Embed Size (px)
Citation preview

110 North Wacker DriveChicago, Illinois 60606(312) 960-5000
www.generalgrowth.com
places∑reat∑a¬h∏rin∑
Financial Highlights liftCompany Profile liftShareholders Letter 2Retail Portfolio 13Following Portfolio Form 10-K Directors/Officers Corporate Information
con¸nts
2005 annual reportGeneral Growth Properties
2005 annual reportG
enera
l Gro
wth
Pro
perties

shop,...plac∏s ¬Ω
play,∏xp∏rıence!and
Financial Highlights liftCompany Profile liftShareholders Letter 2Retail Portfolio 13Following Portfolio Form 10-K Directors/Officers Corporate Information
con¸nts
designed by Conyers Design, Inc. illustrations by Tom Rosborough
FINANCIAL HIGHLIGHTS Dollars in Thousands, Except Per Share Amounts
% Change 2005 vs. 2004 2005 2004 2003 2002 2001
Consolidated Property Revenues 57.8% $ 2,608,305 $ 1,652,773 $ 1,183,763 $ 898,424 $ 799,365
Unconsolidated Property Revenues (at Company Share) 42.6% $ 653,821 $ 458,390 $ 443,488 $ 394,223 $ 352,515
Funds from Operations (FFO) (Before Minority Interests) 16.9% $ 896,005 $ 766,164 $ 618,561 $ 485,304 $ 296,777
FFO Per Share (Fully Diluted)(1) 10.5% $ 3.06 $ 2.77 $ 2.31 $ 1.88 $ 1.32
STOCK AND PARTNERSHIP UNITS Outstanding at Year End
Shares of Common Stock 239,196,649 234,724,082 217,293,976 187,191,255 185,771,796
Operating Partnership Units(1) 53,061,895 55,532,263 55,712,250 58,668,741 58,717,479
Shares of Convertible Preferred Stock – – – 13,500,000 13,500,000
Shares of Common Stock Assuming Full Conversion of Operating Partnership Units and Convertible Preferred Stock 292,258,544 290,256,345 273,006,226 271,362,846 269,992,125
MALL DATA Dollars in Millions
2005 2004 2003 2002 2001
Mall Shop Tenant Sales(2) $ 13,694 $ 12,753 $ 10,258 $ 9,061 $ 7,326
Regional Malls Owned and Operating at Year End(3) 221 179 133 125 97
Mall Shop Square Footage Leased at Year End(2) 92.5% 92.1% 91.3% 91.0% 91.0%
(1) Operating Partnership Units can be exchanged on a one-for-one basis into shares of the Company’s common stock.(2) Excluding redevelopment properties.(3) Includes Consolidated and Unconsolidated Properties.
company profileGeneral Growth Properties, Inc. and its predecessor companies have been reinventing, revital-izing, and reinvigorating the shopping center industry for more than 50 years. General Growth is the second largest U.S.-based publicly traded Real Estate Investment Trust (REIT). General Growth has ownership interest in a portfolio of 192 regional shopping malls in 44 states, as well as ownership in master planned communities, office and industrial properties and community centers. The owned regional mall portfolio totals over 180 million square feet of retail space and includes approximately 24,000 retail stores nationwide. General Growth Properties, Inc. is listed on the New York Stock Exchange under the symbol GGP. For more information, please visit the company Web site at www.generalgrowth.com.
2001
2002
2003
2004
2005
97
125 133
188 192
2001
2002
2003
2004
2005
89
114 12
2
183
183
REGIONAL MALLS OWNED AND OPERATING* At Year End
* Information presented for Consolidated and Unconsolidated Properties.
TOTAL SQUARE FOOTAGE OWNED* In Millions
* Includes Consolidated and Unconsolidated regional malls, community centers, and office and industrial properties.
2001
2002
2003
2004
2005
2001
2002
2003
2004
2005
$7,326
$9,061
$10,258 $12,753
$13,694
$.80 $.92 $1.08
$1.26
$1.49
MALL SHOP TENANT SALES*† Dollars in Millions
* Information presented for Consolidated and Unconsolidated Properties.
† Excludes redevelopment properties and all retail spaces of 10,000 square feet or more.
DIVIDEND GROWTH PER SHARE* Dollar/Share Declared
* Reflects dividends declared and paid during such fiscal years, including the amount declared in January for prior year operations.
that we have created at GGP. Are we happy with our decision to acquire the Rouse Company?
Absolutely. Our enthusiasm for this transaction grows with each passing day. Our excitement
builds because we see many opportunities to improve the Rouse portfolio of retail centers,
and we see our existing GGP malls improving as well. We are creating even Greater Gathering
Places in malls such as Water Tower Place, Chicago, Illinois, Fashion Show Mall, Las Vegas,
Nevada, Faneuil Hall, Boston, Massachusetts and Ala Moana Center, Honolulu, Hawaii.
GGP is a strong and unified company. The addition of the Rouse people and properties make us
even better. We are a team at General Growth. We share the same goals, objectives and values to
make this a better company for all concerned. Yes, we have an outstanding collection of assets,
but first and foremost we are a company. The properties comprise a part of the company but they
do not make up the whole. The REIT industry has historically relied on net asset value (NAV) as
being the primary metric for establishing the value of a publicly traded real estate company. Why
are real estate companies not valued on earnings per share growth, cash flow growth or dividend
growth? Is real estate that different from other industries? We believe that as GGP continues to
grow and continues to operate as a consistently stable and
profitable company, living up in every way to our reputation
as a blue-chip real estate company, that the marketplace will
revisit how we should be valued.
2005 was another exceptionally profitable year for our
shareholders. We delivered a 35.2% total return versus
the Morgan Stanley REIT Index, which appreciated 12.1%,
the S&P 500, which increased 4.9%, the NASDAQ which
appreciated 2.2% and the DJIA, which appreciated 1.7%,
all on a total return basis. Over the last 12 years (since its
initial public offering (IPO) in April 1993), GGP’s per-share
growth in FFO has increased at a 16% rate compounded
GGP has produced superior returns ranking us within the top three among all during periods covering the last three, five and ten years.
General Growth Properties, Inc. 3
Dear Shareholders: Great Gathering Places: these are what we create. Special Places and
Experiences are the focus of our vision. A CUSTOMer-built Company giving our Consumers,
Owners, Retailers and Employees (C.O.R.E.) what they want, when they want it and where they
want it is our mission. These three things define and drive us as we strive to create value for
you. To be successful it is imperative for a company to have vision, a mission and goals. It has
been demonstrated and documented that companies that adhere to these traits are better
financial performers over extended periods of time. It is not “dumb luck” that General Growth
Properties, Inc. (GGP) has produced superior returns, ranking us within the top three among all
Real Estate Investment Trusts (REITs) during periods covering the last three, five and ten years.
We have accomplished this because GGP is anchored solidly to our core foundation of ethics,
integrity, timeless fundamentals and consistent profitability. Good reputations are not made
overnight, nor is recurring profitability; it takes time and it takes hard work. That is what we are
here doing for you. We have made, and we continue to make, a lasting contribution in the
marketplace. Beginning in 1954, this company was Built To Last and we are continuing to Build
To Last as we move forward in the 21st century.
2005 was a year of integration for GGP. Following the 2004 acquisition of The Rouse Company,
which consisted of ownership interests in 37 regional malls, 4 community centers, 6 mixed-use
projects and the master planned communities of Columbia, Maryland, Summerlin, (Las Vegas)
Nevada, The Bridgelands, (Houston) Texas and
a 52.5% interest in The Woodlands, (Houston)
Texas; we had to integrate all of the properties
into our company. With these properties came
approximately an additional 1100 people that
needed to understand and embrace the culture
2 General Growth Properties, Inc.
to our shareholders
General Growth Properties, Inc. 54 General Growth Properties, Inc.
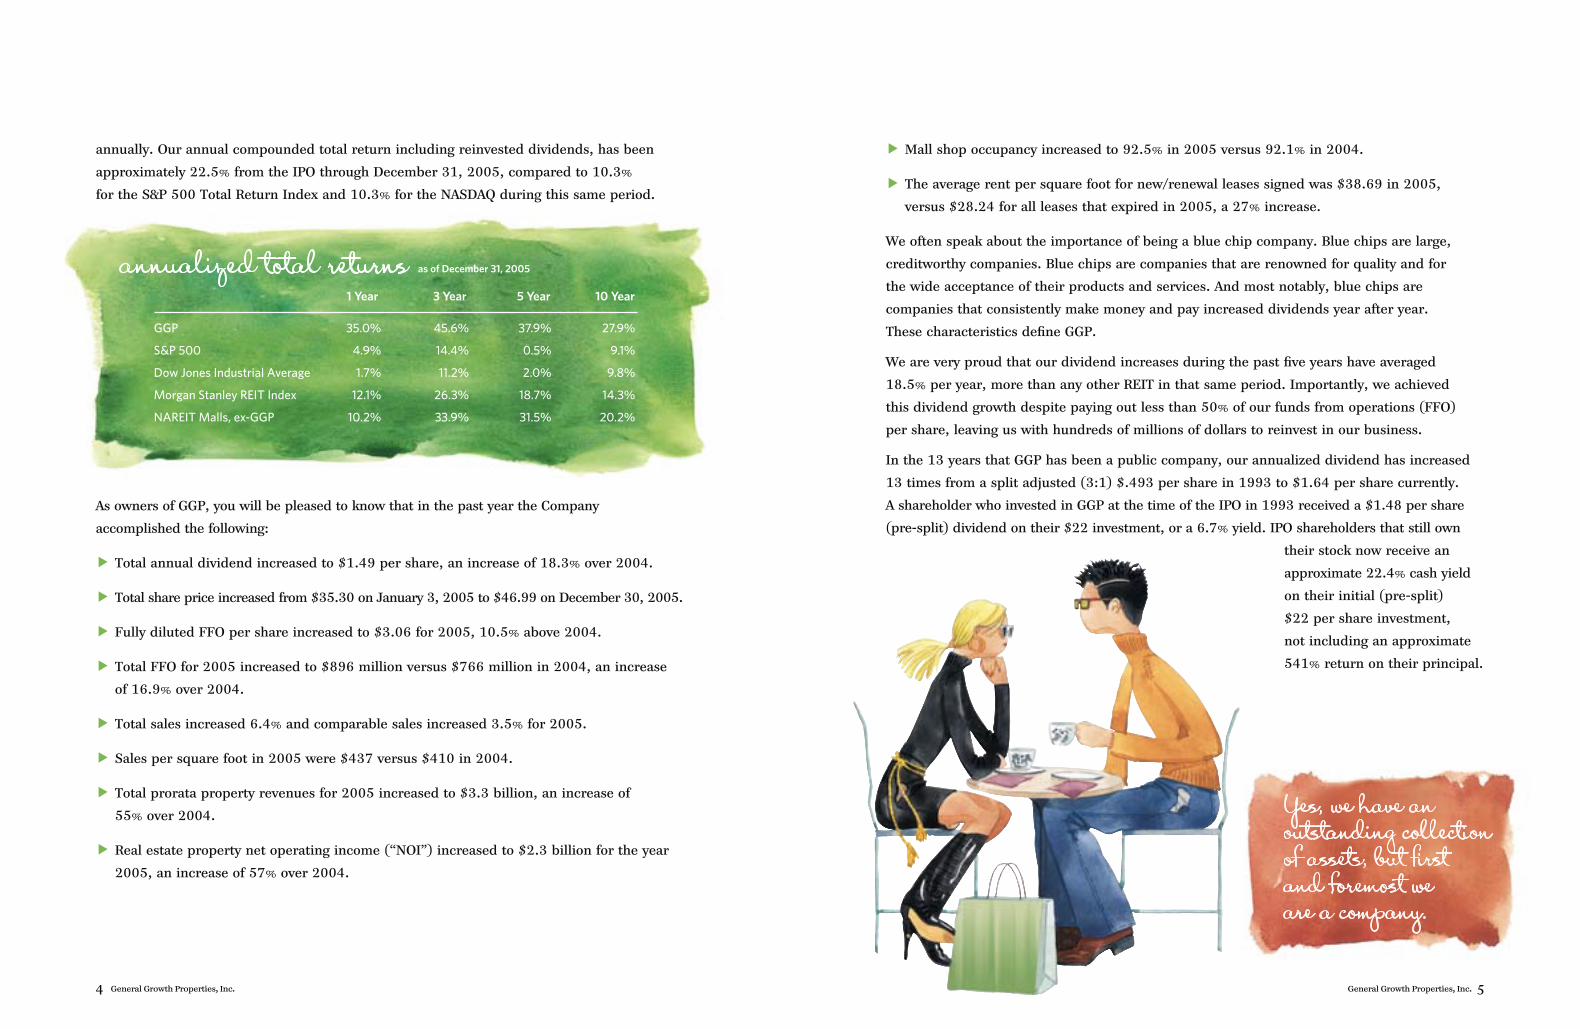
1 Year 3 Year 5 Year 10 Year
GGP 35.0% 45.6% 37.9% 27.9%
S&P 500 4.9% 14.4% 0.5% 9.1%
Dow Jones Industrial Average 1.7% 11.2% 2.0% 9.8%
Morgan Stanley REIT Index 12.1% 26.3% 18.7% 14.3%
NAREIT Malls, ex-GGP 10.2% 33.9% 31.5% 20.2%
annualized total returns as of December 31, 2005
Yes, we have an outstanding collection of assets, but first and foremost we are a company.
annually. Our annual compounded total return including reinvested dividends, has been
approximately 22.5% from the IPO through December 31, 2005, compared to 10.3%
for the S&P 500 Total Return Index and 10.3% for the NASDAQ during this same period.
As owners of GGP, you will be pleased to know that in the past year the Company
accomplished the following:
1 Total annual dividend increased to $1.49 per share, an increase of 18.3% over 2004.
1 Total share price increased from $35.30 on January 3, 2005 to $46.99 on December 30, 2005.
1 Fully diluted FFO per share increased to $3.06 for 2005, 10.5% above 2004.
1 Total FFO for 2005 increased to $896 million versus $766 million in 2004, an increase
of 16.9% over 2004.
1 Total sales increased 6.4% and comparable sales increased 3.5% for 2005.
1 Sales per square foot in 2005 were $437 versus $410 in 2004.
1 Total prorata property revenues for 2005 increased to $3.3 billion, an increase of
55% over 2004.
1 Real estate property net operating income (“NOI”) increased to $2.3 billion for the year
2005, an increase of 57% over 2004.
1 Mall shop occupancy increased to 92.5% in 2005 versus 92.1% in 2004.
1 The average rent per square foot for new/renewal leases signed was $38.69 in 2005,
versus $28.24 for all leases that expired in 2005, a 27% increase.
We often speak about the importance of being a blue chip company. Blue chips are large,
creditworthy companies. Blue chips are companies that are renowned for quality and for
the wide acceptance of their products and services. And most notably, blue chips are
companies that consistently make money and pay increased dividends year after year.
These characteristics define GGP.
We are very proud that our dividend increases during the past five years have averaged
18.5% per year, more than any other REIT in that same period. Importantly, we achieved
this dividend growth despite paying out less than 50% of our funds from operations (FFO)
per share, leaving us with hundreds of millions of dollars to reinvest in our business.
In the 13 years that GGP has been a public company, our annualized dividend has increased
13 times from a split adjusted (3:1) $.493 per share in 1993 to $1.64 per share currently.
A shareholder who invested in GGP at the time of the IPO in 1993 received a $1.48 per share
(pre-split) dividend on their $22 investment, or a 6.7% yield. IPO shareholders that still own
their stock now receive an
approximate 22.4% cash yield
on their initial (pre-split)
$22 per share investment,
not including an approximate
541% return on their principal.
The question we ask ourselves daily is where do we go from here? How do we maintain and
grow the terrific business we have? Guidance can oftentimes come from looking back into
history. It was during 500 BC that The Greek Agora at the foot of the Acropolis in ancient
Athens became one of the first urban marketplaces, with a central square surrounded by
buildings. In 100 BC, the Republican Forum at the base of Capitoline Hill was the commercial
and government center in Rome. By 1174 AD, the Market-Place developed in the city of Brussels
with buildings constructed by guilds and crafts corporations along a rectangular square. Similar
market squares would appear during the Middle Ages in other European cities. In 1288, the
Piazza del Campo in Venice, Italy was an open space surrounded by the cathedral and buildings,
with eleven shop-lined streets converging on the center. Sturbridge Fair opened in 1400 near
Cambridge, England and was one of the largest medieval fairs that were market centers for
merchants and in 1500 the London Bridge was lined with shops across the Thames River in
London, England. Markets are as old as history. They have been incessantly reinvented—
merchants bring new ideas and innovations which result in new marketplaces. We believe the
single most exciting area, the one which affords us the best opportunity to create enormous
value going forward, is reinventing, remerchandising and reinvesting in our existing properties,
just as investors, owners and developers have been doing for hundreds and hundreds of years.
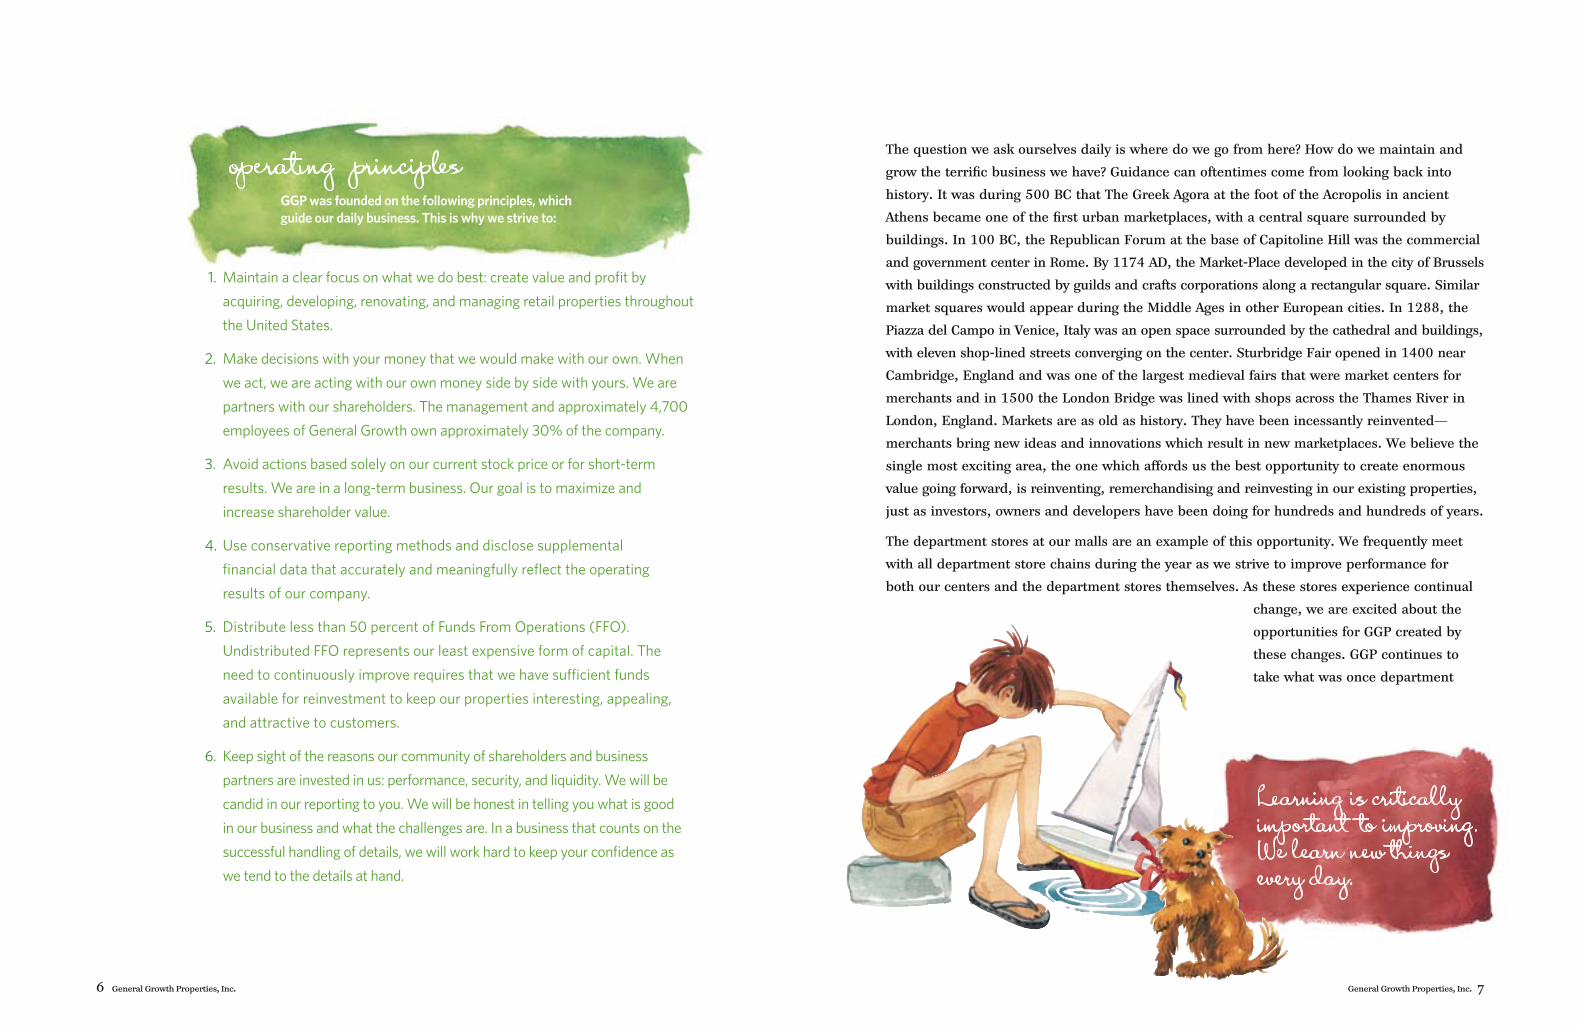
The department stores at our malls are an example of this opportunity. We frequently meet
with all department store chains during the year as we strive to improve performance for
both our centers and the department stores themselves. As these stores experience continual
change, we are excited about the
opportunities for GGP created by
these changes. GGP continues to
take what was once department
General Growth Properties, Inc. 76 General Growth Properties, Inc.
Learning is critically important to improving. We learn new things every day.
1. Maintain a clear focus on what we do best: create value and profit by
acquiring, developing, renovating, and managing retail properties throughout
the United States.
2. Make decisions with your money that we would make with our own. When
we act, we are acting with our own money side by side with yours. We are
partners with our shareholders. The management and approximately 4,700
employees of General Growth own approximately 30% of the company.
3. Avoid actions based solely on our current stock price or for short-term
results. We are in a long-term business. Our goal is to maximize and
increase shareholder value.
4. Use conservative reporting methods and disclose supplemental
financial data that accurately and meaningfully reflect the operating
results of our company.
5. Distribute less than 50 percent of Funds From Operations (FFO).
Undistributed FFO represents our least expensive form of capital. The
need to continuously improve requires that we have sufficient funds
available for reinvestment to keep our properties interesting, appealing,
and attractive to customers.
6. Keep sight of the reasons our community of shareholders and business
partners are invested in us: performance, security, and liquidity. We will be
candid in our reporting to you. We will be honest in telling you what is good
in our business and what the challenges are. In a business that counts on the
successful handling of details, we will work hard to keep your confidence as
we tend to the details at hand.
GGP was founded on the following principles, which guide our daily business. This is why we strive to:
op∏ratıng principles
levels are high, and retailers are rolling out unprecedented levels of new branding concepts.
Spend time in our malls. Monitor the pulse of our business. You will see from firsthand
observation that GGP’s pulse is strong.
Densification. This will define our properties for many, many years into the future and gives
us the ability to bring more square footage onto our existing properties. Our malls are in the
enviable position of being situated on sites typically ranging in size from 100 to 120 acres
of land. As we witness changing demographics, changing commuting patterns and the desire
of people to live, work, play and learn in convenient environments, we have the ability and the
responsibility to provide this to them. Our properties lend themselves to change. Our centers
are constantly evolving. We have continually brought new ideas and innovations to our land.
As previously mentioned, recaptured department store space can be reincarnated into “village”
retail environments, entertainment areas, big box retail formats, residential units, hotels
and/or office complexes. The array of choices we have is large. We treat each and every market
individually, giving us alternatives that are completely unique in the real estate industry.
Learning is critically important to improving. We learn new things every day. One area of our
business that is a continual source of new lessons is the master planned community business.
GGP is expanding from being the creator of special places and experiences through retail
alone, to being the creator of special places and experiences for living, working, playing and
General Growth Properties, Inc. 9
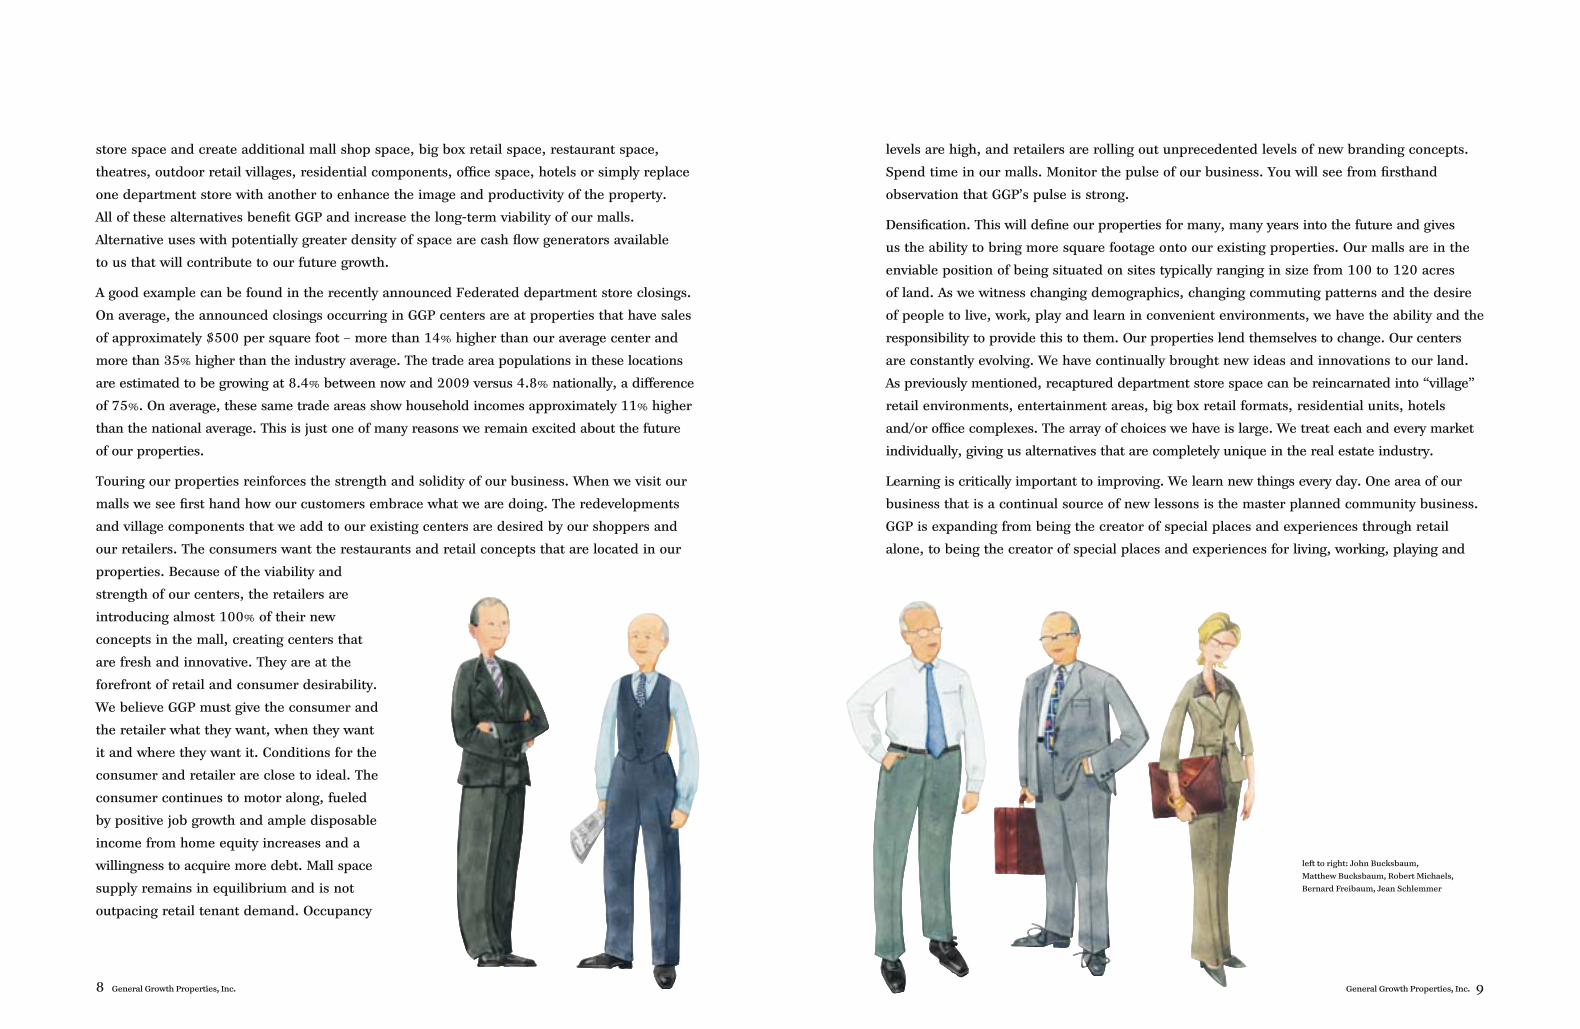
left to right: John Bucksbaum,
Matthew Bucksbaum, Robert Michaels,
Bernard Freibaum, Jean Schlemmer
store space and create additional mall shop space, big box retail space, restaurant space,
theatres, outdoor retail villages, residential components, office space, hotels or simply replace
one department store with another to enhance the image and productivity of the property.
All of these alternatives benefit GGP and increase the long-term viability of our malls.
Alternative uses with potentially greater density of space are cash flow generators available
to us that will contribute to our future growth.
A good example can be found in the recently announced Federated department store closings.
On average, the announced closings occurring in GGP centers are at properties that have sales
of approximately $500 per square foot – more than 14% higher than our average center and
more than 35% higher than the industry average. The trade area populations in these locations
are estimated to be growing at 8.4% between now and 2009 versus 4.8% nationally, a difference
of 75%. On average, these same trade areas show household incomes approximately 11% higher
than the national average. This is just one of many reasons we remain excited about the future
of our properties.
Touring our properties reinforces the strength and solidity of our business. When we visit our
malls we see first hand how our customers embrace what we are doing. The redevelopments
and village components that we add to our existing centers are desired by our shoppers and
our retailers. The consumers want the restaurants and retail concepts that are located in our
properties. Because of the viability and
strength of our centers, the retailers are
introducing almost 100% of their new
concepts in the mall, creating centers that
are fresh and innovative. They are at the
forefront of retail and consumer desirability.
We believe GGP must give the consumer and
the retailer what they want, when they want
it and where they want it. Conditions for the
consumer and retailer are close to ideal. The
consumer continues to motor along, fueled
by positive job growth and ample disposable
income from home equity increases and a
willingness to acquire more debt. Mall space
supply remains in equilibrium and is not
outpacing retail tenant demand. Occupancy
8 General Growth Properties, Inc.
learning in master planned communities. The special places we
now strive to create include destinations where residential, office,
hospitality, retail and civic uses can find effective expressions. This
allows GGP to benefit from extending the experience we create in retail
to other asset classes as well. Instead of deriving financial returns from
retail alone, we now benefit from the economic potential of effective
development of other uses. We now capture the value of “place and
experience” over thousands of acres, instead of hundreds—and what
we learn from the thousands of acres we apply to the hundreds.
Jim Rouse envisioned Columbia, Maryland as “a place to grow people.”
His vision for Columbia has succeeded. Because of his success,
Columbia today is a thriving community of nearly 100,000 residents.
But today, Columbia is much different in its needs and its desires than it was 37 years ago as
it was being planned. Today, the “town center” of Columbia comprises approximately 500
acres and this land is vastly under-utilized. There is a demand for high-rise office and living
spaces, learning centers, hospitality and village retail. People want a more urbane expression
and vitality in their town centers as they densify. The community has the opportunity to become
“bright lights, little city.”
The Woodlands has been developed as a “city in the forest.” The Woodlands took a “village”
approach to living over 32 years ago and today the villages of the Woodlands form a community
of unparalleled living. Much like Columbia, we envision the Woodlands taking on a much more
urbane expression while remaining dedicated and nestled in the splendor and glory of its
natural environment.
Summerlin, (Las Vegas) Nevada is also a community of beautiful neighborhoods in natural
surroundings. Summerlin is fast approaching a population of 100,000 people and is quickly
emerging as an active, vibrant suburban community. As the community has grown, we have
recognized the importance of growing with the community and we are establishing the first phases
of Summerlin Town Center. We are planning and developing more extensive retail, office, multi-
family and hospitality uses. We continue to redefine the “experience” as the scale of the community
becomes more apparent and we are not viewing the mall as an isolated microcosm but as the
heart of the shopping, entertainment, business and residential fabric of the Town Center.
Columbia, The Woodlands, and Summerlin are leaders in advancing the practice of
sustainable development. By designing with nature, they demonstrate that community
10 General Growth Properties, Inc.
building can meet market opportunities better when the planning process includes thoughtful
stewardship of our natural resources. These developments have won international acclaim
by achieving our core human aspiration to be in harmony with nature while also enjoying
the rewarding experience of participating in vibrant, special gathering places. We are excited
about the prospect of applying these lessons to our newest community, Bridgelands, as well
as to the communities of merchants at our malls.
In addition, GGP is actively taking steps to adopt high performance, green design building and
operational practices in our existing, redevelopment and new development projects. GGP is
exploring new technologies and practices to help ensure an efficient use of resources, promote
the health and comfort of our building users and reduce negative impact on the environment,
while reducing energy and operating costs. We believe these efforts are both environmentally
responsible and sound business practices that will benefit our shoppers, retailers, employees
and investors.
We hope this letter gives you a better understanding of how we look for ways to change and
improve GGP. These improvements touch all aspects of our business—not just the obvious
ones. We are improving as a company, and we have the best and most talented people in
the mall industry. We are improving as managers of our employees, and our employees are
in turn improving the assets in each and every community in which we operate. People are
the foundation of GGP.
In 513 BC, Heraclitus of Greece observed, “There is nothing permanent except change.”
GGP continues to change. We make certain that as we change, we live our vision and our
mission each and every day. People Creating Special Places and Experiences—this is our
vision, and this is what we are accomplishing. Enjoy our Great Gathering Places.
our valuesrespecthonestyintegritypassionurgencyteamworkloyaltyhumilityfairness
General Growth Properties, Inc. 11
Bernard Freibaum
Executive Vice President
and Chief Financial Officer
Matthew BucksbaumFounder and Chairman of the Board
Jean Schlemmer
Chief Development Officer
John BucksbaumChief Executive Officer
Robert Michaels
President and
Chief Operating Officer
General Growth Properties, Inc. 13
CaliforniaBayshore Mall Eureka
Burbank Town Center 4Burbank
Chico Mall Chico
Chula Vista CenterChula Vista
Eastridge San Jose
Fallbrook Center West Hills (Los Angeles)
Galleria at Tyler Riverside (Los Angeles)
Glendale Galleria Glendale (Los Angeles)
Montclair Plaza Montclair (San Bernardino)
Moreno Valley MallMoreno Valley (Riverside)
NewPark Mall Newark (San Francisco)
Northridge Fashion CenterNorthridge
Redlands MallRedlands
The Shops at Tanforan 44San Bruno
Southbay Pavilion 4 Carson
Southland Mall Hayward
Stonestown San Francisco
Valley Plaza MallBakersfield
Visalia Mall Visalia
West Valley Mall Tracy (San Francisco)
ColoradoChapel Hills Mall Colorado Springs
Foothills Mall Fort Collins
Park Meadows Littleton (Denver)
Southwest Plaza Littleton (Denver)
ConnecticutBrass Mill Center Waterbury
The Shoppes at Buckland HillsManchester
DelawareChristiana Mall Newark
FloridaAltamonte MallAltamonte Springs
The Avenue Viera 44Viera
Bayside MarketplaceMiami
Coastland Center Naples
Eagle Ridge Mall Lake Wales (Orlando)
Festival Bay Mall 4 Orlando
Governor’s SquareTallahassee
Lakeland Square MallLakeland (Orlando)
Mizner Park Boca Raton
The Oaks MallGainesville
Oviedo MarketplaceOrlando
Pembroke Lakes Mall Pembroke Pines
Regency Square MallJacksonville
Village of Merrick ParkCoral Gables
West Oaks Mall Ocoee
GeorgiaAugusta Mall Augusta
Cumberland Mall Atlanta
North Point MallAlpharetta
Oglethorpe Mall Savannah
Peachtree Mall Columbus
Perimeter Mall Atlanta
Southlake MallMorrow (Atlanta)
HawaiiAla Moana CenterHonolulu
Kings’ Shop 4 Waikoloa
Prince Kuhio PlazaHilo
Queen Ka’ahumanu Center 4Kahului
Queens Marketplace 4 Waikoloa Beach Resort
Ward CentersHonolulu
12 General Growth Properties, Inc.
4 Managed only; no ownership interest
4 Leasing only
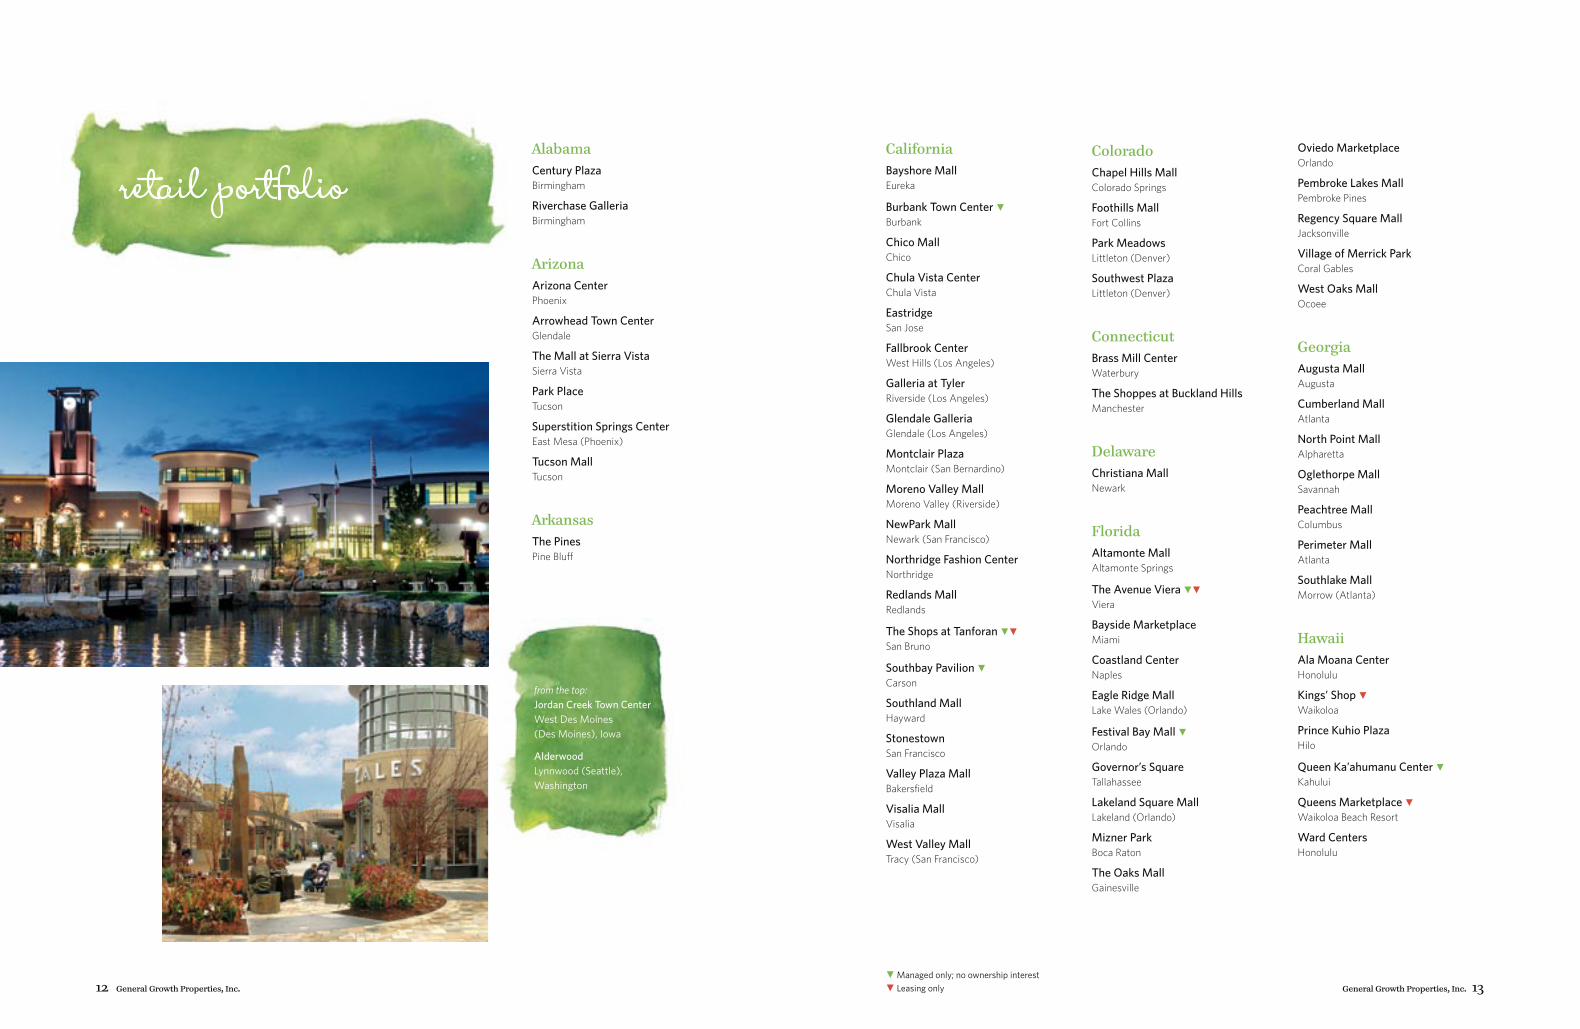
from the top: Jordan Creek Town Center West Des Moines (Des Moines), Iowa
Alderwood Lynnwood (Seattle), Washington
retail portfolioAlabamaCentury PlazaBirmingham
Riverchase GalleriaBirmingham
Arizona Arizona Center Phoenix
Arrowhead Town CenterGlendale
The Mall at Sierra VistaSierra Vista
Park Place Tucson
Superstition Springs CenterEast Mesa (Phoenix)
Tucson MallTucson
ArkansasThe PinesPine Bluff
General Growth Properties, Inc. 15
Lakeside Mall Sterling Heights (Detroit)
Lakeview Square Mall Battle Creek
Lansing Mall Lansing
RiverTown CrossingsGrandville (Grand Rapids)
Southland Center Taylor (Detroit)
Westwood Mall Jackson
MinnesotaApache Mall Rochester
Crossroads CenterSt. Cloud
Eden Prairie CenterEden Prairie (Minneapolis)
Knollwood Mall St. Louis Park (Minneapolis)
Ridgedale CenterMinneapolis
River Hills Mall Mankato
MississippiEdgewood Mall 44 McComb
Metrocenter Mall 4 Jackson
MissouriCapital Mall Jefferson City
Columbia Mall Columbia
Jamestown Mall 4 Florissant
Saint Louis GalleriaSt. Louis
14 General Growth Properties, Inc.
Whalers Village Lahaina
Windward Mall 4 Kaneohe
IdahoBoise Towne SquareBoise
Grand Teton Mall Idaho Falls
Pine Ridge Mall Pocatello
Silver Lake Mall Coeur d’Alene
IllinoisFord City Mall 4 Chicago
Golf Mill Shopping Center 4Niles (Chicago)
Lincolnshire Commons Lincolnshire (Chicago)
Main Street at Seven Bridges 4 Woodridge
Market Place Shopping CenterChampaign
Northbrook Court Northbrook (Chicago)
Oakbrook Center Oak Brook (Chicago)
Sandburg Mall 4 Galesburg
Spring Hill Mall West Dundee (Chicago)
Water Tower PlaceChicago
IndianaGlenbrook Square Fort Wayne
River Falls MallClarksville
IowaCoral Ridge MallCoralville (Iowa City)
Jordan Creek Town CenterWest Des Moines
Mall of the Bluffs Council Bluffs (Omaha, NE)
KentuckyFlorence Mall Florence
Greenwood MallGreenwood
Mall St. Matthews Louisville
Oxmoor Center Louisville
LouisianaAlexandria Mall 4Alexandria
Mall of Louisiana Baton Rouge
Mall St. VincentShreveport
Oakwood Center Gretna (New Orleans)
Pecanland Mall Monroe
Pierre Bossier MallBossier City (Shreveport)
Riverwalk MarketplaceNew Orleans
MaineThe Maine MallSouth Portland
MarylandThe Gallery at HarborplaceBaltimore
Harborplace Baltimore
Laurel Mall 4 Laurel (Baltimore)
The Mall in ColumbiaColumbia (Baltimore)
Mondawmin Mall Baltimore
Owings Mills Baltimore
Towson Town CenterBaltimore
The Village of Cross KeysBaltimore
White Marsh Mall Baltimore
MassachusettsFaneuil Hall MarketplaceBoston
Natick Mall Natick (Boston)
Silver City GalleriaTaunton
Swansea Mall 4 Swansea
MichiganAdrian Mall 4 Adrian
Bay City Mall Bay City
Birchwood Mall Port Huron (Detroit)
Centerpointe 4 Grand Rapids
The Crossroads Portage (Kalamazoo)
Grand Traverse MallTraverse City
4 Managed only; no ownership interest
4 Leasing only
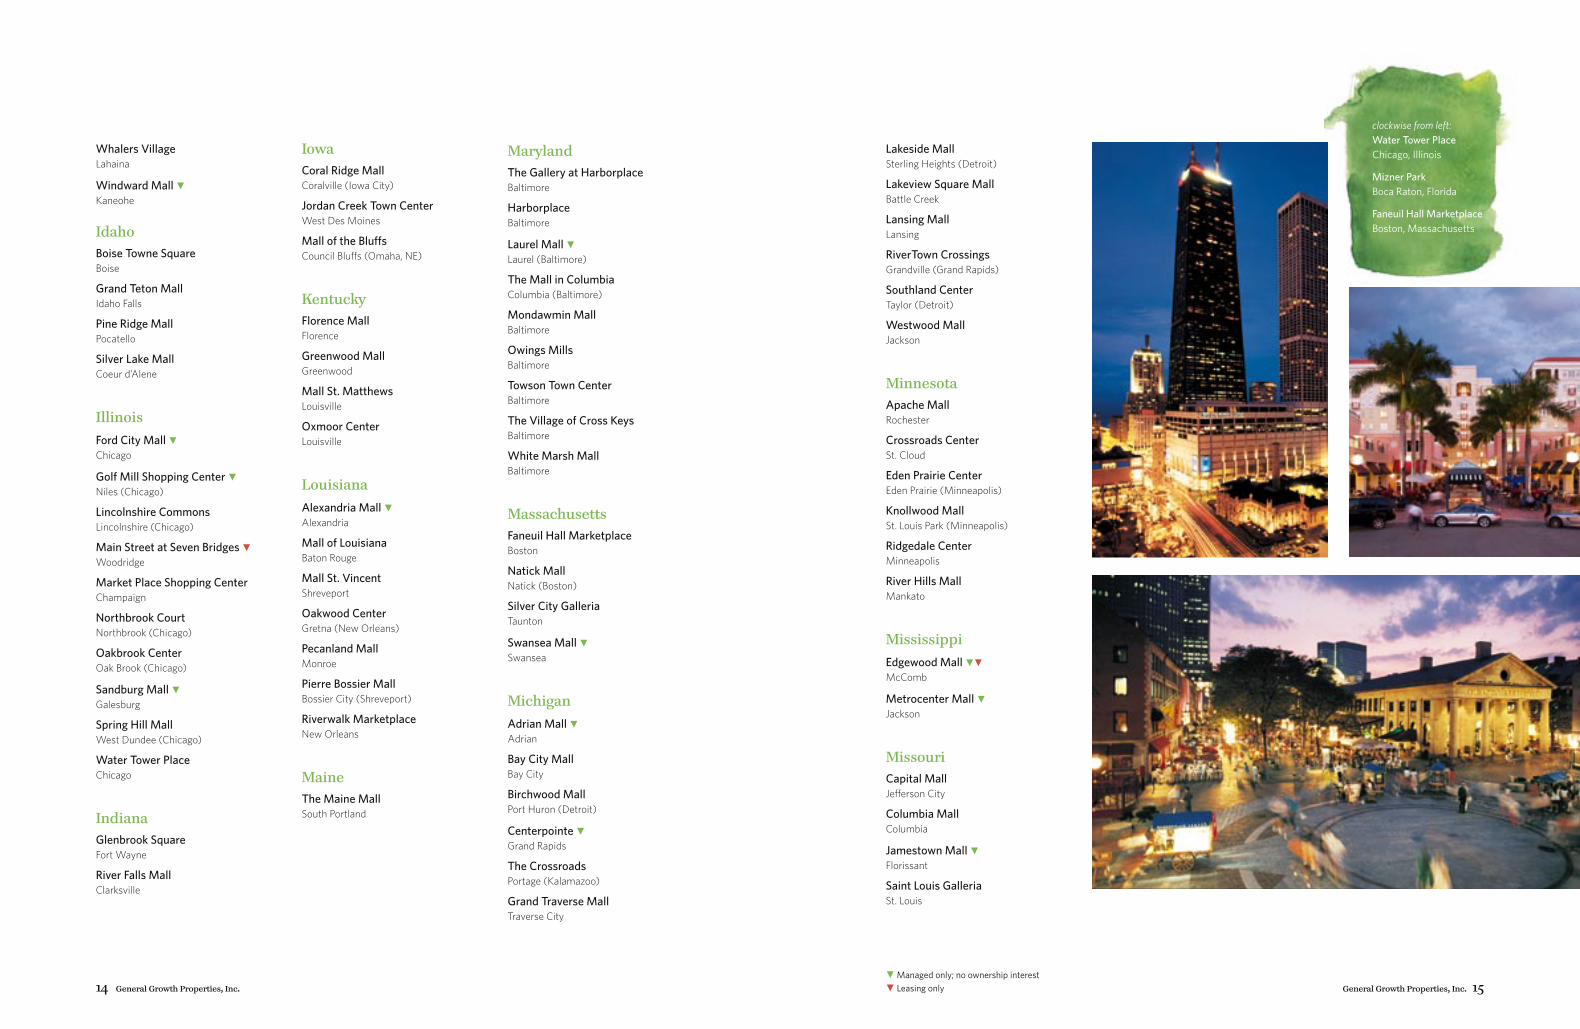
clockwise from left: Water Tower Place Chicago, Illinois
Mizner Park Boca Raton, Florida
Faneuil Hall Marketplace Boston, Massachusetts
General Growth Properties, Inc. 17
NebraskaOak View MallOmaha
Westroads MallOmaha
NevadaThe Boulevard MallLas Vegas
Fashion Show Las Vegas
The Grand Canal Shoppes at The Venetian Las Vegas
Meadows Mall Las Vegas
New HampshireSteeplegate MallConcord
New JerseyBridgewater CommonsBridgewater
Paramus Park Paramus
Willowbrook Mall Wayne
Woodbridge CenterWoodbridge
New MexicoAnimas Valley MallFarmington
Coronado CenterAlbuquerque
North Plains Mall Clovis
Rio West Mall Gallup
New YorkLockport Mall Lockport
South Street SeaportNew York
St. Lawrence Centre 4Messina
Staten Island Mall Staten Island
North CarolinaCarolina Place Pineville (Charlotte)
Four Seasons Town CentreGreensboro
The Streets at SouthpointDurham
Valley Hills Mall Hickory
OhioBeachwood Place Cleveland
Colony Square MallZanesville
Kenwood Towne CentreKenwood (Cincinnati)
OklahomaQuail Springs Mall Oklahoma City
Sooner Mall Norman
Washington Park MallBartlesville
OregonClackamas Town CenterPortland
Gateway MallSpringfield
Pioneer Place Portland
Rogue Valley Mall Medford
Salem Center Salem
PennsylvaniaLebanon Valley 4Lebanon
The Mall at Steamtown 4 Scranton
Neshaminy Mall Bensalem (Philadelphia)
Park City Center Lancaster (Philadelphia)
Rhode IslandGarden City Shopping Center 4Cranston
Providence PlaceProvidence
South CarolinaColumbiana CentreColumbia
Rock Hill Galleria 4 Rock Hill
TennesseeNorthgate MallChattanooga
Stones River Mall 4Murfreesboro (Nashville)
TexasBassett Center 44 El Paso
Baybrook MallFriendswood (Houston)
Collin Creek Plano
Deerbrook Mall Humble (Houston)
16 General Growth Properties, Inc.
4 Managed only; no ownership interest
4 Leasing only
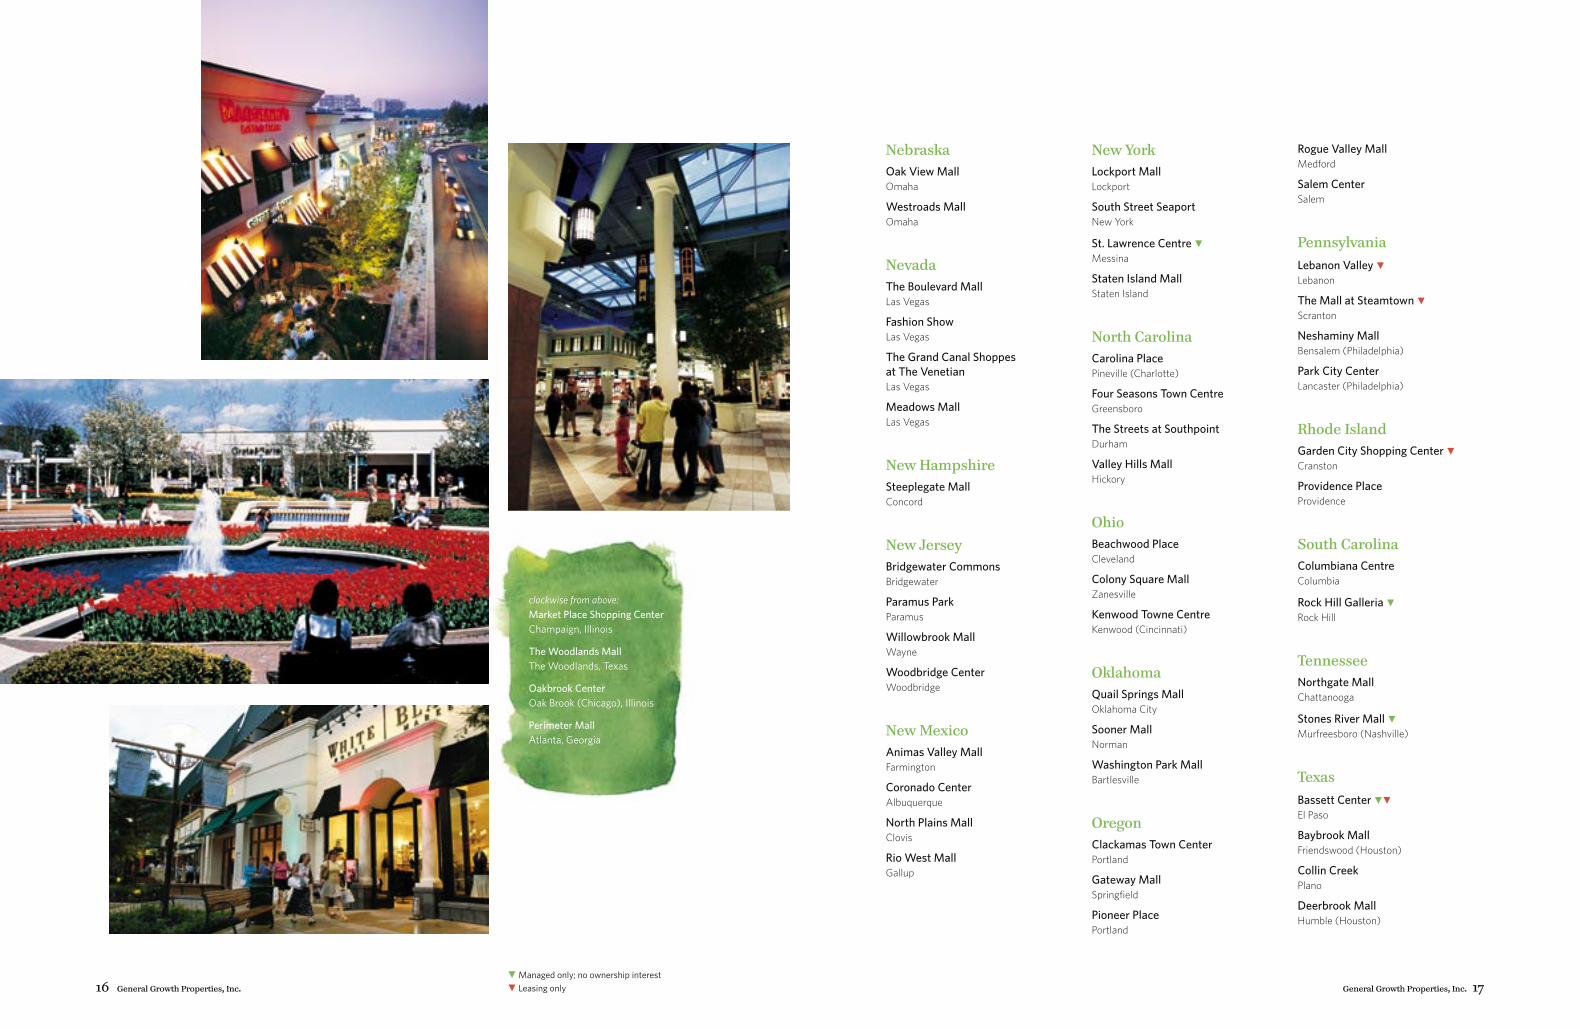
clockwise from above: Market Place Shopping Center Champaign, Illinois
The Woodlands Mall The Woodlands, Texas
Oakbrook Center Oak Brook (Chicago), Illinois
Perimeter Mall Atlanta, Georgia
directors and officers
Directors
Matthew Bucksbaum Founder and Chairman
John Bucksbaum Chief Executive Officer
Alan S. Cohen Senior Director of Marketing, Wireless Networking Business Unit Cisco Systems, Inc. San Jose, CA
Anthony Downs Senior Fellow, The Brookings Institution Washington, D.C.
Bernard Freibaum Executive Vice President and Chief Financial Officer
Adam S. Metz Co-founding Partner, Polaris Capital LLC Northbrook, IL
Robert Michaels President and Chief Operating Officer
Thomas H. Nolan President and Chief Financial Officer, Loreto Bay Company Scottsdale, AZ
John T. Riordan Ex-officio Trustee of the International Council of Shopping Centers Cotuit, MA
Beth Stewart Chief Executive Officer, Storetrax.com Rockville, MD
Officers
Matthew Bucksbaum Founder and Chairman
John Bucksbaum Chief Executive Officer
Robert Michaels President and Chief Operating Officer
Bernard Freibaum Executive Vice President and Chief Financial Officer
Jean Schlemmer Chief Development Officer
Joel Bayer Senior Vice President and Chief Investment Officer
Alex Berman Senior Vice President, GGP Ventures
Thomas D’Alesandro Senior Vice President, Development
Marshall E. Eisenberg Secretary
Ronald L. Gern Senior Vice President and Assistant Secretary
Melinda Holland Senior Vice President, Business Development
General Growth Properties, Inc.
Edmund Hoyt Senior Vice President and Chief Accounting Officer
Chuck Lhotka Chief Administrative Officer
Sharon Polonia Senior Vice President, Asset Management
Daniel Sheridan Executive Vice President, Asset Management
Warren Wilson Executive Vice President, Development
Rob Wyant Senior Vice President, Asset Management
18 General Growth Properties, Inc.
The Woodlands (Houston)
UtahCache Valley Mall Logan
Cottonwood Mall Holladay (Salt Lake City)
Fashion Place Salt Lake City
Newgate Mall Ogden (Salt Lake City)
Provo Towne CentreProvo
Red Cliffs Mall St. George
VermontBurlington Town CenterBurlington
VirginiaLandmark Mall Alexandria (Washington, D.C.)
Lynnhaven Mall Virginia Beach
Piedmont Mall Danville
Tysons Galleria McLean (Washington, D.C.)
WashingtonAlderwoodLynnwood (Seattle)
Bellis FairBellingham
NorthTown Mall Spokane
SouthShore Mall Aberdeen
Spokane Valley MallSpokane
Three Rivers Mall Kelso
Westlake Center Seattle
WisconsinFox River Mall Appleton
Mayfair Wauwatosa (Milwaukee)
Oakwood Mall Eau Claire
WyomingEastridge Mall Casper
White Mountain MallRock Springs
4 Managed only; no ownership interest
4 Leasing only
master planned communitiesTHE WOODLANDS
Houston, Texas
COLUMBIA
Columbia, Maryland
BRIDGELANDS
Houston Texas
FAIRWOOD
Fairwood, Maryland
EMERSON
Emerson, Maryland
STONE LAKE
Stone Lake, Maryland
SUMMERLIN
Las Vegas, Nevada
First Colony Mall Sugar Land (Houston)
Galleria Dallas 4 Dallas
Highland Mall Austin
Hulen Mall Fort Worth
North Star Mall San Antonio
The Parks at ArlingtonArlington
The Shops at La Cantera San Antonio
Sikes Senter Wichita Falls
Stonebriar Centre Frisco (Dallas)
Town East Mall Mesquite (Dallas)
Vista Ridge Mall Lewisville (Dallas)
Willowbrook Mall Houston
The Woodlands Mall
110 North Wacker DriveChicago, Illinois 60606(312) 960-5000
www.generalgrowth.com
corporate informationCorporate Office110 North Wacker Drive Chicago, Illinois 60606 (312) 960-5000
Employees4,700
Registrar and Transfer Agent and Shareowner Services Department
Mellon Investor Services, LLC 480 Washington Blvd Jersey City, NJ 07310
You may contact the Administrator at (888) 395-8037 or www.melloninvestor.com/isd TDD for Hearing Impaired: (800) 231-5469 Foreign Shareholders: (201) 680-6610 TDD for Foreign Shareholders: (201) 680-6578
Information about the Dividend Reinvestment and Stock Purchase Plan may also be obtained from Mellon.
Common Stock Price and DividendsNew York Stock Exchange New York, New York NYSE Symbol: GGP (Common)
Independent AccountantsDeloitte & Touche LLP Chicago, Illinois
Annual MeetingThe Annual Meeting of Stockholders of General Growth Properties, Inc. will be held on May 16, 2006, at General Growth Properties, 110 North Wacker Drive, Chicago, Illinois, at 9 a.m. CT.
Form 10-KReaders who wish to receive, without charge, a copy of Form 10-K as filed with the Securities and Exchange Commission should call (866) 818-9933 or visit our Web site at www.generalgrowth.com and refer to our financial downloads page in the Investment section.
Investor Relations ContactTimothy Goebel Director of Investor Relations
Common Stock Price and DividendsSet forth below are the high and low sales prices per share of Common Stock for each such period as reported by the NYSE, and the distributions per share of Common Stock declared for each such period.
2005 Price Quarter Ended High Low Distribution
March 31 $ 37.75 $ 31.38 $ .36 June 30 $ 42.08 $ 33.40 $ .36 September 30 $ 47.48 $ 40.82 $ .41 December 31 $ 48.27 $ 39.60 $ .41
2004 Price Quarter Ended High Low Distribution
March 31 $ 35.15 $ 27.25 $ .30 June 30 $ 35.30 $ 24.31 $ .30 September 30 $ 32.12 $ 28.41 $ .36 December 31 $ 36.90 $ 30.90 $ .36
2003 Price Quarter Ended High Low Distribution
March 31 $ 18.40 $ 15.90 $ .24 June 30 $ 21.06 $ 17.83 $ .24 September 30 $ 24.03 $ 20.77 $ .30 December 31 $ 28.03 $ 23.91 $ .30
UNITED STATES SECURITIES AND EXCHANGE COMMISSIONWashington, D.C. 20549
Form 10-K(Mark One)
¥ ANNUAL REPORT PURSUANT TO SECTION 13 OR 15(d)OF THE SECURITIES EXCHANGE ACT OF 1934
For the Ñscal year ended December 31, 2005
or
n TRANSITION REPORT PURSUANT TO SECTION 13 OR 15(d) OF THE SECURITIES EXCHANGE ACT OF 1934
For the transition period from to
Commission File Number 1-11656
GENERAL GROWTH PROPERTIES, INC.(Exact name of registrant as speciÑed in its charter)
Delaware 42-1283895(State or other jurisdiction of (I.R.S. Employerincorporation or organization) IdentiÑcation Number)
110 N. Wacker Dr., Chicago, IL 60606(Address of principal executive oÇces) (Zip Code)
(312)960-5000(Registrant's telephone number, including area code)
Securities Registered Pursuant to Section 12(b) of the Act:Title of Each Class Name of Each Exchange on Which Registered
Common Stock, $.01 par value New York Stock Exchange
Preferred Stock Purchase Rights New York Stock Exchange
Securities Registered Pursuant to Section 12(g) of the Act: None
Indicate by check mark if the registrant is a well-known seasoned issuer, as deÑned in Rule 405 of theSecurities Act. YES ¥ NO n
Indicate by check mark if the registrant is not required to Ñle reports pursuant to Section 13 or Section 15(d)of the Act. YES n NO ¥
Indicate by check mark whether the registrant (1) has Ñled all reports required to be Ñled by Section 13 or15(d) of the Securities Exchange Act of 1934 during the preceding 12 months (or for such shorter period thatthe registrant was required to Ñle such reports), and (2) has been subject to such Ñling requirements for thepast 90 days. YES ¥ NO n
Indicate by check mark if disclosure of delinquent Ñlers pursuant to Item 405 of Regulation S-K is notcontained herein, and will not be contained, to the best of registrant's knowledge, in deÑnitive proxy orinformation statements incorporated by reference in Part III of this Form 10-K or any amendment to thisForm 10-K. n
Indicate by check mark whether the registrant is a large accelerated Ñler, an accelerated Ñler, or a non-accelerated Ñler. See deÑnition of ""accelerated Ñler and large accelerated Ñler'' in Rule 12b-2 of the ExchangeAct. (Check one): Large accelerated Ñler ¥ Accelerated Ñler n Non-accelerated Ñler n
Indicate by check mark whether the registrant is a shell company (as deÑned in Rule 12b-2 of the ExchangeAct). YES n NO ¥
On June 30, 2005, the last business day of the registrant's most recently completed second quarter, theaggregate market value of the shares of common stock held by non-aÇliates of the registrant wasapproximately $8.667 billion based upon the closing price of the common stock on the New York StockExchange composite tape on such date.
As of March 24, 2006, there were 241,005,634 shares of the registrant's common stock outstanding.
DOCUMENTS INCORPORATED BY REFERENCE
Portions of the proxy statement for the annual stockholders meeting to be held on May 16, 2006 areincorporated by reference into Part III.
GENERAL GROWTH PROPERTIES, INC.
Annual Report on Form 10-KDecember 31, 2005
TABLE OF CONTENTS
Item No. Page Number
Part I
1. Business ÏÏÏÏÏÏÏÏÏÏÏÏÏÏÏÏÏÏÏÏÏÏÏÏÏÏÏÏÏÏÏÏÏÏÏÏÏÏÏÏÏÏÏÏÏÏÏÏÏÏÏÏÏÏÏÏÏÏÏÏÏÏÏÏ 1
1A. Risk Factors ÏÏÏÏÏÏÏÏÏÏÏÏÏÏÏÏÏÏÏÏÏÏÏÏÏÏÏÏÏÏÏÏÏÏÏÏÏÏÏÏÏÏÏÏÏÏÏÏÏÏÏÏÏÏÏÏÏÏÏÏ 7
1B. Unresolved StaÅ Comments ÏÏÏÏÏÏÏÏÏÏÏÏÏÏÏÏÏÏÏÏÏÏÏÏÏÏÏÏÏÏÏÏÏÏÏÏÏÏÏÏÏÏÏÏÏÏÏ 16
2. PropertiesÏÏÏÏÏÏÏÏÏÏÏÏÏÏÏÏÏÏÏÏÏÏÏÏÏÏÏÏÏÏÏÏÏÏÏÏÏÏÏÏÏÏÏÏÏÏÏÏÏÏÏÏÏÏÏÏÏÏÏÏÏÏÏ 16
3. Legal ProceedingsÏÏÏÏÏÏÏÏÏÏÏÏÏÏÏÏÏÏÏÏÏÏÏÏÏÏÏÏÏÏÏÏÏÏÏÏÏÏÏÏÏÏÏÏÏÏÏÏÏÏÏÏÏÏÏÏ 28
4. Submission of Matters to a Vote of Security Holders ÏÏÏÏÏÏÏÏÏÏÏÏÏÏÏÏÏÏÏÏÏÏÏÏÏÏ 29
Part II
5. Market for Registrant's Common Equity, Related Stockholder Matters and IssuerPurchases of Equity Securities ÏÏÏÏÏÏÏÏÏÏÏÏÏÏÏÏÏÏÏÏÏÏÏÏÏÏÏÏÏÏÏÏÏÏÏÏÏÏÏÏÏÏÏÏÏ 29
6. Selected Financial Data ÏÏÏÏÏÏÏÏÏÏÏÏÏÏÏÏÏÏÏÏÏÏÏÏÏÏÏÏÏÏÏÏÏÏÏÏÏÏÏÏÏÏÏÏÏÏÏÏÏÏÏ 31
7. Management's Discussion and Analysis of Financial Condition and Results ofOperations ÏÏÏÏÏÏÏÏÏÏÏÏÏÏÏÏÏÏÏÏÏÏÏÏÏÏÏÏÏÏÏÏÏÏÏÏÏÏÏÏÏÏÏÏÏÏÏÏÏÏÏÏÏÏÏÏÏÏÏÏÏÏ 33
7A. Quantitative and Qualitative Disclosures About Market RiskÏÏÏÏÏÏÏÏÏÏÏÏÏÏÏÏÏÏÏÏ 50
8. Financial Statements and Supplementary DataÏÏÏÏÏÏÏÏÏÏÏÏÏÏÏÏÏÏÏÏÏÏÏÏÏÏÏÏÏÏÏÏ 50
9. Changes in and Disagreements with Accountants on Accounting and FinancialDisclosure ÏÏÏÏÏÏÏÏÏÏÏÏÏÏÏÏÏÏÏÏÏÏÏÏÏÏÏÏÏÏÏÏÏÏÏÏÏÏÏÏÏÏÏÏÏÏÏÏÏÏÏÏÏÏÏÏÏÏÏÏÏÏ 51
9A. Controls and Procedures ÏÏÏÏÏÏÏÏÏÏÏÏÏÏÏÏÏÏÏÏÏÏÏÏÏÏÏÏÏÏÏÏÏÏÏÏÏÏÏÏÏÏÏÏÏÏÏÏÏÏ 51
9B. Other InformationÏÏÏÏÏÏÏÏÏÏÏÏÏÏÏÏÏÏÏÏÏÏÏÏÏÏÏÏÏÏÏÏÏÏÏÏÏÏÏÏÏÏÏÏÏÏÏÏÏÏÏÏÏÏÏÏ 55
Part III
10. Directors and Executive OÇcers of the RegistrantÏÏÏÏÏÏÏÏÏÏÏÏÏÏÏÏÏÏÏÏÏÏÏÏÏÏÏÏÏ 55
11. Executive Compensation ÏÏÏÏÏÏÏÏÏÏÏÏÏÏÏÏÏÏÏÏÏÏÏÏÏÏÏÏÏÏÏÏÏÏÏÏÏÏÏÏÏÏÏÏÏÏÏÏÏÏ 55
12. Security Ownership of Certain BeneÑcial Owners and Management and RelatedStockholder Matters ÏÏÏÏÏÏÏÏÏÏÏÏÏÏÏÏÏÏÏÏÏÏÏÏÏÏÏÏÏÏÏÏÏÏÏÏÏÏÏÏÏÏÏÏÏÏÏÏÏÏÏÏÏÏ 55
13. Certain Relationships and Related TransactionsÏÏÏÏÏÏÏÏÏÏÏÏÏÏÏÏÏÏÏÏÏÏÏÏÏÏÏÏÏÏÏ 56
14. Principal Accounting Fees and Services ÏÏÏÏÏÏÏÏÏÏÏÏÏÏÏÏÏÏÏÏÏÏÏÏÏÏÏÏÏÏÏÏÏÏÏÏÏ 56
Part IV
15. Exhibits and Financial Statement SchedulesÏÏÏÏÏÏÏÏÏÏÏÏÏÏÏÏÏÏÏÏÏÏÏÏÏÏÏÏÏÏÏÏÏÏ 57
Signatures ÏÏÏÏÏÏÏÏÏÏÏÏÏÏÏÏÏÏÏÏÏÏÏÏÏÏÏÏÏÏÏÏÏÏÏÏÏÏÏÏÏÏÏÏÏÏÏÏÏÏÏÏÏÏÏÏÏÏÏÏÏÏÏÏÏÏÏÏÏÏ 58
Consolidated Financial Statements ÏÏÏÏÏÏÏÏÏÏÏÏÏÏÏÏÏÏÏÏÏÏÏÏÏÏÏÏÏÏÏÏÏÏÏÏÏÏÏÏÏÏÏÏÏÏÏÏÏ F-1
Consolidated Financial Statement ScheduleÏÏÏÏÏÏÏÏÏÏÏÏÏÏÏÏÏÏÏÏÏÏÏÏÏÏÏÏÏÏÏÏÏÏÏÏÏÏÏÏÏÏ F-55
Exhibit Index ÏÏÏÏÏÏÏÏÏÏÏÏÏÏÏÏÏÏÏÏÏÏÏÏÏÏÏÏÏÏÏÏÏÏÏÏÏÏÏÏÏÏÏÏÏÏÏÏÏÏÏÏÏÏÏÏÏÏÏÏÏÏÏÏÏÏÏ S-1
i

PART I
Item 1. Business
All references to numbered Notes are to speciÑc footnotes to the Consolidated Financial Statements ofGeneral Growth Properties, Inc. (""General Growth'' or the ""Company'') as included in this Annual Reporton Form 10-K (""Annual Report''). The descriptions included in such Notes are incorporated into theapplicable Item response by reference. The following discussion should be read in conjunction with suchConsolidated Financial Statements and related Notes. The terms ""we,'' ""us'' and ""our'' may also be used torefer to General Growth and its subsidiaries. See also the Glossary at the end of Item 7, Management'sDiscussion and Analysis of Financial Condition and Results of Operations, for deÑnitions of selected termsused in this Annual Report.
Overview
General Growth is a self-administered and self-managed real estate investment trust, referred to as a ""REIT.''General Growth is a Delaware corporation and was organized in 1986.
Our business is focused in two main areas:
‚ Retail and Other. Through this segment of our business, we own, operate, manage, lease, acquire, develop,expand and Ñnance rental properties. These properties, which are located primarily throughout the UnitedStates, include retail centers, oÇce and industrial buildings and mixed-use and other properties. As ofDecember 31, 2005, we had ownership interest in and/or management responsibility for a portfolio of over200 regional shopping malls in 44 states. We also have ownership interest in certain joint ventures whichown four retail properties (one under construction) in Brazil and one retail property under construction inCosta Rica.
‚ Master Planned Communities. Through this segment of our business, we develop and sell land in andaround Columbia, Maryland; Summerlin, Nevada; and Houston, Texas for residential, commercial andother uses primarily in master planned communities. As of December 31, 2005, these communities,including land previously sold or not saleable, total over 70,000 acres.
Substantially all of our business is conducted through GGP Limited Partnership (the ""Operating Partnership''or ""GGPLP''). As of December 31, 2005, ownership of the Operating Partnership was as follows:
82% ÏÏÏÏÏÏÏÏÏÏÏÏÏÏÏÏÏÏÏÏÏÏÏÏÏÏÏÏÏÏÏÏÏÏÏ General Growth, as sole general partner
Limited partners that indirectly include familymembers of the original stockholders of theCompany. Represented by common units oflimited partnership interest (the ""Common
16ÏÏÏÏÏÏÏÏÏÏÏÏÏÏÏÏÏÏÏÏÏÏÏÏÏÏÏÏÏÏÏÏÏÏÏÏÏ Units'')
Limited partners that include subsequentcontributors of properties to the OperatingPartnership which are also represented by
2ÏÏÏÏÏÏÏÏÏÏÏÏÏÏÏÏÏÏÏÏÏÏÏÏÏÏÏÏÏÏÏÏÏÏÏÏÏ Common Units.
100%
The Operating Partnership also has preferred units of limited partnership interest (the ""Preferred Units'')outstanding. Under certain circumstances, the Preferred Units are convertible into Common Units which areredeemable for shares of General Growth common stock on a one-for-one basis.
Many of our properties are owned entirely by us, or through entities in which we own a majority or controllinginterest. As a result, these properties are consolidated under generally accepted accounting principles(""GAAP''), and we refer to them as the ""Consolidated Properties.'' Some properties are held through jointventure entities in which we own a non-controlling interest (""Unconsolidated Real Estate AÇliates'') and we
1
refer to those properties as the ""Unconsolidated Properties.'' Collectively, we refer to the ConsolidatedProperties and Unconsolidated Properties as our ""Company Portfolio.''
We make all key strategic decisions for our properties. However, in connection with the UnconsolidatedProperties, such strategic decisions are made with the respective stockholders, members or joint venturepartners of such properties. We are also the asset manager of most of the properties in the Company Portfolio,executing the strategic decisions and overseeing the day-to-day property management functions, includingleasing, construction management, data processing, maintenance, accounting, marketing, promotional servicesand security oversight. With respect to jointly owned properties, we generally conduct the managementactivities through one of our taxable REIT subsidiaries (""TRS''). As of December 31, 2005, we managed theproperties for 21 of our unconsolidated joint ventures and seven of our consolidated joint ventures. Our jointventure partners managed the properties for 12 of our unconsolidated joint ventures and four of ourconsolidated joint ventures.
General Development of Business
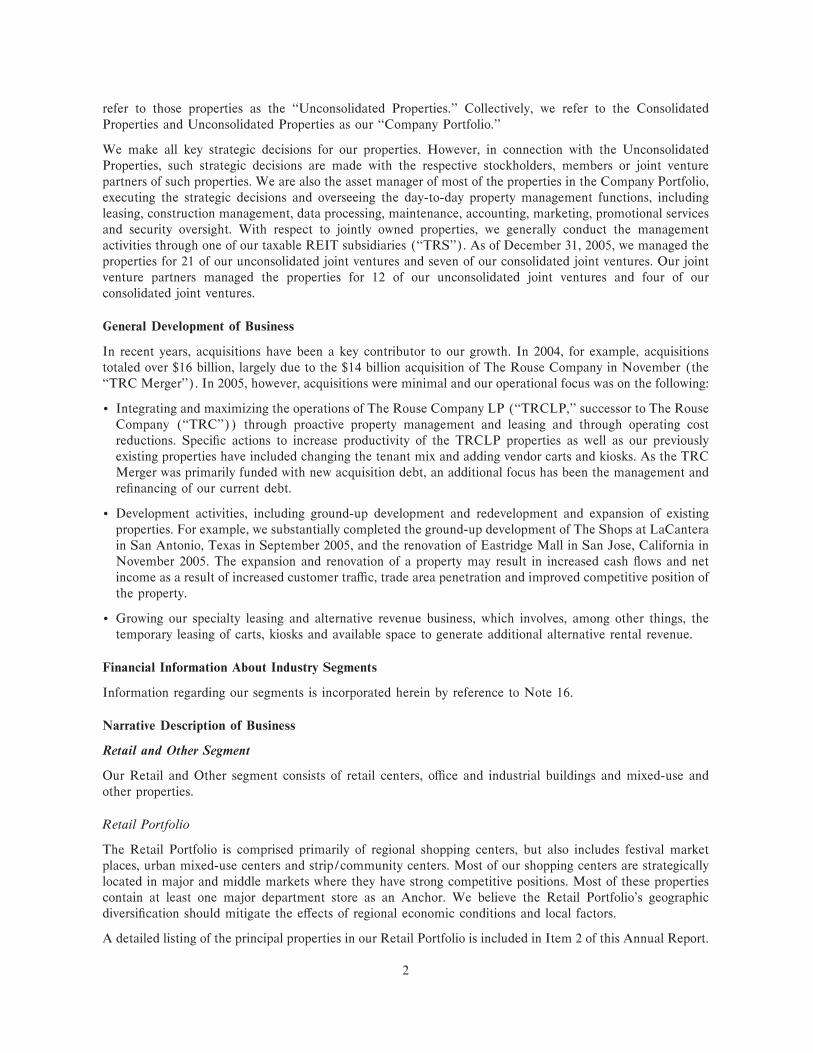
In recent years, acquisitions have been a key contributor to our growth. In 2004, for example, acquisitionstotaled over $16 billion, largely due to the $14 billion acquisition of The Rouse Company in November (the""TRC Merger''). In 2005, however, acquisitions were minimal and our operational focus was on the following:
‚ Integrating and maximizing the operations of The Rouse Company LP (""TRCLP,'' successor to The RouseCompany (""TRC'')) through proactive property management and leasing and through operating costreductions. SpeciÑc actions to increase productivity of the TRCLP properties as well as our previouslyexisting properties have included changing the tenant mix and adding vendor carts and kiosks. As the TRCMerger was primarily funded with new acquisition debt, an additional focus has been the management andreÑnancing of our current debt.
‚ Development activities, including ground-up development and redevelopment and expansion of existingproperties. For example, we substantially completed the ground-up development of The Shops at LaCanterain San Antonio, Texas in September 2005, and the renovation of Eastridge Mall in San Jose, California inNovember 2005. The expansion and renovation of a property may result in increased cash Öows and netincome as a result of increased customer traÇc, trade area penetration and improved competitive position ofthe property.
‚ Growing our specialty leasing and alternative revenue business, which involves, among other things, thetemporary leasing of carts, kiosks and available space to generate additional alternative rental revenue.
Financial Information About Industry Segments
Information regarding our segments is incorporated herein by reference to Note 16.
Narrative Description of Business
Retail and Other Segment
Our Retail and Other segment consists of retail centers, oÇce and industrial buildings and mixed-use andother properties.
Retail Portfolio
The Retail Portfolio is comprised primarily of regional shopping centers, but also includes festival marketplaces, urban mixed-use centers and strip/community centers. Most of our shopping centers are strategicallylocated in major and middle markets where they have strong competitive positions. Most of these propertiescontain at least one major department store as an Anchor. We believe the Retail Portfolio's geographicdiversiÑcation should mitigate the eÅects of regional economic conditions and local factors.
A detailed listing of the principal properties in our Retail Portfolio is included in Item 2 of this Annual Report.
2
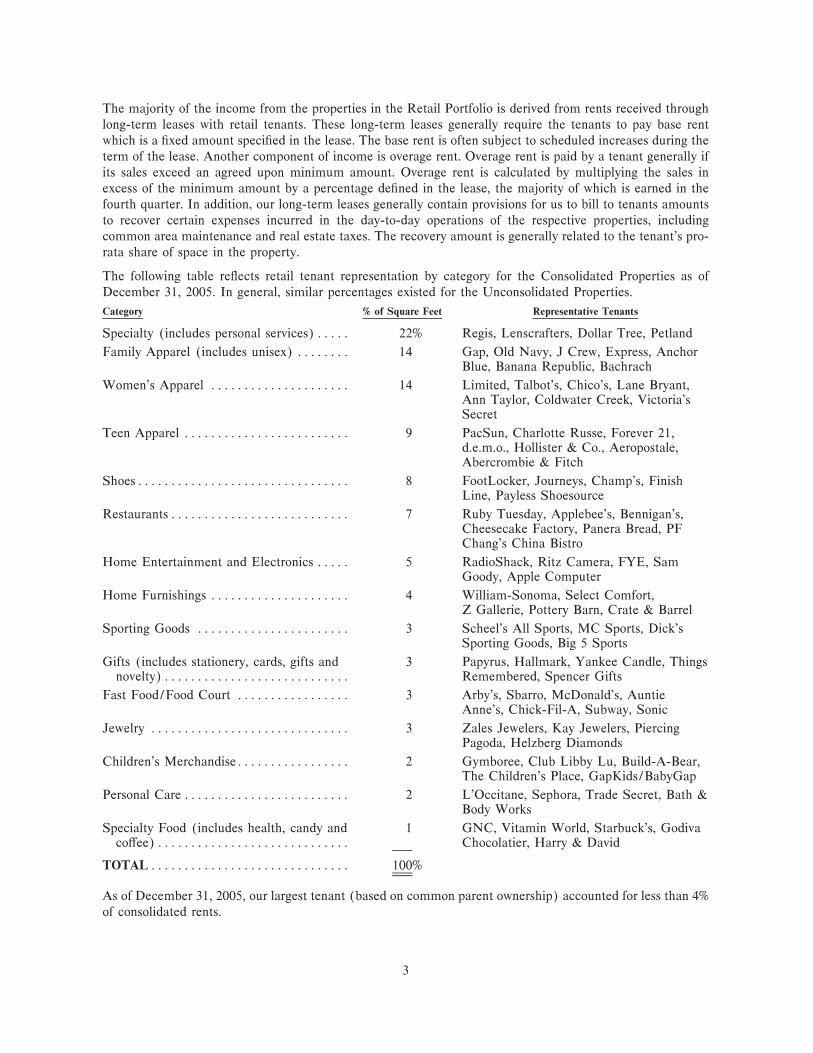
The majority of the income from the properties in the Retail Portfolio is derived from rents received throughlong-term leases with retail tenants. These long-term leases generally require the tenants to pay base rentwhich is a Ñxed amount speciÑed in the lease. The base rent is often subject to scheduled increases during theterm of the lease. Another component of income is overage rent. Overage rent is paid by a tenant generally ifits sales exceed an agreed upon minimum amount. Overage rent is calculated by multiplying the sales inexcess of the minimum amount by a percentage deÑned in the lease, the majority of which is earned in thefourth quarter. In addition, our long-term leases generally contain provisions for us to bill to tenants amountsto recover certain expenses incurred in the day-to-day operations of the respective properties, includingcommon area maintenance and real estate taxes. The recovery amount is generally related to the tenant's pro-rata share of space in the property.
The following table reÖects retail tenant representation by category for the Consolidated Properties as ofDecember 31, 2005. In general, similar percentages existed for the Unconsolidated Properties.
Category % of Square Feet Representative Tenants
Specialty (includes personal services)ÏÏÏÏÏ 22% Regis, Lenscrafters, Dollar Tree, Petland
Family Apparel (includes unisex) ÏÏÏÏÏÏÏÏ 14 Gap, Old Navy, J Crew, Express, AnchorBlue, Banana Republic, Bachrach
Women's Apparel ÏÏÏÏÏÏÏÏÏÏÏÏÏÏÏÏÏÏÏÏÏ 14 Limited, Talbot's, Chico's, Lane Bryant,Ann Taylor, Coldwater Creek, Victoria'sSecret
Teen Apparel ÏÏÏÏÏÏÏÏÏÏÏÏÏÏÏÏÏÏÏÏÏÏÏÏÏ 9 PacSun, Charlotte Russe, Forever 21,d.e.m.o., Hollister & Co., Aeropostale,Abercrombie & Fitch
ShoesÏÏÏÏÏÏÏÏÏÏÏÏÏÏÏÏÏÏÏÏÏÏÏÏÏÏÏÏÏÏÏÏ 8 FootLocker, Journeys, Champ's, FinishLine, Payless Shoesource
RestaurantsÏÏÏÏÏÏÏÏÏÏÏÏÏÏÏÏÏÏÏÏÏÏÏÏÏÏÏ 7 Ruby Tuesday, Applebee's, Bennigan's,Cheesecake Factory, Panera Bread, PFChang's China Bistro
Home Entertainment and Electronics ÏÏÏÏÏ 5 RadioShack, Ritz Camera, FYE, SamGoody, Apple Computer
Home Furnishings ÏÏÏÏÏÏÏÏÏÏÏÏÏÏÏÏÏÏÏÏÏ 4 William-Sonoma, Select Comfort,Z Gallerie, Pottery Barn, Crate & Barrel
Sporting Goods ÏÏÏÏÏÏÏÏÏÏÏÏÏÏÏÏÏÏÏÏÏÏÏ 3 Scheel's All Sports, MC Sports, Dick'sSporting Goods, Big 5 Sports
Gifts (includes stationery, cards, gifts and 3 Papyrus, Hallmark, Yankee Candle, Thingsnovelty)ÏÏÏÏÏÏÏÏÏÏÏÏÏÏÏÏÏÏÏÏÏÏÏÏÏÏÏÏ Remembered, Spencer Gifts
Fast Food/Food Court ÏÏÏÏÏÏÏÏÏÏÏÏÏÏÏÏÏ 3 Arby's, Sbarro, McDonald's, AuntieAnne's, Chick-Fil-A, Subway, Sonic
Jewelry ÏÏÏÏÏÏÏÏÏÏÏÏÏÏÏÏÏÏÏÏÏÏÏÏÏÏÏÏÏÏ 3 Zales Jewelers, Kay Jewelers, PiercingPagoda, Helzberg Diamonds
Children's MerchandiseÏÏÏÏÏÏÏÏÏÏÏÏÏÏÏÏÏ 2 Gymboree, Club Libby Lu, Build-A-Bear,The Children's Place, GapKids/BabyGap
Personal Care ÏÏÏÏÏÏÏÏÏÏÏÏÏÏÏÏÏÏÏÏÏÏÏÏÏ 2 L'Occitane, Sephora, Trade Secret, Bath &Body Works
Specialty Food (includes health, candy and 1 GNC, Vitamin World, Starbuck's, GodivacoÅee)ÏÏÏÏÏÏÏÏÏÏÏÏÏÏÏÏÏÏÏÏÏÏÏÏÏÏÏÏÏ Chocolatier, Harry & David
TOTAL ÏÏÏÏÏÏÏÏÏÏÏÏÏÏÏÏÏÏÏÏÏÏÏÏÏÏÏÏÏÏ 100%
As of December 31, 2005, our largest tenant (based on common parent ownership) accounted for less than 4%of consolidated rents.
3
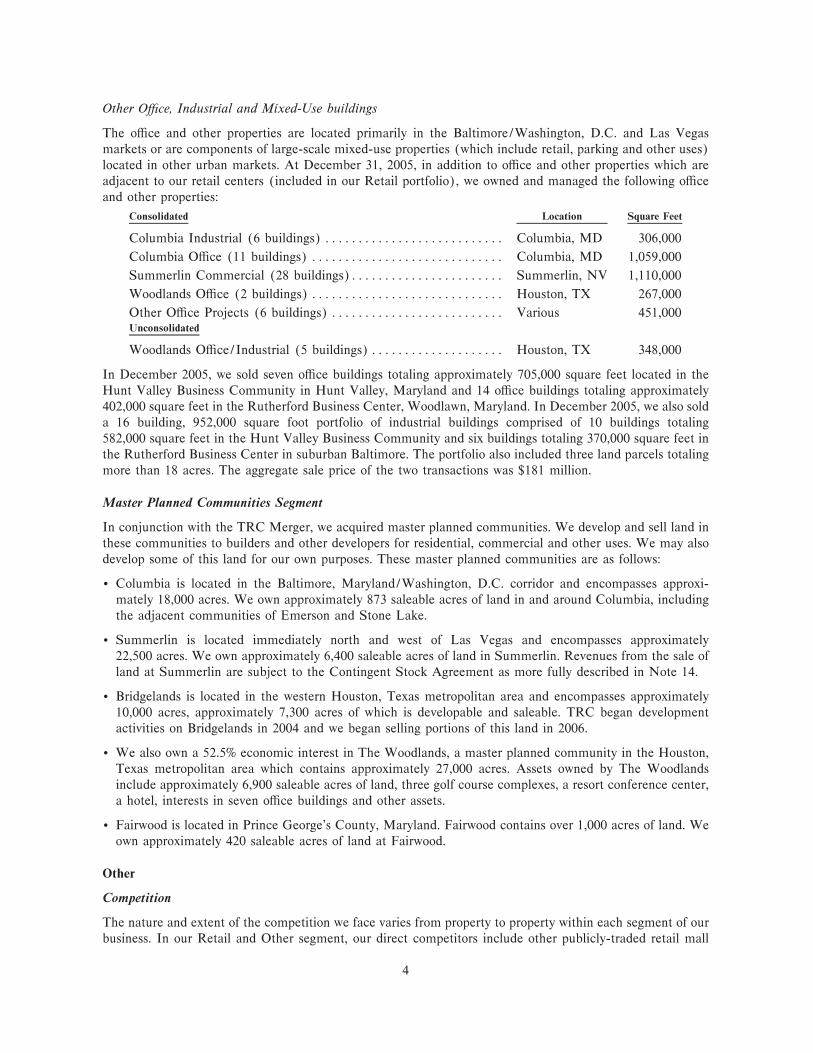
Other OÇce, Industrial and Mixed-Use buildings
The oÇce and other properties are located primarily in the Baltimore/Washington, D.C. and Las Vegasmarkets or are components of large-scale mixed-use properties (which include retail, parking and other uses)located in other urban markets. At December 31, 2005, in addition to oÇce and other properties which areadjacent to our retail centers (included in our Retail portfolio), we owned and managed the following oÇceand other properties:
Consolidated Location Square Feet
Columbia Industrial (6 buildings) ÏÏÏÏÏÏÏÏÏÏÏÏÏÏÏÏÏÏÏÏÏÏÏÏÏÏÏ Columbia, MD 306,000
Columbia OÇce (11 buildings) ÏÏÏÏÏÏÏÏÏÏÏÏÏÏÏÏÏÏÏÏÏÏÏÏÏÏÏÏÏ Columbia, MD 1,059,000
Summerlin Commercial (28 buildings)ÏÏÏÏÏÏÏÏÏÏÏÏÏÏÏÏÏÏÏÏÏÏÏ Summerlin, NV 1,110,000
Woodlands OÇce (2 buildings) ÏÏÏÏÏÏÏÏÏÏÏÏÏÏÏÏÏÏÏÏÏÏÏÏÏÏÏÏÏ Houston, TX 267,000
Other OÇce Projects (6 buildings) ÏÏÏÏÏÏÏÏÏÏÏÏÏÏÏÏÏÏÏÏÏÏÏÏÏÏ Various 451,000Unconsolidated
Woodlands OÇce/Industrial (5 buildings)ÏÏÏÏÏÏÏÏÏÏÏÏÏÏÏÏÏÏÏÏ Houston, TX 348,000
In December 2005, we sold seven oÇce buildings totaling approximately 705,000 square feet located in theHunt Valley Business Community in Hunt Valley, Maryland and 14 oÇce buildings totaling approximately402,000 square feet in the Rutherford Business Center, Woodlawn, Maryland. In December 2005, we also solda 16 building, 952,000 square foot portfolio of industrial buildings comprised of 10 buildings totaling582,000 square feet in the Hunt Valley Business Community and six buildings totaling 370,000 square feet inthe Rutherford Business Center in suburban Baltimore. The portfolio also included three land parcels totalingmore than 18 acres. The aggregate sale price of the two transactions was $181 million.
Master Planned Communities Segment
In conjunction with the TRC Merger, we acquired master planned communities. We develop and sell land inthese communities to builders and other developers for residential, commercial and other uses. We may alsodevelop some of this land for our own purposes. These master planned communities are as follows:
‚ Columbia is located in the Baltimore, Maryland/Washington, D.C. corridor and encompasses approxi-mately 18,000 acres. We own approximately 873 saleable acres of land in and around Columbia, includingthe adjacent communities of Emerson and Stone Lake.
‚ Summerlin is located immediately north and west of Las Vegas and encompasses approximately22,500 acres. We own approximately 6,400 saleable acres of land in Summerlin. Revenues from the sale ofland at Summerlin are subject to the Contingent Stock Agreement as more fully described in Note 14.
‚ Bridgelands is located in the western Houston, Texas metropolitan area and encompasses approximately10,000 acres, approximately 7,300 acres of which is developable and saleable. TRC began developmentactivities on Bridgelands in 2004 and we began selling portions of this land in 2006.
‚ We also own a 52.5% economic interest in The Woodlands, a master planned community in the Houston,Texas metropolitan area which contains approximately 27,000 acres. Assets owned by The Woodlandsinclude approximately 6,900 saleable acres of land, three golf course complexes, a resort conference center,a hotel, interests in seven oÇce buildings and other assets.
‚ Fairwood is located in Prince George's County, Maryland. Fairwood contains over 1,000 acres of land. Weown approximately 420 saleable acres of land at Fairwood.
Other
Competition
The nature and extent of the competition we face varies from property to property within each segment of ourbusiness. In our Retail and Other segment, our direct competitors include other publicly-traded retail mall
4
development and operating companies, retail real estate companies, commercial property developers and otherowners of retail real estate that engage in similar businesses.
Within our Retail Portfolio, we compete to acquire land for new site development and to acquire existing retailproperties. We believe that we have a competitive advantage with respect to acquisitions for the followingreasons:
‚ Subject to certain limitations, the funds necessary for cash acquisitions are available to us from acombination of sources, including mortgage or unsecured Ñnancing or the issuance of public or private debtor equity.
‚ We have the Öexibility to pay for an acquisition with a combination of cash, General Growth equitysecurities or common or preferred units of limited partnership interest in the Operating Partnership. Thislast approach may create the opportunity for a tax-advantaged transaction for the seller.
‚ Our expertise allows us to evaluate proposed acquisitions of existing retail properties for their increasedproÑt potential through expansion, remodeling, re-merchandising and more eÇcient management of theproperty.
We also compete for retail tenants. We believe the principal factors that retailers consider in making theirleasing decision include:
‚ Consumer demographics
‚ Quality, design and location of properties
‚ Total number and geographic distribution of properties
‚ Diversity of retailers and anchor tenants at shopping center locations
‚ Management and operational expertise
‚ Rental rates
Based on these criteria, we believe that the size and scope of our property portfolio, as well as the overallquality and attractiveness of our individual properties, enable us to compete eÅectively for retail tenants in ourlocal markets. Because our revenue potential is linked to the success of our retailers, we indirectly shareexposure to the same competitive factors that our retail tenants experience in their respective markets whentrying to attract individual shoppers. These dynamics include general competition from other regionalshopping centers, including outlet malls and other discount shopping centers, as well as competition withdiscount shopping clubs, catalog companies, internet sales and telemarketing.
With respect to our oÇce and other properties, we experience competition in the development andmanagement of our properties similar to that of our Retail Portfolio. Prospective tenants generally considerquality and appearance, amenities, location relative to other commercial activity and price in determining theattractiveness of our properties. Based on the quality and location of our properties, which are generally inurban markets or are concentrated in the commercial centers of our master planned communities, we believethat our properties are viewed favorably among prospective tenants.
In our Master Planned Communities segment, we compete with other landholders and residential andcommercial property developers in the development of properties within the Baltimore/Washington, D.C., LasVegas, and Houston markets. SigniÑcant factors aÅecting our competition in this business include:
‚ The size and scope of our master planned communities
‚ The recreational and cultural amenities available within the communities
‚ The commercial centers in the communities
‚ The relationships of the developer with homebuilders
‚ The proximity to major metropolitan areas
5

We believe our projects oÅer signiÑcant advantages when viewed against these criteria.
Environmental Matters
Under various federal, state and local laws and regulations, an owner of real estate is liable for the costs ofremoval or remediation of certain hazardous or toxic substances on such real estate. These laws often imposesuch liability without regard to whether the owner knew of, or was responsible for, the presence of suchhazardous or toxic substances. The costs of remediation or removal of such substances may be substantial, andthe presence of such substances, or the failure to promptly remediate such substances, may adversely aÅectthe owner's ability to sell such real estate or to borrow using such real estate as collateral. In connection withour ownership and operation of our properties, we, or the relevant property venture through which the propertyis owned, may be potentially liable for such costs.
Substantially all of our properties have been subject to environmental assessments, which are intended todiscover information regarding, and to evaluate the environmental condition of, the surveyed and surroundingproperties.
The Phase I environmental assessments included a historical review, a public records review, a preliminaryinvestigation of the site and surrounding properties, screening for the presence of asbestos, polychlorinatedbiphenyls (""PCBs'') and underground storage tanks and the preparation and issuance of a written report, butdo not include soil sampling or subsurface investigations. A Phase II assessment, when necessary, wasconducted to further investigate any issues raised by the Phase I assessment. In each case where Phase Iand/or Phase II assessments resulted in speciÑc recommendations for remedial actions required by law,management has either taken or scheduled the recommended action.
Neither the Phase I nor the Phase II assessments have revealed any environmental liability that we believewould have a material eÅect on our overall business, Ñnancial condition or results of operations. Nevertheless,it is possible that these assessments do not reveal all environmental liabilities or that there are materialenvironmental liabilities of which we are unaware. Moreover, no assurances can be given that future laws,ordinances or regulations will not impose any material environmental liability or the current environmentalcondition of our properties will not be adversely aÅected by tenants and occupants of the properties, by thecondition of properties in the vicinity of our properties (such as the presence on such properties ofunderground storage tanks) or by third parties unrelated to us.
Future development opportunities may require additional capital and other expenditures in order to complywith Federal, state and local statutes and regulations relating to the protection of the environment. It isimpossible at this time to predict with any certainty the magnitude of any such expenditures or the long-rangeeÅect, if any, on our operations. Compliance with such laws has had no material adverse eÅect on ouroperating results or competitive position in the past.
Employees
As of March 1, 2006, we had approximately 4,700 employees.
QualiÑcation as a Real Estate Investment Trust and Taxability of Distributions
General Growth currently qualiÑes as a real estate investment trust pursuant to the requirements contained inSections 856-858 of the Internal Revenue Code of 1986, as amended (the ""Code''). If, as we contemplate,such qualiÑcation continues, General Growth will not be taxed on its real estate investment trust taxableincome. During 2005, General Growth distributed (or was deemed to have distributed) 100% of its taxableincome to its preferred and common stockholders (Note 7).
Available Information
Our Internet website address is www.generalgrowth.com. Our Annual Reports on Form 10-K, QuarterlyReports on Form 10-Q, Current Reports on Form 8-K and amendments to those reports are available and maybe accessed free of charge through the Investment section of our Internet website under the Shareholder Info
6
subsection, as soon as reasonably practicable after those documents are Ñled with, or furnished to, the SEC.Our Internet website and information contained therein or connected thereto are not intended to beincorporated into this Annual Report.
Item 1A. Risk Factors
Risks Related to Real Estate Investments
We invest primarily in regional mall shopping centers and other retail properties, which are subject to anumber of signiÑcant risks which are beyond our control
Real property investments are subject to varying degrees of risk that may aÅect the ability of our retailproperties to generate suÇcient revenues. A number of factors may decrease the income generated by a retailproperty, including:
‚ the regional and local economy, which may be negatively impacted by plant closings, industry slowdowns,adverse weather conditions, natural disasters and other factors;
‚ local real estate conditions, such as an oversupply of, or a reduction in demand for, retail space or retailgoods, and the availability and creditworthiness of current and prospective tenants;
‚ perceptions by retailers or shoppers of the safety, convenience and attractiveness of the retail property;
‚ the convenience and quality of competing retail properties and other retailing options such as the Internet;
‚ changes in laws and regulations applicable to real property, including tax and zoning laws; and
‚ changes in interest rate levels and the availability and cost of Ñnancing.
If we are unable to generate suÇcient revenue from our retail properties, including those held by jointventures, we will be unable to meet operating and other expenses, including debt service, lease payments,capital expenditures and tenant improvements, and to make distributions from our joint ventures and then, inturn, to our stockholders.
We depend on leasing space to tenants on economically favorable terms and collecting rent from thesetenants, who may not be able to pay
Our results of operations will depend on our ability to continue to lease space in our properties on economicallyfavorable terms. If the sales of stores operating in our centers decline suÇciently, tenants might be unable topay their existing minimum rents or expense recovery charges, since these rents and charges would represent ahigher percentage of their sales. If our tenants' sales decline, new tenants would be less likely to be willing topay minimum rents as high as they would otherwise pay. In addition, as substantially all of our income isderived from rentals of real property, our income and cash available for distribution to our stockholders wouldbe adversely aÅected if a signiÑcant number of tenants were unable to meet their obligations to us. Duringtimes of economic recession, these risks will increase.
Bankruptcy or store closures of tenants may decrease our revenues and available cash
A number of companies in the retail industry, including some of our tenants, have declared bankruptcy orvoluntarily closed certain of their stores in recent years. The bankruptcy or closure of a major tenant,particularly an Anchor tenant, may have a material adverse eÅect on the retail properties aÅected and theincome produced by these properties and may make it substantially more diÇcult to lease the remainder of theaÅected retail properties. Our leases generally do not contain provisions designed to ensure the creditworthi-ness of the tenant. As a result, the bankruptcy or closure of a major tenant could result in a lower level ofrevenues and cash available for distribution to our stockholders.
7
We may be negatively impacted by department store consolidations
Department store consolidations, such as K-Mart's acquisition of Sears and Federated's acquisition of MayDepartment Stores, are resulting in the closure of existing department stores and we may be unable to re-leasethis area or to re-lease it on comparable or more favorable terms. Other tenants may be entitled to modify theterms of their existing leases, including those pertaining to rent payment, in the event of such closures.Additionally, department store closures could result in decreased customer traÇc which could lead todecreased sales at other stores. Consolidations may also negatively aÅect current and future development andredevelopment projects.
It may be diÇcult to buy and sell real estate quickly, and transfer restrictions apply to some of ourproperties
Equity real estate investments are relatively illiquid, and this characteristic tends to limit our ability to vary ourportfolio promptly in response to changes in economic or other conditions. In addition, signiÑcant expendituresassociated with each equity investment, such as mortgage payments, real estate taxes and maintenance costs,are generally not reduced when circumstances cause a reduction in income from the investment. If incomefrom a property declines while the related expenses do not decline, our income and cash available fordistribution to our stockholders would be adversely aÅected. A signiÑcant portion of our properties aremortgaged to secure payment of indebtedness, and if we were unable to meet our mortgage payments, wecould lose money as a result of foreclosure on the properties by the various mortgagees. In addition, if itbecomes necessary or desirable for us to dispose of one or more of the mortgaged properties, we might not beable to obtain a release of the lien on the mortgaged property without payment of the associated debt. Theforeclosure of a mortgage on a property or inability to sell a property could adversely aÅect the level of cashavailable for distribution to our stockholders. In certain transactions, if persons selling properties to us wish todefer the payment of taxes on the sales proceeds, we are likely to pay them in units of limited partnershipinterest in the Operating Partnership. In transactions of this kind, we may also agree, subject to certainexceptions, not to sell the acquired properties for signiÑcant periods of time.
Risks Related to our Business
We develop and expand properties, and this activity is subject to various risks
We intend to continue to pursue development and expansion activities as opportunities arise. In connectionwith any development or expansion, we will be subject to various risks, including the following:
‚ we may abandon development or expansion activities, which may result in additional cost recognition;
‚ construction costs of a project may exceed original estimates or available Ñnancing, possibly making theproject unfeasible or unproÑtable;
‚ we may not be able to obtain Ñnancing or to reÑnance construction loans, which generally have full recourseto us;
‚ we may not be able to obtain zoning, occupancy or other required governmental permits and authorizations;
‚ occupancy rates and rents at a completed project may not meet projections and, therefore, the project maynot be proÑtable; and
‚ we may need Anchor, mortgage lender and property partner approvals, if applicable, for expansion orredevelopment activities.
If a development project is unsuccessful, our loss could exceed our investment in the project.
If we are unable to manage our growth eÅectively, our Ñnancial condition and results of operations may beadversely aÅected
We have experienced rapid growth in recent years, increasing our total consolidated assets from less than$2 billion at December 31, 1996 to over $25 billion at December 31, 2005. We may not be able to manage our
8

growth eÅectively or to maintain a similar rate of growth in the future, and the failure to do so may have amaterial adverse eÅect on our Ñnancial condition and results of operations.
We may incur costs to comply with environmental laws
Under various federal, state or local laws, ordinances and regulations, a current or previous owner or operatorof real estate may be required to investigate and clean up hazardous or toxic substances released at a property,and may be held liable to a governmental entity or to third parties for property damage or personal injuries andfor investigation and clean-up costs incurred by the parties in connection with the contamination. These lawsoften impose liability without regard to whether the owner or operator knew of, or was responsible for, therelease of the hazardous or toxic substances. The presence of contamination or the failure to remediatecontamination may adversely aÅect the owner's ability to sell or lease real estate or to borrow using the realestate as collateral. Other federal, state and local laws, ordinances and regulations require abatement orremoval of asbestos-containing materials in the event of demolition or certain renovations or remodeling andalso govern emissions of and exposure to asbestos Ñbers in the air. Federal and state laws also regulate theoperation and removal of underground storage tanks. In connection with the ownership, operation andmanagement of our properties, we could be held liable for the costs of remedial action with respect to theseregulated substances or tanks or related claims.
Each of our properties has been subjected to varying degrees of environmental assessment at various times.However, the identiÑcation of new areas of contamination, a change in the extent or known scope ofcontamination or changes in cleanup requirements could result in signiÑcant costs to us.
We are in a competitive business
There are numerous shopping facilities that compete with our properties in attracting retailers to lease space.In addition, retailers at our properties face continued competition from discount shopping centers, lifestylecenters, outlet malls, wholesale and discount shopping clubs, direct mail, telemarketing, television shoppingnetworks and shopping via the Internet. Competition of this type could adversely aÅect our revenues and cashavailable for distribution to our stockholders.
We compete with other major real estate investors with signiÑcant capital for attractive investmentopportunities. These competitors include other REITs, investment banking Ñrms and private institutionalinvestors. This competition has increased prices for commercial properties and may impair our ability to makesuitable property acquisitions on favorable terms in the future.
We may not be able to obtain capital to make investments
We depend primarily on external Ñnancing to fund the growth of our business. This is because one of therequirements of the Internal Revenue Code of 1986, as amended, which we refer to as the ""Code,'' for a REITgenerally is that it distribute 90% of its taxable income, excluding net capital gains, to its stockholders. Ouraccess to debt or equity Ñnancing depends on banks' willingness to lend to us and on conditions in the capitalmarkets in general. We and other companies in the real estate industry have experienced less favorable termsfor bank loans and capital markets Ñnancing from time to time. Although we believe, based on current marketconditions, that we will be able to Ñnance investments we wish to make in the foreseeable future, Ñnancingmight not be available on acceptable terms or may be aÅected by the amount of debt we have outstanding as aresult of the TRC Merger.
Some of our properties are subject to potential natural or other disasters
A number of our properties are located in areas which are subject to natural disasters. For example, two of ourproperties, located in the New Orleans area, suÅered major damage in 2005. It is uncertain as to whether theNew Orleans area will recover to its prior economic strength.
We carry comprehensive liability, Ñre, Öood, earthquake, terrorism, extended coverage and rental lossinsurance on all of our properties. We believe the policy speciÑcations and insured limits of these policies are
9
adequate and appropriate. There are, however, some types of losses, including lease and other contract claims,which generally are not insured. If an uninsured loss or a loss in excess of insured limits occurs, we could loseall or a portion of the capital we have invested in a property, as well as the anticipated future revenue from theproperty. If this happens, we might nevertheless remain obligated for any mortgage debt or other Ñnancialobligations related to the property.
If the Terrorism Risk Insurance Extension Act is not extended beyond 2007, we may incur higher insurancecosts and greater diÇculty in obtaining insurance which covers terrorist-related damages. Our tenants mayalso experience similar diÇculties.
We are subject to risks that aÅect the general retail environment
Our concentration in the regional mall market means that we are subject to factors that aÅect the retailenvironment generally, including the level of consumer spending, the willingness of retailers to lease space inour shopping centers, department store consolidations and tenant bankruptcies. In addition, we are exposed tothe risk that terrorist activities, or the threat of such activities, may discourage consumers from visiting ourmalls and impact consumer conÑdence.
InÖation may adversely aÅect our Ñnancial condition and results of operations
Should inÖation increase in the future, we may experience any or all of the following:
‚ decreasing tenant sales as a result of decreased consumer spending which could result in lower overagerents;
‚ diÇculty in replacing or renewing expiring leases with new leases at higher base and/or overage rents; and
‚ an inability to receive reimbursement from our tenants for their share of certain operating expenses,including common area maintenance, real estate taxes and insurance.
InÖation also poses a potential threat to us due to the probability of future increases in interest rates. Suchincreases would adversely impact us due to our outstanding variable-rate debt as well as result in higherinterest rates on new Ñxed-rate debt.
Risks Related to our Organizational and Financial Structure that Give Rise to Operational and FinancialRisks
As of December 31, 2005, we had material weaknesses in our internal control over Ñnancial reporting
The reports for Ñscal year 2005 included in this Annual Report include material weaknesses related to theCompany's failure to maintain eÅective policies and procedures relating to accounting for income taxes andfailure to have suÇcient personnel resources with appropriate technical accounting expertise to conduct atimely and accurate Ñnancial close. Although we have implemented and continue to implement remediationeÅorts, a material weakness indicates that there is more than a remote likelihood that a material misstatementof our Ñnancial statements will not be prevented or detected in a future period. In addition, we cannot assureyou that we will not in the future identify further material weaknesses or signiÑcant deÑciencies in our internalcontrol over Ñnancial reporting that we have not discovered to date. We are taking steps to improve ourinternal control over Ñnancial reporting to comply with Section 404 of the Sarbanes-Oxley Act. The eÅorts wehave taken and continue to take are subject to continued management review supported by conÑrmation andtesting by management and by our internal auditors as well as audit committee oversight. However, if theseremediation eÅorts are insuÇcient to address the identiÑed material weaknesses, or if additional materialweaknesses are discovered in the future, we may fail to meet our future reporting obligations on a timely basisand internal control deÑciencies could cause investors to lose conÑdence in our reported Ñnancial information.
Our substantial indebtedness could adversely aÅect our Ñnancial health and operating Öexibility
We have a substantial amount of indebtedness. As of December 31, 2005, we had an aggregate consolidatedindebtedness outstanding of approximately $20.4 billion (Note 6). Approximately $6.9 billion of our aggregate
10
indebtedness was unsecured, recourse indebtedness of the Operating Partnership and consolidated subsidiar-ies, while approximately $13.5 billion was secured by our properties. A majority of the secured indebtednesswas non-recourse to us. This indebtedness does not include our proportionate share of indebtedness incurredby our Unconsolidated Properties. As a result of this substantial indebtedness, we are required to use amaterial portion of our cash Öow to service principal and interest on our debt, which will limit the cash Öowavailable for other desirable business opportunities, if present.
Our substantial indebtedness could have important consequences to us and the value of our common stock,including:
‚ limiting our ability to borrow additional amounts for working capital, capital expenditures, debt servicerequirements, execution of our growth strategy or other purposes;
‚ limiting our ability to use operating cash Öow in other areas of our business because we must dedicate asubstantial portion of these funds to service the debt;
‚ increasing our vulnerability to general adverse economic and industry conditions, including increases ininterest rates, particularly given our substantial indebtedness which bears interest at variable rates;
‚ limiting our ability to capitalize on business opportunities, including the acquisition of additional properties,and to react to competitive pressures and adverse changes in government regulation;
‚ limiting our ability or increasing the costs to reÑnance indebtedness; and
‚ limiting our ability to enter into marketing and hedging transactions by reducing the number ofcounterparties with whom we can enter into such transactions as well as the volume of those transactions.
The terms of the 2006 Credit Facility (obtained in February 2006 (Note 6)) and certain other debt,contain covenants and events of default that may limit our Öexibility and prevent us from taking certainactions or result in the acceleration of our obligations under such debt
The terms of the 2006 Credit Facility, similar to the 2004 Credit Facility that was in eÅect at December 31,2005, and certain other debt, require us to satisfy certain customary aÇrmative and negative covenants and tomeet Ñnancial ratios and tests including ratios and tests based on leverage, interest coverage and net worth.The covenants under our debt aÅect, among other things, our ability to:
‚ incur indebtedness;
‚ create liens on assets;
‚ sell assets;
‚ make capital expenditures; and
‚ engage in mergers and acquisitions.
Given the restrictions in our debt covenants on these and other activities, we may be restricted in our ability topursue other acquisitions, may be signiÑcantly limited in our operating and Ñnancial Öexibility and may belimited in our ability to respond to changes in our business or competitive activities.
A failure to comply with these covenants, including a failure to meet the Ñnancial tests or ratios, would likelyresult in an event of default under our debt and would allow the lenders to accelerate such debt under suchfacility. If our debt is accelerated, our assets may not be suÇcient to repay such debt in full.
We have a substantial amount of short-term indebtedness
We have $2 billion of such indebtedness that must be reÑnanced this year. The failure to reÑnance this debt onfavorable terms could have material consequences to us and our stockholders.
11
We share control of some of our properties with other investors and may have conÖicts of interest withthose investors
While we generally make all operating decisions for the Unconsolidated Properties, we are required to makeother decisions with the other investors who have interests in the relevant property or properties. For example,the approval of certain of the other investors is required with respect to operating budgets and reÑnancing,encumbering, expanding or selling any of these properties. We might not have the same interests as the otherinvestors in relation to these transactions. Accordingly, we might not be able to favorably resolve any of theseissues, or we might have to provide Ñnancial or other inducement to the other investors to obtain a favorableresolution.
In addition, various restrictive provisions and rights apply to sales or transfers of interests in our jointly ownedproperties. These may work to our disadvantage because, among other things, we might be required to makedecisions about buying or selling interests in a property or properties at a time that is disadvantageous to us orwe might be required to purchase the interests of our partners in our jointly owned properties.
Bankruptcy of joint venture partners could impose delays and costs on us with respect to the jointly ownedretail properties
The bankruptcy of one of the other investors in any of our jointly owned shopping centers could materially andadversely aÅect the relevant property or properties. Under the bankruptcy laws, we would be precluded by theautomatic stay from taking some actions aÅecting the estate of the other investor without prior approval of thebankruptcy court, which would, in most cases, entail prior notice to other parties and a hearing in thebankruptcy court. At a minimum, the requirement to obtain court approval may delay the actions we would ormight want to take. If the relevant joint venture through which we have invested in a property has incurredrecourse obligations, the discharge in bankruptcy of one of the other investors might result in our ultimateliability for a greater portion of those obligations than we would otherwise bear.
Payments by our direct and indirect subsidiaries of dividends and distributions to us may be adverselyaÅected by prior payments to these subsidiaries' creditors and preferred security holders
Substantially all of our assets are owned through our general partnership interest in the Operating Partnership,including TRCLP. The Operating Partnership holds substantially all of its properties and assets throughsubsidiaries, including subsidiary partnerships, limited liability companies and corporations that have electedto be taxed as REITs. The Operating Partnership therefore derives substantially all of its cash Öow from cashdistributions to it by its subsidiaries, and we, in turn, derive substantially all of our cash Öow from cashdistributions to us by the Operating Partnership. The creditors and preferred security holders, if any, of each ofour direct and indirect subsidiaries are entitled to payment of that subsidiary's obligations to them, when dueand payable, before that subsidiary may make distributions to us. Thus, the Operating Partnership's ability tomake distributions to its partners, including us, depends on its subsidiaries' ability Ñrst to satisfy theirobligations to their creditors and preferred security holders, if any, and then to make distributions to theOperating Partnership. Similarly, our ability to pay dividends to holders of our common stock depends on theOperating Partnership's ability Ñrst to satisfy its obligations to its creditors and preferred security holders, ifany, and then to make distributions to us.
In addition, we will have the right to participate in any distribution of the assets of any of our direct or indirectsubsidiaries upon the liquidation, reorganization or insolvency of the subsidiary only after the claims of thecreditors, including trade creditors, and preferred security holders, if any, of the subsidiary are satisÑed. Ourcommon stockholders, in turn, will have the right to participate in any distribution of our assets upon theliquidation, reorganization or insolvency of us only after the claims of our creditors, including trade creditors,and preferred security holders, if any, are satisÑed.
We might fail to qualify or remain qualiÑed as a REIT
Although we believe that we will remain structured and will continue to operate so as to qualify as a REIT forfederal income tax purposes, we might not continue to be so qualiÑed. QualiÑcation as a REIT for federal
12
income tax purposes involves the application of highly technical and complex provisions of the Code for whichthere are only limited judicial or administrative interpretations. Therefore, the determination of various factualmatters and circumstances not entirely within our control may impact our ability to qualify as a REIT. Inaddition, legislation, new regulations, administrative interpretations or court decisions might signiÑcantlychange the tax laws with respect to the requirements for qualiÑcation as a REIT or the federal income taxconsequences of qualiÑcation as a REIT.
If, with respect to any taxable year, we fail to maintain our qualiÑcation as a REIT, we would not be allowedto deduct distributions to stockholders in computing our taxable income and federal income tax. The corporatelevel income tax, including any applicable alternative minimum tax, would apply to our taxable income atregular corporate rates. As a result, the amount available for distribution to stockholders would be reduced forthe year or years involved, and we would no longer be required to make distributions. In addition, unless wewere entitled to relief under the relevant statutory provisions, we would be disqualiÑed from treatment as aREIT for the Ñve taxable years following the year during which qualiÑcation was lost. Notwithstanding thatwe currently intend to operate in a manner designed to allow us to qualify as a REIT, future economic,market, legal, tax or other considerations may cause us to determine that it is in our best interest and the bestinterest of our stockholders to revoke the REIT election.
An ownership limit and certain anti-takeover defenses and applicable law may hinder any attempt toacquire us
The Ownership Limit. Generally, for us to maintain our qualiÑcation as a REIT under the Code, not morethan 50% in value of the outstanding shares of our capital stock may be owned, directly or indirectly, by Ñve orfewer individuals at any time during the last half of our taxable year. The Code deÑnes ""individuals'' forpurposes of the requirement described in the preceding sentence to include some types of entities. In general,under our current certiÑcate of incorporation, no person other than Martin Bucksbaum (deceased), MatthewBucksbaum (the Chairman of our board of directors), their families and related trusts and entities, includingM.B. Capital Partners III, may own more than 7.5% of the value of our outstanding capital stock. However,our certiÑcate of incorporation also permits our company to exempt a person from the 7.5% ownership limitupon the satisfaction of certain conditions which are described in our certiÑcate of incorporation.
Selected Provisions of our Charter Documents. Our board of directors is divided into three classes ofdirectors. Directors of each class are chosen for three-year staggered terms. Staggered terms of directors mayreduce the possibility of a tender oÅer or an attempt to change control of our company, even though a tenderoÅer or change in control might be in the best interest of our stockholders. Our charter authorizes the board ofdirectors:
‚ to cause us to issue additional authorized but unissued shares of common stock or preferred stock;
‚ to classify or reclassify, in one or more series, any unissued preferred stock; and
‚ to set the preferences, rights and other terms of any classiÑed or reclassiÑed stock that we issue.
Stockholder Rights Plan. We have a stockholder rights plan which will impact a potential acquirer unless theacquirer negotiates with our board of directors and the board of directors approves the transaction.
Selected Provisions of Delaware Law. We are a Delaware corporation, and Section 203 of the DelawareGeneral Corporation Law applies to us. In general, Section 203 prevents an ""interested stockholder,'' asdeÑned in the next sentence, from engaging in a ""business combination,'' as deÑned in the statute, with us forthree years following the date that person becomes an interested stockholder unless:
‚ before that person became an interested stockholder, our board of directors approved the transaction inwhich the interested stockholder became an interested stockholder or approved the business combination;
‚ upon completion of the transaction that resulted in the interested stockholder becoming an interestedstockholder, the interested stockholder owned at least 85% of our voting stock outstanding at the time thetransaction commenced, excluding for purposes of determining the voting stock outstanding (but not theoutstanding voting stock owned by the interested stockholder) stock held by directors who are also oÇcers
13
of the company and by employee stock plans that do not provide employees with the right to determineconÑdentially whether shares held under the plan will be tendered in a tender or exchange oÅer; or
‚ following the transaction in which that person became an interested stockholder, the business combinationis approved by our board of directors and authorized at a meeting of stockholders by the aÇrmative vote ofthe holders of at least two-thirds of our outstanding voting stock not owned by the interested stockholder.
The statute deÑnes ""interested stockholder'' to mean generally any person that is the owner of 15% or more ofour outstanding voting stock or is an aÇliate or associate of us and was the owner of 15% or more of ouroutstanding voting stock at any time within the three-year period immediately before the date ofdetermination.
Each item discussed above may delay, deter or prevent a change in control of our company, even if a proposedtransaction is at a premium over the then current market price for our common stock. Further, theseprovisions may apply in instances where some stockholders consider a transaction beneÑcial to them. As aresult, our stock price may be negatively aÅected by these provisions.
We are impacted by tax-related obligations to some of our partners
We own properties through partnerships which have arrangements in place that protect the deferred taxsituation of our existing third party limited partners. Violation of these arrangements could impose costs on us.As a result, we may be restricted with respect to decisions such as Ñnancing, encumbering, expanding orselling these properties.
Several of our joint venture partners are tax-exempt. As such, they are taxable to the extent of their share ofunrelated business taxable income generated from these properties. As the managing partner in these jointventures, we have obligations to avoid the creation of unrelated business taxable income at these properties. Asa result, we may be restricted with respect to decisions such as Ñnancing and revenue generation with respectto these properties.
Risks Related to the TRC Merger
We may not realize the full anticipated beneÑts of the TRC Merger
Achieving the anticipated beneÑts of the TRC Merger will depend in part upon our ability to integrate the twocompanies' businesses in an eÇcient and eÅective manner. We may continue to face diÇculties integratingaspects of the combined company's businesses that we have not historically focused on, such as the masterplanned community business. Any inability of management to integrate the operations of TRCLP successfullycould cause us to not fully achieve the expected beneÑts of the TRC Merger.
Limitations on the sale of the TRCLP assets may aÅect our cash Öow
We may be restricted in our ability to dispose of certain TRCLP assets until the ten-year period after TRC'selection of REIT status expires in 2008 due to the potential incurrence of substantial tax liabilities on suchdispositions due to applicable REIT regulations.
We have signiÑcant obligations under a Contingent Stock Agreement we assumed in the TRC Merger
We have assumed the obligations of TRC under a Contingent Stock Agreement, which we refer to as the""CSA.'' The assumption includes the obligation under the CSA to issue shares of common stock twice a yearto the beneÑciaries under the CSA and certain indemniÑcation obligations. The number of shares is basedupon our stock price and upon a formula set forth in the CSA. In addition, the CSA requires a valuation ofcertain assets that we own as of December 31, 2009, which could result in the issuance of a signiÑcant numberof additional shares to the beneÑciaries under the CSA. Such issuances could be dilutive to our existingstockholders if we are unable to repurchase a corresponding number of shares through our publicly announcedstock repurchase program.
14
Risks Related to our Common Stock
Our common stock price may be volatile, and consequently investors may not be able to resell theircommon stock at or above their purchase price
The price at which our common stock will trade may be volatile and may Öuctuate due to factors such as:
‚ our historical and anticipated quarterly and annual operating results;
‚ variations between our actual results and analyst and investor expectations or changes in Ñnancial estimatesand recommendations by securities analysts;
‚ the performance and prospects of our industry;
‚ the depth and liquidity of the market for our common stock;
‚ investor perception of us and the industry in which we operate;
‚ domestic and international economic conditions;
‚ the extent of institutional investor interest in us;
‚ the reputation of REITs generally and the attractiveness of their equity securities in comparison to otherequity securities, including securities issued by other real estate companies, and Ñxed income securities;
‚ our Ñnancial condition and performance; and
‚ general market conditions and trends.
Fluctuations may be unrelated to or disproportionate to our Ñnancial performance. These Öuctuations mayresult in a material decline in the trading price of our common stock.
Future sales of our common stock may depress our stock price
As of December 31, 2005, approximately 59.6 million shares of common stock were issuable upon exercise ofconversion and/or redemption rights as to units of limited partnership interest in the Operating Partnership.Under our shelf registration statement, we may oÅer from time to time up to approximately $1.5 billion worthof common stock, preferred stock, depositary shares, debt securities, warrants, stock purchase contracts and/orpurchase units. An additional 1.7 million shares of our common stock remain reserved for issuance under theCSA we assumed in connection with the TRC Merger. In addition, we have reserved a number of shares ofcommon stock for issuance under our option and other beneÑt plans for employees and directors and inconnection with certain other obligations, and these shares will be available for sale from time to time.Although we have publicly announced a stock repurchase program which may oÅset the dilution resultingfrom issuances pursuant to the CSA and our employee option plan, there is no certainty that we will besuccessful in acquiring a suÇcient number of shares at an acceptable price to accomplish this goal. Noprediction can be made as to the eÅect, if any, that these and other future sales of our common stock, or theavailability of common stock for future sales, will have on the market price of the stock. Sales in the publicmarket of substantial amounts of our common stock, or the perception that such sales could occur, couldadversely aÅect prevailing market prices for our common stock.
Increases in market interest rates may hurt the market price of our common stock
We believe that investors consider the distribution rate on REIT stocks, expressed as a percentage of the priceof the stocks, relative to market interest rates as an important factor in deciding whether to buy or sell thestocks. If market interest rates go up, prospective purchasers of REIT stocks may expect a higher distributionrate. Higher interest rates would not, however, result in more funds being available for us to distribute and, infact, would likely increase our borrowing costs and might decrease our funds available for distribution. Thus,higher market interest rates could cause the market price of our common stock to decline.
15
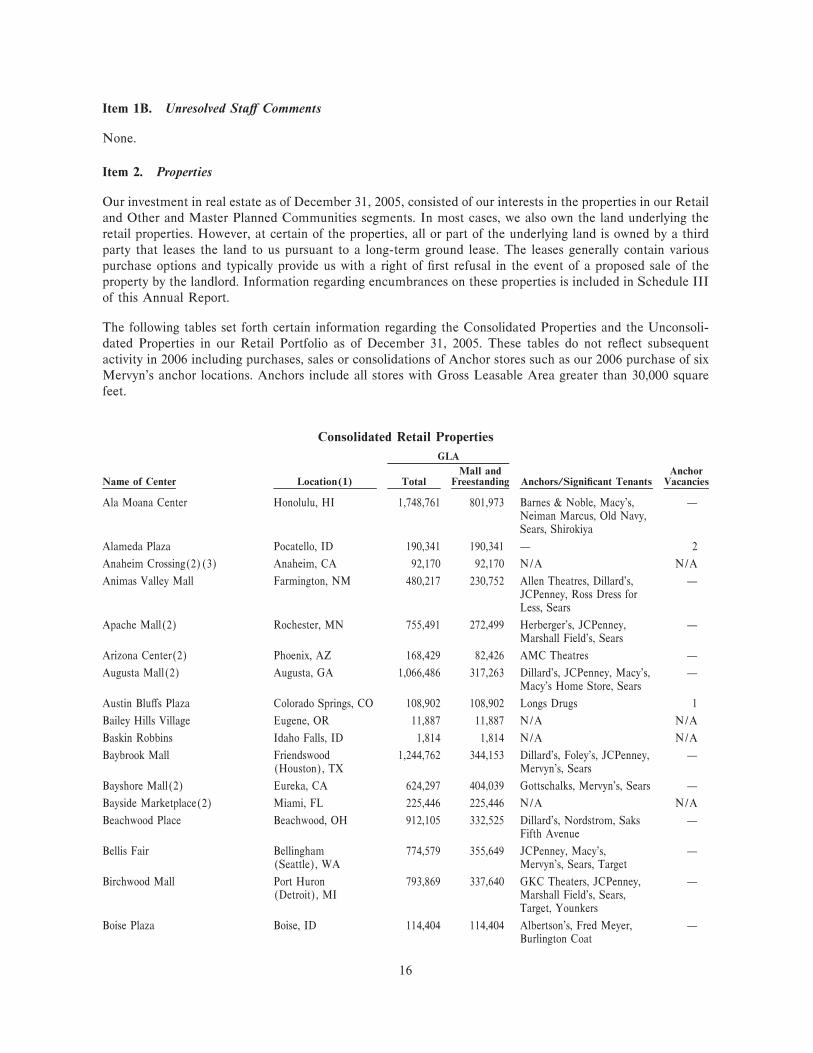
Item 1B. Unresolved StaÅ Comments
None.
Item 2. Properties
Our investment in real estate as of December 31, 2005, consisted of our interests in the properties in our Retailand Other and Master Planned Communities segments. In most cases, we also own the land underlying theretail properties. However, at certain of the properties, all or part of the underlying land is owned by a thirdparty that leases the land to us pursuant to a long-term ground lease. The leases generally contain variouspurchase options and typically provide us with a right of Ñrst refusal in the event of a proposed sale of theproperty by the landlord. Information regarding encumbrances on these properties is included in Schedule IIIof this Annual Report.
The following tables set forth certain information regarding the Consolidated Properties and the Unconsoli-dated Properties in our Retail Portfolio as of December 31, 2005. These tables do not reÖect subsequentactivity in 2006 including purchases, sales or consolidations of Anchor stores such as our 2006 purchase of sixMervyn's anchor locations. Anchors include all stores with Gross Leasable Area greater than 30,000 squarefeet.
Consolidated Retail Properties
GLA
Mall and AnchorName of Center Location(1) Total Freestanding Anchors/SigniÑcant Tenants Vacancies
Ala Moana Center Honolulu, HI 1,748,761 801,973 Barnes & Noble, Macy's, ÌNeiman Marcus, Old Navy,Sears, Shirokiya
Alameda Plaza Pocatello, ID 190,341 190,341 Ì 2
Anaheim Crossing(2)(3) Anaheim, CA 92,170 92,170 N/A N/A
Animas Valley Mall Farmington, NM 480,217 230,752 Allen Theatres, Dillard's, ÌJCPenney, Ross Dress forLess, Sears
Apache Mall(2) Rochester, MN 755,491 272,499 Herberger's, JCPenney, ÌMarshall Field's, Sears
Arizona Center(2) Phoenix, AZ 168,429 82,426 AMC Theatres Ì
Augusta Mall(2) Augusta, GA 1,066,486 317,263 Dillard's, JCPenney, Macy's, ÌMacy's Home Store, Sears
Austin BluÅs Plaza Colorado Springs, CO 108,902 108,902 Longs Drugs 1
Bailey Hills Village Eugene, OR 11,887 11,887 N/A N/A
Baskin Robbins Idaho Falls, ID 1,814 1,814 N/A N/A
Baybrook Mall Friendswood 1,244,762 344,153 Dillard's, Foley's, JCPenney, Ì(Houston), TX Mervyn's, Sears
Bayshore Mall(2) Eureka, CA 624,297 404,039 Gottschalks, Mervyn's, Sears Ì
Bayside Marketplace(2) Miami, FL 225,446 225,446 N/A N/A
Beachwood Place Beachwood, OH 912,105 332,525 Dillard's, Nordstrom, Saks ÌFifth Avenue
Bellis Fair Bellingham 774,579 355,649 JCPenney, Macy's, Ì(Seattle), WA Mervyn's, Sears, Target
Birchwood Mall Port Huron 793,869 337,640 GKC Theaters, JCPenney, Ì(Detroit), MI Marshall Field's, Sears,
Target, Younkers
Boise Plaza Boise, ID 114,404 114,404 Albertson's, Fred Meyer, ÌBurlington Coat
16

GLA
Mall and AnchorName of Center Location(1) Total Freestanding Anchors/SigniÑcant Tenants Vacancies
Boise Towne Plaza(3) Boise, ID 116,677 116,677 Circuit City, Linens 'N ÌThings, Old Navy
Boise Towne Square Boise, ID 1,143,302 474,522 Dillard's, JCPenney, Macy's, ÌMervyn's, Sears
The Boulevard Mall Las Vegas, NV 1,178,595 390,559 Dillard's, JCPenney, Macy's, ÌSears
Burlington Town Center(3) Burlington, VT 311,092 164,339 Filene's Ì
Cache Valley Mall Logan, UT 322,578 176,746 Dillard's, Dillard's Men's & ÌHome, JCPenney
Cache Valley Marketplace Logan, UT 156,996 156,996 Home Depot, Olive Garden, ÌT.J. Maxx
Canyon Point Village Center Las Vegas, NV 65,600 65,600 N/A N/A
Capital Mall JeÅerson City, MO 512,852 279,775 Dillard's, JCPenney, Sears Ì
Century Plaza Birmingham, AL 738,831 252,875 JCPenney, McRae's, Sears 1
Chapel Hills Mall Colorado Springs, CO 1,174,371 428,932 Dillard's, Foley's, JCPenney, ÌKmart, Mervyn's, Sears
Chico Mall Chico, CA 502,079 179,951 Gottschalks, JCPenney, 1Sears
Coastland Center Naples, FL 933,644 343,254 Dillard's, JCPenney, Macy's, ÌSears
Collin Creek Plano, TX 1,113,307 323,224 Dillard's, Foley's, JCPenney, ÌMervyn's, Sears
Colony Square Mall Zanesville, OH 536,662 289,884 Colony Square Cinema 10, ÌElder-Beerman, JCPenney,Sears
Columbia Mall Columbia, MO 750,085 334,641 Dillard's, JCPenney, Sears, ÌTarget
Coral Ridge Mall Coralville (Iowa 1,075,349 420,184 Dillard's, JCPenney, Scheel's ÌCity), IA All Sports, Sears, Target,
Younkers
Coronado Center(2) Albuquerque, NM 1,152,708 378,379 Barnes & Noble, Foley's, ÌJCPenney, Macy's,Mervyn's, Sears
Cottonwood Mall Salt Lake City, UT 734,018 354,510 JCPenney, Meier & Frank Ì
Cottonwood Square(2) Salt Lake City, UT 77,079 77,079 Ì 1
Country Hills Plaza Ogden, UT 140,097 140,097 McKay-Dee Hospital ÌCenter, Smith's Food King
The Crossroads Portage 769,339 266,379 JCPenney, Marshall Field's, Ì(Kalamazoo), MI Mervyn's, Sears
Crossroads Center St. Cloud, MN 897,330 291,650 JCPenney, Marshall Field's, ÌScheel's All Sports, Sears,Target
Cumberland Mall Atlanta, GA 816,964 316,389 Macy's, Sears Ì
Division Crossing Portland, OR 100,760 100,760 Rite Aid, Safeway Ì
Eagle Ridge Mall Lake Wales 646,730 251,275 Dillard's, JCPenney, Ì(Orlando), FL Recreation Station, Regal
Cinemas, Sears
Eastridge Mall Casper, WY 568,810 279,014 JCPenney, Macy's, Sears, ÌTarget
Eden Prairie Center Eden Prairie 988,788 309,207 AMC Theatres, Kohl's, Ì(Minneapolis), MN Sears, Target, Von Maur
17
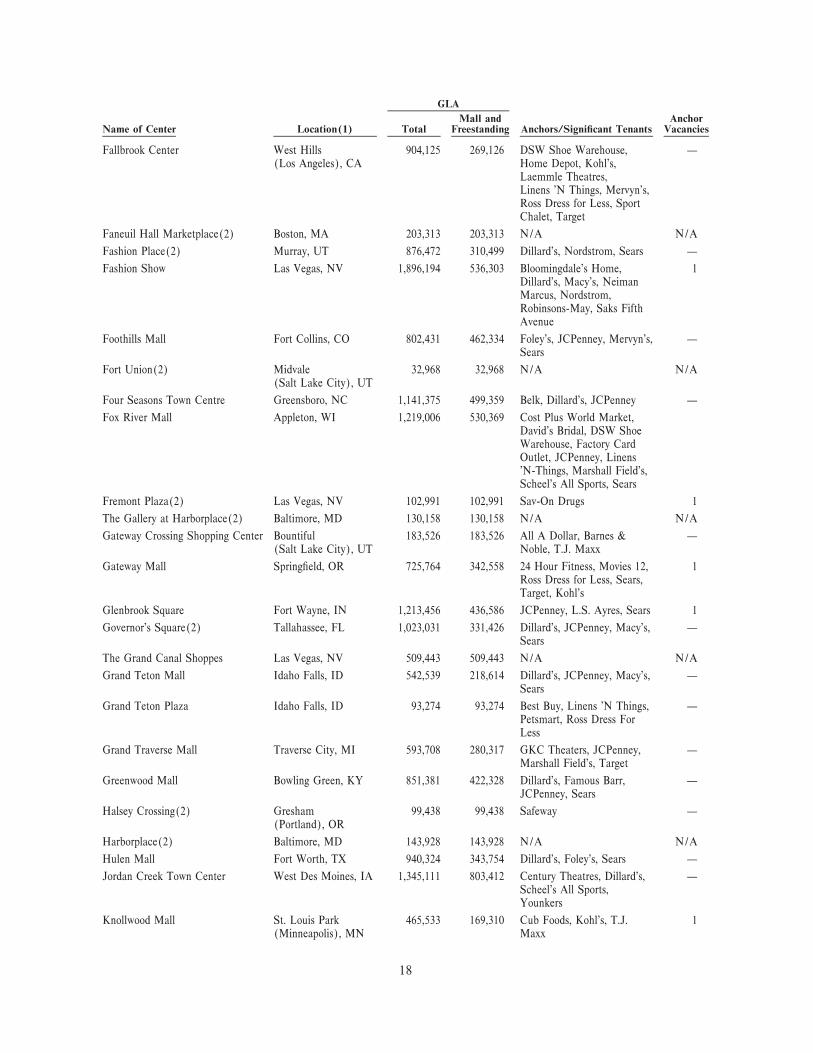
GLA
Mall and AnchorName of Center Location(1) Total Freestanding Anchors/SigniÑcant Tenants Vacancies
Fallbrook Center West Hills 904,125 269,126 DSW Shoe Warehouse, Ì(Los Angeles), CA Home Depot, Kohl's,
Laemmle Theatres,Linens 'N Things, Mervyn's,Ross Dress for Less, SportChalet, Target
Faneuil Hall Marketplace(2) Boston, MA 203,313 203,313 N/A N/A
Fashion Place(2) Murray, UT 876,472 310,499 Dillard's, Nordstrom, Sears Ì
Fashion Show Las Vegas, NV 1,896,194 536,303 Bloomingdale's Home, 1Dillard's, Macy's, NeimanMarcus, Nordstrom,Robinsons-May, Saks FifthAvenue
Foothills Mall Fort Collins, CO 802,431 462,334 Foley's, JCPenney, Mervyn's, ÌSears
Fort Union(2) Midvale 32,968 32,968 N/A N/A(Salt Lake City), UT
Four Seasons Town Centre Greensboro, NC 1,141,375 499,359 Belk, Dillard's, JCPenney Ì
Fox River Mall Appleton, WI 1,219,006 530,369 Cost Plus World Market,David's Bridal, DSW ShoeWarehouse, Factory CardOutlet, JCPenney, Linens'N-Things, Marshall Field's,Scheel's All Sports, Sears
Fremont Plaza(2) Las Vegas, NV 102,991 102,991 Sav-On Drugs 1
The Gallery at Harborplace(2) Baltimore, MD 130,158 130,158 N/A N/A
Gateway Crossing Shopping Center Bountiful 183,526 183,526 All A Dollar, Barnes & Ì(Salt Lake City), UT Noble, T.J. Maxx
Gateway Mall SpringÑeld, OR 725,764 342,558 24 Hour Fitness, Movies 12, 1Ross Dress for Less, Sears,Target, Kohl's
Glenbrook Square Fort Wayne, IN 1,213,456 436,586 JCPenney, L.S. Ayres, Sears 1
Governor's Square(2) Tallahassee, FL 1,023,031 331,426 Dillard's, JCPenney, Macy's, ÌSears
The Grand Canal Shoppes Las Vegas, NV 509,443 509,443 N/A N/A
Grand Teton Mall Idaho Falls, ID 542,539 218,614 Dillard's, JCPenney, Macy's, ÌSears
Grand Teton Plaza Idaho Falls, ID 93,274 93,274 Best Buy, Linens 'N Things, ÌPetsmart, Ross Dress ForLess
Grand Traverse Mall Traverse City, MI 593,708 280,317 GKC Theaters, JCPenney, ÌMarshall Field's, Target
Greenwood Mall Bowling Green, KY 851,381 422,328 Dillard's, Famous Barr, ÌJCPenney, Sears
Halsey Crossing(2) Gresham 99,438 99,438 Safeway Ì(Portland), OR
Harborplace(2) Baltimore, MD 143,928 143,928 N/A N/A
Hulen Mall Fort Worth, TX 940,324 343,754 Dillard's, Foley's, Sears Ì
Jordan Creek Town Center West Des Moines, IA 1,345,111 803,412 Century Theatres, Dillard's, ÌScheel's All Sports,Younkers
Knollwood Mall St. Louis Park 465,533 169,310 Cub Foods, Kohl's, T.J. 1(Minneapolis), MN Maxx
18
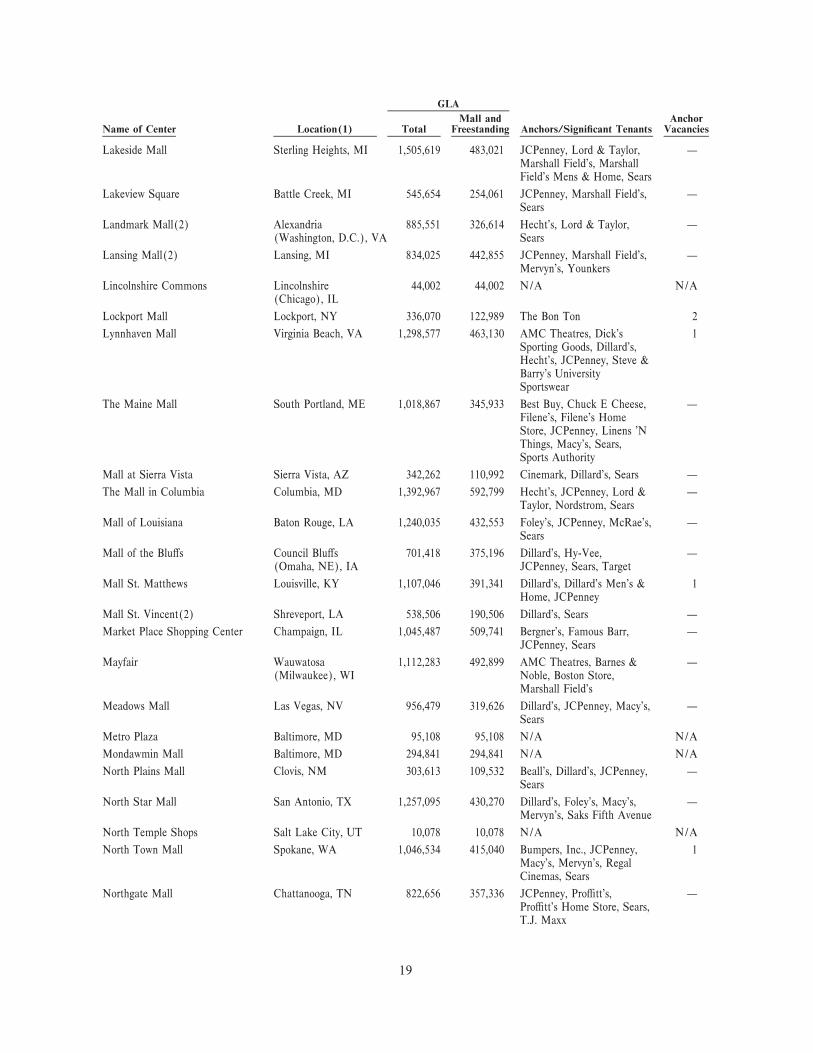
GLA
Mall and AnchorName of Center Location(1) Total Freestanding Anchors/SigniÑcant Tenants Vacancies
Lakeside Mall Sterling Heights, MI 1,505,619 483,021 JCPenney, Lord & Taylor, ÌMarshall Field's, MarshallField's Mens & Home, Sears
Lakeview Square Battle Creek, MI 545,654 254,061 JCPenney, Marshall Field's, ÌSears
Landmark Mall(2) Alexandria 885,551 326,614 Hecht's, Lord & Taylor, Ì(Washington, D.C.), VA Sears
Lansing Mall(2) Lansing, MI 834,025 442,855 JCPenney, Marshall Field's, ÌMervyn's, Younkers
Lincolnshire Commons Lincolnshire 44,002 44,002 N/A N/A(Chicago), IL
Lockport Mall Lockport, NY 336,070 122,989 The Bon Ton 2
Lynnhaven Mall Virginia Beach, VA 1,298,577 463,130 AMC Theatres, Dick's 1Sporting Goods, Dillard's,Hecht's, JCPenney, Steve &Barry's UniversitySportswear
The Maine Mall South Portland, ME 1,018,867 345,933 Best Buy, Chuck E Cheese, ÌFilene's, Filene's HomeStore, JCPenney, Linens 'NThings, Macy's, Sears,Sports Authority
Mall at Sierra Vista Sierra Vista, AZ 342,262 110,992 Cinemark, Dillard's, Sears Ì
The Mall in Columbia Columbia, MD 1,392,967 592,799 Hecht's, JCPenney, Lord & ÌTaylor, Nordstrom, Sears
Mall of Louisiana Baton Rouge, LA 1,240,035 432,553 Foley's, JCPenney, McRae's, ÌSears
Mall of the BluÅs Council BluÅs 701,418 375,196 Dillard's, Hy-Vee, Ì(Omaha, NE), IA JCPenney, Sears, Target
Mall St. Matthews Louisville, KY 1,107,046 391,341 Dillard's, Dillard's Men's & 1Home, JCPenney
Mall St. Vincent(2) Shreveport, LA 538,506 190,506 Dillard's, Sears Ì
Market Place Shopping Center Champaign, IL 1,045,487 509,741 Bergner's, Famous Barr, ÌJCPenney, Sears
Mayfair Wauwatosa 1,112,283 492,899 AMC Theatres, Barnes & Ì(Milwaukee), WI Noble, Boston Store,
Marshall Field's
Meadows Mall Las Vegas, NV 956,479 319,626 Dillard's, JCPenney, Macy's, ÌSears
Metro Plaza Baltimore, MD 95,108 95,108 N/A N/A
Mondawmin Mall Baltimore, MD 294,841 294,841 N/A N/A
North Plains Mall Clovis, NM 303,613 109,532 Beall's, Dillard's, JCPenney, ÌSears
North Star Mall San Antonio, TX 1,257,095 430,270 Dillard's, Foley's, Macy's, ÌMervyn's, Saks Fifth Avenue
North Temple Shops Salt Lake City, UT 10,078 10,078 N/A N/A
North Town Mall Spokane, WA 1,046,534 415,040 Bumpers, Inc., JCPenney, 1Macy's, Mervyn's, RegalCinemas, Sears
Northgate Mall Chattanooga, TN 822,656 357,336 JCPenney, ProÇtt's, ÌProÇtt's Home Store, Sears,T.J. Maxx
19
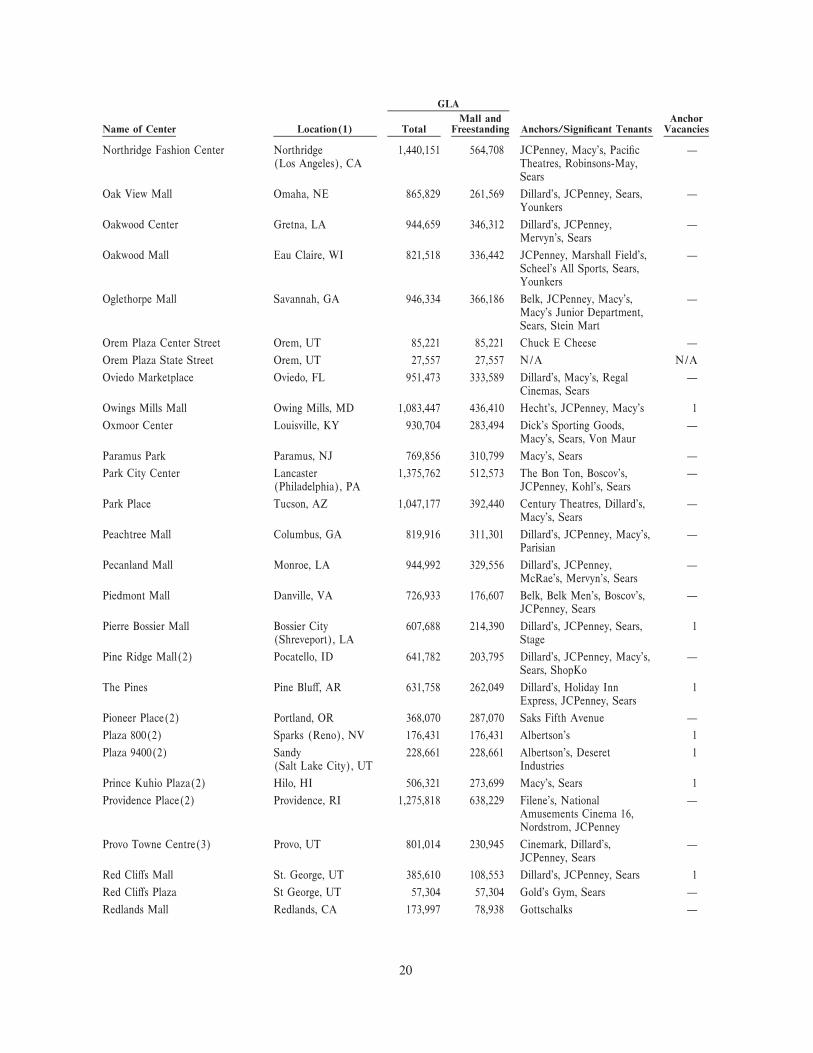
GLA
Mall and AnchorName of Center Location(1) Total Freestanding Anchors/SigniÑcant Tenants Vacancies
Northridge Fashion Center Northridge 1,440,151 564,708 JCPenney, Macy's, PaciÑc Ì(Los Angeles), CA Theatres, Robinsons-May,
Sears
Oak View Mall Omaha, NE 865,829 261,569 Dillard's, JCPenney, Sears, ÌYounkers
Oakwood Center Gretna, LA 944,659 346,312 Dillard's, JCPenney, ÌMervyn's, Sears
Oakwood Mall Eau Claire, WI 821,518 336,442 JCPenney, Marshall Field's, ÌScheel's All Sports, Sears,Younkers
Oglethorpe Mall Savannah, GA 946,334 366,186 Belk, JCPenney, Macy's, ÌMacy's Junior Department,Sears, Stein Mart
Orem Plaza Center Street Orem, UT 85,221 85,221 Chuck E Cheese Ì
Orem Plaza State Street Orem, UT 27,557 27,557 N/A N/A
Oviedo Marketplace Oviedo, FL 951,473 333,589 Dillard's, Macy's, Regal ÌCinemas, Sears
Owings Mills Mall Owing Mills, MD 1,083,447 436,410 Hecht's, JCPenney, Macy's 1
Oxmoor Center Louisville, KY 930,704 283,494 Dick's Sporting Goods, ÌMacy's, Sears, Von Maur
Paramus Park Paramus, NJ 769,856 310,799 Macy's, Sears Ì
Park City Center Lancaster 1,375,762 512,573 The Bon Ton, Boscov's, Ì(Philadelphia), PA JCPenney, Kohl's, Sears
Park Place Tucson, AZ 1,047,177 392,440 Century Theatres, Dillard's, ÌMacy's, Sears
Peachtree Mall Columbus, GA 819,916 311,301 Dillard's, JCPenney, Macy's, ÌParisian
Pecanland Mall Monroe, LA 944,992 329,556 Dillard's, JCPenney, ÌMcRae's, Mervyn's, Sears
Piedmont Mall Danville, VA 726,933 176,607 Belk, Belk Men's, Boscov's, ÌJCPenney, Sears
Pierre Bossier Mall Bossier City 607,688 214,390 Dillard's, JCPenney, Sears, 1(Shreveport), LA Stage
Pine Ridge Mall(2) Pocatello, ID 641,782 203,795 Dillard's, JCPenney, Macy's, ÌSears, ShopKo
The Pines Pine BluÅ, AR 631,758 262,049 Dillard's, Holiday Inn 1Express, JCPenney, Sears
Pioneer Place(2) Portland, OR 368,070 287,070 Saks Fifth Avenue Ì
Plaza 800(2) Sparks (Reno), NV 176,431 176,431 Albertson's 1
Plaza 9400(2) Sandy 228,661 228,661 Albertson's, Deseret 1(Salt Lake City), UT Industries
Prince Kuhio Plaza(2) Hilo, HI 506,321 273,699 Macy's, Sears 1
Providence Place(2) Providence, RI 1,275,818 638,229 Filene's, National ÌAmusements Cinema 16,Nordstrom, JCPenney
Provo Towne Centre(3) Provo, UT 801,014 230,945 Cinemark, Dillard's, ÌJCPenney, Sears
Red CliÅs Mall St. George, UT 385,610 108,553 Dillard's, JCPenney, Sears 1
Red CliÅs Plaza St George, UT 57,304 57,304 Gold's Gym, Sears Ì
Redlands Mall Redlands, CA 173,997 78,938 Gottschalks Ì
20
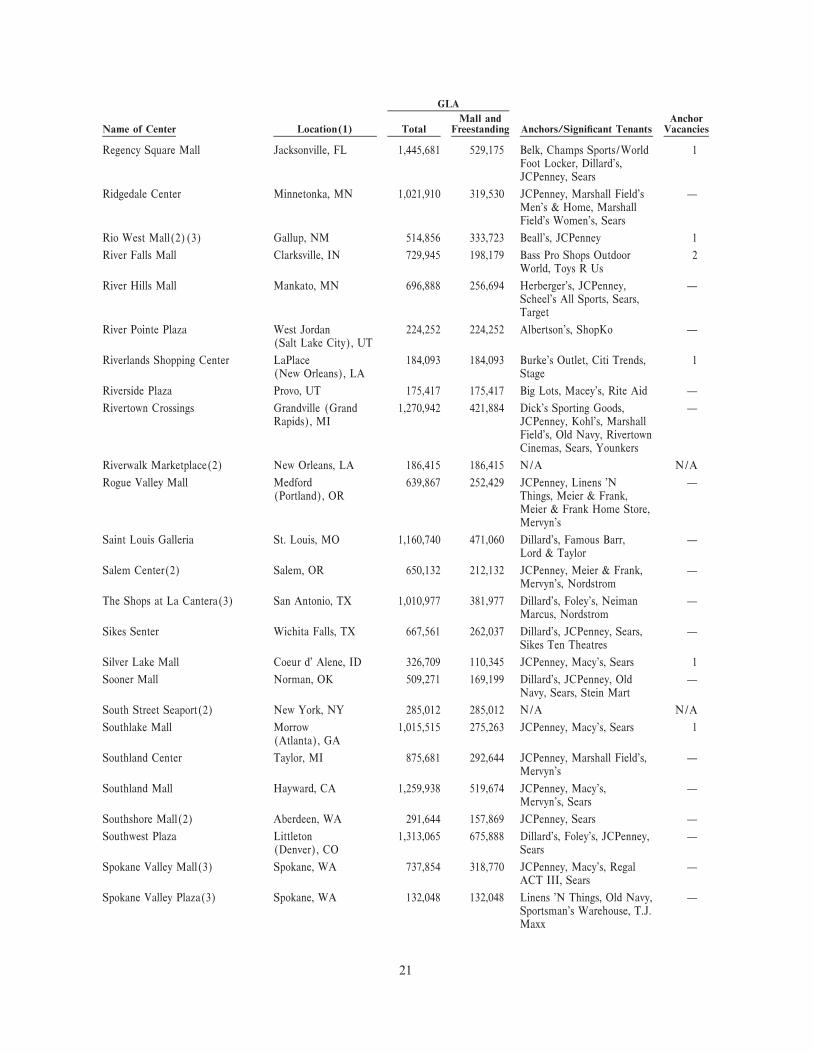
GLA
Mall and AnchorName of Center Location(1) Total Freestanding Anchors/SigniÑcant Tenants Vacancies
Regency Square Mall Jacksonville, FL 1,445,681 529,175 Belk, Champs Sports/World 1Foot Locker, Dillard's,JCPenney, Sears
Ridgedale Center Minnetonka, MN 1,021,910 319,530 JCPenney, Marshall Field's ÌMen's & Home, MarshallField's Women's, Sears
Rio West Mall(2)(3) Gallup, NM 514,856 333,723 Beall's, JCPenney 1
River Falls Mall Clarksville, IN 729,945 198,179 Bass Pro Shops Outdoor 2World, Toys R Us
River Hills Mall Mankato, MN 696,888 256,694 Herberger's, JCPenney, ÌScheel's All Sports, Sears,Target
River Pointe Plaza West Jordan 224,252 224,252 Albertson's, ShopKo Ì(Salt Lake City), UT
Riverlands Shopping Center LaPlace 184,093 184,093 Burke's Outlet, Citi Trends, 1(New Orleans), LA Stage
Riverside Plaza Provo, UT 175,417 175,417 Big Lots, Macey's, Rite Aid Ì
Rivertown Crossings Grandville (Grand 1,270,942 421,884 Dick's Sporting Goods, ÌRapids), MI JCPenney, Kohl's, Marshall
Field's, Old Navy, RivertownCinemas, Sears, Younkers
Riverwalk Marketplace(2) New Orleans, LA 186,415 186,415 N/A N/A
Rogue Valley Mall Medford 639,867 252,429 JCPenney, Linens 'N Ì(Portland), OR Things, Meier & Frank,
Meier & Frank Home Store,Mervyn's
Saint Louis Galleria St. Louis, MO 1,160,740 471,060 Dillard's, Famous Barr, ÌLord & Taylor
Salem Center(2) Salem, OR 650,132 212,132 JCPenney, Meier & Frank, ÌMervyn's, Nordstrom
The Shops at La Cantera(3) San Antonio, TX 1,010,977 381,977 Dillard's, Foley's, Neiman ÌMarcus, Nordstrom
Sikes Senter Wichita Falls, TX 667,561 262,037 Dillard's, JCPenney, Sears, ÌSikes Ten Theatres
Silver Lake Mall Coeur d' Alene, ID 326,709 110,345 JCPenney, Macy's, Sears 1
Sooner Mall Norman, OK 509,271 169,199 Dillard's, JCPenney, Old ÌNavy, Sears, Stein Mart
South Street Seaport(2) New York, NY 285,012 285,012 N/A N/A
Southlake Mall Morrow 1,015,515 275,263 JCPenney, Macy's, Sears 1(Atlanta), GA
Southland Center Taylor, MI 875,681 292,644 JCPenney, Marshall Field's, ÌMervyn's
Southland Mall Hayward, CA 1,259,938 519,674 JCPenney, Macy's, ÌMervyn's, Sears
Southshore Mall(2) Aberdeen, WA 291,644 157,869 JCPenney, Sears Ì
Southwest Plaza Littleton 1,313,065 675,888 Dillard's, Foley's, JCPenney, Ì(Denver), CO Sears
Spokane Valley Mall(3) Spokane, WA 737,854 318,770 JCPenney, Macy's, Regal ÌACT III, Sears
Spokane Valley Plaza(3) Spokane, WA 132,048 132,048 Linens 'N Things, Old Navy, ÌSportsman's Warehouse, T.J.Maxx
21
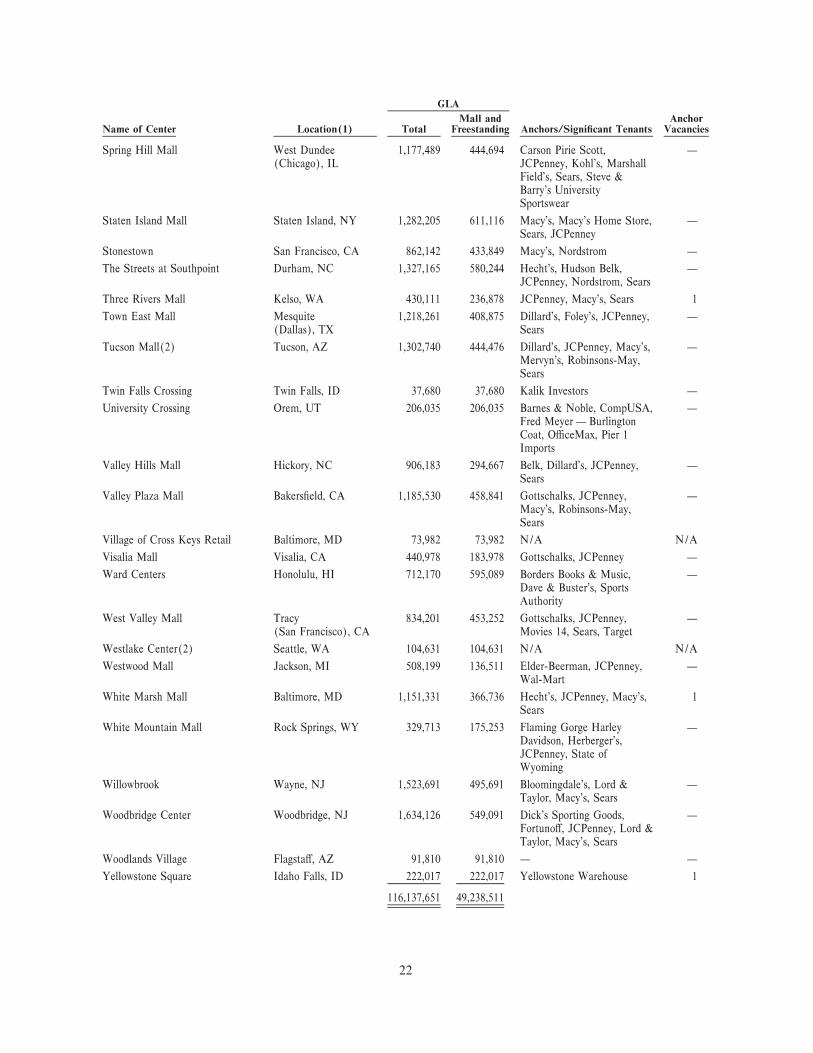
GLA
Mall and AnchorName of Center Location(1) Total Freestanding Anchors/SigniÑcant Tenants Vacancies
Spring Hill Mall West Dundee 1,177,489 444,694 Carson Pirie Scott, Ì(Chicago), IL JCPenney, Kohl's, Marshall
Field's, Sears, Steve &Barry's UniversitySportswear
Staten Island Mall Staten Island, NY 1,282,205 611,116 Macy's, Macy's Home Store, ÌSears, JCPenney
Stonestown San Francisco, CA 862,142 433,849 Macy's, Nordstrom Ì
The Streets at Southpoint Durham, NC 1,327,165 580,244 Hecht's, Hudson Belk, ÌJCPenney, Nordstrom, Sears
Three Rivers Mall Kelso, WA 430,111 236,878 JCPenney, Macy's, Sears 1
Town East Mall Mesquite 1,218,261 408,875 Dillard's, Foley's, JCPenney, Ì(Dallas), TX Sears
Tucson Mall(2) Tucson, AZ 1,302,740 444,476 Dillard's, JCPenney, Macy's, ÌMervyn's, Robinsons-May,Sears
Twin Falls Crossing Twin Falls, ID 37,680 37,680 Kalik Investors Ì
University Crossing Orem, UT 206,035 206,035 Barnes & Noble, CompUSA, ÌFred Meyer Ì BurlingtonCoat, OÇceMax, Pier 1Imports
Valley Hills Mall Hickory, NC 906,183 294,667 Belk, Dillard's, JCPenney, ÌSears
Valley Plaza Mall BakersÑeld, CA 1,185,530 458,841 Gottschalks, JCPenney, ÌMacy's, Robinsons-May,Sears
Village of Cross Keys Retail Baltimore, MD 73,982 73,982 N/A N/A
Visalia Mall Visalia, CA 440,978 183,978 Gottschalks, JCPenney Ì
Ward Centers Honolulu, HI 712,170 595,089 Borders Books & Music, ÌDave & Buster's, SportsAuthority
West Valley Mall Tracy 834,201 453,252 Gottschalks, JCPenney, Ì(San Francisco), CA Movies 14, Sears, Target
Westlake Center(2) Seattle, WA 104,631 104,631 N/A N/A
Westwood Mall Jackson, MI 508,199 136,511 Elder-Beerman, JCPenney, ÌWal-Mart
White Marsh Mall Baltimore, MD 1,151,331 366,736 Hecht's, JCPenney, Macy's, 1Sears
White Mountain Mall Rock Springs, WY 329,713 175,253 Flaming Gorge Harley ÌDavidson, Herberger's,JCPenney, State ofWyoming
Willowbrook Wayne, NJ 1,523,691 495,691 Bloomingdale's, Lord & ÌTaylor, Macy's, Sears
Woodbridge Center Woodbridge, NJ 1,634,126 549,091 Dick's Sporting Goods, ÌFortunoÅ, JCPenney, Lord &Taylor, Macy's, Sears
Woodlands Village FlagstaÅ, AZ 91,810 91,810 Ì Ì
Yellowstone Square Idaho Falls, ID 222,017 222,017 Yellowstone Warehouse 1
116,137,651 49,238,511
22
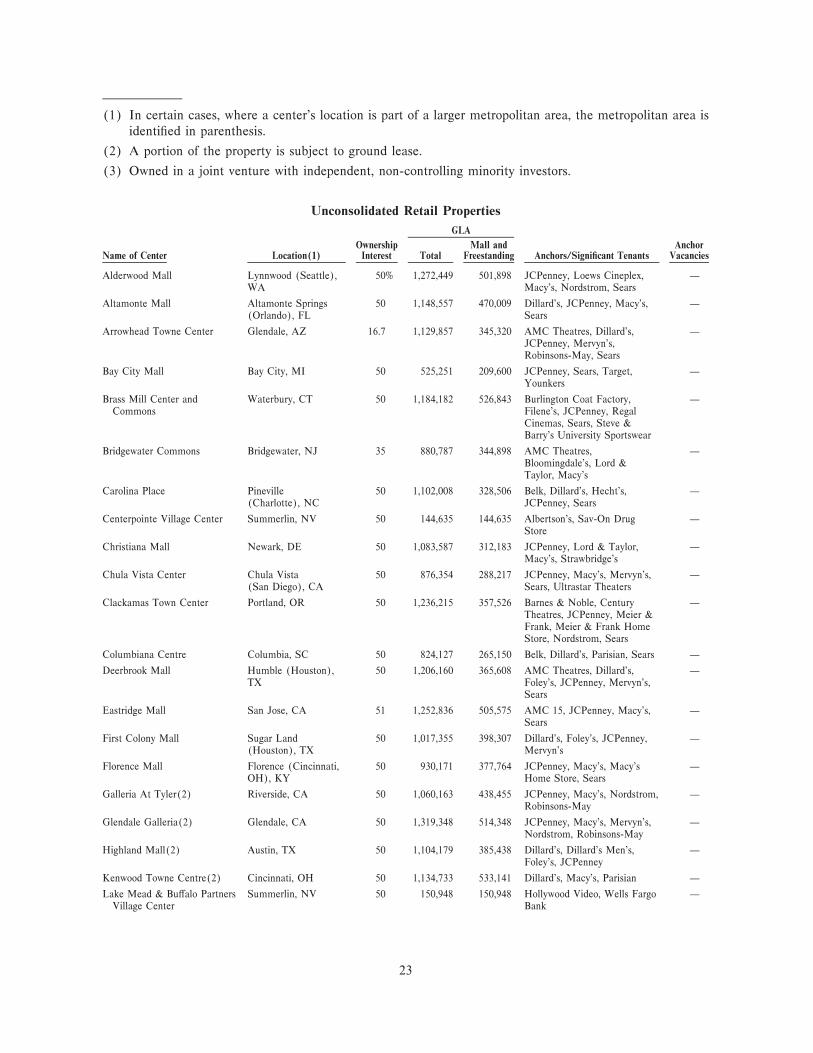
(1) In certain cases, where a center's location is part of a larger metropolitan area, the metropolitan area isidentiÑed in parenthesis.
(2) A portion of the property is subject to ground lease.
(3) Owned in a joint venture with independent, non-controlling minority investors.
Unconsolidated Retail Properties
GLA
Ownership Mall and AnchorName of Center Location(1) Interest Total Freestanding Anchors/SigniÑcant Tenants Vacancies
Alderwood Mall Lynnwood (Seattle), 50% 1,272,449 501,898 JCPenney, Loews Cineplex, ÌWA Macy's, Nordstrom, Sears
Altamonte Mall Altamonte Springs 50 1,148,557 470,009 Dillard's, JCPenney, Macy's, Ì(Orlando), FL Sears
Arrowhead Towne Center Glendale, AZ 16.7 1,129,857 345,320 AMC Theatres, Dillard's, ÌJCPenney, Mervyn's,Robinsons-May, Sears
Bay City Mall Bay City, MI 50 525,251 209,600 JCPenney, Sears, Target, ÌYounkers
Brass Mill Center and Waterbury, CT 50 1,184,182 526,843 Burlington Coat Factory, ÌCommons Filene's, JCPenney, Regal
Cinemas, Sears, Steve &Barry's University Sportswear
Bridgewater Commons Bridgewater, NJ 35 880,787 344,898 AMC Theatres, ÌBloomingdale's, Lord &Taylor, Macy's
Carolina Place Pineville 50 1,102,008 328,506 Belk, Dillard's, Hecht's, Ì(Charlotte), NC JCPenney, Sears
Centerpointe Village Center Summerlin, NV 50 144,635 144,635 Albertson's, Sav-On Drug ÌStore
Christiana Mall Newark, DE 50 1,083,587 312,183 JCPenney, Lord & Taylor, ÌMacy's, Strawbridge's
Chula Vista Center Chula Vista 50 876,354 288,217 JCPenney, Macy's, Mervyn's, Ì(San Diego), CA Sears, Ultrastar Theaters
Clackamas Town Center Portland, OR 50 1,236,215 357,526 Barnes & Noble, Century ÌTheatres, JCPenney, Meier &Frank, Meier & Frank HomeStore, Nordstrom, Sears
Columbiana Centre Columbia, SC 50 824,127 265,150 Belk, Dillard's, Parisian, Sears Ì
Deerbrook Mall Humble (Houston), 50 1,206,160 365,608 AMC Theatres, Dillard's, ÌTX Foley's, JCPenney, Mervyn's,
Sears
Eastridge Mall San Jose, CA 51 1,252,836 505,575 AMC 15, JCPenney, Macy's, ÌSears
First Colony Mall Sugar Land 50 1,017,355 398,307 Dillard's, Foley's, JCPenney, Ì(Houston), TX Mervyn's
Florence Mall Florence (Cincinnati, 50 930,171 377,764 JCPenney, Macy's, Macy's ÌOH), KY Home Store, Sears
Galleria At Tyler(2) Riverside, CA 50 1,060,163 438,455 JCPenney, Macy's, Nordstrom, ÌRobinsons-May
Glendale Galleria(2) Glendale, CA 50 1,319,348 514,348 JCPenney, Macy's, Mervyn's, ÌNordstrom, Robinsons-May
Highland Mall(2) Austin, TX 50 1,104,179 385,438 Dillard's, Dillard's Men's, ÌFoley's, JCPenney
Kenwood Towne Centre(2) Cincinnati, OH 50 1,134,733 533,141 Dillard's, Macy's, Parisian Ì
Lake Mead & BuÅalo Partners Summerlin, NV 50 150,948 150,948 Hollywood Video, Wells Fargo ÌVillage Center Bank
23

GLA
Ownership Mall and AnchorName of Center Location(1) Interest Total Freestanding Anchors/SigniÑcant Tenants Vacancies
Lakeland Square Mall Lakeland (Orlando), 50 898,502 288,464 Dillard's, Dillard's Men's & 1FL Home, JCPenney, Macy's,
Sears
Mizner Park(2) Boca Raton, FL 50 236,599 125,777 Mizner Park Cinema, Robb & ÌStucky
Montclair Plaza Montclair 50 1,349,642 546,627 Circuit City, Ethan Allen, Ì(San Bernadino), CA JCPenney, Linens 'N Things,
Macy's, Nordstrom,Robinsons-May, Sears
Moreno Valley Mall Moreno Valley 50 1,092,062 322,871 Gottschalks, Harkins Theatre, Ì(Riverside), CA JCPenney, Limited,
Robinsons-May, Sears
Natick Mall Natick (Boston), MA 50 1,154,026 427,364 Filene's, Lord & Taylor, ÌMacy's, Sears
Neshaminy Mall Bensalem, PA 25 1,019,629 325,037 AMC Theatres, Boscov's, ÌSears, Strawbridge's
Newgate Mall Ogden (Salt Lake 50 725,947 253,813 Dillard's, Gart Sports, ÌCity), UT Mervyn's, Sears, Tinsel Town
NewPark Mall Newark 50 1,138,354 394,890 JCPenney, Macy's, Mervyn's, Ì(San Francisco), CA Sears, Target
North Point Mall Alpharetta (Atlanta), 50 1,371,441 405,154 Dillard's, JCPenney, Macy's, 1GA Parisian, Sears
Northbrook Court Northbrook 50 1,011,221 395,302 AMC Theatres, Lord & Ì(Chicago), IL Taylor, Marshall Field's,
Neiman Marcus
Oakbrook Center Oakbrook (Chicago), 50 2,119,809 834,829 Bloomingdale's Home, ÌIL Crate & Barrel, Lord &
Taylor, Marshall Field's,Neiman Marcus, Nordstrom,Sears
The Oaks Mall Gainesville, FL 51 906,392 348,525 Belk, Dillard's, JCPenney, ÌMacy's, Sears
The Parks at Arlington Arlington (Dallas), 50 1,518,300 432,040 AMC Theatres, Circuit City, ÌTX Dick's Sporting Goods,
Dillard's, Foley's, JCPenney,Mervyn's, Sears, Steve &Barry's University Sportswear
Park Meadows Littleton, CO 35 1,630,538 607,538 Dillard's, Foley's, JCPenney, 1Nordstrom
Pembroke Lakes Mall Pembroke Pines 50 1,067,074 355,799 Dillard's, Dillard's Men's & Ì(Fort Lauderdale), FL Home, JCPenney, Macy's,
Sears
Perimeter Mall Atlanta, GA 50 1,561,219 507,945 Bloomingdale's, Dillard's, ÌMacy's, Nordstrom
Quail Springs Mall Oklahoma City, OK 50 1,134,623 349,823 AMC Theatres, Dillard's, ÌFoley's, JCPenney, Sears
Riverchase Galleria Hoover 50 1,562,460 513,553 Comp USA, JCPenney, 1(Birmingham), AL Macy's, Parisian, ProÇtt's,
Sears
The Shoppes at Buckland Hills Manchester, CT 50 978,117 429,944 Filene's, Filene's Home & 1Men's Store, JCPenney, Sears
Shopping Center Iguatemi Salvador, Bahia 35 685,310 426,846 Bompreco, C&A, Lojas ÌBahia (Brazil) Americanas, Cinema
Multiplex, Playland, Riachuelo
Shopping Center Taboao da Taboao da Serra, Sao 35 418,660 188,172 Beshi, C&A, Carrefour, Lojas ÌSerra Paulo (Brazil) Americanas, Riachuelo, Telha
Norte
24
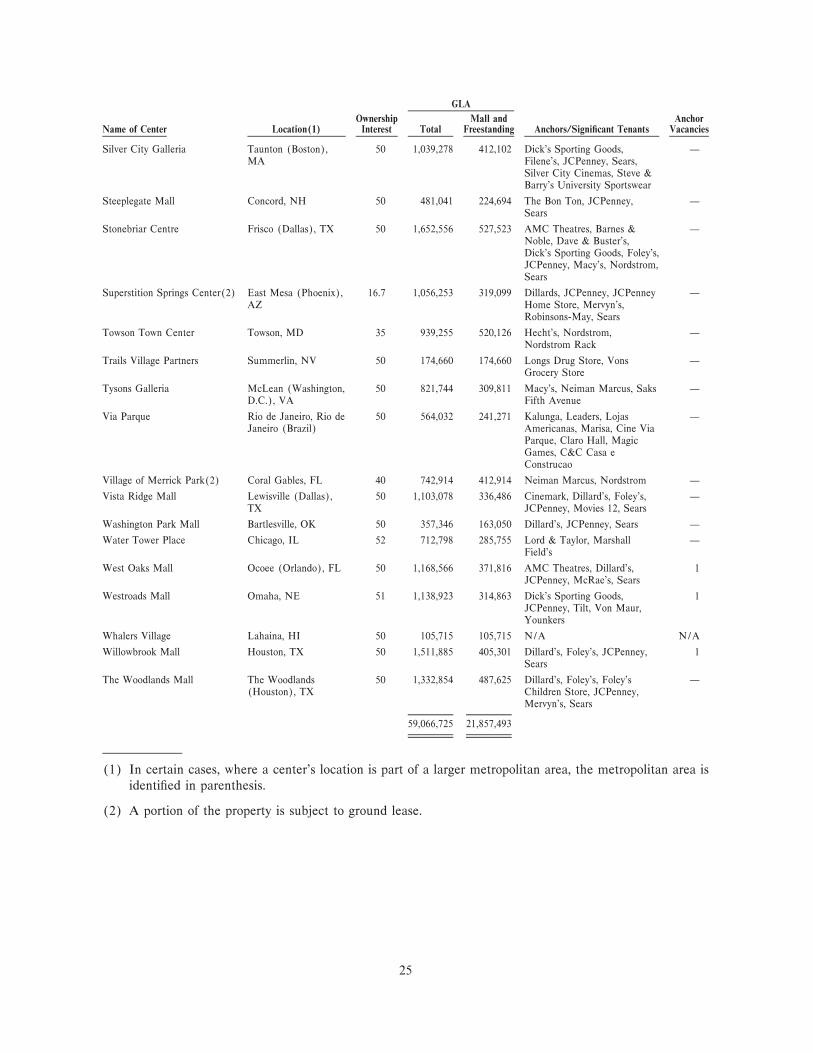
GLA
Ownership Mall and AnchorName of Center Location(1) Interest Total Freestanding Anchors/SigniÑcant Tenants Vacancies
Silver City Galleria Taunton (Boston), 50 1,039,278 412,102 Dick's Sporting Goods, ÌMA Filene's, JCPenney, Sears,
Silver City Cinemas, Steve &Barry's University Sportswear
Steeplegate Mall Concord, NH 50 481,041 224,694 The Bon Ton, JCPenney, ÌSears
Stonebriar Centre Frisco (Dallas), TX 50 1,652,556 527,523 AMC Theatres, Barnes & ÌNoble, Dave & Buster's,Dick's Sporting Goods, Foley's,JCPenney, Macy's, Nordstrom,Sears
Superstition Springs Center(2) East Mesa (Phoenix), 16.7 1,056,253 319,099 Dillards, JCPenney, JCPenney ÌAZ Home Store, Mervyn's,
Robinsons-May, Sears
Towson Town Center Towson, MD 35 939,255 520,126 Hecht's, Nordstrom, ÌNordstrom Rack
Trails Village Partners Summerlin, NV 50 174,660 174,660 Longs Drug Store, Vons ÌGrocery Store
Tysons Galleria McLean (Washington, 50 821,744 309,811 Macy's, Neiman Marcus, Saks ÌD.C.), VA Fifth Avenue
Via Parque Rio de Janeiro, Rio de 50 564,032 241,271 Kalunga, Leaders, Lojas ÌJaneiro (Brazil) Americanas, Marisa, Cine Via
Parque, Claro Hall, MagicGames, C&C Casa eConstrucao
Village of Merrick Park(2) Coral Gables, FL 40 742,914 412,914 Neiman Marcus, Nordstrom Ì
Vista Ridge Mall Lewisville (Dallas), 50 1,103,078 336,486 Cinemark, Dillard's, Foley's, ÌTX JCPenney, Movies 12, Sears
Washington Park Mall Bartlesville, OK 50 357,346 163,050 Dillard's, JCPenney, Sears Ì
Water Tower Place Chicago, IL 52 712,798 285,755 Lord & Taylor, Marshall ÌField's
West Oaks Mall Ocoee (Orlando), FL 50 1,168,566 371,816 AMC Theatres, Dillard's, 1JCPenney, McRae's, Sears
Westroads Mall Omaha, NE 51 1,138,923 314,863 Dick's Sporting Goods, 1JCPenney, Tilt, Von Maur,Younkers
Whalers Village Lahaina, HI 50 105,715 105,715 N/A N/A
Willowbrook Mall Houston, TX 50 1,511,885 405,301 Dillard's, Foley's, JCPenney, 1Sears
The Woodlands Mall The Woodlands 50 1,332,854 487,625 Dillard's, Foley's, Foley's Ì(Houston), TX Children Store, JCPenney,
Mervyn's, Sears
59,066,725 21,857,493
(1) In certain cases, where a center's location is part of a larger metropolitan area, the metropolitan area isidentiÑed in parenthesis.
(2) A portion of the property is subject to ground lease.
25
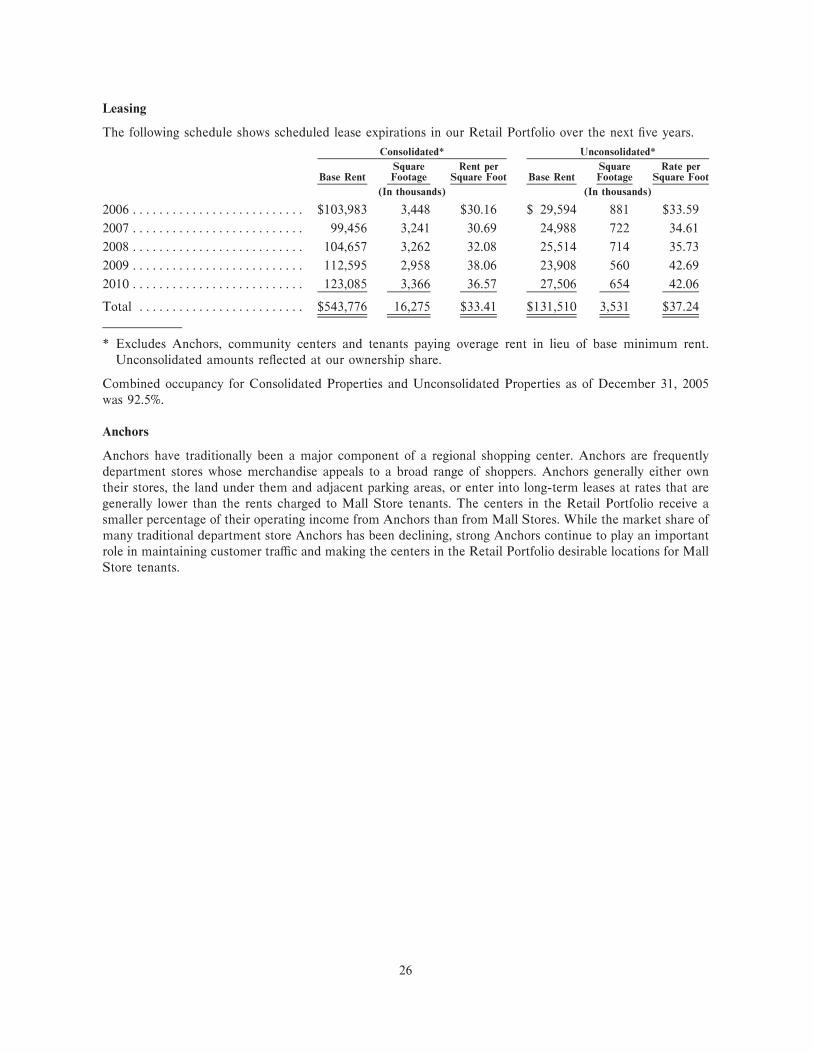
Leasing
The following schedule shows scheduled lease expirations in our Retail Portfolio over the next Ñve years.
Consolidated* Unconsolidated*
Square Rent per Square Rate perBase Rent Footage Square Foot Base Rent Footage Square Foot
(In thousands) (In thousands)
2006 ÏÏÏÏÏÏÏÏÏÏÏÏÏÏÏÏÏÏÏÏÏÏÏÏÏÏ $103,983 3,448 $30.16 $ 29,594 881 $33.59
2007 ÏÏÏÏÏÏÏÏÏÏÏÏÏÏÏÏÏÏÏÏÏÏÏÏÏÏ 99,456 3,241 30.69 24,988 722 34.61
2008 ÏÏÏÏÏÏÏÏÏÏÏÏÏÏÏÏÏÏÏÏÏÏÏÏÏÏ 104,657 3,262 32.08 25,514 714 35.73
2009 ÏÏÏÏÏÏÏÏÏÏÏÏÏÏÏÏÏÏÏÏÏÏÏÏÏÏ 112,595 2,958 38.06 23,908 560 42.69
2010 ÏÏÏÏÏÏÏÏÏÏÏÏÏÏÏÏÏÏÏÏÏÏÏÏÏÏ 123,085 3,366 36.57 27,506 654 42.06
Total ÏÏÏÏÏÏÏÏÏÏÏÏÏÏÏÏÏÏÏÏÏÏÏÏÏ $543,776 16,275 $33.41 $131,510 3,531 $37.24
* Excludes Anchors, community centers and tenants paying overage rent in lieu of base minimum rent.Unconsolidated amounts reÖected at our ownership share.
Combined occupancy for Consolidated Properties and Unconsolidated Properties as of December 31, 2005was 92.5%.
Anchors
Anchors have traditionally been a major component of a regional shopping center. Anchors are frequentlydepartment stores whose merchandise appeals to a broad range of shoppers. Anchors generally either owntheir stores, the land under them and adjacent parking areas, or enter into long-term leases at rates that aregenerally lower than the rents charged to Mall Store tenants. The centers in the Retail Portfolio receive asmaller percentage of their operating income from Anchors than from Mall Stores. While the market share ofmany traditional department store Anchors has been declining, strong Anchors continue to play an importantrole in maintaining customer traÇc and making the centers in the Retail Portfolio desirable locations for MallStore tenants.
26
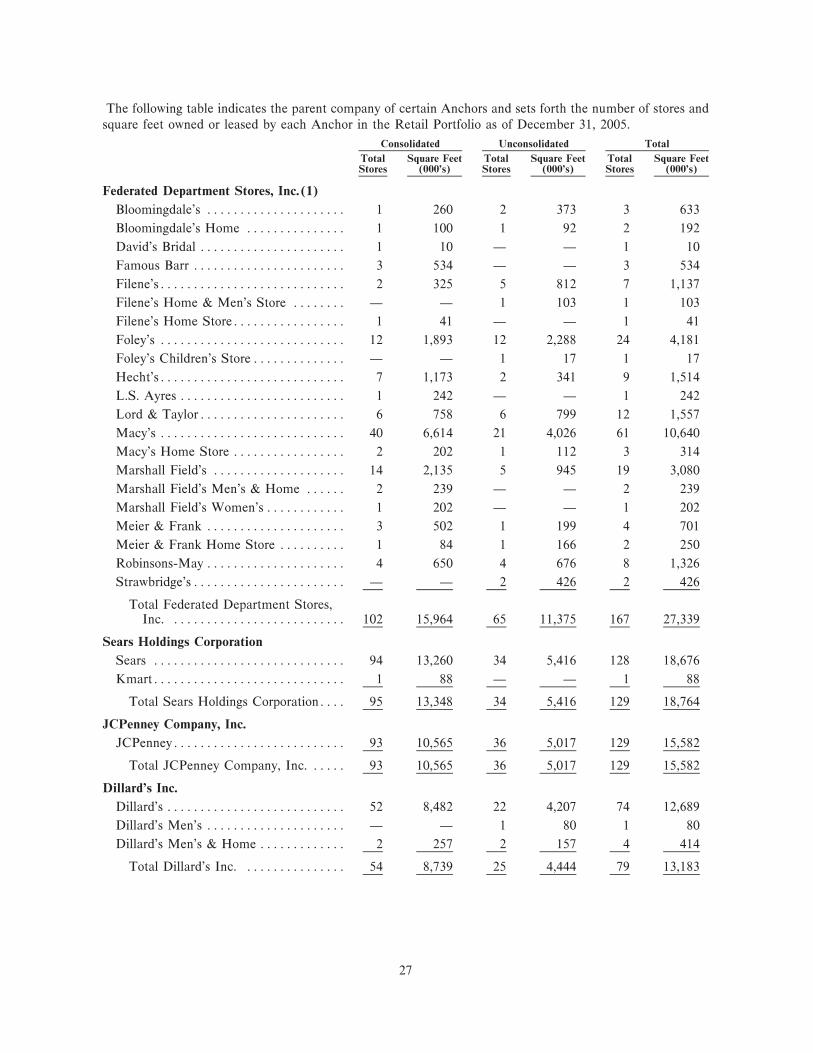
The following table indicates the parent company of certain Anchors and sets forth the number of stores andsquare feet owned or leased by each Anchor in the Retail Portfolio as of December 31, 2005.
Consolidated Unconsolidated Total
Total Square Feet Total Square Feet Total Square FeetStores (000's) Stores (000's) Stores (000's)
Federated Department Stores, Inc.(1)
Bloomingdale's ÏÏÏÏÏÏÏÏÏÏÏÏÏÏÏÏÏÏÏÏÏ 1 260 2 373 3 633
Bloomingdale's Home ÏÏÏÏÏÏÏÏÏÏÏÏÏÏÏ 1 100 1 92 2 192
David's Bridal ÏÏÏÏÏÏÏÏÏÏÏÏÏÏÏÏÏÏÏÏÏÏ 1 10 Ì Ì 1 10
Famous Barr ÏÏÏÏÏÏÏÏÏÏÏÏÏÏÏÏÏÏÏÏÏÏÏ 3 534 Ì Ì 3 534
Filene'sÏÏÏÏÏÏÏÏÏÏÏÏÏÏÏÏÏÏÏÏÏÏÏÏÏÏÏÏ 2 325 5 812 7 1,137
Filene's Home & Men's Store ÏÏÏÏÏÏÏÏ Ì Ì 1 103 1 103
Filene's Home StoreÏÏÏÏÏÏÏÏÏÏÏÏÏÏÏÏÏ 1 41 Ì Ì 1 41
Foley's ÏÏÏÏÏÏÏÏÏÏÏÏÏÏÏÏÏÏÏÏÏÏÏÏÏÏÏÏ 12 1,893 12 2,288 24 4,181
Foley's Children's StoreÏÏÏÏÏÏÏÏÏÏÏÏÏÏ Ì Ì 1 17 1 17
Hecht'sÏÏÏÏÏÏÏÏÏÏÏÏÏÏÏÏÏÏÏÏÏÏÏÏÏÏÏÏ 7 1,173 2 341 9 1,514
L.S. Ayres ÏÏÏÏÏÏÏÏÏÏÏÏÏÏÏÏÏÏÏÏÏÏÏÏÏ 1 242 Ì Ì 1 242
Lord & TaylorÏÏÏÏÏÏÏÏÏÏÏÏÏÏÏÏÏÏÏÏÏÏ 6 758 6 799 12 1,557
Macy's ÏÏÏÏÏÏÏÏÏÏÏÏÏÏÏÏÏÏÏÏÏÏÏÏÏÏÏÏ 40 6,614 21 4,026 61 10,640
Macy's Home Store ÏÏÏÏÏÏÏÏÏÏÏÏÏÏÏÏÏ 2 202 1 112 3 314
Marshall Field's ÏÏÏÏÏÏÏÏÏÏÏÏÏÏÏÏÏÏÏÏ 14 2,135 5 945 19 3,080
Marshall Field's Men's & Home ÏÏÏÏÏÏ 2 239 Ì Ì 2 239
Marshall Field's Women's ÏÏÏÏÏÏÏÏÏÏÏÏ 1 202 Ì Ì 1 202
Meier & Frank ÏÏÏÏÏÏÏÏÏÏÏÏÏÏÏÏÏÏÏÏÏ 3 502 1 199 4 701
Meier & Frank Home Store ÏÏÏÏÏÏÏÏÏÏ 1 84 1 166 2 250
Robinsons-May ÏÏÏÏÏÏÏÏÏÏÏÏÏÏÏÏÏÏÏÏÏ 4 650 4 676 8 1,326
Strawbridge'sÏÏÏÏÏÏÏÏÏÏÏÏÏÏÏÏÏÏÏÏÏÏÏ Ì Ì 2 426 2 426
Total Federated Department Stores,Inc. ÏÏÏÏÏÏÏÏÏÏÏÏÏÏÏÏÏÏÏÏÏÏÏÏÏÏ 102 15,964 65 11,375 167 27,339
Sears Holdings Corporation
Sears ÏÏÏÏÏÏÏÏÏÏÏÏÏÏÏÏÏÏÏÏÏÏÏÏÏÏÏÏÏ 94 13,260 34 5,416 128 18,676
KmartÏÏÏÏÏÏÏÏÏÏÏÏÏÏÏÏÏÏÏÏÏÏÏÏÏÏÏÏÏ 1 88 Ì Ì 1 88
Total Sears Holdings CorporationÏÏÏÏ 95 13,348 34 5,416 129 18,764
JCPenney Company, Inc.
JCPenneyÏÏÏÏÏÏÏÏÏÏÏÏÏÏÏÏÏÏÏÏÏÏÏÏÏÏ 93 10,565 36 5,017 129 15,582
Total JCPenney Company, Inc. ÏÏÏÏÏ 93 10,565 36 5,017 129 15,582
Dillard's Inc.
Dillard's ÏÏÏÏÏÏÏÏÏÏÏÏÏÏÏÏÏÏÏÏÏÏÏÏÏÏÏ 52 8,482 22 4,207 74 12,689
Dillard's Men's ÏÏÏÏÏÏÏÏÏÏÏÏÏÏÏÏÏÏÏÏÏ Ì Ì 1 80 1 80
Dillard's Men's & Home ÏÏÏÏÏÏÏÏÏÏÏÏÏ 2 257 2 157 4 414
Total Dillard's Inc. ÏÏÏÏÏÏÏÏÏÏÏÏÏÏÏ 54 8,739 25 4,444 79 13,183
27
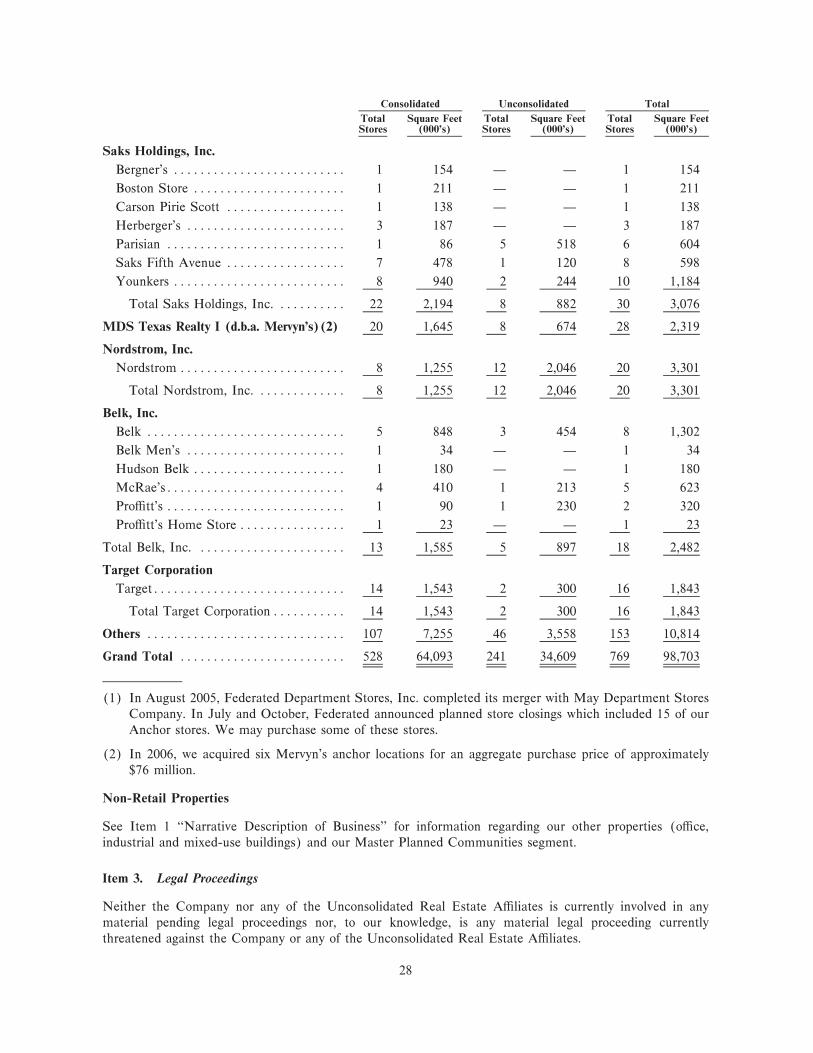
Consolidated Unconsolidated Total
Total Square Feet Total Square Feet Total Square FeetStores (000's) Stores (000's) Stores (000's)
Saks Holdings, Inc.
Bergner's ÏÏÏÏÏÏÏÏÏÏÏÏÏÏÏÏÏÏÏÏÏÏÏÏÏÏ 1 154 Ì Ì 1 154
Boston Store ÏÏÏÏÏÏÏÏÏÏÏÏÏÏÏÏÏÏÏÏÏÏÏ 1 211 Ì Ì 1 211
Carson Pirie Scott ÏÏÏÏÏÏÏÏÏÏÏÏÏÏÏÏÏÏ 1 138 Ì Ì 1 138
Herberger's ÏÏÏÏÏÏÏÏÏÏÏÏÏÏÏÏÏÏÏÏÏÏÏÏ 3 187 Ì Ì 3 187
Parisian ÏÏÏÏÏÏÏÏÏÏÏÏÏÏÏÏÏÏÏÏÏÏÏÏÏÏÏ 1 86 5 518 6 604
Saks Fifth Avenue ÏÏÏÏÏÏÏÏÏÏÏÏÏÏÏÏÏÏ 7 478 1 120 8 598
Younkers ÏÏÏÏÏÏÏÏÏÏÏÏÏÏÏÏÏÏÏÏÏÏÏÏÏÏ 8 940 2 244 10 1,184
Total Saks Holdings, Inc. ÏÏÏÏÏÏÏÏÏÏ 22 2,194 8 882 30 3,076
MDS Texas Realty I (d.b.a. Mervyn's)(2) 20 1,645 8 674 28 2,319
Nordstrom, Inc.
Nordstrom ÏÏÏÏÏÏÏÏÏÏÏÏÏÏÏÏÏÏÏÏÏÏÏÏÏ 8 1,255 12 2,046 20 3,301
Total Nordstrom, Inc. ÏÏÏÏÏÏÏÏÏÏÏÏÏ 8 1,255 12 2,046 20 3,301
Belk, Inc.
Belk ÏÏÏÏÏÏÏÏÏÏÏÏÏÏÏÏÏÏÏÏÏÏÏÏÏÏÏÏÏÏ 5 848 3 454 8 1,302
Belk Men's ÏÏÏÏÏÏÏÏÏÏÏÏÏÏÏÏÏÏÏÏÏÏÏÏ 1 34 Ì Ì 1 34
Hudson Belk ÏÏÏÏÏÏÏÏÏÏÏÏÏÏÏÏÏÏÏÏÏÏÏ 1 180 Ì Ì 1 180
McRae'sÏÏÏÏÏÏÏÏÏÏÏÏÏÏÏÏÏÏÏÏÏÏÏÏÏÏÏ 4 410 1 213 5 623
ProÇtt's ÏÏÏÏÏÏÏÏÏÏÏÏÏÏÏÏÏÏÏÏÏÏÏÏÏÏÏ 1 90 1 230 2 320
ProÇtt's Home Store ÏÏÏÏÏÏÏÏÏÏÏÏÏÏÏÏ 1 23 Ì Ì 1 23
Total Belk, Inc. ÏÏÏÏÏÏÏÏÏÏÏÏÏÏÏÏÏÏÏÏÏÏ 13 1,585 5 897 18 2,482
Target Corporation
TargetÏÏÏÏÏÏÏÏÏÏÏÏÏÏÏÏÏÏÏÏÏÏÏÏÏÏÏÏÏ 14 1,543 2 300 16 1,843
Total Target CorporationÏÏÏÏÏÏÏÏÏÏÏ 14 1,543 2 300 16 1,843
Others ÏÏÏÏÏÏÏÏÏÏÏÏÏÏÏÏÏÏÏÏÏÏÏÏÏÏÏÏÏÏ 107 7,255 46 3,558 153 10,814
Grand Total ÏÏÏÏÏÏÏÏÏÏÏÏÏÏÏÏÏÏÏÏÏÏÏÏÏ 528 64,093 241 34,609 769 98,703
(1) In August 2005, Federated Department Stores, Inc. completed its merger with May Department StoresCompany. In July and October, Federated announced planned store closings which included 15 of ourAnchor stores. We may purchase some of these stores.
(2) In 2006, we acquired six Mervyn's anchor locations for an aggregate purchase price of approximately$76 million.
Non-Retail Properties
See Item 1 ""Narrative Description of Business'' for information regarding our other properties (oÇce,industrial and mixed-use buildings) and our Master Planned Communities segment.
Item 3. Legal Proceedings
Neither the Company nor any of the Unconsolidated Real Estate AÇliates is currently involved in anymaterial pending legal proceedings nor, to our knowledge, is any material legal proceeding currentlythreatened against the Company or any of the Unconsolidated Real Estate AÇliates.
28
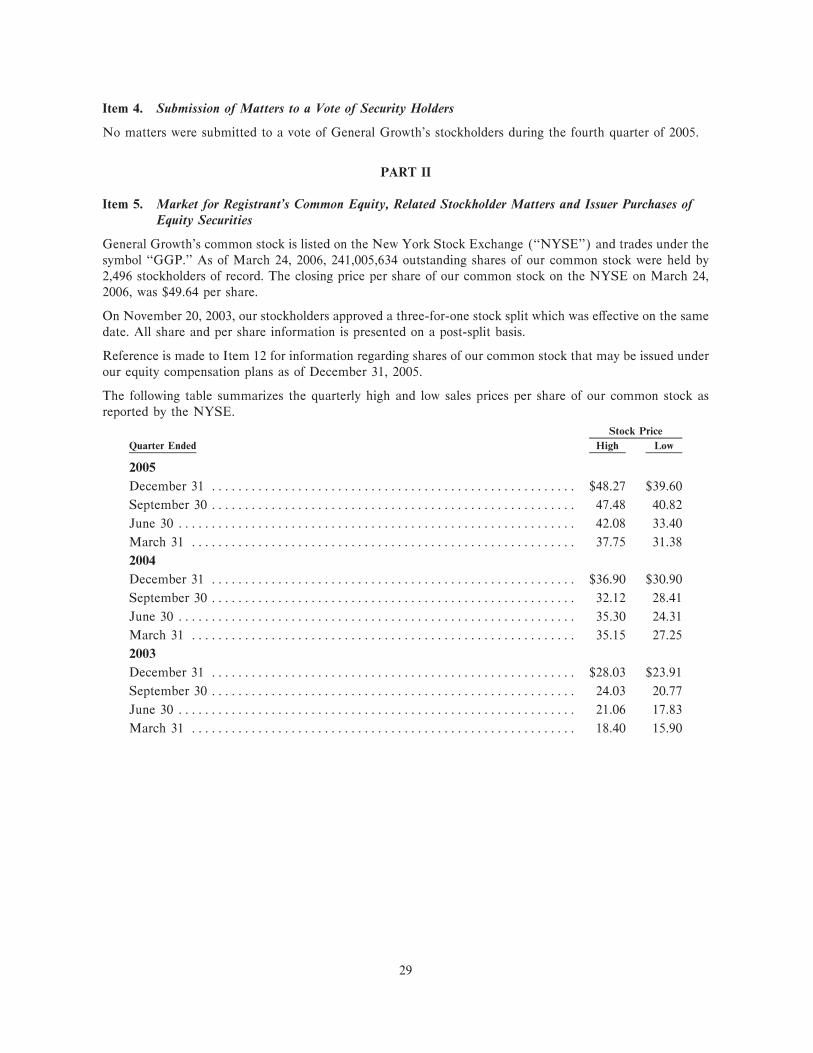
Item 4. Submission of Matters to a Vote of Security Holders
No matters were submitted to a vote of General Growth's stockholders during the fourth quarter of 2005.
PART II
Item 5. Market for Registrant's Common Equity, Related Stockholder Matters and Issuer Purchases ofEquity Securities
General Growth's common stock is listed on the New York Stock Exchange (""NYSE'') and trades under thesymbol ""GGP.'' As of March 24, 2006, 241,005,634 outstanding shares of our common stock were held by2,496 stockholders of record. The closing price per share of our common stock on the NYSE on March 24,2006, was $49.64 per share.
On November 20, 2003, our stockholders approved a three-for-one stock split which was eÅective on the samedate. All share and per share information is presented on a post-split basis.
Reference is made to Item 12 for information regarding shares of our common stock that may be issued underour equity compensation plans as of December 31, 2005.
The following table summarizes the quarterly high and low sales prices per share of our common stock asreported by the NYSE.
Stock Price
Quarter Ended High Low
2005
December 31 ÏÏÏÏÏÏÏÏÏÏÏÏÏÏÏÏÏÏÏÏÏÏÏÏÏÏÏÏÏÏÏÏÏÏÏÏÏÏÏÏÏÏÏÏÏÏÏÏÏÏÏÏÏÏÏ $48.27 $39.60
September 30 ÏÏÏÏÏÏÏÏÏÏÏÏÏÏÏÏÏÏÏÏÏÏÏÏÏÏÏÏÏÏÏÏÏÏÏÏÏÏÏÏÏÏÏÏÏÏÏÏÏÏÏÏÏÏÏ 47.48 40.82
June 30 ÏÏÏÏÏÏÏÏÏÏÏÏÏÏÏÏÏÏÏÏÏÏÏÏÏÏÏÏÏÏÏÏÏÏÏÏÏÏÏÏÏÏÏÏÏÏÏÏÏÏÏÏÏÏÏÏÏÏÏÏ 42.08 33.40
March 31 ÏÏÏÏÏÏÏÏÏÏÏÏÏÏÏÏÏÏÏÏÏÏÏÏÏÏÏÏÏÏÏÏÏÏÏÏÏÏÏÏÏÏÏÏÏÏÏÏÏÏÏÏÏÏÏÏÏÏ 37.75 31.38
2004
December 31 ÏÏÏÏÏÏÏÏÏÏÏÏÏÏÏÏÏÏÏÏÏÏÏÏÏÏÏÏÏÏÏÏÏÏÏÏÏÏÏÏÏÏÏÏÏÏÏÏÏÏÏÏÏÏÏ $36.90 $30.90
September 30 ÏÏÏÏÏÏÏÏÏÏÏÏÏÏÏÏÏÏÏÏÏÏÏÏÏÏÏÏÏÏÏÏÏÏÏÏÏÏÏÏÏÏÏÏÏÏÏÏÏÏÏÏÏÏÏ 32.12 28.41
June 30 ÏÏÏÏÏÏÏÏÏÏÏÏÏÏÏÏÏÏÏÏÏÏÏÏÏÏÏÏÏÏÏÏÏÏÏÏÏÏÏÏÏÏÏÏÏÏÏÏÏÏÏÏÏÏÏÏÏÏÏÏ 35.30 24.31
March 31 ÏÏÏÏÏÏÏÏÏÏÏÏÏÏÏÏÏÏÏÏÏÏÏÏÏÏÏÏÏÏÏÏÏÏÏÏÏÏÏÏÏÏÏÏÏÏÏÏÏÏÏÏÏÏÏÏÏÏ 35.15 27.25
2003
December 31 ÏÏÏÏÏÏÏÏÏÏÏÏÏÏÏÏÏÏÏÏÏÏÏÏÏÏÏÏÏÏÏÏÏÏÏÏÏÏÏÏÏÏÏÏÏÏÏÏÏÏÏÏÏÏÏ $28.03 $23.91
September 30 ÏÏÏÏÏÏÏÏÏÏÏÏÏÏÏÏÏÏÏÏÏÏÏÏÏÏÏÏÏÏÏÏÏÏÏÏÏÏÏÏÏÏÏÏÏÏÏÏÏÏÏÏÏÏÏ 24.03 20.77
June 30 ÏÏÏÏÏÏÏÏÏÏÏÏÏÏÏÏÏÏÏÏÏÏÏÏÏÏÏÏÏÏÏÏÏÏÏÏÏÏÏÏÏÏÏÏÏÏÏÏÏÏÏÏÏÏÏÏÏÏÏÏ 21.06 17.83
March 31 ÏÏÏÏÏÏÏÏÏÏÏÏÏÏÏÏÏÏÏÏÏÏÏÏÏÏÏÏÏÏÏÏÏÏÏÏÏÏÏÏÏÏÏÏÏÏÏÏÏÏÏÏÏÏÏÏÏÏ 18.40 15.90
29
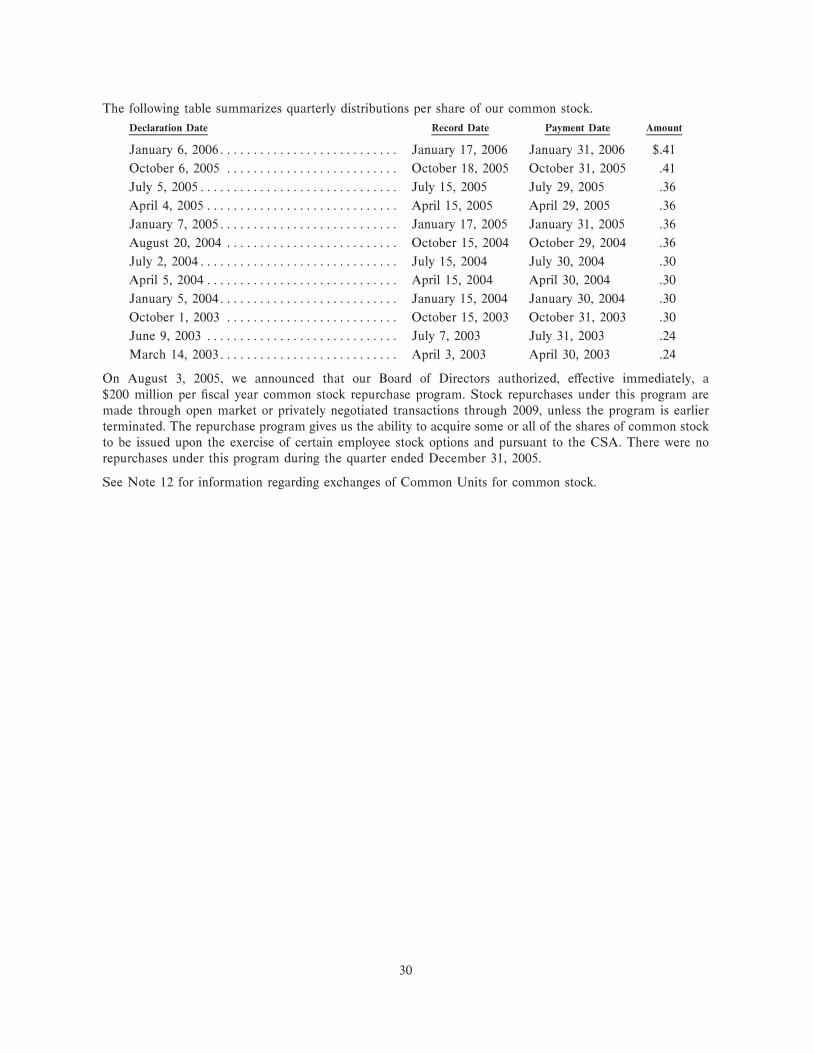
The following table summarizes quarterly distributions per share of our common stock.
Declaration Date Record Date Payment Date Amount
January 6, 2006ÏÏÏÏÏÏÏÏÏÏÏÏÏÏÏÏÏÏÏÏÏÏÏÏÏÏÏ January 17, 2006 January 31, 2006 $.41
October 6, 2005 ÏÏÏÏÏÏÏÏÏÏÏÏÏÏÏÏÏÏÏÏÏÏÏÏÏÏ October 18, 2005 October 31, 2005 .41
July 5, 2005ÏÏÏÏÏÏÏÏÏÏÏÏÏÏÏÏÏÏÏÏÏÏÏÏÏÏÏÏÏÏ July 15, 2005 July 29, 2005 .36
April 4, 2005ÏÏÏÏÏÏÏÏÏÏÏÏÏÏÏÏÏÏÏÏÏÏÏÏÏÏÏÏÏ April 15, 2005 April 29, 2005 .36
January 7, 2005ÏÏÏÏÏÏÏÏÏÏÏÏÏÏÏÏÏÏÏÏÏÏÏÏÏÏÏ January 17, 2005 January 31, 2005 .36
August 20, 2004 ÏÏÏÏÏÏÏÏÏÏÏÏÏÏÏÏÏÏÏÏÏÏÏÏÏÏ October 15, 2004 October 29, 2004 .36
July 2, 2004ÏÏÏÏÏÏÏÏÏÏÏÏÏÏÏÏÏÏÏÏÏÏÏÏÏÏÏÏÏÏ July 15, 2004 July 30, 2004 .30
April 5, 2004ÏÏÏÏÏÏÏÏÏÏÏÏÏÏÏÏÏÏÏÏÏÏÏÏÏÏÏÏÏ April 15, 2004 April 30, 2004 .30
January 5, 2004ÏÏÏÏÏÏÏÏÏÏÏÏÏÏÏÏÏÏÏÏÏÏÏÏÏÏÏ January 15, 2004 January 30, 2004 .30
October 1, 2003 ÏÏÏÏÏÏÏÏÏÏÏÏÏÏÏÏÏÏÏÏÏÏÏÏÏÏ October 15, 2003 October 31, 2003 .30
June 9, 2003 ÏÏÏÏÏÏÏÏÏÏÏÏÏÏÏÏÏÏÏÏÏÏÏÏÏÏÏÏÏ July 7, 2003 July 31, 2003 .24
March 14, 2003ÏÏÏÏÏÏÏÏÏÏÏÏÏÏÏÏÏÏÏÏÏÏÏÏÏÏÏ April 3, 2003 April 30, 2003 .24
On August 3, 2005, we announced that our Board of Directors authorized, eÅective immediately, a$200 million per Ñscal year common stock repurchase program. Stock repurchases under this program aremade through open market or privately negotiated transactions through 2009, unless the program is earlierterminated. The repurchase program gives us the ability to acquire some or all of the shares of common stockto be issued upon the exercise of certain employee stock options and pursuant to the CSA. There were norepurchases under this program during the quarter ended December 31, 2005.
See Note 12 for information regarding exchanges of Common Units for common stock.
30

Item 6. Selected Financial Data
The following table sets forth selected Ñnancial data which is derived from, and should be read in conjunctionwith, the Consolidated Financial Statements and the related Notes and Management's Discussion andAnalysis of Financial Condition and Results of Operations contained in this Annual Report.
Results for prior periods have been restated to reÖect the reclassiÑcation of disposed properties in 2005 todiscontinued operations (Note 4).
2005 2004 2003 2002 2001
(In thousands, except per share amounts)
Operating Data
Revenues ÏÏÏÏÏÏÏÏÏÏÏÏÏÏÏÏÏÏÏÏÏÏÏÏÏÏÏÏ $ 3,073,416 $ 1,799,881 $ 1,262,791 $ 973,440 $ 799,365
Depreciation and amortization ÏÏÏÏÏÏÏÏÏÏ (672,914) (364,854) (230,195) (179,036) (144,863)
Other operating expenses ÏÏÏÏÏÏÏÏÏÏÏÏÏÏÏ (1,342,161) (693,735) (484,196) (366,806) (293,565)
Interest expense, netÏÏÏÏÏÏÏÏÏÏÏÏÏÏÏÏÏÏÏ (1,020,825) (468,958) (276,235) (215,340) (220,402)
Provision for income taxesÏÏÏÏÏÏÏÏÏÏÏÏÏÏ (50,646) (2,383) (98) (119) (160)
Income allocated to minority interests ÏÏÏÏ (43,989) (105,274) (110,984) (86,213) (40,288)
Equity in income of unconsolidatedaÇliates ÏÏÏÏÏÏÏÏÏÏÏÏÏÏÏÏÏÏÏÏÏÏÏÏÏÏÏ 120,986 88,191 94,480 80,825 60,195
Network discontinuance costs ÏÏÏÏÏÏÏÏÏÏÏ Ì Ì Ì Ì (66,000)
Income from continuing operations ÏÏÏÏÏÏ 63,867 252,868 255,563 206,751 94,282
Income from discontinued operations, netÏÏ 11,686 14,984 7,848 2,507 1,362
Income before cumulative eÅect ofaccounting changeÏÏÏÏÏÏÏÏÏÏÏÏÏÏÏÏÏÏÏ 75,553 267,852 263,411 209,258 95,644
Cumulative eÅect of accounting change ÏÏ Ì Ì Ì Ì (3,334)
Net income ÏÏÏÏÏÏÏÏÏÏÏÏÏÏÏÏÏÏÏÏÏÏÏÏÏÏ 75,553 267,852 263,411 209,258 92,310
Convertible preferred stock dividendsÏÏÏÏÏ Ì Ì (13,030) (24,467) (24,467)
Net income available to commonstockholdersÏÏÏÏÏÏÏÏÏÏÏÏÏÏÏÏÏÏÏÏÏÏÏÏ $ 75,553 $ 267,852 $ 250,381 $ 184,791 $ 67,843
Basic earnings per share:
Continuing operationsÏÏÏÏÏÏÏÏÏÏÏÏÏÏÏÏ $ 0.27 $ 1.15 $ 1.21 $ 0.98 $ 0.44
Discontinued operations ÏÏÏÏÏÏÏÏÏÏÏÏÏÏ 0.05 0.07 0.04 0.01 0.01
Cumulative eÅect of accountingchange ÏÏÏÏÏÏÏÏÏÏÏÏÏÏÏÏÏÏÏÏÏÏÏÏÏÏ Ì Ì Ì Ì (0.02)
$ 0.32 $ 1.22 $ 1.25 $ 0.99 $ 0.43
Diluted earnings per share:
Continuing operationsÏÏÏÏÏÏÏÏÏÏÏÏÏÏÏÏ $ 0.27 $ 1.15 $ 1.19 $ 0.97 $ 0.44
Discontinued operations ÏÏÏÏÏÏÏÏÏÏÏÏÏÏ 0.05 0.06 0.03 0.01 0.01
Cumulative eÅect of accountingchange ÏÏÏÏÏÏÏÏÏÏÏÏÏÏÏÏÏÏÏÏÏÏÏÏÏÏ Ì Ì Ì Ì (0.02)
$ 0.32 $ 1.21 $ 1.22 $ 0.98 $ 0.43
Distributions declared per shareÏÏÏÏÏÏÏÏÏ $ 1.49 $ 1.26 $ 0.78 $ 0.92 $ 0.80
31
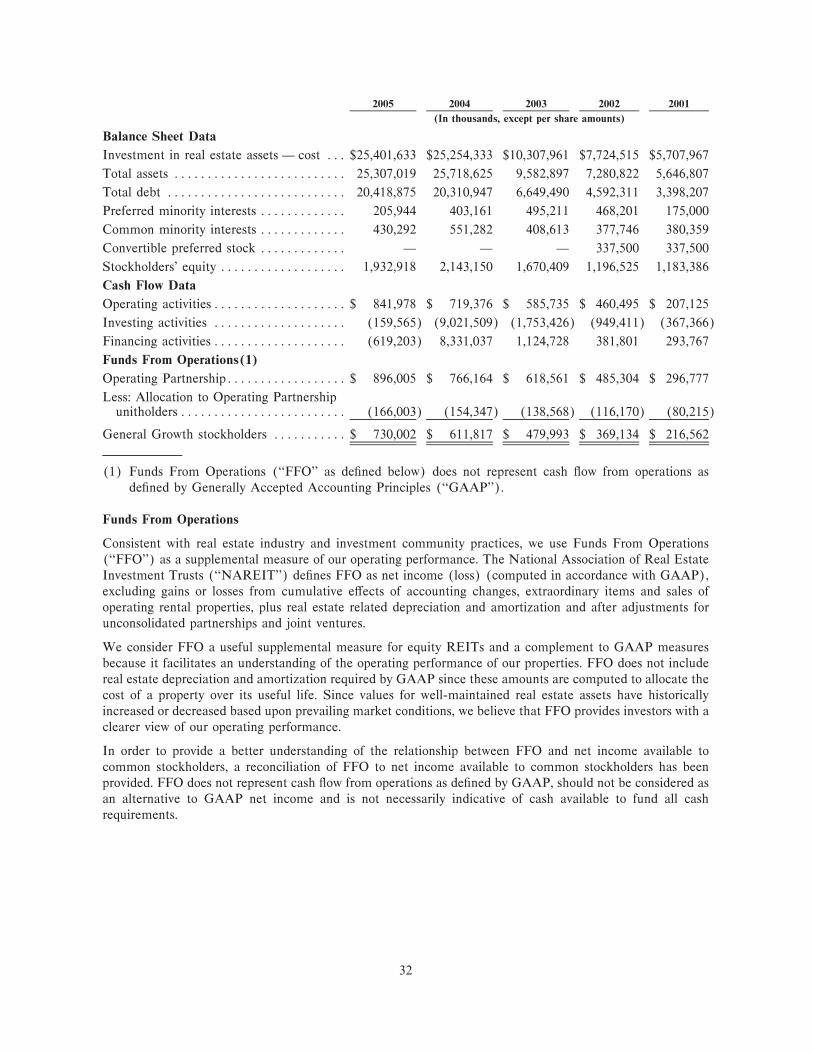
2005 2004 2003 2002 2001
(In thousands, except per share amounts)
Balance Sheet Data
Investment in real estate assets Ì cost ÏÏÏ $25,401,633 $25,254,333 $10,307,961 $7,724,515 $5,707,967
Total assets ÏÏÏÏÏÏÏÏÏÏÏÏÏÏÏÏÏÏÏÏÏÏÏÏÏÏ 25,307,019 25,718,625 9,582,897 7,280,822 5,646,807
Total debt ÏÏÏÏÏÏÏÏÏÏÏÏÏÏÏÏÏÏÏÏÏÏÏÏÏÏÏ 20,418,875 20,310,947 6,649,490 4,592,311 3,398,207
Preferred minority interests ÏÏÏÏÏÏÏÏÏÏÏÏÏ 205,944 403,161 495,211 468,201 175,000
Common minority interests ÏÏÏÏÏÏÏÏÏÏÏÏÏ 430,292 551,282 408,613 377,746 380,359
Convertible preferred stock ÏÏÏÏÏÏÏÏÏÏÏÏÏ Ì Ì Ì 337,500 337,500
Stockholders' equity ÏÏÏÏÏÏÏÏÏÏÏÏÏÏÏÏÏÏÏ 1,932,918 2,143,150 1,670,409 1,196,525 1,183,386
Cash Flow Data
Operating activitiesÏÏÏÏÏÏÏÏÏÏÏÏÏÏÏÏÏÏÏÏ $ 841,978 $ 719,376 $ 585,735 $ 460,495 $ 207,125
Investing activities ÏÏÏÏÏÏÏÏÏÏÏÏÏÏÏÏÏÏÏÏ (159,565) (9,021,509) (1,753,426) (949,411) (367,366)
Financing activities ÏÏÏÏÏÏÏÏÏÏÏÏÏÏÏÏÏÏÏÏ (619,203) 8,331,037 1,124,728 381,801 293,767
Funds From Operations(1)
Operating PartnershipÏÏÏÏÏÏÏÏÏÏÏÏÏÏÏÏÏÏ $ 896,005 $ 766,164 $ 618,561 $ 485,304 $ 296,777
Less: Allocation to Operating Partnershipunitholders ÏÏÏÏÏÏÏÏÏÏÏÏÏÏÏÏÏÏÏÏÏÏÏÏÏ (166,003) (154,347) (138,568) (116,170) (80,215)
General Growth stockholders ÏÏÏÏÏÏÏÏÏÏÏ $ 730,002 $ 611,817 $ 479,993 $ 369,134 $ 216,562
(1) Funds From Operations (""FFO'' as deÑned below) does not represent cash Öow from operations asdeÑned by Generally Accepted Accounting Principles (""GAAP'').
Funds From Operations
Consistent with real estate industry and investment community practices, we use Funds From Operations(""FFO'') as a supplemental measure of our operating performance. The National Association of Real EstateInvestment Trusts (""NAREIT'') deÑnes FFO as net income (loss) (computed in accordance with GAAP),excluding gains or losses from cumulative eÅects of accounting changes, extraordinary items and sales ofoperating rental properties, plus real estate related depreciation and amortization and after adjustments forunconsolidated partnerships and joint ventures.
We consider FFO a useful supplemental measure for equity REITs and a complement to GAAP measuresbecause it facilitates an understanding of the operating performance of our properties. FFO does not includereal estate depreciation and amortization required by GAAP since these amounts are computed to allocate thecost of a property over its useful life. Since values for well-maintained real estate assets have historicallyincreased or decreased based upon prevailing market conditions, we believe that FFO provides investors with aclearer view of our operating performance.
In order to provide a better understanding of the relationship between FFO and net income available tocommon stockholders, a reconciliation of FFO to net income available to common stockholders has beenprovided. FFO does not represent cash Öow from operations as deÑned by GAAP, should not be considered asan alternative to GAAP net income and is not necessarily indicative of cash available to fund all cashrequirements.
32
Reconciliation of FFO to Net Income Available to Common Stockholders
2005 2004 2003 2002 2001
(In thousands)
FFO:
General Growth stockholders ÏÏÏÏÏÏÏÏÏÏÏÏ $730,002 $611,817 $479,993 $369,134 $216,562
Operating Partnership unitholdersÏÏÏÏÏÏÏÏÏ 166,003 154,347 138,568 116,170 80,215
Operating PartnershipÏÏÏÏÏÏÏÏÏÏÏÏÏÏÏÏÏÏÏ 896,005 766,164 618,561 485,304 296,777
Depreciation and amortization of capitalizedreal estate costs ÏÏÏÏÏÏÏÏÏÏÏÏÏÏÏÏÏÏÏÏÏÏÏÏ (799,337) (440,108) (299,711) (241,393) (200,123)
FFO of discontinued operations ÏÏÏÏÏÏÏÏÏÏÏÏ (13,548) (6,235) (6,299) (4,263) (2,215)
Allocations to Operating Partnershipunitholders ÏÏÏÏÏÏÏÏÏÏÏÏÏÏÏÏÏÏÏÏÏÏÏÏÏÏÏÏ (19,253) (66,953) (56,988) (32,897) (157)
Income from continuing operationsÏÏÏÏÏÏÏÏÏÏ 63,867 252,868 255,563 206,751 94,282
Income from discontinued operations, net ofminority interest ÏÏÏÏÏÏÏÏÏÏÏÏÏÏÏÏÏÏÏÏÏÏÏ 11,686 14,984 7,848 2,507 1,362
Income before cumulative eÅect of accountingchange and convertible preferred stockdividends ÏÏÏÏÏÏÏÏÏÏÏÏÏÏÏÏÏÏÏÏÏÏÏÏÏÏÏÏÏ 75,553 267,852 263,411 209,258 95,644
Cumulative eÅect of accounting changeÏÏÏÏÏÏ Ì Ì Ì Ì (3,334)
Convertible preferred stock dividendsÏÏÏÏÏÏÏÏ Ì Ì (13,030) (24,467) (24,467)
Net income available to common stockholders $ 75,553 $267,852 $250,381 $184,791 $ 67,843
Item 7. Management's Discussion and Analysis of Financial Condition and Results of Operations
All references to numbered Notes are to speciÑc footnotes to our Consolidated Financial Statements includedin this Annual Report and which descriptions are incorporated into the applicable response by reference. Thefollowing discussion should be read in conjunction with such Consolidated Financial Statements and relatedNotes. Capitalized terms used, but not deÑned, in this Management's Discussion and Analysis of FinancialCondition and Results of Operations (""MD&A'') have the same meanings as in such Notes. See also theGlossary at the end of this Item 7 for deÑnitions of selected terms used in this Annual Report.
Overview Ì Retail and Other Segment
Our primary business is acquiring, owning, managing, leasing and developing retail and oÇce rental property.As of December 31, 2005, we had ownership interest in or management responsibility for a portfolio of over200 regional shopping malls in 44 states. We provide on-site management and other services to substantiallyall of our properties, including properties which we own through joint venture arrangements and which areunconsolidated for GAAP purposes. Our management operating philosophies and strategies are generally thesame whether the properties are consolidated or unconsolidated. As a result, we believe that Ñnancialinformation and operating statistics with respect to all properties, both consolidated and unconsolidated,provide important insights into our operating results. Collectively, we refer to our Consolidated andUnconsolidated Properties as our ""Company Portfolio'' and the retail portion of the Company Portfolio as the""Retail Company Portfolio.''
Prior year acquisitions were the most signiÑcant factor aÅecting our cash Öows and real estate net operatingincome in 2005, 2004 and 2003. Acquisitions have included single centers, privately held portfolios andpublic-to-public purchases such as the $14 billion TRC Merger in November 2004. Acquisitions in 2005,however, were not signiÑcant and consisted primarily of interests in joint ventures which are developing retailcenters.
33
We seek to increase cash Öow and real estate net operating income of our retail and oÇce rental propertiesthrough proactive property management and leasing (including tenant remerchandising), operating costreductions, physical expansions, redevelopments and capital reinvestment. Some of the actions that we take toincrease productivity include changing the tenant mix, adding vendor carts or kiosks and full expansions orrenovations of centers.
We believe that the most signiÑcant operating factor aÅecting incremental cash Öow and real estate netoperating income is increased rents (either base rental revenue or overage rents) earned from tenants at ourproperties. These rental revenue increases are primarily achieved by:
‚ Renewing expiring leases and re-leasing existing space at rates higher than expiring or existing rates. Theaverage annual new/renewal lease rate for our Consolidated Retail Properties for 2005 was $37.72 persquare foot which was $4.43 per square foot higher than the average annualized in place rent per squarefoot, as detailed in the table immediately below.
‚ Increasing occupancy at the properties so that more space is generating rent. The occupancy percentage atproperties which are not under redevelopment in our Retail Company Portfolio was 92.5 percent atDecember 31, 2005, compared to 92.1 percent at December 31, 2004.
‚ Increased tenant sales in which we participate through overage rents. In 2005, tenant sales per square foot inour Retail Company Portfolio increased 6.4 percent over 2004 to $437 per square foot.
The following table summarizes selected operating statistics as of December 31, 2005.
Consolidated Unconsolidated RetailRetail Retail Company
Properties Properties Portfolio
Operating Statistics(a)
Occupancy ÏÏÏÏÏÏÏÏÏÏÏÏÏÏÏÏÏÏÏÏÏÏÏÏÏÏÏÏÏÏÏÏÏÏÏÏÏ 92.1% 93.5% 92.5%
Trailing 12 month total tenant sales per sq. ft.(b) ÏÏÏÏ $ 428 $ 455 $ 437
% change in total sales(b)ÏÏÏÏÏÏÏÏÏÏÏÏÏÏÏÏÏÏÏÏÏÏÏÏ 5.9% 7.2% 6.4%
% change in comparable sales(b)ÏÏÏÏÏÏÏÏÏÏÏÏÏÏÏÏÏÏ 3.3 3.9 3.5
Mall and freestanding GLA excluding space underredevelopment (in sq. ft.) ÏÏÏÏÏÏÏÏÏÏÏÏÏÏÏÏÏÏÏÏÏÏ 40,354,823 19,176,851 59,531,674
Certain Financial Information
Average annualized in place rent per sq. ft. ÏÏÏÏÏÏÏÏÏ $ 33.29 $ 36.25
Average rent per sq. ft. for new/renewal leases ÏÏÏÏÏÏ 37.72 40.48
Average rent per sq. ft. for leases expiring in 2005ÏÏÏÏ 29.63 32.31
(a) Excludes properties currently being redeveloped and/or remerchandised and miscellaneous (non-mall)properties.
(b) Due to tenant sales reporting timelines, data presented is as of November.
The expansion and renovation of a property may also result in increased cash Öows and operating income as aresult of increased customer traÇc, trade area penetration and improved competitive position of the property.As of December 31, 2005, we had 22 major approved redevelopment projects underway (each with budgetedprojected expenditures, at our ownership share, in excess of $10 million).
We also develop retail centers from the ground-up. In September 2005, we opened the Shops at La Cantera inSan Antonio, Texas. This open air center is anchored by Neiman Marcus, Nordstrom, Dillard's and Foley's.In August 2004, we completed the ground-up development of Jordan Creek Town Center in WestDes Moines, Iowa, a 1.9 million square foot enclosed regional shopping mall with four anchor stores, a hoteland an amphitheater.
34
We have six retail center development projects currently under construction, all of which are scheduled toopen in late 2006 or 2007:
‚ Lincolnshire Commons in Lincolnshire (Chicago), Illinois
‚ Otay Ranch Town Center in Chula Vista (San Diego), California
‚ Gateway Overlook in Benson, Maryland
‚ Natick West in Natick, Massachusetts
‚ The Shops at Fallen Timbers, Maumee (Toledo), Ohio
‚ Pinnacle Hills Promenade in Rogers, Arkansas
In addition, we have agreed to acquire the new retail development at The Palazzo in Las Vegas, Nevada, uponopening. This is currently expected in late 2007, at an estimated acquisition cost of $600 million. We also have11 other potential new retail or mixed-use developments that are projected to open in 2006 through 2009.
Total projected expenditures (including our share of the Unconsolidated Real Estate AÇliates) for the 22redevelopment projects and the six new retail center development projects were approximately $2.0 billion asof December 31, 2005. Such development and redevelopment expenditures, together with expenditures for the11 other potential new retail or mixed-use developments are expected to result in approximately $450 to$800 million of expenditures per year for the years 2006 to 2009.
Overview Ì Master Planned Communities Segment
Our Master Planned Communities segment includes the development and sale of residential and commercialland, primarily in large-scale projects in and around Columbia, Maryland; Houston, Texas and Summerlin,Nevada. We develop land and sell Ñnished and undeveloped land in such communities to builders and otherdevelopers for residential, commercial and other uses. Our Master Planned Communities segment reportedNOI of $95.7 million in 2005. Land sale activity at our newest project, the Bridgelands in Houston, Texas,began in 2006.
Overview Ì Other
We believe changes in interest rates are the most signiÑcant external factor aÅecting our cash Öows and netincome. As detailed in our discussion of economic conditions and market risk (Item 7A), interest rates haverisen in recent months and could continue to rise in future months, which could adversely impact our futurecash Öow and net income.
During 2005, we obtained approximately $3.9 billion of consolidated debt through new Ñnancings andreÑnancings. Our share of debt issued by our Unconsolidated Real Estate AÇliates totaled approximately$840 million during the same period. Proceeds from the issuances were used, in part, to repay $2.7 billion ofvariable-rate debt.
Two of our operating retail properties (Oakwood Center in Gretna, Louisiana and Riverwalk, located near theconvention center in downtown New Orleans) were closed in September 2005, when a hurricane struck thearea. Although property damage in the New Orleans area was generally due to hurricane eÅects, the damageto Oakwood Center and Riverwalk was from arson and vandalism. Riverwalk partially re-opened onNovember 21, 2005 at a substantially reduced occupancy level. The Sears store at Oakwood Center isoperating at a reduced level. Two other anchor stores at Oakwood Center are expected to re-open in 2006 andfollowing repair and restoration, the remainder of the property is expected to open on or before Fall 2007. Wehave comprehensive insurance coverage for both property damage and business interruption. The restorationeÅort at the properties is expected to include replacing portions of the building, landscaping and furnishings.The net book value of the property damage is currently estimated to be approximately $53 million; however,we are still assessing the damage estimates and the actual net book value write-oÅ could vary from thisestimate. Changes to these estimates will be recorded in the periods in which they are determined. As ofDecember 31, 2005, we have recorded a net Ñxed asset write-oÅ and a corresponding insurance claim recovery
35
receivable for this net book value amount because we believe that it is probable that the insurance recovery,net of deductibles on a replacement cost basis, will exceed these amounts. While we expect the insuranceproceeds will be suÇcient to cover most of the replacement cost of the restoration of the properties and certainbusiness interruption amounts, certain deductibles, limitations and exclusions are expected to apply withrespect to both current and future matters. No determination has been made as to the total amount or timingof those insurance payments. As of December 31, 2005, $5 million in insurance proceeds related to theOakwood property has been received, which has been oÅset against this insurance recovery receivable. InJanuary 2006, we received an additional $5 million in insurance proceeds with respect to Oakwood and$2.5 million in insurance proceeds related to Riverwalk. As only a portion of the repairs have taken place as ofDecember 31, 2005, substantially all of the remaining $63.4 million receivable recorded represents therecovery of the net book value of Ñxed assets written oÅ. The cost recoveries have been recorded on theexpense line item to which they relate, and therefore there is no signiÑcant impact to any line item or ouroverall results. However, included in property operating expenses in 2005 are approximately $1 million of costswhich, when fully expended, are not expected to be recoverable from insurance proceeds due to insurancepolicy deductibles.
Seasonality
Although we have a year-long temporary leasing program, occupancies for short-term tenants and, therefore,rental income recognized, are higher during the second half of the year. In addition, the majority of ourtenants have December or January lease years for purposes of calculating annual overage rent amounts.Accordingly, overage rent thresholds are most commonly achieved in the fourth quarter. As a result, revenueproduction is generally highest in the fourth quarter of each year.
Use of Estimates
The preparation of Ñnancial statements in conformity with accounting principles generally accepted in theUnited States of America requires management to make estimates and assumptions. These estimates andassumptions aÅect the reported amounts of assets and liabilities and the disclosure of contingent assets andliabilities at the date of the Ñnancial statements and the reported amounts of revenues and expenses during thereporting period. For example, signiÑcant estimates and assumptions have been made with respect to usefullives of assets, capitalization of development and leasing costs, provision for income taxes, recoverableamounts of receivables, deferred taxes, initial valuations and related amortization periods of deferred costs andintangibles, particularly with respect to property acquisitions and cost ratios and completion percentages usedfor land sales. Actual results could diÅer from those estimates.
Critical Accounting Policies
Critical accounting policies are those that are both signiÑcant to the overall presentation of our Ñnancialcondition and results of operations and require management to make diÇcult, complex or subjectivejudgments. Our critical accounting policies are those applicable to the following:
Initial valuations and estimated useful lives or amortization periods for property and intangibles. When weacquire a property, we make an initial assessment of the initial valuation and composition of the assetsacquired and liabilities assumed. These assessments consider fair values of the respective assets and liabilitiesand are primarily determined based on estimated future cash Öows using appropriate discount and capitaliza-tion rates, but may also be based on independent appraisals or other market data. The estimated future cashÖows that are used for this analysis reÖect the historical operations of the property, known trends and changesexpected in current market and economic conditions which would impact the property's operations, and ourplans for such property. These estimates are particularly important as they are used for the allocation ofpurchase price between depreciable and non-depreciable real estate and other identiÑable intangiblesincluding above, below and at-market leases. As a result, the impact of these estimates on our operations couldbe substantial.
36
SigniÑcant diÅerences in annual depreciation or amortization expense may result from the diÅeringamortization periods related to such purchased assets and liabilities. For example, the TRC Merger increasedland by $1.3 billion, buildings and equipment by $8.2 billion, investment land and land held for developmentand sale by $1.7 billion and other tenant-related intangibles and liabilities, net, by approximately $300 million.Buildings are depreciated over 40-45 years, equipment is depreciated over 5-15 years and purchasedintangibles are amortized over the related remaining lease life which is, generally, 5 years. Land andinvestment land and land held for development and sale are not depreciated, however, the carrying value ofsuch land will aÅect the gain/loss recognized on the sale of such land. Therefore, the majority of theacquisition cost of $14 billion is reÖected over time in increased depreciation and amortization charges.
Events or changes in circumstances concerning a property may occur which could indicate that the carryingvalues or amortization periods of the assets and liabilities may require adjustment. The resulting recoveryanalysis also depends on an analysis of future cash Öows to be generated from a property's assets and liabilities.Changes in our overall plans (for example, the extent and nature of a proposed redevelopment of a property)and our views on current market and economic conditions may have a signiÑcant impact on the resultingestimated future cash Öows of a property that are analyzed for these purposes.
Recoverable amounts of receivables and deferred taxes. We make periodic assessments of the collectibilityof receivables (including those resulting from the diÅerence between rental revenue recognized and rentscurrently due from tenants) and the recoverability of deferred taxes based on a speciÑc review of the risk ofloss on speciÑc accounts or amounts. The receivable analysis places particular emphasis on past-due accountsand considers the nature and age of the receivables, the payment history and Ñnancial condition of the payee,the basis for any disputes or negotiations with the payee and other information which may impactcollectibility. For straight-line rents, the analysis considers the probability of collection of the unbilled deferredrent receivable given our experience regarding such amounts. For deferred taxes, an assessment of therecoverability of the current tax asset considers the current expiration periods of the prior net operating losscarryforwards and the estimated future taxable income of our taxable REIT subsidiaries. The resultingestimates of any allowance or reserve related to the recovery of these items is subject to revision as thesefactors change and is sensitive to the eÅects of economic and market conditions on such payees and ourtaxable REIT subsidiaries.
Capitalization of development and leasing costs. We capitalize the costs of development and leasingactivities of our properties. These costs are incurred both at the property location and at the regional andcorporate oÇce level. The amount of capitalization depends, in part, on the identiÑcation and justiÑableallocation of certain activities to speciÑc projects and leases. DiÅerences in methodologies of cost identiÑca-tion and documentation, as well as diÅering assumptions as to the time incurred on projects, can yieldsigniÑcant diÅerences in the amounts capitalized and, as a result, the amount of depreciation recognized.
Revenue recognition and related matters. Minimum rent revenues are recognized on a straight-line basisover the terms of the related leases. Minimum rent revenues also include amounts collected from tenants toallow the termination of their leases prior to their scheduled termination dates and accretion related to aboveand below-market tenant leases on acquired properties. Straight-line rents receivable represents the currentnet cumulative rents recognized prior to when billed and collectible as provided by the terms of the leases.Overage rents are recognized on an accrual basis once tenant sales exceed contractual tenant lease thresholds.Recoveries from tenants are established in the leases or computed based upon a formula related to real estatetaxes, insurance and other shopping center operating expenses and are generally recognized as revenues in theperiod the related costs are incurred. Revenues from land sales are recognized using the full accrual methodprovided that various criteria relating to the terms of the transactions and our subsequent involvement with theland sold are met. Revenues relating to transactions that do not meet the established criteria are deferred andrecognized when the criteria are met or using the installment or cost recovery methods, as appropriate in thecircumstances. For land sale transactions in which we are required to perform additional services and incursigniÑcant costs after title has passed, revenues and cost of sales are recognized on a percentage of completionbasis.
37

Cost of land sales is determined as a speciÑed percentage of land sales revenues recognized for eachcommunity development project. The cost ratios used are based on actual costs incurred and estimates ofdevelopment costs and sales revenues to completion of each project. The ratios are reviewed regularly andrevised for changes in sales and cost estimates or development plans. SigniÑcant changes in these estimates ordevelopment plans, whether due to changes in market conditions or other factors, could result in changes tothe cost ratio used for a speciÑc project. The increase in the basis of the land due to purchase price accountingadjustments has resulted in a signiÑcant increase in the cost ratios of our projects. The speciÑc identiÑcationmethod is used to determine cost of sales for certain parcels of land, including acquired parcels we do notintend to develop or for which development is complete at the date of acquisition.
Acquisitions
Acquisitions were as follows:
GrossPurchase New or
Acquisition Date Price Assumed Debt(1)
(In millions)
2005
20% ownership interest in Shopping Leblon (underdevelopment) (through Cencom, S.A. (Brazil)) ÏÏÏÏÏÏÏÏ August 3 $ 13.4 Ì
50% ownership interest in Pinnacle Hills Promenade, adevelopment in progress, (through Rogers Retail L.L.C.) September 30 18.5 Ì
50% interest in Circle T Power Center, a development inprogress, (through 170 Retail Associates, LTD)ÏÏÏÏÏÏÏÏÏ October 31 14.8 Ì
50% interest in Whalers Village (through GGP/Teachers) ÏÏ November 1 85.0 $ 67.5
$ 131.7 $ 67.5
2004
50% ownership interest in Burlington Town Center ÏÏÏÏÏÏÏÏ January 7 $ 10.25 Ì
Redlands Mall ÏÏÏÏÏÏÏÏÏÏÏÏÏÏÏÏÏÏÏÏÏÏÏÏÏÏÏÏÏÏÏÏÏÏÏÏÏÏÏ January 16 14.25 Ì
The remaining 50% ownership interest in Town East Mall ÏÏ March 1 44.5 Ì
Four Seasons Town Centre ÏÏÏÏÏÏÏÏÏÏÏÏÏÏÏÏÏÏÏÏÏÏÏÏÏÏÏÏ March 5 161.0 $ 134.4
331/3% ownership interest in GGP/Sambil Costa Rica ÏÏÏÏÏÏ April 30 9.7(1) Ì
50% ownership interest in Riverchase Galleria ÏÏÏÏÏÏÏÏÏÏÏÏ May 11 166.0 100.0
Mall of Louisiana ÏÏÏÏÏÏÏÏÏÏÏÏÏÏÏÏÏÏÏÏÏÏÏÏÏÏÏÏÏÏÏÏÏÏÏÏ May 12 265.0 185.0
The Grand Canal Shoppes ÏÏÏÏÏÏÏÏÏÏÏÏÏÏÏÏÏÏÏÏÏÏÏÏÏÏÏÏÏ May 17 766.0 766.0
50% ownership interest in GGP/NIG Brazil ÏÏÏÏÏÏÏÏÏÏÏÏÏÏ July 30 7.0(2) Ì
Stonestown GalleriaÏÏÏÏÏÏÏÏÏÏÏÏÏÏÏÏÏÏÏÏÏÏÏÏÏÏÏÏÏÏÏÏÏÏÏ August 13 312.0 220.0
The Rouse CompanyÏÏÏÏÏÏÏÏÏÏÏÏÏÏÏÏÏÏÏÏÏÏÏÏÏÏÏÏÏÏÏÏÏÏ November 12 14,327.5(3) 5,137.8
$16,083.2 $6,543.2
38
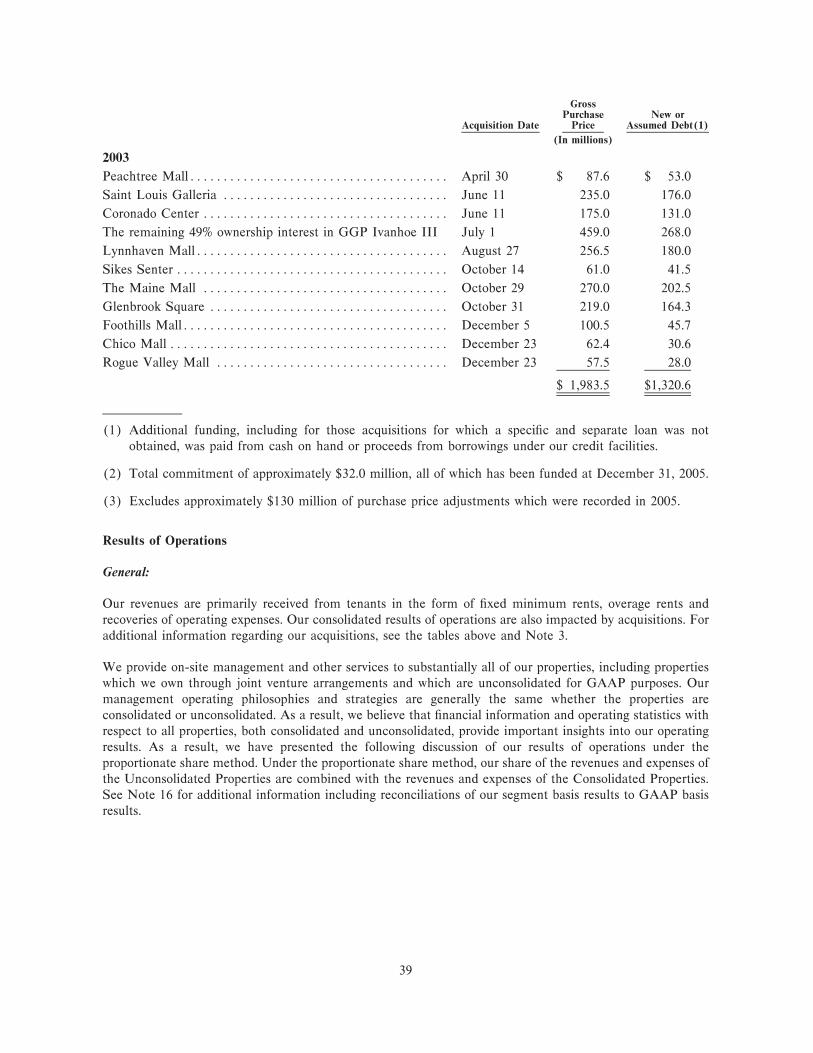
GrossPurchase New or
Acquisition Date Price Assumed Debt(1)
(In millions)
2003
Peachtree MallÏÏÏÏÏÏÏÏÏÏÏÏÏÏÏÏÏÏÏÏÏÏÏÏÏÏÏÏÏÏÏÏÏÏÏÏÏÏÏ April 30 $ 87.6 $ 53.0
Saint Louis Galleria ÏÏÏÏÏÏÏÏÏÏÏÏÏÏÏÏÏÏÏÏÏÏÏÏÏÏÏÏÏÏÏÏÏÏ June 11 235.0 176.0
Coronado Center ÏÏÏÏÏÏÏÏÏÏÏÏÏÏÏÏÏÏÏÏÏÏÏÏÏÏÏÏÏÏÏÏÏÏÏÏÏ June 11 175.0 131.0
The remaining 49% ownership interest in GGP Ivanhoe III July 1 459.0 268.0
Lynnhaven MallÏÏÏÏÏÏÏÏÏÏÏÏÏÏÏÏÏÏÏÏÏÏÏÏÏÏÏÏÏÏÏÏÏÏÏÏÏÏ August 27 256.5 180.0
Sikes Senter ÏÏÏÏÏÏÏÏÏÏÏÏÏÏÏÏÏÏÏÏÏÏÏÏÏÏÏÏÏÏÏÏÏÏÏÏÏÏÏÏÏ October 14 61.0 41.5
The Maine Mall ÏÏÏÏÏÏÏÏÏÏÏÏÏÏÏÏÏÏÏÏÏÏÏÏÏÏÏÏÏÏÏÏÏÏÏÏÏ October 29 270.0 202.5
Glenbrook Square ÏÏÏÏÏÏÏÏÏÏÏÏÏÏÏÏÏÏÏÏÏÏÏÏÏÏÏÏÏÏÏÏÏÏÏÏ October 31 219.0 164.3
Foothills MallÏÏÏÏÏÏÏÏÏÏÏÏÏÏÏÏÏÏÏÏÏÏÏÏÏÏÏÏÏÏÏÏÏÏÏÏÏÏÏÏ December 5 100.5 45.7
Chico Mall ÏÏÏÏÏÏÏÏÏÏÏÏÏÏÏÏÏÏÏÏÏÏÏÏÏÏÏÏÏÏÏÏÏÏÏÏÏÏÏÏÏÏ December 23 62.4 30.6
Rogue Valley Mall ÏÏÏÏÏÏÏÏÏÏÏÏÏÏÏÏÏÏÏÏÏÏÏÏÏÏÏÏÏÏÏÏÏÏÏ December 23 57.5 28.0
$ 1,983.5 $1,320.6
(1) Additional funding, including for those acquisitions for which a speciÑc and separate loan was notobtained, was paid from cash on hand or proceeds from borrowings under our credit facilities.
(2) Total commitment of approximately $32.0 million, all of which has been funded at December 31, 2005.
(3) Excludes approximately $130 million of purchase price adjustments which were recorded in 2005.
Results of Operations
General:
Our revenues are primarily received from tenants in the form of Ñxed minimum rents, overage rents andrecoveries of operating expenses. Our consolidated results of operations are also impacted by acquisitions. Foradditional information regarding our acquisitions, see the tables above and Note 3.
We provide on-site management and other services to substantially all of our properties, including propertieswhich we own through joint venture arrangements and which are unconsolidated for GAAP purposes. Ourmanagement operating philosophies and strategies are generally the same whether the properties areconsolidated or unconsolidated. As a result, we believe that Ñnancial information and operating statistics withrespect to all properties, both consolidated and unconsolidated, provide important insights into our operatingresults. As a result, we have presented the following discussion of our results of operations under theproportionate share method. Under the proportionate share method, our share of the revenues and expenses ofthe Unconsolidated Properties are combined with the revenues and expenses of the Consolidated Properties.See Note 16 for additional information including reconciliations of our segment basis results to GAAP basisresults.
39
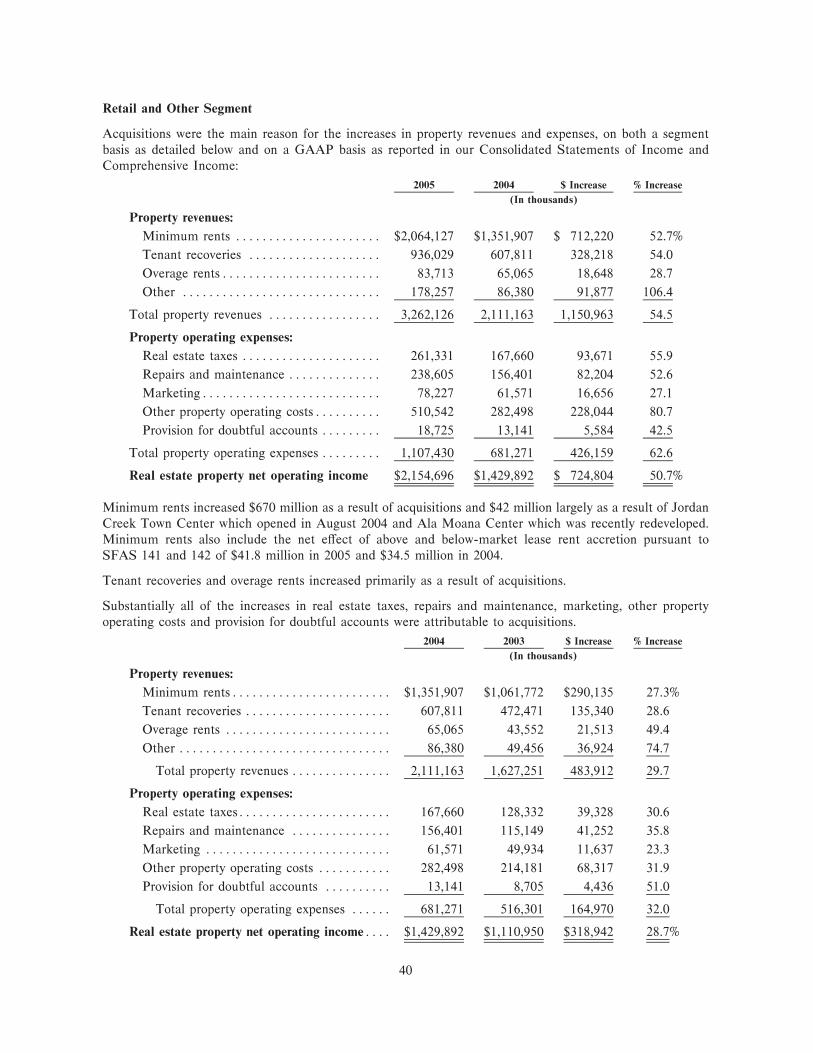
Retail and Other Segment
Acquisitions were the main reason for the increases in property revenues and expenses, on both a segmentbasis as detailed below and on a GAAP basis as reported in our Consolidated Statements of Income andComprehensive Income:
2005 2004 $ Increase % Increase
(In thousands)
Property revenues:
Minimum rents ÏÏÏÏÏÏÏÏÏÏÏÏÏÏÏÏÏÏÏÏÏÏ $2,064,127 $1,351,907 $ 712,220 52.7%
Tenant recoveries ÏÏÏÏÏÏÏÏÏÏÏÏÏÏÏÏÏÏÏÏ 936,029 607,811 328,218 54.0
Overage rentsÏÏÏÏÏÏÏÏÏÏÏÏÏÏÏÏÏÏÏÏÏÏÏÏ 83,713 65,065 18,648 28.7
Other ÏÏÏÏÏÏÏÏÏÏÏÏÏÏÏÏÏÏÏÏÏÏÏÏÏÏÏÏÏÏ 178,257 86,380 91,877 106.4
Total property revenues ÏÏÏÏÏÏÏÏÏÏÏÏÏÏÏÏÏ 3,262,126 2,111,163 1,150,963 54.5
Property operating expenses:
Real estate taxes ÏÏÏÏÏÏÏÏÏÏÏÏÏÏÏÏÏÏÏÏÏ 261,331 167,660 93,671 55.9
Repairs and maintenance ÏÏÏÏÏÏÏÏÏÏÏÏÏÏ 238,605 156,401 82,204 52.6
MarketingÏÏÏÏÏÏÏÏÏÏÏÏÏÏÏÏÏÏÏÏÏÏÏÏÏÏÏ 78,227 61,571 16,656 27.1
Other property operating costsÏÏÏÏÏÏÏÏÏÏ 510,542 282,498 228,044 80.7
Provision for doubtful accounts ÏÏÏÏÏÏÏÏÏ 18,725 13,141 5,584 42.5
Total property operating expenses ÏÏÏÏÏÏÏÏÏ 1,107,430 681,271 426,159 62.6
Real estate property net operating income $2,154,696 $1,429,892 $ 724,804 50.7%
Minimum rents increased $670 million as a result of acquisitions and $42 million largely as a result of JordanCreek Town Center which opened in August 2004 and Ala Moana Center which was recently redeveloped.Minimum rents also include the net eÅect of above and below-market lease rent accretion pursuant toSFAS 141 and 142 of $41.8 million in 2005 and $34.5 million in 2004.
Tenant recoveries and overage rents increased primarily as a result of acquisitions.
Substantially all of the increases in real estate taxes, repairs and maintenance, marketing, other propertyoperating costs and provision for doubtful accounts were attributable to acquisitions.
2004 2003 $ Increase % Increase
(In thousands)
Property revenues:
Minimum rentsÏÏÏÏÏÏÏÏÏÏÏÏÏÏÏÏÏÏÏÏÏÏÏÏ $1,351,907 $1,061,772 $290,135 27.3%
Tenant recoveries ÏÏÏÏÏÏÏÏÏÏÏÏÏÏÏÏÏÏÏÏÏÏ 607,811 472,471 135,340 28.6
Overage rents ÏÏÏÏÏÏÏÏÏÏÏÏÏÏÏÏÏÏÏÏÏÏÏÏÏ 65,065 43,552 21,513 49.4
Other ÏÏÏÏÏÏÏÏÏÏÏÏÏÏÏÏÏÏÏÏÏÏÏÏÏÏÏÏÏÏÏÏ 86,380 49,456 36,924 74.7
Total property revenues ÏÏÏÏÏÏÏÏÏÏÏÏÏÏÏ 2,111,163 1,627,251 483,912 29.7
Property operating expenses:
Real estate taxesÏÏÏÏÏÏÏÏÏÏÏÏÏÏÏÏÏÏÏÏÏÏÏ 167,660 128,332 39,328 30.6
Repairs and maintenance ÏÏÏÏÏÏÏÏÏÏÏÏÏÏÏ 156,401 115,149 41,252 35.8
Marketing ÏÏÏÏÏÏÏÏÏÏÏÏÏÏÏÏÏÏÏÏÏÏÏÏÏÏÏÏ 61,571 49,934 11,637 23.3
Other property operating costs ÏÏÏÏÏÏÏÏÏÏÏ 282,498 214,181 68,317 31.9
Provision for doubtful accounts ÏÏÏÏÏÏÏÏÏÏ 13,141 8,705 4,436 51.0
Total property operating expenses ÏÏÏÏÏÏ 681,271 516,301 164,970 32.0
Real estate property net operating incomeÏÏÏÏ $1,429,892 $1,110,950 $318,942 28.7%
40
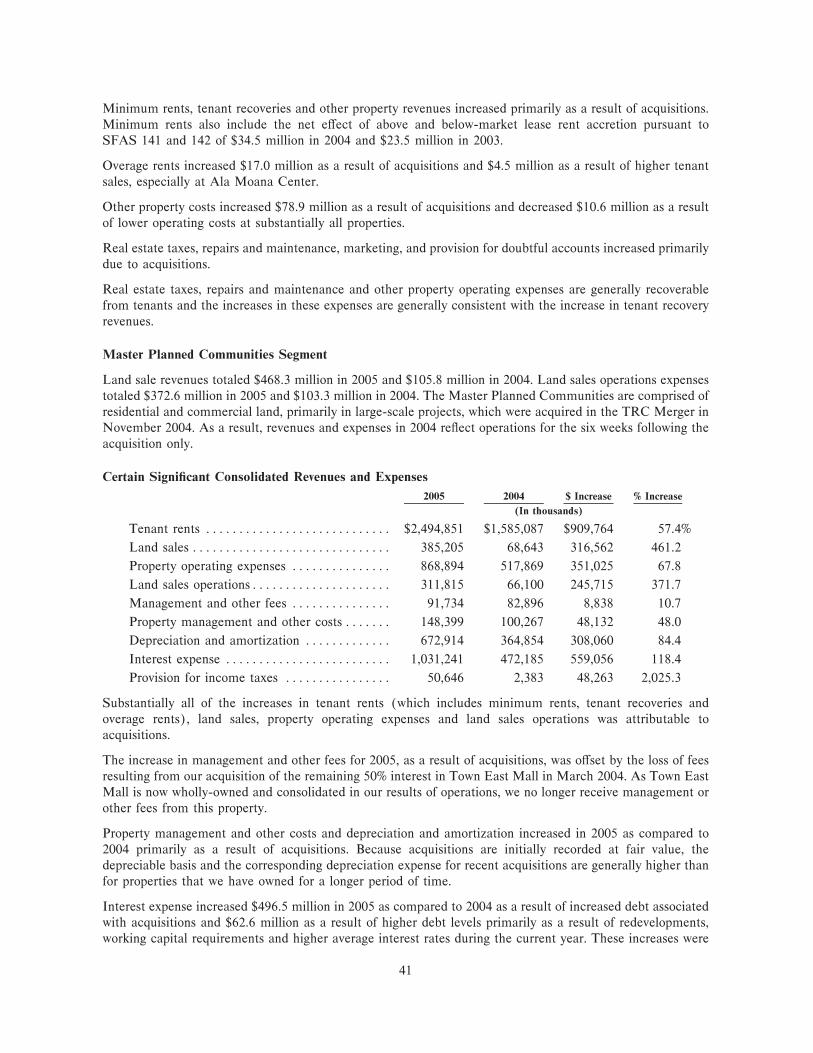
Minimum rents, tenant recoveries and other property revenues increased primarily as a result of acquisitions.Minimum rents also include the net eÅect of above and below-market lease rent accretion pursuant toSFAS 141 and 142 of $34.5 million in 2004 and $23.5 million in 2003.
Overage rents increased $17.0 million as a result of acquisitions and $4.5 million as a result of higher tenantsales, especially at Ala Moana Center.
Other property costs increased $78.9 million as a result of acquisitions and decreased $10.6 million as a resultof lower operating costs at substantially all properties.
Real estate taxes, repairs and maintenance, marketing, and provision for doubtful accounts increased primarilydue to acquisitions.
Real estate taxes, repairs and maintenance and other property operating expenses are generally recoverablefrom tenants and the increases in these expenses are generally consistent with the increase in tenant recoveryrevenues.
Master Planned Communities Segment
Land sale revenues totaled $468.3 million in 2005 and $105.8 million in 2004. Land sales operations expensestotaled $372.6 million in 2005 and $103.3 million in 2004. The Master Planned Communities are comprised ofresidential and commercial land, primarily in large-scale projects, which were acquired in the TRC Merger inNovember 2004. As a result, revenues and expenses in 2004 reÖect operations for the six weeks following theacquisition only.
Certain SigniÑcant Consolidated Revenues and Expenses
2005 2004 $ Increase % Increase
(In thousands)
Tenant rents ÏÏÏÏÏÏÏÏÏÏÏÏÏÏÏÏÏÏÏÏÏÏÏÏÏÏÏÏ $2,494,851 $1,585,087 $909,764 57.4%
Land sales ÏÏÏÏÏÏÏÏÏÏÏÏÏÏÏÏÏÏÏÏÏÏÏÏÏÏÏÏÏÏ 385,205 68,643 316,562 461.2
Property operating expenses ÏÏÏÏÏÏÏÏÏÏÏÏÏÏÏ 868,894 517,869 351,025 67.8
Land sales operationsÏÏÏÏÏÏÏÏÏÏÏÏÏÏÏÏÏÏÏÏÏ 311,815 66,100 245,715 371.7
Management and other fees ÏÏÏÏÏÏÏÏÏÏÏÏÏÏÏ 91,734 82,896 8,838 10.7
Property management and other costs ÏÏÏÏÏÏÏ 148,399 100,267 48,132 48.0
Depreciation and amortization ÏÏÏÏÏÏÏÏÏÏÏÏÏ 672,914 364,854 308,060 84.4
Interest expense ÏÏÏÏÏÏÏÏÏÏÏÏÏÏÏÏÏÏÏÏÏÏÏÏÏ 1,031,241 472,185 559,056 118.4
Provision for income taxes ÏÏÏÏÏÏÏÏÏÏÏÏÏÏÏÏ 50,646 2,383 48,263 2,025.3
Substantially all of the increases in tenant rents (which includes minimum rents, tenant recoveries andoverage rents), land sales, property operating expenses and land sales operations was attributable toacquisitions.
The increase in management and other fees for 2005, as a result of acquisitions, was oÅset by the loss of feesresulting from our acquisition of the remaining 50% interest in Town East Mall in March 2004. As Town EastMall is now wholly-owned and consolidated in our results of operations, we no longer receive management orother fees from this property.
Property management and other costs and depreciation and amortization increased in 2005 as compared to2004 primarily as a result of acquisitions. Because acquisitions are initially recorded at fair value, thedepreciable basis and the corresponding depreciation expense for recent acquisitions are generally higher thanfor properties that we have owned for a longer period of time.
Interest expense increased $496.5 million in 2005 as compared to 2004 as a result of increased debt associatedwith acquisitions and $62.6 million as a result of higher debt levels primarily as a result of redevelopments,working capital requirements and higher average interest rates during the current year. These increases were
41
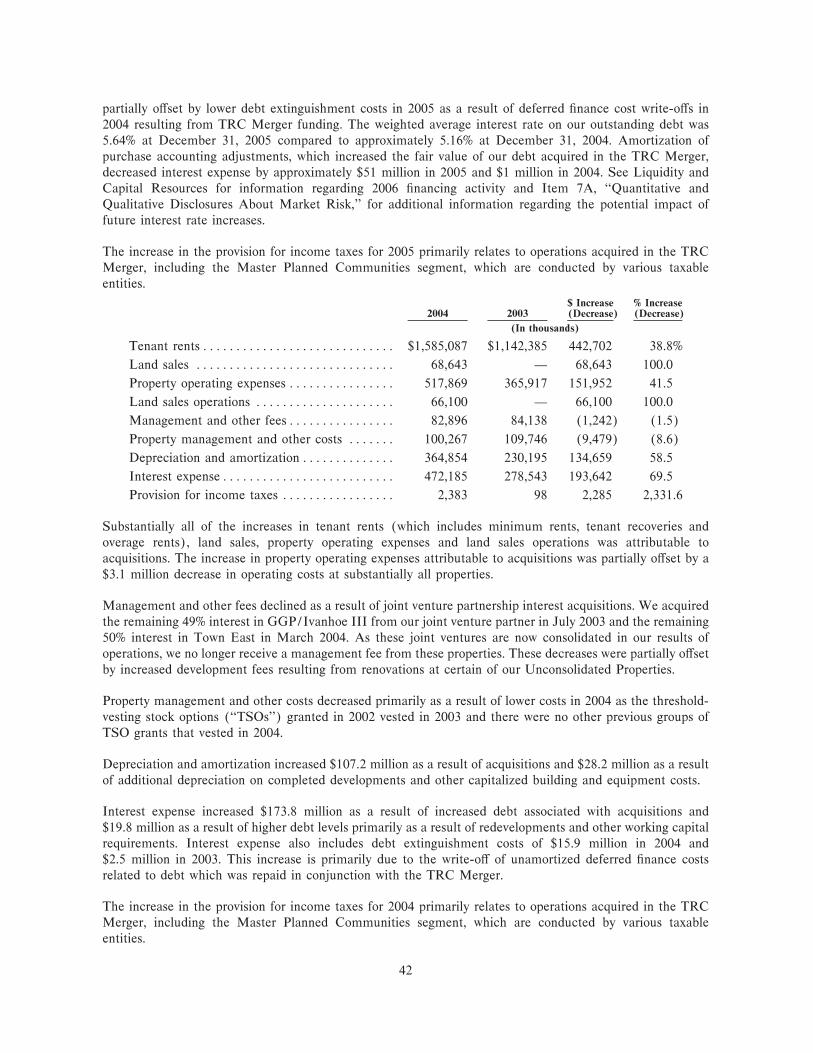
partially oÅset by lower debt extinguishment costs in 2005 as a result of deferred Ñnance cost write-oÅs in2004 resulting from TRC Merger funding. The weighted average interest rate on our outstanding debt was5.64% at December 31, 2005 compared to approximately 5.16% at December 31, 2004. Amortization ofpurchase accounting adjustments, which increased the fair value of our debt acquired in the TRC Merger,decreased interest expense by approximately $51 million in 2005 and $1 million in 2004. See Liquidity andCapital Resources for information regarding 2006 Ñnancing activity and Item 7A, ""Quantitative andQualitative Disclosures About Market Risk,'' for additional information regarding the potential impact offuture interest rate increases.
The increase in the provision for income taxes for 2005 primarily relates to operations acquired in the TRCMerger, including the Master Planned Communities segment, which are conducted by various taxableentities.
$ Increase % Increase2004 2003 (Decrease) (Decrease)
(In thousands)
Tenant rents ÏÏÏÏÏÏÏÏÏÏÏÏÏÏÏÏÏÏÏÏÏÏÏÏÏÏÏÏÏ $1,585,087 $1,142,385 442,702 38.8%
Land sales ÏÏÏÏÏÏÏÏÏÏÏÏÏÏÏÏÏÏÏÏÏÏÏÏÏÏÏÏÏÏ 68,643 Ì 68,643 100.0
Property operating expenses ÏÏÏÏÏÏÏÏÏÏÏÏÏÏÏÏ 517,869 365,917 151,952 41.5
Land sales operations ÏÏÏÏÏÏÏÏÏÏÏÏÏÏÏÏÏÏÏÏÏ 66,100 Ì 66,100 100.0
Management and other feesÏÏÏÏÏÏÏÏÏÏÏÏÏÏÏÏ 82,896 84,138 (1,242) (1.5)
Property management and other costs ÏÏÏÏÏÏÏ 100,267 109,746 (9,479) (8.6)
Depreciation and amortizationÏÏÏÏÏÏÏÏÏÏÏÏÏÏ 364,854 230,195 134,659 58.5
Interest expenseÏÏÏÏÏÏÏÏÏÏÏÏÏÏÏÏÏÏÏÏÏÏÏÏÏÏ 472,185 278,543 193,642 69.5
Provision for income taxes ÏÏÏÏÏÏÏÏÏÏÏÏÏÏÏÏÏ 2,383 98 2,285 2,331.6
Substantially all of the increases in tenant rents (which includes minimum rents, tenant recoveries andoverage rents), land sales, property operating expenses and land sales operations was attributable toacquisitions. The increase in property operating expenses attributable to acquisitions was partially oÅset by a$3.1 million decrease in operating costs at substantially all properties.
Management and other fees declined as a result of joint venture partnership interest acquisitions. We acquiredthe remaining 49% interest in GGP/Ivanhoe III from our joint venture partner in July 2003 and the remaining50% interest in Town East in March 2004. As these joint ventures are now consolidated in our results ofoperations, we no longer receive a management fee from these properties. These decreases were partially oÅsetby increased development fees resulting from renovations at certain of our Unconsolidated Properties.
Property management and other costs decreased primarily as a result of lower costs in 2004 as the threshold-vesting stock options (""TSOs'') granted in 2002 vested in 2003 and there were no other previous groups ofTSO grants that vested in 2004.
Depreciation and amortization increased $107.2 million as a result of acquisitions and $28.2 million as a resultof additional depreciation on completed developments and other capitalized building and equipment costs.
Interest expense increased $173.8 million as a result of increased debt associated with acquisitions and$19.8 million as a result of higher debt levels primarily as a result of redevelopments and other working capitalrequirements. Interest expense also includes debt extinguishment costs of $15.9 million in 2004 and$2.5 million in 2003. This increase is primarily due to the write-oÅ of unamortized deferred Ñnance costsrelated to debt which was repaid in conjunction with the TRC Merger.
The increase in the provision for income taxes for 2004 primarily relates to operations acquired in the TRCMerger, including the Master Planned Communities segment, which are conducted by various taxableentities.
42

Liquidity and Capital Resources
Our primary uses and sources of our consolidated cash are as follows:
Uses Sources
Short-term liquidity and capital needs such as:
‚ Tenant construction allowances ‚ Operating cash Öow, including the distributions‚ Minor improvements made to individual of our share of cash Öow produced by our
properties that are not recoverable through Unconsolidated Real Estate AÇliatescommon area maintenance charges to tenants ‚ Land sales from the Master Planned
‚ Dividend payments Communities segment‚ Debt repayment requirements, including both ‚ Borrowings under revolving credit facilities
principal and interest‚ Stock repurchases‚ Corporate and administrative expenses
Longer-term liquidity needs such as:
‚ Acquisitions ‚ Secured loans collateralized by individual‚ New development, including our master planned properties
communities ‚ Unsecured loans at either a venture or company‚ Major redevelopment, renovation or expansion level
programs at individual properties ‚ Construction loans‚ Debt repayment requirements, including both ‚ Mini-permanent loans
principal and interest ‚ Long-term project Ñnancing‚ Purchase of Anchor stores available as a result of ‚ Joint venture Ñnancing with institutional partners
consolidations, including the Federated/May ‚ Equity securitiesmerger* ‚ Asset sales, including the sale of certain oÇce
‚ Income tax liabilities and industrial property acquired in the TRCMerger
* In August 2005, Federated Department Stores, Inc. completed its merger with May Department StoresCompany. In July and October, Federated announced planned store closings which included 15 of ourAnchor stores. We may purchase some of these stores. In addition, in 2006, we acquired six Mervyn'sanchor locations for an aggregate purchase price of approximately $76 million.
Cash Flows from Operating Activities
Net cash provided by operating activities was $842.0 million in 2005, $719.4 million in 2004 and $585.7 mil-lion in 2003. Substantially all of the increases were attributable to acquisitions.
Cash Flows from Investing Activities
Net cash used in investing activities was $159.6 million in 2005, $9.0 billion in 2004 and $1.8 billion in 2003.Substantially all of the changes were attributable to acquisitions, including the TRC Merger in 2004.
As of December 31, 2005, we had 22 major approved redevelopment projects underway (each with budgetedprojected expenditures, at our ownership share, in excess of $10 million). Total projected expenditures(including our share of the Unconsolidated Real Estate AÇliates) for the 22 redevelopment projects and thesix new retail center development projects that are under construction were approximately $2.0 billion as ofDecember 31, 2005. Such development and redevelopment expenditures, together with expenditures for11 other potential new retail or mixed-use developments, are expected to result in approximately $450 to$800 million of expenditures per year for the years 2006 to 2009.
Cash Flows from Financing Activities
Net cash (used in) provided by Ñnancing activities was ($619.2) million in 2005, $8.3 billion in 2004 and$1.1 billion in 2003.
43
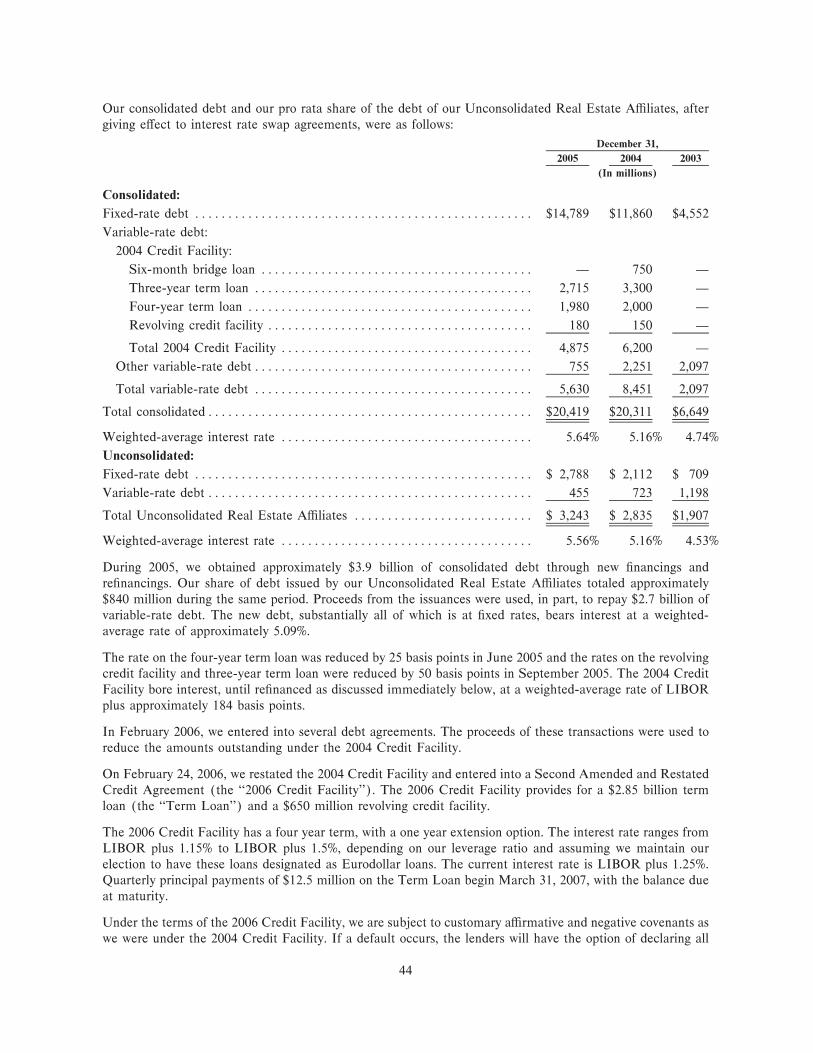
Our consolidated debt and our pro rata share of the debt of our Unconsolidated Real Estate AÇliates, aftergiving eÅect to interest rate swap agreements, were as follows:
December 31,
2005 2004 2003
(In millions)
Consolidated:
Fixed-rate debt ÏÏÏÏÏÏÏÏÏÏÏÏÏÏÏÏÏÏÏÏÏÏÏÏÏÏÏÏÏÏÏÏÏÏÏÏÏÏÏÏÏÏÏÏÏÏÏÏÏÏÏ $14,789 $11,860 $4,552
Variable-rate debt:
2004 Credit Facility:
Six-month bridge loan ÏÏÏÏÏÏÏÏÏÏÏÏÏÏÏÏÏÏÏÏÏÏÏÏÏÏÏÏÏÏÏÏÏÏÏÏÏÏÏÏÏ Ì 750 Ì
Three-year term loan ÏÏÏÏÏÏÏÏÏÏÏÏÏÏÏÏÏÏÏÏÏÏÏÏÏÏÏÏÏÏÏÏÏÏÏÏÏÏÏÏÏÏ 2,715 3,300 Ì
Four-year term loan ÏÏÏÏÏÏÏÏÏÏÏÏÏÏÏÏÏÏÏÏÏÏÏÏÏÏÏÏÏÏÏÏÏÏÏÏÏÏÏÏÏÏÏ 1,980 2,000 Ì
Revolving credit facility ÏÏÏÏÏÏÏÏÏÏÏÏÏÏÏÏÏÏÏÏÏÏÏÏÏÏÏÏÏÏÏÏÏÏÏÏÏÏÏÏ 180 150 Ì
Total 2004 Credit Facility ÏÏÏÏÏÏÏÏÏÏÏÏÏÏÏÏÏÏÏÏÏÏÏÏÏÏÏÏÏÏÏÏÏÏÏÏÏÏ 4,875 6,200 Ì
Other variable-rate debt ÏÏÏÏÏÏÏÏÏÏÏÏÏÏÏÏÏÏÏÏÏÏÏÏÏÏÏÏÏÏÏÏÏÏÏÏÏÏÏÏÏÏ 755 2,251 2,097
Total variable-rate debt ÏÏÏÏÏÏÏÏÏÏÏÏÏÏÏÏÏÏÏÏÏÏÏÏÏÏÏÏÏÏÏÏÏÏÏÏÏÏÏÏÏÏ 5,630 8,451 2,097
Total consolidatedÏÏÏÏÏÏÏÏÏÏÏÏÏÏÏÏÏÏÏÏÏÏÏÏÏÏÏÏÏÏÏÏÏÏÏÏÏÏÏÏÏÏÏÏÏÏÏÏÏ $20,419 $20,311 $6,649
Weighted-average interest rate ÏÏÏÏÏÏÏÏÏÏÏÏÏÏÏÏÏÏÏÏÏÏÏÏÏÏÏÏÏÏÏÏÏÏÏÏÏÏ 5.64% 5.16% 4.74%
Unconsolidated:
Fixed-rate debt ÏÏÏÏÏÏÏÏÏÏÏÏÏÏÏÏÏÏÏÏÏÏÏÏÏÏÏÏÏÏÏÏÏÏÏÏÏÏÏÏÏÏÏÏÏÏÏÏÏÏÏ $ 2,788 $ 2,112 $ 709
Variable-rate debt ÏÏÏÏÏÏÏÏÏÏÏÏÏÏÏÏÏÏÏÏÏÏÏÏÏÏÏÏÏÏÏÏÏÏÏÏÏÏÏÏÏÏÏÏÏÏÏÏÏ 455 723 1,198
Total Unconsolidated Real Estate AÇliates ÏÏÏÏÏÏÏÏÏÏÏÏÏÏÏÏÏÏÏÏÏÏÏÏÏÏÏ $ 3,243 $ 2,835 $1,907
Weighted-average interest rate ÏÏÏÏÏÏÏÏÏÏÏÏÏÏÏÏÏÏÏÏÏÏÏÏÏÏÏÏÏÏÏÏÏÏÏÏÏÏ 5.56% 5.16% 4.53%
During 2005, we obtained approximately $3.9 billion of consolidated debt through new Ñnancings andreÑnancings. Our share of debt issued by our Unconsolidated Real Estate AÇliates totaled approximately$840 million during the same period. Proceeds from the issuances were used, in part, to repay $2.7 billion ofvariable-rate debt. The new debt, substantially all of which is at Ñxed rates, bears interest at a weighted-average rate of approximately 5.09%.
The rate on the four-year term loan was reduced by 25 basis points in June 2005 and the rates on the revolvingcredit facility and three-year term loan were reduced by 50 basis points in September 2005. The 2004 CreditFacility bore interest, until reÑnanced as discussed immediately below, at a weighted-average rate of LIBORplus approximately 184 basis points.
In February 2006, we entered into several debt agreements. The proceeds of these transactions were used toreduce the amounts outstanding under the 2004 Credit Facility.
On February 24, 2006, we restated the 2004 Credit Facility and entered into a Second Amended and RestatedCredit Agreement (the ""2006 Credit Facility''). The 2006 Credit Facility provides for a $2.85 billion termloan (the ""Term Loan'') and a $650 million revolving credit facility.
The 2006 Credit Facility has a four year term, with a one year extension option. The interest rate ranges fromLIBOR plus 1.15% to LIBOR plus 1.5%, depending on our leverage ratio and assuming we maintain ourelection to have these loans designated as Eurodollar loans. The current interest rate is LIBOR plus 1.25%.Quarterly principal payments of $12.5 million on the Term Loan begin March 31, 2007, with the balance dueat maturity.
Under the terms of the 2006 Credit Facility, we are subject to customary aÇrmative and negative covenants aswe were under the 2004 Credit Facility. If a default occurs, the lenders will have the option of declaring all
44
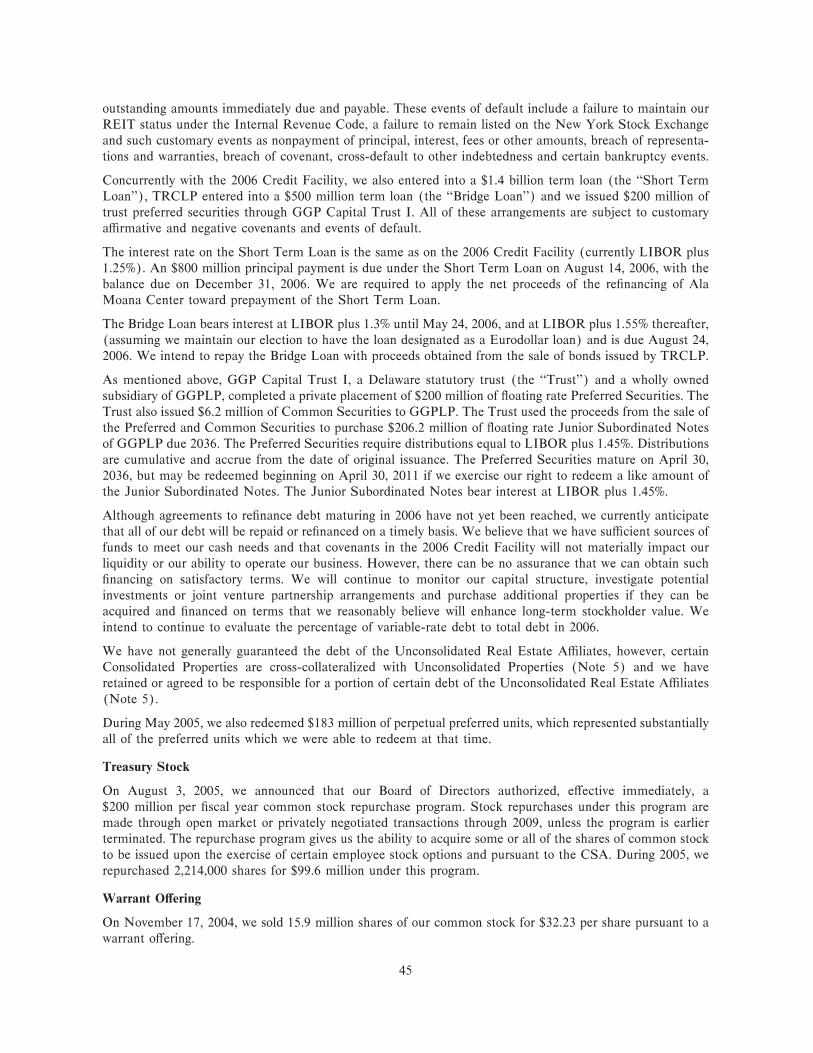
outstanding amounts immediately due and payable. These events of default include a failure to maintain ourREIT status under the Internal Revenue Code, a failure to remain listed on the New York Stock Exchangeand such customary events as nonpayment of principal, interest, fees or other amounts, breach of representa-tions and warranties, breach of covenant, cross-default to other indebtedness and certain bankruptcy events.
Concurrently with the 2006 Credit Facility, we also entered into a $1.4 billion term loan (the ""Short TermLoan''), TRCLP entered into a $500 million term loan (the ""Bridge Loan'') and we issued $200 million oftrust preferred securities through GGP Capital Trust I. All of these arrangements are subject to customaryaÇrmative and negative covenants and events of default.
The interest rate on the Short Term Loan is the same as on the 2006 Credit Facility (currently LIBOR plus1.25%). An $800 million principal payment is due under the Short Term Loan on August 14, 2006, with thebalance due on December 31, 2006. We are required to apply the net proceeds of the reÑnancing of AlaMoana Center toward prepayment of the Short Term Loan.
The Bridge Loan bears interest at LIBOR plus 1.3% until May 24, 2006, and at LIBOR plus 1.55% thereafter,(assuming we maintain our election to have the loan designated as a Eurodollar loan) and is due August 24,2006. We intend to repay the Bridge Loan with proceeds obtained from the sale of bonds issued by TRCLP.
As mentioned above, GGP Capital Trust I, a Delaware statutory trust (the ""Trust'') and a wholly ownedsubsidiary of GGPLP, completed a private placement of $200 million of Öoating rate Preferred Securities. TheTrust also issued $6.2 million of Common Securities to GGPLP. The Trust used the proceeds from the sale ofthe Preferred and Common Securities to purchase $206.2 million of Öoating rate Junior Subordinated Notesof GGPLP due 2036. The Preferred Securities require distributions equal to LIBOR plus 1.45%. Distributionsare cumulative and accrue from the date of original issuance. The Preferred Securities mature on April 30,2036, but may be redeemed beginning on April 30, 2011 if we exercise our right to redeem a like amount ofthe Junior Subordinated Notes. The Junior Subordinated Notes bear interest at LIBOR plus 1.45%.
Although agreements to reÑnance debt maturing in 2006 have not yet been reached, we currently anticipatethat all of our debt will be repaid or reÑnanced on a timely basis. We believe that we have suÇcient sources offunds to meet our cash needs and that covenants in the 2006 Credit Facility will not materially impact ourliquidity or our ability to operate our business. However, there can be no assurance that we can obtain suchÑnancing on satisfactory terms. We will continue to monitor our capital structure, investigate potentialinvestments or joint venture partnership arrangements and purchase additional properties if they can beacquired and Ñnanced on terms that we reasonably believe will enhance long-term stockholder value. Weintend to continue to evaluate the percentage of variable-rate debt to total debt in 2006.
We have not generally guaranteed the debt of the Unconsolidated Real Estate AÇliates, however, certainConsolidated Properties are cross-collateralized with Unconsolidated Properties (Note 5) and we haveretained or agreed to be responsible for a portion of certain debt of the Unconsolidated Real Estate AÇliates(Note 5).
During May 2005, we also redeemed $183 million of perpetual preferred units, which represented substantiallyall of the preferred units which we were able to redeem at that time.
Treasury Stock
On August 3, 2005, we announced that our Board of Directors authorized, eÅective immediately, a$200 million per Ñscal year common stock repurchase program. Stock repurchases under this program aremade through open market or privately negotiated transactions through 2009, unless the program is earlierterminated. The repurchase program gives us the ability to acquire some or all of the shares of common stockto be issued upon the exercise of certain employee stock options and pursuant to the CSA. During 2005, werepurchased 2,214,000 shares for $99.6 million under this program.
Warrant OÅering
On November 17, 2004, we sold 15.9 million shares of our common stock for $32.23 per share pursuant to awarrant oÅering.
45
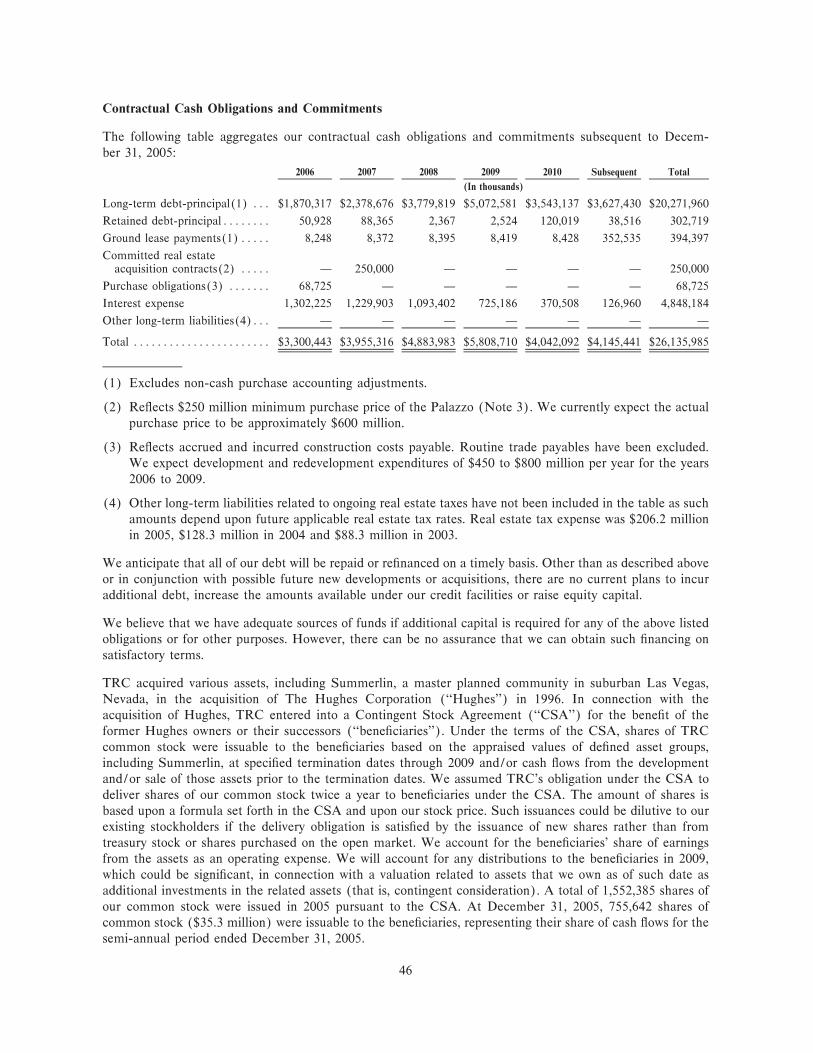
Contractual Cash Obligations and Commitments
The following table aggregates our contractual cash obligations and commitments subsequent to Decem-ber 31, 2005:
2006 2007 2008 2009 2010 Subsequent Total
(In thousands)
Long-term debt-principal(1) ÏÏÏ $1,870,317 $2,378,676 $3,779,819 $5,072,581 $3,543,137 $3,627,430 $20,271,960
Retained debt-principalÏÏÏÏÏÏÏÏ 50,928 88,365 2,367 2,524 120,019 38,516 302,719
Ground lease payments(1)ÏÏÏÏÏ 8,248 8,372 8,395 8,419 8,428 352,535 394,397
Committed real estateacquisition contracts(2) ÏÏÏÏÏ Ì 250,000 Ì Ì Ì Ì 250,000
Purchase obligations(3) ÏÏÏÏÏÏÏ 68,725 Ì Ì Ì Ì Ì 68,725
Interest expense 1,302,225 1,229,903 1,093,402 725,186 370,508 126,960 4,848,184
Other long-term liabilities(4)ÏÏÏ Ì Ì Ì Ì Ì Ì Ì
Total ÏÏÏÏÏÏÏÏÏÏÏÏÏÏÏÏÏÏÏÏÏÏÏ $3,300,443 $3,955,316 $4,883,983 $5,808,710 $4,042,092 $4,145,441 $26,135,985
(1) Excludes non-cash purchase accounting adjustments.
(2) ReÖects $250 million minimum purchase price of the Palazzo (Note 3). We currently expect the actualpurchase price to be approximately $600 million.
(3) ReÖects accrued and incurred construction costs payable. Routine trade payables have been excluded.We expect development and redevelopment expenditures of $450 to $800 million per year for the years2006 to 2009.
(4) Other long-term liabilities related to ongoing real estate taxes have not been included in the table as suchamounts depend upon future applicable real estate tax rates. Real estate tax expense was $206.2 millionin 2005, $128.3 million in 2004 and $88.3 million in 2003.
We anticipate that all of our debt will be repaid or reÑnanced on a timely basis. Other than as described aboveor in conjunction with possible future new developments or acquisitions, there are no current plans to incuradditional debt, increase the amounts available under our credit facilities or raise equity capital.
We believe that we have adequate sources of funds if additional capital is required for any of the above listedobligations or for other purposes. However, there can be no assurance that we can obtain such Ñnancing onsatisfactory terms.
TRC acquired various assets, including Summerlin, a master planned community in suburban Las Vegas,Nevada, in the acquisition of The Hughes Corporation (""Hughes'') in 1996. In connection with theacquisition of Hughes, TRC entered into a Contingent Stock Agreement (""CSA'') for the beneÑt of theformer Hughes owners or their successors (""beneÑciaries''). Under the terms of the CSA, shares of TRCcommon stock were issuable to the beneÑciaries based on the appraised values of deÑned asset groups,including Summerlin, at speciÑed termination dates through 2009 and/or cash Öows from the developmentand/or sale of those assets prior to the termination dates. We assumed TRC's obligation under the CSA todeliver shares of our common stock twice a year to beneÑciaries under the CSA. The amount of shares isbased upon a formula set forth in the CSA and upon our stock price. Such issuances could be dilutive to ourexisting stockholders if the delivery obligation is satisÑed by the issuance of new shares rather than fromtreasury stock or shares purchased on the open market. We account for the beneÑciaries' share of earningsfrom the assets as an operating expense. We will account for any distributions to the beneÑciaries in 2009,which could be signiÑcant, in connection with a valuation related to assets that we own as of such date asadditional investments in the related assets (that is, contingent consideration). A total of 1,552,385 shares ofour common stock were issued in 2005 pursuant to the CSA. At December 31, 2005, 755,642 shares ofcommon stock ($35.3 million) were issuable to the beneÑciaries, representing their share of cash Öows for thesemi-annual period ended December 31, 2005.
46
OÅ-Balance Sheet Financing Arrangements
We do not have any oÅ-balance sheet Ñnancing arrangements.
REIT Requirements
In order to remain taxed as a real estate investment trust for federal income tax purposes, we must distributeor pay tax on 100% of our capital gains and at least 90% of our ordinary taxable income to stockholders. Thefollowing factors, among others, will aÅect operating cash Öow and, accordingly, inÖuence the decisions of theBoard of Directors regarding distributions:
‚ Scheduled increases in base rents of existing leases
‚ Changes in minimum base rents and/or overage rents attributable to replacement of existing leases withnew or renewal leases
‚ Changes in occupancy rates at existing centers and procurement of leases for newly developed centers
‚ Necessary capital improvement expenditures or debt repayments at existing properties
‚ Our share of distributions of operating cash Öow generated by the Unconsolidated Real Estate AÇliates,less management costs and debt service on additional loans that have been or will be incurred
‚ Anticipated proceeds from sales in our Master Planned Communities segment
We anticipate that our operating cash Öow and potential new debt or equity will provide adequate liquidity toconduct our operations, fund general and administrative expenses, fund operating costs and interest paymentsand allow distributions to our stockholders in accordance with the requirements of the Code.
Recently Issued Accounting Pronouncements and Developments
As described in Note 15, new accounting pronouncements have been issued which are eÅective for the currentor subsequent year. We do not expect a signiÑcant impact on our Ñnancial statements due to the application ofthese new pronouncements.
InÖation
InÖation has been relatively low in recent years and has not had a signiÑcant detrimental impact on us. ShouldinÖation rates increase in the future, substantially all of our tenant leases contain provisions designed topartially mitigate the negative impact of inÖation. Such provisions include clauses enabling us to receiveoverage rents based on tenants' gross sales, which generally increase as prices rise, and/or escalation clauses,which generally increase rental rates during the terms of the leases. In addition, many of the leases expire eachyear which may enable us to replace or renew such expiring leases with new leases at higher base and/oroverage rents, if rents under the expiring leases are below the then-existing market rates. Finally, many of theexisting leases require the tenants to pay amounts related to all, or substantially all, of their share of certainoperating expenses, including common area maintenance, real estate taxes and insurance, thereby partiallyreducing our exposure to increases in costs and operating expenses resulting from inÖation. In general, theseamounts either vary annually based on actual expenditures or are set on an initial share of costs with provisionsfor annual increases.
InÖation also poses a risk to us due to the probability of future increases in interest rates. Such increases wouldadversely impact us due to our outstanding variable-rate debt which increased substantially as a result of theTRC Merger. We have limited our exposure to interest rate Öuctuations related to a portion of our variable-rate debt by the use of interest rate cap and swap agreements. Finally, subject to current market conditions, wehave a policy of replacing variable-rate debt with Ñxed-rate debt. However, in an increasing interest rateenvironment (which generally follows improved market conditions), the Ñxed rates we can obtain with suchreplacement Ñxed-rate debt will also continue to increase.
47
Forward-Looking Information
We may make forward-looking statements in this Annual Report and in other reports and proxy statementswhich we Ñle with the SEC. In addition, our senior management might make forward-looking statementsorally to analysts, investors, the media and others.
Forward-looking statements include:
‚ Projections of our revenues, income, earnings per share, Funds From Operations, capital expenditures,dividends, capital structure or other Ñnancial items
‚ Descriptions of plans or objectives of our management for future operations, including pendingacquisitions
‚ Forecasts of our future economic performance
‚ Descriptions of assumptions underlying or relating to any of the foregoing
In this Annual Report, for example, we make forward-looking statements discussing our expectations about:
‚ Future repayment of debt, including the ratio of variable to Ñxed-rate debt in our portfolio
‚ Future interest rates
Forward-looking statements discuss matters that are not historical facts. Because they discuss future events orconditions, forward-looking statements often include words such as ""anticipate,'' ""believe,'' ""estimate,''""expect,'' ""intend,'' ""plan,'' ""project,'' ""target,'' ""can,'' ""could,'' ""may,'' ""should,'' ""will,'' ""would'' or similarexpressions. Forward-looking statements should not be unduly relied upon. They give our expectations aboutthe future and are not guarantees. Forward-looking statements speak only as of the date they are made and wemight not update them to reÖect changes that occur after the date they are made.
There are several factors, many beyond our control, which could cause results to diÅer signiÑcantly from ourexpectations. Factors such as credit, market, operational, liquidity, interest rate and other risks, are describedelsewhere in this Annual Report. Any factor described in this Annual Report could by itself, or together withone or more other factors, adversely aÅect our business, results of operations or Ñnancial condition. There arealso other factors that we have not described in this Annual Report that could cause results to diÅer from ourexpectations.
48
GLOSSARY
Anchor: A department store or other large retail store with gross leaseable area greater than 30,000 square feet.
Code: The Internal Revenue Code of 1986, as amended.
Common Units: The common units of GGP Limited Partnership held by limited partners.
Company Portfolio: Includes both the Unconsolidated Properties and the Consolidated Properties.
Consolidated Properties: Properties in which we own either a majority or a controlling interest and, as aresult, are consolidated under GAAP.
CSA: The Contingent Stock Agreement under which we assumed the obligations of TRC to issue shares ofcommon stock twice a year to the beneÑciaries thereunder.
Exchange Act: Securities Exchange Act of 1934, as amended.
Freestanding GLA: The gross leaseable area of freestanding retail stores in locations that are not attached tothe primary complex of buildings that comprise a shopping center, measured in square feet.
Funds From Operations or FFO: A supplemental measure of operating performance deÑned by NAREIT asnet income (loss) (computed in accordance with GAAP), excluding gains or losses from cumulative eÅects ofaccounting changes, extraordinary items and sales of properties, plus real estate related depreciation andamortization and after adjustments for unconsolidated partnerships and joint ventures.
GAAP: Accounting principles generally accepted in the United States of America.
GGMI: General Growth Management, Inc., which manages, leases, and performs various services for someof our Unconsolidated Real Estate AÇliates and over 30 properties owned by unaÇliated third parties, alllocated in the United States.
GGPLP: GGP Limited Partnership, also referred to herein as the Operating Partnership, the partnershipthrough which substantially all of our business is conducted.
Gross Leaseable Area or GLA: Gross leaseable retail space, including Anchors and all other leaseable areas,measured in square feet.
Mall GLA: Gross leaseable retail space, excluding both Anchors and Freestanding GLA, measured in squarefeet.
Mall Stores: Stores (other than Anchors) that are typically specialty retailers who lease space in thestructure including, or attached to, the primary complex of buildings that comprise a shopping center.
MD&A: The Management's Discussion and Analysis of Financial Condition and Results of Operationscontained in Item 7 of this Annual Report on Form 10-K.
NAREIT: The National Association of Real Estate Investment Trusts.
NOI: Real estate property net operating income, the measure of property operating performance used bymanagement.
Operating Partnership: GGP Limited Partnership, also referred to as GGPLP, the partnership throughwhich substantially all of our business is conducted.
Overage rent: Rent paid by the tenant if its sales exceed an agreed upon minimum amount. The amount iscalculated by multiplying the sales in excess of the minimum amount by a percentage deÑned in the applicablelease.
REIT: A real estate investment trust.
Retail Portfolio: The retail centers and mixed-use and other properties within our Retail and Other segment.
SEC: The United States Securities and Exchange Commission.
49
SigniÑcant Tenants: Any tenant at a community/strip center with gross leaseable area greater than10,000 square feet.
Total GLA: The gross leaseable area of anchor stores plus Mall and Freestanding GLA.
Total Mall Stores Sales: The gross revenue from product sales to customers generated by the Mall Stores.
TRC Merger: The transaction in which we acquired The Rouse Company, a real estate development andmanagement company, on November 12, 2004.
TRCLP: The Rouse Company LP.
TRS: An entity that has elected to be treated as taxable REIT subsidiary.
Unconsolidated Properties: Properties owned by Unconsolidated Real Estate AÇliates and which areunconsolidated under GAAP.
Unconsolidated Real Estate AÇliates: Joint venture entities in which we own a non-controlling interest.
Item 7A. Quantitative and Qualitative Disclosures about Market Risk
We have not entered into any transactions using derivative commodity instruments. We are subject to marketrisk associated with changes in interest rates both in terms of variable-rate debt and the price of new Ñxed-ratedebt upon maturity of existing debt and for acquisitions. As of December 31, 2005, we had consolidated debtof $20.4 billion, including $6.5 billion of variable-rate debt of which approximately $883.1 million was subjectto interest rate swap agreements, which Ñx the interest rate we are required to pay on such debt atapproximately 5.46% per annum. Although the majority of the remaining variable-rate debt is subject tointerest rate cap agreements pursuant to the loan agreements and Ñnancing terms, such interest rate capsgenerally limit our interest rate exposure only if LIBOR exceeds a rate per annum signiÑcantly higher(generally above 8% per annum) than current LIBOR rates (4.39% at December 31, 2005). A 25 basis pointmovement in the interest rate on the $5.6 billion of variable-rate debt which is not subject to interest rate swapagreements would result in an approximately $14.1 million annualized increase or decrease in consolidatedinterest expense and operating cash Öows.
In addition, we are subject to interest rate exposure as a result of variable-rate debt collateralized by theUnconsolidated Properties for which similar interest rate swap agreements have not been obtained. Our share(based on our respective equity ownership interests in the Unconsolidated Real Estate AÇliates) of suchremaining variable-rate debt was approximately $455.6 million at December 31, 2005. A similar 25 basis pointannualized movement in the interest rate on the variable-rate debt of the Unconsolidated Real EstateAÇliates would result in an approximately $1.1 million annualized increase or decrease in our equity in theincome and operating cash Öows from Unconsolidated Real Estate AÇliates.
We are further subject to interest rate risk with respect to our Ñxed-rate Ñnancing in that changes in interestrates will impact the fair value of our Ñxed-rate Ñnancing. To determine fair value, the Ñxed-rate debt isdiscounted at a rate based on an estimate of current lending rates, assuming the debt is outstanding throughmaturity and considering the collateral. At December 31, 2005, the fair value of our debt is estimated to beapproximately $28.8 million lower than the carrying value of $20.4 billion. If LIBOR were to increase by25 basis points, the fair value of our debt would be approximately $158.0 million lower than the carrying valueand the fair value of our swap agreements would increase by approximately $1.6 million. For additionalinformation concerning our debt, reference is made to Item 7, Liquidity and Capital Resources and Note 6.
Item 8. Financial Statements and Supplementary Data
Reference is made to the Consolidated Financial Statements and Consolidated Financial Statement Schedulebeginning on page F-1 for the required information.
50
Item 9. Changes in and Disagreements with Accountants on Accounting and Financial Disclosure
None.
Item 9A. Controls and Procedures
Disclosure Controls and Procedures. As of the end of the period covered by this report, we carried out anevaluation, under the supervision and with the participation of our management, including the Chief ExecutiveOÇcer (""CEO'') and Chief Financial OÇcer (""CFO''), of the eÅectiveness of the design and operation ofour disclosure controls and procedures (as deÑned in Rules 13a-15(e) and 15(d)-15(e) under the SecuritiesExchange Act of 1934, as amended, (the ""Exchange Act'')). Based on that evaluation, the CEO and theCFO have concluded that our disclosure controls and procedures are eÅective to ensure that information thatwe are required to disclose in the reports we Ñle or submit under the Exchange Act, is recorded, processed,summarized and reported within the time periods speciÑed in the Securities and Exchange Commission rulesand forms.
Internal Controls over Financing Reporting. There have been no changes in our internal controls during ourmost recently completed Ñscal quarter that have materially aÅected or are reasonably likely to materiallyaÅect our internal control over Ñnancial reporting or in other factors that could signiÑcantly aÅect internalcontrols subsequent to the end of the period covered by this report.
MANAGEMENT'S REPORT ON INTERNAL CONTROL OVER FINANCIAL REPORTING
Our management is responsible for establishing and maintaining adequate internal control over Ñnancialreporting. Our internal control over Ñnancial reporting is a process designed under the supervision of ourprincipal executive and principal Ñnancial oÇcers to provide reasonable assurance regarding the reliability ofÑnancial reporting and preparation of our Ñnancial statements for external reporting purposes in accordancewith generally accepted accounting principles in the U.S.
As of December 31, 2005, we conducted an assessment of the eÅectiveness of our internal control overÑnancial reporting based on the framework utilizing the criteria set forth by the Committee of SponsoringOrganizations of the Treadway Commission in ""Internal Controls Ì Integrated Framework.'' Based on thisassessment management believes that, as of December 31, 2005, the Company did not maintain eÅectiveinternal control over Ñnancial reporting because of the eÅect of material weaknesses in the Company's systemof internal controls. During the closing process for the year ended December 31, 2005, managementdetermined that:
‚ the Company did not maintain eÅective controls at the Company's subsidiary over the process ofidentifying, communicating, recording and tracking various items that create current and deferred incometaxes; and
‚ the Company had insuÇcient personnel resources with technical accounting expertise to enable it toconduct a timely and accurate Ñnancial close process.
Subsequent to the period covered by this report, management of the Company reviewed and evaluated thedesign of the internal control process for accounting for income taxes and the staÇng level with technicalaccounting expertise and is taking the following actions to remediate these reported material weaknesses ininternal control over Ñnancial reporting by:
‚ Reviewing the documentation for the income tax closing process and documentation procedures todetermine if changes are appropriate to more clearly set forth the quarterly and annual income tax closingprocess requirements;
‚ Educating and training Company employees about accounting and reporting for income tax;
51
‚ Hiring employees to Ñll tax-related positions that were vacant at December 31, 2005;
‚ Creating additional positions to review and coordinate the implementation and maintenance of internalcontrols over accounting for income tax;
‚ Hiring additional accounting staÅ with requisite technical accounting expertise;
‚ Adhering to the Company's closing process, including monitoring controls and documentation procedureswith the assistance and oversight of additional Company employees;
The Company's management has discussed these material weaknesses, initial corrective actions and bothcurrent and future plans with the Audit Committee, who concurred with management.
Deloitte & Touche LLP, the Company's independent registered public accounting Ñrm, audited manage-ment's assessment of the eÅectiveness of internal control over Ñnancial reporting as of December 31, 2005and, based on that audit, issued the report set forth herein.
52
REPORT OF INDEPENDENT REGISTERED PUBLIC ACCOUNTING FIRM
To the Board of Directors and Stockholders ofGeneral Growth Properties, Inc.Chicago, Illinois
We have audited management's assessment, included in the accompanying Management's Report on InternalControl Over Financial Reporting, that General Growth Properties, Inc. and subsidiaries (the ""Company'')did not maintain eÅective internal control over Ñnancial reporting as of December 31, 2005, because of theeÅect of the material weaknesses identiÑed in management's assessment, based on criteria established inInternal Control Ì Integrated Framework issued by the Committee of Sponsoring Organizations of theTreadway Commission. The Company's management is responsible for maintaining eÅective internal controlover Ñnancial reporting and for its assessment of the eÅectiveness of internal control over Ñnancial reporting.Our responsibility is to express an opinion on management's assessment and an opinion on the eÅectiveness ofthe Company's internal control over Ñnancial reporting based on our audit.
We conducted our audit in accordance with the standards of the Public Company Accounting OversightBoard (United States). Those standards require that we plan and perform the audit to obtain reasonableassurance about whether eÅective internal control over Ñnancial reporting was maintained in all materialrespects. Our audit included obtaining an understanding of internal control over Ñnancial reporting, evaluatingmanagement's assessment, testing and evaluating the design and operating eÅectiveness of internal control,and performing such other procedures as we considered necessary in the circumstances. We believe that ouraudit provides a reasonable basis for our opinions.
A company's internal control over Ñnancial reporting is a process designed by, or under the supervision of, thecompany's principal executive and principal Ñnancial oÇcers, or persons performing similar functions, andeÅected by the company's board of directors, management, and other personnel to provide reasonableassurance regarding the reliability of Ñnancial reporting and the preparation of Ñnancial statements for externalpurposes in accordance with generally accepted accounting principles. A company's internal control overÑnancial reporting includes those policies and procedures that (1) pertain to the maintenance of records that,in reasonable detail, accurately and fairly reÖect the transactions and dispositions of the assets of the company;(2) provide reasonable assurance that transactions are recorded as necessary to permit preparation of Ñnancialstatements in accordance with generally accepted accounting principles, and that receipts and expenditures ofthe company are being made only in accordance with authorizations of management and directors of thecompany; and (3) provide reasonable assurance regarding prevention or timely detection of unauthorizedacquisition, use, or disposition of the company's assets that could have a material eÅect on the Ñnancialstatements.
Because of the inherent limitations of internal control over Ñnancial reporting, including the possibility ofcollusion or improper management override of controls, material misstatements due to error or fraud may notbe prevented or detected on a timely basis. Also, projections of any evaluation of the eÅectiveness on theinternal control over Ñnancial reporting to future periods are subject to the risk that the controls may becomeinadequate because of changes in conditions, or that the degree of compliance with the policies or proceduresmay deteriorate.
A material weakness is a signiÑcant deÑciency, or combination of signiÑcant deÑciencies, that results in morethan a remote likelihood that a material misstatement of the annual or interim Ñnancial statements will not beprevented or detected. The following material weaknesses have been identiÑed and included in management'sassessment:
As of December 31, 2005, the Company did not maintain eÅective controls at the Company's The RouseCompany LP subsidiary over the process of identifying, communicating and tracking various items thatcreate current and deferred income taxes. SpeciÑcally, the current portion of the tax provision was notaccurately determined and the Company did not adequately review the diÅerences between the incometax basis and Ñnancial reporting basis of assets and liabilities and reconcile the diÅerences to recordeddeferred income tax assets and liabilities. In addition, the tax department was not appropriately staÅed to
53
conduct a timely and accurate review of the tax provision. The consolidated Ñnancial statements wereadjusted prior to the Company Ñling this Annual Report on Form 10-K to properly reÖect severalÑnancial statement line items, including current and deferred taxes, as well as goodwill.
As of December 31, 2005, the Company's controls over the Ñnancial close process did not operateeÅectively. There are insuÇcient personnel resources with technical accounting expertise to conduct atimely and accurate Ñnancial close. The consolidated Ñnancial statements were corrected prior to theCompany Ñling this Annual Report on Form 10-K. These error corrections aÅected various items withinthe consolidated statement of cash Öows and a number of Ñnancial statement line items, includingbuildings and equipment, goodwill, investment in unconsolidated real estate aÇliates, accounts payableand accrued expenses, equity in net income of unconsolidated aÇliates and interest expense.
These material weaknesses were considered in determining the nature, timing and extent of audit tests appliedin our audit of the consolidated Ñnancial statements and consolidated Ñnancial statement schedule as of andfor the year ended December 31, 2005, of the Company and this report does not aÅect our report on suchconsolidated Ñnancial statements and consolidated Ñnancial statement schedule.
In our opinion, management's assessment that the Company did not maintain eÅective internal control overÑnancial reporting as of December 31, 2005, is fairly stated, in all material respects, based on the criteriaestablished in Internal Control Ì Integrated Framework issued by the Committee of Sponsoring Organiza-tions of the Treadway Commission. Also in our opinion, because of the eÅect of the material weaknessesdescribed above on the achievement of the objections of the control criteria, the Company has not maintained,in all material respects, eÅective internal control over Ñnancial reporting as of December 31, 2005, based onthe criteria established in Internal Control Ì Integrated Framework issued by the Committee of SponsoringOrganizations of the Treadway Commission.
We have also audited, in accordance with the standards of the Public Company Accounting Oversight Board(United States), the consolidated Ñnancial statements and consolidated Ñnancial statement schedule as of andfor the year ended December 31, 2005 of the Company and our reports dated March 31, 2006 expressed anunqualiÑed opinion on those consolidated Ñnancial statements and consolidated Ñnancial statement schedule.
DELOITTE & TOUCHE LLP
Chicago, IllinoisMarch 31, 2006
54
Item 9B. Other Information
None.
PART III
Item 10. Directors and Executive OÇcers of the Registrant
The information which appears under the captions ""Election of Directors,'' ""Executive OÇcers,'' ""Govern-ance of the Company Ì Committees of the Board of Directors Ì Audit Committee'' and ""Ì Nominating &Governance Committee'' and ""Stock Ownership Ì Section 16(a) BeneÑcial Ownership Reporting Compli-ance'' in our proxy statement for our 2006 Annual Meeting of Stockholders is incorporated by reference intothis Item 10.
We have a Code of Business Conduct and Ethics which applies to all of our employees, oÇcers and directors,including our Chairman, Chief Executive OÇcer and Chief Financial OÇcer. The Code of Business Conductand Ethics is available on the Corporate Governance page of our website at www.generalgrowth.com and wewill provide a copy of the Code of Business Conduct and Ethics without charge to any person who requests itin writing to: General Growth Properties, Inc., 110 N. Wacker Dr., Chicago, IL 60606, Attn: Director ofInvestor Relations. We will post on our website amendments to or waivers of our Code of Ethics for executiveoÇcers, in accordance with applicable laws and regulations.
Our Chief Executive OÇcer and Chief Financial OÇcer have signed certiÑcates under Sections 302 and 906of the Sarbanes-Oxley Act, which are Ñled as Exhibits 31.1 and 31.2 and 32.1 and 32.2, respectively, to thisAnnual Report. In addition, our Chief Executive OÇcer submitted his most recent annual certiÑcation to theNYSE pursuant to Section 303A 12(a) of the NYSE listing standards on May 25, 2005, in which heindicated that he was not aware of any violations of NYSE corporate governance listing standards.
Item 11. Executive Compensation
The information which appears under the caption ""Executive Compensation'' in our proxy statement for our2006 Annual Meeting of Stockholders is incorporated by reference into this Item 11; provided, however, thatthe Report of the Compensation Committee of the Board of Directors on Executive Compensation shall notbe incorporated by reference herein, in any of our previous Ñlings under the Securities Act of 1933, asamended, or the Exchange Act, or in any of our future Ñlings.
Item 12. Security Ownership of Certain BeneÑcial Owners and Management and Related StockholderMatters
The information which appears under the captions ""Stock Ownership Ì Common Stock Ownership ofCertain BeneÑcial Owners'' and ""Ì Equity Ownership of Management'' in our proxy statement for our 2006Annual Meeting of Stockholders is incorporated by reference into this Item 12.
55
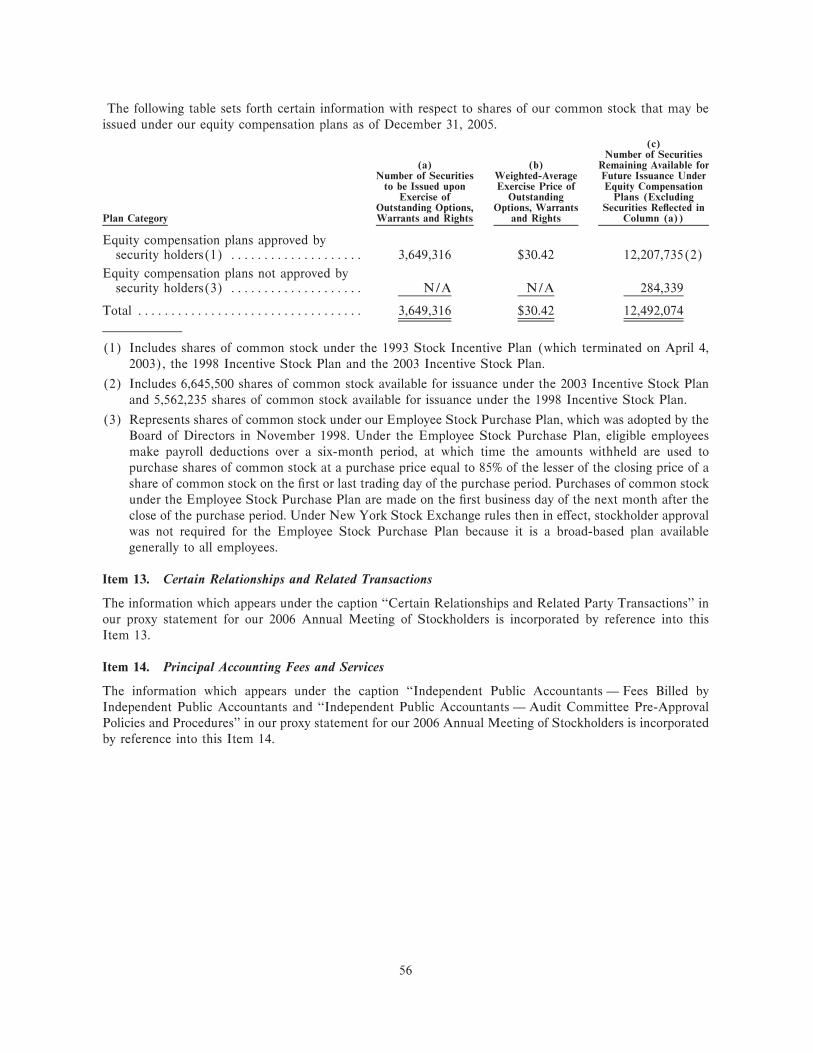
The following table sets forth certain information with respect to shares of our common stock that may beissued under our equity compensation plans as of December 31, 2005.
(c)Number of Securities
(a) (b) Remaining Available forNumber of Securities Weighted-Average Future Issuance Under
to be Issued upon Exercise Price of Equity CompensationExercise of Outstanding Plans (Excluding
Outstanding Options, Options, Warrants Securities ReÖected inPlan Category Warrants and Rights and Rights Column (a))
Equity compensation plans approved bysecurity holders(1) ÏÏÏÏÏÏÏÏÏÏÏÏÏÏÏÏÏÏÏÏ 3,649,316 $30.42 12,207,735(2)
Equity compensation plans not approved bysecurity holders(3) ÏÏÏÏÏÏÏÏÏÏÏÏÏÏÏÏÏÏÏÏ N/A N/A 284,339
Total ÏÏÏÏÏÏÏÏÏÏÏÏÏÏÏÏÏÏÏÏÏÏÏÏÏÏÏÏÏÏÏÏÏÏ 3,649,316 $30.42 12,492,074
(1) Includes shares of common stock under the 1993 Stock Incentive Plan (which terminated on April 4,2003), the 1998 Incentive Stock Plan and the 2003 Incentive Stock Plan.
(2) Includes 6,645,500 shares of common stock available for issuance under the 2003 Incentive Stock Planand 5,562,235 shares of common stock available for issuance under the 1998 Incentive Stock Plan.
(3) Represents shares of common stock under our Employee Stock Purchase Plan, which was adopted by theBoard of Directors in November 1998. Under the Employee Stock Purchase Plan, eligible employeesmake payroll deductions over a six-month period, at which time the amounts withheld are used topurchase shares of common stock at a purchase price equal to 85% of the lesser of the closing price of ashare of common stock on the Ñrst or last trading day of the purchase period. Purchases of common stockunder the Employee Stock Purchase Plan are made on the Ñrst business day of the next month after theclose of the purchase period. Under New York Stock Exchange rules then in eÅect, stockholder approvalwas not required for the Employee Stock Purchase Plan because it is a broad-based plan availablegenerally to all employees.
Item 13. Certain Relationships and Related Transactions
The information which appears under the caption ""Certain Relationships and Related Party Transactions'' inour proxy statement for our 2006 Annual Meeting of Stockholders is incorporated by reference into thisItem 13.
Item 14. Principal Accounting Fees and Services
The information which appears under the caption ""Independent Public Accountants Ì Fees Billed byIndependent Public Accountants and ""Independent Public Accountants Ì Audit Committee Pre-ApprovalPolicies and Procedures'' in our proxy statement for our 2006 Annual Meeting of Stockholders is incorporatedby reference into this Item 14.
56
PART IV
Item 15. Exhibits and Financial Statement Schedules
(a) Financial Statements and Financial Statement Schedules.
The consolidated Ñnancial statements and schedule listed in the accompanying Index to Consoli-dated Financial Statements and Consolidated Financial Statement Schedule are Ñled as part of thisAnnual Report.
(b) Exhibits.
See Exhibit Index on page S-1.
(c) Separate Ñnancial statements.
Not applicable.
57
SIGNATURES
Pursuant to the requirements of Section 13 or 15(d) of the Securities Exchange Act of 1934, the registranthas duly caused this report to be signed on its behalf by the undersigned, thereunto duly authorized.
GENERAL GROWTH PROPERTIES, INC.
By: /s/ JOHN BUCKSBAUM
John BucksbaumChief Executive OÇcer
March 31, 2006
Pursuant to the requirements of the Securities Exchange Act of 1934, this report has been signed below by thefollowing persons on behalf of the registrant and in the capacities and on the dates indicated.
Signature Title Date
/s/ MATTHEW BUCKSBAUM Chairman of the Board March 31, 2006
Matthew Bucksbaum
/s/ JOHN BUCKSBAUM Director and Chief Executive OÇcer March 31, 2006(Principal Executive OÇcer)John Bucksbaum
/s/ ROBERT MICHAELS Director, President and March 31, 2006Chief Operating OÇcerRobert Michaels
/s/ BERNARD FREIBAUM Director, Executive Vice President March 31, 2006and Chief Financial OÇcerBernard Freibaum
(Principal Financialand Accounting OÇcer)
/s/ ALAN COHEN Director March 31, 2006
Alan Cohen
/s/ ANTHONY DOWNS Director March 31, 2006
Anthony Downs
/s/ ADAM METZ Director March 31, 2006
Adam Metz
/s/ THOMAS NOLAN Director March 31, 2006
Thomas Nolan
/s/ JOHN RIORDAN Director March 31, 2006
John Riordan
/s/ BETH STEWART Director March 31, 2006
Beth Stewart
58
GENERAL GROWTH PROPERTIES, INC.
INDEX TO CONSOLIDATED FINANCIAL STATEMENTS ANDCONSOLIDATED FINANCIAL STATEMENT SCHEDULE
The following consolidated Ñnancial statements and consolidated Ñnancial statement schedule are included inItem 8 of this Annual Report on Form 10-K:
Page
Consolidated Financial Statements
Report of Independent Registered Public Accounting Firm Ì General Growth Properties, Inc. ÏÏ F-2
Report of Independent Registered Public Accounting Firm Ì GGP/Homart, Inc. ÏÏÏÏÏÏÏÏÏÏÏÏÏ F-3
Report of Independent Registered Public Accounting Firm Ì GGP/Homart II L.L.C. ÏÏÏÏÏÏÏÏÏ F-4
Report of Independent Registered Public Accounting Firm Ì GGP-TRS, L.L.C. ÏÏÏÏÏÏÏÏÏÏÏÏÏ F-5
Consolidated Balance Sheets as of December 31, 2005 and 2004 ÏÏÏÏÏÏÏÏÏÏÏÏÏÏÏÏÏÏÏÏÏÏÏÏÏÏÏÏ F-6
Consolidated Statements of Income and Comprehensive Income for the years endedDecember 31, 2005, 2004 and 2003ÏÏÏÏÏÏÏÏÏÏÏÏÏÏÏÏÏÏÏÏÏÏÏÏÏÏÏÏÏÏÏÏÏÏÏÏÏÏÏÏÏÏÏÏÏÏÏÏÏÏÏ F-7
Consolidated Statements of Stockholders' Equity for the years ended December 31, 2005, 2004and 2003 ÏÏÏÏÏÏÏÏÏÏÏÏÏÏÏÏÏÏÏÏÏÏÏÏÏÏÏÏÏÏÏÏÏÏÏÏÏÏÏÏÏÏÏÏÏÏÏÏÏÏÏÏÏÏÏÏÏÏÏÏÏÏÏÏÏÏÏÏÏÏÏÏÏ F-8
Consolidated Statements of Cash Flows for the years ended December 31, 2005, 2004and 2003 ÏÏÏÏÏÏÏÏÏÏÏÏÏÏÏÏÏÏÏÏÏÏÏÏÏÏÏÏÏÏÏÏÏÏÏÏÏÏÏÏÏÏÏÏÏÏÏÏÏÏÏÏÏÏÏÏÏÏÏÏÏÏÏÏÏÏÏÏÏÏÏÏÏ F-9
Notes to Consolidated Financial Statements ÏÏÏÏÏÏÏÏÏÏÏÏÏÏÏÏÏÏÏÏÏÏÏÏÏÏÏÏÏÏÏÏÏÏÏÏÏÏÏÏÏÏÏÏÏ F-10
Consolidated Financial Statement Schedule
Report of Independent Registered Public Accounting FirmÏÏÏÏÏÏÏÏÏÏÏÏÏÏÏÏÏÏÏÏÏÏÏÏÏÏÏÏÏÏÏÏÏ F-55
Schedule III Ì Real Estate and Accumulated Depreciation ÏÏÏÏÏÏÏÏÏÏÏÏÏÏÏÏÏÏÏÏÏÏÏÏÏÏÏÏÏÏÏÏ F-56
All other schedules are omitted since the required information is either not present in any amounts, is notpresent in amounts suÇcient to require submission of the schedule or because the information required isincluded in the consolidated Ñnancial statements and related notes.
F-1
REPORT OF INDEPENDENT REGISTERED PUBLIC ACCOUNTING FIRM
To the Board of Directors and Stockholders ofGeneral Growth Properties, Inc.Chicago, Illinois
We have audited the accompanying consolidated balance sheets of General Growth Properties, Inc. andsubsidiaries (the ""Company'') as of December 31, 2005 and 2004, and the related consolidated statements ofincome and comprehensive income, stockholders' equity, and cash Öows for each of the three years in theperiod ended December 31, 2005. These Ñnancial statements are the responsibility of the Company'smanagement. Our responsibility is to express an opinion on these Ñnancial statements based on our audits. Wedid not audit the consolidated Ñnancial statements of GGP/Homart, Inc., GGP/Homart II L.L.C., andGGP-TRS L.L.C., the Company's investments in which are accounted for by use of the equity method. TheCompany's equity of $70,175,000 and $126,855,000 in GGP/Homart Inc.'s net assets as of December 31,2005 and 2004, respectively, and of $31,425,000, $21,148,000 and $23,815,000 in GGP/Homart Inc.'s netincome for each of the three years in the respective period ended December 31, 2005 are included in theaccompanying Ñnancial statements. The Company's equity of $259,716,000 and $319,537,000 in GGP/Homart II L.L.C.'s net assets as of December 31, 2005 and 2004, respectively, and of $33,849,000,$36,724,000 and $33,448,000 in GGP/Homart II L.L.C.'s net income for each of the three years in therespective period ended December 31, 2005 are included in the accompanying Ñnancial statements. TheCompany's equity of $3,764,000 in GGP-TRS L.L.C.'s net assets as of December 31, 2005, and of$19,308,000 in GGP-TRS L.L.C.'s net income for the year then ended are included in the accompanyingÑnancial statements. The Ñnancial statements of GGP/Homart, Inc., GGP/Homart II L.L.C., and GGP-TRS L.L.C. were audited by other auditors related to the periods listed above whose reports have beenfurnished to us, and our opinion, insofar as it relates to the amounts included for such companies, is basedsolely on the reports of such other auditors.
We conducted our audits in accordance with the standards of the Public Company Accounting OversightBoard (United States). Those standards require that we plan and perform the audit to obtain reasonableassurance about whether the Ñnancial statements are free of material misstatement. An audit includesexamining, on a test basis, evidence supporting the amounts and disclosures in the Ñnancial statements. Anaudit also includes assessing the accounting principles used and signiÑcant estimates made by management, aswell as evaluating the overall Ñnancial statement presentation. We believe that our audits and the reports ofthe other auditors provide a reasonable basis for our opinion.
In our opinion, based on our audits and the reports of the other auditors, such consolidated Ñnancialstatements present fairly, in all material respects, the Ñnancial position of General Growth Properties, Inc. andsubsidiaries at December 31, 2005 and 2004, and the results of its operations and its cash Öows for each of thethree years in the period ended December 31, 2005, in conformity with accounting principles generallyaccepted in the United States of America.
We have also audited, in accordance with the standards of the Public Company Accounting Oversight Board(United States), the eÅectiveness of the Company's internal control over Ñnancial reporting as of Decem-ber 31, 2005, based on the criteria established in Internal Control Ì Integrated Framework issued by theCommittee of Sponsoring Organizations of the Treadway Commission (COSO) and our report datedMarch 31, 2006 expressed an unqualiÑed opinion on management's assessment on the eÅectiveness of theCompany's internal control over Ñnancial reporting and an adverse opinion on the eÅectiveness of theCompany's internal control over Ñnancial reporting because of material weaknesses.
DELOITTE & TOUCHE LLP
Chicago, IllinoisMarch 31, 2006
F-2

REPORT OF INDEPENDENT REGISTERED PUBLIC ACCOUNTING FIRM
The StockholdersGGP/Homart, Inc.:
We have audited the consolidated balance sheets of GGP/Homart, Inc. (a Delaware Corporation) andsubsidiaries (the Company) as of December 31, 2005 and 2004, and the related consolidated statements ofincome and comprehensive income, stockholders' equity, and cash Öows for each of the years in the three-yearperiod ended December 31, 2005 (not presented separately herein). These consolidated Ñnancial statementsare the responsibility of the Company's management. Our responsibility is to express an opinion on theseconsolidated Ñnancial statements based on our audits.
We conducted our audits in accordance with the standards of the Public Company Accounting OversightBoard (United States). Those standards require that we plan and perform the audit to obtain reasonableassurance about whether the Ñnancial statements are free of material misstatement. An audit includesexamining, on a test basis, evidence supporting the amounts and disclosures in the Ñnancial statements. Anaudit also includes assessing the accounting principles used and signiÑcant estimates made by management, aswell as evaluating the overall Ñnancial statement presentation. We believe that our audits provide a reasonablebasis for our opinion.
In our opinion, the consolidated Ñnancial statements referred to above present fairly, in all material respects,the Ñnancial position of GGP/Homart, Inc. and subsidiaries as of December 31, 2005 and 2004, and theresults of their operations and their cash Öows for each of the years in the three-year period endedDecember 31, 2005, in conformity with U.S. generally accepted accounting principles.
KPMG LLP
Chicago, IllinoisMarch 17, 2006
F-3
REPORT OF INDEPENDENT REGISTERED PUBLIC ACCOUNTING FIRM
To MembersGGP/Homart II L.L.C.:
We have audited the consolidated balance sheets of GGP/Homart II L.L.C. (a Delaware Limited LiabilityCompany) and subsidiaries (the Company) as of December 31, 2005 and 2004, and the related consolidatedstatements of income and comprehensive income, changes in members' capital, and cash Öows for each of theyears in the three-year period ended December 31, 2005 (not presented separately herein). These consoli-dated Ñnancial statements are the responsibility of the Company's management. Our responsibility is toexpress an opinion on these consolidated Ñnancial statements based on our audits.
We conducted our audits in accordance with the standards of the Public Company Accounting OversightBoard (United States). Those standards require that we plan and perform the audit to obtain reasonableassurance about whether the Ñnancial statements are free of material misstatement. An audit includesexamining, on a test basis, evidence supporting the amounts and disclosures in the Ñnancial statements. Anaudit also includes assessing the accounting principles used and signiÑcant estimates made by management, aswell as evaluating the overall Ñnancial statement presentation. We believe that our audits provide a reasonablebasis for our opinion.
In our opinion, the consolidated Ñnancial statements referred to above present fairly, in all material respects,the Ñnancial position of GGP/Homart II L.L.C. and subsidiaries as of December 31, 2005 and 2004, and theresults of their operations and their cash Öows for each of the years in the three-year period endedDecember 31, 2005, in conformity with U.S. generally accepted accounting principles.
KPMG LLP
Chicago, IllinoisMarch 17, 2006
F-4
REPORT OF INDEPENDENT REGISTERED PUBLIC ACCOUNTING FIRM
Members GGP-TRS, L.L.C.:
We have audited the accompanying consolidated balance sheet of GGP Ó TRS L.L.C. (a Deleware limitedliability company) and subsidiaries as of December 31, 2005, and the related consolidated statement ofoperations, changes in members' capital, and cash Öow for the then year ended (not presented separatelyherein). These consolidated Ñnancial statements are the responsibility of the Company's management. Ourresponsibility is to express an opinion on these consolidated Ñnancial statements based on our audit.
We conducted our audit in accordance with the standards of the Public Company Accounting OversightBoard (United States). Those standards require that we plan and perform the audit to obtain reasonableassurance about whether the Ñnancial statements are free of material misstatement. An audit includesexamining, on a test basis, evidence supporting the amounts and disclosures in the Ñnancial statements. Anaudit also includes assessing the accounting principles used and signiÑcant estimates made by management, aswell as evaluating the overall Ñnancial statement presentation. We believe that our audit provides a reasonablebasis for our opinion.
In our opinion, the consolidated Ñnancial statements referred to above present fairly, in all material respects,the Ñnancial position of GGP Ó TRS L.L.C. and subsidiaries as of December 31, 2005, and the result of theiroperations and their cash Öow for the year then ended, in conformity with U.S. generally accepted accountingprinciples.
KPMG LLP
Chicago, IllinoisMarch 17, 2006
F-5
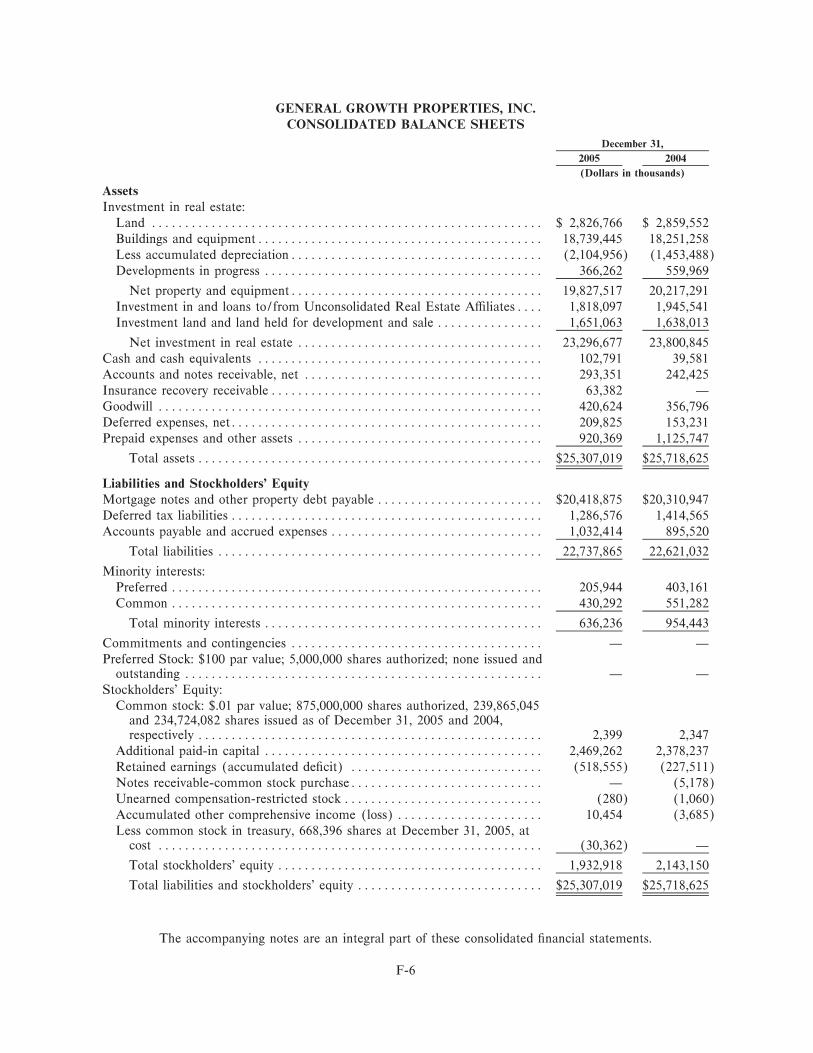
GENERAL GROWTH PROPERTIES, INC.CONSOLIDATED BALANCE SHEETS
December 31,
2005 2004
(Dollars in thousands)
AssetsInvestment in real estate:
Land ÏÏÏÏÏÏÏÏÏÏÏÏÏÏÏÏÏÏÏÏÏÏÏÏÏÏÏÏÏÏÏÏÏÏÏÏÏÏÏÏÏÏÏÏÏÏÏÏÏÏÏÏÏÏÏÏÏÏÏ $ 2,826,766 $ 2,859,552Buildings and equipmentÏÏÏÏÏÏÏÏÏÏÏÏÏÏÏÏÏÏÏÏÏÏÏÏÏÏÏÏÏÏÏÏÏÏÏÏÏÏÏÏÏÏÏ 18,739,445 18,251,258Less accumulated depreciationÏÏÏÏÏÏÏÏÏÏÏÏÏÏÏÏÏÏÏÏÏÏÏÏÏÏÏÏÏÏÏÏÏÏÏÏÏÏ (2,104,956) (1,453,488)Developments in progress ÏÏÏÏÏÏÏÏÏÏÏÏÏÏÏÏÏÏÏÏÏÏÏÏÏÏÏÏÏÏÏÏÏÏÏÏÏÏÏÏÏÏ 366,262 559,969
Net property and equipmentÏÏÏÏÏÏÏÏÏÏÏÏÏÏÏÏÏÏÏÏÏÏÏÏÏÏÏÏÏÏÏÏÏÏÏÏÏÏ 19,827,517 20,217,291Investment in and loans to/from Unconsolidated Real Estate AÇliatesÏÏÏÏ 1,818,097 1,945,541Investment land and land held for development and sale ÏÏÏÏÏÏÏÏÏÏÏÏÏÏÏÏ 1,651,063 1,638,013
Net investment in real estate ÏÏÏÏÏÏÏÏÏÏÏÏÏÏÏÏÏÏÏÏÏÏÏÏÏÏÏÏÏÏÏÏÏÏÏÏÏ 23,296,677 23,800,845Cash and cash equivalents ÏÏÏÏÏÏÏÏÏÏÏÏÏÏÏÏÏÏÏÏÏÏÏÏÏÏÏÏÏÏÏÏÏÏÏÏÏÏÏÏÏÏÏ 102,791 39,581Accounts and notes receivable, net ÏÏÏÏÏÏÏÏÏÏÏÏÏÏÏÏÏÏÏÏÏÏÏÏÏÏÏÏÏÏÏÏÏÏÏÏ 293,351 242,425Insurance recovery receivableÏÏÏÏÏÏÏÏÏÏÏÏÏÏÏÏÏÏÏÏÏÏÏÏÏÏÏÏÏÏÏÏÏÏÏÏÏÏÏÏÏ 63,382 ÌGoodwill ÏÏÏÏÏÏÏÏÏÏÏÏÏÏÏÏÏÏÏÏÏÏÏÏÏÏÏÏÏÏÏÏÏÏÏÏÏÏÏÏÏÏÏÏÏÏÏÏÏÏÏÏÏÏÏÏÏÏ 420,624 356,796Deferred expenses, netÏÏÏÏÏÏÏÏÏÏÏÏÏÏÏÏÏÏÏÏÏÏÏÏÏÏÏÏÏÏÏÏÏÏÏÏÏÏÏÏÏÏÏÏÏÏÏ 209,825 153,231Prepaid expenses and other assets ÏÏÏÏÏÏÏÏÏÏÏÏÏÏÏÏÏÏÏÏÏÏÏÏÏÏÏÏÏÏÏÏÏÏÏÏÏ 920,369 1,125,747
Total assets ÏÏÏÏÏÏÏÏÏÏÏÏÏÏÏÏÏÏÏÏÏÏÏÏÏÏÏÏÏÏÏÏÏÏÏÏÏÏÏÏÏÏÏÏÏÏÏÏÏÏÏÏ $25,307,019 $25,718,625
Liabilities and Stockholders' EquityMortgage notes and other property debt payable ÏÏÏÏÏÏÏÏÏÏÏÏÏÏÏÏÏÏÏÏÏÏÏÏÏ $20,418,875 $20,310,947Deferred tax liabilities ÏÏÏÏÏÏÏÏÏÏÏÏÏÏÏÏÏÏÏÏÏÏÏÏÏÏÏÏÏÏÏÏÏÏÏÏÏÏÏÏÏÏÏÏÏÏÏ 1,286,576 1,414,565Accounts payable and accrued expenses ÏÏÏÏÏÏÏÏÏÏÏÏÏÏÏÏÏÏÏÏÏÏÏÏÏÏÏÏÏÏÏÏ 1,032,414 895,520
Total liabilities ÏÏÏÏÏÏÏÏÏÏÏÏÏÏÏÏÏÏÏÏÏÏÏÏÏÏÏÏÏÏÏÏÏÏÏÏÏÏÏÏÏÏÏÏÏÏÏÏÏ 22,737,865 22,621,032
Minority interests:Preferred ÏÏÏÏÏÏÏÏÏÏÏÏÏÏÏÏÏÏÏÏÏÏÏÏÏÏÏÏÏÏÏÏÏÏÏÏÏÏÏÏÏÏÏÏÏÏÏÏÏÏÏÏÏÏÏÏ 205,944 403,161Common ÏÏÏÏÏÏÏÏÏÏÏÏÏÏÏÏÏÏÏÏÏÏÏÏÏÏÏÏÏÏÏÏÏÏÏÏÏÏÏÏÏÏÏÏÏÏÏÏÏÏÏÏÏÏÏÏ 430,292 551,282
Total minority interests ÏÏÏÏÏÏÏÏÏÏÏÏÏÏÏÏÏÏÏÏÏÏÏÏÏÏÏÏÏÏÏÏÏÏÏÏÏÏÏÏÏÏ 636,236 954,443
Commitments and contingencies ÏÏÏÏÏÏÏÏÏÏÏÏÏÏÏÏÏÏÏÏÏÏÏÏÏÏÏÏÏÏÏÏÏÏÏÏÏÏ Ì ÌPreferred Stock: $100 par value; 5,000,000 shares authorized; none issued and
outstanding ÏÏÏÏÏÏÏÏÏÏÏÏÏÏÏÏÏÏÏÏÏÏÏÏÏÏÏÏÏÏÏÏÏÏÏÏÏÏÏÏÏÏÏÏÏÏÏÏÏÏÏÏÏÏ Ì ÌStockholders' Equity:
Common stock: $.01 par value; 875,000,000 shares authorized, 239,865,045and 234,724,082 shares issued as of December 31, 2005 and 2004,respectively ÏÏÏÏÏÏÏÏÏÏÏÏÏÏÏÏÏÏÏÏÏÏÏÏÏÏÏÏÏÏÏÏÏÏÏÏÏÏÏÏÏÏÏÏÏÏÏÏÏÏÏÏ 2,399 2,347
Additional paid-in capital ÏÏÏÏÏÏÏÏÏÏÏÏÏÏÏÏÏÏÏÏÏÏÏÏÏÏÏÏÏÏÏÏÏÏÏÏÏÏÏÏÏÏ 2,469,262 2,378,237Retained earnings (accumulated deÑcit) ÏÏÏÏÏÏÏÏÏÏÏÏÏÏÏÏÏÏÏÏÏÏÏÏÏÏÏÏÏ (518,555) (227,511)Notes receivable-common stock purchaseÏÏÏÏÏÏÏÏÏÏÏÏÏÏÏÏÏÏÏÏÏÏÏÏÏÏÏÏÏ Ì (5,178)Unearned compensation-restricted stock ÏÏÏÏÏÏÏÏÏÏÏÏÏÏÏÏÏÏÏÏÏÏÏÏÏÏÏÏÏÏ (280) (1,060)Accumulated other comprehensive income (loss) ÏÏÏÏÏÏÏÏÏÏÏÏÏÏÏÏÏÏÏÏÏÏ 10,454 (3,685)Less common stock in treasury, 668,396 shares at December 31, 2005, at
cost ÏÏÏÏÏÏÏÏÏÏÏÏÏÏÏÏÏÏÏÏÏÏÏÏÏÏÏÏÏÏÏÏÏÏÏÏÏÏÏÏÏÏÏÏÏÏÏÏÏÏÏÏÏÏÏÏÏÏ (30,362) Ì
Total stockholders' equity ÏÏÏÏÏÏÏÏÏÏÏÏÏÏÏÏÏÏÏÏÏÏÏÏÏÏÏÏÏÏÏÏÏÏÏÏÏÏÏÏ 1,932,918 2,143,150
Total liabilities and stockholders' equity ÏÏÏÏÏÏÏÏÏÏÏÏÏÏÏÏÏÏÏÏÏÏÏÏÏÏÏÏ $25,307,019 $25,718,625
The accompanying notes are an integral part of these consolidated Ñnancial statements.
F-6
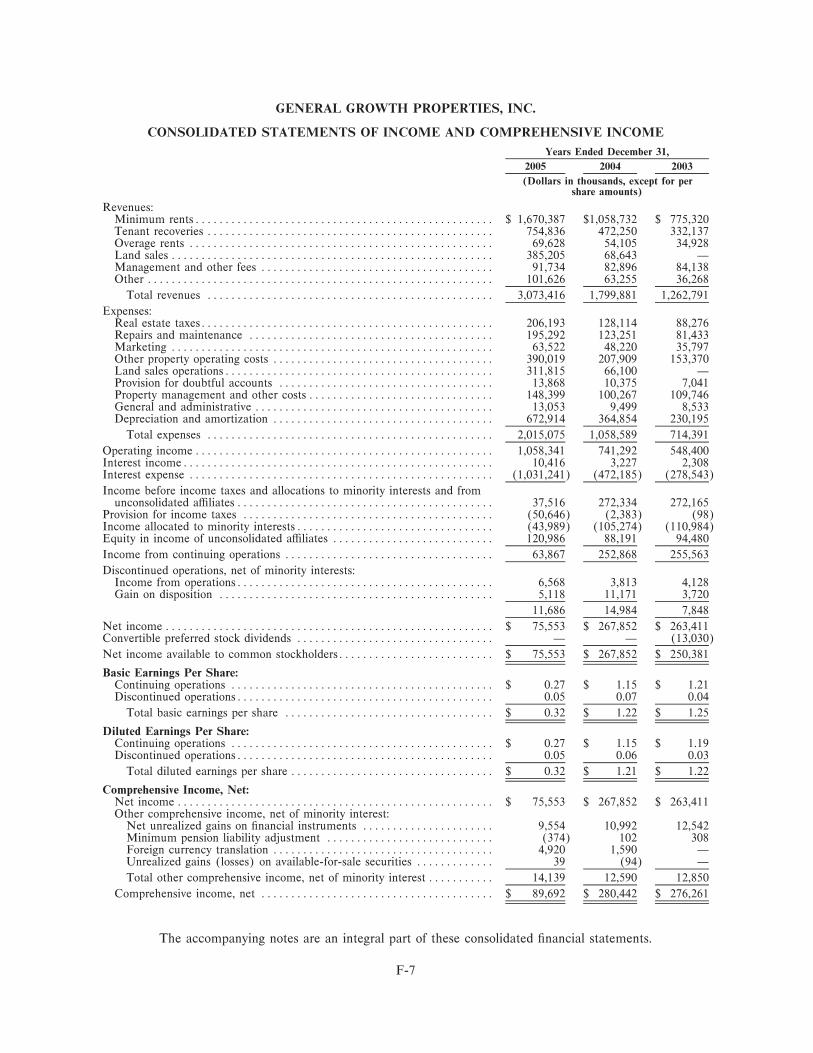
GENERAL GROWTH PROPERTIES, INC.
CONSOLIDATED STATEMENTS OF INCOME AND COMPREHENSIVE INCOME
Years Ended December 31,
2005 2004 2003
(Dollars in thousands, except for pershare amounts)
Revenues:Minimum rentsÏÏÏÏÏÏÏÏÏÏÏÏÏÏÏÏÏÏÏÏÏÏÏÏÏÏÏÏÏÏÏÏÏÏÏÏÏÏÏÏÏÏÏÏÏÏÏÏÏÏ $ 1,670,387 $1,058,732 $ 775,320Tenant recoveries ÏÏÏÏÏÏÏÏÏÏÏÏÏÏÏÏÏÏÏÏÏÏÏÏÏÏÏÏÏÏÏÏÏÏÏÏÏÏÏÏÏÏÏÏÏÏÏÏ 754,836 472,250 332,137Overage rents ÏÏÏÏÏÏÏÏÏÏÏÏÏÏÏÏÏÏÏÏÏÏÏÏÏÏÏÏÏÏÏÏÏÏÏÏÏÏÏÏÏÏÏÏÏÏÏÏÏÏÏ 69,628 54,105 34,928Land sales ÏÏÏÏÏÏÏÏÏÏÏÏÏÏÏÏÏÏÏÏÏÏÏÏÏÏÏÏÏÏÏÏÏÏÏÏÏÏÏÏÏÏÏÏÏÏÏÏÏÏÏÏÏÏ 385,205 68,643 ÌManagement and other fees ÏÏÏÏÏÏÏÏÏÏÏÏÏÏÏÏÏÏÏÏÏÏÏÏÏÏÏÏÏÏÏÏÏÏÏÏÏÏÏ 91,734 82,896 84,138Other ÏÏÏÏÏÏÏÏÏÏÏÏÏÏÏÏÏÏÏÏÏÏÏÏÏÏÏÏÏÏÏÏÏÏÏÏÏÏÏÏÏÏÏÏÏÏÏÏÏÏÏÏÏÏÏÏÏÏ 101,626 63,255 36,268
Total revenues ÏÏÏÏÏÏÏÏÏÏÏÏÏÏÏÏÏÏÏÏÏÏÏÏÏÏÏÏÏÏÏÏÏÏÏÏÏÏÏÏÏÏÏÏÏÏÏÏ 3,073,416 1,799,881 1,262,791
Expenses:Real estate taxesÏÏÏÏÏÏÏÏÏÏÏÏÏÏÏÏÏÏÏÏÏÏÏÏÏÏÏÏÏÏÏÏÏÏÏÏÏÏÏÏÏÏÏÏÏÏÏÏÏ 206,193 128,114 88,276Repairs and maintenance ÏÏÏÏÏÏÏÏÏÏÏÏÏÏÏÏÏÏÏÏÏÏÏÏÏÏÏÏÏÏÏÏÏÏÏÏÏÏÏÏÏ 195,292 123,251 81,433Marketing ÏÏÏÏÏÏÏÏÏÏÏÏÏÏÏÏÏÏÏÏÏÏÏÏÏÏÏÏÏÏÏÏÏÏÏÏÏÏÏÏÏÏÏÏÏÏÏÏÏÏÏÏÏÏ 63,522 48,220 35,797Other property operating costs ÏÏÏÏÏÏÏÏÏÏÏÏÏÏÏÏÏÏÏÏÏÏÏÏÏÏÏÏÏÏÏÏÏÏÏÏÏ 390,019 207,909 153,370Land sales operationsÏÏÏÏÏÏÏÏÏÏÏÏÏÏÏÏÏÏÏÏÏÏÏÏÏÏÏÏÏÏÏÏÏÏÏÏÏÏÏÏÏÏÏÏÏ 311,815 66,100 ÌProvision for doubtful accounts ÏÏÏÏÏÏÏÏÏÏÏÏÏÏÏÏÏÏÏÏÏÏÏÏÏÏÏÏÏÏÏÏÏÏÏÏ 13,868 10,375 7,041Property management and other costs ÏÏÏÏÏÏÏÏÏÏÏÏÏÏÏÏÏÏÏÏÏÏÏÏÏÏÏÏÏÏÏ 148,399 100,267 109,746General and administrative ÏÏÏÏÏÏÏÏÏÏÏÏÏÏÏÏÏÏÏÏÏÏÏÏÏÏÏÏÏÏÏÏÏÏÏÏÏÏÏÏ 13,053 9,499 8,533Depreciation and amortization ÏÏÏÏÏÏÏÏÏÏÏÏÏÏÏÏÏÏÏÏÏÏÏÏÏÏÏÏÏÏÏÏÏÏÏÏÏ 672,914 364,854 230,195
Total expenses ÏÏÏÏÏÏÏÏÏÏÏÏÏÏÏÏÏÏÏÏÏÏÏÏÏÏÏÏÏÏÏÏÏÏÏÏÏÏÏÏÏÏÏÏÏÏÏÏ 2,015,075 1,058,589 714,391
Operating incomeÏÏÏÏÏÏÏÏÏÏÏÏÏÏÏÏÏÏÏÏÏÏÏÏÏÏÏÏÏÏÏÏÏÏÏÏÏÏÏÏÏÏÏÏÏÏÏÏÏÏ 1,058,341 741,292 548,400Interest incomeÏÏÏÏÏÏÏÏÏÏÏÏÏÏÏÏÏÏÏÏÏÏÏÏÏÏÏÏÏÏÏÏÏÏÏÏÏÏÏÏÏÏÏÏÏÏÏÏÏÏÏÏ 10,416 3,227 2,308Interest expense ÏÏÏÏÏÏÏÏÏÏÏÏÏÏÏÏÏÏÏÏÏÏÏÏÏÏÏÏÏÏÏÏÏÏÏÏÏÏÏÏÏÏÏÏÏÏÏÏÏÏÏ (1,031,241) (472,185) (278,543)
Income before income taxes and allocations to minority interests and fromunconsolidated aÇliates ÏÏÏÏÏÏÏÏÏÏÏÏÏÏÏÏÏÏÏÏÏÏÏÏÏÏÏÏÏÏÏÏÏÏÏÏÏÏÏÏÏÏÏ 37,516 272,334 272,165
Provision for income taxes ÏÏÏÏÏÏÏÏÏÏÏÏÏÏÏÏÏÏÏÏÏÏÏÏÏÏÏÏÏÏÏÏÏÏÏÏÏÏÏÏÏÏ (50,646) (2,383) (98)Income allocated to minority interestsÏÏÏÏÏÏÏÏÏÏÏÏÏÏÏÏÏÏÏÏÏÏÏÏÏÏÏÏÏÏÏÏÏ (43,989) (105,274) (110,984)Equity in income of unconsolidated aÇliates ÏÏÏÏÏÏÏÏÏÏÏÏÏÏÏÏÏÏÏÏÏÏÏÏÏÏÏ 120,986 88,191 94,480
Income from continuing operations ÏÏÏÏÏÏÏÏÏÏÏÏÏÏÏÏÏÏÏÏÏÏÏÏÏÏÏÏÏÏÏÏÏÏÏ 63,867 252,868 255,563
Discontinued operations, net of minority interests:Income from operationsÏÏÏÏÏÏÏÏÏÏÏÏÏÏÏÏÏÏÏÏÏÏÏÏÏÏÏÏÏÏÏÏÏÏÏÏÏÏÏÏÏÏÏ 6,568 3,813 4,128Gain on disposition ÏÏÏÏÏÏÏÏÏÏÏÏÏÏÏÏÏÏÏÏÏÏÏÏÏÏÏÏÏÏÏÏÏÏÏÏÏÏÏÏÏÏÏÏÏÏ 5,118 11,171 3,720
11,686 14,984 7,848
Net income ÏÏÏÏÏÏÏÏÏÏÏÏÏÏÏÏÏÏÏÏÏÏÏÏÏÏÏÏÏÏÏÏÏÏÏÏÏÏÏÏÏÏÏÏÏÏÏÏÏÏÏÏÏÏÏ $ 75,553 $ 267,852 $ 263,411Convertible preferred stock dividends ÏÏÏÏÏÏÏÏÏÏÏÏÏÏÏÏÏÏÏÏÏÏÏÏÏÏÏÏÏÏÏÏÏ Ì Ì (13,030)
Net income available to common stockholdersÏÏÏÏÏÏÏÏÏÏÏÏÏÏÏÏÏÏÏÏÏÏÏÏÏÏ $ 75,553 $ 267,852 $ 250,381
Basic Earnings Per Share:Continuing operations ÏÏÏÏÏÏÏÏÏÏÏÏÏÏÏÏÏÏÏÏÏÏÏÏÏÏÏÏÏÏÏÏÏÏÏÏÏÏÏÏÏÏÏÏ $ 0.27 $ 1.15 $ 1.21Discontinued operationsÏÏÏÏÏÏÏÏÏÏÏÏÏÏÏÏÏÏÏÏÏÏÏÏÏÏÏÏÏÏÏÏÏÏÏÏÏÏÏÏÏÏÏ 0.05 0.07 0.04
Total basic earnings per share ÏÏÏÏÏÏÏÏÏÏÏÏÏÏÏÏÏÏÏÏÏÏÏÏÏÏÏÏÏÏÏÏÏÏÏ $ 0.32 $ 1.22 $ 1.25
Diluted Earnings Per Share:Continuing operations ÏÏÏÏÏÏÏÏÏÏÏÏÏÏÏÏÏÏÏÏÏÏÏÏÏÏÏÏÏÏÏÏÏÏÏÏÏÏÏÏÏÏÏÏ $ 0.27 $ 1.15 $ 1.19Discontinued operationsÏÏÏÏÏÏÏÏÏÏÏÏÏÏÏÏÏÏÏÏÏÏÏÏÏÏÏÏÏÏÏÏÏÏÏÏÏÏÏÏÏÏÏ 0.05 0.06 0.03
Total diluted earnings per share ÏÏÏÏÏÏÏÏÏÏÏÏÏÏÏÏÏÏÏÏÏÏÏÏÏÏÏÏÏÏÏÏÏÏ $ 0.32 $ 1.21 $ 1.22
Comprehensive Income, Net:Net income ÏÏÏÏÏÏÏÏÏÏÏÏÏÏÏÏÏÏÏÏÏÏÏÏÏÏÏÏÏÏÏÏÏÏÏÏÏÏÏÏÏÏÏÏÏÏÏÏÏÏÏÏÏ $ 75,553 $ 267,852 $ 263,411Other comprehensive income, net of minority interest:
Net unrealized gains on Ñnancial instruments ÏÏÏÏÏÏÏÏÏÏÏÏÏÏÏÏÏÏÏÏÏÏ 9,554 10,992 12,542Minimum pension liability adjustment ÏÏÏÏÏÏÏÏÏÏÏÏÏÏÏÏÏÏÏÏÏÏÏÏÏÏÏÏ (374) 102 308Foreign currency translation ÏÏÏÏÏÏÏÏÏÏÏÏÏÏÏÏÏÏÏÏÏÏÏÏÏÏÏÏÏÏÏÏÏÏÏÏÏ 4,920 1,590 ÌUnrealized gains (losses) on available-for-sale securities ÏÏÏÏÏÏÏÏÏÏÏÏÏ 39 (94) Ì
Total other comprehensive income, net of minority interest ÏÏÏÏÏÏÏÏÏÏÏ 14,139 12,590 12,850
Comprehensive income, net ÏÏÏÏÏÏÏÏÏÏÏÏÏÏÏÏÏÏÏÏÏÏÏÏÏÏÏÏÏÏÏÏÏÏÏÏÏÏÏ $ 89,692 $ 280,442 $ 276,261
The accompanying notes are an integral part of these consolidated Ñnancial statements.
F-7
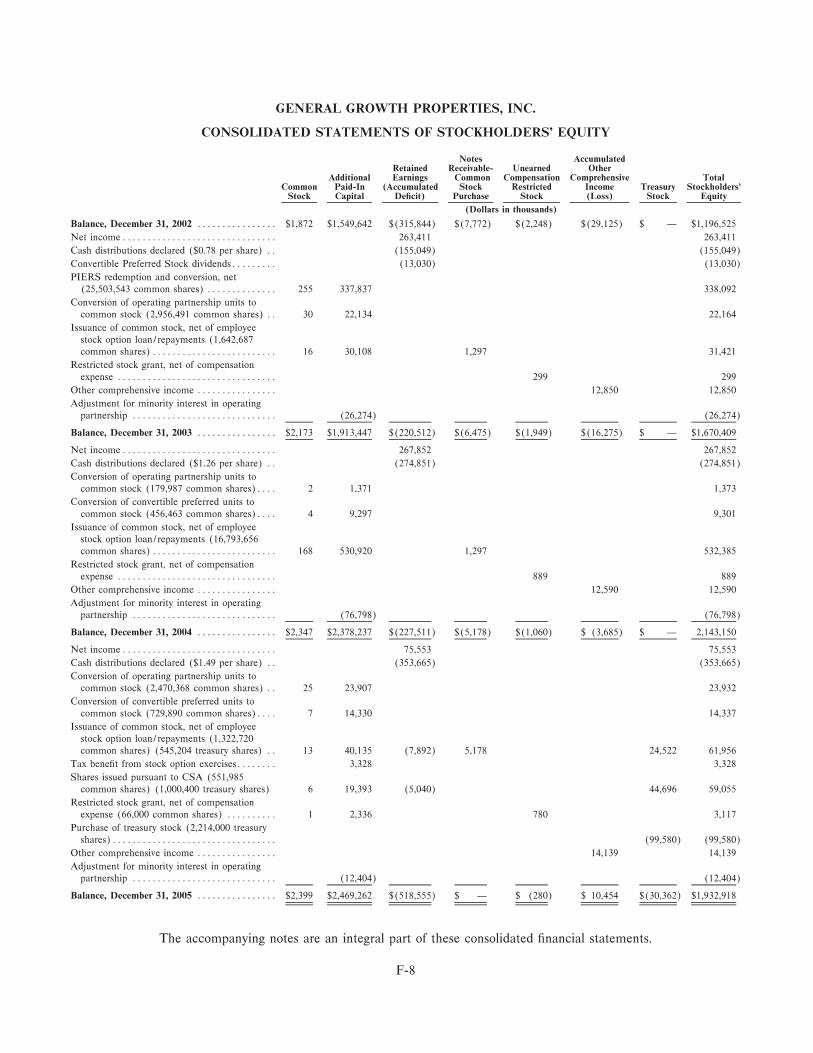
GENERAL GROWTH PROPERTIES, INC.
CONSOLIDATED STATEMENTS OF STOCKHOLDERS' EQUITY
Notes AccumulatedRetained Receivable- Unearned Other
Additional Earnings Common Compensation Comprehensive TotalCommon Paid-In (Accumulated Stock Restricted Income Treasury Stockholders'Stock Capital DeÑcit) Purchase Stock (Loss) Stock Equity
(Dollars in thousands)
Balance, December 31, 2002 ÏÏÏÏÏÏÏÏÏÏÏÏÏÏÏÏ $1,872 $1,549,642 $(315,844) $(7,772) $(2,248) $(29,125) $ Ì $1,196,525
Net incomeÏÏÏÏÏÏÏÏÏÏÏÏÏÏÏÏÏÏÏÏÏÏÏÏÏÏÏÏÏÏÏ 263,411 263,411
Cash distributions declared ($0.78 per share) ÏÏ (155,049) (155,049)
Convertible Preferred Stock dividendsÏÏÏÏÏÏÏÏÏ (13,030) (13,030)
PIERS redemption and conversion, net(25,503,543 common shares) ÏÏÏÏÏÏÏÏÏÏÏÏÏÏ 255 337,837 338,092
Conversion of operating partnership units tocommon stock (2,956,491 common shares) ÏÏ 30 22,134 22,164
Issuance of common stock, net of employeestock option loan/repayments (1,642,687common shares)ÏÏÏÏÏÏÏÏÏÏÏÏÏÏÏÏÏÏÏÏÏÏÏÏÏ 16 30,108 1,297 31,421
Restricted stock grant, net of compensationexpense ÏÏÏÏÏÏÏÏÏÏÏÏÏÏÏÏÏÏÏÏÏÏÏÏÏÏÏÏÏÏÏÏ 299 299
Other comprehensive income ÏÏÏÏÏÏÏÏÏÏÏÏÏÏÏÏ 12,850 12,850
Adjustment for minority interest in operatingpartnership ÏÏÏÏÏÏÏÏÏÏÏÏÏÏÏÏÏÏÏÏÏÏÏÏÏÏÏÏÏ (26,274) (26,274)
Balance, December 31, 2003 ÏÏÏÏÏÏÏÏÏÏÏÏÏÏÏÏ $2,173 $1,913,447 $(220,512) $(6,475) $(1,949) $(16,275) $ Ì $1,670,409
Net incomeÏÏÏÏÏÏÏÏÏÏÏÏÏÏÏÏÏÏÏÏÏÏÏÏÏÏÏÏÏÏÏ 267,852 267,852
Cash distributions declared ($1.26 per share) ÏÏ (274,851) (274,851)
Conversion of operating partnership units tocommon stock (179,987 common shares)ÏÏÏÏ 2 1,371 1,373
Conversion of convertible preferred units tocommon stock (456,463 common shares)ÏÏÏÏ 4 9,297 9,301
Issuance of common stock, net of employeestock option loan/repayments (16,793,656common shares)ÏÏÏÏÏÏÏÏÏÏÏÏÏÏÏÏÏÏÏÏÏÏÏÏÏ 168 530,920 1,297 532,385
Restricted stock grant, net of compensationexpense ÏÏÏÏÏÏÏÏÏÏÏÏÏÏÏÏÏÏÏÏÏÏÏÏÏÏÏÏÏÏÏÏ 889 889
Other comprehensive income ÏÏÏÏÏÏÏÏÏÏÏÏÏÏÏÏ 12,590 12,590
Adjustment for minority interest in operatingpartnership ÏÏÏÏÏÏÏÏÏÏÏÏÏÏÏÏÏÏÏÏÏÏÏÏÏÏÏÏÏ (76,798) (76,798)
Balance, December 31, 2004 ÏÏÏÏÏÏÏÏÏÏÏÏÏÏÏÏ $2,347 $2,378,237 $(227,511) $(5,178) $(1,060) $ (3,685) $ Ì 2,143,150
Net incomeÏÏÏÏÏÏÏÏÏÏÏÏÏÏÏÏÏÏÏÏÏÏÏÏÏÏÏÏÏÏÏ 75,553 75,553
Cash distributions declared ($1.49 per share) ÏÏ (353,665) (353,665)
Conversion of operating partnership units tocommon stock (2,470,368 common shares) ÏÏ 25 23,907 23,932
Conversion of convertible preferred units tocommon stock (729,890 common shares)ÏÏÏÏ 7 14,330 14,337
Issuance of common stock, net of employeestock option loan/repayments (1,322,720common shares) (545,204 treasury shares) ÏÏ 13 40,135 (7,892) 5,178 24,522 61,956
Tax beneÑt from stock option exercisesÏÏÏÏÏÏÏÏ 3,328 3,328
Shares issued pursuant to CSA (551,985common shares) (1,000,400 treasury shares) 6 19,393 (5,040) 44,696 59,055
Restricted stock grant, net of compensationexpense (66,000 common shares) ÏÏÏÏÏÏÏÏÏÏ 1 2,336 780 3,117
Purchase of treasury stock (2,214,000 treasuryshares)ÏÏÏÏÏÏÏÏÏÏÏÏÏÏÏÏÏÏÏÏÏÏÏÏÏÏÏÏÏÏÏÏÏ (99,580) (99,580)
Other comprehensive income ÏÏÏÏÏÏÏÏÏÏÏÏÏÏÏÏ 14,139 14,139
Adjustment for minority interest in operatingpartnership ÏÏÏÏÏÏÏÏÏÏÏÏÏÏÏÏÏÏÏÏÏÏÏÏÏÏÏÏÏ (12,404) (12,404)
Balance, December 31, 2005 ÏÏÏÏÏÏÏÏÏÏÏÏÏÏÏÏ $2,399 $2,469,262 $(518,555) $ Ì $ (280) $ 10,454 $(30,362) $1,932,918
The accompanying notes are an integral part of these consolidated Ñnancial statements.
F-8

GENERAL GROWTH PROPERTIES, INC.
CONSOLIDATED STATEMENTS OF CASH FLOWSYears Ended December 31,
2005 2004 2003
(In thousands)Cash Flows from Operating Activities:
Net incomeÏÏÏÏÏÏÏÏÏÏÏÏÏÏÏÏÏÏÏÏÏÏÏÏÏÏÏÏÏÏÏÏÏÏÏÏÏÏÏÏÏÏÏÏÏÏÏÏÏÏÏÏÏÏÏÏÏÏÏÏÏÏÏÏ $ 75,553 $ 267,852 $ 263,411Adjustments to reconcile net income to net cash provided by operating activities:
Minority interests, including discontinued operations ÏÏÏÏÏÏÏÏÏÏÏÏÏÏÏÏÏÏÏÏÏÏÏÏÏ 45,488 106,233 113,289Equity in income of unconsolidated aÇliates ÏÏÏÏÏÏÏÏÏÏÏÏÏÏÏÏÏÏÏÏÏÏÏÏÏÏÏÏÏÏÏÏ (120,986) (88,191) (94,480)Provision for doubtful accounts, including discontinued operations ÏÏÏÏÏÏÏÏÏÏÏÏÏÏ 13,876 10,393 7,009Distributions received from unconsolidated aÇliatesÏÏÏÏÏÏÏÏÏÏÏÏÏÏÏÏÏÏÏÏÏÏÏÏÏÏ 119,602 87,906 91,613Depreciation, including discontinued operations ÏÏÏÏÏÏÏÏÏÏÏÏÏÏÏÏÏÏÏÏÏÏÏÏÏÏÏÏÏ 657,358 348,303 205,385Amortization, including discontinued operations ÏÏÏÏÏÏÏÏÏÏÏÏÏÏÏÏÏÏÏÏÏÏÏÏÏÏÏÏÏ 30,536 28,753 34,849Amortization of debt market rate adjustment ÏÏÏÏÏÏÏÏÏÏÏÏÏÏÏÏÏÏÏÏÏÏÏÏÏÏÏÏÏÏÏ (46,993) (1,026) (723)Gain on disposition ÏÏÏÏÏÏÏÏÏÏÏÏÏÏÏÏÏÏÏÏÏÏÏÏÏÏÏÏÏÏÏÏÏÏÏÏÏÏÏÏÏÏÏÏÏÏÏÏÏÏÏÏÏ (5,118) (11,172) (4,831)Participation expense pursuant to Contingent Stock Agreement ÏÏÏÏÏÏÏÏÏÏÏÏÏÏÏÏ 106,285 8,513 ÌLand development and acquisitions expenditures ÏÏÏÏÏÏÏÏÏÏÏÏÏÏÏÏÏÏÏÏÏÏÏÏÏÏÏÏ (140,823) (27,563) ÌCost of land sales ÏÏÏÏÏÏÏÏÏÏÏÏÏÏÏÏÏÏÏÏÏÏÏÏÏÏÏÏÏÏÏÏÏÏÏÏÏÏÏÏÏÏÏÏÏÏÏÏÏÏÏÏÏÏ 181,301 51,659 ÌDebt assumed by purchasers of landÏÏÏÏÏÏÏÏÏÏÏÏÏÏÏÏÏÏÏÏÏÏÏÏÏÏÏÏÏÏÏÏÏÏÏÏÏÏÏ (11,371) (318) ÌDeferred income taxes ÏÏÏÏÏÏÏÏÏÏÏÏÏÏÏÏÏÏÏÏÏÏÏÏÏÏÏÏÏÏÏÏÏÏÏÏÏÏÏÏÏÏÏÏÏÏÏÏÏÏ 28,596 1,993 ÌProceeds from the sale of marketable securities, including deÑned contribution
plan assets ÏÏÏÏÏÏÏÏÏÏÏÏÏÏÏÏÏÏÏÏÏÏÏÏÏÏÏÏÏÏÏÏÏÏÏÏÏÏÏÏÏÏÏÏÏÏÏÏÏÏÏÏÏÏÏÏÏÏ 27,740 7,954 ÌNet changes:
Accounts and notes receivable ÏÏÏÏÏÏÏÏÏÏÏÏÏÏÏÏÏÏÏÏÏÏÏÏÏÏÏÏÏÏÏÏÏÏÏÏÏÏÏÏÏÏ (85,125) (21,177) (29,304)Prepaid expenses and other assets ÏÏÏÏÏÏÏÏÏÏÏÏÏÏÏÏÏÏÏÏÏÏÏÏÏÏÏÏÏÏÏÏÏÏÏÏÏÏÏ (32,701) 21,463 16,269Deferred expenses ÏÏÏÏÏÏÏÏÏÏÏÏÏÏÏÏÏÏÏÏÏÏÏÏÏÏÏÏÏÏÏÏÏÏÏÏÏÏÏÏÏÏÏÏÏÏÏÏÏÏÏÏ (73,048) (43,485) (54,535)Accounts payable and accrued expensesÏÏÏÏÏÏÏÏÏÏÏÏÏÏÏÏÏÏÏÏÏÏÏÏÏÏÏÏÏÏÏÏÏÏ 61,909 (44,614) 34,683Other, net ÏÏÏÏÏÏÏÏÏÏÏÏÏÏÏÏÏÏÏÏÏÏÏÏÏÏÏÏÏÏÏÏÏÏÏÏÏÏÏÏÏÏÏÏÏÏÏÏÏÏÏÏÏÏÏÏÏÏÏ 9,899 15,900 3,100
Net cash provided by operating activities ÏÏÏÏÏÏÏÏÏÏÏÏÏÏÏÏÏÏÏÏÏÏÏÏÏÏÏÏÏÏÏÏÏ 841,978 719,376 585,735
Cash Flows from Investing Activities:Acquisition/development of real estate and property additions/improvements ÏÏÏÏÏÏÏÏ (497,977) (9,000,108) (1,732,358)Proceeds from sale of investment property ÏÏÏÏÏÏÏÏÏÏÏÏÏÏÏÏÏÏÏÏÏÏÏÏÏÏÏÏÏÏÏÏÏÏÏÏÏÏ 143,543 65,268 14,978Increase in investments in unconsolidated aÇliatesÏÏÏÏÏÏÏÏÏÏÏÏÏÏÏÏÏÏÏÏÏÏÏÏÏÏÏÏÏÏÏ (195,642) (211,247) (26,418)Increase in restricted cash ÏÏÏÏÏÏÏÏÏÏÏÏÏÏÏÏÏÏÏÏÏÏÏÏÏÏÏÏÏÏÏÏÏÏÏÏÏÏÏÏÏÏÏÏÏÏÏÏÏÏÏ (22,950) (1,951) (7,971)Insurance recoveries ÏÏÏÏÏÏÏÏÏÏÏÏÏÏÏÏÏÏÏÏÏÏÏÏÏÏÏÏÏÏÏÏÏÏÏÏÏÏÏÏÏÏÏÏÏÏÏÏÏÏÏÏÏÏÏÏ 5,000 Ì ÌDistributions received from unconsolidated aÇliates in excess of income ÏÏÏÏÏÏÏÏÏÏÏÏ 260,639 134,116 90,925Loans (to) from unconsolidated aÇliates, net ÏÏÏÏÏÏÏÏÏÏÏÏÏÏÏÏÏÏÏÏÏÏÏÏÏÏÏÏÏÏÏÏÏÏÏ 126,500 (8,884) (94,355)Other, net ÏÏÏÏÏÏÏÏÏÏÏÏÏÏÏÏÏÏÏÏÏÏÏÏÏÏÏÏÏÏÏÏÏÏÏÏÏÏÏÏÏÏÏÏÏÏÏÏÏÏÏÏÏÏÏÏÏÏÏÏÏÏÏÏÏ 21,322 1,297 1,773
Net cash used in investing activities ÏÏÏÏÏÏÏÏÏÏÏÏÏÏÏÏÏÏÏÏÏÏÏÏÏÏÏÏÏÏÏÏÏÏÏÏÏÏÏÏÏ (159,565) (9,021,509) (1,753,426)
Cash Flows from Financing Activities:Cash distributions paid to common stockholdersÏÏÏÏÏÏÏÏÏÏÏÏÏÏÏÏÏÏÏÏÏÏÏÏÏÏÏÏÏÏÏÏÏ (353,665) (274,851) (199,986)Cash distributions paid to holders of Common Units ÏÏÏÏÏÏÏÏÏÏÏÏÏÏÏÏÏÏÏÏÏÏÏÏÏÏÏÏÏ (80,885) (70,412) (59,815)Cash distributions paid to holders of perpetual and convertible preferred unitsÏÏÏÏÏÏÏÏ (27,329) (37,152) (40,257)Payment of dividends on PIERSÏÏÏÏÏÏÏÏÏÏÏÏÏÏÏÏÏÏÏÏÏÏÏÏÏÏÏÏÏÏÏÏÏÏÏÏÏÏÏÏÏÏÏÏÏÏ Ì Ì (19,145)Proceeds from issuance of common stock, including from common stock plans ÏÏÏÏÏÏÏ 45,208 531,976 31,308Purchase of treasury stock ÏÏÏÏÏÏÏÏÏÏÏÏÏÏÏÏÏÏÏÏÏÏÏÏÏÏÏÏÏÏÏÏÏÏÏÏÏÏÏÏÏÏÏÏÏÏÏÏÏÏÏ (98,939) Ì ÌRedemption of preferred minority interests ÏÏÏÏÏÏÏÏÏÏÏÏÏÏÏÏÏÏÏÏÏÏÏÏÏÏÏÏÏÏÏÏÏÏÏÏÏ (183,000) (107,923) ÌProceeds from issuance of mortgage notes and other property debt payable ÏÏÏÏÏÏÏÏÏÏ 3,907,254 12,733,339 3,140,750Principal payments on mortgage notes and other property debt payable ÏÏÏÏÏÏÏÏÏÏÏÏÏ (3,791,978) (4,430,532) (1,715,029)Other, net ÏÏÏÏÏÏÏÏÏÏÏÏÏÏÏÏÏÏÏÏÏÏÏÏÏÏÏÏÏÏÏÏÏÏÏÏÏÏÏÏÏÏÏÏÏÏÏÏÏÏÏÏÏÏÏÏÏÏÏÏÏÏÏÏÏ (35,869) (13,408) (13,098)
Net cash (used in) provided by Ñnancing activities ÏÏÏÏÏÏÏÏÏÏÏÏÏÏÏÏÏÏÏÏÏÏÏÏÏÏÏÏ (619,203) 8,331,037 1,124,728
Net change in cash and cash equivalents ÏÏÏÏÏÏÏÏÏÏÏÏÏÏÏÏÏÏÏÏÏÏÏÏÏÏÏÏÏÏÏÏÏÏÏÏÏÏÏÏÏ 63,210 28,904 (42,963)Cash and cash equivalents at beginning of period ÏÏÏÏÏÏÏÏÏÏÏÏÏÏÏÏÏÏÏÏÏÏÏÏÏÏÏÏÏÏÏÏÏÏ 39,581 10,677 53,640
Cash and cash equivalents at end of period ÏÏÏÏÏÏÏÏÏÏÏÏÏÏÏÏÏÏÏÏÏÏÏÏÏÏÏÏÏÏÏÏÏÏÏÏÏÏÏ $ 102,791 $ 39,581 $ 10,677
Supplemental Disclosure of Cash Flow Information:Interest paid ÏÏÏÏÏÏÏÏÏÏÏÏÏÏÏÏÏÏÏÏÏÏÏÏÏÏÏÏÏÏÏÏÏÏÏÏÏÏÏÏÏÏÏÏÏÏÏÏÏÏÏÏÏÏÏÏÏÏÏÏÏÏÏ $ 1,074,874 $ 424,380 $ 258,395Interest capitalized ÏÏÏÏÏÏÏÏÏÏÏÏÏÏÏÏÏÏÏÏÏÏÏÏÏÏÏÏÏÏÏÏÏÏÏÏÏÏÏÏÏÏÏÏÏÏÏÏÏÏÏÏÏÏÏÏÏ 54,260 11,272 5,679Income taxes paid ÏÏÏÏÏÏÏÏÏÏÏÏÏÏÏÏÏÏÏÏÏÏÏÏÏÏÏÏÏÏÏÏÏÏÏÏÏÏÏÏÏÏÏÏÏÏÏÏÏÏÏÏÏÏÏÏÏÏ 8,170 390 98
Non-Cash Investing and Financing Activities:Common stock issued in exchange for PIERS ÏÏÏÏÏÏÏÏÏÏÏÏÏÏÏÏÏÏÏÏÏÏÏÏÏÏÏÏÏÏÏÏÏÏ $ Ì $ Ì $ 337,483Common stock issued in exchange for Operating Partnership UnitsÏÏÏÏÏÏÏÏÏÏÏÏÏÏÏÏÏ 23,932 1,373 22,134Common stock issued in exchange for convertible preferred units ÏÏÏÏÏÏÏÏÏÏÏÏÏÏÏÏÏÏ 14,337 9,301 ÌAssumption of debt in conjunction with acquisition of property ÏÏÏÏÏÏÏÏÏÏÏÏÏÏÏÏÏÏÏÏ Ì 134,902 552,174Common stock issued pursuant to Contingent Stock Agreement ÏÏÏÏÏÏÏÏÏÏÏÏÏÏÏÏÏÏÏ 59,055 Ì ÌOperating Partnership Units issued as consideration for purchase of real estate ÏÏÏÏÏÏÏ Ì 25,132 26,637TRC Merger:
Fair value of assets acquired ÏÏÏÏÏÏÏÏÏÏÏÏÏÏÏÏÏÏÏÏÏÏÏÏÏÏÏÏÏÏÏÏÏÏÏÏÏÏÏÏÏÏÏÏÏÏÏ (134,166) 14,327,519 ÌCash paid ÏÏÏÏÏÏÏÏÏÏÏÏÏÏÏÏÏÏÏÏÏÏÏÏÏÏÏÏÏÏÏÏÏÏÏÏÏÏÏÏÏÏÏÏÏÏÏÏÏÏÏÏÏÏÏÏÏÏÏÏÏÏÏ Ì (7,150,844) ÌLiabilities assumed ÏÏÏÏÏÏÏÏÏÏÏÏÏÏÏÏÏÏÏÏÏÏÏÏÏÏÏÏÏÏÏÏÏÏÏÏÏÏÏÏÏÏÏÏÏÏÏÏÏÏÏÏÏÏÏ (125,925) 7,176,675 Ì
The accompanying notes are an integral part of these consolidated Ñnancial statements.
F-9
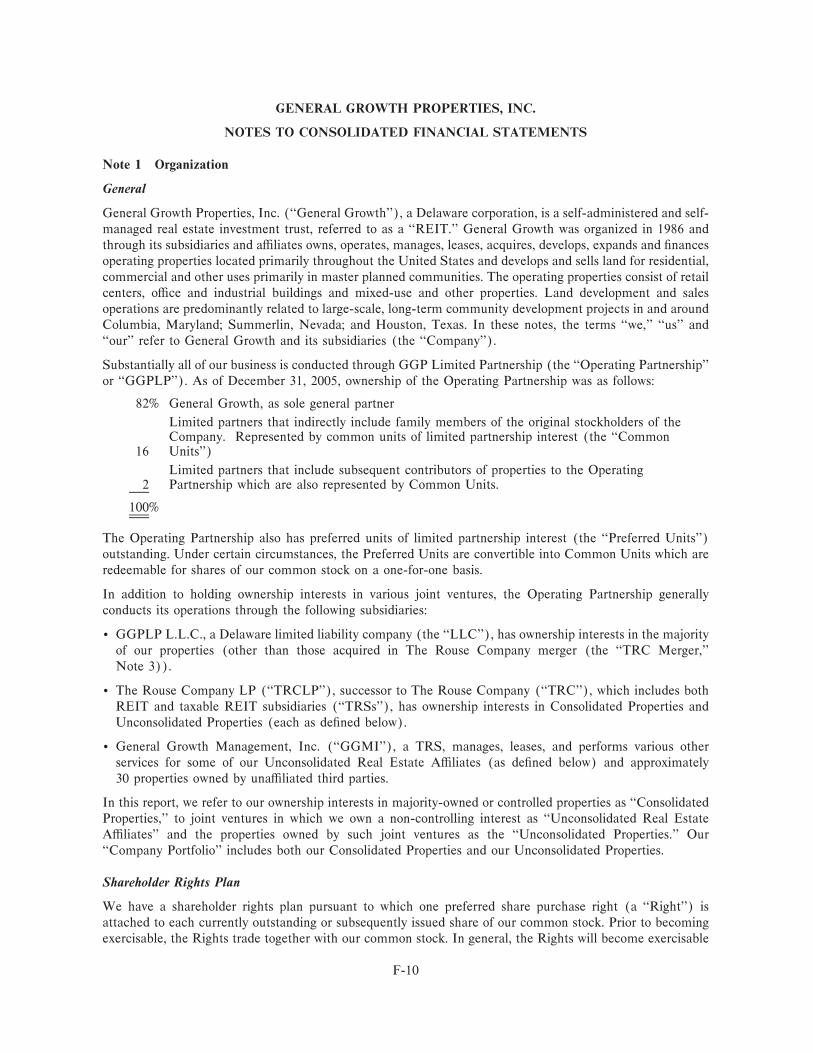
GENERAL GROWTH PROPERTIES, INC.
NOTES TO CONSOLIDATED FINANCIAL STATEMENTS
Note 1 Organization
General
General Growth Properties, Inc. (""General Growth''), a Delaware corporation, is a self-administered and self-managed real estate investment trust, referred to as a ""REIT.'' General Growth was organized in 1986 andthrough its subsidiaries and aÇliates owns, operates, manages, leases, acquires, develops, expands and Ñnancesoperating properties located primarily throughout the United States and develops and sells land for residential,commercial and other uses primarily in master planned communities. The operating properties consist of retailcenters, oÇce and industrial buildings and mixed-use and other properties. Land development and salesoperations are predominantly related to large-scale, long-term community development projects in and aroundColumbia, Maryland; Summerlin, Nevada; and Houston, Texas. In these notes, the terms ""we,'' ""us'' and""our'' refer to General Growth and its subsidiaries (the ""Company'').
Substantially all of our business is conducted through GGP Limited Partnership (the ""Operating Partnership''or ""GGPLP''). As of December 31, 2005, ownership of the Operating Partnership was as follows:
82% General Growth, as sole general partner
Limited partners that indirectly include family members of the original stockholders of theCompany. Represented by common units of limited partnership interest (the ""Common
16 Units'')
Limited partners that include subsequent contributors of properties to the Operating2 Partnership which are also represented by Common Units.
100%
The Operating Partnership also has preferred units of limited partnership interest (the ""Preferred Units'')outstanding. Under certain circumstances, the Preferred Units are convertible into Common Units which areredeemable for shares of our common stock on a one-for-one basis.
In addition to holding ownership interests in various joint ventures, the Operating Partnership generallyconducts its operations through the following subsidiaries:
‚ GGPLP L.L.C., a Delaware limited liability company (the ""LLC''), has ownership interests in the majorityof our properties (other than those acquired in The Rouse Company merger (the ""TRC Merger,''Note 3)).
‚ The Rouse Company LP (""TRCLP''), successor to The Rouse Company (""TRC''), which includes bothREIT and taxable REIT subsidiaries (""TRSs''), has ownership interests in Consolidated Properties andUnconsolidated Properties (each as deÑned below).
‚ General Growth Management, Inc. (""GGMI''), a TRS, manages, leases, and performs various otherservices for some of our Unconsolidated Real Estate AÇliates (as deÑned below) and approximately30 properties owned by unaÇliated third parties.
In this report, we refer to our ownership interests in majority-owned or controlled properties as ""ConsolidatedProperties,'' to joint ventures in which we own a non-controlling interest as ""Unconsolidated Real EstateAÇliates'' and the properties owned by such joint ventures as the ""Unconsolidated Properties.'' Our""Company Portfolio'' includes both our Consolidated Properties and our Unconsolidated Properties.
Shareholder Rights Plan
We have a shareholder rights plan pursuant to which one preferred share purchase right (a ""Right'') isattached to each currently outstanding or subsequently issued share of our common stock. Prior to becomingexercisable, the Rights trade together with our common stock. In general, the Rights will become exercisable
F-10
GENERAL GROWTH PROPERTIES, INC.
NOTES TO CONSOLIDATED FINANCIAL STATEMENTS Ì (Continued)
if a person or group acquires or announces a tender or exchange oÅer for 15% or more of our common stock.Each Right will initially entitle the holder to purchase from General Growth one-third of one-thousandth of ashare of Series A Junior Participating Preferred Stock, par value $100 per share (the ""Preferred Stock''), atan exercise price of $148 per one one-thousandth of a share, subject to adjustment. If a person or groupacquires 15% or more of our common stock, each Right will entitle the holder (other than the acquirer) topurchase shares of our common stock (or, in certain circumstances, cash or other securities) having a marketvalue of twice the exercise price of a Right at such time. Under certain circumstances, each Right will entitlethe holder (other than the acquirer) to purchase the common stock of the acquirer having a market value oftwice the exercise price of a Right at such time. In addition, under certain circumstances, our Board ofDirectors may exchange each Right (other than those held by the acquirer) for one share of our commonstock, subject to adjustment. If the Rights become exercisable, holders of common units of partnershipinterest in the Operating Partnership, other than General Growth, will receive the number of Rights theywould have received if their units had been redeemed and the purchase price paid in our common stock. TheRights expire on November 18, 2008, unless earlier redeemed by our Board of Directors for one-third of $0.01per Right or such expiration date is extended.
Dividend Reinvestment and Stock Purchase Plan
We have reserved up to 3.0 million shares of our common stock for issuance under the Dividend Reinvestmentand Stock Purchase Plan (""DRSP''). In general, the DRSP allows participants to make purchases of ourcommon stock from dividends received or additional cash investments. Although the purchase price of thecommon stock is determined by the current market price, the purchases are made without fees or commissionscharged to the participant. We have and will continue to satisfy DRSP common stock purchase needs throughthe issuance of new shares of our common stock or by repurchases of currently outstanding common stock. Asof December 31, 2005, an aggregate of 535,528 shares of our common stock have been issued under theDRSP.
Note 2 Summary of SigniÑcant Accounting Policies
Principles of Consolidation
The accompanying consolidated Ñnancial statements include the accounts of General Growth, our subsidiariesand joint ventures in which we have a controlling interest. Income allocated to minority interests in these jointventures includes the share of such properties' operations (generally computed as the respective joint venturepartner ownership percentage) applicable to such non-controlling venturers. All signiÑcant intercompanybalances and transactions have been eliminated.
Properties
Real estate assets are stated at cost. Construction and improvement costs incurred in connection with thedevelopment of new properties or the redevelopment of existing properties are capitalized to the extent thetotal carrying value of the property does not exceed the estimated fair value of the completed property. Realestate taxes and interest costs incurred during construction periods are capitalized. Capitalized interest costsare based on qualiÑed expenditures and interest rates in place during the construction period. Capitalized realestate taxes and interest costs are amortized over lives which are consistent with the constructed assets.
Pre-development costs, which generally include legal and professional fees and other directly-related third-party costs, are capitalized as part of the property being developed. In the event a development is no longerdeemed to be probable, the costs previously capitalized are expensed.
F-11
GENERAL GROWTH PROPERTIES, INC.
NOTES TO CONSOLIDATED FINANCIAL STATEMENTS Ì (Continued)
Tenant improvements, either paid directly or in the form of construction allowances paid to tenants, arecapitalized and depreciated over the average lease term. Maintenance and repairs are charged to expense whenincurred. Expenditures for signiÑcant betterments and improvements are capitalized.
Our real estate assets, including developments in progress, are reviewed for impairment whenever events orchanges in circumstances indicate that the carrying value may not be recoverable. A real estate asset isconsidered to be impaired when the estimated future undiscounted operating cash Öow is less than its carryingvalue. To the extent an impairment has occurred, the excess of the carrying value of the asset over itsestimated fair value will be expensed to operations.
Depreciation or amortization expense is computed using the straight-line method based upon the followingestimated useful lives:
Years
Buildings and improvements ÏÏÏÏÏÏÏÏÏÏÏÏÏÏÏÏÏÏÏÏÏÏÏÏÏÏÏÏÏÏÏÏÏÏÏÏÏÏÏÏÏÏÏÏÏÏÏÏÏÏÏÏ 40-45
Equipment, tenant improvements and Ñxtures ÏÏÏÏÏÏÏÏÏÏÏÏÏÏÏÏÏÏÏÏÏÏÏÏÏÏÏÏÏÏÏÏÏÏÏÏÏ 5-10
Acquisitions of Operating Properties
Acquisitions of properties are accounted for utilizing the purchase method and, accordingly, the results ofoperations of acquired properties are included in our results of operations from the respective dates ofacquisition. Estimates of future cash Öows and other valuation techniques are used to allocate the purchaseprice of acquired property between land, buildings and improvements, equipment and identiÑable intangibleassets and liabilities such as amounts related to in-place at-market tenant leases, acquired above and below-market tenant and ground leases and tenant relationships. Initial valuations are subject to change until suchinformation is Ñnalized no later than 12 months from the acquisition date.
The fair values of tangible assets are determined on an ""if vacant'' basis. The ""if-vacant'' fair value is allocatedto land, where applicable, buildings, tenant improvements and equipment based on comparable sales and otherrelevant information obtained in connection with the acquisition of the property.
The estimated fair value of acquired in-place at-market tenant leases are the costs we would have incurred tolease the property to the occupancy level of the property at the date of acquisition. Such estimate includes thefair value of leasing commissions, legal costs and tenant coordination costs that would be incurred to lease theproperty to this occupancy level. Additionally, we evaluate the time period over which such occupancy levelwould be achieved and include an estimate of the net operating costs (primarily real estate taxes, insuranceand utilities) incurred during the lease-up period, which generally ranges up to one year. Acquired in-place at-market tenant leases are amortized over the average lease term.
Intangible assets and liabilities are also recorded for above-market and below-market in-place tenant andground leases where we are either the lessor or the lessee. Above-market and below-market in-place tenantand ground lease values are recorded based on the present value (using an interest rate which reÖects the risksassociated with the leases acquired) of the diÅerence between the contractual amounts to be received or paidpursuant to the in-place leases and our estimate of fair market lease rates for the corresponding in-place leases,measured over a period equal to the remaining non-cancelable term of the leases. Above and below-marketlease values are amortized over the remaining non-cancelable terms of the respective leases (approximatelyÑve years for tenant leases and approximately 50 years for ground leases).
Due to existing contacts and relationships with tenants at our currently owned properties and at propertiescurrently managed for others, no signiÑcant value has been ascribed to the tenant relationships at the acquiredproperties.
F-12
GENERAL GROWTH PROPERTIES, INC.
NOTES TO CONSOLIDATED FINANCIAL STATEMENTS Ì (Continued)
The excess of the cost of an acquired entity over the net of the amounts assigned to assets acquired (includingidentiÑed intangible assets) and liabilities assumed is recorded as goodwill. Goodwill is not amortized but istested for impairment on an annual basis, or more frequently if events or changes in circumstances indicatethat the asset might be impaired. An impairment loss for an asset group is allocated to the long-lived assets ofthe group on a pro-rata basis using the relative carrying amounts of those assets, unless the fair value ofspeciÑc components of the reporting group are determinable without undue cost and eÅort.
Investments in Unconsolidated Real Estate AÇliates
We account for investments in joint ventures where we own a non-controlling joint interest using the equitymethod. Under the equity method, the cost of our investment is adjusted for our share of the equity in earningsof such Unconsolidated Real Estate AÇliates from the date of acquisition and reduced by distributionsreceived. Generally, the operating agreements with respect to our Unconsolidated Real Estate AÇliatesprovide that assets, liabilities and funding obligations are shared in accordance with our ownership percent-ages. Therefore, we generally also share in the proÑt and losses, cash Öows and other matters relating to ourUnconsolidated Real Estate AÇliates in accordance with our respective ownership percentages. Except forRetained Debt (as described in Note 5), diÅerences between the carrying value of our investment in theUnconsolidated Real Estate AÇliates and our share of the underlying equity of such Unconsolidated RealEstate AÇliates are amortized over lives ranging from Ñve to forty years.
For those joint ventures where we own less than a 5% interest and have virtually no inÖuence on the jointventure's operating and Ñnancial policies, we account for our investments using the cost method.
Cash and Cash Equivalents and Investments in Marketable Securities
Highly-liquid investments with maturities at dates of purchase of three months or less are classiÑed as cashequivalents.
Investments in marketable securities with maturities at dates of purchase in excess of three months are carriedat amortized cost as it is our intention to hold these investments until maturity. Most investments inmarketable securities are held in an irrevocable trust for participants in our non-qualiÑed deÑned contributionplans which were acquired with the TRC Merger, are classiÑed as trading securities and are carried at marketvalue with changes in values recognized in earnings. Other investments in marketable equity securities subjectto signiÑcant restrictions on sale or transfer are classiÑed as available-for-sale and are carried at market valuewith unrealized changes in values recognized in other comprehensive income.
Leases
Leases which transfer substantially all the risks and beneÑts of ownership to tenants are considered Ñnanceleases and the present values of the minimum lease payments and the estimated residual values of the leasedproperties, if any, are accounted for as receivables. Leases which transfer substantially all the risks and beneÑtsof ownership to us are considered capital leases and the present values of the minimum lease payments areaccounted for as assets and liabilities.
Deferred Expenses
Deferred expenses consist principally of Ñnancing fees and leasing costs and commissions. Deferred Ñnancingfees are amortized to interest expense using the interest method (or other methods which approximate theinterest method) over the terms of the respective agreements. Deferred leasing costs and commissions areamortized using the straight-line method over the average life of the tenant leases. Deferred expenses in ourConsolidated Balance Sheets are shown at cost, net of accumulated amortization of $147.5 million as ofDecember 31, 2005 and $128.3 million as of December 31, 2004.
F-13
GENERAL GROWTH PROPERTIES, INC.
NOTES TO CONSOLIDATED FINANCIAL STATEMENTS Ì (Continued)
Minority Interests Ì Common (Note 12)
Income is allocated to the holders of the Common Units (the ""OP Minority Interests'') based on theirownership percentage of the Operating Partnership. This ownership percentage, as well as the total net assetsof the Operating Partnership, change when additional shares of our common stock or Common Units areissued. Such changes result in an allocation between stockholders' equity and Minority Interests Ì Commonin the Consolidated Balance Sheets. Due to the number of such capital transactions that occur each period, wehave presented a single net eÅect of all such allocations for the period as the ""Adjustment for MinorityInterest in Operating Partnership'' in our Consolidated Statements of Stockholders' Equity (rather thanseparately allocating the minority interest for each individual capital transaction).
Treasury Stock
We account for repurchases of common stock using the cost method with common stock in treasury classiÑedin the Consolidated Balance Sheets as a reduction of stockholders' equity. Treasury stock is reissued ataverage cost.
Revenue Recognition and Related Matters
Minimum rent revenues are recognized on a straight-line basis over the terms of the related leases. Minimumrent revenues also include amounts collected from tenants to allow the termination of their leases prior to theirscheduled termination dates and accretion related to above and below-market tenant leases on acquiredproperties as follows:
2005 2004 2003
(In thousands)
Lease termination fees ÏÏÏÏÏÏÏÏÏÏÏÏÏÏÏÏÏÏÏÏÏÏÏÏÏÏÏÏÏÏÏÏÏÏÏÏ $14,534 $ 7,942 $ 9,694
Above and below-market tenant lease accretion ÏÏÏÏÏÏÏÏÏÏÏÏÏÏÏ 34,692 27,591 16,551
Straight-line rents receivable, which represent the current net cumulative rents recognized prior to when billedand collectible as provided by the terms of the leases, of approximately $123.5 million as of December 31,2005 and $91.8 million as of December 31, 2004 are included in accounts and notes receivable, net in ourConsolidated Balance Sheets.
We provide an allowance for doubtful accounts against the portion of accounts receivable, including straight-line rents, which is estimated to be uncollectible. Such allowances are reviewed periodically based upon ourrecovery experience. We also evaluate the probability of collecting future rent which is recognized currentlyunder a straight-line methodology. This analysis considers the long-term nature of our leases, as a certainportion of the straight-line rent currently recognizable will not be billed to the tenant until many years into thefuture. Our experience relative to unbilled deferred rent receivable is that a certain portion of the amountsstraight-lined into revenue are never collected from (or billed to) the tenant due to early lease terminations.For that portion of the otherwise recognizable deferred rent that is not deemed to be probable of collection, norevenue is recognized. Accounts receivable in our Consolidated Balance Sheets are shown net of an allowancefor doubtful accounts of $54.6 million as of December 31, 2005 and $48.6 million as of December 31, 2004.
Overage rents are recognized on an accrual basis once tenant sales exceed contractual tenant lease thresholds.Recoveries from tenants are established in the leases or computed based upon a formula related to real estatetaxes, insurance and other shopping center operating expenses and are generally recognized as revenues in theperiod the related costs are incurred.
Management and other fees primarily represent management and leasing fees, construction fees Ñnancing feesand fees for other ancillary services performed by GGMI and other subsidiaries (generally TRS entities owned
F-14
GENERAL GROWTH PROPERTIES, INC.
NOTES TO CONSOLIDATED FINANCIAL STATEMENTS Ì (Continued)
by TRCLP) for the beneÑt of the Unconsolidated Real Estate AÇliates and for independent third-partyinvestors. Such fees are recognized as revenue as the services are rendered.
Revenues from land sales are recognized using the full accrual method provided that various criteria relatingto the terms of the transactions and our subsequent involvement with the land sold are met. Revenues relatingto transactions that do not meet the established criteria are deferred and recognized when the criteria are metor using the installment or cost recovery methods, as appropriate in the circumstances. For land saletransactions in which we are required to perform additional services and incur signiÑcant costs after title haspassed, revenues and cost of sales are recognized on a percentage of completion basis.
Cost of land sales is determined as a speciÑed percentage of land sales revenues recognized for eachcommunity development project. The cost ratios used are based on actual costs incurred and estimates ofdevelopment costs and sales revenues to completion of each project. The ratios are reviewed regularly andrevised for changes in sales and cost estimates or development plans. SigniÑcant changes in these estimates orfuture development plans, whether due to changes in market conditions or other factors, could result inchanges to the cost ratio used for a speciÑc project. The speciÑc identiÑcation method is used to determinecost of sales for certain parcels of land, including acquired parcels we do not intend to develop or for whichdevelopment is complete at the date of acquisition.
Income Taxes (Note 7)
Deferred income taxes are accounted for using the asset and liability method. Deferred tax assets andliabilities are recognized for the expected future tax consequences of events that have been included in theÑnancial statements or tax returns. Under this method, deferred tax assets and liabilities are determined basedon the diÅerences between the Ñnancial reporting and tax bases of assets and liabilities using enacted tax ratesin eÅect for the year in which the diÅerences are expected to reverse. Deferred income taxes also reÖect theimpact of operating loss and tax credit carryforwards. A valuation allowance is provided if we believe it is morelikely than not that all or some portion of the deferred tax asset will not be realized. An increase or decrease inthe valuation allowance that results from a change in circumstances, and which causes a change in ourjudgment about the realizability of the related deferred tax asset, is included in the current tax provision.
Earnings Per Share (""EPS'')
Basic earnings per share (""EPS'') is computed by dividing net income available to common stockholders bythe weighted-average number of common shares outstanding. Diluted EPS is computed after adjusting thenumerator and denominator of the basic EPS computation for the eÅects of all potentially dilutive commonshares. The dilutive eÅects of convertible securities are computed using the ""if-converted'' method and thedilutive eÅects of options, warrants and their equivalents (including Ñxed awards and nonvested stock issuedunder stock-based compensation plans) are computed using the ""treasury stock'' method.
Dilutive EPS excludes anti-dilutive options where the exercise price was higher than the average market priceof our common stock and options for which conditions for issuance were not achieved. Such options totaled1,026,777 in 2005, 1,590,974 in 2004 and 21,000 in 2003. Outstanding Common Units have also been excludedfrom the diluted earnings per share calculation because there would be no eÅect on EPS as the minorityinterests' share of income would also be added back to net income.
F-15
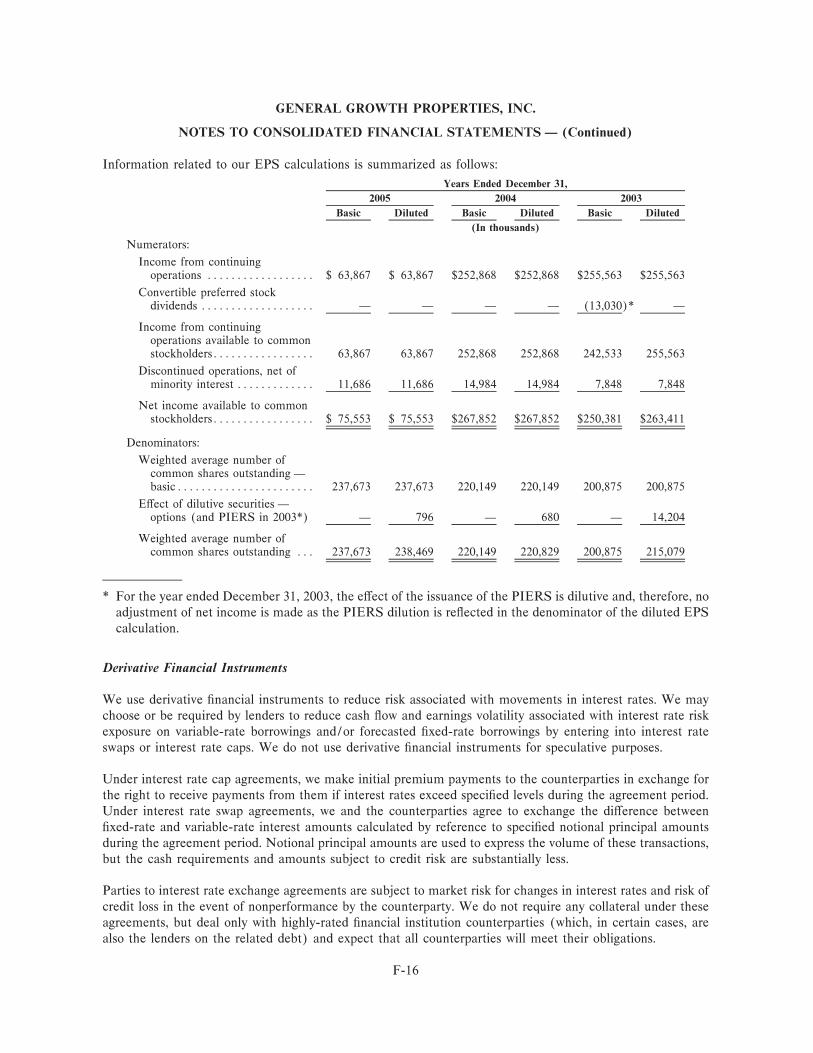
GENERAL GROWTH PROPERTIES, INC.
NOTES TO CONSOLIDATED FINANCIAL STATEMENTS Ì (Continued)
Information related to our EPS calculations is summarized as follows:
Years Ended December 31,
2005 2004 2003
Basic Diluted Basic Diluted Basic Diluted
(In thousands)
Numerators:
Income from continuingoperations ÏÏÏÏÏÏÏÏÏÏÏÏÏÏÏÏÏÏ $ 63,867 $ 63,867 $252,868 $252,868 $255,563 $255,563
Convertible preferred stockdividends ÏÏÏÏÏÏÏÏÏÏÏÏÏÏÏÏÏÏÏ Ì Ì Ì Ì (13,030)* Ì
Income from continuingoperations available to commonstockholdersÏÏÏÏÏÏÏÏÏÏÏÏÏÏÏÏÏ 63,867 63,867 252,868 252,868 242,533 255,563
Discontinued operations, net ofminority interest ÏÏÏÏÏÏÏÏÏÏÏÏÏ 11,686 11,686 14,984 14,984 7,848 7,848
Net income available to commonstockholdersÏÏÏÏÏÏÏÏÏÏÏÏÏÏÏÏÏ $ 75,553 $ 75,553 $267,852 $267,852 $250,381 $263,411
Denominators:
Weighted average number ofcommon shares outstanding ÌbasicÏÏÏÏÏÏÏÏÏÏÏÏÏÏÏÏÏÏÏÏÏÏÏ 237,673 237,673 220,149 220,149 200,875 200,875
EÅect of dilutive securities Ìoptions (and PIERS in 2003*) Ì 796 Ì 680 Ì 14,204
Weighted average number ofcommon shares outstanding ÏÏÏ 237,673 238,469 220,149 220,829 200,875 215,079
* For the year ended December 31, 2003, the eÅect of the issuance of the PIERS is dilutive and, therefore, noadjustment of net income is made as the PIERS dilution is reÖected in the denominator of the diluted EPScalculation.
Derivative Financial Instruments
We use derivative Ñnancial instruments to reduce risk associated with movements in interest rates. We maychoose or be required by lenders to reduce cash Öow and earnings volatility associated with interest rate riskexposure on variable-rate borrowings and/or forecasted Ñxed-rate borrowings by entering into interest rateswaps or interest rate caps. We do not use derivative Ñnancial instruments for speculative purposes.
Under interest rate cap agreements, we make initial premium payments to the counterparties in exchange forthe right to receive payments from them if interest rates exceed speciÑed levels during the agreement period.Under interest rate swap agreements, we and the counterparties agree to exchange the diÅerence betweenÑxed-rate and variable-rate interest amounts calculated by reference to speciÑed notional principal amountsduring the agreement period. Notional principal amounts are used to express the volume of these transactions,but the cash requirements and amounts subject to credit risk are substantially less.
Parties to interest rate exchange agreements are subject to market risk for changes in interest rates and risk ofcredit loss in the event of nonperformance by the counterparty. We do not require any collateral under theseagreements, but deal only with highly-rated Ñnancial institution counterparties (which, in certain cases, arealso the lenders on the related debt) and expect that all counterparties will meet their obligations.
F-16
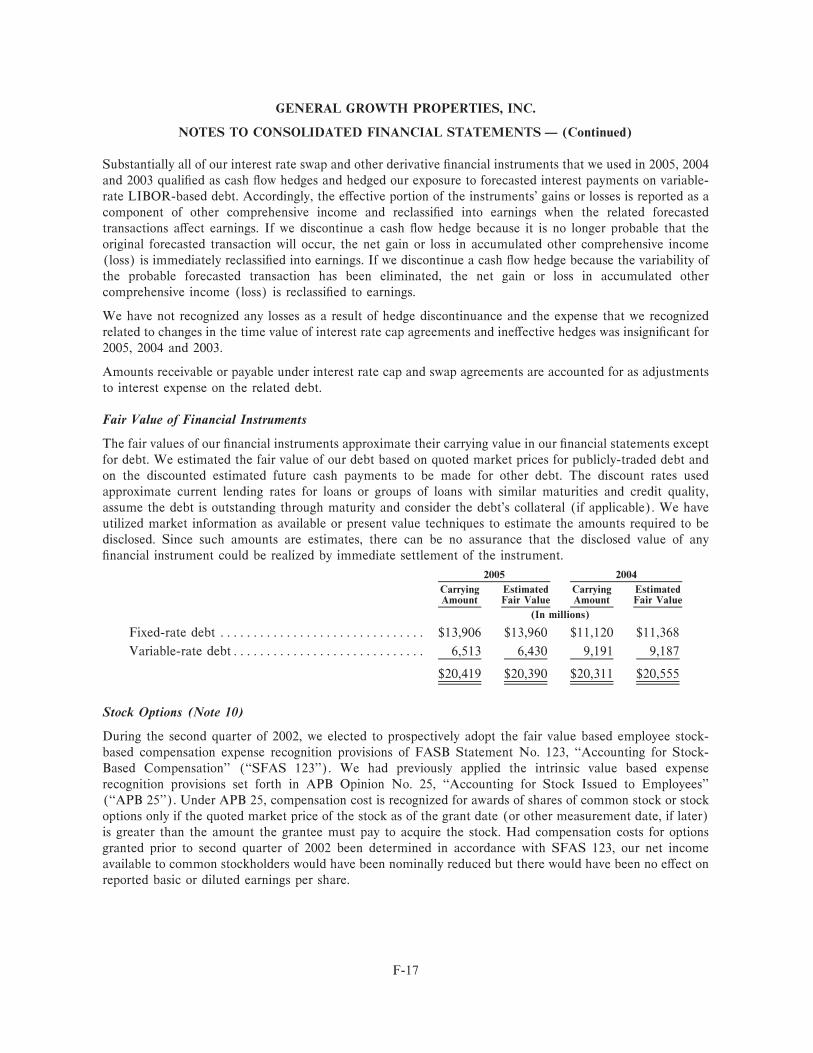
GENERAL GROWTH PROPERTIES, INC.
NOTES TO CONSOLIDATED FINANCIAL STATEMENTS Ì (Continued)
Substantially all of our interest rate swap and other derivative Ñnancial instruments that we used in 2005, 2004and 2003 qualiÑed as cash Öow hedges and hedged our exposure to forecasted interest payments on variable-rate LIBOR-based debt. Accordingly, the eÅective portion of the instruments' gains or losses is reported as acomponent of other comprehensive income and reclassiÑed into earnings when the related forecastedtransactions aÅect earnings. If we discontinue a cash Öow hedge because it is no longer probable that theoriginal forecasted transaction will occur, the net gain or loss in accumulated other comprehensive income(loss) is immediately reclassiÑed into earnings. If we discontinue a cash Öow hedge because the variability ofthe probable forecasted transaction has been eliminated, the net gain or loss in accumulated othercomprehensive income (loss) is reclassiÑed to earnings.
We have not recognized any losses as a result of hedge discontinuance and the expense that we recognizedrelated to changes in the time value of interest rate cap agreements and ineÅective hedges was insigniÑcant for2005, 2004 and 2003.
Amounts receivable or payable under interest rate cap and swap agreements are accounted for as adjustmentsto interest expense on the related debt.
Fair Value of Financial Instruments
The fair values of our Ñnancial instruments approximate their carrying value in our Ñnancial statements exceptfor debt. We estimated the fair value of our debt based on quoted market prices for publicly-traded debt andon the discounted estimated future cash payments to be made for other debt. The discount rates usedapproximate current lending rates for loans or groups of loans with similar maturities and credit quality,assume the debt is outstanding through maturity and consider the debt's collateral (if applicable). We haveutilized market information as available or present value techniques to estimate the amounts required to bedisclosed. Since such amounts are estimates, there can be no assurance that the disclosed value of anyÑnancial instrument could be realized by immediate settlement of the instrument.
2005 2004
Carrying Estimated Carrying EstimatedAmount Fair Value Amount Fair Value
(In millions)
Fixed-rate debt ÏÏÏÏÏÏÏÏÏÏÏÏÏÏÏÏÏÏÏÏÏÏÏÏÏÏÏÏÏÏÏ $13,906 $13,960 $11,120 $11,368
Variable-rate debtÏÏÏÏÏÏÏÏÏÏÏÏÏÏÏÏÏÏÏÏÏÏÏÏÏÏÏÏÏ 6,513 6,430 9,191 9,187
$20,419 $20,390 $20,311 $20,555
Stock Options (Note 10)
During the second quarter of 2002, we elected to prospectively adopt the fair value based employee stock-based compensation expense recognition provisions of FASB Statement No. 123, ""Accounting for Stock-Based Compensation'' (""SFAS 123''). We had previously applied the intrinsic value based expenserecognition provisions set forth in APB Opinion No. 25, ""Accounting for Stock Issued to Employees''(""APB 25''). Under APB 25, compensation cost is recognized for awards of shares of common stock or stockoptions only if the quoted market price of the stock as of the grant date (or other measurement date, if later)is greater than the amount the grantee must pay to acquire the stock. Had compensation costs for optionsgranted prior to second quarter of 2002 been determined in accordance with SFAS 123, our net incomeavailable to common stockholders would have been nominally reduced but there would have been no eÅect onreported basic or diluted earnings per share.
F-17
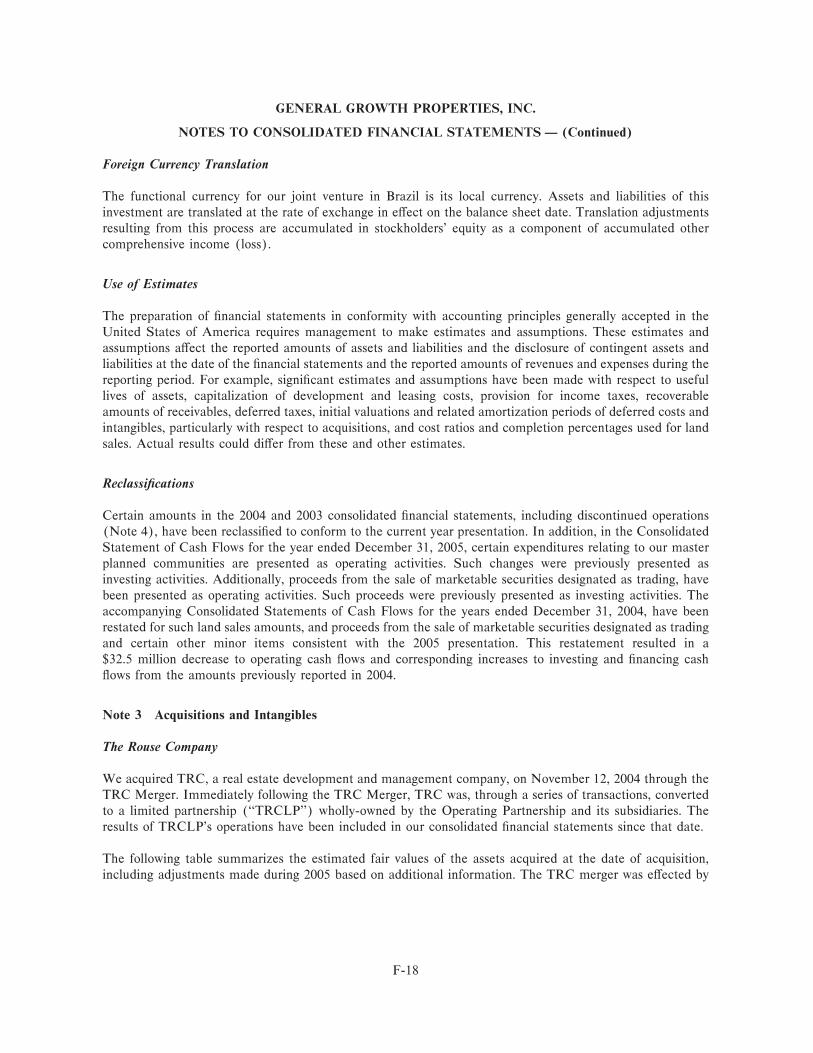
GENERAL GROWTH PROPERTIES, INC.
NOTES TO CONSOLIDATED FINANCIAL STATEMENTS Ì (Continued)
Foreign Currency Translation
The functional currency for our joint venture in Brazil is its local currency. Assets and liabilities of thisinvestment are translated at the rate of exchange in eÅect on the balance sheet date. Translation adjustmentsresulting from this process are accumulated in stockholders' equity as a component of accumulated othercomprehensive income (loss).
Use of Estimates
The preparation of Ñnancial statements in conformity with accounting principles generally accepted in theUnited States of America requires management to make estimates and assumptions. These estimates andassumptions aÅect the reported amounts of assets and liabilities and the disclosure of contingent assets andliabilities at the date of the Ñnancial statements and the reported amounts of revenues and expenses during thereporting period. For example, signiÑcant estimates and assumptions have been made with respect to usefullives of assets, capitalization of development and leasing costs, provision for income taxes, recoverableamounts of receivables, deferred taxes, initial valuations and related amortization periods of deferred costs andintangibles, particularly with respect to acquisitions, and cost ratios and completion percentages used for landsales. Actual results could diÅer from these and other estimates.
ReclassiÑcations
Certain amounts in the 2004 and 2003 consolidated Ñnancial statements, including discontinued operations(Note 4), have been reclassiÑed to conform to the current year presentation. In addition, in the ConsolidatedStatement of Cash Flows for the year ended December 31, 2005, certain expenditures relating to our masterplanned communities are presented as operating activities. Such changes were previously presented asinvesting activities. Additionally, proceeds from the sale of marketable securities designated as trading, havebeen presented as operating activities. Such proceeds were previously presented as investing activities. Theaccompanying Consolidated Statements of Cash Flows for the years ended December 31, 2004, have beenrestated for such land sales amounts, and proceeds from the sale of marketable securities designated as tradingand certain other minor items consistent with the 2005 presentation. This restatement resulted in a$32.5 million decrease to operating cash Öows and corresponding increases to investing and Ñnancing cashÖows from the amounts previously reported in 2004.
Note 3 Acquisitions and Intangibles
The Rouse Company
We acquired TRC, a real estate development and management company, on November 12, 2004 through theTRC Merger. Immediately following the TRC Merger, TRC was, through a series of transactions, convertedto a limited partnership (""TRCLP'') wholly-owned by the Operating Partnership and its subsidiaries. Theresults of TRCLP's operations have been included in our consolidated Ñnancial statements since that date.
The following table summarizes the estimated fair values of the assets acquired at the date of acquisition,including adjustments made during 2005 based on additional information. The TRC merger was eÅected by
F-18
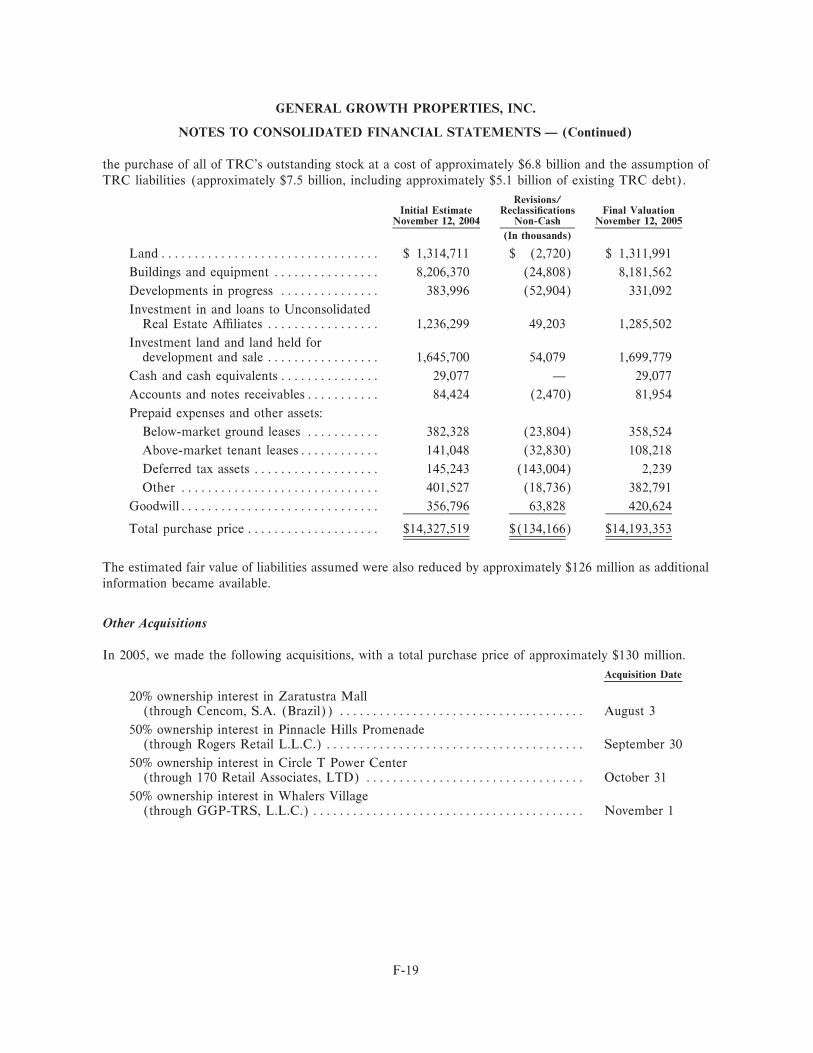
GENERAL GROWTH PROPERTIES, INC.
NOTES TO CONSOLIDATED FINANCIAL STATEMENTS Ì (Continued)
the purchase of all of TRC's outstanding stock at a cost of approximately $6.8 billion and the assumption ofTRC liabilities (approximately $7.5 billion, including approximately $5.1 billion of existing TRC debt).
Revisions/Initial Estimate ReclassiÑcations Final Valuation
November 12, 2004 Non-Cash November 12, 2005
(In thousands)
LandÏÏÏÏÏÏÏÏÏÏÏÏÏÏÏÏÏÏÏÏÏÏÏÏÏÏÏÏÏÏÏÏÏ $ 1,314,711 $ (2,720) $ 1,311,991
Buildings and equipment ÏÏÏÏÏÏÏÏÏÏÏÏÏÏÏÏ 8,206,370 (24,808) 8,181,562
Developments in progress ÏÏÏÏÏÏÏÏÏÏÏÏÏÏÏ 383,996 (52,904) 331,092
Investment in and loans to UnconsolidatedReal Estate AÇliates ÏÏÏÏÏÏÏÏÏÏÏÏÏÏÏÏÏ 1,236,299 49,203 1,285,502
Investment land and land held fordevelopment and sale ÏÏÏÏÏÏÏÏÏÏÏÏÏÏÏÏÏ 1,645,700 54,079 1,699,779
Cash and cash equivalents ÏÏÏÏÏÏÏÏÏÏÏÏÏÏÏ 29,077 Ì 29,077
Accounts and notes receivablesÏÏÏÏÏÏÏÏÏÏÏ 84,424 (2,470) 81,954
Prepaid expenses and other assets:
Below-market ground leases ÏÏÏÏÏÏÏÏÏÏÏ 382,328 (23,804) 358,524
Above-market tenant leasesÏÏÏÏÏÏÏÏÏÏÏÏ 141,048 (32,830) 108,218
Deferred tax assets ÏÏÏÏÏÏÏÏÏÏÏÏÏÏÏÏÏÏÏ 145,243 (143,004) 2,239
Other ÏÏÏÏÏÏÏÏÏÏÏÏÏÏÏÏÏÏÏÏÏÏÏÏÏÏÏÏÏÏ 401,527 (18,736) 382,791
GoodwillÏÏÏÏÏÏÏÏÏÏÏÏÏÏÏÏÏÏÏÏÏÏÏÏÏÏÏÏÏÏ 356,796 63,828 420,624
Total purchase price ÏÏÏÏÏÏÏÏÏÏÏÏÏÏÏÏÏÏÏÏ $14,327,519 $(134,166) $14,193,353
The estimated fair value of liabilities assumed were also reduced by approximately $126 million as additionalinformation became available.
Other Acquisitions
In 2005, we made the following acquisitions, with a total purchase price of approximately $130 million.
Acquisition Date
20% ownership interest in Zaratustra Mall(through Cencom, S.A. (Brazil)) ÏÏÏÏÏÏÏÏÏÏÏÏÏÏÏÏÏÏÏÏÏÏÏÏÏÏÏÏÏÏÏÏÏÏÏÏÏ August 3
50% ownership interest in Pinnacle Hills Promenade(through Rogers Retail L.L.C.) ÏÏÏÏÏÏÏÏÏÏÏÏÏÏÏÏÏÏÏÏÏÏÏÏÏÏÏÏÏÏÏÏÏÏÏÏÏÏÏ September 30
50% ownership interest in Circle T Power Center(through 170 Retail Associates, LTD) ÏÏÏÏÏÏÏÏÏÏÏÏÏÏÏÏÏÏÏÏÏÏÏÏÏÏÏÏÏÏÏÏÏ October 31
50% ownership interest in Whalers Village(through GGP-TRS, L.L.C.) ÏÏÏÏÏÏÏÏÏÏÏÏÏÏÏÏÏÏÏÏÏÏÏÏÏÏÏÏÏÏÏÏÏÏÏÏÏÏÏÏÏ November 1
F-19
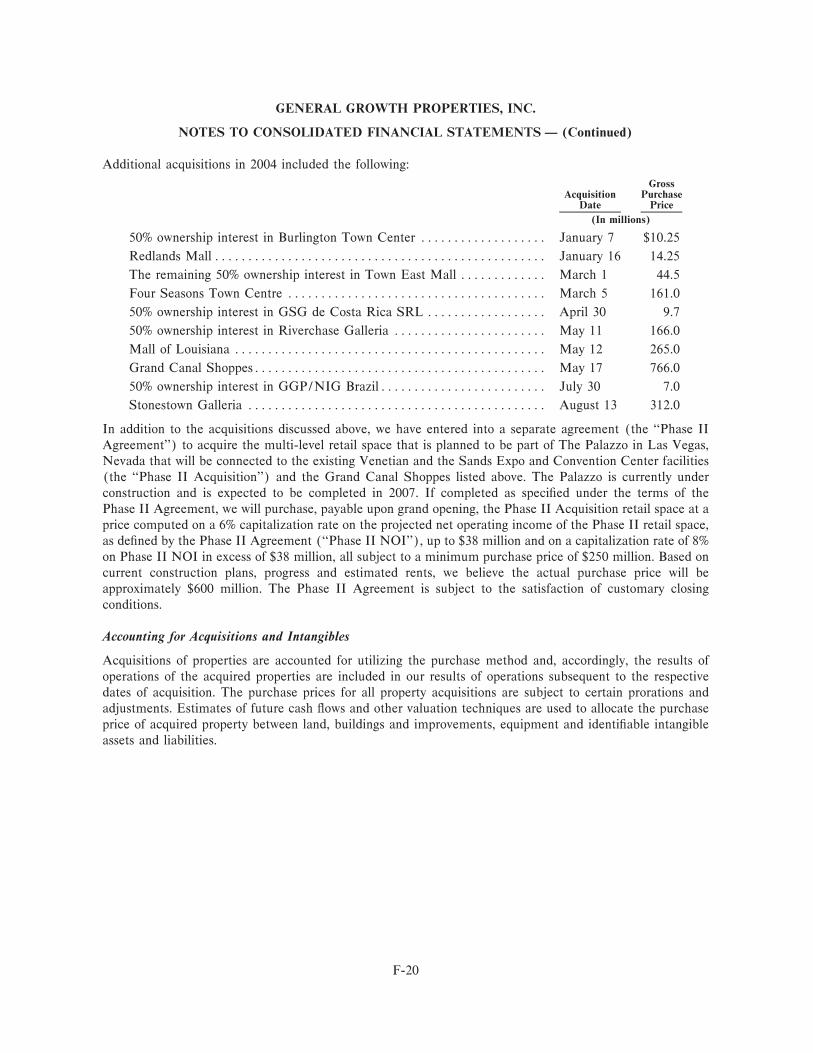
GENERAL GROWTH PROPERTIES, INC.
NOTES TO CONSOLIDATED FINANCIAL STATEMENTS Ì (Continued)
Additional acquisitions in 2004 included the following:
GrossAcquisition Purchase
Date Price
(In millions)
50% ownership interest in Burlington Town Center ÏÏÏÏÏÏÏÏÏÏÏÏÏÏÏÏÏÏÏ January 7 $10.25
Redlands Mall ÏÏÏÏÏÏÏÏÏÏÏÏÏÏÏÏÏÏÏÏÏÏÏÏÏÏÏÏÏÏÏÏÏÏÏÏÏÏÏÏÏÏÏÏÏÏÏÏÏÏ January 16 14.25
The remaining 50% ownership interest in Town East Mall ÏÏÏÏÏÏÏÏÏÏÏÏÏ March 1 44.5
Four Seasons Town Centre ÏÏÏÏÏÏÏÏÏÏÏÏÏÏÏÏÏÏÏÏÏÏÏÏÏÏÏÏÏÏÏÏÏÏÏÏÏÏÏ March 5 161.0
50% ownership interest in GSG de Costa Rica SRL ÏÏÏÏÏÏÏÏÏÏÏÏÏÏÏÏÏÏ April 30 9.7
50% ownership interest in Riverchase Galleria ÏÏÏÏÏÏÏÏÏÏÏÏÏÏÏÏÏÏÏÏÏÏÏ May 11 166.0
Mall of Louisiana ÏÏÏÏÏÏÏÏÏÏÏÏÏÏÏÏÏÏÏÏÏÏÏÏÏÏÏÏÏÏÏÏÏÏÏÏÏÏÏÏÏÏÏÏÏÏÏ May 12 265.0
Grand Canal ShoppesÏÏÏÏÏÏÏÏÏÏÏÏÏÏÏÏÏÏÏÏÏÏÏÏÏÏÏÏÏÏÏÏÏÏÏÏÏÏÏÏÏÏÏÏ May 17 766.0
50% ownership interest in GGP/NIG BrazilÏÏÏÏÏÏÏÏÏÏÏÏÏÏÏÏÏÏÏÏÏÏÏÏÏ July 30 7.0
Stonestown Galleria ÏÏÏÏÏÏÏÏÏÏÏÏÏÏÏÏÏÏÏÏÏÏÏÏÏÏÏÏÏÏÏÏÏÏÏÏÏÏÏÏÏÏÏÏÏ August 13 312.0
In addition to the acquisitions discussed above, we have entered into a separate agreement (the ""Phase IIAgreement'') to acquire the multi-level retail space that is planned to be part of The Palazzo in Las Vegas,Nevada that will be connected to the existing Venetian and the Sands Expo and Convention Center facilities(the ""Phase II Acquisition'') and the Grand Canal Shoppes listed above. The Palazzo is currently underconstruction and is expected to be completed in 2007. If completed as speciÑed under the terms of thePhase II Agreement, we will purchase, payable upon grand opening, the Phase II Acquisition retail space at aprice computed on a 6% capitalization rate on the projected net operating income of the Phase II retail space,as deÑned by the Phase II Agreement (""Phase II NOI''), up to $38 million and on a capitalization rate of 8%on Phase II NOI in excess of $38 million, all subject to a minimum purchase price of $250 million. Based oncurrent construction plans, progress and estimated rents, we believe the actual purchase price will beapproximately $600 million. The Phase II Agreement is subject to the satisfaction of customary closingconditions.
Accounting for Acquisitions and Intangibles
Acquisitions of properties are accounted for utilizing the purchase method and, accordingly, the results ofoperations of the acquired properties are included in our results of operations subsequent to the respectivedates of acquisition. The purchase prices for all property acquisitions are subject to certain prorations andadjustments. Estimates of future cash Öows and other valuation techniques are used to allocate the purchaseprice of acquired property between land, buildings and improvements, equipment and identiÑable intangibleassets and liabilities.
F-20
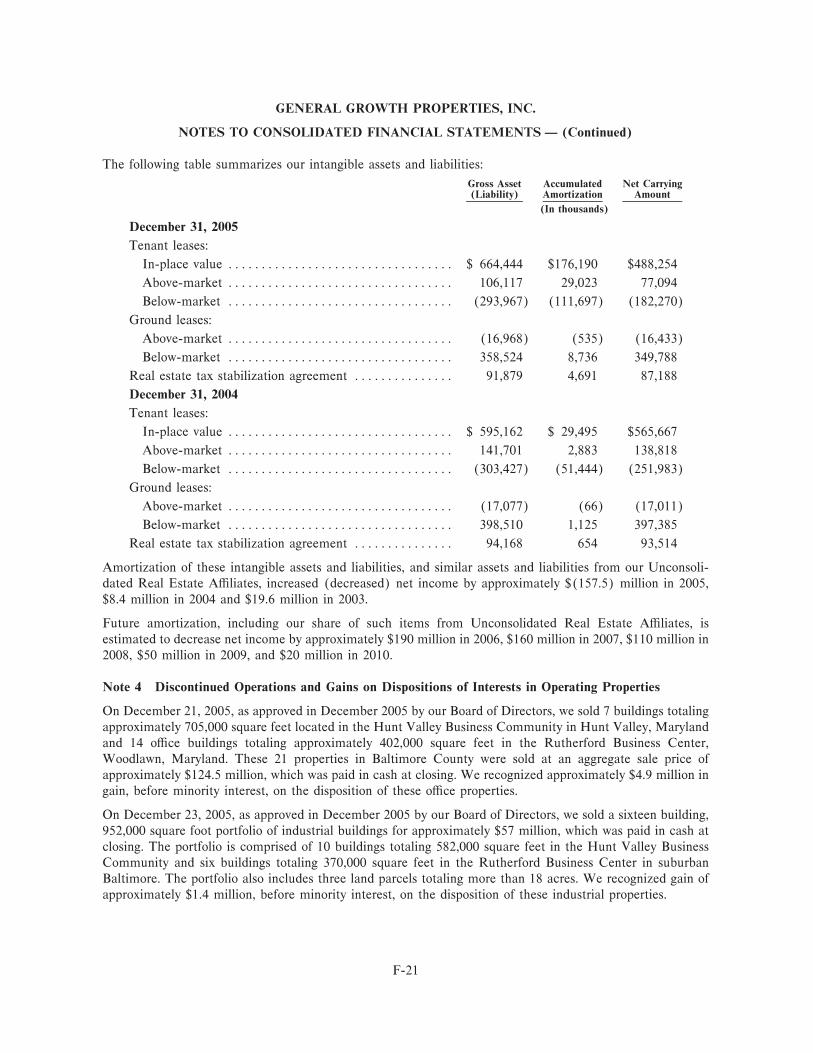
GENERAL GROWTH PROPERTIES, INC.
NOTES TO CONSOLIDATED FINANCIAL STATEMENTS Ì (Continued)
The following table summarizes our intangible assets and liabilities:
Gross Asset Accumulated Net Carrying(Liability) Amortization Amount
(In thousands)
December 31, 2005
Tenant leases:
In-place value ÏÏÏÏÏÏÏÏÏÏÏÏÏÏÏÏÏÏÏÏÏÏÏÏÏÏÏÏÏÏÏÏÏÏ $ 664,444 $176,190 $488,254
Above-market ÏÏÏÏÏÏÏÏÏÏÏÏÏÏÏÏÏÏÏÏÏÏÏÏÏÏÏÏÏÏÏÏÏÏ 106,117 29,023 77,094
Below-market ÏÏÏÏÏÏÏÏÏÏÏÏÏÏÏÏÏÏÏÏÏÏÏÏÏÏÏÏÏÏÏÏÏÏ (293,967) (111,697) (182,270)
Ground leases:
Above-market ÏÏÏÏÏÏÏÏÏÏÏÏÏÏÏÏÏÏÏÏÏÏÏÏÏÏÏÏÏÏÏÏÏÏ (16,968) (535) (16,433)
Below-market ÏÏÏÏÏÏÏÏÏÏÏÏÏÏÏÏÏÏÏÏÏÏÏÏÏÏÏÏÏÏÏÏÏÏ 358,524 8,736 349,788
Real estate tax stabilization agreement ÏÏÏÏÏÏÏÏÏÏÏÏÏÏÏ 91,879 4,691 87,188
December 31, 2004
Tenant leases:
In-place value ÏÏÏÏÏÏÏÏÏÏÏÏÏÏÏÏÏÏÏÏÏÏÏÏÏÏÏÏÏÏÏÏÏÏ $ 595,162 $ 29,495 $565,667
Above-market ÏÏÏÏÏÏÏÏÏÏÏÏÏÏÏÏÏÏÏÏÏÏÏÏÏÏÏÏÏÏÏÏÏÏ 141,701 2,883 138,818
Below-market ÏÏÏÏÏÏÏÏÏÏÏÏÏÏÏÏÏÏÏÏÏÏÏÏÏÏÏÏÏÏÏÏÏÏ (303,427) (51,444) (251,983)
Ground leases:
Above-market ÏÏÏÏÏÏÏÏÏÏÏÏÏÏÏÏÏÏÏÏÏÏÏÏÏÏÏÏÏÏÏÏÏÏ (17,077) (66) (17,011)
Below-market ÏÏÏÏÏÏÏÏÏÏÏÏÏÏÏÏÏÏÏÏÏÏÏÏÏÏÏÏÏÏÏÏÏÏ 398,510 1,125 397,385
Real estate tax stabilization agreement ÏÏÏÏÏÏÏÏÏÏÏÏÏÏÏ 94,168 654 93,514
Amortization of these intangible assets and liabilities, and similar assets and liabilities from our Unconsoli-dated Real Estate AÇliates, increased (decreased) net income by approximately $(157.5) million in 2005,$8.4 million in 2004 and $19.6 million in 2003.
Future amortization, including our share of such items from Unconsolidated Real Estate AÇliates, isestimated to decrease net income by approximately $190 million in 2006, $160 million in 2007, $110 million in2008, $50 million in 2009, and $20 million in 2010.
Note 4 Discontinued Operations and Gains on Dispositions of Interests in Operating Properties
On December 21, 2005, as approved in December 2005 by our Board of Directors, we sold 7 buildings totalingapproximately 705,000 square feet located in the Hunt Valley Business Community in Hunt Valley, Marylandand 14 oÇce buildings totaling approximately 402,000 square feet in the Rutherford Business Center,Woodlawn, Maryland. These 21 properties in Baltimore County were sold at an aggregate sale price ofapproximately $124.5 million, which was paid in cash at closing. We recognized approximately $4.9 million ingain, before minority interest, on the disposition of these oÇce properties.
On December 23, 2005, as approved in December 2005 by our Board of Directors, we sold a sixteen building,952,000 square foot portfolio of industrial buildings for approximately $57 million, which was paid in cash atclosing. The portfolio is comprised of 10 buildings totaling 582,000 square feet in the Hunt Valley BusinessCommunity and six buildings totaling 370,000 square feet in the Rutherford Business Center in suburbanBaltimore. The portfolio also includes three land parcels totaling more than 18 acres. We recognized gain ofapproximately $1.4 million, before minority interest, on the disposition of these industrial properties.
F-21
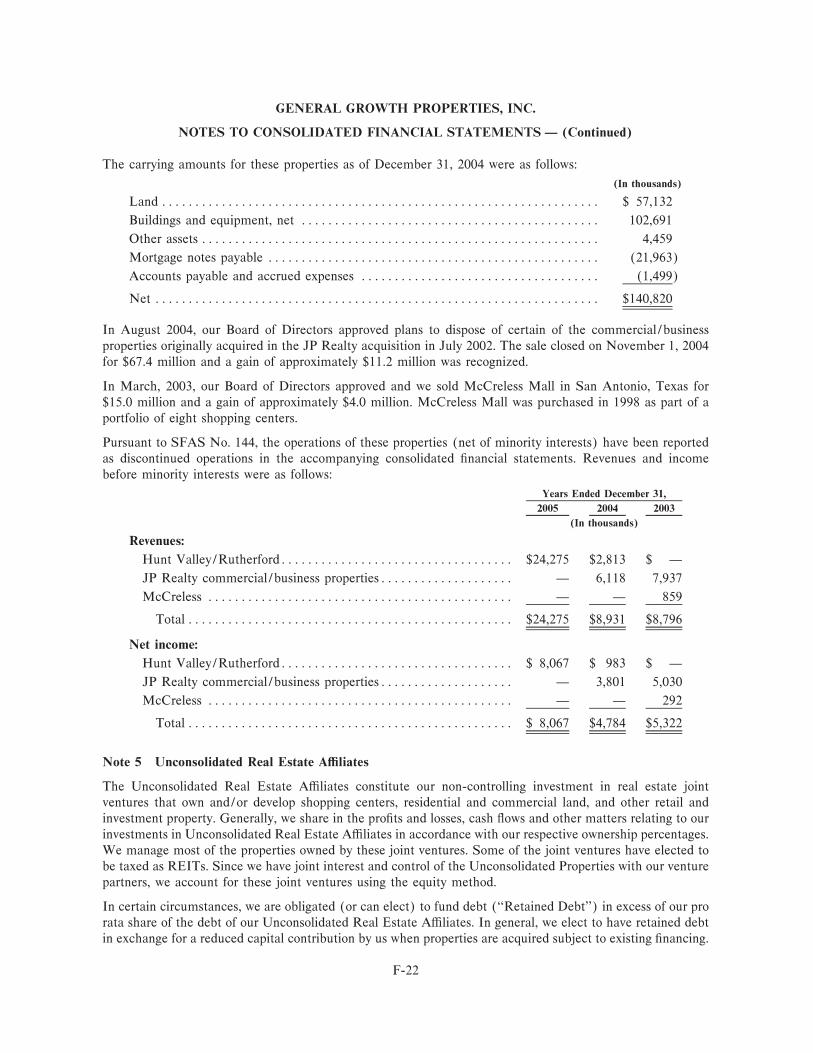
GENERAL GROWTH PROPERTIES, INC.
NOTES TO CONSOLIDATED FINANCIAL STATEMENTS Ì (Continued)
The carrying amounts for these properties as of December 31, 2004 were as follows:
(In thousands)
Land ÏÏÏÏÏÏÏÏÏÏÏÏÏÏÏÏÏÏÏÏÏÏÏÏÏÏÏÏÏÏÏÏÏÏÏÏÏÏÏÏÏÏÏÏÏÏÏÏÏÏÏÏÏÏÏÏÏÏÏÏÏÏÏÏÏÏ $ 57,132
Buildings and equipment, net ÏÏÏÏÏÏÏÏÏÏÏÏÏÏÏÏÏÏÏÏÏÏÏÏÏÏÏÏÏÏÏÏÏÏÏÏÏÏÏÏÏÏÏÏÏ 102,691
Other assets ÏÏÏÏÏÏÏÏÏÏÏÏÏÏÏÏÏÏÏÏÏÏÏÏÏÏÏÏÏÏÏÏÏÏÏÏÏÏÏÏÏÏÏÏÏÏÏÏÏÏÏÏÏÏÏÏÏÏÏÏ 4,459
Mortgage notes payable ÏÏÏÏÏÏÏÏÏÏÏÏÏÏÏÏÏÏÏÏÏÏÏÏÏÏÏÏÏÏÏÏÏÏÏÏÏÏÏÏÏÏÏÏÏÏÏÏÏÏ (21,963)
Accounts payable and accrued expenses ÏÏÏÏÏÏÏÏÏÏÏÏÏÏÏÏÏÏÏÏÏÏÏÏÏÏÏÏÏÏÏÏÏÏÏÏ (1,499)
Net ÏÏÏÏÏÏÏÏÏÏÏÏÏÏÏÏÏÏÏÏÏÏÏÏÏÏÏÏÏÏÏÏÏÏÏÏÏÏÏÏÏÏÏÏÏÏÏÏÏÏÏÏÏÏÏÏÏÏÏÏÏÏÏÏÏÏÏ $140,820
In August 2004, our Board of Directors approved plans to dispose of certain of the commercial/businessproperties originally acquired in the JP Realty acquisition in July 2002. The sale closed on November 1, 2004for $67.4 million and a gain of approximately $11.2 million was recognized.
In March, 2003, our Board of Directors approved and we sold McCreless Mall in San Antonio, Texas for$15.0 million and a gain of approximately $4.0 million. McCreless Mall was purchased in 1998 as part of aportfolio of eight shopping centers.
Pursuant to SFAS No. 144, the operations of these properties (net of minority interests) have been reportedas discontinued operations in the accompanying consolidated Ñnancial statements. Revenues and incomebefore minority interests were as follows:
Years Ended December 31,
2005 2004 2003
(In thousands)
Revenues:
Hunt Valley/RutherfordÏÏÏÏÏÏÏÏÏÏÏÏÏÏÏÏÏÏÏÏÏÏÏÏÏÏÏÏÏÏÏÏÏÏÏ $24,275 $2,813 $ Ì
JP Realty commercial/business propertiesÏÏÏÏÏÏÏÏÏÏÏÏÏÏÏÏÏÏÏÏ Ì 6,118 7,937
McCreless ÏÏÏÏÏÏÏÏÏÏÏÏÏÏÏÏÏÏÏÏÏÏÏÏÏÏÏÏÏÏÏÏÏÏÏÏÏÏÏÏÏÏÏÏÏÏ Ì Ì 859
Total ÏÏÏÏÏÏÏÏÏÏÏÏÏÏÏÏÏÏÏÏÏÏÏÏÏÏÏÏÏÏÏÏÏÏÏÏÏÏÏÏÏÏÏÏÏÏÏÏÏ $24,275 $8,931 $8,796
Net income:
Hunt Valley/RutherfordÏÏÏÏÏÏÏÏÏÏÏÏÏÏÏÏÏÏÏÏÏÏÏÏÏÏÏÏÏÏÏÏÏÏÏ $ 8,067 $ 983 $ Ì
JP Realty commercial/business propertiesÏÏÏÏÏÏÏÏÏÏÏÏÏÏÏÏÏÏÏÏ Ì 3,801 5,030
McCreless ÏÏÏÏÏÏÏÏÏÏÏÏÏÏÏÏÏÏÏÏÏÏÏÏÏÏÏÏÏÏÏÏÏÏÏÏÏÏÏÏÏÏÏÏÏÏ Ì Ì 292
Total ÏÏÏÏÏÏÏÏÏÏÏÏÏÏÏÏÏÏÏÏÏÏÏÏÏÏÏÏÏÏÏÏÏÏÏÏÏÏÏÏÏÏÏÏÏÏÏÏÏ $ 8,067 $4,784 $5,322
Note 5 Unconsolidated Real Estate AÇliates
The Unconsolidated Real Estate AÇliates constitute our non-controlling investment in real estate jointventures that own and/or develop shopping centers, residential and commercial land, and other retail andinvestment property. Generally, we share in the proÑts and losses, cash Öows and other matters relating to ourinvestments in Unconsolidated Real Estate AÇliates in accordance with our respective ownership percentages.We manage most of the properties owned by these joint ventures. Some of the joint ventures have elected tobe taxed as REITs. Since we have joint interest and control of the Unconsolidated Properties with our venturepartners, we account for these joint ventures using the equity method.
In certain circumstances, we are obligated (or can elect) to fund debt (""Retained Debt'') in excess of our prorata share of the debt of our Unconsolidated Real Estate AÇliates. In general, we elect to have retained debtin exchange for a reduced capital contribution by us when properties are acquired subject to existing Ñnancing.
F-22
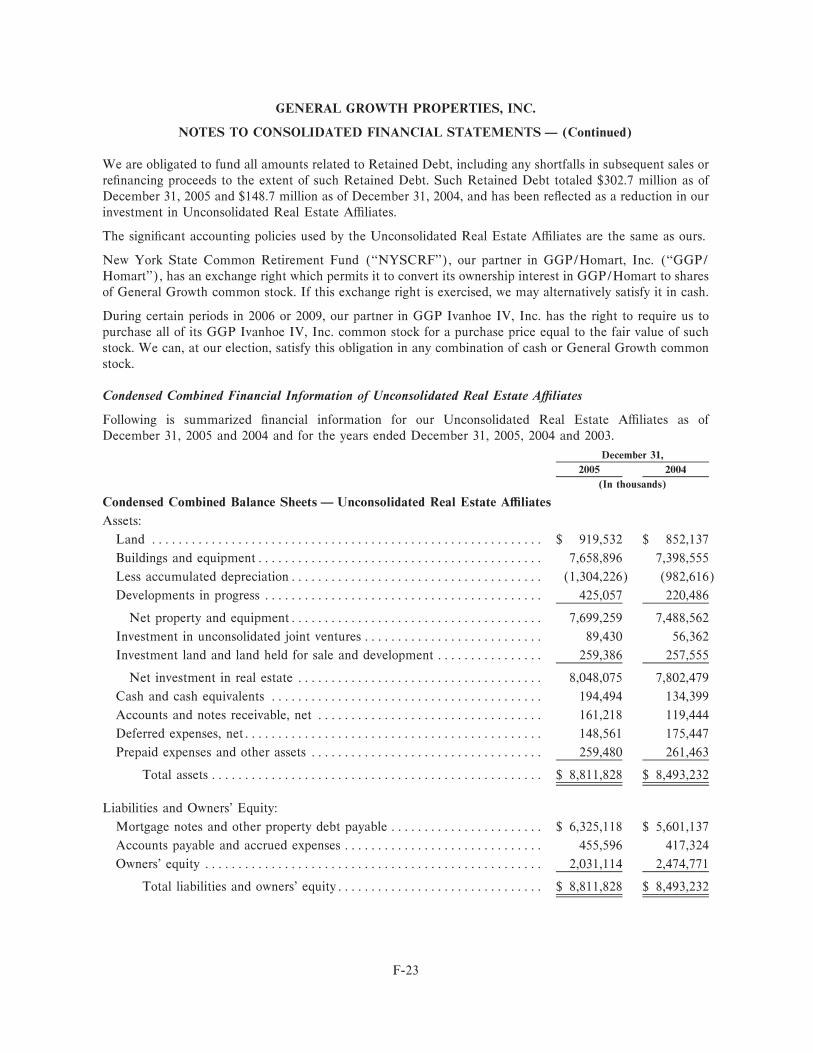
GENERAL GROWTH PROPERTIES, INC.
NOTES TO CONSOLIDATED FINANCIAL STATEMENTS Ì (Continued)
We are obligated to fund all amounts related to Retained Debt, including any shortfalls in subsequent sales orreÑnancing proceeds to the extent of such Retained Debt. Such Retained Debt totaled $302.7 million as ofDecember 31, 2005 and $148.7 million as of December 31, 2004, and has been reÖected as a reduction in ourinvestment in Unconsolidated Real Estate AÇliates.
The signiÑcant accounting policies used by the Unconsolidated Real Estate AÇliates are the same as ours.
New York State Common Retirement Fund (""NYSCRF''), our partner in GGP/Homart, Inc. (""GGP/Homart''), has an exchange right which permits it to convert its ownership interest in GGP/Homart to sharesof General Growth common stock. If this exchange right is exercised, we may alternatively satisfy it in cash.
During certain periods in 2006 or 2009, our partner in GGP Ivanhoe IV, Inc. has the right to require us topurchase all of its GGP Ivanhoe IV, Inc. common stock for a purchase price equal to the fair value of suchstock. We can, at our election, satisfy this obligation in any combination of cash or General Growth commonstock.
Condensed Combined Financial Information of Unconsolidated Real Estate AÇliates
Following is summarized Ñnancial information for our Unconsolidated Real Estate AÇliates as ofDecember 31, 2005 and 2004 and for the years ended December 31, 2005, 2004 and 2003.
December 31,
2005 2004
(In thousands)
Condensed Combined Balance Sheets Ì Unconsolidated Real Estate AÇliates
Assets:
Land ÏÏÏÏÏÏÏÏÏÏÏÏÏÏÏÏÏÏÏÏÏÏÏÏÏÏÏÏÏÏÏÏÏÏÏÏÏÏÏÏÏÏÏÏÏÏÏÏÏÏÏÏÏÏÏÏÏÏÏ $ 919,532 $ 852,137
Buildings and equipmentÏÏÏÏÏÏÏÏÏÏÏÏÏÏÏÏÏÏÏÏÏÏÏÏÏÏÏÏÏÏÏÏÏÏÏÏÏÏÏÏÏÏÏ 7,658,896 7,398,555
Less accumulated depreciationÏÏÏÏÏÏÏÏÏÏÏÏÏÏÏÏÏÏÏÏÏÏÏÏÏÏÏÏÏÏÏÏÏÏÏÏÏÏ (1,304,226) (982,616)
Developments in progress ÏÏÏÏÏÏÏÏÏÏÏÏÏÏÏÏÏÏÏÏÏÏÏÏÏÏÏÏÏÏÏÏÏÏÏÏÏÏÏÏÏÏ 425,057 220,486
Net property and equipmentÏÏÏÏÏÏÏÏÏÏÏÏÏÏÏÏÏÏÏÏÏÏÏÏÏÏÏÏÏÏÏÏÏÏÏÏÏÏ 7,699,259 7,488,562
Investment in unconsolidated joint ventures ÏÏÏÏÏÏÏÏÏÏÏÏÏÏÏÏÏÏÏÏÏÏÏÏÏÏÏ 89,430 56,362
Investment land and land held for sale and development ÏÏÏÏÏÏÏÏÏÏÏÏÏÏÏÏ 259,386 257,555
Net investment in real estate ÏÏÏÏÏÏÏÏÏÏÏÏÏÏÏÏÏÏÏÏÏÏÏÏÏÏÏÏÏÏÏÏÏÏÏÏÏ 8,048,075 7,802,479
Cash and cash equivalents ÏÏÏÏÏÏÏÏÏÏÏÏÏÏÏÏÏÏÏÏÏÏÏÏÏÏÏÏÏÏÏÏÏÏÏÏÏÏÏÏÏ 194,494 134,399
Accounts and notes receivable, net ÏÏÏÏÏÏÏÏÏÏÏÏÏÏÏÏÏÏÏÏÏÏÏÏÏÏÏÏÏÏÏÏÏÏ 161,218 119,444
Deferred expenses, netÏÏÏÏÏÏÏÏÏÏÏÏÏÏÏÏÏÏÏÏÏÏÏÏÏÏÏÏÏÏÏÏÏÏÏÏÏÏÏÏÏÏÏÏÏ 148,561 175,447
Prepaid expenses and other assets ÏÏÏÏÏÏÏÏÏÏÏÏÏÏÏÏÏÏÏÏÏÏÏÏÏÏÏÏÏÏÏÏÏÏÏ 259,480 261,463
Total assets ÏÏÏÏÏÏÏÏÏÏÏÏÏÏÏÏÏÏÏÏÏÏÏÏÏÏÏÏÏÏÏÏÏÏÏÏÏÏÏÏÏÏÏÏÏÏÏÏÏÏ $ 8,811,828 $ 8,493,232
Liabilities and Owners' Equity:
Mortgage notes and other property debt payable ÏÏÏÏÏÏÏÏÏÏÏÏÏÏÏÏÏÏÏÏÏÏÏ $ 6,325,118 $ 5,601,137
Accounts payable and accrued expenses ÏÏÏÏÏÏÏÏÏÏÏÏÏÏÏÏÏÏÏÏÏÏÏÏÏÏÏÏÏÏ 455,596 417,324
Owners' equity ÏÏÏÏÏÏÏÏÏÏÏÏÏÏÏÏÏÏÏÏÏÏÏÏÏÏÏÏÏÏÏÏÏÏÏÏÏÏÏÏÏÏÏÏÏÏÏÏÏÏÏ 2,031,114 2,474,771
Total liabilities and owners' equityÏÏÏÏÏÏÏÏÏÏÏÏÏÏÏÏÏÏÏÏÏÏÏÏÏÏÏÏÏÏÏ $ 8,811,828 $ 8,493,232
F-23
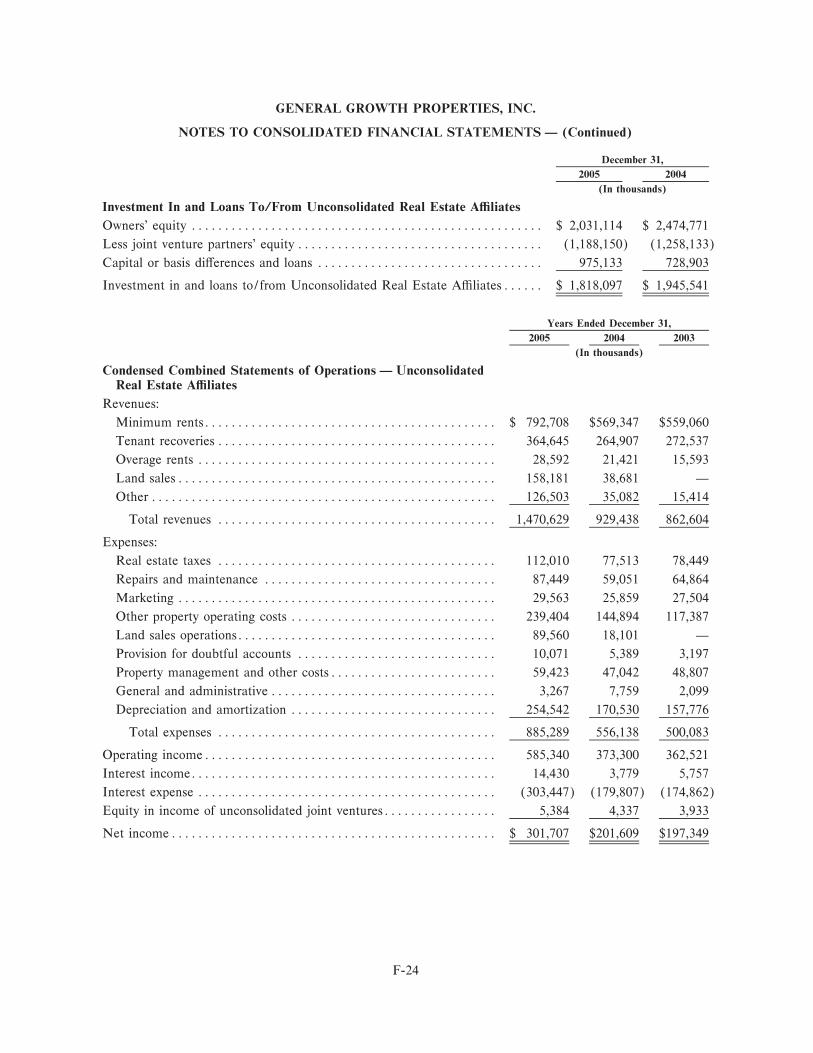
GENERAL GROWTH PROPERTIES, INC.
NOTES TO CONSOLIDATED FINANCIAL STATEMENTS Ì (Continued)
December 31,
2005 2004
(In thousands)
Investment In and Loans To/From Unconsolidated Real Estate AÇliates
Owners' equity ÏÏÏÏÏÏÏÏÏÏÏÏÏÏÏÏÏÏÏÏÏÏÏÏÏÏÏÏÏÏÏÏÏÏÏÏÏÏÏÏÏÏÏÏÏÏÏÏÏÏÏÏÏ $ 2,031,114 $ 2,474,771
Less joint venture partners' equity ÏÏÏÏÏÏÏÏÏÏÏÏÏÏÏÏÏÏÏÏÏÏÏÏÏÏÏÏÏÏÏÏÏÏÏÏÏ (1,188,150) (1,258,133)
Capital or basis diÅerences and loans ÏÏÏÏÏÏÏÏÏÏÏÏÏÏÏÏÏÏÏÏÏÏÏÏÏÏÏÏÏÏÏÏÏÏ 975,133 728,903
Investment in and loans to/from Unconsolidated Real Estate AÇliatesÏÏÏÏÏÏ $ 1,818,097 $ 1,945,541
Years Ended December 31,
2005 2004 2003
(In thousands)
Condensed Combined Statements of Operations Ì UnconsolidatedReal Estate AÇliates
Revenues:
Minimum rentsÏÏÏÏÏÏÏÏÏÏÏÏÏÏÏÏÏÏÏÏÏÏÏÏÏÏÏÏÏÏÏÏÏÏÏÏÏÏÏÏÏÏÏÏ $ 792,708 $569,347 $559,060
Tenant recoveries ÏÏÏÏÏÏÏÏÏÏÏÏÏÏÏÏÏÏÏÏÏÏÏÏÏÏÏÏÏÏÏÏÏÏÏÏÏÏÏÏÏÏ 364,645 264,907 272,537
Overage rents ÏÏÏÏÏÏÏÏÏÏÏÏÏÏÏÏÏÏÏÏÏÏÏÏÏÏÏÏÏÏÏÏÏÏÏÏÏÏÏÏÏÏÏÏÏ 28,592 21,421 15,593
Land salesÏÏÏÏÏÏÏÏÏÏÏÏÏÏÏÏÏÏÏÏÏÏÏÏÏÏÏÏÏÏÏÏÏÏÏÏÏÏÏÏÏÏÏÏÏÏÏÏ 158,181 38,681 Ì
Other ÏÏÏÏÏÏÏÏÏÏÏÏÏÏÏÏÏÏÏÏÏÏÏÏÏÏÏÏÏÏÏÏÏÏÏÏÏÏÏÏÏÏÏÏÏÏÏÏÏÏÏÏ 126,503 35,082 15,414
Total revenues ÏÏÏÏÏÏÏÏÏÏÏÏÏÏÏÏÏÏÏÏÏÏÏÏÏÏÏÏÏÏÏÏÏÏÏÏÏÏÏÏÏÏ 1,470,629 929,438 862,604
Expenses:
Real estate taxes ÏÏÏÏÏÏÏÏÏÏÏÏÏÏÏÏÏÏÏÏÏÏÏÏÏÏÏÏÏÏÏÏÏÏÏÏÏÏÏÏÏÏ 112,010 77,513 78,449
Repairs and maintenance ÏÏÏÏÏÏÏÏÏÏÏÏÏÏÏÏÏÏÏÏÏÏÏÏÏÏÏÏÏÏÏÏÏÏÏ 87,449 59,051 64,864
Marketing ÏÏÏÏÏÏÏÏÏÏÏÏÏÏÏÏÏÏÏÏÏÏÏÏÏÏÏÏÏÏÏÏÏÏÏÏÏÏÏÏÏÏÏÏÏÏÏÏ 29,563 25,859 27,504
Other property operating costs ÏÏÏÏÏÏÏÏÏÏÏÏÏÏÏÏÏÏÏÏÏÏÏÏÏÏÏÏÏÏÏ 239,404 144,894 117,387
Land sales operationsÏÏÏÏÏÏÏÏÏÏÏÏÏÏÏÏÏÏÏÏÏÏÏÏÏÏÏÏÏÏÏÏÏÏÏÏÏÏÏ 89,560 18,101 Ì
Provision for doubtful accounts ÏÏÏÏÏÏÏÏÏÏÏÏÏÏÏÏÏÏÏÏÏÏÏÏÏÏÏÏÏÏ 10,071 5,389 3,197
Property management and other costsÏÏÏÏÏÏÏÏÏÏÏÏÏÏÏÏÏÏÏÏÏÏÏÏÏ 59,423 47,042 48,807
General and administrative ÏÏÏÏÏÏÏÏÏÏÏÏÏÏÏÏÏÏÏÏÏÏÏÏÏÏÏÏÏÏÏÏÏÏ 3,267 7,759 2,099
Depreciation and amortization ÏÏÏÏÏÏÏÏÏÏÏÏÏÏÏÏÏÏÏÏÏÏÏÏÏÏÏÏÏÏÏ 254,542 170,530 157,776
Total expenses ÏÏÏÏÏÏÏÏÏÏÏÏÏÏÏÏÏÏÏÏÏÏÏÏÏÏÏÏÏÏÏÏÏÏÏÏÏÏÏÏÏÏ 885,289 556,138 500,083
Operating incomeÏÏÏÏÏÏÏÏÏÏÏÏÏÏÏÏÏÏÏÏÏÏÏÏÏÏÏÏÏÏÏÏÏÏÏÏÏÏÏÏÏÏÏÏ 585,340 373,300 362,521
Interest incomeÏÏÏÏÏÏÏÏÏÏÏÏÏÏÏÏÏÏÏÏÏÏÏÏÏÏÏÏÏÏÏÏÏÏÏÏÏÏÏÏÏÏÏÏÏÏ 14,430 3,779 5,757
Interest expense ÏÏÏÏÏÏÏÏÏÏÏÏÏÏÏÏÏÏÏÏÏÏÏÏÏÏÏÏÏÏÏÏÏÏÏÏÏÏÏÏÏÏÏÏÏ (303,447) (179,807) (174,862)
Equity in income of unconsolidated joint venturesÏÏÏÏÏÏÏÏÏÏÏÏÏÏÏÏÏ 5,384 4,337 3,933
Net incomeÏÏÏÏÏÏÏÏÏÏÏÏÏÏÏÏÏÏÏÏÏÏÏÏÏÏÏÏÏÏÏÏÏÏÏÏÏÏÏÏÏÏÏÏÏÏÏÏÏ $ 301,707 $201,609 $197,349
F-24
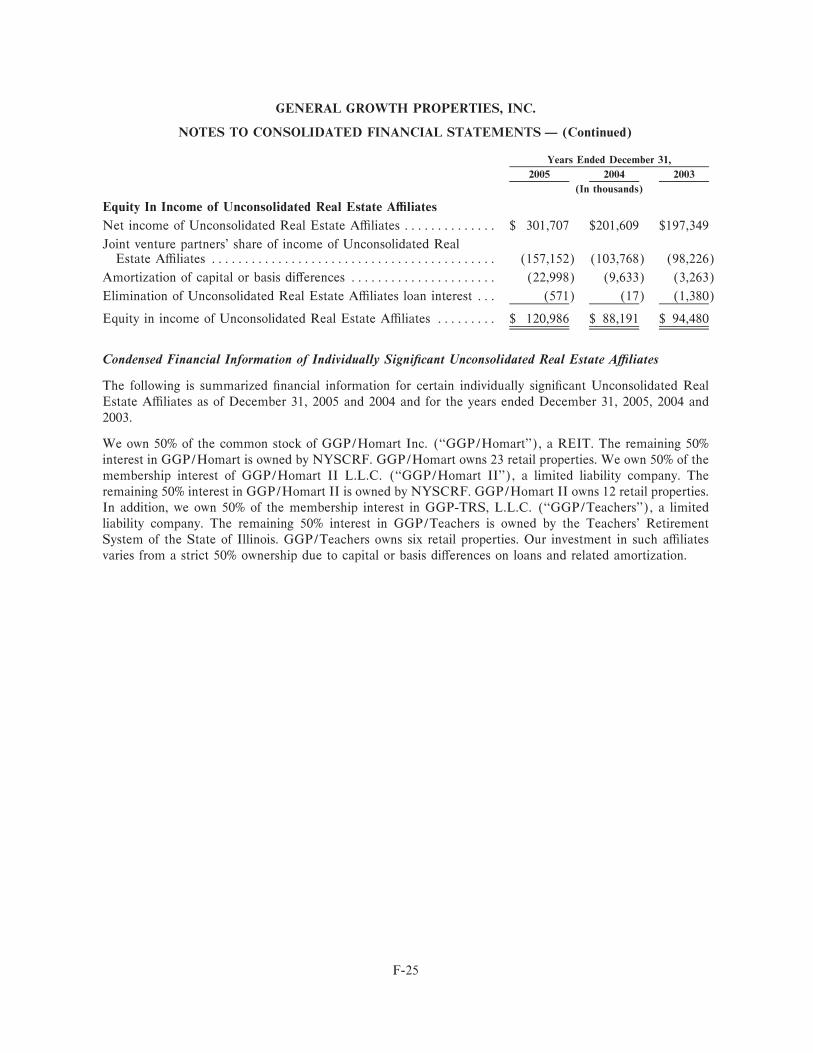
GENERAL GROWTH PROPERTIES, INC.
NOTES TO CONSOLIDATED FINANCIAL STATEMENTS Ì (Continued)
Years Ended December 31,
2005 2004 2003
(In thousands)
Equity In Income of Unconsolidated Real Estate AÇliates
Net income of Unconsolidated Real Estate AÇliates ÏÏÏÏÏÏÏÏÏÏÏÏÏÏ $ 301,707 $201,609 $197,349
Joint venture partners' share of income of Unconsolidated RealEstate AÇliates ÏÏÏÏÏÏÏÏÏÏÏÏÏÏÏÏÏÏÏÏÏÏÏÏÏÏÏÏÏÏÏÏÏÏÏÏÏÏÏÏÏÏÏ (157,152) (103,768) (98,226)
Amortization of capital or basis diÅerences ÏÏÏÏÏÏÏÏÏÏÏÏÏÏÏÏÏÏÏÏÏÏ (22,998) (9,633) (3,263)
Elimination of Unconsolidated Real Estate AÇliates loan interest ÏÏÏ (571) (17) (1,380)
Equity in income of Unconsolidated Real Estate AÇliates ÏÏÏÏÏÏÏÏÏ $ 120,986 $ 88,191 $ 94,480
Condensed Financial Information of Individually SigniÑcant Unconsolidated Real Estate AÇliates
The following is summarized Ñnancial information for certain individually signiÑcant Unconsolidated RealEstate AÇliates as of December 31, 2005 and 2004 and for the years ended December 31, 2005, 2004 and2003.
We own 50% of the common stock of GGP/Homart Inc. (""GGP/Homart''), a REIT. The remaining 50%interest in GGP/Homart is owned by NYSCRF. GGP/Homart owns 23 retail properties. We own 50% of themembership interest of GGP/Homart II L.L.C. (""GGP/Homart II''), a limited liability company. Theremaining 50% interest in GGP/Homart II is owned by NYSCRF. GGP/Homart II owns 12 retail properties.In addition, we own 50% of the membership interest in GGP-TRS, L.L.C. (""GGP/Teachers''), a limitedliability company. The remaining 50% interest in GGP/Teachers is owned by the Teachers' RetirementSystem of the State of Illinois. GGP/Teachers owns six retail properties. Our investment in such aÇliatesvaries from a strict 50% ownership due to capital or basis diÅerences on loans and related amortization.
F-25
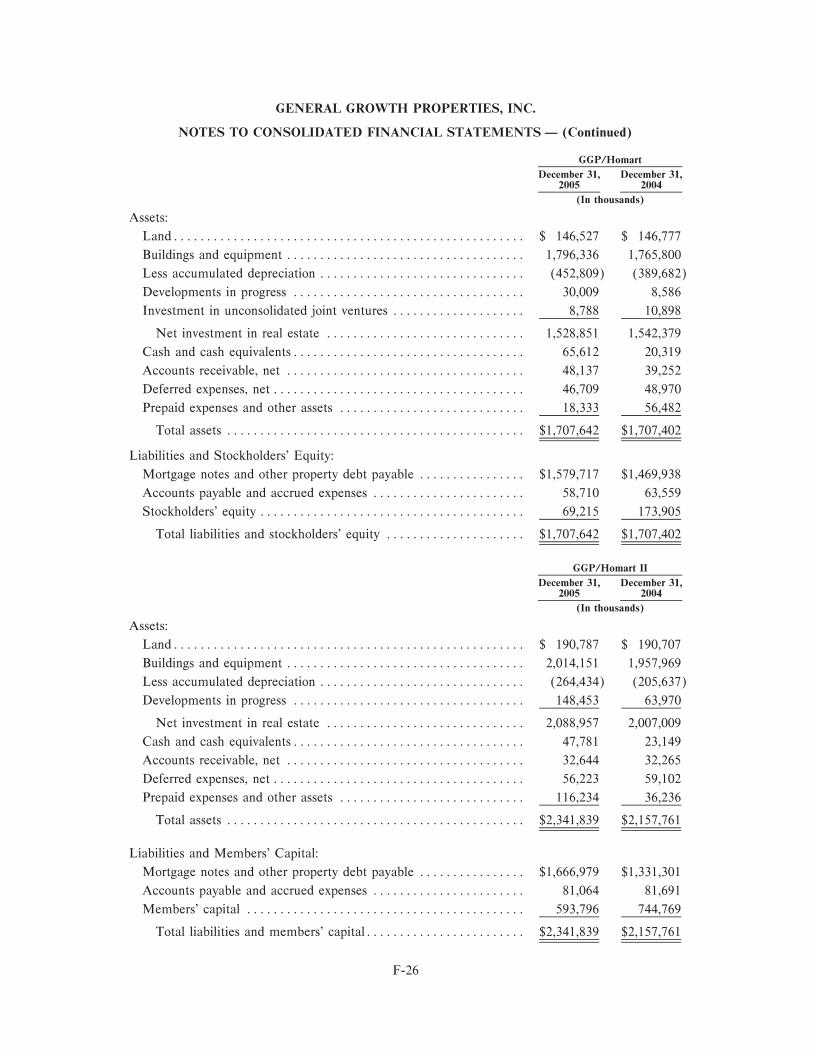
GENERAL GROWTH PROPERTIES, INC.
NOTES TO CONSOLIDATED FINANCIAL STATEMENTS Ì (Continued)
GGP/Homart
December 31, December 31,2005 2004
(In thousands)
Assets:
LandÏÏÏÏÏÏÏÏÏÏÏÏÏÏÏÏÏÏÏÏÏÏÏÏÏÏÏÏÏÏÏÏÏÏÏÏÏÏÏÏÏÏÏÏÏÏÏÏÏÏÏÏÏ $ 146,527 $ 146,777
Buildings and equipment ÏÏÏÏÏÏÏÏÏÏÏÏÏÏÏÏÏÏÏÏÏÏÏÏÏÏÏÏÏÏÏÏÏÏÏÏ 1,796,336 1,765,800
Less accumulated depreciation ÏÏÏÏÏÏÏÏÏÏÏÏÏÏÏÏÏÏÏÏÏÏÏÏÏÏÏÏÏÏÏ (452,809) (389,682)
Developments in progress ÏÏÏÏÏÏÏÏÏÏÏÏÏÏÏÏÏÏÏÏÏÏÏÏÏÏÏÏÏÏÏÏÏÏÏ 30,009 8,586
Investment in unconsolidated joint ventures ÏÏÏÏÏÏÏÏÏÏÏÏÏÏÏÏÏÏÏÏ 8,788 10,898
Net investment in real estate ÏÏÏÏÏÏÏÏÏÏÏÏÏÏÏÏÏÏÏÏÏÏÏÏÏÏÏÏÏÏ 1,528,851 1,542,379
Cash and cash equivalentsÏÏÏÏÏÏÏÏÏÏÏÏÏÏÏÏÏÏÏÏÏÏÏÏÏÏÏÏÏÏÏÏÏÏÏ 65,612 20,319
Accounts receivable, net ÏÏÏÏÏÏÏÏÏÏÏÏÏÏÏÏÏÏÏÏÏÏÏÏÏÏÏÏÏÏÏÏÏÏÏÏ 48,137 39,252
Deferred expenses, net ÏÏÏÏÏÏÏÏÏÏÏÏÏÏÏÏÏÏÏÏÏÏÏÏÏÏÏÏÏÏÏÏÏÏÏÏÏÏ 46,709 48,970
Prepaid expenses and other assets ÏÏÏÏÏÏÏÏÏÏÏÏÏÏÏÏÏÏÏÏÏÏÏÏÏÏÏÏ 18,333 56,482
Total assets ÏÏÏÏÏÏÏÏÏÏÏÏÏÏÏÏÏÏÏÏÏÏÏÏÏÏÏÏÏÏÏÏÏÏÏÏÏÏÏÏÏÏÏÏÏ $1,707,642 $1,707,402
Liabilities and Stockholders' Equity:
Mortgage notes and other property debt payable ÏÏÏÏÏÏÏÏÏÏÏÏÏÏÏÏ $1,579,717 $1,469,938
Accounts payable and accrued expenses ÏÏÏÏÏÏÏÏÏÏÏÏÏÏÏÏÏÏÏÏÏÏÏ 58,710 63,559
Stockholders' equity ÏÏÏÏÏÏÏÏÏÏÏÏÏÏÏÏÏÏÏÏÏÏÏÏÏÏÏÏÏÏÏÏÏÏÏÏÏÏÏÏ 69,215 173,905
Total liabilities and stockholders' equity ÏÏÏÏÏÏÏÏÏÏÏÏÏÏÏÏÏÏÏÏÏ $1,707,642 $1,707,402
GGP/Homart II
December 31, December 31,2005 2004
(In thousands)
Assets:
LandÏÏÏÏÏÏÏÏÏÏÏÏÏÏÏÏÏÏÏÏÏÏÏÏÏÏÏÏÏÏÏÏÏÏÏÏÏÏÏÏÏÏÏÏÏÏÏÏÏÏÏÏÏ $ 190,787 $ 190,707
Buildings and equipment ÏÏÏÏÏÏÏÏÏÏÏÏÏÏÏÏÏÏÏÏÏÏÏÏÏÏÏÏÏÏÏÏÏÏÏÏ 2,014,151 1,957,969
Less accumulated depreciation ÏÏÏÏÏÏÏÏÏÏÏÏÏÏÏÏÏÏÏÏÏÏÏÏÏÏÏÏÏÏÏ (264,434) (205,637)
Developments in progress ÏÏÏÏÏÏÏÏÏÏÏÏÏÏÏÏÏÏÏÏÏÏÏÏÏÏÏÏÏÏÏÏÏÏÏ 148,453 63,970
Net investment in real estate ÏÏÏÏÏÏÏÏÏÏÏÏÏÏÏÏÏÏÏÏÏÏÏÏÏÏÏÏÏÏ 2,088,957 2,007,009
Cash and cash equivalentsÏÏÏÏÏÏÏÏÏÏÏÏÏÏÏÏÏÏÏÏÏÏÏÏÏÏÏÏÏÏÏÏÏÏÏ 47,781 23,149
Accounts receivable, net ÏÏÏÏÏÏÏÏÏÏÏÏÏÏÏÏÏÏÏÏÏÏÏÏÏÏÏÏÏÏÏÏÏÏÏÏ 32,644 32,265
Deferred expenses, net ÏÏÏÏÏÏÏÏÏÏÏÏÏÏÏÏÏÏÏÏÏÏÏÏÏÏÏÏÏÏÏÏÏÏÏÏÏÏ 56,223 59,102
Prepaid expenses and other assets ÏÏÏÏÏÏÏÏÏÏÏÏÏÏÏÏÏÏÏÏÏÏÏÏÏÏÏÏ 116,234 36,236
Total assets ÏÏÏÏÏÏÏÏÏÏÏÏÏÏÏÏÏÏÏÏÏÏÏÏÏÏÏÏÏÏÏÏÏÏÏÏÏÏÏÏÏÏÏÏÏ $2,341,839 $2,157,761
Liabilities and Members' Capital:
Mortgage notes and other property debt payable ÏÏÏÏÏÏÏÏÏÏÏÏÏÏÏÏ $1,666,979 $1,331,301
Accounts payable and accrued expenses ÏÏÏÏÏÏÏÏÏÏÏÏÏÏÏÏÏÏÏÏÏÏÏ 81,064 81,691
Members' capital ÏÏÏÏÏÏÏÏÏÏÏÏÏÏÏÏÏÏÏÏÏÏÏÏÏÏÏÏÏÏÏÏÏÏÏÏÏÏÏÏÏÏ 593,796 744,769
Total liabilities and members' capitalÏÏÏÏÏÏÏÏÏÏÏÏÏÏÏÏÏÏÏÏÏÏÏÏ $2,341,839 $2,157,761
F-26
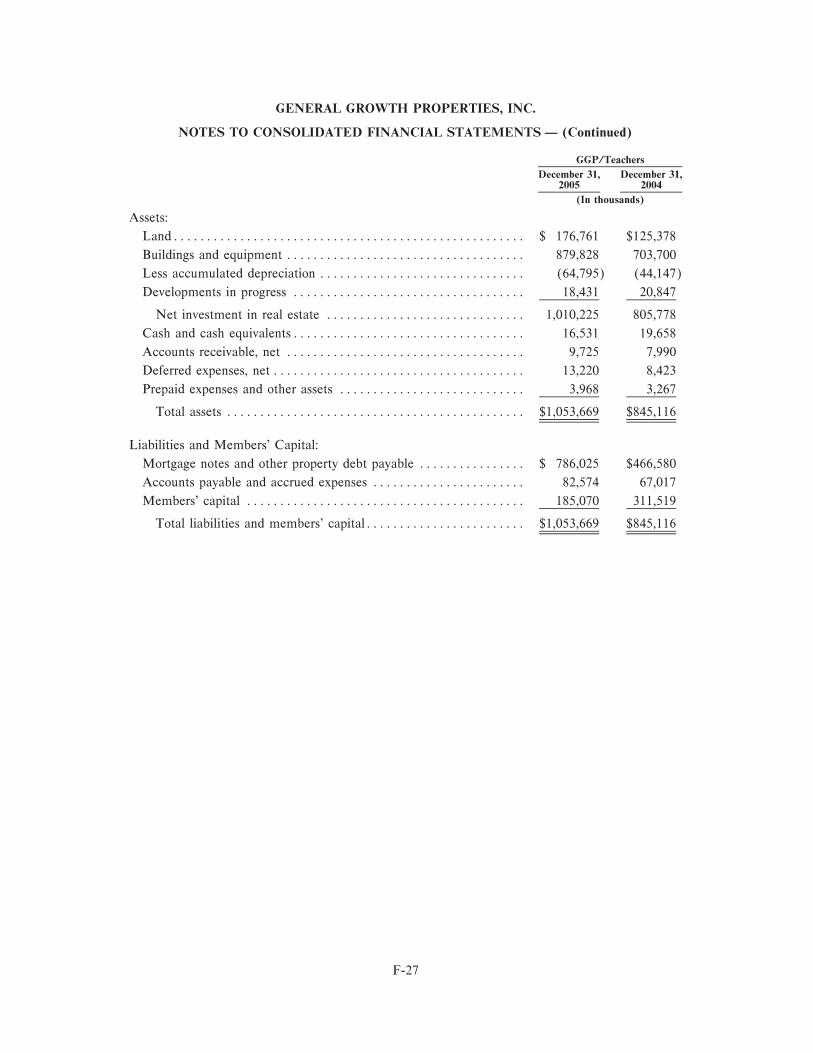
GENERAL GROWTH PROPERTIES, INC.
NOTES TO CONSOLIDATED FINANCIAL STATEMENTS Ì (Continued)
GGP/Teachers
December 31, December 31,2005 2004
(In thousands)
Assets:
LandÏÏÏÏÏÏÏÏÏÏÏÏÏÏÏÏÏÏÏÏÏÏÏÏÏÏÏÏÏÏÏÏÏÏÏÏÏÏÏÏÏÏÏÏÏÏÏÏÏÏÏÏÏ $ 176,761 $125,378
Buildings and equipment ÏÏÏÏÏÏÏÏÏÏÏÏÏÏÏÏÏÏÏÏÏÏÏÏÏÏÏÏÏÏÏÏÏÏÏÏ 879,828 703,700
Less accumulated depreciation ÏÏÏÏÏÏÏÏÏÏÏÏÏÏÏÏÏÏÏÏÏÏÏÏÏÏÏÏÏÏÏ (64,795) (44,147)
Developments in progress ÏÏÏÏÏÏÏÏÏÏÏÏÏÏÏÏÏÏÏÏÏÏÏÏÏÏÏÏÏÏÏÏÏÏÏ 18,431 20,847
Net investment in real estate ÏÏÏÏÏÏÏÏÏÏÏÏÏÏÏÏÏÏÏÏÏÏÏÏÏÏÏÏÏÏ 1,010,225 805,778
Cash and cash equivalentsÏÏÏÏÏÏÏÏÏÏÏÏÏÏÏÏÏÏÏÏÏÏÏÏÏÏÏÏÏÏÏÏÏÏÏ 16,531 19,658
Accounts receivable, net ÏÏÏÏÏÏÏÏÏÏÏÏÏÏÏÏÏÏÏÏÏÏÏÏÏÏÏÏÏÏÏÏÏÏÏÏ 9,725 7,990
Deferred expenses, net ÏÏÏÏÏÏÏÏÏÏÏÏÏÏÏÏÏÏÏÏÏÏÏÏÏÏÏÏÏÏÏÏÏÏÏÏÏÏ 13,220 8,423
Prepaid expenses and other assets ÏÏÏÏÏÏÏÏÏÏÏÏÏÏÏÏÏÏÏÏÏÏÏÏÏÏÏÏ 3,968 3,267
Total assets ÏÏÏÏÏÏÏÏÏÏÏÏÏÏÏÏÏÏÏÏÏÏÏÏÏÏÏÏÏÏÏÏÏÏÏÏÏÏÏÏÏÏÏÏÏ $1,053,669 $845,116
Liabilities and Members' Capital:
Mortgage notes and other property debt payable ÏÏÏÏÏÏÏÏÏÏÏÏÏÏÏÏ $ 786,025 $466,580
Accounts payable and accrued expenses ÏÏÏÏÏÏÏÏÏÏÏÏÏÏÏÏÏÏÏÏÏÏÏ 82,574 67,017
Members' capital ÏÏÏÏÏÏÏÏÏÏÏÏÏÏÏÏÏÏÏÏÏÏÏÏÏÏÏÏÏÏÏÏÏÏÏÏÏÏÏÏÏÏ 185,070 311,519
Total liabilities and members' capitalÏÏÏÏÏÏÏÏÏÏÏÏÏÏÏÏÏÏÏÏÏÏÏÏ $1,053,669 $845,116
F-27
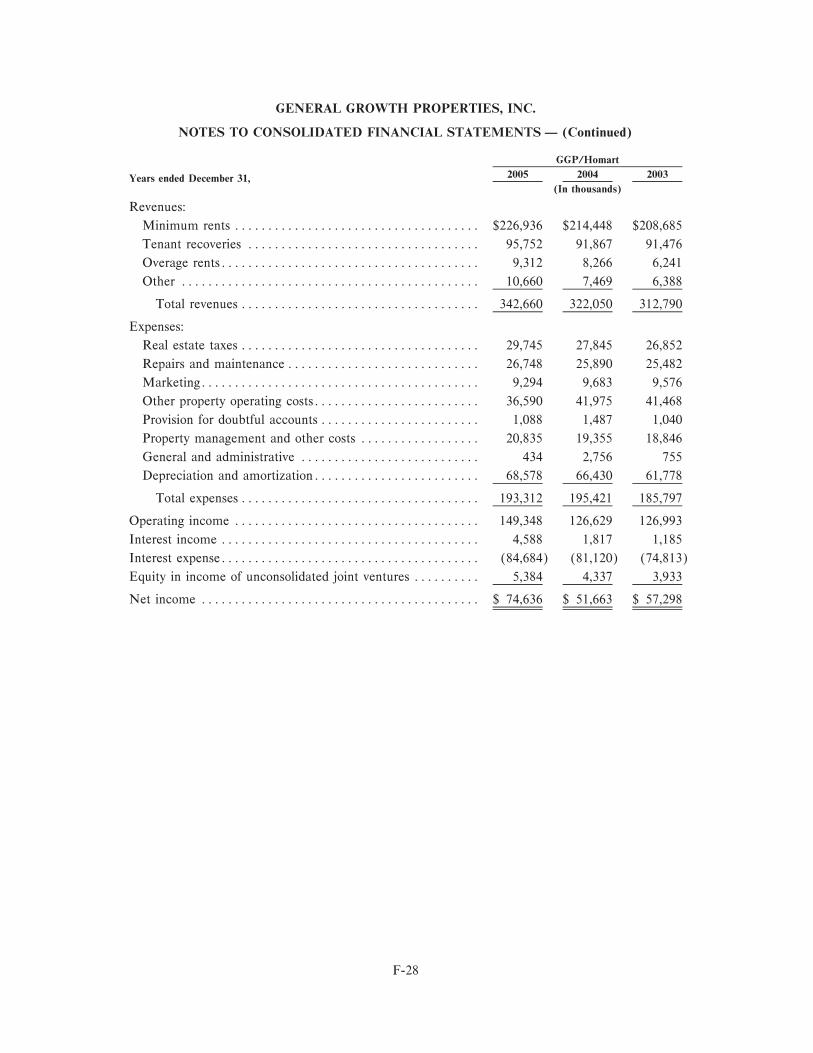
GENERAL GROWTH PROPERTIES, INC.
NOTES TO CONSOLIDATED FINANCIAL STATEMENTS Ì (Continued)
GGP/Homart
2005 2004 2003Years ended December 31,(In thousands)
Revenues:
Minimum rents ÏÏÏÏÏÏÏÏÏÏÏÏÏÏÏÏÏÏÏÏÏÏÏÏÏÏÏÏÏÏÏÏÏÏÏÏÏ $226,936 $214,448 $208,685
Tenant recoveries ÏÏÏÏÏÏÏÏÏÏÏÏÏÏÏÏÏÏÏÏÏÏÏÏÏÏÏÏÏÏÏÏÏÏÏ 95,752 91,867 91,476
Overage rentsÏÏÏÏÏÏÏÏÏÏÏÏÏÏÏÏÏÏÏÏÏÏÏÏÏÏÏÏÏÏÏÏÏÏÏÏÏÏÏ 9,312 8,266 6,241
Other ÏÏÏÏÏÏÏÏÏÏÏÏÏÏÏÏÏÏÏÏÏÏÏÏÏÏÏÏÏÏÏÏÏÏÏÏÏÏÏÏÏÏÏÏÏ 10,660 7,469 6,388
Total revenues ÏÏÏÏÏÏÏÏÏÏÏÏÏÏÏÏÏÏÏÏÏÏÏÏÏÏÏÏÏÏÏÏÏÏÏÏ 342,660 322,050 312,790
Expenses:
Real estate taxes ÏÏÏÏÏÏÏÏÏÏÏÏÏÏÏÏÏÏÏÏÏÏÏÏÏÏÏÏÏÏÏÏÏÏÏÏ 29,745 27,845 26,852
Repairs and maintenance ÏÏÏÏÏÏÏÏÏÏÏÏÏÏÏÏÏÏÏÏÏÏÏÏÏÏÏÏÏ 26,748 25,890 25,482
MarketingÏÏÏÏÏÏÏÏÏÏÏÏÏÏÏÏÏÏÏÏÏÏÏÏÏÏÏÏÏÏÏÏÏÏÏÏÏÏÏÏÏÏ 9,294 9,683 9,576
Other property operating costsÏÏÏÏÏÏÏÏÏÏÏÏÏÏÏÏÏÏÏÏÏÏÏÏÏ 36,590 41,975 41,468
Provision for doubtful accounts ÏÏÏÏÏÏÏÏÏÏÏÏÏÏÏÏÏÏÏÏÏÏÏÏ 1,088 1,487 1,040
Property management and other costs ÏÏÏÏÏÏÏÏÏÏÏÏÏÏÏÏÏÏ 20,835 19,355 18,846
General and administrative ÏÏÏÏÏÏÏÏÏÏÏÏÏÏÏÏÏÏÏÏÏÏÏÏÏÏÏ 434 2,756 755
Depreciation and amortizationÏÏÏÏÏÏÏÏÏÏÏÏÏÏÏÏÏÏÏÏÏÏÏÏÏ 68,578 66,430 61,778
Total expenses ÏÏÏÏÏÏÏÏÏÏÏÏÏÏÏÏÏÏÏÏÏÏÏÏÏÏÏÏÏÏÏÏÏÏÏÏ 193,312 195,421 185,797
Operating income ÏÏÏÏÏÏÏÏÏÏÏÏÏÏÏÏÏÏÏÏÏÏÏÏÏÏÏÏÏÏÏÏÏÏÏÏÏ 149,348 126,629 126,993
Interest income ÏÏÏÏÏÏÏÏÏÏÏÏÏÏÏÏÏÏÏÏÏÏÏÏÏÏÏÏÏÏÏÏÏÏÏÏÏÏÏ 4,588 1,817 1,185
Interest expenseÏÏÏÏÏÏÏÏÏÏÏÏÏÏÏÏÏÏÏÏÏÏÏÏÏÏÏÏÏÏÏÏÏÏÏÏÏÏÏ (84,684) (81,120) (74,813)
Equity in income of unconsolidated joint ventures ÏÏÏÏÏÏÏÏÏÏ 5,384 4,337 3,933
Net income ÏÏÏÏÏÏÏÏÏÏÏÏÏÏÏÏÏÏÏÏÏÏÏÏÏÏÏÏÏÏÏÏÏÏÏÏÏÏÏÏÏÏ $ 74,636 $ 51,663 $ 57,298
F-28
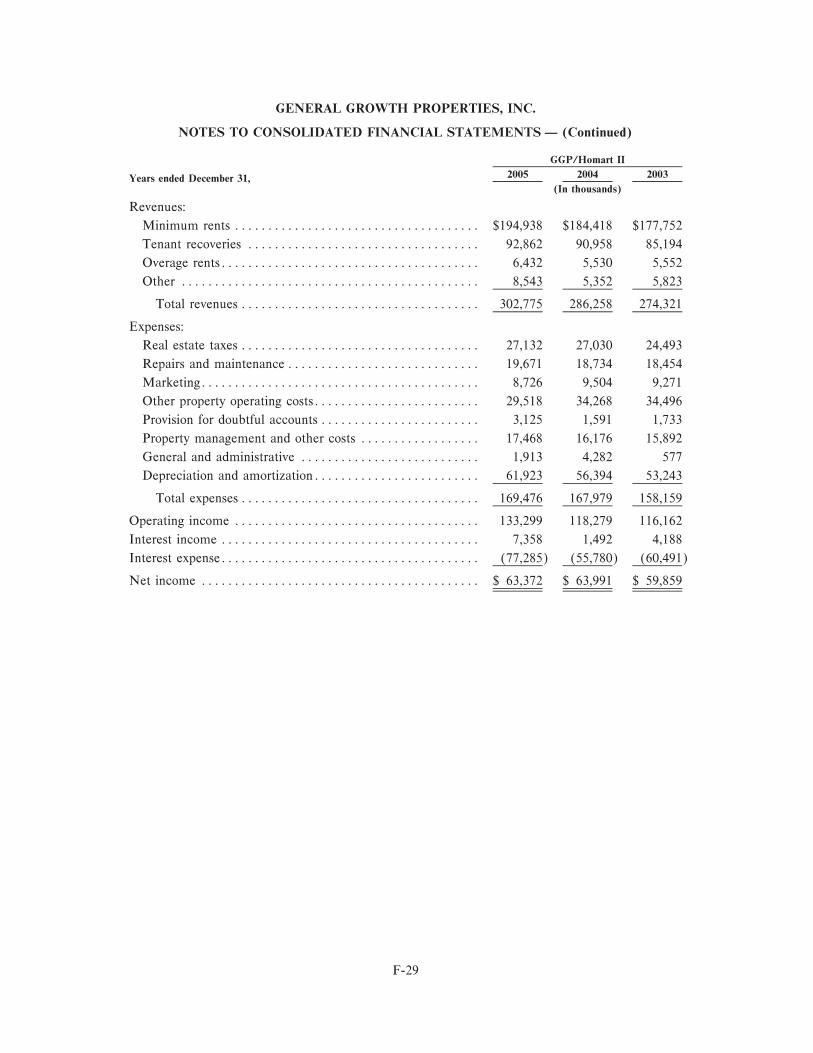
GENERAL GROWTH PROPERTIES, INC.
NOTES TO CONSOLIDATED FINANCIAL STATEMENTS Ì (Continued)
GGP/Homart II
2005 2004 2003Years ended December 31,(In thousands)
Revenues:
Minimum rents ÏÏÏÏÏÏÏÏÏÏÏÏÏÏÏÏÏÏÏÏÏÏÏÏÏÏÏÏÏÏÏÏÏÏÏÏÏ $194,938 $184,418 $177,752
Tenant recoveries ÏÏÏÏÏÏÏÏÏÏÏÏÏÏÏÏÏÏÏÏÏÏÏÏÏÏÏÏÏÏÏÏÏÏÏ 92,862 90,958 85,194
Overage rentsÏÏÏÏÏÏÏÏÏÏÏÏÏÏÏÏÏÏÏÏÏÏÏÏÏÏÏÏÏÏÏÏÏÏÏÏÏÏÏ 6,432 5,530 5,552
Other ÏÏÏÏÏÏÏÏÏÏÏÏÏÏÏÏÏÏÏÏÏÏÏÏÏÏÏÏÏÏÏÏÏÏÏÏÏÏÏÏÏÏÏÏÏ 8,543 5,352 5,823
Total revenues ÏÏÏÏÏÏÏÏÏÏÏÏÏÏÏÏÏÏÏÏÏÏÏÏÏÏÏÏÏÏÏÏÏÏÏÏ 302,775 286,258 274,321
Expenses:
Real estate taxes ÏÏÏÏÏÏÏÏÏÏÏÏÏÏÏÏÏÏÏÏÏÏÏÏÏÏÏÏÏÏÏÏÏÏÏÏ 27,132 27,030 24,493
Repairs and maintenance ÏÏÏÏÏÏÏÏÏÏÏÏÏÏÏÏÏÏÏÏÏÏÏÏÏÏÏÏÏ 19,671 18,734 18,454
MarketingÏÏÏÏÏÏÏÏÏÏÏÏÏÏÏÏÏÏÏÏÏÏÏÏÏÏÏÏÏÏÏÏÏÏÏÏÏÏÏÏÏÏ 8,726 9,504 9,271
Other property operating costsÏÏÏÏÏÏÏÏÏÏÏÏÏÏÏÏÏÏÏÏÏÏÏÏÏ 29,518 34,268 34,496
Provision for doubtful accounts ÏÏÏÏÏÏÏÏÏÏÏÏÏÏÏÏÏÏÏÏÏÏÏÏ 3,125 1,591 1,733
Property management and other costs ÏÏÏÏÏÏÏÏÏÏÏÏÏÏÏÏÏÏ 17,468 16,176 15,892
General and administrative ÏÏÏÏÏÏÏÏÏÏÏÏÏÏÏÏÏÏÏÏÏÏÏÏÏÏÏ 1,913 4,282 577
Depreciation and amortizationÏÏÏÏÏÏÏÏÏÏÏÏÏÏÏÏÏÏÏÏÏÏÏÏÏ 61,923 56,394 53,243
Total expenses ÏÏÏÏÏÏÏÏÏÏÏÏÏÏÏÏÏÏÏÏÏÏÏÏÏÏÏÏÏÏÏÏÏÏÏÏ 169,476 167,979 158,159
Operating income ÏÏÏÏÏÏÏÏÏÏÏÏÏÏÏÏÏÏÏÏÏÏÏÏÏÏÏÏÏÏÏÏÏÏÏÏÏ 133,299 118,279 116,162
Interest income ÏÏÏÏÏÏÏÏÏÏÏÏÏÏÏÏÏÏÏÏÏÏÏÏÏÏÏÏÏÏÏÏÏÏÏÏÏÏÏ 7,358 1,492 4,188
Interest expenseÏÏÏÏÏÏÏÏÏÏÏÏÏÏÏÏÏÏÏÏÏÏÏÏÏÏÏÏÏÏÏÏÏÏÏÏÏÏÏ (77,285) (55,780) (60,491)
Net income ÏÏÏÏÏÏÏÏÏÏÏÏÏÏÏÏÏÏÏÏÏÏÏÏÏÏÏÏÏÏÏÏÏÏÏÏÏÏÏÏÏÏ $ 63,372 $ 63,991 $ 59,859
F-29
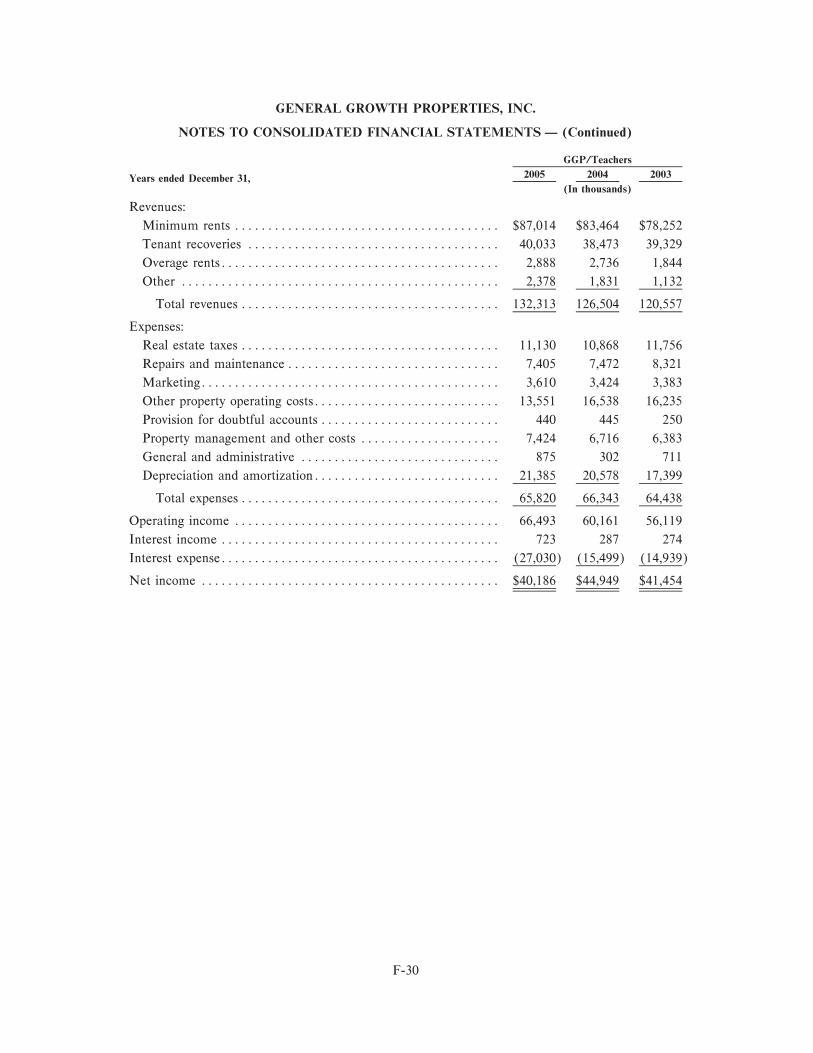
GENERAL GROWTH PROPERTIES, INC.
NOTES TO CONSOLIDATED FINANCIAL STATEMENTS Ì (Continued)
GGP/Teachers
2005 2004 2003Years ended December 31,(In thousands)
Revenues:
Minimum rents ÏÏÏÏÏÏÏÏÏÏÏÏÏÏÏÏÏÏÏÏÏÏÏÏÏÏÏÏÏÏÏÏÏÏÏÏÏÏÏÏ $87,014 $83,464 $78,252
Tenant recoveries ÏÏÏÏÏÏÏÏÏÏÏÏÏÏÏÏÏÏÏÏÏÏÏÏÏÏÏÏÏÏÏÏÏÏÏÏÏÏ 40,033 38,473 39,329
Overage rentsÏÏÏÏÏÏÏÏÏÏÏÏÏÏÏÏÏÏÏÏÏÏÏÏÏÏÏÏÏÏÏÏÏÏÏÏÏÏÏÏÏÏ 2,888 2,736 1,844
Other ÏÏÏÏÏÏÏÏÏÏÏÏÏÏÏÏÏÏÏÏÏÏÏÏÏÏÏÏÏÏÏÏÏÏÏÏÏÏÏÏÏÏÏÏÏÏÏÏ 2,378 1,831 1,132
Total revenues ÏÏÏÏÏÏÏÏÏÏÏÏÏÏÏÏÏÏÏÏÏÏÏÏÏÏÏÏÏÏÏÏÏÏÏÏÏÏÏ 132,313 126,504 120,557
Expenses:
Real estate taxes ÏÏÏÏÏÏÏÏÏÏÏÏÏÏÏÏÏÏÏÏÏÏÏÏÏÏÏÏÏÏÏÏÏÏÏÏÏÏÏ 11,130 10,868 11,756
Repairs and maintenance ÏÏÏÏÏÏÏÏÏÏÏÏÏÏÏÏÏÏÏÏÏÏÏÏÏÏÏÏÏÏÏÏ 7,405 7,472 8,321
MarketingÏÏÏÏÏÏÏÏÏÏÏÏÏÏÏÏÏÏÏÏÏÏÏÏÏÏÏÏÏÏÏÏÏÏÏÏÏÏÏÏÏÏÏÏÏ 3,610 3,424 3,383
Other property operating costsÏÏÏÏÏÏÏÏÏÏÏÏÏÏÏÏÏÏÏÏÏÏÏÏÏÏÏÏ 13,551 16,538 16,235
Provision for doubtful accounts ÏÏÏÏÏÏÏÏÏÏÏÏÏÏÏÏÏÏÏÏÏÏÏÏÏÏÏ 440 445 250
Property management and other costs ÏÏÏÏÏÏÏÏÏÏÏÏÏÏÏÏÏÏÏÏÏ 7,424 6,716 6,383
General and administrative ÏÏÏÏÏÏÏÏÏÏÏÏÏÏÏÏÏÏÏÏÏÏÏÏÏÏÏÏÏÏ 875 302 711
Depreciation and amortizationÏÏÏÏÏÏÏÏÏÏÏÏÏÏÏÏÏÏÏÏÏÏÏÏÏÏÏÏ 21,385 20,578 17,399
Total expenses ÏÏÏÏÏÏÏÏÏÏÏÏÏÏÏÏÏÏÏÏÏÏÏÏÏÏÏÏÏÏÏÏÏÏÏÏÏÏÏ 65,820 66,343 64,438
Operating income ÏÏÏÏÏÏÏÏÏÏÏÏÏÏÏÏÏÏÏÏÏÏÏÏÏÏÏÏÏÏÏÏÏÏÏÏÏÏÏÏ 66,493 60,161 56,119
Interest income ÏÏÏÏÏÏÏÏÏÏÏÏÏÏÏÏÏÏÏÏÏÏÏÏÏÏÏÏÏÏÏÏÏÏÏÏÏÏÏÏÏÏ 723 287 274
Interest expenseÏÏÏÏÏÏÏÏÏÏÏÏÏÏÏÏÏÏÏÏÏÏÏÏÏÏÏÏÏÏÏÏÏÏÏÏÏÏÏÏÏÏ (27,030) (15,499) (14,939)
Net income ÏÏÏÏÏÏÏÏÏÏÏÏÏÏÏÏÏÏÏÏÏÏÏÏÏÏÏÏÏÏÏÏÏÏÏÏÏÏÏÏÏÏÏÏÏ $40,186 $44,949 $41,454
F-30
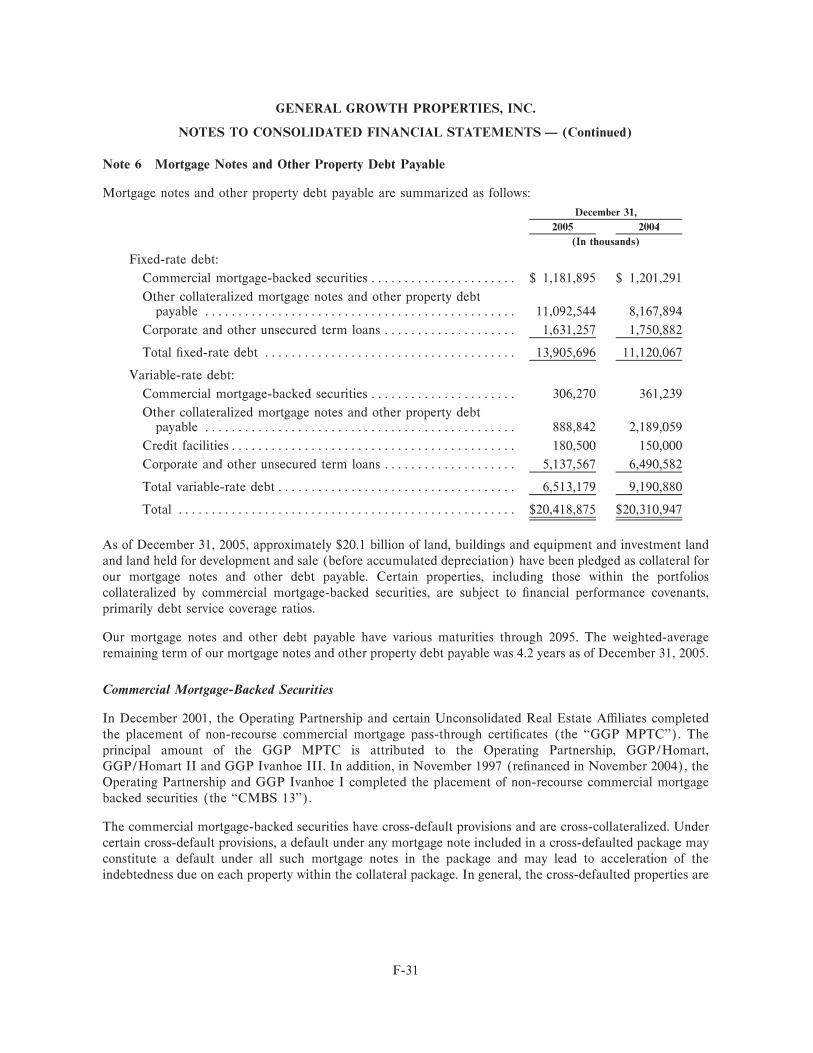
GENERAL GROWTH PROPERTIES, INC.
NOTES TO CONSOLIDATED FINANCIAL STATEMENTS Ì (Continued)
Note 6 Mortgage Notes and Other Property Debt Payable
Mortgage notes and other property debt payable are summarized as follows:
December 31,
2005 2004
(In thousands)
Fixed-rate debt:
Commercial mortgage-backed securities ÏÏÏÏÏÏÏÏÏÏÏÏÏÏÏÏÏÏÏÏÏÏ $ 1,181,895 $ 1,201,291
Other collateralized mortgage notes and other property debtpayable ÏÏÏÏÏÏÏÏÏÏÏÏÏÏÏÏÏÏÏÏÏÏÏÏÏÏÏÏÏÏÏÏÏÏÏÏÏÏÏÏÏÏÏÏÏÏÏ 11,092,544 8,167,894
Corporate and other unsecured term loans ÏÏÏÏÏÏÏÏÏÏÏÏÏÏÏÏÏÏÏÏ 1,631,257 1,750,882
Total Ñxed-rate debt ÏÏÏÏÏÏÏÏÏÏÏÏÏÏÏÏÏÏÏÏÏÏÏÏÏÏÏÏÏÏÏÏÏÏÏÏÏÏ 13,905,696 11,120,067
Variable-rate debt:
Commercial mortgage-backed securities ÏÏÏÏÏÏÏÏÏÏÏÏÏÏÏÏÏÏÏÏÏÏ 306,270 361,239
Other collateralized mortgage notes and other property debtpayable ÏÏÏÏÏÏÏÏÏÏÏÏÏÏÏÏÏÏÏÏÏÏÏÏÏÏÏÏÏÏÏÏÏÏÏÏÏÏÏÏÏÏÏÏÏÏÏ 888,842 2,189,059
Credit facilitiesÏÏÏÏÏÏÏÏÏÏÏÏÏÏÏÏÏÏÏÏÏÏÏÏÏÏÏÏÏÏÏÏÏÏÏÏÏÏÏÏÏÏÏ 180,500 150,000
Corporate and other unsecured term loans ÏÏÏÏÏÏÏÏÏÏÏÏÏÏÏÏÏÏÏÏ 5,137,567 6,490,582
Total variable-rate debt ÏÏÏÏÏÏÏÏÏÏÏÏÏÏÏÏÏÏÏÏÏÏÏÏÏÏÏÏÏÏÏÏÏÏÏÏ 6,513,179 9,190,880
Total ÏÏÏÏÏÏÏÏÏÏÏÏÏÏÏÏÏÏÏÏÏÏÏÏÏÏÏÏÏÏÏÏÏÏÏÏÏÏÏÏÏÏÏÏÏÏÏÏÏÏÏ $20,418,875 $20,310,947
As of December 31, 2005, approximately $20.1 billion of land, buildings and equipment and investment landand land held for development and sale (before accumulated depreciation) have been pledged as collateral forour mortgage notes and other debt payable. Certain properties, including those within the portfolioscollateralized by commercial mortgage-backed securities, are subject to Ñnancial performance covenants,primarily debt service coverage ratios.
Our mortgage notes and other debt payable have various maturities through 2095. The weighted-averageremaining term of our mortgage notes and other property debt payable was 4.2 years as of December 31, 2005.
Commercial Mortgage-Backed Securities
In December 2001, the Operating Partnership and certain Unconsolidated Real Estate AÇliates completedthe placement of non-recourse commercial mortgage pass-through certiÑcates (the ""GGP MPTC''). Theprincipal amount of the GGP MPTC is attributed to the Operating Partnership, GGP/Homart,GGP/Homart II and GGP Ivanhoe III. In addition, in November 1997 (reÑnanced in November 2004), theOperating Partnership and GGP Ivanhoe I completed the placement of non-recourse commercial mortgagebacked securities (the ""CMBS 13'').
The commercial mortgage-backed securities have cross-default provisions and are cross-collateralized. Undercertain cross-default provisions, a default under any mortgage note included in a cross-defaulted package mayconstitute a default under all such mortgage notes in the package and may lead to acceleration of theindebtedness due on each property within the collateral package. In general, the cross-defaulted properties are
F-31
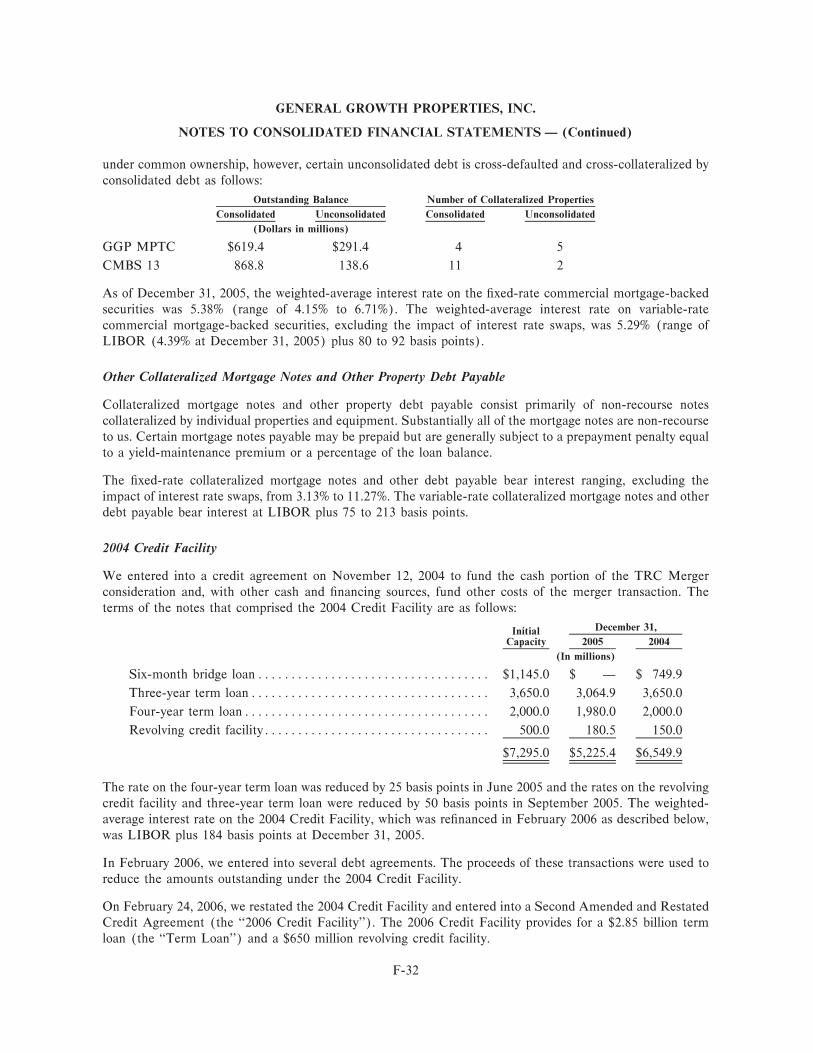
GENERAL GROWTH PROPERTIES, INC.
NOTES TO CONSOLIDATED FINANCIAL STATEMENTS Ì (Continued)
under common ownership, however, certain unconsolidated debt is cross-defaulted and cross-collateralized byconsolidated debt as follows:
Outstanding Balance Number of Collateralized Properties
Consolidated Unconsolidated Consolidated Unconsolidated
(Dollars in millions)
GGP MPTC $619.4 $291.4 4 5
CMBS 13 868.8 138.6 11 2
As of December 31, 2005, the weighted-average interest rate on the Ñxed-rate commercial mortgage-backedsecurities was 5.38% (range of 4.15% to 6.71%). The weighted-average interest rate on variable-ratecommercial mortgage-backed securities, excluding the impact of interest rate swaps, was 5.29% (range ofLIBOR (4.39% at December 31, 2005) plus 80 to 92 basis points).
Other Collateralized Mortgage Notes and Other Property Debt Payable
Collateralized mortgage notes and other property debt payable consist primarily of non-recourse notescollateralized by individual properties and equipment. Substantially all of the mortgage notes are non-recourseto us. Certain mortgage notes payable may be prepaid but are generally subject to a prepayment penalty equalto a yield-maintenance premium or a percentage of the loan balance.
The Ñxed-rate collateralized mortgage notes and other debt payable bear interest ranging, excluding theimpact of interest rate swaps, from 3.13% to 11.27%. The variable-rate collateralized mortgage notes and otherdebt payable bear interest at LIBOR plus 75 to 213 basis points.
2004 Credit Facility
We entered into a credit agreement on November 12, 2004 to fund the cash portion of the TRC Mergerconsideration and, with other cash and Ñnancing sources, fund other costs of the merger transaction. Theterms of the notes that comprised the 2004 Credit Facility are as follows:
December 31,InitialCapacity 2005 2004
(In millions)
Six-month bridge loanÏÏÏÏÏÏÏÏÏÏÏÏÏÏÏÏÏÏÏÏÏÏÏÏÏÏÏÏÏÏÏÏÏÏÏ $1,145.0 $ Ì $ 749.9
Three-year term loanÏÏÏÏÏÏÏÏÏÏÏÏÏÏÏÏÏÏÏÏÏÏÏÏÏÏÏÏÏÏÏÏÏÏÏÏ 3,650.0 3,064.9 3,650.0
Four-year term loanÏÏÏÏÏÏÏÏÏÏÏÏÏÏÏÏÏÏÏÏÏÏÏÏÏÏÏÏÏÏÏÏÏÏÏÏÏ 2,000.0 1,980.0 2,000.0
Revolving credit facilityÏÏÏÏÏÏÏÏÏÏÏÏÏÏÏÏÏÏÏÏÏÏÏÏÏÏÏÏÏÏÏÏÏÏ 500.0 180.5 150.0
$7,295.0 $5,225.4 $6,549.9
The rate on the four-year term loan was reduced by 25 basis points in June 2005 and the rates on the revolvingcredit facility and three-year term loan were reduced by 50 basis points in September 2005. The weighted-average interest rate on the 2004 Credit Facility, which was reÑnanced in February 2006 as described below,was LIBOR plus 184 basis points at December 31, 2005.
In February 2006, we entered into several debt agreements. The proceeds of these transactions were used toreduce the amounts outstanding under the 2004 Credit Facility.
On February 24, 2006, we restated the 2004 Credit Facility and entered into a Second Amended and RestatedCredit Agreement (the ""2006 Credit Facility''). The 2006 Credit Facility provides for a $2.85 billion termloan (the ""Term Loan'') and a $650 million revolving credit facility.
F-32
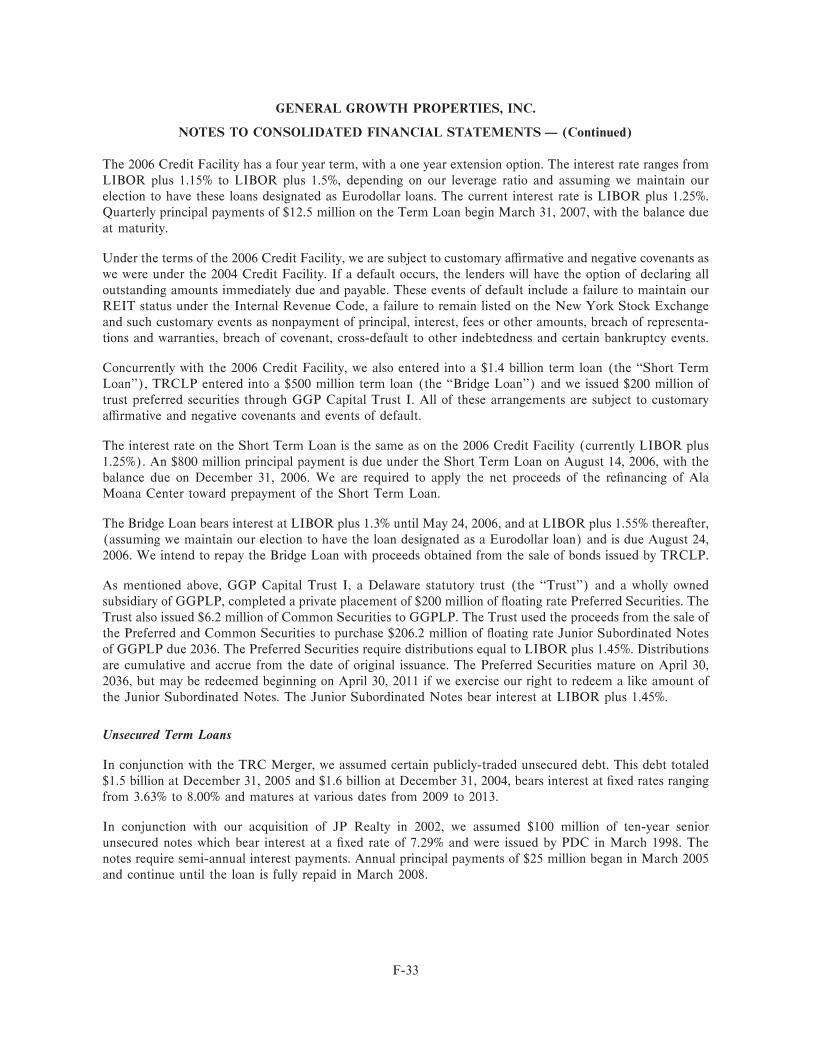
GENERAL GROWTH PROPERTIES, INC.
NOTES TO CONSOLIDATED FINANCIAL STATEMENTS Ì (Continued)
The 2006 Credit Facility has a four year term, with a one year extension option. The interest rate ranges fromLIBOR plus 1.15% to LIBOR plus 1.5%, depending on our leverage ratio and assuming we maintain ourelection to have these loans designated as Eurodollar loans. The current interest rate is LIBOR plus 1.25%.Quarterly principal payments of $12.5 million on the Term Loan begin March 31, 2007, with the balance dueat maturity.
Under the terms of the 2006 Credit Facility, we are subject to customary aÇrmative and negative covenants aswe were under the 2004 Credit Facility. If a default occurs, the lenders will have the option of declaring alloutstanding amounts immediately due and payable. These events of default include a failure to maintain ourREIT status under the Internal Revenue Code, a failure to remain listed on the New York Stock Exchangeand such customary events as nonpayment of principal, interest, fees or other amounts, breach of representa-tions and warranties, breach of covenant, cross-default to other indebtedness and certain bankruptcy events.
Concurrently with the 2006 Credit Facility, we also entered into a $1.4 billion term loan (the ""Short TermLoan''), TRCLP entered into a $500 million term loan (the ""Bridge Loan'') and we issued $200 million oftrust preferred securities through GGP Capital Trust I. All of these arrangements are subject to customaryaÇrmative and negative covenants and events of default.
The interest rate on the Short Term Loan is the same as on the 2006 Credit Facility (currently LIBOR plus1.25%). An $800 million principal payment is due under the Short Term Loan on August 14, 2006, with thebalance due on December 31, 2006. We are required to apply the net proceeds of the reÑnancing of AlaMoana Center toward prepayment of the Short Term Loan.
The Bridge Loan bears interest at LIBOR plus 1.3% until May 24, 2006, and at LIBOR plus 1.55% thereafter,(assuming we maintain our election to have the loan designated as a Eurodollar loan) and is due August 24,2006. We intend to repay the Bridge Loan with proceeds obtained from the sale of bonds issued by TRCLP.
As mentioned above, GGP Capital Trust I, a Delaware statutory trust (the ""Trust'') and a wholly ownedsubsidiary of GGPLP, completed a private placement of $200 million of Öoating rate Preferred Securities. TheTrust also issued $6.2 million of Common Securities to GGPLP. The Trust used the proceeds from the sale ofthe Preferred and Common Securities to purchase $206.2 million of Öoating rate Junior Subordinated Notesof GGPLP due 2036. The Preferred Securities require distributions equal to LIBOR plus 1.45%. Distributionsare cumulative and accrue from the date of original issuance. The Preferred Securities mature on April 30,2036, but may be redeemed beginning on April 30, 2011 if we exercise our right to redeem a like amount ofthe Junior Subordinated Notes. The Junior Subordinated Notes bear interest at LIBOR plus 1.45%.
Unsecured Term Loans
In conjunction with the TRC Merger, we assumed certain publicly-traded unsecured debt. This debt totaled$1.5 billion at December 31, 2005 and $1.6 billion at December 31, 2004, bears interest at Ñxed rates rangingfrom 3.63% to 8.00% and matures at various dates from 2009 to 2013.
In conjunction with our acquisition of JP Realty in 2002, we assumed $100 million of ten-year seniorunsecured notes which bear interest at a Ñxed rate of 7.29% and were issued by PDC in March 1998. Thenotes require semi-annual interest payments. Annual principal payments of $25 million began in March 2005and continue until the loan is fully repaid in March 2008.
F-33
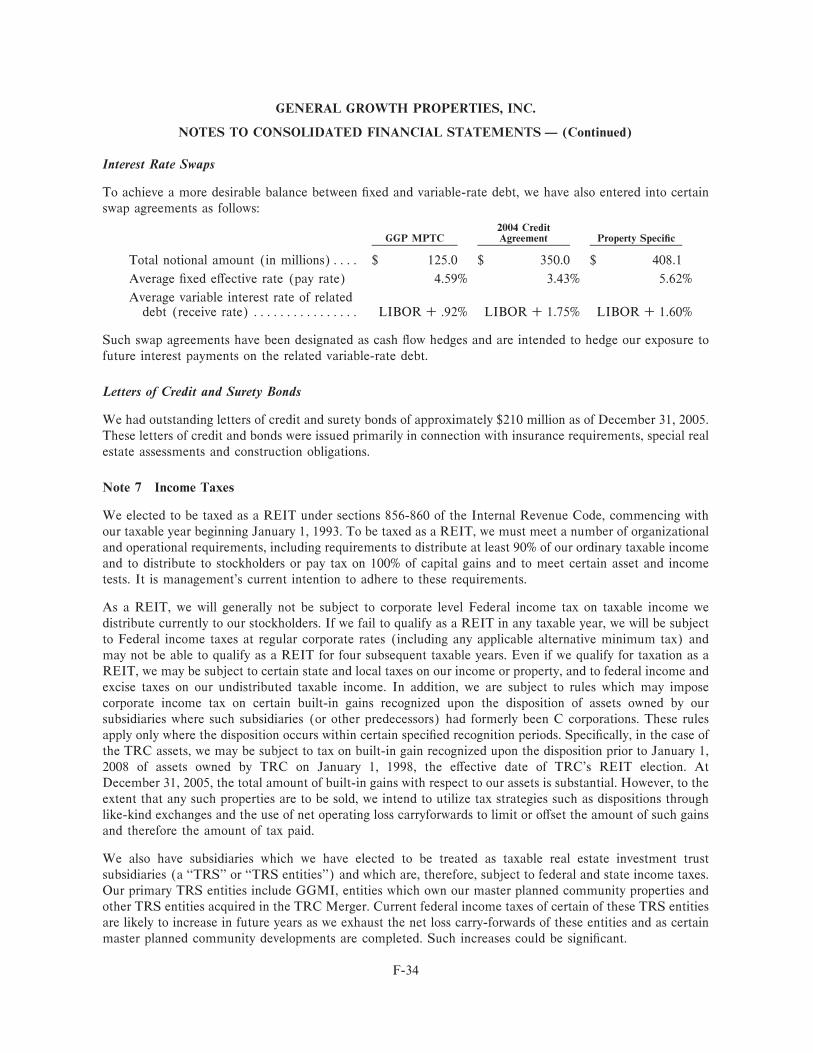
GENERAL GROWTH PROPERTIES, INC.
NOTES TO CONSOLIDATED FINANCIAL STATEMENTS Ì (Continued)
Interest Rate Swaps
To achieve a more desirable balance between Ñxed and variable-rate debt, we have also entered into certainswap agreements as follows:
2004 CreditGGP MPTC Agreement Property SpeciÑc
Total notional amount (in millions)ÏÏÏÏ $ 125.0 $ 350.0 $ 408.1
Average Ñxed eÅective rate (pay rate) 4.59% 3.43% 5.62%
Average variable interest rate of relateddebt (receive rate) ÏÏÏÏÏÏÏÏÏÏÏÏÏÏÏÏ LIBOR ° .92% LIBOR ° 1.75% LIBOR ° 1.60%
Such swap agreements have been designated as cash Öow hedges and are intended to hedge our exposure tofuture interest payments on the related variable-rate debt.
Letters of Credit and Surety Bonds
We had outstanding letters of credit and surety bonds of approximately $210 million as of December 31, 2005.These letters of credit and bonds were issued primarily in connection with insurance requirements, special realestate assessments and construction obligations.
Note 7 Income Taxes
We elected to be taxed as a REIT under sections 856-860 of the Internal Revenue Code, commencing withour taxable year beginning January 1, 1993. To be taxed as a REIT, we must meet a number of organizationaland operational requirements, including requirements to distribute at least 90% of our ordinary taxable incomeand to distribute to stockholders or pay tax on 100% of capital gains and to meet certain asset and incometests. It is management's current intention to adhere to these requirements.
As a REIT, we will generally not be subject to corporate level Federal income tax on taxable income wedistribute currently to our stockholders. If we fail to qualify as a REIT in any taxable year, we will be subjectto Federal income taxes at regular corporate rates (including any applicable alternative minimum tax) andmay not be able to qualify as a REIT for four subsequent taxable years. Even if we qualify for taxation as aREIT, we may be subject to certain state and local taxes on our income or property, and to federal income andexcise taxes on our undistributed taxable income. In addition, we are subject to rules which may imposecorporate income tax on certain built-in gains recognized upon the disposition of assets owned by oursubsidiaries where such subsidiaries (or other predecessors) had formerly been C corporations. These rulesapply only where the disposition occurs within certain speciÑed recognition periods. SpeciÑcally, in the case ofthe TRC assets, we may be subject to tax on built-in gain recognized upon the disposition prior to January 1,2008 of assets owned by TRC on January 1, 1998, the eÅective date of TRC's REIT election. AtDecember 31, 2005, the total amount of built-in gains with respect to our assets is substantial. However, to theextent that any such properties are to be sold, we intend to utilize tax strategies such as dispositions throughlike-kind exchanges and the use of net operating loss carryforwards to limit or oÅset the amount of such gainsand therefore the amount of tax paid.
We also have subsidiaries which we have elected to be treated as taxable real estate investment trustsubsidiaries (a ""TRS'' or ""TRS entities'') and which are, therefore, subject to federal and state income taxes.Our primary TRS entities include GGMI, entities which own our master planned community properties andother TRS entities acquired in the TRC Merger. Current federal income taxes of certain of these TRS entitiesare likely to increase in future years as we exhaust the net loss carry-forwards of these entities and as certainmaster planned community developments are completed. Such increases could be signiÑcant.
F-34
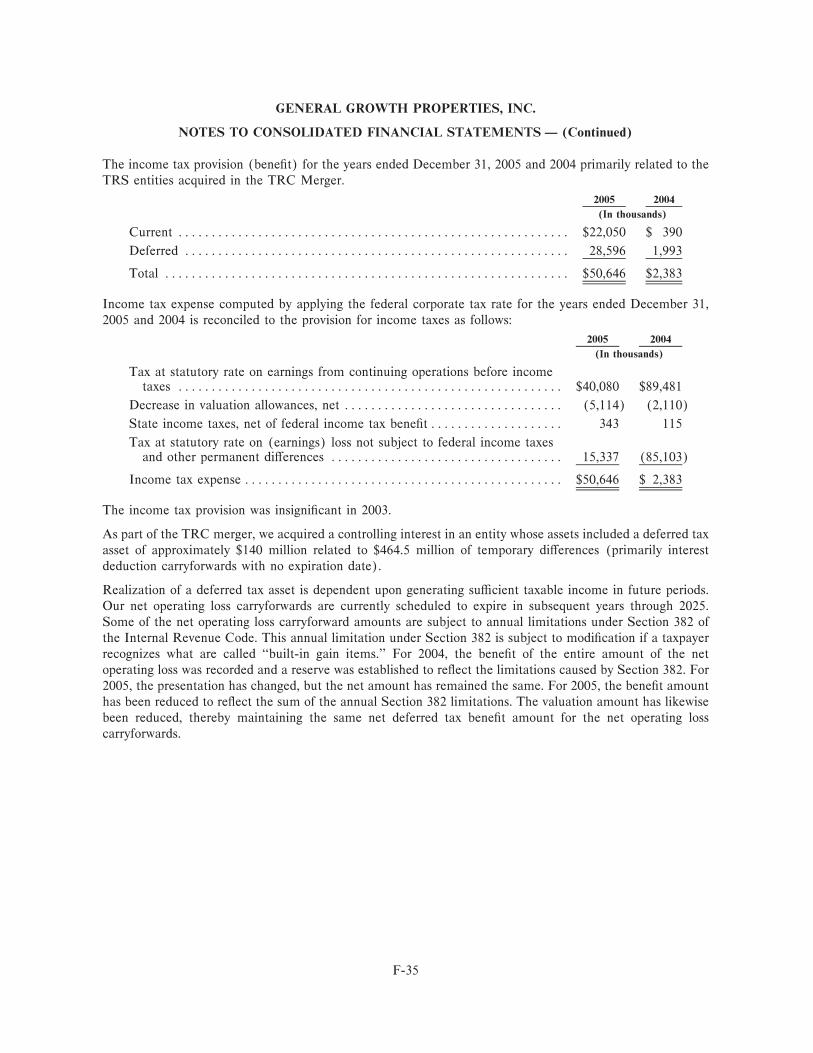
GENERAL GROWTH PROPERTIES, INC.
NOTES TO CONSOLIDATED FINANCIAL STATEMENTS Ì (Continued)
The income tax provision (beneÑt) for the years ended December 31, 2005 and 2004 primarily related to theTRS entities acquired in the TRC Merger.
2005 2004
(In thousands)
Current ÏÏÏÏÏÏÏÏÏÏÏÏÏÏÏÏÏÏÏÏÏÏÏÏÏÏÏÏÏÏÏÏÏÏÏÏÏÏÏÏÏÏÏÏÏÏÏÏÏÏÏÏÏÏÏÏÏÏÏ $22,050 $ 390
Deferred ÏÏÏÏÏÏÏÏÏÏÏÏÏÏÏÏÏÏÏÏÏÏÏÏÏÏÏÏÏÏÏÏÏÏÏÏÏÏÏÏÏÏÏÏÏÏÏÏÏÏÏÏÏÏÏÏÏÏ 28,596 1,993
Total ÏÏÏÏÏÏÏÏÏÏÏÏÏÏÏÏÏÏÏÏÏÏÏÏÏÏÏÏÏÏÏÏÏÏÏÏÏÏÏÏÏÏÏÏÏÏÏÏÏÏÏÏÏÏÏÏÏÏÏÏÏ $50,646 $2,383
Income tax expense computed by applying the federal corporate tax rate for the years ended December 31,2005 and 2004 is reconciled to the provision for income taxes as follows:
2005 2004
(In thousands)
Tax at statutory rate on earnings from continuing operations before incometaxes ÏÏÏÏÏÏÏÏÏÏÏÏÏÏÏÏÏÏÏÏÏÏÏÏÏÏÏÏÏÏÏÏÏÏÏÏÏÏÏÏÏÏÏÏÏÏÏÏÏÏÏÏÏÏÏÏÏÏ $40,080 $89,481
Decrease in valuation allowances, net ÏÏÏÏÏÏÏÏÏÏÏÏÏÏÏÏÏÏÏÏÏÏÏÏÏÏÏÏÏÏÏÏÏ (5,114) (2,110)
State income taxes, net of federal income tax beneÑt ÏÏÏÏÏÏÏÏÏÏÏÏÏÏÏÏÏÏÏÏ 343 115
Tax at statutory rate on (earnings) loss not subject to federal income taxesand other permanent diÅerences ÏÏÏÏÏÏÏÏÏÏÏÏÏÏÏÏÏÏÏÏÏÏÏÏÏÏÏÏÏÏÏÏÏÏÏ 15,337 (85,103)
Income tax expense ÏÏÏÏÏÏÏÏÏÏÏÏÏÏÏÏÏÏÏÏÏÏÏÏÏÏÏÏÏÏÏÏÏÏÏÏÏÏÏÏÏÏÏÏÏÏÏÏ $50,646 $ 2,383
The income tax provision was insigniÑcant in 2003.
As part of the TRC merger, we acquired a controlling interest in an entity whose assets included a deferred taxasset of approximately $140 million related to $464.5 million of temporary diÅerences (primarily interestdeduction carryforwards with no expiration date).
Realization of a deferred tax asset is dependent upon generating suÇcient taxable income in future periods.Our net operating loss carryforwards are currently scheduled to expire in subsequent years through 2025.Some of the net operating loss carryforward amounts are subject to annual limitations under Section 382 ofthe Internal Revenue Code. This annual limitation under Section 382 is subject to modiÑcation if a taxpayerrecognizes what are called ""built-in gain items.'' For 2004, the beneÑt of the entire amount of the netoperating loss was recorded and a reserve was established to reÖect the limitations caused by Section 382. For2005, the presentation has changed, but the net amount has remained the same. For 2005, the beneÑt amounthas been reduced to reÖect the sum of the annual Section 382 limitations. The valuation amount has likewisebeen reduced, thereby maintaining the same net deferred tax beneÑt amount for the net operating losscarryforwards.
F-35
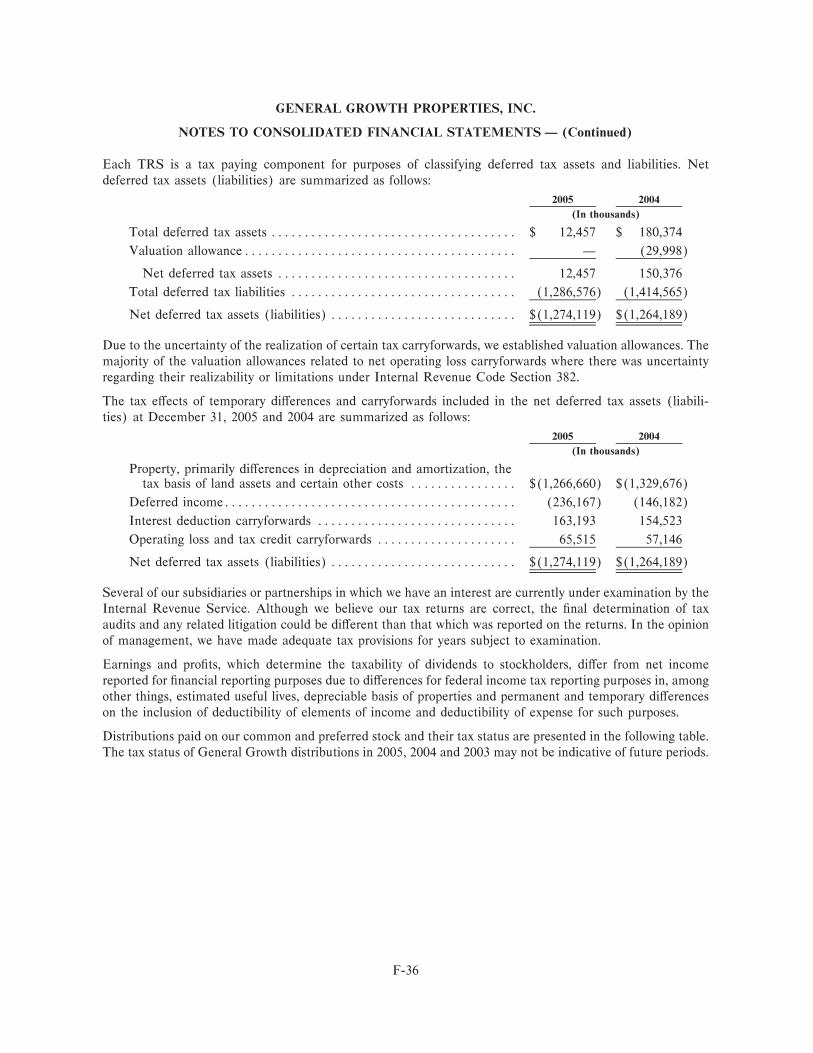
GENERAL GROWTH PROPERTIES, INC.
NOTES TO CONSOLIDATED FINANCIAL STATEMENTS Ì (Continued)
Each TRS is a tax paying component for purposes of classifying deferred tax assets and liabilities. Netdeferred tax assets (liabilities) are summarized as follows:
2005 2004
(In thousands)
Total deferred tax assets ÏÏÏÏÏÏÏÏÏÏÏÏÏÏÏÏÏÏÏÏÏÏÏÏÏÏÏÏÏÏÏÏÏÏÏÏÏ $ 12,457 $ 180,374
Valuation allowanceÏÏÏÏÏÏÏÏÏÏÏÏÏÏÏÏÏÏÏÏÏÏÏÏÏÏÏÏÏÏÏÏÏÏÏÏÏÏÏÏÏ Ì (29,998)
Net deferred tax assets ÏÏÏÏÏÏÏÏÏÏÏÏÏÏÏÏÏÏÏÏÏÏÏÏÏÏÏÏÏÏÏÏÏÏÏÏ 12,457 150,376
Total deferred tax liabilities ÏÏÏÏÏÏÏÏÏÏÏÏÏÏÏÏÏÏÏÏÏÏÏÏÏÏÏÏÏÏÏÏÏÏ (1,286,576) (1,414,565)
Net deferred tax assets (liabilities) ÏÏÏÏÏÏÏÏÏÏÏÏÏÏÏÏÏÏÏÏÏÏÏÏÏÏÏÏ $(1,274,119) $(1,264,189)
Due to the uncertainty of the realization of certain tax carryforwards, we established valuation allowances. Themajority of the valuation allowances related to net operating loss carryforwards where there was uncertaintyregarding their realizability or limitations under Internal Revenue Code Section 382.
The tax eÅects of temporary diÅerences and carryforwards included in the net deferred tax assets (liabili-ties) at December 31, 2005 and 2004 are summarized as follows:
2005 2004
(In thousands)
Property, primarily diÅerences in depreciation and amortization, thetax basis of land assets and certain other costs ÏÏÏÏÏÏÏÏÏÏÏÏÏÏÏÏ $(1,266,660) $(1,329,676)
Deferred incomeÏÏÏÏÏÏÏÏÏÏÏÏÏÏÏÏÏÏÏÏÏÏÏÏÏÏÏÏÏÏÏÏÏÏÏÏÏÏÏÏÏÏÏÏ (236,167) (146,182)
Interest deduction carryforwards ÏÏÏÏÏÏÏÏÏÏÏÏÏÏÏÏÏÏÏÏÏÏÏÏÏÏÏÏÏÏ 163,193 154,523
Operating loss and tax credit carryforwards ÏÏÏÏÏÏÏÏÏÏÏÏÏÏÏÏÏÏÏÏÏ 65,515 57,146
Net deferred tax assets (liabilities) ÏÏÏÏÏÏÏÏÏÏÏÏÏÏÏÏÏÏÏÏÏÏÏÏÏÏÏÏ $(1,274,119) $(1,264,189)
Several of our subsidiaries or partnerships in which we have an interest are currently under examination by theInternal Revenue Service. Although we believe our tax returns are correct, the Ñnal determination of taxaudits and any related litigation could be diÅerent than that which was reported on the returns. In the opinionof management, we have made adequate tax provisions for years subject to examination.
Earnings and proÑts, which determine the taxability of dividends to stockholders, diÅer from net incomereported for Ñnancial reporting purposes due to diÅerences for federal income tax reporting purposes in, amongother things, estimated useful lives, depreciable basis of properties and permanent and temporary diÅerenceson the inclusion of deductibility of elements of income and deductibility of expense for such purposes.
Distributions paid on our common and preferred stock and their tax status are presented in the following table.The tax status of General Growth distributions in 2005, 2004 and 2003 may not be indicative of future periods.
F-36
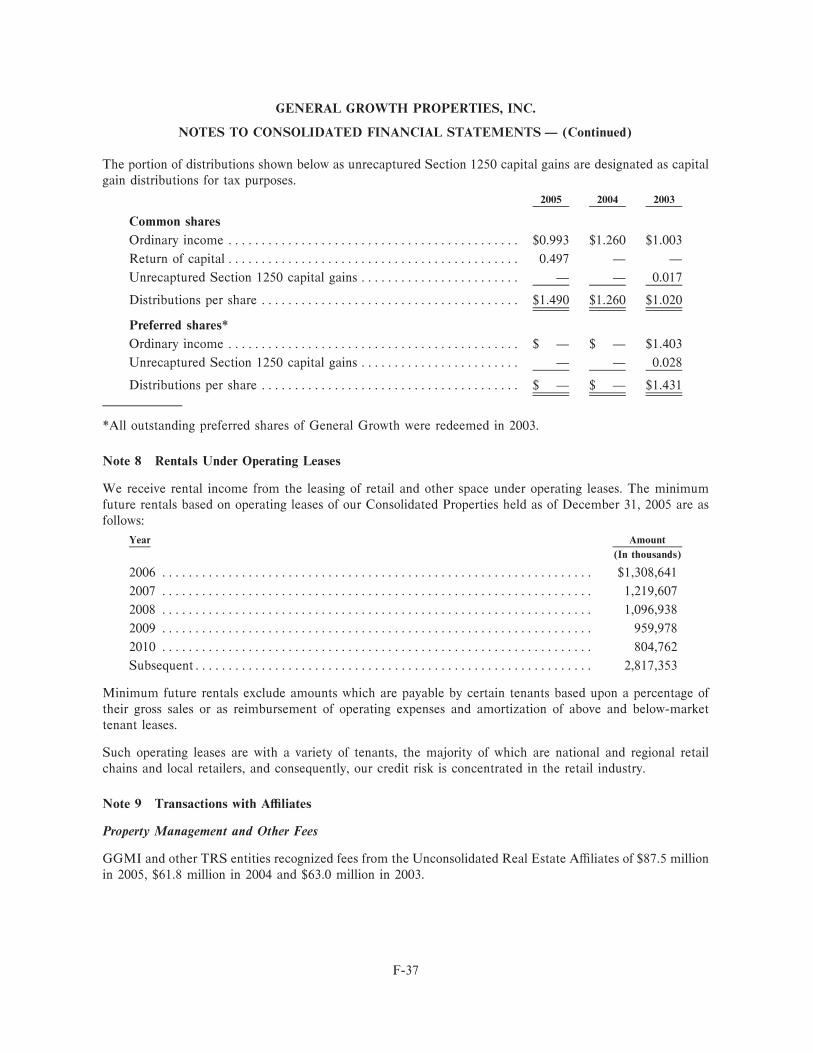
GENERAL GROWTH PROPERTIES, INC.
NOTES TO CONSOLIDATED FINANCIAL STATEMENTS Ì (Continued)
The portion of distributions shown below as unrecaptured Section 1250 capital gains are designated as capitalgain distributions for tax purposes.
2005 2004 2003
Common shares
Ordinary income ÏÏÏÏÏÏÏÏÏÏÏÏÏÏÏÏÏÏÏÏÏÏÏÏÏÏÏÏÏÏÏÏÏÏÏÏÏÏÏÏÏÏÏÏ $0.993 $1.260 $1.003
Return of capital ÏÏÏÏÏÏÏÏÏÏÏÏÏÏÏÏÏÏÏÏÏÏÏÏÏÏÏÏÏÏÏÏÏÏÏÏÏÏÏÏÏÏÏÏ 0.497 Ì Ì
Unrecaptured Section 1250 capital gains ÏÏÏÏÏÏÏÏÏÏÏÏÏÏÏÏÏÏÏÏÏÏÏÏ Ì Ì 0.017
Distributions per share ÏÏÏÏÏÏÏÏÏÏÏÏÏÏÏÏÏÏÏÏÏÏÏÏÏÏÏÏÏÏÏÏÏÏÏÏÏÏÏ $1.490 $1.260 $1.020
Preferred shares*
Ordinary income ÏÏÏÏÏÏÏÏÏÏÏÏÏÏÏÏÏÏÏÏÏÏÏÏÏÏÏÏÏÏÏÏÏÏÏÏÏÏÏÏÏÏÏÏ $ Ì $ Ì $1.403
Unrecaptured Section 1250 capital gains ÏÏÏÏÏÏÏÏÏÏÏÏÏÏÏÏÏÏÏÏÏÏÏÏ Ì Ì 0.028
Distributions per share ÏÏÏÏÏÏÏÏÏÏÏÏÏÏÏÏÏÏÏÏÏÏÏÏÏÏÏÏÏÏÏÏÏÏÏÏÏÏÏ $ Ì $ Ì $1.431
*All outstanding preferred shares of General Growth were redeemed in 2003.
Note 8 Rentals Under Operating Leases
We receive rental income from the leasing of retail and other space under operating leases. The minimumfuture rentals based on operating leases of our Consolidated Properties held as of December 31, 2005 are asfollows:
Year Amount
(In thousands)
2006 ÏÏÏÏÏÏÏÏÏÏÏÏÏÏÏÏÏÏÏÏÏÏÏÏÏÏÏÏÏÏÏÏÏÏÏÏÏÏÏÏÏÏÏÏÏÏÏÏÏÏÏÏÏÏÏÏÏÏÏÏÏÏÏÏÏ $1,308,641
2007 ÏÏÏÏÏÏÏÏÏÏÏÏÏÏÏÏÏÏÏÏÏÏÏÏÏÏÏÏÏÏÏÏÏÏÏÏÏÏÏÏÏÏÏÏÏÏÏÏÏÏÏÏÏÏÏÏÏÏÏÏÏÏÏÏÏ 1,219,607
2008 ÏÏÏÏÏÏÏÏÏÏÏÏÏÏÏÏÏÏÏÏÏÏÏÏÏÏÏÏÏÏÏÏÏÏÏÏÏÏÏÏÏÏÏÏÏÏÏÏÏÏÏÏÏÏÏÏÏÏÏÏÏÏÏÏÏ 1,096,938
2009 ÏÏÏÏÏÏÏÏÏÏÏÏÏÏÏÏÏÏÏÏÏÏÏÏÏÏÏÏÏÏÏÏÏÏÏÏÏÏÏÏÏÏÏÏÏÏÏÏÏÏÏÏÏÏÏÏÏÏÏÏÏÏÏÏÏ 959,978
2010 ÏÏÏÏÏÏÏÏÏÏÏÏÏÏÏÏÏÏÏÏÏÏÏÏÏÏÏÏÏÏÏÏÏÏÏÏÏÏÏÏÏÏÏÏÏÏÏÏÏÏÏÏÏÏÏÏÏÏÏÏÏÏÏÏÏ 804,762
SubsequentÏÏÏÏÏÏÏÏÏÏÏÏÏÏÏÏÏÏÏÏÏÏÏÏÏÏÏÏÏÏÏÏÏÏÏÏÏÏÏÏÏÏÏÏÏÏÏÏÏÏÏÏÏÏÏÏÏÏÏÏ 2,817,353
Minimum future rentals exclude amounts which are payable by certain tenants based upon a percentage oftheir gross sales or as reimbursement of operating expenses and amortization of above and below-markettenant leases.
Such operating leases are with a variety of tenants, the majority of which are national and regional retailchains and local retailers, and consequently, our credit risk is concentrated in the retail industry.
Note 9 Transactions with AÇliates
Property Management and Other Fees
GGMI and other TRS entities recognized fees from the Unconsolidated Real Estate AÇliates of $87.5 millionin 2005, $61.8 million in 2004 and $63.0 million in 2003.
F-37
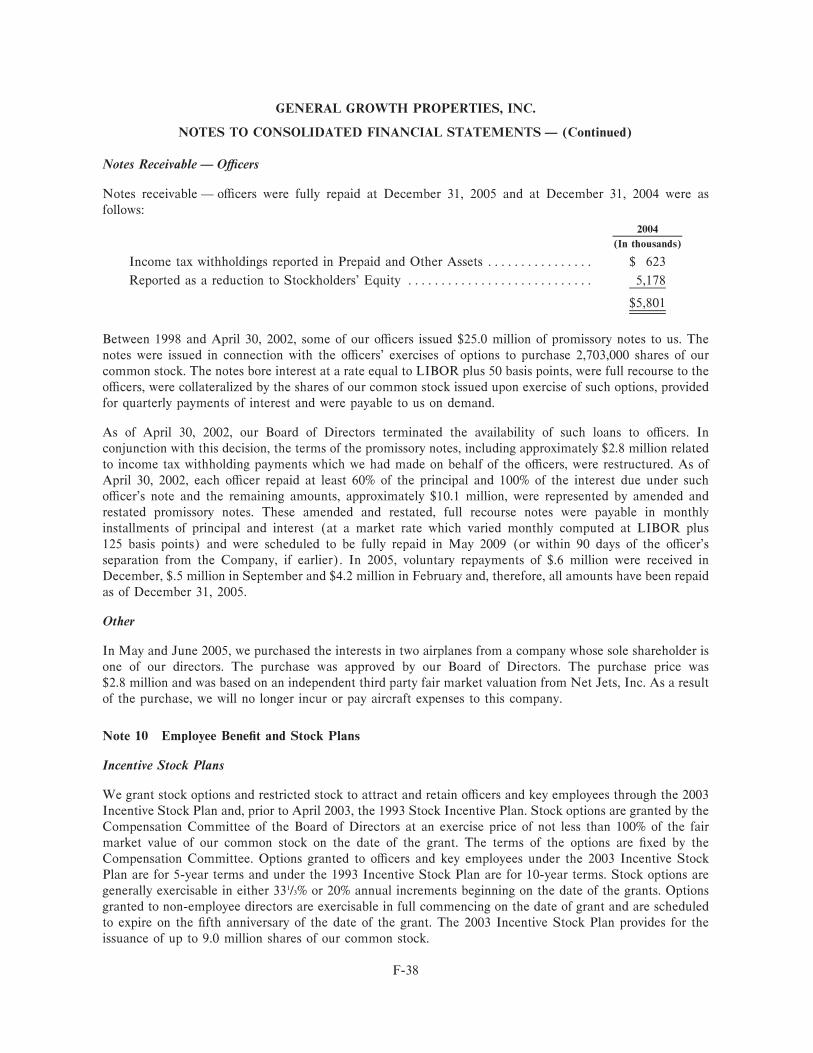
GENERAL GROWTH PROPERTIES, INC.
NOTES TO CONSOLIDATED FINANCIAL STATEMENTS Ì (Continued)
Notes Receivable Ì OÇcers
Notes receivable Ì oÇcers were fully repaid at December 31, 2005 and at December 31, 2004 were asfollows:
2004
(In thousands)
Income tax withholdings reported in Prepaid and Other Assets ÏÏÏÏÏÏÏÏÏÏÏÏÏÏÏÏ $ 623
Reported as a reduction to Stockholders' Equity ÏÏÏÏÏÏÏÏÏÏÏÏÏÏÏÏÏÏÏÏÏÏÏÏÏÏÏÏ 5,178
$5,801
Between 1998 and April 30, 2002, some of our oÇcers issued $25.0 million of promissory notes to us. Thenotes were issued in connection with the oÇcers' exercises of options to purchase 2,703,000 shares of ourcommon stock. The notes bore interest at a rate equal to LIBOR plus 50 basis points, were full recourse to theoÇcers, were collateralized by the shares of our common stock issued upon exercise of such options, providedfor quarterly payments of interest and were payable to us on demand.
As of April 30, 2002, our Board of Directors terminated the availability of such loans to oÇcers. Inconjunction with this decision, the terms of the promissory notes, including approximately $2.8 million relatedto income tax withholding payments which we had made on behalf of the oÇcers, were restructured. As ofApril 30, 2002, each oÇcer repaid at least 60% of the principal and 100% of the interest due under suchoÇcer's note and the remaining amounts, approximately $10.1 million, were represented by amended andrestated promissory notes. These amended and restated, full recourse notes were payable in monthlyinstallments of principal and interest (at a market rate which varied monthly computed at LIBOR plus125 basis points) and were scheduled to be fully repaid in May 2009 (or within 90 days of the oÇcer'sseparation from the Company, if earlier). In 2005, voluntary repayments of $.6 million were received inDecember, $.5 million in September and $4.2 million in February and, therefore, all amounts have been repaidas of December 31, 2005.
Other
In May and June 2005, we purchased the interests in two airplanes from a company whose sole shareholder isone of our directors. The purchase was approved by our Board of Directors. The purchase price was$2.8 million and was based on an independent third party fair market valuation from Net Jets, Inc. As a resultof the purchase, we will no longer incur or pay aircraft expenses to this company.
Note 10 Employee BeneÑt and Stock Plans
Incentive Stock Plans
We grant stock options and restricted stock to attract and retain oÇcers and key employees through the 2003Incentive Stock Plan and, prior to April 2003, the 1993 Stock Incentive Plan. Stock options are granted by theCompensation Committee of the Board of Directors at an exercise price of not less than 100% of the fairmarket value of our common stock on the date of the grant. The terms of the options are Ñxed by theCompensation Committee. Options granted to oÇcers and key employees under the 2003 Incentive StockPlan are for 5-year terms and under the 1993 Incentive Stock Plan are for 10-year terms. Stock options aregenerally exercisable in either 331/3% or 20% annual increments beginning on the date of the grants. Optionsgranted to non-employee directors are exercisable in full commencing on the date of grant and are scheduledto expire on the Ñfth anniversary of the date of the grant. The 2003 Incentive Stock Plan provides for theissuance of up to 9.0 million shares of our common stock.
F-38
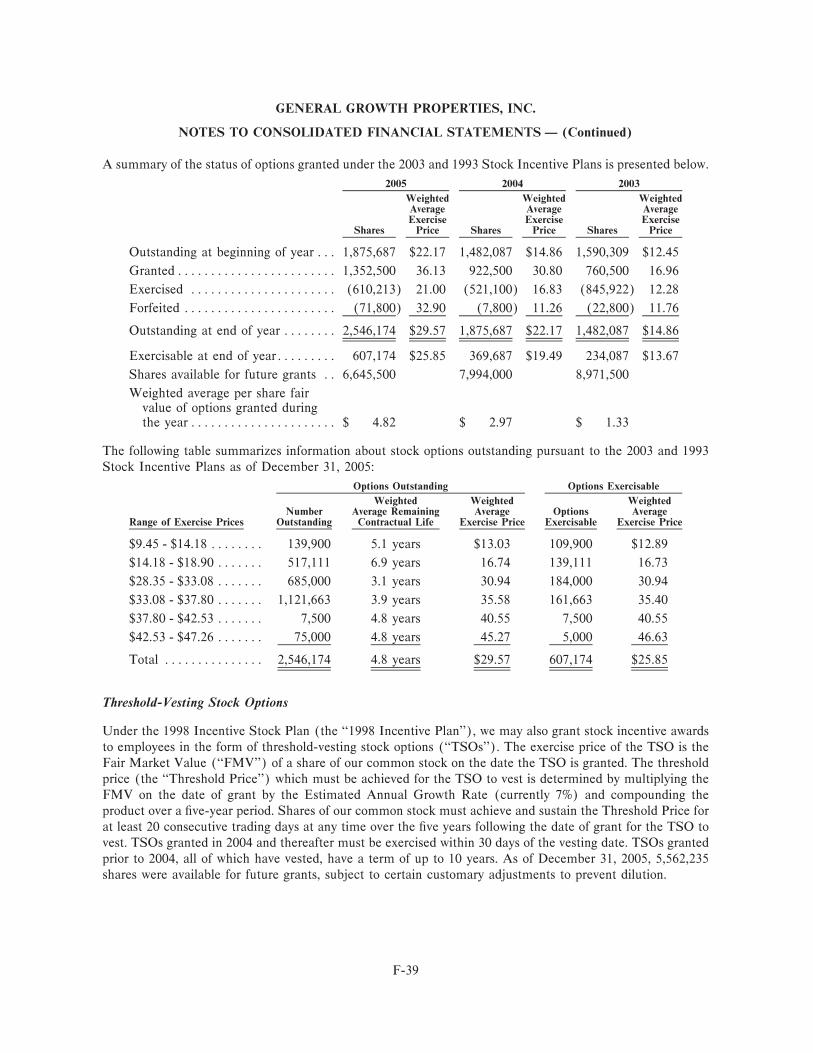
GENERAL GROWTH PROPERTIES, INC.
NOTES TO CONSOLIDATED FINANCIAL STATEMENTS Ì (Continued)
A summary of the status of options granted under the 2003 and 1993 Stock Incentive Plans is presented below.
2005 2004 2003
Weighted Weighted WeightedAverage Average AverageExercise Exercise Exercise
Shares Price Shares Price Shares Price
Outstanding at beginning of year ÏÏÏ 1,875,687 $22.17 1,482,087 $14.86 1,590,309 $12.45
GrantedÏÏÏÏÏÏÏÏÏÏÏÏÏÏÏÏÏÏÏÏÏÏÏÏ 1,352,500 36.13 922,500 30.80 760,500 16.96
Exercised ÏÏÏÏÏÏÏÏÏÏÏÏÏÏÏÏÏÏÏÏÏÏ (610,213) 21.00 (521,100) 16.83 (845,922) 12.28
Forfeited ÏÏÏÏÏÏÏÏÏÏÏÏÏÏÏÏÏÏÏÏÏÏÏ (71,800) 32.90 (7,800) 11.26 (22,800) 11.76
Outstanding at end of year ÏÏÏÏÏÏÏÏ 2,546,174 $29.57 1,875,687 $22.17 1,482,087 $14.86
Exercisable at end of yearÏÏÏÏÏÏÏÏÏ 607,174 $25.85 369,687 $19.49 234,087 $13.67
Shares available for future grants ÏÏ 6,645,500 7,994,000 8,971,500
Weighted average per share fairvalue of options granted duringthe year ÏÏÏÏÏÏÏÏÏÏÏÏÏÏÏÏÏÏÏÏÏÏ $ 4.82 $ 2.97 $ 1.33
The following table summarizes information about stock options outstanding pursuant to the 2003 and 1993Stock Incentive Plans as of December 31, 2005:
Options Outstanding Options Exercisable
Weighted Weighted WeightedNumber Average Remaining Average Options Average
Range of Exercise Prices Outstanding Contractual Life Exercise Price Exercisable Exercise Price
$9.45 - $14.18 ÏÏÏÏÏÏÏÏ 139,900 5.1 years $13.03 109,900 $12.89
$14.18 - $18.90 ÏÏÏÏÏÏÏ 517,111 6.9 years 16.74 139,111 16.73
$28.35 - $33.08 ÏÏÏÏÏÏÏ 685,000 3.1 years 30.94 184,000 30.94
$33.08 - $37.80 ÏÏÏÏÏÏÏ 1,121,663 3.9 years 35.58 161,663 35.40
$37.80 - $42.53 ÏÏÏÏÏÏÏ 7,500 4.8 years 40.55 7,500 40.55
$42.53 - $47.26 ÏÏÏÏÏÏÏ 75,000 4.8 years 45.27 5,000 46.63
Total ÏÏÏÏÏÏÏÏÏÏÏÏÏÏÏ 2,546,174 4.8 years $29.57 607,174 $25.85
Threshold-Vesting Stock Options
Under the 1998 Incentive Stock Plan (the ""1998 Incentive Plan''), we may also grant stock incentive awardsto employees in the form of threshold-vesting stock options (""TSOs''). The exercise price of the TSO is theFair Market Value (""FMV'') of a share of our common stock on the date the TSO is granted. The thresholdprice (the ""Threshold Price'') which must be achieved for the TSO to vest is determined by multiplying theFMV on the date of grant by the Estimated Annual Growth Rate (currently 7%) and compounding theproduct over a Ñve-year period. Shares of our common stock must achieve and sustain the Threshold Price forat least 20 consecutive trading days at any time over the Ñve years following the date of grant for the TSO tovest. TSOs granted in 2004 and thereafter must be exercised within 30 days of the vesting date. TSOs grantedprior to 2004, all of which have vested, have a term of up to 10 years. As of December 31, 2005, 5,562,235shares were available for future grants, subject to certain customary adjustments to prevent dilution.
F-39
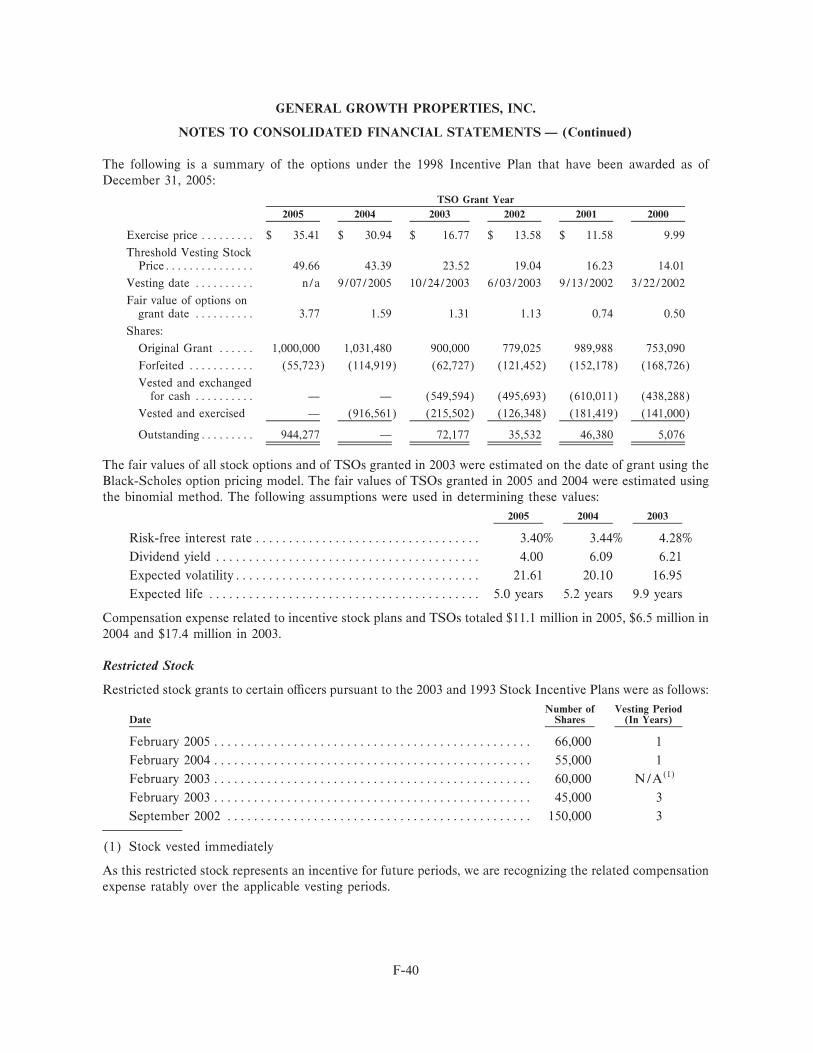
GENERAL GROWTH PROPERTIES, INC.
NOTES TO CONSOLIDATED FINANCIAL STATEMENTS Ì (Continued)
The following is a summary of the options under the 1998 Incentive Plan that have been awarded as ofDecember 31, 2005:
TSO Grant Year
2005 2004 2003 2002 2001 2000
Exercise price ÏÏÏÏÏÏÏÏÏ $ 35.41 $ 30.94 $ 16.77 $ 13.58 $ 11.58 9.99
Threshold Vesting StockPriceÏÏÏÏÏÏÏÏÏÏÏÏÏÏÏ 49.66 43.39 23.52 19.04 16.23 14.01
Vesting date ÏÏÏÏÏÏÏÏÏÏ n/a 9/07/2005 10/24/2003 6/03/2003 9/13/2002 3/22/2002
Fair value of options ongrant date ÏÏÏÏÏÏÏÏÏÏ 3.77 1.59 1.31 1.13 0.74 0.50
Shares:
Original Grant ÏÏÏÏÏÏ 1,000,000 1,031,480 900,000 779,025 989,988 753,090
Forfeited ÏÏÏÏÏÏÏÏÏÏÏ (55,723) (114,919) (62,727) (121,452) (152,178) (168,726)
Vested and exchangedfor cash ÏÏÏÏÏÏÏÏÏÏ Ì Ì (549,594) (495,693) (610,011) (438,288)
Vested and exercised Ì (916,561) (215,502) (126,348) (181,419) (141,000)
OutstandingÏÏÏÏÏÏÏÏÏ 944,277 Ì 72,177 35,532 46,380 5,076
The fair values of all stock options and of TSOs granted in 2003 were estimated on the date of grant using theBlack-Scholes option pricing model. The fair values of TSOs granted in 2005 and 2004 were estimated usingthe binomial method. The following assumptions were used in determining these values:
2005 2004 2003
Risk-free interest rate ÏÏÏÏÏÏÏÏÏÏÏÏÏÏÏÏÏÏÏÏÏÏÏÏÏÏÏÏÏÏÏÏÏÏ 3.40% 3.44% 4.28%
Dividend yield ÏÏÏÏÏÏÏÏÏÏÏÏÏÏÏÏÏÏÏÏÏÏÏÏÏÏÏÏÏÏÏÏÏÏÏÏÏÏÏÏ 4.00 6.09 6.21
Expected volatilityÏÏÏÏÏÏÏÏÏÏÏÏÏÏÏÏÏÏÏÏÏÏÏÏÏÏÏÏÏÏÏÏÏÏÏÏÏ 21.61 20.10 16.95
Expected life ÏÏÏÏÏÏÏÏÏÏÏÏÏÏÏÏÏÏÏÏÏÏÏÏÏÏÏÏÏÏÏÏÏÏÏÏÏÏÏÏÏ 5.0 years 5.2 years 9.9 years
Compensation expense related to incentive stock plans and TSOs totaled $11.1 million in 2005, $6.5 million in2004 and $17.4 million in 2003.
Restricted Stock
Restricted stock grants to certain oÇcers pursuant to the 2003 and 1993 Stock Incentive Plans were as follows:
Number of Vesting PeriodDate Shares (In Years)
February 2005 ÏÏÏÏÏÏÏÏÏÏÏÏÏÏÏÏÏÏÏÏÏÏÏÏÏÏÏÏÏÏÏÏÏÏÏÏÏÏÏÏÏÏÏÏÏÏÏÏ 66,000 1
February 2004 ÏÏÏÏÏÏÏÏÏÏÏÏÏÏÏÏÏÏÏÏÏÏÏÏÏÏÏÏÏÏÏÏÏÏÏÏÏÏÏÏÏÏÏÏÏÏÏÏ 55,000 1
February 2003 ÏÏÏÏÏÏÏÏÏÏÏÏÏÏÏÏÏÏÏÏÏÏÏÏÏÏÏÏÏÏÏÏÏÏÏÏÏÏÏÏÏÏÏÏÏÏÏÏ 60,000 N/A(1)
February 2003 ÏÏÏÏÏÏÏÏÏÏÏÏÏÏÏÏÏÏÏÏÏÏÏÏÏÏÏÏÏÏÏÏÏÏÏÏÏÏÏÏÏÏÏÏÏÏÏÏ 45,000 3
September 2002 ÏÏÏÏÏÏÏÏÏÏÏÏÏÏÏÏÏÏÏÏÏÏÏÏÏÏÏÏÏÏÏÏÏÏÏÏÏÏÏÏÏÏÏÏÏÏ 150,000 3
(1) Stock vested immediately
As this restricted stock represents an incentive for future periods, we are recognizing the related compensationexpense ratably over the applicable vesting periods.
F-40
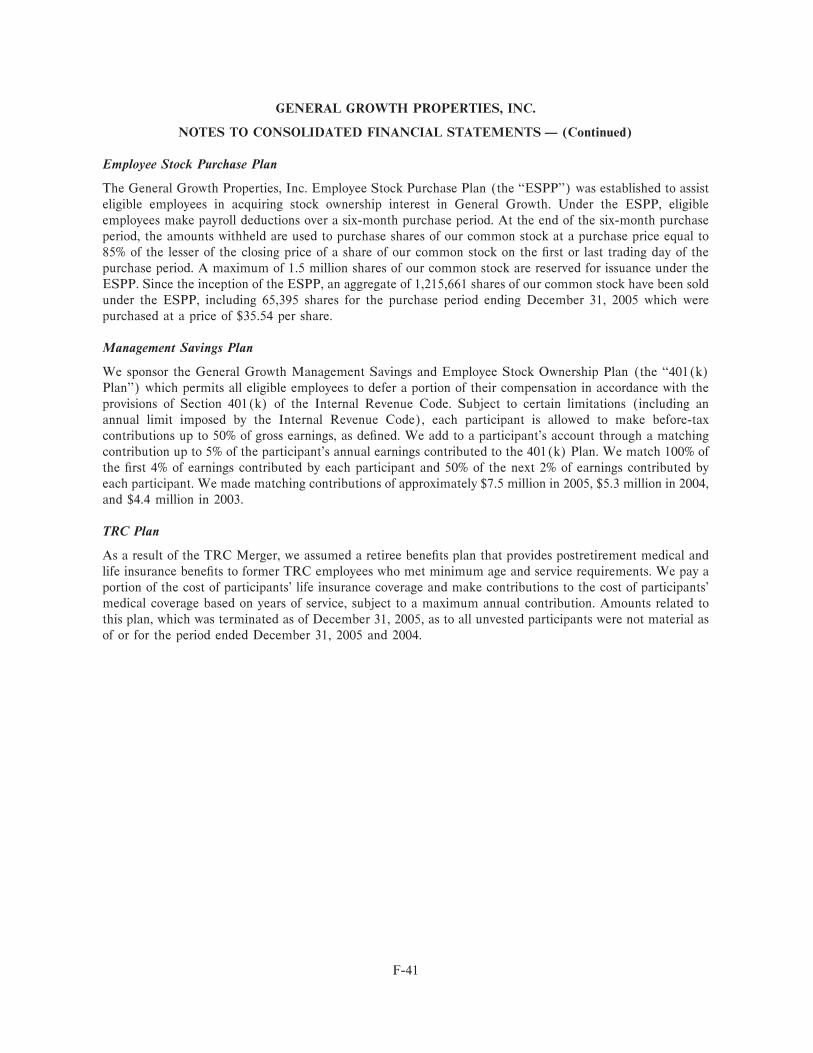
GENERAL GROWTH PROPERTIES, INC.
NOTES TO CONSOLIDATED FINANCIAL STATEMENTS Ì (Continued)
Employee Stock Purchase Plan
The General Growth Properties, Inc. Employee Stock Purchase Plan (the ""ESPP'') was established to assisteligible employees in acquiring stock ownership interest in General Growth. Under the ESPP, eligibleemployees make payroll deductions over a six-month purchase period. At the end of the six-month purchaseperiod, the amounts withheld are used to purchase shares of our common stock at a purchase price equal to85% of the lesser of the closing price of a share of our common stock on the Ñrst or last trading day of thepurchase period. A maximum of 1.5 million shares of our common stock are reserved for issuance under theESPP. Since the inception of the ESPP, an aggregate of 1,215,661 shares of our common stock have been soldunder the ESPP, including 65,395 shares for the purchase period ending December 31, 2005 which werepurchased at a price of $35.54 per share.
Management Savings Plan
We sponsor the General Growth Management Savings and Employee Stock Ownership Plan (the ""401(k)Plan'') which permits all eligible employees to defer a portion of their compensation in accordance with theprovisions of Section 401(k) of the Internal Revenue Code. Subject to certain limitations (including anannual limit imposed by the Internal Revenue Code), each participant is allowed to make before-taxcontributions up to 50% of gross earnings, as deÑned. We add to a participant's account through a matchingcontribution up to 5% of the participant's annual earnings contributed to the 401(k) Plan. We match 100% ofthe Ñrst 4% of earnings contributed by each participant and 50% of the next 2% of earnings contributed byeach participant. We made matching contributions of approximately $7.5 million in 2005, $5.3 million in 2004,and $4.4 million in 2003.
TRC Plan
As a result of the TRC Merger, we assumed a retiree beneÑts plan that provides postretirement medical andlife insurance beneÑts to former TRC employees who met minimum age and service requirements. We pay aportion of the cost of participants' life insurance coverage and make contributions to the cost of participants'medical coverage based on years of service, subject to a maximum annual contribution. Amounts related tothis plan, which was terminated as of December 31, 2005, as to all unvested participants were not material asof or for the period ended December 31, 2005 and 2004.
F-41
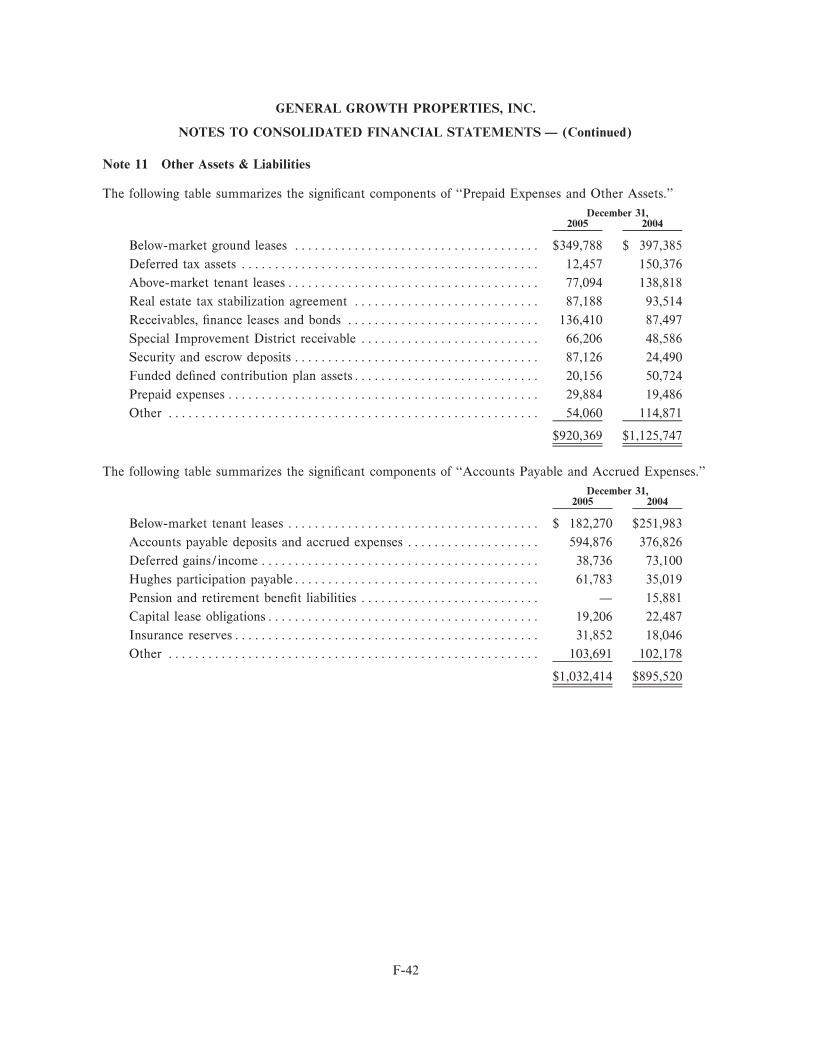
GENERAL GROWTH PROPERTIES, INC.
NOTES TO CONSOLIDATED FINANCIAL STATEMENTS Ì (Continued)
Note 11 Other Assets & Liabilities
The following table summarizes the signiÑcant components of ""Prepaid Expenses and Other Assets.''
December 31,2005 2004
Below-market ground leases ÏÏÏÏÏÏÏÏÏÏÏÏÏÏÏÏÏÏÏÏÏÏÏÏÏÏÏÏÏÏÏÏÏÏÏÏÏ $349,788 $ 397,385
Deferred tax assets ÏÏÏÏÏÏÏÏÏÏÏÏÏÏÏÏÏÏÏÏÏÏÏÏÏÏÏÏÏÏÏÏÏÏÏÏÏÏÏÏÏÏÏÏÏ 12,457 150,376
Above-market tenant leasesÏÏÏÏÏÏÏÏÏÏÏÏÏÏÏÏÏÏÏÏÏÏÏÏÏÏÏÏÏÏÏÏÏÏÏÏÏÏ 77,094 138,818
Real estate tax stabilization agreement ÏÏÏÏÏÏÏÏÏÏÏÏÏÏÏÏÏÏÏÏÏÏÏÏÏÏÏÏ 87,188 93,514
Receivables, Ñnance leases and bonds ÏÏÏÏÏÏÏÏÏÏÏÏÏÏÏÏÏÏÏÏÏÏÏÏÏÏÏÏÏ 136,410 87,497
Special Improvement District receivable ÏÏÏÏÏÏÏÏÏÏÏÏÏÏÏÏÏÏÏÏÏÏÏÏÏÏÏ 66,206 48,586
Security and escrow deposits ÏÏÏÏÏÏÏÏÏÏÏÏÏÏÏÏÏÏÏÏÏÏÏÏÏÏÏÏÏÏÏÏÏÏÏÏÏ 87,126 24,490
Funded deÑned contribution plan assetsÏÏÏÏÏÏÏÏÏÏÏÏÏÏÏÏÏÏÏÏÏÏÏÏÏÏÏÏ 20,156 50,724
Prepaid expenses ÏÏÏÏÏÏÏÏÏÏÏÏÏÏÏÏÏÏÏÏÏÏÏÏÏÏÏÏÏÏÏÏÏÏÏÏÏÏÏÏÏÏÏÏÏÏÏ 29,884 19,486
Other ÏÏÏÏÏÏÏÏÏÏÏÏÏÏÏÏÏÏÏÏÏÏÏÏÏÏÏÏÏÏÏÏÏÏÏÏÏÏÏÏÏÏÏÏÏÏÏÏÏÏÏÏÏÏÏÏ 54,060 114,871
$920,369 $1,125,747
The following table summarizes the signiÑcant components of ""Accounts Payable and Accrued Expenses.''
December 31,2005 2004
Below-market tenant leases ÏÏÏÏÏÏÏÏÏÏÏÏÏÏÏÏÏÏÏÏÏÏÏÏÏÏÏÏÏÏÏÏÏÏÏÏÏÏ $ 182,270 $251,983
Accounts payable deposits and accrued expenses ÏÏÏÏÏÏÏÏÏÏÏÏÏÏÏÏÏÏÏÏ 594,876 376,826
Deferred gains/income ÏÏÏÏÏÏÏÏÏÏÏÏÏÏÏÏÏÏÏÏÏÏÏÏÏÏÏÏÏÏÏÏÏÏÏÏÏÏÏÏÏÏ 38,736 73,100
Hughes participation payableÏÏÏÏÏÏÏÏÏÏÏÏÏÏÏÏÏÏÏÏÏÏÏÏÏÏÏÏÏÏÏÏÏÏÏÏÏ 61,783 35,019
Pension and retirement beneÑt liabilities ÏÏÏÏÏÏÏÏÏÏÏÏÏÏÏÏÏÏÏÏÏÏÏÏÏÏÏ Ì 15,881
Capital lease obligationsÏÏÏÏÏÏÏÏÏÏÏÏÏÏÏÏÏÏÏÏÏÏÏÏÏÏÏÏÏÏÏÏÏÏÏÏÏÏÏÏÏ 19,206 22,487
Insurance reservesÏÏÏÏÏÏÏÏÏÏÏÏÏÏÏÏÏÏÏÏÏÏÏÏÏÏÏÏÏÏÏÏÏÏÏÏÏÏÏÏÏÏÏÏÏÏ 31,852 18,046
Other ÏÏÏÏÏÏÏÏÏÏÏÏÏÏÏÏÏÏÏÏÏÏÏÏÏÏÏÏÏÏÏÏÏÏÏÏÏÏÏÏÏÏÏÏÏÏÏÏÏÏÏÏÏÏÏÏ 103,691 102,178
$1,032,414 $895,520
F-42
GENERAL GROWTH PROPERTIES, INC.
NOTES TO CONSOLIDATED FINANCIAL STATEMENTS Ì (Continued)
Note 12 Minority Interests
Common
Changes in outstanding Operating Partnership Common Units for the three years ended December 31, 2005are as follows:
December 31, 2002 ÏÏÏÏÏÏÏÏÏÏÏÏÏÏÏÏÏÏÏÏÏÏÏÏÏÏÏÏÏÏÏÏÏÏÏÏÏÏÏÏÏÏÏÏÏÏÏÏÏÏÏÏÏÏ 58,668,741
Exchanges for General Growth common stock ÏÏÏÏÏÏÏÏÏÏÏÏÏÏÏÏÏÏÏÏÏÏÏÏÏÏÏÏÏ (2,956,491)
December 31, 2003 ÏÏÏÏÏÏÏÏÏÏÏÏÏÏÏÏÏÏÏÏÏÏÏÏÏÏÏÏÏÏÏÏÏÏÏÏÏÏÏÏÏÏÏÏÏÏÏÏÏÏÏÏÏÏ 55,712,250
Exchanges for General Growth common stock ÏÏÏÏÏÏÏÏÏÏÏÏÏÏÏÏÏÏÏÏÏÏÏÏÏÏÏÏÏ (179,987)
December 31, 2004 ÏÏÏÏÏÏÏÏÏÏÏÏÏÏÏÏÏÏÏÏÏÏÏÏÏÏÏÏÏÏÏÏÏÏÏÏÏÏÏÏÏÏÏÏÏÏÏÏÏÏÏÏÏÏ 55,532,263
Conversion of Preferred Units into Common UnitsÏÏÏÏÏÏÏÏÏÏÏÏÏÏÏÏÏÏÏÏÏÏÏÏÏÏ 729,890
Exchanges for General Growth common stock ÏÏÏÏÏÏÏÏÏÏÏÏÏÏÏÏÏÏÏÏÏÏÏÏÏÏÏÏÏ (3,200,258)
December 31, 2005 ÏÏÏÏÏÏÏÏÏÏÏÏÏÏÏÏÏÏÏÏÏÏÏÏÏÏÏÏÏÏÏÏÏÏÏÏÏÏÏÏÏÏÏÏÏÏÏÏÏÏÏÏÏÏ 53,061,895
Under certain circumstances, the Common Units can be redeemed at the option of the holders for cash or, atour election, for shares of General Growth common stock on a one-for-one basis. The holders of the CommonUnits also share equally with our common stockholders on a per share basis in any distributions by theOperating Partnership on the basis that one Common Unit is equivalent to one share of General Growthcommon stock.
Also included in minority interests-common is minority interest in consolidated joint ventures of approxi-mately $13.6 million as of December 31, 2005 and $66.6 million as of December 31, 2004.
F-43
GENERAL GROWTH PROPERTIES, INC.
NOTES TO CONSOLIDATED FINANCIAL STATEMENTS Ì (Continued)
Preferred
Components of minority interest Ì preferred as of December 31, 2005 and 2004 are as follows:
Numberof Units
as of Per UnitCarrying AmountCoupon Issuing December Liquidation
Security Type Rate Entity 31, 2005 Preference 2005 2004
(In thousands)
Perpetual Preferred Units
Redeemable Preferred Units(""RPUs'')ÏÏÏÏÏÏÏÏÏÏÏÏÏÏÏÏÏÏÏÏÏÏ 8.95% LLC 240,000 $ 250 $ 60,000 $235,000(1)
Cumulative Preferred Units(""CPUs'')ÏÏÏÏÏÏÏÏÏÏÏÏÏÏÏÏÏÏÏÏÏÏ 8.25% LLC 20,000 250 5,000 5,000
Price Development Company(""PDC'') Series C ÏÏÏÏÏÏÏÏÏÏÏÏÏÏ 8.75% PDC Ì 25 Ì 8,000
65,000 248,000
Convertible Preferred Units
Series BÌJP Realty ÏÏÏÏÏÏÏÏÏÏÏÏÏÏÏ 8.50% GGPLP 1,362,571 50 68,129 70,975
Series CÌGlendale Galleria ÏÏÏÏÏÏÏÏ 7.00% GGPLP 413,676 50 20,685 32,176
Series DÌFoothills Mall ÏÏÏÏÏÏÏÏÏÏÏ 6.50% GGPLP 532,750 50 26,637 26,637
Series EÌFour Seasons Town Centre 7.00% GGPLP 502,658 50 25,132 25,132
140,583 154,920
Other preferred stock of consolidatedsubsidiaries ÏÏÏÏÏÏÏÏÏÏÏÏÏÏÏÏÏÏÏÏÏ N/A various 361 1,000 361 241
Total Minority Interest-PreferredÏÏÏÏÏ $205,944 $403,161
(1) Includes $175 million which was redeemed in May 2005 as permitted under the terms of the applicableRPUs.
Holders of the RPUs and CPUs are entitled to receive cumulative preferential cash distributions prior to anydistributions by the LLC to the Operating Partnership. Subject to certain limitations, the RPUs may beredeemed in cash by the LLC in April 2007 for the liquidation preference amount plus accrued and unpaiddistributions and may be exchanged by the holders of the RPUs for an equivalent amount of redeemablepreferred stock of General Growth. Such preferred stock provides for an equivalent 8.95% annual preferreddistribution and is redeemable at our option for cash equal to the liquidation preference amount plus accruedand unpaid distributions.
The Convertible Preferred Units are convertible, with certain restrictions, at any time by the holder intoCommon Units of the Operating Partnership at the following rates:
Number of CommonUnits for eachPreferred Unit
Series B Ì JP Realty ÏÏÏÏÏÏÏÏÏÏÏÏÏÏÏÏÏÏÏÏÏÏÏÏÏÏÏÏÏÏÏÏÏÏÏÏÏÏÏÏÏÏÏÏÏÏÏ 3.000
Series C Ì Glendale Galleria ÏÏÏÏÏÏÏÏÏÏÏÏÏÏÏÏÏÏÏÏÏÏÏÏÏÏÏÏÏÏÏÏÏÏÏÏÏÏÏÏ 2.433
Series D Ì Foothills Mall ÏÏÏÏÏÏÏÏÏÏÏÏÏÏÏÏÏÏÏÏÏÏÏÏÏÏÏÏÏÏÏÏÏÏÏÏÏÏÏÏÏÏÏ 1.508
Series E Ì Four Seasons Town Center ÏÏÏÏÏÏÏÏÏÏÏÏÏÏÏÏÏÏÏÏÏÏÏÏÏÏÏÏÏÏÏÏ 1.298
F-44
GENERAL GROWTH PROPERTIES, INC.
NOTES TO CONSOLIDATED FINANCIAL STATEMENTS Ì (Continued)
Note 13 Accumulated Other Comprehensive Income (Loss)
Components of accumulated other comprehensive income (loss) as of December 31, 2005 and 2004 are asfollows:
2005 2004
(In thousands)
Net unrealized gains (losses) on Ñnancial instruments ÏÏÏÏÏÏÏÏÏÏÏÏÏÏÏÏÏÏÏ $ 4,702 $(4,852)
Minimum pension liability adjustment ÏÏÏÏÏÏÏÏÏÏÏÏÏÏÏÏÏÏÏÏÏÏÏÏÏÏÏÏÏÏÏÏ (703) (329)
Foreign currency translation ÏÏÏÏÏÏÏÏÏÏÏÏÏÏÏÏÏÏÏÏÏÏÏÏÏÏÏÏÏÏÏÏÏÏÏÏÏÏÏÏÏ 6,510 1,590
Unrealized losses on available-for-sale securities ÏÏÏÏÏÏÏÏÏÏÏÏÏÏÏÏÏÏÏÏÏÏÏÏ (55) (94)
$10,454 $(3,685)
Note 14 Commitments and Contingencies
In the normal course of business, from time to time, we are involved in legal actions relating to the ownershipand operations of our properties. In management's opinion, the liabilities, if any, that may ultimately resultfrom such legal actions are not expected to have a material adverse eÅect on our consolidated Ñnancialposition, results of operations or liquidity.
We lease land or buildings at certain properties from third parties. The leases generally provide us with a rightof Ñrst refusal in the event of a proposed sale of the property by the landlord. All of our ground leases areclassiÑed as operating leases. Accordingly, rental payments are expensed as incurred and have, to the extentapplicable, been straight-lined over the term of the lease. Rental expense, including participation rent andexcluding amortization of above and below-market ground leases, was $10.5 million in 2005, $3.6 million in2004 and $2.5 million in 2003.
We periodically enter into contingent agreements for the acquisition of properties. Each acquisition is subjectto satisfactory completion of due diligence and, in the case of property acquired under development,completion of the project.
TRC acquired various assets, including Summerlin, a master planned community in suburban Las Vegas,Nevada, in the acquisition of The Hughes Corporation (""Hughes'') in 1996. In connection with theacquisition of Hughes, TRC entered into a Contingent Stock Agreement (""CSA'') for the beneÑt of theformer Hughes owners or their successors (""beneÑciaries''). Under the terms of the CSA, shares of TRCcommon stock are issuable to the beneÑciaries based on the appraised values of deÑned asset groups, includingSummerlin, at speciÑed termination dates through 2009 and/or cash Öows from the development and/or saleof those assets prior to the termination dates.
We assumed TRC's obligation under the CSA to deliver shares of General Growth common stock twice a yearto beneÑciaries under the CSA and certain indemniÑcation obligations. The amount of shares is based upon aformula set forth in the CSA and upon our stock price. Such issuances could be dilutive to our existingstockholders if the delivery obligation is satisÑed by the issuance of shares, new or treasury, rather than fromshares purchased on the open market. We account for the beneÑciaries' share of earnings from the assets as anoperating expense. We will account for any distributions to the beneÑciaries in 2009, which are likely to besigniÑcant, in connection with a valuation related to assets that we own as of such termination date asadditional investments in the related assets (that is, contingent consideration). A total of 1,552,385 shares ofour common stock were issued in 2005 pursuant to the CSA. At December 31, 2005, 755,642 shares ofcommon stock were issuable to the beneÑciaries, representing their share of cash Öows for the semi-annualperiod ending December 31, 2005.
F-45
GENERAL GROWTH PROPERTIES, INC.
NOTES TO CONSOLIDATED FINANCIAL STATEMENTS Ì (Continued)
Two of our operating retail properties (Oakwood Center in Gretna, Louisiana and Riverwalk, located near theconvention center in downtown New Orleans) were closed in September 2005, when a hurricane struck thearea. Although property damage in the New Orleans area was generally due to hurricane eÅects, the damageto Oakwood Center and Riverwalk was from arson and vandalism. Riverwalk partially re-opened onNovember 21, 2005 at a substantially reduced occupancy level. The Sears store at Oakwood Center isoperating at a reduced level. Two other anchor stores at Oakwood Center are expected to re-open in 2006 andfollowing repair and restoration, the remainder of the property is expected to open on or before Fall 2007. Wehave comprehensive insurance coverage for both property damage and business interruption. The restorationeÅort at the properties is expected to include replacing portions of the building, landscaping and furnishings.The net book value of the property damage is currently estimated to be approximately $53 million; however,we are still assessing the damage estimates and the actual net book value write-oÅ could vary from thisestimate. Changes to these estimates will be recorded in the periods in which they are determined. As ofDecember 31, 2005, we have recorded a net Ñxed asset write-oÅ and a corresponding insurance claim recoveryreceivable for this net book value amount because we believe that it is probable that the insurance recovery,net of deductibles on a replacement cost basis, will exceed these amounts. While we expect the insuranceproceeds will be suÇcient to cover most of the replacement cost of the restoration of the properties and certainbusiness interruption amounts, certain deductibles, limitations and exclusions are expected to apply withrespect to both current and future matters. No determination has been made as to the total amount or timingof those insurance payments. As of December 31, 2005, $5 million in insurance proceeds related to theOakwood property has been received, which has been oÅset against this insurance recovery receivable. InJanuary 2006, we received an additional $5 million in insurance proceeds with respect to Oakwood and$2.5 million in insurance proceeds related to Riverwalk. As only a portion of the repairs have taken place as ofDecember 31, 2005, substantially all of the remaining $63.4 million receivable recorded represents therecovery of the net book value of Ñxed assets written oÅ. The cost recoveries have been recorded on theexpense line item to which they relate, and therefore there is no signiÑcant impact to any line item or ouroverall results. However, included in property operating expenses in 2005 are approximately $1 million of costswhich, when fully expended, are not expected to be recoverable from insurance proceeds due to insurancepolicy deductibles.
The following table summarizes the contractual maturities of our long-term and retained debt and commit-ments under ground leases as of December 31, 2005. Both long-term debt and ground leases include therelated purchase accounting fair value adjustments:
2006 2007 2008 2009 2010 Subsequent Total
(In thousands)
Long-term debt-principalÏÏ $1,905,410 $2,407,092 $3,798,168 $5,086,955 $3,555,162 $3,666,088 $20,418,875
Retained debt-principal ÏÏÏ 50,928 88,365 2,367 2,524 120,019 38,516 302,719
Ground lease payments ÏÏÏ 15,327 15,451 15,474 15,497 15,506 650,523 727,778
Total ÏÏÏÏÏÏÏÏÏÏÏÏÏÏÏÏÏÏ $1,971,665 $2,510,908 $3,816,009 $5,104,976 $3,690,687 $4,355,127 $21,449,372
Note 15 Recently Issued Accounting Pronouncements
In October 2005, the FASB Issued StaÅ Position No. FAS 13-1, ""Accounting for Rental Costs Incurredduring a Construction Period'' (""FSP 13-1''). This FSP requires that rental costs associated with ground orbuilding operating leases incurred during a construction period be recognized as rental expense. However, FSP13-1 does not address lessees that account for the sale or rental of real estate projects under FASB StatementNo. 67, ""Accounting for Costs and Initial Rental Operations of Real Estate Projects.'' As we generally ownrather than lease property upon which we construct new real estate ventures and our policy would be tocapitalize rental costs associated with ground leases incurred during construction periods under StatementNo. 67, FSP 13-1 will not have a material eÅect on our results of operations when it becomes eÅective in 2006.
F-46
GENERAL GROWTH PROPERTIES, INC.
NOTES TO CONSOLIDATED FINANCIAL STATEMENTS Ì (Continued)
In June 2005, the Emerging Issues Task Force (""EITF'') reached a consensus on EITF 04-05, ""Investor'sAccounting for an Investment in a Limited Partnership When the Investor Is the Sole General Partner andthe Limited Partners Have Certain Rights'' (""EITF 04-05'') which provides guidance on when a sole generalpartner should consolidate a limited partnership. A sole general partner in a limited partnership is presumed tocontrol that limited partnership and therefore should include the limited partnership in its consolidatedÑnancial statements, regardless of the sole general partner's ownership interest in the limited partnership. Thecontrol presumption may be overcome if the limited partners have the ability to remove the sole generalpartner or otherwise dissolve the limited partnership. Other substantive participating rights by the limitedpartners may also overcome the control presumption. This consensus is eÅective for general partners of allnewly formed limited partnerships and existing limited partnerships for which the partnership agreements aremodiÑed. For general partners in all other limited partnerships, this consensus is eÅective no later than thebeginning of the Ñrst reporting period in Ñscal years beginning after December 15, 2005. We do not expectEITF 04-05 to have a signiÑcant impact on our Ñnancial statements.
In May 2005, the FASB issued Statement of Financial Accounting Standards (""SFAS'') No. 154,""Accounting Changes and Error Corrections Ì A Replacement of APB Opinion No. 20 and FASBStatement No. 3'' (""SFAS 154''). Among other changes, SFAS 154 requires that a voluntary change inaccounting principle be applied retrospectively with all prior period Ñnancial statements presented on the newaccounting principle, unless it is impracticable to do so. SFAS 154 also provides that:
‚ A change in method of depreciating or amortizing a long-lived nonÑnancial asset be accounted for as achange in estimate (prospectively) that was eÅected by a change in accounting principle, and
‚ Correction of errors in previously issued Ñnancial statements should be termed a ""restatement.''
SFAS 154 is eÅective for accounting changes and correction of errors made in Ñscal years beginning afterDecember 15, 2005. Early adoption of this standard is permitted for accounting changes and correction oferrors made in Ñscal years beginning after June 1, 2005.
In March 2005, the FASB issued FASB Interpretation No. 47 (""FIN 47'') ""Accounting for ConditionalAsset Retirement Obligations, an interpretation of SFAS No. 143'' which clariÑes that a liability for theperformance of an asset retirement activity should be recorded if the obligation to perform such activity isunconditional, whether or not the timing or method of settlement may be conditional on a future event.FIN 47 is eÅective no later than the end of Ñscal years ending after December 15, 2005, and therefore, isapplicable to our December 31, 2005 consolidated Ñnancial statements. Under previous guidance, it wasgenerally accepted that if the enterprise had no current plans or present obligation to perform such assetretirement activity, the liability could not reasonably be estimated and only a disclosure obligation, if material,was present. Although we may have an ultimate legal obligation to remediate any asbestos contained in any ofour investment properties, either in the course of future remodeling, demolition or tenant construction, or as atransferred liability to a buyer, we do not believe that the current estimation of that liability, and the relatedasset and cumulative catch-up of any accretion or depreciation, is material to our consolidated Ñnancialstatements. The time period for any of this work is indeterminate as we are not obligated to perform anyamount of such work that is material to our consolidated Ñnancial statements in conjunction with any currentrenovation or construction project. Accordingly, amounts recorded relating to FIN 47 are not material to ourconsolidated Ñnancial statements.
On February 7, 2005, the SEC staÅ published certain views concerning the accounting by lessees for leaseholdimprovements, rent holidays, lessor funding of lessee expenditures and other tenant inducements. Althoughthe application of these views to lessors was not speciÑed by the SEC and a formal accounting standardmodifying existing practice on these items has not been issued or proposed, we have conducted a review of ouraccounting relative to such items. We believe that our leasing practices and agreements with a majority of ourtenants provide that leasehold improvements that we fund represent Ñxed assets that we own and control. We
F-47
GENERAL GROWTH PROPERTIES, INC.
NOTES TO CONSOLIDATED FINANCIAL STATEMENTS Ì (Continued)
also believe that leases with such arrangements are properly accounted for as commencing at the completionof construction of such assets. A smaller percentage of our tenant leases do not provide for landlord fundingbut rather provide for tenant funded construction and furnishing of the leased premises prior to the formalcommencement of the lease. We have concluded that the cumulative incremental straight-line rental revenuethat would have been recognized on such leases if they had commenced on tenant possession of such spacerather than the lease-speciÑed commencement date to be approximately $10.1 million at December 31, 2004which was recognized in the three months ended March 31, 2005. The recognition of straight-line rentalrevenue on this accelerated basis will have no eÅect on periodic or cumulative cash Öows to be receivedpursuant to a tenant lease.
On December 16, 2004, the FASB issued SFAS No. 153, ""Exchanges of Nonmonetary Assets-AnAmendment of APB Opinion No. 29'' (""SFAS 153''). The amendments made by SFAS 153 are based on theprinciple that exchanges of nonmonetary assets should be measured based on the fair value of the assetsexchanged. Further, the amendments eliminate the narrow exception for nonmonetary exchanges of similarproductive assets and replace it with a broader exception for exchanges of nonmonetary assets that do not have""commercial substance.'' SFAS 153 is eÅective for nonmonetary asset exchanges occurring in Ñscal periodsbeginning after June 15, 2005. The adoption of SFAS 153 on June 15, 2005 did not have a material eÅect onour consolidated Ñnancial statements.
On December 16, 2004, the FASB issued SFAS No. 123 (Revised 2004), ""Share-Based Payment''(""SFAS 123R''). SFAS 123R replaces SFAS 123, which we adopted in the second quarter of 2002.SFAS 123R requires that compensation cost relating to share-based payment transactions be recognized inÑnancial statements and measured based on the fair value of the equity or liability instruments used.SFAS 123R, as provided by SEC regulation, is not required to be adopted until the Ñrst interim or annualreporting period that begins after December 15, 2005. Although we are still evaluating the provisions ofSFAS 123R, we do not expect its adoption to have a material eÅect on our consolidated Ñnancial statements.
In May 2003, the FASB issued SFAS No. 150, ""Accounting for Certain Financial Instruments withCharacteristics of Both Liabilities and Equity,'' (""SFAS 150'') which establishes standards for how an issuerclassiÑes and measures certain Ñnancial instruments with characteristics of both liabilities and equity. Itrequires that an issuer classify a Ñnancial instrument that is within its scope as a liability. The eÅective date ofa portion of SFAS 150 has been indeÑnitely postponed by the FASB. We did not enter into new Ñnancialinstruments subsequent to May 2003 which would fall within the scope of this statement. None of ourtransactions, arrangements or Ñnancial instruments, except for certain ventures acquired in the TRC Merger,have been identiÑed that appear to meet the criteria for liability recognition in accordance with paragraphs 9and 10 under SFAS 150 due to the indeÑnite life of the joint venture arrangements. Therefore, if theeÅectiveness of the measurement and classiÑcation provisions is no longer postponed, we would reclassify toliabilities approximately $15 million of minority interest with respect to such TRC Merger acquired ventures,but no amount for any of our other ventures.
Note 16 Segments
We have two business segments which oÅer diÅerent products and services. Our segments are managedseparately because each requires diÅerent operating strategies or management expertise. We do notdistinguish or group our consolidated operations on a geographic basis. Further, all material operations arewithin the United States and no customer or tenant comprises more than 10% of consolidated revenues. Ourreportable segments are as follows:
‚ Retail and Other Ì includes the operation, development and management of regional shopping centers,oÇce and industrial properties, downtown specialty marketplaces, the retail and non-retail rental compo-nents of mixed-use projects and community retail centers
F-48
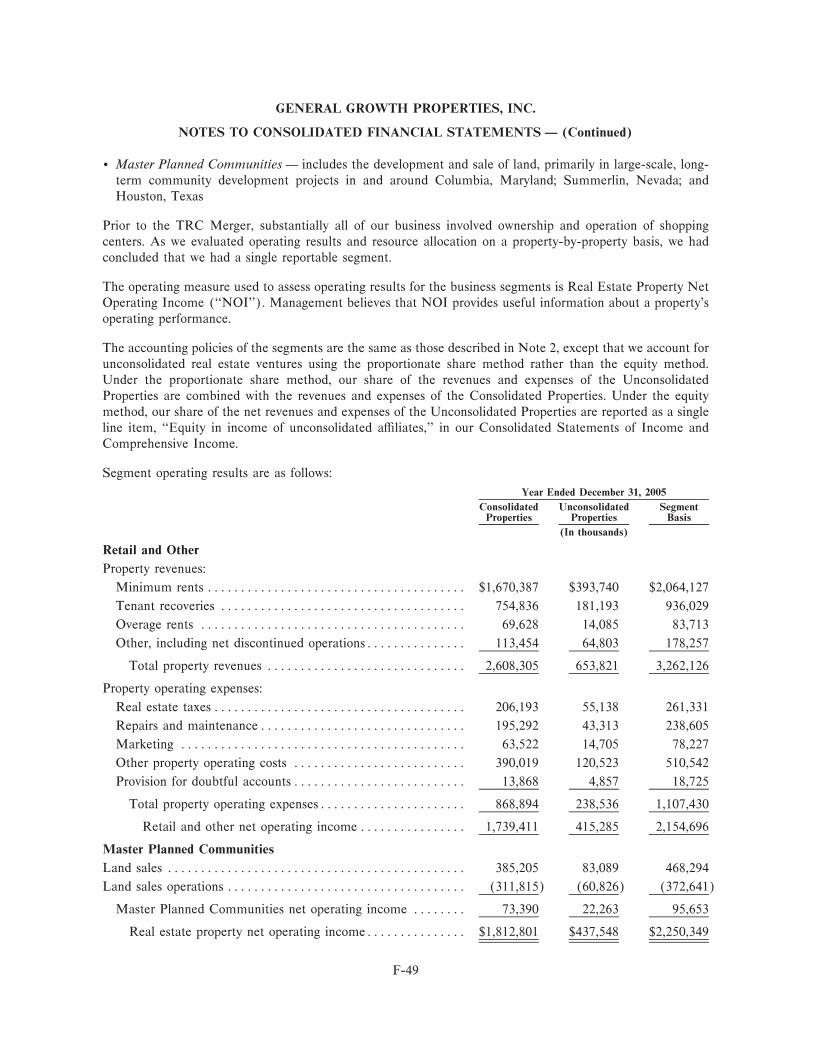
GENERAL GROWTH PROPERTIES, INC.
NOTES TO CONSOLIDATED FINANCIAL STATEMENTS Ì (Continued)
‚ Master Planned Communities Ì includes the development and sale of land, primarily in large-scale, long-term community development projects in and around Columbia, Maryland; Summerlin, Nevada; andHouston, Texas
Prior to the TRC Merger, substantially all of our business involved ownership and operation of shoppingcenters. As we evaluated operating results and resource allocation on a property-by-property basis, we hadconcluded that we had a single reportable segment.
The operating measure used to assess operating results for the business segments is Real Estate Property NetOperating Income (""NOI''). Management believes that NOI provides useful information about a property'soperating performance.
The accounting policies of the segments are the same as those described in Note 2, except that we account forunconsolidated real estate ventures using the proportionate share method rather than the equity method.Under the proportionate share method, our share of the revenues and expenses of the UnconsolidatedProperties are combined with the revenues and expenses of the Consolidated Properties. Under the equitymethod, our share of the net revenues and expenses of the Unconsolidated Properties are reported as a singleline item, ""Equity in income of unconsolidated aÇliates,'' in our Consolidated Statements of Income andComprehensive Income.
Segment operating results are as follows:
Year Ended December 31, 2005
Consolidated Unconsolidated SegmentProperties Properties Basis
(In thousands)
Retail and Other
Property revenues:
Minimum rents ÏÏÏÏÏÏÏÏÏÏÏÏÏÏÏÏÏÏÏÏÏÏÏÏÏÏÏÏÏÏÏÏÏÏÏÏÏÏÏ $1,670,387 $393,740 $2,064,127
Tenant recoveries ÏÏÏÏÏÏÏÏÏÏÏÏÏÏÏÏÏÏÏÏÏÏÏÏÏÏÏÏÏÏÏÏÏÏÏÏÏ 754,836 181,193 936,029
Overage rents ÏÏÏÏÏÏÏÏÏÏÏÏÏÏÏÏÏÏÏÏÏÏÏÏÏÏÏÏÏÏÏÏÏÏÏÏÏÏÏÏ 69,628 14,085 83,713
Other, including net discontinued operationsÏÏÏÏÏÏÏÏÏÏÏÏÏÏÏ 113,454 64,803 178,257
Total property revenues ÏÏÏÏÏÏÏÏÏÏÏÏÏÏÏÏÏÏÏÏÏÏÏÏÏÏÏÏÏÏ 2,608,305 653,821 3,262,126
Property operating expenses:
Real estate taxes ÏÏÏÏÏÏÏÏÏÏÏÏÏÏÏÏÏÏÏÏÏÏÏÏÏÏÏÏÏÏÏÏÏÏÏÏÏÏ 206,193 55,138 261,331
Repairs and maintenanceÏÏÏÏÏÏÏÏÏÏÏÏÏÏÏÏÏÏÏÏÏÏÏÏÏÏÏÏÏÏÏ 195,292 43,313 238,605
Marketing ÏÏÏÏÏÏÏÏÏÏÏÏÏÏÏÏÏÏÏÏÏÏÏÏÏÏÏÏÏÏÏÏÏÏÏÏÏÏÏÏÏÏÏ 63,522 14,705 78,227
Other property operating costs ÏÏÏÏÏÏÏÏÏÏÏÏÏÏÏÏÏÏÏÏÏÏÏÏÏÏ 390,019 120,523 510,542
Provision for doubtful accountsÏÏÏÏÏÏÏÏÏÏÏÏÏÏÏÏÏÏÏÏÏÏÏÏÏÏ 13,868 4,857 18,725
Total property operating expensesÏÏÏÏÏÏÏÏÏÏÏÏÏÏÏÏÏÏÏÏÏÏ 868,894 238,536 1,107,430
Retail and other net operating incomeÏÏÏÏÏÏÏÏÏÏÏÏÏÏÏÏ 1,739,411 415,285 2,154,696
Master Planned Communities
Land sales ÏÏÏÏÏÏÏÏÏÏÏÏÏÏÏÏÏÏÏÏÏÏÏÏÏÏÏÏÏÏÏÏÏÏÏÏÏÏÏÏÏÏÏÏÏ 385,205 83,089 468,294
Land sales operations ÏÏÏÏÏÏÏÏÏÏÏÏÏÏÏÏÏÏÏÏÏÏÏÏÏÏÏÏÏÏÏÏÏÏÏÏ (311,815) (60,826) (372,641)
Master Planned Communities net operating income ÏÏÏÏÏÏÏÏ 73,390 22,263 95,653
Real estate property net operating incomeÏÏÏÏÏÏÏÏÏÏÏÏÏÏÏ $1,812,801 $437,548 $2,250,349
F-49
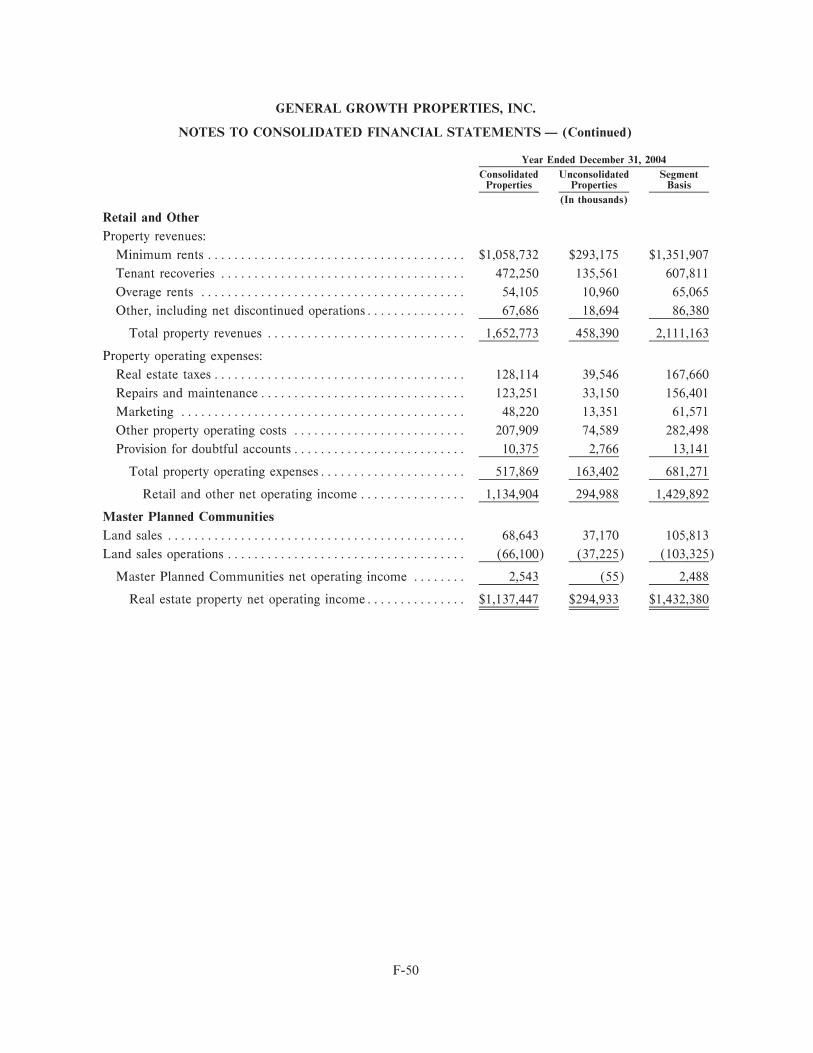
GENERAL GROWTH PROPERTIES, INC.
NOTES TO CONSOLIDATED FINANCIAL STATEMENTS Ì (Continued)
Year Ended December 31, 2004
Consolidated Unconsolidated SegmentProperties Properties Basis
(In thousands)
Retail and Other
Property revenues:
Minimum rents ÏÏÏÏÏÏÏÏÏÏÏÏÏÏÏÏÏÏÏÏÏÏÏÏÏÏÏÏÏÏÏÏÏÏÏÏÏÏÏ $1,058,732 $293,175 $1,351,907
Tenant recoveries ÏÏÏÏÏÏÏÏÏÏÏÏÏÏÏÏÏÏÏÏÏÏÏÏÏÏÏÏÏÏÏÏÏÏÏÏÏ 472,250 135,561 607,811
Overage rents ÏÏÏÏÏÏÏÏÏÏÏÏÏÏÏÏÏÏÏÏÏÏÏÏÏÏÏÏÏÏÏÏÏÏÏÏÏÏÏÏ 54,105 10,960 65,065
Other, including net discontinued operationsÏÏÏÏÏÏÏÏÏÏÏÏÏÏÏ 67,686 18,694 86,380
Total property revenues ÏÏÏÏÏÏÏÏÏÏÏÏÏÏÏÏÏÏÏÏÏÏÏÏÏÏÏÏÏÏ 1,652,773 458,390 2,111,163
Property operating expenses:
Real estate taxes ÏÏÏÏÏÏÏÏÏÏÏÏÏÏÏÏÏÏÏÏÏÏÏÏÏÏÏÏÏÏÏÏÏÏÏÏÏÏ 128,114 39,546 167,660
Repairs and maintenanceÏÏÏÏÏÏÏÏÏÏÏÏÏÏÏÏÏÏÏÏÏÏÏÏÏÏÏÏÏÏÏ 123,251 33,150 156,401
Marketing ÏÏÏÏÏÏÏÏÏÏÏÏÏÏÏÏÏÏÏÏÏÏÏÏÏÏÏÏÏÏÏÏÏÏÏÏÏÏÏÏÏÏÏ 48,220 13,351 61,571
Other property operating costs ÏÏÏÏÏÏÏÏÏÏÏÏÏÏÏÏÏÏÏÏÏÏÏÏÏÏ 207,909 74,589 282,498
Provision for doubtful accountsÏÏÏÏÏÏÏÏÏÏÏÏÏÏÏÏÏÏÏÏÏÏÏÏÏÏ 10,375 2,766 13,141
Total property operating expensesÏÏÏÏÏÏÏÏÏÏÏÏÏÏÏÏÏÏÏÏÏÏ 517,869 163,402 681,271
Retail and other net operating incomeÏÏÏÏÏÏÏÏÏÏÏÏÏÏÏÏ 1,134,904 294,988 1,429,892
Master Planned Communities
Land sales ÏÏÏÏÏÏÏÏÏÏÏÏÏÏÏÏÏÏÏÏÏÏÏÏÏÏÏÏÏÏÏÏÏÏÏÏÏÏÏÏÏÏÏÏÏ 68,643 37,170 105,813
Land sales operations ÏÏÏÏÏÏÏÏÏÏÏÏÏÏÏÏÏÏÏÏÏÏÏÏÏÏÏÏÏÏÏÏÏÏÏÏ (66,100) (37,225) (103,325)
Master Planned Communities net operating income ÏÏÏÏÏÏÏÏ 2,543 (55) 2,488
Real estate property net operating incomeÏÏÏÏÏÏÏÏÏÏÏÏÏÏÏ $1,137,447 $294,933 $1,432,380
F-50
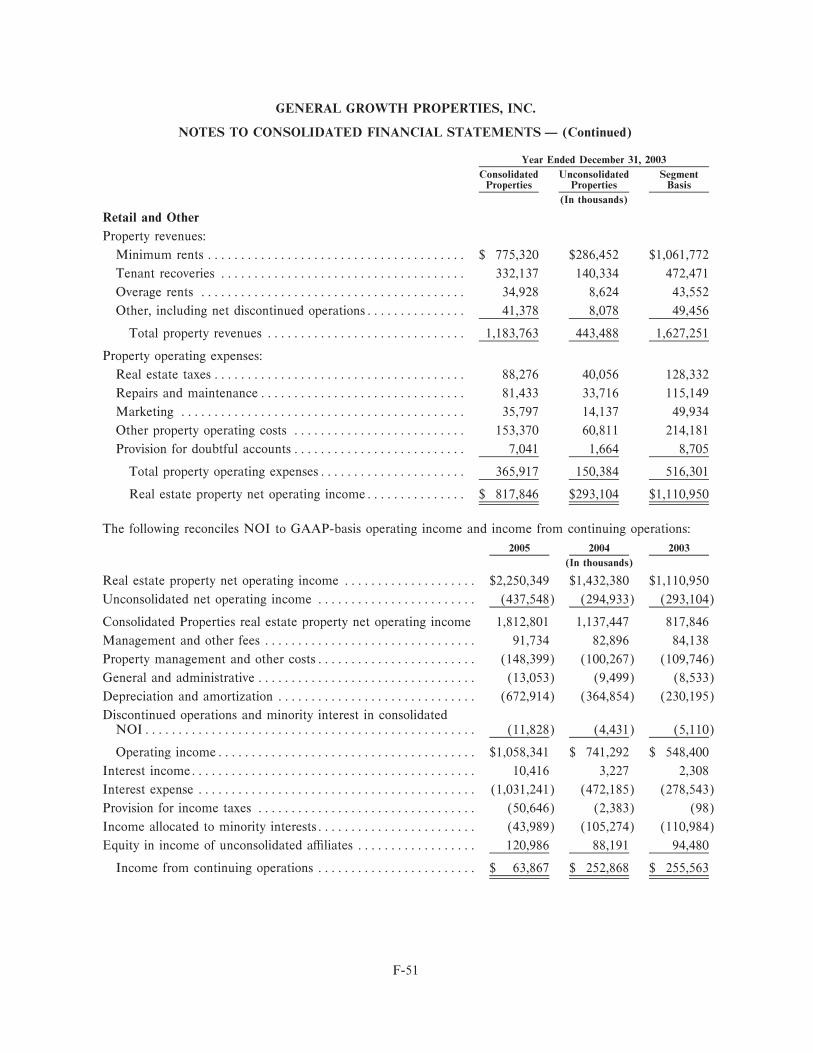
GENERAL GROWTH PROPERTIES, INC.
NOTES TO CONSOLIDATED FINANCIAL STATEMENTS Ì (Continued)
Year Ended December 31, 2003
Consolidated Unconsolidated SegmentProperties Properties Basis
(In thousands)
Retail and Other
Property revenues:
Minimum rents ÏÏÏÏÏÏÏÏÏÏÏÏÏÏÏÏÏÏÏÏÏÏÏÏÏÏÏÏÏÏÏÏÏÏÏÏÏÏÏ $ 775,320 $286,452 $1,061,772
Tenant recoveries ÏÏÏÏÏÏÏÏÏÏÏÏÏÏÏÏÏÏÏÏÏÏÏÏÏÏÏÏÏÏÏÏÏÏÏÏÏ 332,137 140,334 472,471
Overage rents ÏÏÏÏÏÏÏÏÏÏÏÏÏÏÏÏÏÏÏÏÏÏÏÏÏÏÏÏÏÏÏÏÏÏÏÏÏÏÏÏ 34,928 8,624 43,552
Other, including net discontinued operationsÏÏÏÏÏÏÏÏÏÏÏÏÏÏÏ 41,378 8,078 49,456
Total property revenues ÏÏÏÏÏÏÏÏÏÏÏÏÏÏÏÏÏÏÏÏÏÏÏÏÏÏÏÏÏÏ 1,183,763 443,488 1,627,251
Property operating expenses:
Real estate taxes ÏÏÏÏÏÏÏÏÏÏÏÏÏÏÏÏÏÏÏÏÏÏÏÏÏÏÏÏÏÏÏÏÏÏÏÏÏÏ 88,276 40,056 128,332
Repairs and maintenanceÏÏÏÏÏÏÏÏÏÏÏÏÏÏÏÏÏÏÏÏÏÏÏÏÏÏÏÏÏÏÏ 81,433 33,716 115,149
Marketing ÏÏÏÏÏÏÏÏÏÏÏÏÏÏÏÏÏÏÏÏÏÏÏÏÏÏÏÏÏÏÏÏÏÏÏÏÏÏÏÏÏÏÏ 35,797 14,137 49,934
Other property operating costs ÏÏÏÏÏÏÏÏÏÏÏÏÏÏÏÏÏÏÏÏÏÏÏÏÏÏ 153,370 60,811 214,181
Provision for doubtful accountsÏÏÏÏÏÏÏÏÏÏÏÏÏÏÏÏÏÏÏÏÏÏÏÏÏÏ 7,041 1,664 8,705
Total property operating expensesÏÏÏÏÏÏÏÏÏÏÏÏÏÏÏÏÏÏÏÏÏÏ 365,917 150,384 516,301
Real estate property net operating incomeÏÏÏÏÏÏÏÏÏÏÏÏÏÏÏ $ 817,846 $293,104 $1,110,950
The following reconciles NOI to GAAP-basis operating income and income from continuing operations:
2005 2004 2003
(In thousands)
Real estate property net operating income ÏÏÏÏÏÏÏÏÏÏÏÏÏÏÏÏÏÏÏÏ $2,250,349 $1,432,380 $1,110,950
Unconsolidated net operating income ÏÏÏÏÏÏÏÏÏÏÏÏÏÏÏÏÏÏÏÏÏÏÏÏ (437,548) (294,933) (293,104)
Consolidated Properties real estate property net operating income 1,812,801 1,137,447 817,846
Management and other fees ÏÏÏÏÏÏÏÏÏÏÏÏÏÏÏÏÏÏÏÏÏÏÏÏÏÏÏÏÏÏÏÏ 91,734 82,896 84,138
Property management and other costsÏÏÏÏÏÏÏÏÏÏÏÏÏÏÏÏÏÏÏÏÏÏÏÏ (148,399) (100,267) (109,746)
General and administrative ÏÏÏÏÏÏÏÏÏÏÏÏÏÏÏÏÏÏÏÏÏÏÏÏÏÏÏÏÏÏÏÏÏ (13,053) (9,499) (8,533)
Depreciation and amortization ÏÏÏÏÏÏÏÏÏÏÏÏÏÏÏÏÏÏÏÏÏÏÏÏÏÏÏÏÏÏ (672,914) (364,854) (230,195)
Discontinued operations and minority interest in consolidatedNOIÏÏÏÏÏÏÏÏÏÏÏÏÏÏÏÏÏÏÏÏÏÏÏÏÏÏÏÏÏÏÏÏÏÏÏÏÏÏÏÏÏÏÏÏÏÏÏÏÏÏ (11,828) (4,431) (5,110)
Operating incomeÏÏÏÏÏÏÏÏÏÏÏÏÏÏÏÏÏÏÏÏÏÏÏÏÏÏÏÏÏÏÏÏÏÏÏÏÏÏÏ $1,058,341 $ 741,292 $ 548,400
Interest incomeÏÏÏÏÏÏÏÏÏÏÏÏÏÏÏÏÏÏÏÏÏÏÏÏÏÏÏÏÏÏÏÏÏÏÏÏÏÏÏÏÏÏÏ 10,416 3,227 2,308
Interest expense ÏÏÏÏÏÏÏÏÏÏÏÏÏÏÏÏÏÏÏÏÏÏÏÏÏÏÏÏÏÏÏÏÏÏÏÏÏÏÏÏÏÏ (1,031,241) (472,185) (278,543)
Provision for income taxes ÏÏÏÏÏÏÏÏÏÏÏÏÏÏÏÏÏÏÏÏÏÏÏÏÏÏÏÏÏÏÏÏÏ (50,646) (2,383) (98)
Income allocated to minority interestsÏÏÏÏÏÏÏÏÏÏÏÏÏÏÏÏÏÏÏÏÏÏÏÏ (43,989) (105,274) (110,984)
Equity in income of unconsolidated aÇliates ÏÏÏÏÏÏÏÏÏÏÏÏÏÏÏÏÏÏ 120,986 88,191 94,480
Income from continuing operations ÏÏÏÏÏÏÏÏÏÏÏÏÏÏÏÏÏÏÏÏÏÏÏÏ $ 63,867 $ 252,868 $ 255,563
F-51
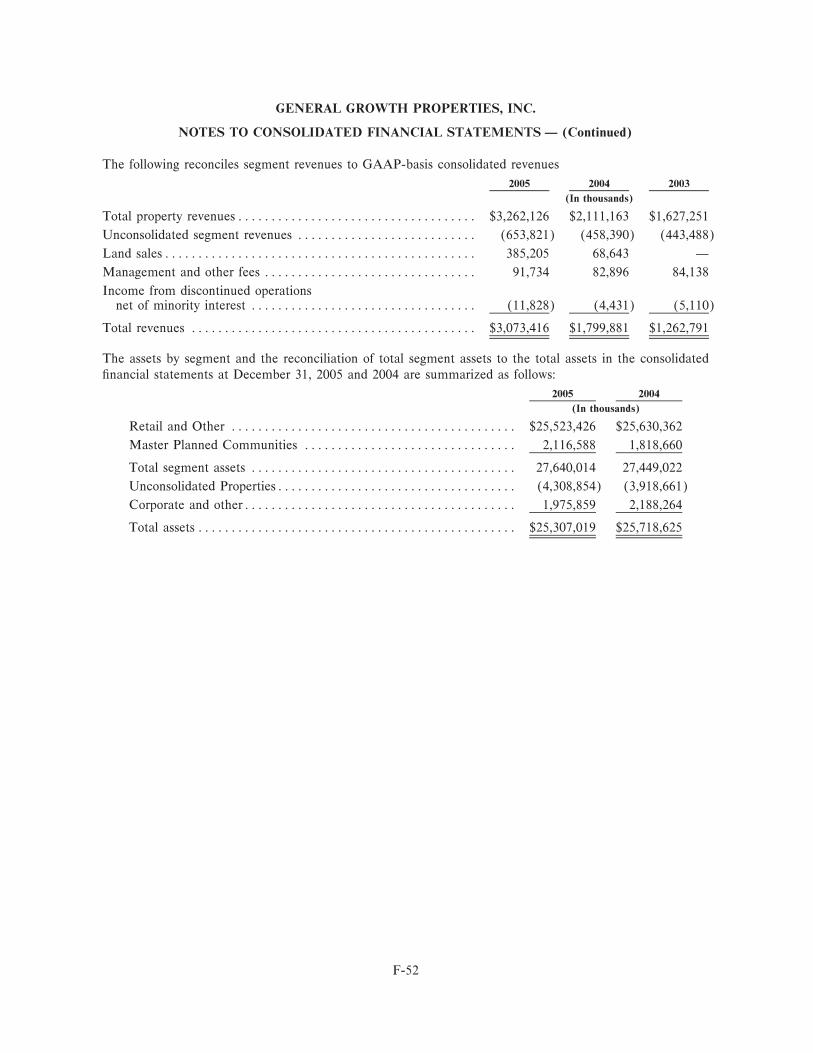
GENERAL GROWTH PROPERTIES, INC.
NOTES TO CONSOLIDATED FINANCIAL STATEMENTS Ì (Continued)
The following reconciles segment revenues to GAAP-basis consolidated revenues
2005 2004 2003
(In thousands)
Total property revenuesÏÏÏÏÏÏÏÏÏÏÏÏÏÏÏÏÏÏÏÏÏÏÏÏÏÏÏÏÏÏÏÏÏÏÏÏ $3,262,126 $2,111,163 $1,627,251
Unconsolidated segment revenues ÏÏÏÏÏÏÏÏÏÏÏÏÏÏÏÏÏÏÏÏÏÏÏÏÏÏÏ (653,821) (458,390) (443,488)
Land salesÏÏÏÏÏÏÏÏÏÏÏÏÏÏÏÏÏÏÏÏÏÏÏÏÏÏÏÏÏÏÏÏÏÏÏÏÏÏÏÏÏÏÏÏÏÏÏ 385,205 68,643 Ì
Management and other fees ÏÏÏÏÏÏÏÏÏÏÏÏÏÏÏÏÏÏÏÏÏÏÏÏÏÏÏÏÏÏÏÏ 91,734 82,896 84,138
Income from discontinued operationsnet of minority interest ÏÏÏÏÏÏÏÏÏÏÏÏÏÏÏÏÏÏÏÏÏÏÏÏÏÏÏÏÏÏÏÏÏÏ (11,828) (4,431) (5,110)
Total revenues ÏÏÏÏÏÏÏÏÏÏÏÏÏÏÏÏÏÏÏÏÏÏÏÏÏÏÏÏÏÏÏÏÏÏÏÏÏÏÏÏÏÏÏ $3,073,416 $1,799,881 $1,262,791
The assets by segment and the reconciliation of total segment assets to the total assets in the consolidatedÑnancial statements at December 31, 2005 and 2004 are summarized as follows:
2005 2004
(In thousands)
Retail and Other ÏÏÏÏÏÏÏÏÏÏÏÏÏÏÏÏÏÏÏÏÏÏÏÏÏÏÏÏÏÏÏÏÏÏÏÏÏÏÏÏÏÏÏ $25,523,426 $25,630,362
Master Planned Communities ÏÏÏÏÏÏÏÏÏÏÏÏÏÏÏÏÏÏÏÏÏÏÏÏÏÏÏÏÏÏÏÏ 2,116,588 1,818,660
Total segment assets ÏÏÏÏÏÏÏÏÏÏÏÏÏÏÏÏÏÏÏÏÏÏÏÏÏÏÏÏÏÏÏÏÏÏÏÏÏÏÏÏ 27,640,014 27,449,022
Unconsolidated PropertiesÏÏÏÏÏÏÏÏÏÏÏÏÏÏÏÏÏÏÏÏÏÏÏÏÏÏÏÏÏÏÏÏÏÏÏÏ (4,308,854) (3,918,661)
Corporate and otherÏÏÏÏÏÏÏÏÏÏÏÏÏÏÏÏÏÏÏÏÏÏÏÏÏÏÏÏÏÏÏÏÏÏÏÏÏÏÏÏÏ 1,975,859 2,188,264
Total assets ÏÏÏÏÏÏÏÏÏÏÏÏÏÏÏÏÏÏÏÏÏÏÏÏÏÏÏÏÏÏÏÏÏÏÏÏÏÏÏÏÏÏÏÏÏÏÏÏ $25,307,019 $25,718,625
F-52
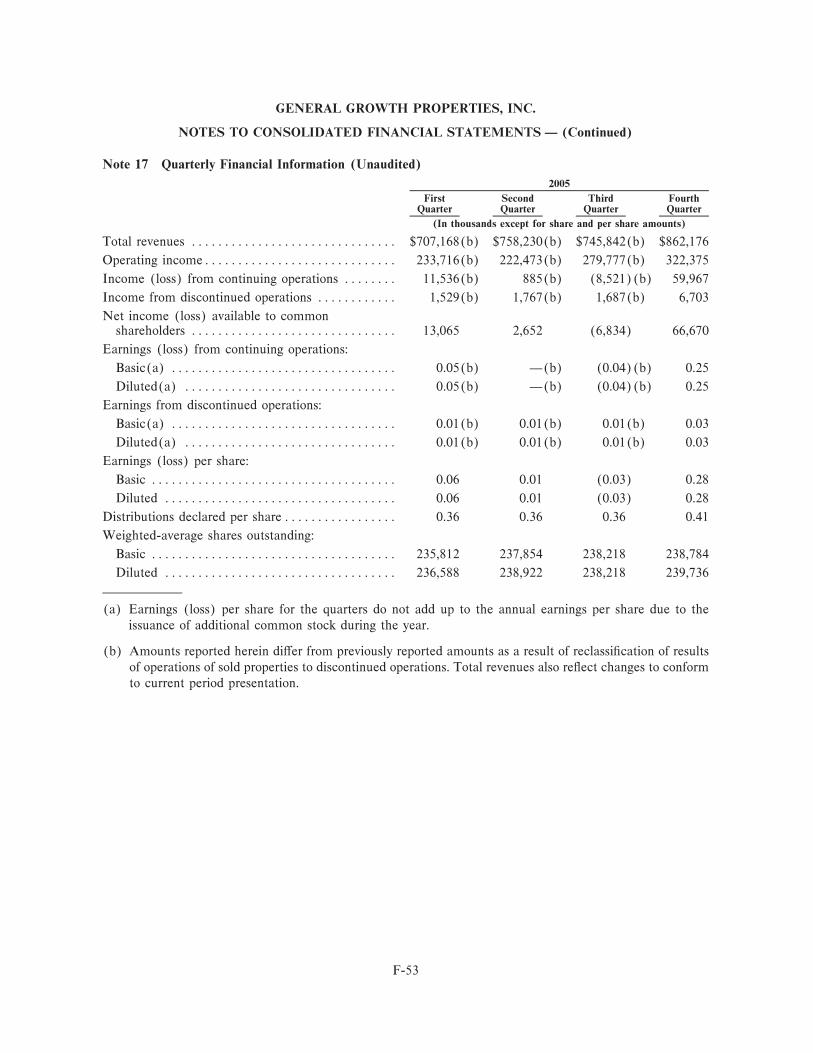
GENERAL GROWTH PROPERTIES, INC.
NOTES TO CONSOLIDATED FINANCIAL STATEMENTS Ì (Continued)
Note 17 Quarterly Financial Information (Unaudited)
2005
First Second Third FourthQuarter Quarter Quarter Quarter
(In thousands except for share and per share amounts)
Total revenues ÏÏÏÏÏÏÏÏÏÏÏÏÏÏÏÏÏÏÏÏÏÏÏÏÏÏÏÏÏÏÏ $707,168(b) $758,230(b) $745,842(b) $862,176
Operating incomeÏÏÏÏÏÏÏÏÏÏÏÏÏÏÏÏÏÏÏÏÏÏÏÏÏÏÏÏÏ 233,716(b) 222,473(b) 279,777(b) 322,375
Income (loss) from continuing operations ÏÏÏÏÏÏÏÏ 11,536(b) 885(b) (8,521)(b) 59,967
Income from discontinued operations ÏÏÏÏÏÏÏÏÏÏÏÏ 1,529(b) 1,767(b) 1,687(b) 6,703
Net income (loss) available to commonshareholders ÏÏÏÏÏÏÏÏÏÏÏÏÏÏÏÏÏÏÏÏÏÏÏÏÏÏÏÏÏÏÏ 13,065 2,652 (6,834) 66,670
Earnings (loss) from continuing operations:
Basic(a) ÏÏÏÏÏÏÏÏÏÏÏÏÏÏÏÏÏÏÏÏÏÏÏÏÏÏÏÏÏÏÏÏÏÏ 0.05(b) Ì(b) (0.04)(b) 0.25
Diluted(a) ÏÏÏÏÏÏÏÏÏÏÏÏÏÏÏÏÏÏÏÏÏÏÏÏÏÏÏÏÏÏÏÏ 0.05(b) Ì(b) (0.04)(b) 0.25
Earnings from discontinued operations:
Basic(a) ÏÏÏÏÏÏÏÏÏÏÏÏÏÏÏÏÏÏÏÏÏÏÏÏÏÏÏÏÏÏÏÏÏÏ 0.01(b) 0.01(b) 0.01(b) 0.03
Diluted(a) ÏÏÏÏÏÏÏÏÏÏÏÏÏÏÏÏÏÏÏÏÏÏÏÏÏÏÏÏÏÏÏÏ 0.01(b) 0.01(b) 0.01(b) 0.03
Earnings (loss) per share:
Basic ÏÏÏÏÏÏÏÏÏÏÏÏÏÏÏÏÏÏÏÏÏÏÏÏÏÏÏÏÏÏÏÏÏÏÏÏÏ 0.06 0.01 (0.03) 0.28
Diluted ÏÏÏÏÏÏÏÏÏÏÏÏÏÏÏÏÏÏÏÏÏÏÏÏÏÏÏÏÏÏÏÏÏÏÏ 0.06 0.01 (0.03) 0.28
Distributions declared per shareÏÏÏÏÏÏÏÏÏÏÏÏÏÏÏÏÏ 0.36 0.36 0.36 0.41
Weighted-average shares outstanding:
Basic ÏÏÏÏÏÏÏÏÏÏÏÏÏÏÏÏÏÏÏÏÏÏÏÏÏÏÏÏÏÏÏÏÏÏÏÏÏ 235,812 237,854 238,218 238,784
Diluted ÏÏÏÏÏÏÏÏÏÏÏÏÏÏÏÏÏÏÏÏÏÏÏÏÏÏÏÏÏÏÏÏÏÏÏ 236,588 238,922 238,218 239,736
(a) Earnings (loss) per share for the quarters do not add up to the annual earnings per share due to theissuance of additional common stock during the year.
(b) Amounts reported herein diÅer from previously reported amounts as a result of reclassiÑcation of resultsof operations of sold properties to discontinued operations. Total revenues also reÖect changes to conformto current period presentation.
F-53
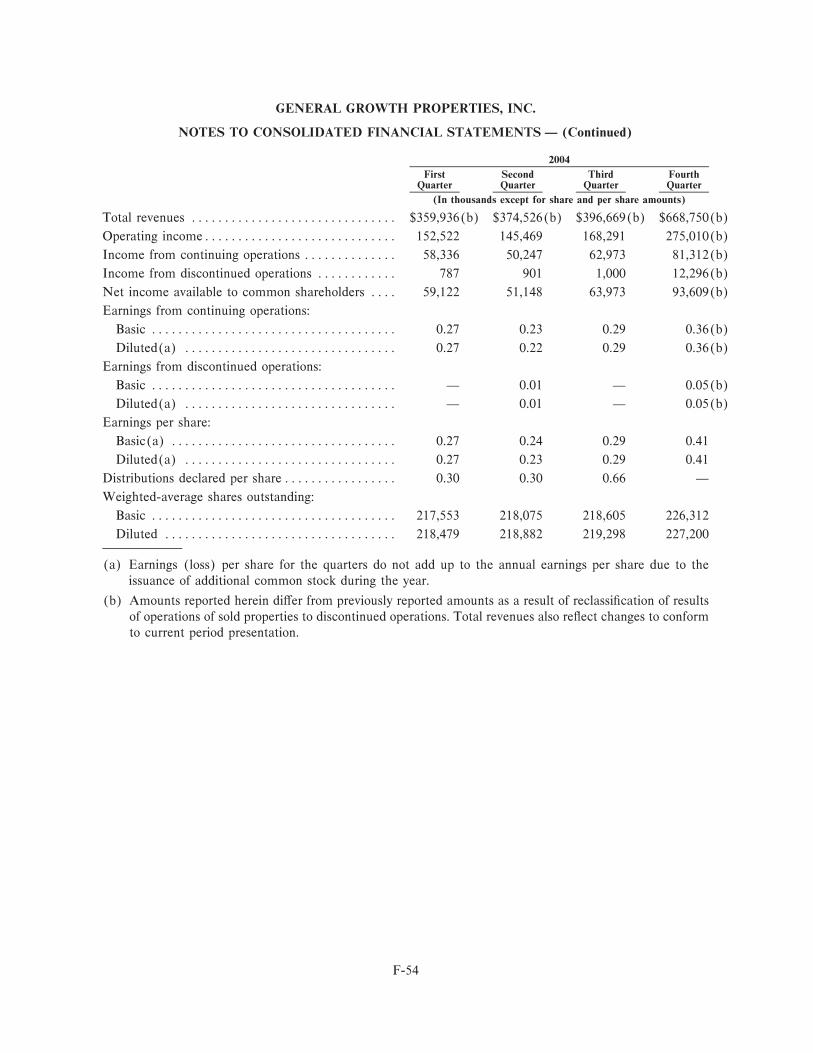
GENERAL GROWTH PROPERTIES, INC.
NOTES TO CONSOLIDATED FINANCIAL STATEMENTS Ì (Continued)
2004
First Second Third FourthQuarter Quarter Quarter Quarter
(In thousands except for share and per share amounts)
Total revenues ÏÏÏÏÏÏÏÏÏÏÏÏÏÏÏÏÏÏÏÏÏÏÏÏÏÏÏÏÏÏÏ $359,936(b) $374,526(b) $396,669(b) $668,750(b)
Operating incomeÏÏÏÏÏÏÏÏÏÏÏÏÏÏÏÏÏÏÏÏÏÏÏÏÏÏÏÏÏ 152,522 145,469 168,291 275,010(b)
Income from continuing operations ÏÏÏÏÏÏÏÏÏÏÏÏÏÏ 58,336 50,247 62,973 81,312(b)
Income from discontinued operations ÏÏÏÏÏÏÏÏÏÏÏÏ 787 901 1,000 12,296(b)
Net income available to common shareholders ÏÏÏÏ 59,122 51,148 63,973 93,609(b)
Earnings from continuing operations:
Basic ÏÏÏÏÏÏÏÏÏÏÏÏÏÏÏÏÏÏÏÏÏÏÏÏÏÏÏÏÏÏÏÏÏÏÏÏÏ 0.27 0.23 0.29 0.36(b)
Diluted(a) ÏÏÏÏÏÏÏÏÏÏÏÏÏÏÏÏÏÏÏÏÏÏÏÏÏÏÏÏÏÏÏÏ 0.27 0.22 0.29 0.36(b)
Earnings from discontinued operations:
Basic ÏÏÏÏÏÏÏÏÏÏÏÏÏÏÏÏÏÏÏÏÏÏÏÏÏÏÏÏÏÏÏÏÏÏÏÏÏ Ì 0.01 Ì 0.05(b)
Diluted(a) ÏÏÏÏÏÏÏÏÏÏÏÏÏÏÏÏÏÏÏÏÏÏÏÏÏÏÏÏÏÏÏÏ Ì 0.01 Ì 0.05(b)
Earnings per share:
Basic(a) ÏÏÏÏÏÏÏÏÏÏÏÏÏÏÏÏÏÏÏÏÏÏÏÏÏÏÏÏÏÏÏÏÏÏ 0.27 0.24 0.29 0.41
Diluted(a) ÏÏÏÏÏÏÏÏÏÏÏÏÏÏÏÏÏÏÏÏÏÏÏÏÏÏÏÏÏÏÏÏ 0.27 0.23 0.29 0.41
Distributions declared per shareÏÏÏÏÏÏÏÏÏÏÏÏÏÏÏÏÏ 0.30 0.30 0.66 Ì
Weighted-average shares outstanding:
Basic ÏÏÏÏÏÏÏÏÏÏÏÏÏÏÏÏÏÏÏÏÏÏÏÏÏÏÏÏÏÏÏÏÏÏÏÏÏ 217,553 218,075 218,605 226,312
Diluted ÏÏÏÏÏÏÏÏÏÏÏÏÏÏÏÏÏÏÏÏÏÏÏÏÏÏÏÏÏÏÏÏÏÏÏ 218,479 218,882 219,298 227,200
(a) Earnings (loss) per share for the quarters do not add up to the annual earnings per share due to theissuance of additional common stock during the year.
(b) Amounts reported herein diÅer from previously reported amounts as a result of reclassiÑcation of resultsof operations of sold properties to discontinued operations. Total revenues also reÖect changes to conformto current period presentation.
F-54
REPORT OF INDEPENDENT REGISTERED PUBLIC ACCOUNTING FIRM
To the Board of Directors and Stockholders ofGeneral Growth Properties, Inc.Chicago, Illinois
We have audited the consolidated Ñnancial statements of General Growth Properties, Inc. and subsidiaries(the ""Company'') as of December 31, 2005 and 2004, and for each of the three years in the period endedDecember 31, 2005, management's assessment of the eÅectiveness of the Company's internal control overÑnancial reporting as of December 31, 2005, and the eÅectiveness of the Company's internal control overÑnancial reporting as of December 31, 2005, and have issued our reports thereon dated March 31, 2006(which report expresses an adverse opinion on the eÅectiveness of the Company's internal control overÑnancial reporting because of material weaknesses); such consolidated Ñnancial statements and reports areincluded elsewhere in this Form 10-K. Our audits also included the consolidated Ñnancial statement scheduleof the Company listed in the Index to Consolidated Financial Statements and Consolidated FinancialStatement Schedule on page F-1 of this Form 10-K. This consolidated Ñnancial statement schedule is theresponsibility of the Company's management. Our responsibility is to express an opinion based on our audits.In our opinion, such consolidated Ñnancial statement schedule, when considered in relation to the basicconsolidated Ñnancial statements taken as a whole, presents fairly, in all material respects, the information setforth therein.
DELOITTE & TOUCHE LLP
Chicago, IllinoisMarch 31, 2006
F-55
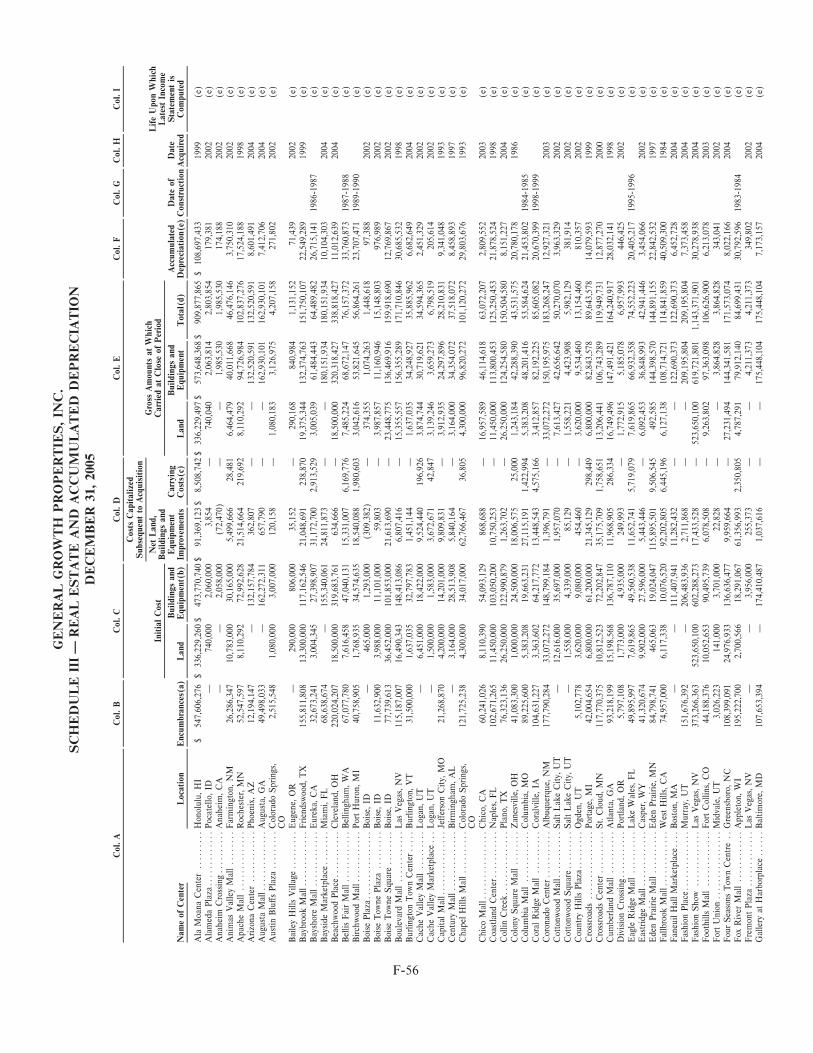
F-56
GEN
ER
AL G
RO
WTH
PR
OPER
TIE
S, IN
C.
SC
HED
ULE I
IIÌ
REAL E
STATE A
ND
AC
CU
MU
LATED
DEPR
EC
IATIO
ND
EC
EM
BER
31, 2005
Col
. A
Col
. B
Col
. C
Col
. D
Col
. E
Col
. F
Col
. G
Col
. H
Col
. I
Cos
ts C
apital
ized
Subs
equen
t to
Acq
uis
itio
nG
ross
Am
ount
s at
Whic
hN
et L
and,
Life
Upo
n W
hic
hIn
itia
l C
ost
Car
ried
at C
lose
of Per
iod
Buildi
ngs
and
Lat
est In
com
eBuildi
ngs
and
Equ
ipm
ent
Car
ryin
gBuildi
ngs
and
Acc
um
ula
ted
Dat
e of
Dat
eSta
tem
ent is
Nam
e of
Cen
ter
Loc
atio
nEnc
um
bran
ces(
a)Lan
dEqu
ipm
ent(
b)Im
prov
emen
tsC
osts
(c)
Lan
dEqu
ipm
ent
Tot
al(d
)D
epre
ciat
ion(
e)C
onst
ruct
ion
Acq
uired
Com
pute
d
Ala
Moa
na C
ente
rÏÏ
ÏÏÏÏ
ÏÏÏ
Hon
olul
u, H
I$
547,
606,
276
$33
6,22
9,26
0$
473,
770,
740
$91
,369
,123
$8,
508,
742
$33
6,22
9,49
7$
573,
648,
368
$90
9,87
7,86
5$
108,
697,
433
1999
(e)
Ala
med
a Pla
zaÏÏ
ÏÏÏÏ
ÏÏÏÏ
ÏÏÏ
Poc
atel
lo, ID
Ì74
0,00
02,
060,
000
3,85
4Ì
740,
040
2,06
3,81
42,
803,
854
179,
381
2002
(e)
Ana
hei
m C
ross
ingÏÏ
ÏÏÏÏ
ÏÏÏÏ
Ana
hei
m, C
AÌ
Ì2,
058,
000
(72,
470)
ÌÌ
1,98
5,53
01,
985,
530
174,
188
2002
(e)
Ani
mas
Val
ley
Mal
lÏÏ
ÏÏÏÏ
ÏÏFar
min
gton
, N
M26
,286
,347
10,7
83,0
0030
,165
,000
5,49
9,66
628
,481
6,46
4,47
940
,011
,668
46,4
76,1
463,
750,
310
2002
(e)
Apa
che
Mal
lÏÏ
ÏÏÏÏ
ÏÏÏÏ
ÏÏÏÏ
Roc
hes
ter, M
N52
,547
,597
8,11
0,29
272
,992
,628
21,5
14,6
6421
9,69
28,
110,
292
94,7
26,9
8410
2,83
7,27
617
,524
,188
1998
(e)
Arizo
na C
ente
rÏÏ
ÏÏÏÏ
ÏÏÏÏ
ÏÏPhoe
nix,
AZ
12,1
94,1
47Ì
132,
157,
784
362,
807
ÌÌ
132,
520,
591
132,
520,
591
8,60
1,49
120
04(e
)A
ugus
ta M
allÏ
ÏÏÏÏ
ÏÏÏÏ
ÏÏÏÏ
ÏA
ugus
ta, G
A49
,498
,033
Ì16
2,27
2,31
165
7,79
0Ì
Ì16
2,93
0,10
116
2,93
0,10
17,
412,
706
2004
(e)
Aus
tin
Blu
Ås
Pla
zaÏÏ
ÏÏÏÏ
ÏÏÏ
Col
orad
o Spr
ings
,2,
515,
548
1,08
0,00
03,
007,
000
120,
158
Ì1,
080,
183
3,12
6,97
54,
207,
158
271,
802
2002
(e)
CO
Bai
ley
Hills V
illa
geÏÏ
ÏÏÏÏ
ÏÏÏ
Eug
ene,
OR
Ì29
0,00
080
6,00
035
,152
Ì29
0,16
884
0,98
41,
131,
152
71,4
3920
02(e
)Bay
broo
k M
allÏ
ÏÏÏÏ
ÏÏÏÏ
ÏÏÏÏ
Frien
dswoo
d, T
X15
5,81
1,80
813
,300
,000
117,
162,
546
21,0
48,6
9123
8,87
019
,375
,344
132,
374,
763
151,
750,
107
22,5
49,2
8919
99(e
)Bay
shor
e M
allÏÏ
ÏÏÏÏ
ÏÏÏÏ
ÏÏÏ
Eur
eka,
CA
32,6
73,2
413,
004,
345
27,3
98,9
0731
,172
,700
2,91
3,52
93,
005,
039
61,4
84,4
4364
,489
,482
26,7
15,1
4119
86-1
987
(e)
Bay
side
Mar
ketp
lace
ÏÏÏÏ
ÏÏÏÏ
Mia
mi,
FL
68,6
38,6
74Ì
155,
340,
061
24,8
11,8
73Ì
Ì18
0,15
1,93
418
0,15
1,93
410
,104
,303
2004
(e)
Bea
chwoo
d Pla
ceÏÏ
ÏÏÏÏ
ÏÏÏÏ
ÏC
leve
land
, O
H22
0,02
4,20
718
,500
,000
319,
683,
761
634,
666
Ì18
,500
,000
320,
318,
427
338,
818,
427
11,0
12,6
3920
04(e
)Bel
lis
Fai
r M
allÏ
ÏÏÏÏ
ÏÏÏÏ
ÏÏÏ
Bel
ling
ham
, W
A67
,077
,780
7,61
6,45
847
,040
,131
15,3
31,0
076,
169,
776
7,48
5,22
468
,672
,147
76,1
57,3
7233
,760
,873
1987
-198
8(e
)Birch
woo
d M
allÏ
ÏÏÏÏ
ÏÏÏÏ
ÏÏÏ
Por
t H
uron
, M
I40
,758
,905
1,76
8,93
534
,574
,635
18,5
40,0
881,
980,
603
3,04
2,61
653
,821
,645
56,8
64,2
6123
,707
,471
1989
-199
0(e
)Boi
se P
laza
ÏÏÏÏ
ÏÏÏÏ
ÏÏÏÏ
ÏÏÏÏ
Boi
se, ID
Ì46
5,00
01,
293,
000
(309
,382
)Ì
374,
355
1,07
4,26
31,
448,
618
97,3
8820
02(e
)Boi
se T
owne
Pla
zaÏÏ
ÏÏÏÏ
ÏÏÏ
Boi
se, ID
11,6
32,9
003,
988,
000
11,1
01,0
0059
,803
Ì3,
987,
857
11,1
60,9
4615
,148
,803
976,
989
2002
(e)
Boi
se T
owne
Squ
are
ÏÏÏÏ
ÏÏÏÏ
Boi
se, ID
77,7
39,6
1336
,452
,000
101,
853,
000
21,6
13,6
90Ì
23,4
48,7
7513
6,46
9,91
615
9,91
8,69
012
,769
,867
2002
(e)
Bou
leva
rd M
allÏÏ
ÏÏÏÏ
ÏÏÏÏ
ÏÏLas
Veg
as, N
V11
5,18
7,00
716
,490
,343
148,
413,
086
6,80
7,41
6Ì
15,3
55,5
5715
6,35
5,28
917
1,71
0,84
630
,685
,532
1998
(e)
Bur
ling
ton
Tow
n C
ente
rÏÏÏ
ÏÏBur
ling
ton,
VT
31,5
00,0
001,
637,
035
32,7
97,7
831,
451,
144
Ì1,
637,
035
34,2
48,9
2735
,885
,962
6,68
2,64
920
04(e
)C
ache
Val
ley
Mal
lÏÏ
ÏÏÏÏ
ÏÏÏ
Log
an, U
TÌ
6,45
1,00
018
,422
,000
9,52
4,44
019
6,92
63,
874,
744
30,7
19,6
2134
,594
,365
2,45
1,32
920
02(e
)C
ache
Val
ley
Mar
ketp
lace
ÏÏÏ
Log
an, U
TÌ
1,50
0,00
01,
583,
000
3,67
2,67
142
,847
3,13
9,24
63,
659,
273
6,79
8,51
920
5,61
420
02(e
)C
apital
Mal
lÏÏÏ
ÏÏÏÏ
ÏÏÏÏ
ÏÏÏÏ
JeÅer
son
City,
MO
21,2
68,8
704,
200,
000
14,2
01,0
009,
809,
831
Ì3,
912,
935
24,2
97,8
9628
,210
,831
9,34
1,04
819
93(e
)C
entu
ry M
allÏ
ÏÏÏÏ
ÏÏÏÏ
ÏÏÏÏ
ÏBirm
ingh
am, A
LÌ
3,16
4,00
028
,513
,908
5,84
0,16
4Ì
3,16
4,00
034
,354
,072
37,5
18,0
728,
458,
893
1997
(e)
Chap
el H
ills M
allÏ
ÏÏÏÏ
ÏÏÏÏ
ÏC
olor
ado
Spr
ings
,12
1,72
5,23
84,
300,
000
34,0
17,0
0062
,766
,467
36,8
054,
300,
000
96,8
20,2
7210
1,12
0,27
229
,803
,676
1993
(e)
CO
Chic
o M
allÏ
ÏÏÏÏ
ÏÏÏÏ
ÏÏÏÏ
ÏÏÏ
Chic
o, C
A60
,241
,026
8,11
0,39
054
,093
,129
868,
688
Ì16
,957
,589
46,1
14,6
1863
,072
,207
2,80
9,55
220
03(e
)C
oast
land
Cen
terÏ
ÏÏÏÏ
ÏÏÏÏ
ÏÏN
aple
s, F
L10
2,67
1,26
511
,450
,000
103,
050,
200
10,7
50,2
53Ì
11,4
50,0
0011
3,80
0,45
312
5,25
0,45
321
,878
,524
1998
(e)
Col
lin
Cre
ekÏÏ
ÏÏÏÏ
ÏÏÏÏ
ÏÏÏÏ
ÏPla
no, TX
76,3
23,1
3626
,250
,000
122,
990,
879
1,26
3,70
2Ì
26,2
50,0
0012
4,25
4,58
015
0,50
4,58
08,
151,
227
2004
(e)
Col
ony
Squ
are
Mal
lÏÏ
ÏÏÏÏ
ÏÏZ
anes
ville,
OH
41,0
83,3
001,
000,
000
24,5
00,0
0018
,006
,575
25,0
001,
243,
184
42,2
88,3
9043
,531
,575
20,7
80,1
7819
86(e
)C
olum
bia
Mal
lÏÏ
ÏÏÏÏ
ÏÏÏÏ
ÏÏC
olum
bia,
MO
89,2
25,6
005,
383,
208
19,6
63,2
3127
,115
,191
1,42
2,99
45,
383,
208
48,2
01,4
1653
,584
,624
21,4
53,8
0219
84-1
985
(e)
Cor
al R
idge
Mal
lÏÏ
ÏÏÏÏ
ÏÏÏÏ
Cor
alvi
lle,
IA
104,
631,
227
3,36
3,60
264
,217
,772
13,4
48,5
434,
575,
166
3,41
2,85
782
,192
,225
85,6
05,0
8220
,670
,399
1998
-199
9(e
)C
oron
ado
Cen
terÏ
ÏÏÏÏ
ÏÏÏÏ
ÏÏA
lbuq
uerq
ue, N
M17
7,79
0,28
433
,072
,272
148,
799,
184
1,39
6,79
1Ì
33,0
72,2
7215
0,19
5,97
518
3,26
8,24
712
,927
,321
2003
(e)
Cot
tonw
ood
Mal
lÏÏÏ
ÏÏÏÏ
ÏÏÏÏ
Sal
t Lak
e C
ity,
UT
Ì12
,616
,000
35,6
97,0
001,
957,
070
Ì7,
613,
427
42,6
56,6
4250
,270
,070
3,96
3,32
920
02(e
)C
otto
nwoo
d Squ
areÏÏ
ÏÏÏÏ
ÏÏÏ
Sal
t Lak
e C
ity,
UT
Ì1,
558,
000
4,33
9,00
085
,129
Ì1,
558,
221
4,42
3,90
85,
982,
129
381,
914
2002
(e)
Cou
ntry
Hills P
laza
ÏÏÏÏ
ÏÏÏÏ
ÏO
gden
, U
T5,
102,
778
3,62
0,00
09,
080,
000
454,
460
Ì3,
620,
000
9,53
4,46
013
,154
,460
810,
357
2002
(e)
Cro
ssro
ads
ÏÏÏÏ
ÏÏÏÏ
ÏÏÏÏ
ÏÏÏÏ
Por
tage
, M
I42
,004
,654
6,80
0,00
061
,200
,000
21,3
45,1
2929
8,44
96,
800,
000
82,8
43,5
7889
,643
,578
14,0
79,5
9319
99(e
)C
ross
road
s C
ente
rÏÏ
ÏÏÏÏ
ÏÏÏÏ
St. C
loud
, M
N11
7,77
0,37
510
,812
,523
72,2
02,8
4735
,175
,709
1,75
8,65
113
,206
,441
106,
743,
289
119,
949,
731
12,8
77,2
7020
00(e
)C
umbe
rlan
d M
allÏÏ
ÏÏÏÏ
ÏÏÏÏ
Atlan
ta, G
A93
,218
,199
15,1
98,5
6813
6,78
7,11
011
,968
,905
286,
334
16,7
49,4
9614
7,49
1,42
116
4,24
0,91
728
,032
,141
1998
(e)
Div
isio
n C
ross
ingÏ
ÏÏÏÏ
ÏÏÏÏ
ÏÏPor
tlan
d, O
R5,
797,
108
1,77
3,00
04,
935,
000
249,
993
Ì1,
772,
915
5,18
5,07
86,
957,
993
446,
425
2002
(e)
Eag
le R
idge
Mal
lÏÏ
ÏÏÏÏ
ÏÏÏÏ
Lak
e W
ales
, FL
49,8
95,9
977,
619,
865
49,5
60,5
3811
,652
,741
5,71
9,07
97,
619,
865
66,9
32,3
5874
,552
,223
20,4
05,2
1719
95-1
996
(e)
Eas
trid
ge M
allÏ
ÏÏÏÏ
ÏÏÏÏ
ÏÏÏÏ
Cas
per, W
Y41
,320
,674
9,90
2,00
027
,596
,000
5,44
3,44
6Ì
6,09
2,45
336
,848
,993
42,9
41,4
463,
454,
066
2002
(e)
Ede
n Pra
irie
Mal
lÏÏ
ÏÏÏÏ
ÏÏÏÏ
Ede
n Pra
irie
, M
N84
,798
,741
465,
063
19,0
24,0
4711
5,89
5,50
19,
506,
545
492,
585
144,
398,
570
144,
891,
155
22,8
42,5
3219
97(e
)Fal
lbro
ok M
allÏ
ÏÏÏÏ
ÏÏÏÏ
ÏÏÏÏ
Wes
t H
ills, C
A74
,957
,000
6,11
7,33
810
,076
,520
92,2
02,8
056,
445,
196
6,12
7,13
810
8,71
4,72
111
4,84
1,85
940
,509
,300
1984
(e)
Fan
euil H
all M
arke
tpla
ceÏÏ
ÏÏBos
ton,
MA
ÌÌ
111,
407,
941
11,2
82,4
32Ì
Ì12
2,69
0,37
312
2,69
0,37
36,
452,
728
2004
(e)
Fas
hio
n Pla
ceÏÏ
ÏÏÏÏ
ÏÏÏÏ
ÏÏÏÏ
Mur
ray,
UT
151,
676,
392
Ì20
6,48
3,93
62,
711,
868
ÌÌ
209,
195,
804
209,
195,
804
7,37
3,45
820
04(e
)Fas
hio
n Show
ÏÏÏÏ
ÏÏÏÏ
ÏÏÏÏ
ÏLas
Veg
as, N
V37
3,26
6,36
352
3,65
0,10
060
2,28
8,27
317
,433
,528
Ì52
3,65
0,10
061
9,72
1,80
11,
143,
371,
901
30,2
78,9
3820
04(e
)Foo
thills M
all
ÏÏÏÏ
ÏÏÏÏ
ÏÏÏÏ
ÏFor
t C
ollins
, C
O44
,188
,376
10,0
52,6
5390
,495
,739
6,07
8,50
8Ì
9,26
3,80
297
,363
,098
106,
626,
900
6,21
3,07
820
03(e
)For
t U
nion
ÏÏÏÏ
ÏÏÏÏ
ÏÏÏÏ
ÏÏÏÏ
Mid
vale
, U
T3,
026,
223
141,
000
3,70
1,00
022
,828
ÌÌ
3,86
4,82
83,
864,
828
343,
041
2002
(e)
Fou
r Sea
sons
Tow
n C
entre
ÏÏG
reen
sbor
o, N
C10
8,39
9,09
124
,976
,933
136,
636,
477
9,95
9,66
4Ì
27,2
31,4
9414
4,34
1,58
117
1,57
3,07
48,
022,
166
2004
(e)
Fox
Riv
er M
allÏÏ
ÏÏÏÏ
ÏÏÏÏ
ÏÏA
pple
ton,
WI
195,
222,
700
2,70
0,56
618
,291
,067
61,3
56,9
932,
350,
805
4,78
7,29
179
,912
,140
84,6
99,4
3130
,792
,596
1983
-198
4(e
)Fre
mon
t Pla
zaÏÏ
ÏÏÏÏ
ÏÏÏÏ
ÏÏÏ
Las
Veg
as, N
VÌ
Ì3,
956,
000
255,
373
ÌÌ
4,21
1,37
34,
211,
373
349,
802
2002
(e)
Gal
lery
at H
arbo
rpla
ceÏÏ
ÏÏÏÏ
Bal
tim
ore,
MD
107,
653,
394
Ì17
4,41
0,48
71,
037,
616
ÌÌ
175,
448,
104
175,
448,
104
7,17
3,15
720
04(e
)
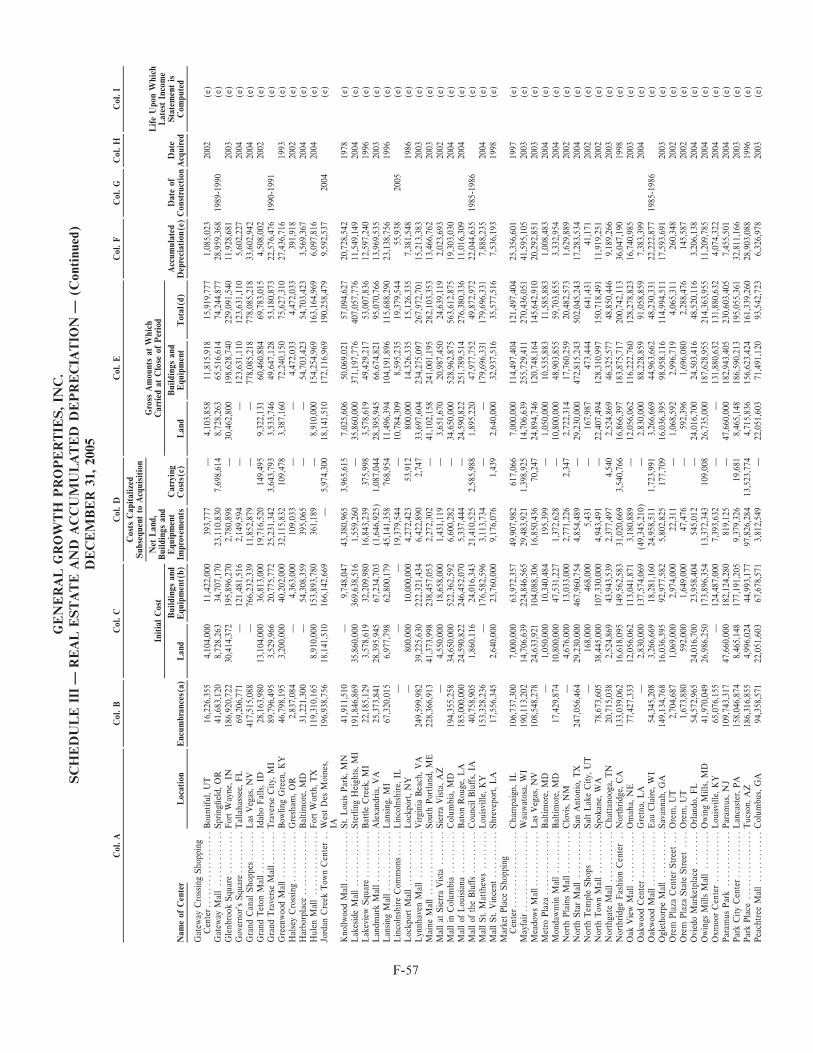
F-57
GEN
ER
AL G
RO
WTH
PR
OPER
TIE
S, IN
C.
SC
HED
ULE I
IIÌ
REAL E
STATE A
ND
AC
CU
MU
LATED
DEPR
EC
IATIO
NÌ
(C
ontinued
)D
EC
EM
BER
31, 2005
Col
. A
Col
. B
Col
. C
Col
. D
Col
. E
Col
. F
Col
. G
Col
. H
Col
. I
Cos
ts C
apital
ized
Subs
equen
t to
Acq
uis
itio
nG
ross
Am
ount
s at
Whic
hN
et L
and,
Life
Upo
n W
hic
hIn
itia
l C
ost
Car
ried
at C
lose
of Per
iod
Buildi
ngs
and
Lat
est In
com
eBuildi
ngs
and
Equ
ipm
ent
Car
ryin
gBuildi
ngs
and
Acc
um
ula
ted
Dat
e of
Dat
eSta
tem
ent is
Nam
e of
Cen
ter
Loc
atio
nEnc
um
bran
ces(
a)Lan
dEqu
ipm
ent(
b)Im
prov
emen
tsC
osts
(c)
Lan
dEqu
ipm
ent
Tot
al(d
)D
epre
ciat
ion(
e)C
onst
ruct
ion
Acq
uired
Com
pute
d
Gat
eway
Cro
ssin
g Shop
ping
Cen
terÏ
ÏÏÏÏ
ÏÏÏÏ
ÏÏÏÏ
ÏÏÏÏ
ÏBou
ntiful
, U
T16
,226
,355
4,10
4,00
011
,422
,000
393,
777
Ì4,
103,
858
11,8
15,9
1815
,919
,777
1,08
5,02
320
02(e
)G
atew
ay M
all
ÏÏÏÏ
ÏÏÏÏ
ÏÏÏÏ
ÏSpr
ingÑ
eld,
OR
41,6
83,1
208,
728,
263
34,7
07,1
7023
,110
,830
7,69
8,61
48,
728,
263
65,5
16,6
1474
,244
,877
28,9
59,3
6819
89-1
990
(e)
Gle
nbro
ok S
quar
eÏÏ
ÏÏÏÏ
ÏÏÏÏ
For
t W
ayne
, IN
186,
920,
722
30,4
14,3
7219
5,89
6,27
02,
780,
898
Ì30
,462
,800
198,
628,
740
229,
091,
540
11,9
28,6
8120
03(e
)G
over
nor's
Squ
areÏÏ
ÏÏÏÏ
ÏÏÏÏ
Tal
lahas
see,
FL
69,2
06,7
71Ì
121,
481,
516
2,14
9,59
4Ì
Ì12
3,63
1,11
012
3,63
1,11
05,
602,
227
2004
(e)
Gra
nd C
anal
Shop
pesÏ
ÏÏÏÏ
ÏÏLas
Veg
as, N
V41
7,51
5,08
8Ì
766,
232,
339
11,8
52,8
79Ì
Ì77
8,08
5,21
877
8,08
5,21
833
,602
,942
2004
(e)
Gra
nd T
eton
Mal
lÏÏÏ
ÏÏÏÏ
ÏÏÏ
Idah
o Fal
ls, ID
28,1
63,9
8013
,104
,000
36,8
13,0
0019
,716
,520
149,
495
9,32
2,13
160
,460
,884
69,7
83,0
154,
508,
002
2002
(e)
Gra
nd T
rave
rse
Mal
lÏÏÏ
ÏÏÏÏ
ÏTra
vers
e C
ity,
MI
89,7
96,4
953,
529,
966
20,7
75,7
7225
,231
,342
3,64
3,79
33,
533,
746
49,6
47,1
2853
,180
,873
22,5
76,4
7619
90-1
991
(e)
Gre
enwoo
d M
allÏÏ
ÏÏÏÏ
ÏÏÏÏ
ÏBow
ling
Gre
en, K
Y46
,798
,195
3,20
0,00
040
,202
,000
32,1
15,8
3210
9,47
83,
387,
160
72,2
40,1
5075
,627
,310
27,4
36,7
1619
93(e
)H
alse
y C
ross
ingÏÏ
ÏÏÏÏ
ÏÏÏÏ
ÏÏG
resh
am, O
R2,
837,
084
Ì4,
363,
000
109,
033
ÌÌ
4,47
2,03
34,
472,
033
391,
918
2002
(e)
Har
borp
lace
ÏÏÏÏ
ÏÏÏÏ
ÏÏÏÏ
ÏÏÏ
Bal
tim
ore,
MD
31,2
21,3
00Ì
54,3
08,3
5939
5,06
5Ì
Ì54
,703
,423
54,7
03,4
233,
569,
367
2004
(e)
Hul
en M
all
ÏÏÏÏ
ÏÏÏÏ
ÏÏÏÏ
ÏÏÏ
For
t W
orth
, TX
119,
310,
165
8,91
0,00
015
3,89
3,78
036
1,18
9Ì
8,91
0,00
015
4,25
4,96
916
3,16
4,96
96,
097,
816
2004
(e)
Jord
an C
reek
Tow
n C
ente
rÏÏ
Wes
t D
es M
oine
s,19
6,93
8,75
618
,141
,510
166,
142,
669
Ì5,
974,
300
18,1
41,5
1017
2,11
6,96
919
0,25
8,47
99,
592,
537
2004
(e)
IAK
nollwoo
d M
allÏ
ÏÏÏÏ
ÏÏÏÏ
ÏÏÏ
St. L
ouis P
ark,
MN
41,9
11,5
10Ì
9,74
8,04
743
,380
,965
3,96
5,61
57,
025,
606
50,0
69,0
2157
,094
,627
20,7
28,5
4219
78(e
)Lak
esid
e M
allÏÏ
ÏÏÏÏ
ÏÏÏÏ
ÏÏÏ
Ste
rlin
g H
eigh
ts, M
I19
1,84
6,86
935
,860
,000
369,
638,
516
1,55
9,26
0Ì
35,8
60,0
0037
1,19
7,77
640
7,05
7,77
611
,549
,149
2004
(e)
Lak
evie
w S
quar
eÏÏ
ÏÏÏÏ
ÏÏÏÏ
ÏBat
tle
Cre
ek, M
I22
,185
,129
3,57
8,61
932
,209
,980
16,8
43,2
3937
5,99
83,
578,
619
49,4
29,2
1753
,007
,836
12,5
97,2
4019
96(e
)Lan
dmar
k M
allÏ
ÏÏÏÏ
ÏÏÏÏ
ÏÏÏ
Ale
xand
ria,
VA
25,3
73,8
4128
,395
,945
67,2
34,7
03(1
,646
,925
)1,
087,
044
28,3
95,9
4566
,674
,821
95,0
70,7
6613
,969
,535
2003
(e)
Lan
sing
Mal
lÏÏ
ÏÏÏÏ
ÏÏÏÏ
ÏÏÏÏ
Lan
sing
, M
I67
,320
,015
6,97
7,79
862
,800
,179
45,1
41,3
5876
8,95
411
,496
,394
104,
191,
896
115,
688,
290
23,1
38,7
5619
96(e
)Lin
coln
shire
Com
mon
sÏÏÏ
ÏÏÏ
Lin
coln
shire,
IL
ÌÌ
Ì19
,379
,544
Ì10
,784
,309
8,59
5,23
519
,379
,544
55,9
3820
05(e
)Loc
kpor
t M
allÏÏ
ÏÏÏÏ
ÏÏÏÏ
ÏÏÏ
Loc
kpor
t, N
YÌ
800,
000
10,0
00,0
004,
272,
423
53,9
1280
0,00
014
,326
,335
15,1
26,3
357,
381,
548
1986
(e)
Lyn
nhav
en M
all
ÏÏÏÏ
ÏÏÏÏ
ÏÏÏ
Virgi
nia
Bea
ch, V
A24
9,59
9,98
239
,225
,630
222,
321,
434
6,42
2,89
02,
747
33,6
97,6
0423
4,27
5,09
726
7,97
2,70
115
,213
,383
2003
(e)
Mai
ne M
allÏÏ
ÏÏÏÏ
ÏÏÏÏ
ÏÏÏÏ
ÏSou
th P
ortlan
d, M
E22
8,36
6,91
341
,373
,998
238,
457,
053
2,27
2,30
2Ì
41,1
02,1
5824
1,00
1,19
528
2,10
3,35
313
,466
,762
2003
(e)
Mal
l at
Sie
rra
Vista
ÏÏÏÏ
ÏÏÏÏ
Sie
rra
Vista
, A
ZÌ
4,55
0,00
018
,658
,000
1,43
1,11
9Ì
3,65
1,67
020
,987
,450
24,6
39,1
192,
023,
693
2002
(e)
Mal
l in
Col
umbi
aÏÏ
ÏÏÏÏ
ÏÏÏÏ
Col
umbi
a, M
D19
4,35
5,25
834
,650
,000
522,
362,
592
6,60
0,28
2Ì
34,6
50,0
0052
8,96
2,87
556
3,61
2,87
519
,303
,030
2004
(e)
Mal
l of
Lou
isia
naÏÏ
ÏÏÏÏ
ÏÏÏÏ
Bat
on R
ouge
, LA
185,
000,
000
24,5
90,8
2224
6,45
2,07
05,
337,
444
Ì24
,590
,822
251,
789,
514
276,
380,
336
11,0
16,3
0920
04(e
)M
all of
the
Blu
ÅsÏÏ
ÏÏÏÏ
ÏÏÏÏ
Cou
ncil B
luÅs, I
A40
,758
,905
1,86
0,11
624
,016
,343
21,4
10,5
252,
585,
988
1,89
5,22
047
,977
,752
49,8
72,9
7222
,044
,635
1985
-198
6(e
)M
all St. M
atth
ews
ÏÏÏÏ
ÏÏÏÏ
ÏLou
isvi
lle,
KY
153,
328,
236
Ì17
6,58
2,59
63,
113,
734
ÌÌ
179,
696,
331
179,
696,
331
7,88
8,23
520
04(e
)M
all St. V
ince
ntÏÏ
ÏÏÏÏ
ÏÏÏÏ
ÏShre
vepo
rt, LA
17,5
56,3
452,
640,
000
23,7
60,0
009,
176,
076
1,43
92,
640,
000
32,9
37,5
1635
,577
,516
7,53
6,19
319
98(e
)M
arke
t Pla
ce S
hop
ping
Cen
terÏ
ÏÏÏÏ
ÏÏÏÏ
ÏÏÏÏ
ÏÏÏÏ
ÏC
ham
paig
n, I
L10
6,73
7,30
07,
000,
000
63,9
72,3
5749
,907
,982
617,
066
7,00
0,00
011
4,49
7,40
412
1,49
7,40
425
,356
,601
1997
(e)
May
fair
ÏÏÏÏ
ÏÏÏÏ
ÏÏÏÏ
ÏÏÏÏ
ÏÏÏ
Wau
wat
osa,
WI
190,
113,
202
14,7
06,6
3922
4,84
6,56
529
,483
,921
1,39
8,92
514
,706
,639
255,
729,
411
270,
436,
051
41,5
95,1
0520
03(e
)M
eado
ws
Mal
lÏÏÏ
ÏÏÏÏ
ÏÏÏÏ
ÏÏLas
Veg
as, N
V10
8,54
8,27
824
,633
,921
104,
088,
306
16,8
50,4
3670
,247
24,8
94,7
4612
0,74
8,16
414
5,64
2,91
020
,292
,851
2003
(e)
Met
ro P
laza
ÏÏÏÏ
ÏÏÏÏ
ÏÏÏÏ
ÏÏÏ
Bal
tim
ore,
MD
Ì1,
050,
000
10,3
40,4
8419
5,39
9Ì
1,05
0,00
010
,535
,883
11,5
85,8
831,
008,
483
2004
(e)
Mon
dawm
in M
allÏÏ
ÏÏÏÏ
ÏÏÏÏ
Bal
tim
ore,
MD
17,4
29,8
7410
,800
,000
47,5
31,2
271,
372,
628
Ì10
,800
,000
48,9
03,8
5559
,703
,855
3,33
2,95
420
04(e
)N
orth
Pla
ins
Mal
lÏÏÏ
ÏÏÏÏ
ÏÏÏ
Clo
vis, N
MÌ
4,67
6,00
013
,033
,000
2,77
1,22
62,
347
2,72
2,31
417
,760
,259
20,4
82,5
731,
629,
889
2002
(e)
Nor
th S
tar
Mal
lÏÏ
ÏÏÏÏ
ÏÏÏÏ
ÏSan
Ant
onio
, TX
247,
056,
464
29,2
30,0
0046
7,96
0,75
44,
854,
489
Ì29
,230
,000
472,
815,
243
502,
045,
243
17,2
83,5
3420
04(e
)N
orth
Tem
ple
Shop
sÏÏ
ÏÏÏÏ
ÏSal
t Lak
e C
ity,
UT
Ì16
8,00
046
8,00
05,
431
Ì16
7,98
747
3,44
464
1,43
141
,171
2002
(e)
Nor
th T
own
Mal
lÏÏ
ÏÏÏÏ
ÏÏÏÏ
Spo
kane
, W
A78
,673
,605
38,4
45,0
0010
7,33
0,00
04,
943,
491
Ì22
,407
,494
128,
310,
997
150,
718,
491
11,9
19,2
5120
02(e
)N
orth
gate
Mal
lÏÏ
ÏÏÏÏ
ÏÏÏÏ
ÏÏC
hat
tano
oga,
TN
20,7
15,0
382,
524,
869
43,9
43,5
392,
377,
497
4,54
02,
524,
869
46,3
25,5
7748
,850
,446
9,18
9,26
620
03(e
)N
orth
ridg
e Fas
hio
n C
ente
rÏÏ
Nor
thridg
e, C
A13
3,03
9,06
216
,618
,095
149,
562,
583
31,0
20,6
693,
540,
766
16,8
66,3
9718
3,87
5,71
720
0,74
2,11
336
,047
,190
1998
(e)
Oak
Vie
w M
allÏÏ
ÏÏÏÏ
ÏÏÏÏ
ÏÏO
mah
a, N
E77
,427
,333
12,0
56,0
6211
3,04
1,87
13,
180,
889
Ì12
,056
,062
116,
222,
760
128,
278,
823
16,7
40,9
8520
03(e
)O
akwoo
d C
ente
rÏÏ
ÏÏÏÏ
ÏÏÏÏ
ÏG
retn
a, L
AÌ
2,83
0,00
013
7,57
4,06
9(4
9,34
5,21
0)Ì
2,83
0,00
088
,228
,859
91,0
58,8
597,
383,
399
2004
(e)
Oak
woo
d M
allÏ
ÏÏÏÏ
ÏÏÏÏ
ÏÏÏÏ
Eau
Cla
ire,
WI
54,3
45,2
083,
266,
669
18,2
81,1
6024
,958
,511
1,72
3,99
13,
266,
669
44,9
63,6
6248
,230
,331
22,2
22,8
7719
85-1
986
(e)
Ogl
ethor
pe M
all
ÏÏÏÏ
ÏÏÏÏ
ÏÏÏ
Sav
anna
h, G
A14
9,13
4,76
816
,036
,395
92,9
77,5
825,
802,
825
177,
709
16,0
36,3
9598
,958
,116
114,
994,
511
17,5
93,6
9120
03(e
)O
rem
Pla
za C
ente
r Stree
tÏÏ
ÏO
rem
, U
T2,
704,
687
1,06
9,00
02,
974,
000
22,3
11Ì
1,06
8,59
22,
996,
719
4,06
5,31
126
0,34
820
02(e
)O
rem
Pla
za S
tate
Stree
tÏÏ
ÏÏO
rem
, U
T1,
673,
880
592,
000
1,64
9,00
047
,476
Ì59
2,39
61,
696,
080
2,28
8,47
614
5,58
720
02(e
)O
vied
o M
arke
tpla
ceÏÏ
ÏÏÏÏ
ÏÏO
rlan
do, FL
54,5
72,9
6524
,016
,700
23,9
58,4
0454
5,01
2Ì
24,0
16,7
0024
,503
,416
48,5
20,1
163,
206,
138
2004
(e)
Owin
gs M
ills M
all
ÏÏÏÏ
ÏÏÏÏ
ÏO
win
g M
ills, M
D41
,970
,049
26,9
86,2
5017
3,89
6,35
413
,372
,343
109,
008
26,7
35,0
0018
7,62
8,95
521
4,36
3,95
511
,209
,785
2004
(e)
Oxm
oor
Cen
terÏÏ
ÏÏÏÏ
ÏÏÏÏ
ÏÏLou
isvi
lle,
KY
65,0
76,1
55Ì
124,
487,
000
7,39
3,63
2Ì
Ì13
1,88
0,63
213
1,88
0,63
24,
074,
322
2004
(e)
Par
amus
Par
kÏÏ
ÏÏÏÏ
ÏÏÏÏ
ÏÏÏ
Par
amus
, N
J10
9,74
3,31
747
,660
,000
182,
124,
280
819,
125
Ì47
,660
,000
182,
943,
405
230,
603,
405
7,45
5,50
120
04(e
)Par
k C
ity
Cen
terÏ
ÏÏÏÏ
ÏÏÏÏ
ÏÏLan
cast
er, PA
158,
046,
874
8,46
5,14
817
7,19
1,20
59,
379,
326
19,6
818,
465,
148
186,
590,
213
195,
055,
361
32,8
11,1
6620
03(e
)Par
k Pla
ceÏÏ
ÏÏÏÏ
ÏÏÏÏ
ÏÏÏÏ
ÏÏTuc
son,
AZ
186,
316,
855
4,99
6,02
444
,993
,177
97,8
26,2
8413
,523
,774
4,71
5,83
615
6,62
3,42
416
1,33
9,26
028
,903
,088
1996
(e)
Pea
chtree
Mal
lÏÏ
ÏÏÏÏ
ÏÏÏÏ
ÏÏC
olum
bus, G
A94
,358
,571
22,0
51,6
0367
,678
,571
3,81
2,54
9Ì
22,0
51,6
0371
,491
,120
93,5
42,7
236,
326,
978
2003
(e)
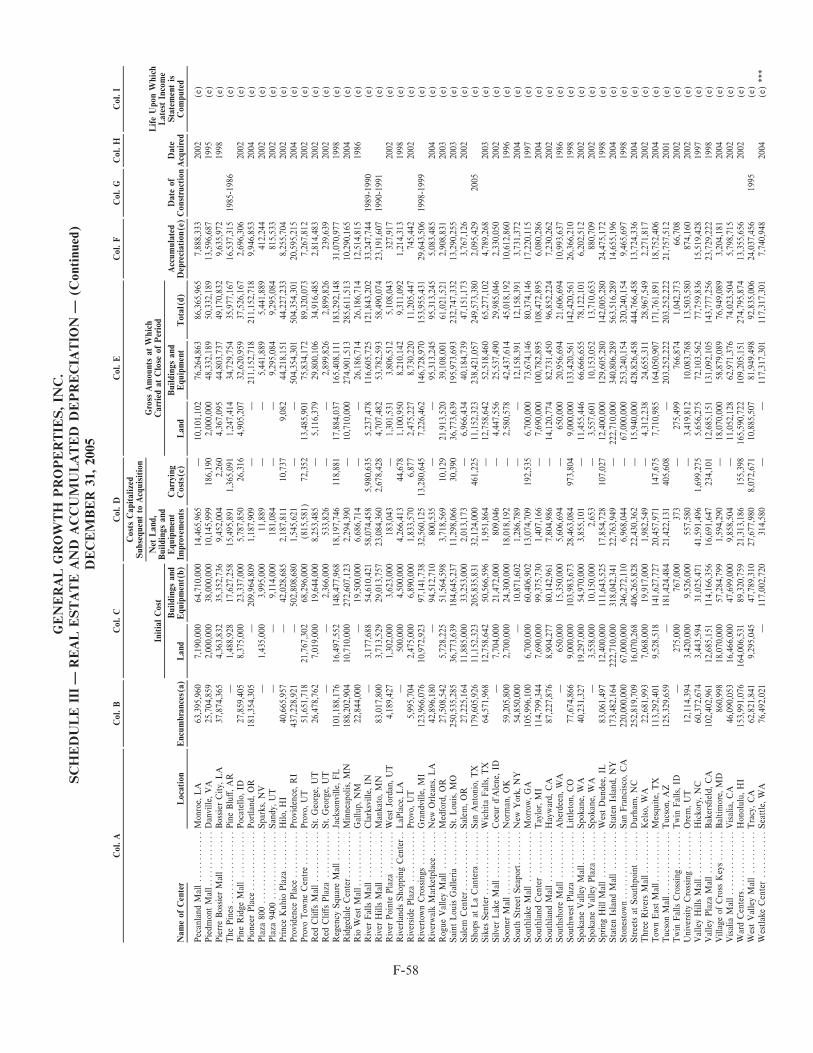
F-58
GEN
ER
AL G
RO
WTH
PR
OPER
TIE
S, IN
C.
SC
HED
ULE I
IIÌ
REAL E
STATE A
ND
AC
CU
MU
LATED
DEPR
EC
IATIO
NÌ
(C
ontinued
)D
EC
EM
BER
31, 2005
Col
. A
Col
. B
Col
. C
Col
. D
Col
. E
Col
. F
Col
. G
Col
. H
Col
. I
Cos
ts C
apital
ized
Subs
equen
t to
Acq
uis
itio
nG
ross
Am
ount
s at
Whic
hN
et L
and,
Life
Upo
n W
hic
hIn
itia
l C
ost
Car
ried
at C
lose
of Per
iod
Buildi
ngs
and
Lat
est In
com
eBuildi
ngs
and
Equ
ipm
ent
Car
ryin
gBuildi
ngs
and
Acc
um
ula
ted
Dat
e of
Dat
eSta
tem
ent is
Nam
e of
Cen
ter
Loc
atio
nEnc
um
bran
ces(
a)Lan
dEqu
ipm
ent(
b)Im
prov
emen
tsC
osts
(c)
Lan
dEqu
ipm
ent
Tot
al(d
)D
epre
ciat
ion(
e)C
onst
ruct
ion
Acq
uired
Com
pute
d
Pec
anla
nd M
allÏÏ
ÏÏÏÏ
ÏÏÏÏ
ÏÏM
onro
e, L
A63
,395
,960
7,19
0,00
064
,710
,000
14,4
65,9
65Ì
10,1
01,1
0276
,264
,863
86,3
65,9
657,
888,
333
2002
(e)
Pie
dmon
t M
allÏ
ÏÏÏÏ
ÏÏÏÏ
ÏÏÏÏ
Dan
ville,
VA
25,7
04,8
592,
000,
000
38,0
00,0
0010
,145
,999
186,
190
2,00
0,00
048
,332
,189
50,3
32,1
8913
,596
,687
1995
(e)
Pie
rre
Bos
sier
Mal
lÏÏÏ
ÏÏÏÏ
ÏÏBos
sier
City,
LA
37,8
74,3
654,
363,
832
35,3
52,7
369,
452,
004
2,26
04,
367,
095
44,8
03,7
3749
,170
,832
9,63
5,97
219
98(e
)The
Pin
esÏÏ
ÏÏÏÏ
ÏÏÏÏ
ÏÏÏÏ
ÏÏÏ
Pin
e Blu
Å, A
RÌ
1,48
8,92
817
,627
,258
15,4
95,8
911,
365,
091
1,24
7,41
434
,729
,754
35,9
77,1
6716
,537
,315
1985
-198
6(e
)Pin
e R
idge
Mal
lÏÏ
ÏÏÏÏ
ÏÏÏÏ
ÏPoc
atel
lo, ID
27,8
59,4
058,
375,
000
23,3
37,0
005,
787,
850
26,3
164,
905,
207
32,6
20,9
5937
,526
,167
2,69
6,30
620
02(e
)Pio
neer
Pla
ceÏÏ
ÏÏÏÏ
ÏÏÏÏ
ÏÏÏÏ
Por
tlan
d, O
R18
1,35
4,30
5Ì
209,
964,
809
1,18
7,90
9Ì
Ì21
1,15
2,71
821
1,15
2,71
89,
946,
853
2004
(e)
Pla
za 8
00ÏÏ
ÏÏÏÏ
ÏÏÏÏ
ÏÏÏÏ
ÏÏÏ
Spa
rks, N
VÌ
1,43
5,00
03,
995,
000
11,8
89Ì
Ì5,
441,
889
5,44
1,88
941
2,24
420
02(e
)Pla
za 9
400
ÏÏÏÏ
ÏÏÏÏ
ÏÏÏÏ
ÏÏÏÏ
San
dy, U
TÌ
Ì9,
114,
000
181,
084
ÌÌ
9,29
5,08
49,
295,
084
815,
533
2002
(e)
Princ
e K
uhio
Pla
zaÏÏ
ÏÏÏÏ
ÏÏÏ
Hilo,
HI
40,6
65,9
57Ì
42,0
28,6
852,
187,
811
10,7
379,
082
44,2
18,1
5144
,227
,233
8,25
5,70
420
02(e
)Pro
vide
nce
Pla
ceÏÏ
ÏÏÏÏ
ÏÏÏÏ
ÏPro
vide
nce,
RI
437,
228,
921
Ì50
2,80
8,68
01,
545,
621
ÌÌ
504,
354,
301
504,
354,
301
20,5
95,2
1520
04(e
)Pro
vo T
owne
Cen
treÏÏ
ÏÏÏÏ
ÏÏPro
vo, U
T51
,651
,718
21,7
67,3
0268
,296
,000
(815
,581
)72
,352
13,4
85,9
0175
,834
,172
89,3
20,0
737,
267,
812
2002
(e)
Red
CliÅs
Mal
lÏÏÏ
ÏÏÏÏ
ÏÏÏÏ
ÏSt. G
eorg
e, U
T26
,478
,762
7,01
9,00
019
,644
,000
8,25
3,48
5Ì
5,11
6,37
929
,800
,106
34,9
16,4
852,
814,
483
2002
(e)
Red
CliÅs
Pla
zaÏÏ
ÏÏÏÏ
ÏÏÏÏ
ÏSt. G
eorg
e, U
TÌ
Ì2,
366,
000
533,
826
ÌÌ
2,89
9,82
62,
899,
826
239,
639
2002
(e)
Reg
ency
Squ
are
Mal
lÏÏÏ
ÏÏÏÏ
Jack
sonv
ille
, FL
101,
188,
176
16,4
97,5
5214
8,47
7,96
818
,197
,746
118,
881
17,8
84,0
3716
5,40
8,11
118
3,29
2,14
831
,070
,977
1998
(e)
Rid
geda
le C
ente
rÏÏÏ
ÏÏÏÏ
ÏÏÏÏ
Min
neap
olis, M
N18
8,20
2,90
410
,710
,000
272,
607,
123
2,29
4,39
0Ì
10,7
10,0
0027
4,90
1,51
328
5,61
1,51
310
,290
,165
2004
(e)
Rio
Wes
t M
allÏ
ÏÏÏÏ
ÏÏÏÏ
ÏÏÏÏ
Gal
lup,
NM
22,8
44,0
00Ì
19,5
00,0
006,
686,
714
ÌÌ
26,1
86,7
1426
,186
,714
12,5
14,8
1519
86(e
)R
iver
Fal
ls M
all
ÏÏÏÏ
ÏÏÏÏ
ÏÏÏ
Cla
rksv
ille
, IN
Ì3,
177,
688
54,6
10,4
2158
,074
,458
5,98
0,63
55,
237,
478
116,
605,
725
121,
843,
202
33,2
47,7
4419
89-1
990
(e)
Riv
er H
ills M
all
ÏÏÏÏ
ÏÏÏÏ
ÏÏÏ
Man
kato
, M
N83
,017
,800
3,71
3,52
929
,013
,757
23,0
84,3
602,
678,
428
4,70
7,48
253
,782
,593
58,4
90,0
7423
,191
,607
1990
-199
1(e
)R
iver
Poi
nte
Pla
zaÏÏ
ÏÏÏÏ
ÏÏÏ
Wes
t Jo
rdan
, U
T4,
189,
427
1,30
2,00
03,
623,
000
183,
043
Ì1,
301,
531
3,80
6,51
25,
108,
043
327,
917
2002
(e)
Riv
erla
nds
Shop
ping
Cen
terÏ
ÏLaP
lace
, LA
Ì50
0,00
04,
500,
000
4,26
6,41
344
,678
1,10
0,95
08,
210,
142
9,31
1,09
21,
214,
313
1998
(e)
Riv
erside
Pla
zaÏÏ
ÏÏÏÏ
ÏÏÏÏ
ÏÏPro
vo, U
T5,
995,
704
2,47
5,00
06,
890,
000
1,83
3,57
06,
877
2,47
5,22
78,
730,
220
11,2
05,4
4774
5,44
220
02(e
)R
iver
town
Cro
ssin
gsÏÏ
ÏÏÏÏ
ÏÏG
rand
ville,
MI
123,
966,
076
10,9
72,9
2397
,141
,738
32,5
60,1
2513
,280
,645
7,22
6,46
214
6,72
8,97
015
3,95
5,43
129
,643
,506
1998
-199
9(e
)R
iver
wal
k M
arke
tpla
ceÏÏ
ÏÏÏÏ
New
Orlea
ns, LA
42,8
96,1
80Ì
94,5
12,7
1080
0,53
5Ì
Ì95
,313
,245
95,3
13,2
455,
083,
485
2004
(e)
Rog
ue V
alle
y M
allÏÏ
ÏÏÏÏ
ÏÏÏ
Med
ford
, O
R27
,508
,542
5,72
8,22
551
,564
,598
3,71
8,56
910
,129
21,9
13,5
2039
,108
,001
61,0
21,5
212,
908,
831
2003
(e)
Sai
nt L
ouis G
alle
ria
ÏÏÏÏ
ÏÏÏÏ
St. L
ouis, M
O25
0,53
5,28
536
,773
,639
184,
645,
237
11,2
98,0
6630
,390
36,7
73,6
3919
5,97
3,69
323
2,74
7,33
213
,290
,255
2003
(e)
Sal
em C
ente
rÏÏÏ
ÏÏÏÏ
ÏÏÏÏ
ÏÏÏ
Sal
em, O
R27
,225
,164
11,8
85,0
0033
,253
,000
2,01
3,17
3Ì
6,96
6,43
440
,184
,739
47,1
51,1
733,
767,
126
2002
(e)
Shop
s at
La
Can
tera
ÏÏÏÏ
ÏÏÏÏ
San
Ant
onio
, TX
179,
605,
926
11,1
52,3
2320
5,83
5,83
132
,124
,000
461,
225
11,1
52,3
2323
8,42
1,05
724
9,57
3,38
02,
095,
429
2005
(e)
Sik
es S
ente
rÏÏÏ
ÏÏÏÏ
ÏÏÏÏ
ÏÏÏÏ
Wic
hita
Fal
ls, TX
64,5
71,9
6812
,758
,642
50,5
66,5
961,
951,
864
Ì12
,758
,642
52,5
18,4
6065
,277
,102
4,78
9,26
820
03(e
)Silve
r Lak
e M
allÏ
ÏÏÏÏ
ÏÏÏÏ
ÏÏC
oeur
d'A
lene
, ID
Ì7,
704,
000
21,4
72,0
0080
9,04
6Ì
4,44
7,55
625
,537
,490
29,9
85,0
462,
330,
050
2002
(e)
Soo
ner
Mal
lÏÏÏ
ÏÏÏÏ
ÏÏÏÏ
ÏÏÏÏ
Nor
man
, O
K59
,205
,800
2,70
0,00
024
,300
,000
18,0
18,1
92Ì
2,58
0,57
842
,437
,614
45,0
18,1
9210
,612
,860
1996
(e)
Sou
th S
tree
t Sea
portÏÏ
ÏÏÏÏ
ÏÏN
ew Y
ork,
NY
54,8
50,0
00Ì
10,8
71,6
021,
286,
789
ÌÌ
12,1
58,3
9112
,158
,391
3,73
1,37
220
04(e
)Sou
thla
ke M
allÏÏ
ÏÏÏÏ
ÏÏÏÏ
ÏÏM
orro
w, G
A10
5,99
6,10
06,
700,
000
60,4
06,9
0213
,074
,709
192,
535
6,70
0,00
073
,674
,146
80,3
74,1
4617
,220
,115
1997
(e)
Sou
thla
nd C
ente
rÏÏ
ÏÏÏÏ
ÏÏÏÏ
Tay
lor, M
I11
4,79
9,34
47,
690,
000
99,3
75,7
301,
407,
166
Ì7,
690,
000
100,
782,
895
108,
472,
895
6,08
0,28
620
04(e
)Sou
thla
nd M
allÏÏ
ÏÏÏÏ
ÏÏÏÏ
ÏÏH
aywar
d, C
A87
,227
,876
8,90
4,27
780
,142
,961
7,80
4,98
6Ì
14,1
20,7
7482
,731
,450
96,8
52,2
247,
230,
262
2002
(e)
Sou
thsh
ore
Mal
lÏÏ
ÏÏÏÏ
ÏÏÏÏ
ÏA
berd
een,
WA
Ì65
0,00
015
,350
,000
5,60
6,69
4Ì
650,
000
20,9
56,6
9421
,606
,694
10,9
93,6
3719
86(e
)Sou
thwes
t Pla
zaÏÏ
ÏÏÏÏ
ÏÏÏÏ
ÏLittlet
on, C
O77
,674
,866
9,00
0,00
010
3,98
3,67
328
,463
,084
973,
804
9,00
0,00
013
3,42
0,56
114
2,42
0,56
126
,366
,210
1998
(e)
Spo
kane
Val
ley
Mal
lÏÏÏ
ÏÏÏÏ
ÏSpo
kane
, W
A40
,231
,327
19,2
97,0
0054
,970
,000
3,85
5,10
1Ì
11,4
55,4
4666
,666
,655
78,1
22,1
016,
202,
512
2002
(e)
Spo
kane
Val
ley
Pla
zaÏÏ
ÏÏÏÏ
ÏSpo
kane
, W
AÌ
3,55
8,00
010
,150
,000
2,65
3Ì
3,55
7,60
110
,153
,052
13,7
10,6
5388
0,70
920
02(e
)Spr
ing
Hill M
allÏÏ
ÏÏÏÏ
ÏÏÏÏ
ÏW
est D
unde
e, I
L83
,061
,497
12,4
00,0
0011
1,64
3,52
517
,854
,728
107,
027
12,4
00,0
0012
9,60
5,28
014
2,00
5,28
024
,475
,172
1998
(e)
Sta
ten
Isla
nd M
all
ÏÏÏÏ
ÏÏÏÏ
ÏSta
ten
Isla
nd, N
Y17
3,48
2,16
422
2,71
0,00
031
8,04
2,34
122
,763
,949
Ì22
2,71
0,00
034
0,80
6,28
956
3,51
6,28
914
,655
,196
2004
(e)
Sto
nest
ownÏÏ
ÏÏÏÏ
ÏÏÏÏ
ÏÏÏÏ
ÏÏSan
Fra
ncisco
, C
A22
0,00
0,00
067
,000
,000
246,
272,
110
6,96
8,04
4Ì
67,0
00,0
0025
3,24
0,15
432
0,24
0,15
49,
465,
697
1998
(e)
Stree
ts a
t Sou
thpo
int
ÏÏÏÏ
ÏÏÏ
Dur
ham
, N
C25
2,81
9,70
916
,070
,268
406,
265,
828
22,4
30,3
62Ì
15,9
40,0
0042
8,82
6,45
844
4,76
6,45
813
,724
,336
2004
(e)
Thre
e R
iver
s M
allÏ
ÏÏÏÏ
ÏÏÏÏ
ÏK
elso
, W
A22
,681
,993
7,06
8,00
019
,917
,000
1,98
2,54
9Ì
4,31
2,23
824
,655
,311
28,9
67,5
492,
271,
817
2002
(e)
Tow
n Eas
t M
allÏ
ÏÏÏÏ
ÏÏÏÏ
ÏÏÏ
Mes
quite,
TX
113,
292,
401
9,52
8,51
814
1,62
7,72
720
,457
,971
147,
675
7,71
0,98
516
4,05
0,90
717
1,76
1,89
118
,752
,406
2004
(e)
Tuc
son
Mal
lÏÏÏ
ÏÏÏÏ
ÏÏÏÏ
ÏÏÏÏ
Tuc
son,
AZ
125,
329,
659
Ì18
1,42
4,48
421
,422
,131
405,
608
Ì20
3,25
2,22
220
3,25
2,22
221
,757
,512
2001
(e)
Twin
Fal
ls C
ross
ingÏ
ÏÏÏÏ
ÏÏÏÏ
Twin
Fal
ls, ID
Ì27
5,00
076
7,00
037
3Ì
275,
499
766,
874
1,04
2,37
366
,708
2002
(e)
Uni
vers
ity
Cro
ssin
gÏÏ
ÏÏÏÏ
ÏÏÏ
Ore
m, U
T12
,114
,394
3,42
0,00
09,
526,
000
557,
580
Ì3,
419,
812
10,0
83,7
6813
,503
,580
874,
160
2002
(e)
Val
ley
Hills M
allÏ
ÏÏÏÏ
ÏÏÏÏ
ÏÏH
icko
ry, N
C60
,372
,674
3,44
3,59
431
,025
,471
41,5
91,4
961,
699,
275
5,65
6,27
572
,103
,562
77,7
59,8
3615
,519
,428
1997
(e)
Val
ley
Pla
za M
allÏÏ
ÏÏÏÏ
ÏÏÏÏ
Bak
ersÑ
eld,
CA
102,
402,
961
12,6
85,1
5111
4,16
6,35
616
,691
,647
234,
101
12,6
85,1
5113
1,09
2,10
514
3,77
7,25
623
,729
,222
1998
(e)
Villa
ge o
f C
ross
Key
sÏÏ
ÏÏÏÏ
ÏBal
tim
ore,
MD
860,
998
18,0
70,0
0057
,284
,799
1,59
4,29
0Ì
18,0
70,0
0058
,879
,089
76,9
49,0
893,
204,
181
2004
(e)
Visal
ia M
allÏ
ÏÏÏÏ
ÏÏÏÏ
ÏÏÏÏ
ÏÏV
isal
ia, C
A46
,090
,053
16,4
66,0
0047
,699
,000
9,85
8,50
4Ì
11,0
52,1
2862
,971
,376
74,0
23,5
045,
798,
715
2002
(e)
War
d C
ente
rsÏÏ
ÏÏÏÏ
ÏÏÏÏ
ÏÏÏÏ
Hon
olul
u, H
I15
3,99
1,07
616
4,00
6,53
189
,320
,759
21,3
13,1
8615
5,39
816
5,59
0,72
210
9,20
5,15
127
4,79
5,87
413
,355
,656
2002
(e)
Wes
t V
alle
y M
allÏÏ
ÏÏÏÏ
ÏÏÏÏ
Tra
cy, C
A62
,821
,841
9,29
5,04
547
,789
,310
27,6
77,9
808,
072,
671
10,8
85,5
0781
,949
,498
92,8
35,0
0624
,037
,456
1995
(e)
Wes
tlak
e C
ente
rÏÏ
ÏÏÏÏ
ÏÏÏÏ
ÏSea
ttle
, W
A76
,492
,021
Ì11
7,00
2,72
031
4,58
0Ì
Ì11
7,31
7,30
111
7,31
7,30
17,
740,
948
2004
(e)
***
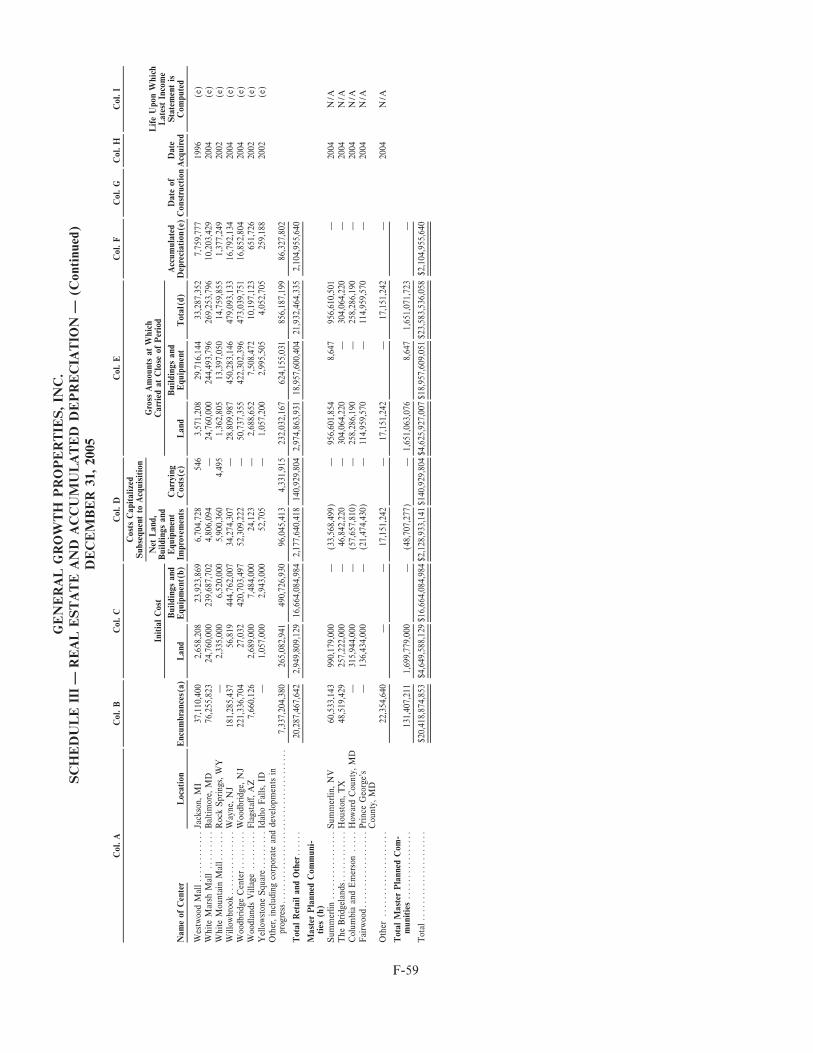
F-59
GEN
ER
AL G
RO
WTH
PR
OPER
TIE
S, IN
C.
SC
HED
ULE I
IIÌ
REAL E
STATE A
ND
AC
CU
MU
LATED
DEPR
EC
IATIO
NÌ
(C
ontinued
)D
EC
EM
BER
31, 2005
Col
. A
Col
. B
Col
. C
Col
. D
Col
. E
Col
. F
Col
. G
Col
. H
Col
. I
Cos
ts C
apital
ized
Subs
equen
t to
Acq
uis
itio
nG
ross
Am
ount
s at
Whic
hN
et L
and,
Life
Upo
n W
hic
hIn
itia
l C
ost
Car
ried
at C
lose
of Per
iod
Buildi
ngs
and
Lat
est In
com
eBuildi
ngs
and
Equ
ipm
ent
Car
ryin
gBuildi
ngs
and
Acc
um
ula
ted
Dat
e of
Dat
eSta
tem
ent is
Nam
e of
Cen
ter
Loc
atio
nEnc
um
bran
ces(
a)Lan
dEqu
ipm
ent(
b)Im
prov
emen
tsC
osts
(c)
Lan
dEqu
ipm
ent
Tot
al(d
)D
epre
ciat
ion(
e)C
onst
ruct
ion
Acq
uired
Com
pute
d
Wes
twoo
d M
allÏ
ÏÏÏÏ
ÏÏÏÏ
ÏÏÏ
Jack
son,
MI
37,1
10,4
002,
658,
208
23,9
23,8
696,
704,
728
546
3,57
1,20
829
,716
,144
33,2
87,3
527,
759,
777
1996
(e)
White
Mar
sh M
all
ÏÏÏÏ
ÏÏÏÏ
ÏBal
tim
ore,
MD
76,2
55,8
2324
,760
,000
239,
687,
702
4,80
6,09
4Ì
24,7
60,0
0024
4,49
3,79
626
9,25
3,79
610
,203
,429
2004
(e)
White
Mou
ntai
n M
allÏ
ÏÏÏÏ
ÏÏR
ock
Spr
ings
, W
YÌ
2,33
5,00
06,
520,
000
5,90
0,36
04,
495
1,36
2,80
513
,397
,050
14,7
59,8
551,
377,
249
2002
(e)
Willo
wbr
ookÏÏ
ÏÏÏÏ
ÏÏÏÏ
ÏÏÏÏ
ÏW
ayne
, N
J18
1,28
5,43
756
,819
444,
762,
007
34,2
74,3
07Ì
28,8
09,9
8745
0,28
3,14
647
9,09
3,13
316
,792
,134
2004
(e)
Woo
dbridg
e C
ente
rÏÏÏ
ÏÏÏÏ
ÏÏW
oodb
ridg
e, N
J22
1,33
6,70
427
,032
420,
703,
497
52,3
09,2
22Ì
50,7
37,3
5542
2,30
2,39
647
3,03
9,75
116
,852
,804
2004
(e)
Woo
dlan
ds V
illa
geÏÏ
ÏÏÏÏ
ÏÏÏ
Fla
gsta
Å, A
Z7,
660,
126
2,68
9,00
07,
484,
000
24,1
23Ì
2,68
8,65
27,
508,
472
10,1
97,1
2365
1,72
620
02(e
)Y
ello
wst
one
Squ
areÏ
ÏÏÏÏ
ÏÏÏÏ
Idah
o Fal
ls, ID
Ì1,
057,
000
2,94
3,00
052
,705
Ì1,
057,
200
2,99
5,50
54,
052,
705
259,
188
2002
(e)
Oth
er, in
clud
ing
corp
orat
e an
d de
velo
pmen
ts in
prog
ress
ÏÏÏÏ
ÏÏÏÏ
ÏÏÏÏ
ÏÏÏÏ
ÏÏÏÏ
ÏÏÏÏ
ÏÏÏÏ
ÏÏÏÏ
ÏÏÏÏ
7,33
7,20
4,38
026
5,08
2,94
149
0,72
6,93
096
,045
,413
4,33
1,91
523
2,03
2,16
762
4,15
5,03
185
6,18
7,19
986
,327
,802
Tot
al R
etai
l an
d O
ther
ÏÏÏÏ
ÏÏ20
,287
,467
,642
2,94
9,80
9,12
916
,664
,084
,984
2,17
7,64
0,41
814
0,92
9,80
42,
974,
863,
931
18,9
57,6
00,4
0421
,932
,464
,335
2,10
4,95
5,64
0
Mas
ter
Pla
nned
Com
muni
-ties
(h)
Sum
mer
lin
ÏÏÏÏ
ÏÏÏÏ
ÏÏÏÏ
ÏÏÏÏ
Sum
mer
lin,
NV
60,5
33,1
4399
0,17
9,00
0Ì
(33,
568,
499)
Ì95
6,60
1,85
48,
647
956,
610,
501
Ì20
04N
/AThe
Bridg
elan
dsÏÏ
ÏÏÏÏ
ÏÏÏÏ
ÏÏH
oust
on, TX
48,5
19,4
2925
7,22
2,00
0Ì
46,8
42,2
20Ì
304,
064,
220
Ì30
4,06
4,22
0Ì
2004
N/A
Col
umbi
a an
d Em
erso
nÏÏ
ÏÏÏ
How
ard
Cou
nty,
MD
Ì31
5,94
4,00
0Ì
(57,
657,
810)
Ì25
8,28
6,19
0Ì
258,
286,
190
Ì20
04N
/AFai
rwoo
dÏÏ
ÏÏÏÏ
ÏÏÏÏ
ÏÏÏÏ
ÏÏÏÏ
Princ
e G
eorg
e's
Ì13
6,43
4,00
0Ì
(21,
474,
430)
Ì11
4,95
9,57
0Ì
114,
959,
570
Ì20
04N
/AC
ount
y, M
DO
ther
ÏÏÏÏ
ÏÏÏÏ
ÏÏÏÏ
ÏÏÏÏ
ÏÏÏÏ
22,3
54,6
40Ì
Ì17
,151
,242
Ì17
,151
,242
Ì17
,151
,242
Ì20
04N
/A
Tot
al M
aste
r Pla
nned
Com
-m
uni
ties
ÏÏÏÏ
ÏÏÏÏ
ÏÏÏÏ
ÏÏÏÏ
131,
407,
211
1,69
9,77
9,00
0Ì
(48,
707,
277)
Ì1,
651,
063,
076
8,64
71,
651,
071,
723
Ì
Tot
alÏÏ
ÏÏÏÏ
ÏÏÏÏ
ÏÏÏÏ
ÏÏÏÏ
ÏÏÏ
$20,
418,
874,
853
$4,6
49,5
88,1
29$1
6,66
4,08
4,98
4$2
,128
,933
,141
$140
,929
,804
$4,6
25,9
27,0
07$1
8,95
7,60
9,05
1$2
3,58
3,53
6,05
8$2
,104
,955
,640
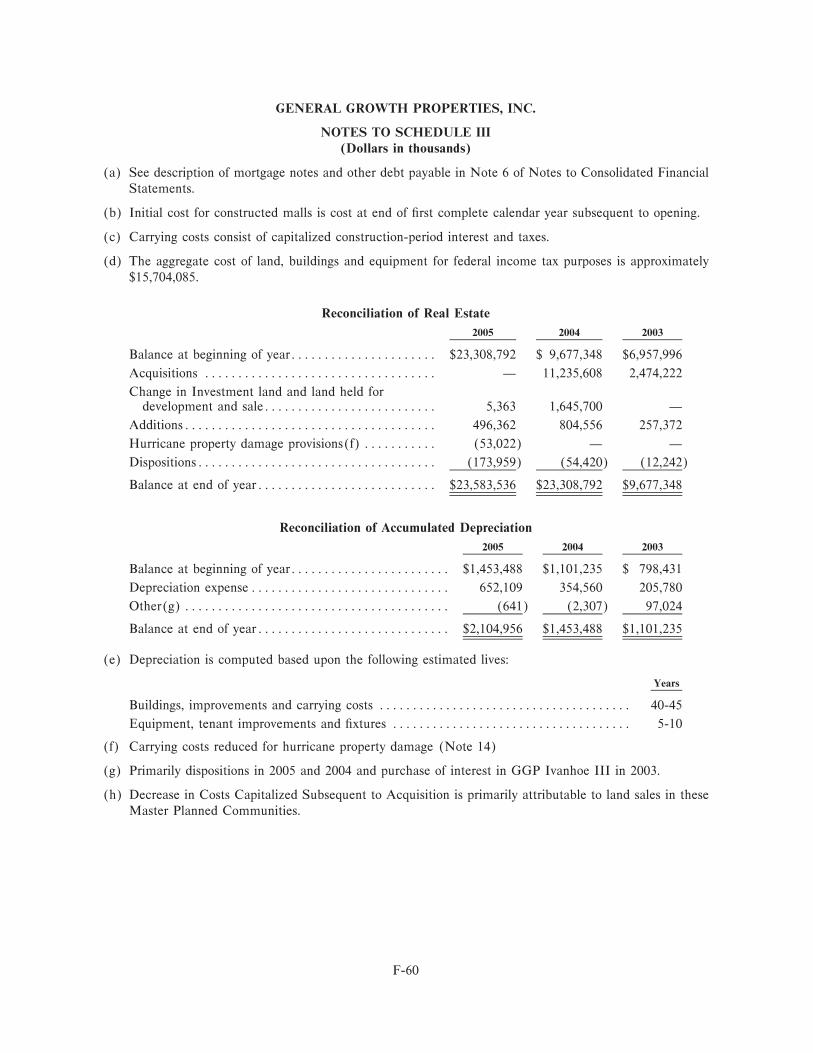
GENERAL GROWTH PROPERTIES, INC.
NOTES TO SCHEDULE III(Dollars in thousands)
(a) See description of mortgage notes and other debt payable in Note 6 of Notes to Consolidated FinancialStatements.
(b) Initial cost for constructed malls is cost at end of Ñrst complete calendar year subsequent to opening.
(c) Carrying costs consist of capitalized construction-period interest and taxes.
(d) The aggregate cost of land, buildings and equipment for federal income tax purposes is approximately$15,704,085.
Reconciliation of Real Estate
2005 2004 2003
Balance at beginning of yearÏÏÏÏÏÏÏÏÏÏÏÏÏÏÏÏÏÏÏÏÏÏ $23,308,792 $ 9,677,348 $6,957,996
Acquisitions ÏÏÏÏÏÏÏÏÏÏÏÏÏÏÏÏÏÏÏÏÏÏÏÏÏÏÏÏÏÏÏÏÏÏÏ Ì 11,235,608 2,474,222
Change in Investment land and land held fordevelopment and saleÏÏÏÏÏÏÏÏÏÏÏÏÏÏÏÏÏÏÏÏÏÏÏÏÏÏ 5,363 1,645,700 Ì
AdditionsÏÏÏÏÏÏÏÏÏÏÏÏÏÏÏÏÏÏÏÏÏÏÏÏÏÏÏÏÏÏÏÏÏÏÏÏÏÏ 496,362 804,556 257,372
Hurricane property damage provisions(f) ÏÏÏÏÏÏÏÏÏÏÏ (53,022) Ì Ì
DispositionsÏÏÏÏÏÏÏÏÏÏÏÏÏÏÏÏÏÏÏÏÏÏÏÏÏÏÏÏÏÏÏÏÏÏÏÏ (173,959) (54,420) (12,242)
Balance at end of yearÏÏÏÏÏÏÏÏÏÏÏÏÏÏÏÏÏÏÏÏÏÏÏÏÏÏÏ $23,583,536 $23,308,792 $9,677,348
Reconciliation of Accumulated Depreciation
2005 2004 2003
Balance at beginning of yearÏÏÏÏÏÏÏÏÏÏÏÏÏÏÏÏÏÏÏÏÏÏÏÏ $1,453,488 $1,101,235 $ 798,431
Depreciation expenseÏÏÏÏÏÏÏÏÏÏÏÏÏÏÏÏÏÏÏÏÏÏÏÏÏÏÏÏÏÏ 652,109 354,560 205,780
Other(g) ÏÏÏÏÏÏÏÏÏÏÏÏÏÏÏÏÏÏÏÏÏÏÏÏÏÏÏÏÏÏÏÏÏÏÏÏÏÏÏÏ (641) (2,307) 97,024
Balance at end of yearÏÏÏÏÏÏÏÏÏÏÏÏÏÏÏÏÏÏÏÏÏÏÏÏÏÏÏÏÏ $2,104,956 $1,453,488 $1,101,235
(e) Depreciation is computed based upon the following estimated lives:
Years
Buildings, improvements and carrying costs ÏÏÏÏÏÏÏÏÏÏÏÏÏÏÏÏÏÏÏÏÏÏÏÏÏÏÏÏÏÏÏÏÏÏÏÏÏÏ 40-45
Equipment, tenant improvements and Ñxtures ÏÏÏÏÏÏÏÏÏÏÏÏÏÏÏÏÏÏÏÏÏÏÏÏÏÏÏÏÏÏÏÏÏÏÏÏ 5-10
(f) Carrying costs reduced for hurricane property damage (Note 14)
(g) Primarily dispositions in 2005 and 2004 and purchase of interest in GGP Ivanhoe III in 2003.
(h) Decrease in Costs Capitalized Subsequent to Acquisition is primarily attributable to land sales in theseMaster Planned Communities.
F-60
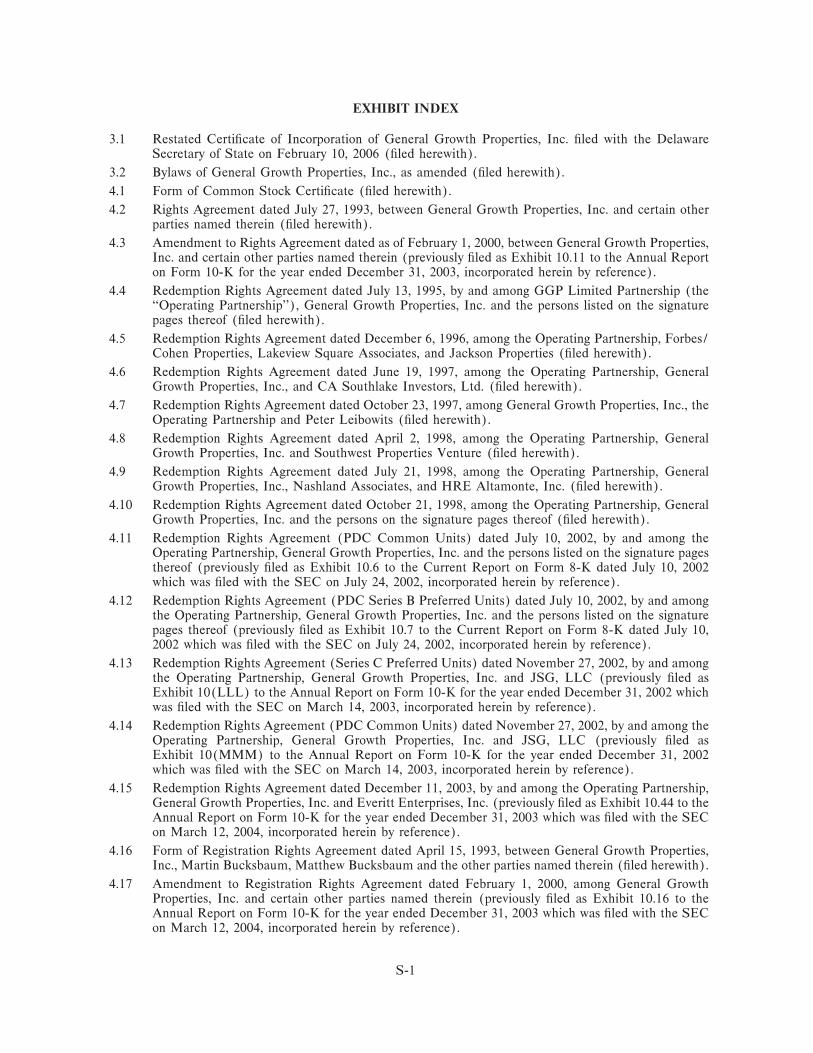
EXHIBIT INDEX
3.1 Restated CertiÑcate of Incorporation of General Growth Properties, Inc. Ñled with the DelawareSecretary of State on February 10, 2006 (Ñled herewith).
3.2 Bylaws of General Growth Properties, Inc., as amended (Ñled herewith).
4.1 Form of Common Stock CertiÑcate (Ñled herewith).
4.2 Rights Agreement dated July 27, 1993, between General Growth Properties, Inc. and certain otherparties named therein (Ñled herewith).
4.3 Amendment to Rights Agreement dated as of February 1, 2000, between General Growth Properties,Inc. and certain other parties named therein (previously Ñled as Exhibit 10.11 to the Annual Reporton Form 10-K for the year ended December 31, 2003, incorporated herein by reference).
4.4 Redemption Rights Agreement dated July 13, 1995, by and among GGP Limited Partnership (the""Operating Partnership''), General Growth Properties, Inc. and the persons listed on the signaturepages thereof (Ñled herewith).
4.5 Redemption Rights Agreement dated December 6, 1996, among the Operating Partnership, Forbes/Cohen Properties, Lakeview Square Associates, and Jackson Properties (Ñled herewith).
4.6 Redemption Rights Agreement dated June 19, 1997, among the Operating Partnership, GeneralGrowth Properties, Inc., and CA Southlake Investors, Ltd. (Ñled herewith).
4.7 Redemption Rights Agreement dated October 23, 1997, among General Growth Properties, Inc., theOperating Partnership and Peter Leibowits (Ñled herewith).
4.8 Redemption Rights Agreement dated April 2, 1998, among the Operating Partnership, GeneralGrowth Properties, Inc. and Southwest Properties Venture (Ñled herewith).
4.9 Redemption Rights Agreement dated July 21, 1998, among the Operating Partnership, GeneralGrowth Properties, Inc., Nashland Associates, and HRE Altamonte, Inc. (Ñled herewith).
4.10 Redemption Rights Agreement dated October 21, 1998, among the Operating Partnership, GeneralGrowth Properties, Inc. and the persons on the signature pages thereof (Ñled herewith).
4.11 Redemption Rights Agreement (PDC Common Units) dated July 10, 2002, by and among theOperating Partnership, General Growth Properties, Inc. and the persons listed on the signature pagesthereof (previously Ñled as Exhibit 10.6 to the Current Report on Form 8-K dated July 10, 2002which was Ñled with the SEC on July 24, 2002, incorporated herein by reference).
4.12 Redemption Rights Agreement (PDC Series B Preferred Units) dated July 10, 2002, by and amongthe Operating Partnership, General Growth Properties, Inc. and the persons listed on the signaturepages thereof (previously Ñled as Exhibit 10.7 to the Current Report on Form 8-K dated July 10,2002 which was Ñled with the SEC on July 24, 2002, incorporated herein by reference).
4.13 Redemption Rights Agreement (Series C Preferred Units) dated November 27, 2002, by and amongthe Operating Partnership, General Growth Properties, Inc. and JSG, LLC (previously Ñled asExhibit 10(LLL) to the Annual Report on Form 10-K for the year ended December 31, 2002 whichwas Ñled with the SEC on March 14, 2003, incorporated herein by reference).
4.14 Redemption Rights Agreement (PDC Common Units) dated November 27, 2002, by and among theOperating Partnership, General Growth Properties, Inc. and JSG, LLC (previously Ñled asExhibit 10(MMM) to the Annual Report on Form 10-K for the year ended December 31, 2002which was Ñled with the SEC on March 14, 2003, incorporated herein by reference).
4.15 Redemption Rights Agreement dated December 11, 2003, by and among the Operating Partnership,General Growth Properties, Inc. and Everitt Enterprises, Inc. (previously Ñled as Exhibit 10.44 to theAnnual Report on Form 10-K for the year ended December 31, 2003 which was Ñled with the SECon March 12, 2004, incorporated herein by reference).
4.16 Form of Registration Rights Agreement dated April 15, 1993, between General Growth Properties,Inc., Martin Bucksbaum, Matthew Bucksbaum and the other parties named therein (Ñled herewith).
4.17 Amendment to Registration Rights Agreement dated February 1, 2000, among General GrowthProperties, Inc. and certain other parties named therein (previously Ñled as Exhibit 10.16 to theAnnual Report on Form 10-K for the year ended December 31, 2003 which was Ñled with the SECon March 12, 2004, incorporated herein by reference).
S-1
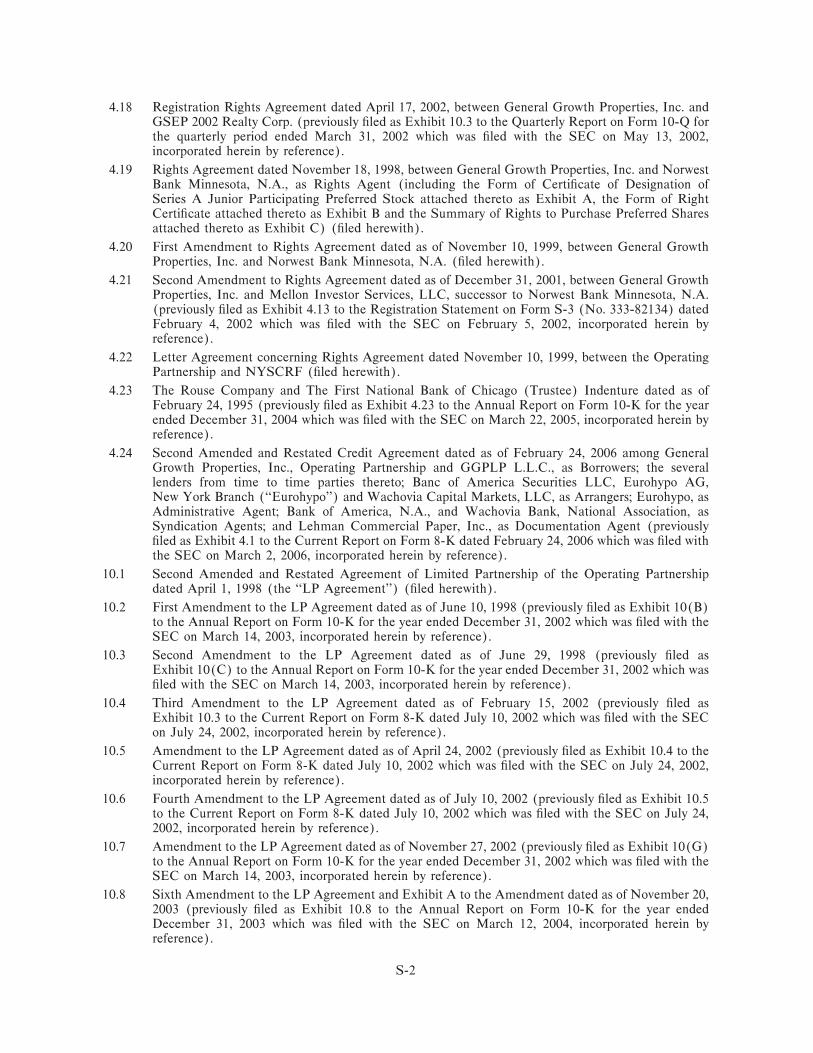
4.18 Registration Rights Agreement dated April 17, 2002, between General Growth Properties, Inc. andGSEP 2002 Realty Corp. (previously Ñled as Exhibit 10.3 to the Quarterly Report on Form 10-Q forthe quarterly period ended March 31, 2002 which was Ñled with the SEC on May 13, 2002,incorporated herein by reference).
4.19 Rights Agreement dated November 18, 1998, between General Growth Properties, Inc. and NorwestBank Minnesota, N.A., as Rights Agent (including the Form of CertiÑcate of Designation ofSeries A Junior Participating Preferred Stock attached thereto as Exhibit A, the Form of RightCertiÑcate attached thereto as Exhibit B and the Summary of Rights to Purchase Preferred Sharesattached thereto as Exhibit C) (Ñled herewith).
4.20 First Amendment to Rights Agreement dated as of November 10, 1999, between General GrowthProperties, Inc. and Norwest Bank Minnesota, N.A. (Ñled herewith).
4.21 Second Amendment to Rights Agreement dated as of December 31, 2001, between General GrowthProperties, Inc. and Mellon Investor Services, LLC, successor to Norwest Bank Minnesota, N.A.(previously Ñled as Exhibit 4.13 to the Registration Statement on Form S-3 (No. 333-82134) datedFebruary 4, 2002 which was Ñled with the SEC on February 5, 2002, incorporated herein byreference).
4.22 Letter Agreement concerning Rights Agreement dated November 10, 1999, between the OperatingPartnership and NYSCRF (Ñled herewith).
4.23 The Rouse Company and The First National Bank of Chicago (Trustee) Indenture dated as ofFebruary 24, 1995 (previously Ñled as Exhibit 4.23 to the Annual Report on Form 10-K for the yearended December 31, 2004 which was Ñled with the SEC on March 22, 2005, incorporated herein byreference).
4.24 Second Amended and Restated Credit Agreement dated as of February 24, 2006 among GeneralGrowth Properties, Inc., Operating Partnership and GGPLP L.L.C., as Borrowers; the severallenders from time to time parties thereto; Banc of America Securities LLC, Eurohypo AG,New York Branch (""Eurohypo'') and Wachovia Capital Markets, LLC, as Arrangers; Eurohypo, asAdministrative Agent; Bank of America, N.A., and Wachovia Bank, National Association, asSyndication Agents; and Lehman Commercial Paper, Inc., as Documentation Agent (previouslyÑled as Exhibit 4.1 to the Current Report on Form 8-K dated February 24, 2006 which was Ñled withthe SEC on March 2, 2006, incorporated herein by reference).
10.1 Second Amended and Restated Agreement of Limited Partnership of the Operating Partnershipdated April 1, 1998 (the ""LP Agreement'') (Ñled herewith).
10.2 First Amendment to the LP Agreement dated as of June 10, 1998 (previously Ñled as Exhibit 10(B)to the Annual Report on Form 10-K for the year ended December 31, 2002 which was Ñled with theSEC on March 14, 2003, incorporated herein by reference).
10.3 Second Amendment to the LP Agreement dated as of June 29, 1998 (previously Ñled asExhibit 10(C) to the Annual Report on Form 10-K for the year ended December 31, 2002 which wasÑled with the SEC on March 14, 2003, incorporated herein by reference).
10.4 Third Amendment to the LP Agreement dated as of February 15, 2002 (previously Ñled asExhibit 10.3 to the Current Report on Form 8-K dated July 10, 2002 which was Ñled with the SECon July 24, 2002, incorporated herein by reference).
10.5 Amendment to the LP Agreement dated as of April 24, 2002 (previously Ñled as Exhibit 10.4 to theCurrent Report on Form 8-K dated July 10, 2002 which was Ñled with the SEC on July 24, 2002,incorporated herein by reference).
10.6 Fourth Amendment to the LP Agreement dated as of July 10, 2002 (previously Ñled as Exhibit 10.5to the Current Report on Form 8-K dated July 10, 2002 which was Ñled with the SEC on July 24,2002, incorporated herein by reference).
10.7 Amendment to the LP Agreement dated as of November 27, 2002 (previously Ñled as Exhibit 10(G)to the Annual Report on Form 10-K for the year ended December 31, 2002 which was Ñled with theSEC on March 14, 2003, incorporated herein by reference).
10.8 Sixth Amendment to the LP Agreement and Exhibit A to the Amendment dated as of November 20,2003 (previously Ñled as Exhibit 10.8 to the Annual Report on Form 10-K for the year endedDecember 31, 2003 which was Ñled with the SEC on March 12, 2004, incorporated herein byreference).
S-2
10.9 Amendment to the LP Agreement and Exhibit A to the Amendment dated as of December 11, 2003(previously Ñled as an Exhibit 10.9 to the Annual Report on Form 10-K for the year endedDecember 31, 2003 which was Ñled with the SEC on March 12, 2004, incorporated herein byreference).
10.10 Amendment to the LP Agreement dated November 12, 2004 (previously Ñled as Exhibit 10.3 to theCurrent Report on Form 8-K/A dated November 12, 2004 which was Ñled with the SEC onNovember 18, 2004, incorporated herein by reference).
10.11 Second Amended and Restated Operating Agreement of GGPLP L.L.C. dated April 17, 2002 (the""LLC Agreement'') (previously Ñled as Exhibit 10.1 to the Quarterly Report on Form 10-Q for thequarterly period ended March 31, 2002 which was Ñled with the SEC on May 13, 2002, incorporatedherein by reference).
10.12 First Amendment to the LLC Agreement dated April 23, 2002 (previously Ñled as Exhibit 10.2 tothe Quarterly Report on Form 10-Q for the quarterly period ended March 31, 2002 which was Ñledwith the SEC on May 13, 2002, incorporated herein by reference).
10.13 Second Amendment to the LLC Agreement dated May 13, 2002 (previously Ñled as Exhibit 10.1 tothe Quarterly Report on Form 10-Q for the quarterly period ended June 30, 2002 which was Ñledwith the SEC on August 13, 2002, incorporated herein by reference).
10.14 Third Amendment to the LLC Agreement dated October 30, 2002 (previously Ñled as Ex-hibit 10(Y) to the Annual Report on Form 10-K for the year ended December 31, 2002 which wasÑled with the SEC on March 14, 2003, incorporated herein by reference).
10.15 Fourth Amendment to the LLC Agreement dated April 7, 2003 (previously Ñled as Exhibit 10.1 tothe Quarterly Report on Form 10-Q for the quarterly period ended March 31, 2003 which was Ñledwith the SEC on May 9, 2003, incorporated herein by reference).
10.16 Fifth Amendment to the LLC Agreement dated April 11, 2003 (previously Ñled as Exhibit 10.2 tothe Quarterly Report on Form 10-Q for the quarterly period ended March 31, 2003 which was Ñledwith the SEC on May 9, 2003, incorporated herein by reference).
10.17 Sixth Amendment to the LLC Agreement dated November 12, 2004 (previously Ñled as Ex-hibit 10.2 to the Current Report on Form 8-K/A dated November 12, 2004 which was Ñled with theSEC on November 18, 2004, incorporated herein by reference).
10.18 Stockholders Agreement dated December 20, 1995, among GGP/Homart, Inc., Operating Partner-ship, The Comptroller of the State of New York, As Trustee of the Common Retirement Fund(""NYSCRF''), Equitable Life Insurance Company of Iowa, USG Annuity & Life Company,Trustees of the University of Pennsylvania and General Growth Properties (Ñled herewith).
10.19 First Amendment to Stockholders Agreement dated September 10, 1996 (Ñled herewith).
10.20 Operating Agreement dated November 10, 1999, between the Operating Partnership, NYSCRF, andGGP/Homart II L.L.C. (Ñled herewith).
10.21 Amendment to the Operating Agreement of GGP/Homart II L.L.C. dated November 22, 2002(Ñled herewith).
10.22 Letter Amendment to the Operating Agreement of GGP/Homart II L.L.C. dated January 31, 2003(Ñled herewith).
10.23 Second Amendment to the Operating Agreement of GGP/Homart II L.L.C. dated January 31, 2003(Ñled herewith).
10.24 Amended and Restated Operating Agreement of GGP-TRS L.L.C. dated August 26, 2002, betweenthe Operating Partnership, Teachers' Retirement System of the State of Illinois and GGP-TRSL.L.C. (Ñled herewith).
10.25 First Amendment to Amended and Restated Operating Agreement of GGP-TRS L.L.C. datedDecember 19, 2002 (Ñled herewith).
10.26 Second Amendment to Amended and Restated Operating Agreement of GGP-TRS L.L.C. datedNovember 1, 2005 (Ñled herewith).
10.27* General Growth Properties, Inc. 1998 Incentive Stock Plan, as amended (previously Ñled asExhibit 10.1 to the Quarterly Report on Form 10-Q for the quarterly period ended June 30, 2005which was Ñled with the SEC on August 8, 2005, incorporated herein by reference).
S-3
10.28* Form of Option Agreement pursuant to 1998 Incentive Stock Plan (previously Ñled as Exhibit 10.47to the Annual Report on Form 10-K for the year ended December 31, 2004 which was Ñled with theSEC on March 22, 2005, incorporated herein by reference).
10.29* General Growth Properties, Inc. 2003 Incentive Stock Plan (previously Ñled as Exhibit 4.1 to theRegistration Statement (333-105882) on Form S-8 dated June 5, 2003 which was Ñled with the SECon June 6, 2003, incorporated herein by reference).
10.30* Form of Option Agreement pursuant to 2003 Incentive Stock Plan (previously Ñled as Exhibit 10.48to the Annual Report on Form 10-K for the year ended December 31, 2004 which was Ñled with theSEC on March 22, 2005, incorporated herein by reference).
10.31* Form of Restricted Stock Agreement pursuant to 2003 Incentive Stock Plan (Ñled herewith).
10.32* Summary of Non-Employee Director Compensation Program (previously Ñled as Exhibit 10.1 to theCurrent Report on Form 8-K dated July 26, 2005 which was Ñled with the SEC on July 28, 2005,incorporated herein by reference).
10.33 Form of Contingent Stock Agreement, eÅective January 1, 1996, by The Rouse Company and infavor of and for the beneÑt of the Holders and the Representatives (as deÑned therein) (previouslyÑled as Exhibit 99.1 to the Registration Statement on Form S-3/A (No. 333-120373) which wasÑled with the SEC on December 23, 2004, incorporated herein by reference).
10.34 Assumption Agreement dated October 19, 2004 by General Growth Properties, Inc. and The RouseCompany in favor of and for the beneÑt of the Holders and the Representatives (as deÑned therein)(previously Ñled as Exhibit 99.2 to the Registration Statement on Form S-3/A (No. 333-120373)which was Ñled with the SEC on December 23, 2004, incorporated herein by reference).
10.35 Agreement and Plan of Merger by and Among The Rouse Company, General Growth Properties,Inc. and Red Acquisition, LLC dated as of August 19, 2004 (previously Ñled as Exhibit 2.1 to ourCurrent Report on Form 8-K/A dated August 20, 2004 which was Ñled with the SEC on August 24,2004, incorporated herein by reference).
21 List of Subsidiaries (Ñled herewith).
23.1 Consent of Deloitte & Touche LLP (Ñled herewith).
23.2 Consent of KPMG LLP (Ñled herewith).
31.1 CertiÑcation of Chief Executive OÇcer Pursuant to Section 302 of the Sarbanes-Oxley Act of 2002(Ñled herewith).
31.2 CertiÑcation of Chief Financial OÇcer Pursuant to Section 302 of the Sarbanes-Oxley Act of 2002(Ñled herewith).
32.1 CertiÑcation of Chief Executive OÇcer Pursuant to Section 906 of the Sarbanes-Oxley Act of 2002(Ñled herewith).
32.2 CertiÑcation of Chief Financial OÇcer Pursuant to Section 906 of the Sarbanes-Oxley Act of 2002(Ñled herewith).
(*) A compensatory plan or arrangement required to be Ñled.
Pursuant to Item 601(b)(4)(iii) of Regulation S-K, the registrant has not Ñled debt instruments relating tolong-term debt that is not registered and for which the total amount of securities authorized thereunder doesnot exceed 10% of total assets of the registrant and its subsidiaries on a consolidated basis as of December 31,2005. The registrant agrees to furnish a copy of such agreements to the Commission upon request.
S-4
EXHIBIT 31.1
CERTIFICATION OF CHIEF EXECUTIVE OFFICER PURSUANT TO SECTION 302 OF THESARBANES-OXLEY ACT OF 2002
I, John Bucksbaum, certify that:
1. I have reviewed this annual report on Form 10-K of General Growth Properties, Inc.;
2. Based on my knowledge, this report does not contain any untrue statement of a material fact or omit tostate a material fact necessary to make the statements made, in light of the circumstances under which suchstatements were made, not misleading with respect to the period covered by this report;
3. Based on my knowledge, the Ñnancial statements, and other Ñnancial information included in this report,fairly present in all material respects the Ñnancial condition, results of operations and cash Öows of theregistrant as of, and for, the periods presented in this report;
4. The registrant's other certifying oÇcer and I are responsible for establishing and maintaining disclosurecontrols and procedures (as deÑned in Exchange Act Rules 13a-15(e) and 15d-15(e)) and internal controlover Ñnancial reporting (as deÑned in Exchange Act Rules 13a-15(f) and 15d-15(f)) for the registrant andhave:
a) Designed such disclosure controls and procedures, or caused such disclosure controls andprocedures to be designed under our supervision, to ensure that material information relating to theregistrant, including its consolidated subsidiaries, is made known to us by others within those entities,particularly during the period in which this report is being prepared;
b) Designed such internal control over Ñnancial reporting, or caused such internal control overÑnancial reporting to be designed under our supervision, to provide reasonable assurance regarding thereliability of Ñnancial reporting and the preparation of Ñnancial statements for external purposes inaccordance with generally accepted accounting principles;
c) Evaluated the eÅectiveness of the registrant's disclosure controls and procedures and presented inthis report our conclusions about the eÅectiveness of the disclosure controls and procedures, as of the endof the period covered by this report based on such evaluation; and
d) Disclosed in this report any change in the registrant's internal control over Ñnancial reportingthat occurred during the registrant's most recent Ñscal quarter (the registrant's fourth Ñscal quarter in thecase of an annual report) that has materially aÅected, or is reasonably likely to materially aÅect, theregistrant's internal control over Ñnancial reporting; and
5. The registrant's other certifying oÇcer and I have disclosed, based on our most recent evaluation of internalcontrol over Ñnancial reporting, to the registrant's auditors and the audit committee of registrant's board ofdirectors (or persons performing the equivalent functions):
a) All signiÑcant deÑciencies and material weaknesses in the design or operation of internal controlover Ñnancial reporting which are reasonably likely to adversely aÅect the registrant's ability to record,process, summarize and report Ñnancial information; and
b) Any fraud, whether or not material, that involves management or other employees who have asigniÑcant role in the registrant's internal control over Ñnancial reporting.
/s/ JOHN BUCKSBAUM
John BucksbaumChief Executive OÇcer
Date: March 31, 2006
EXHIBIT 31.2
CERTIFICATION OF CHIEF FINANCIAL OFFICER PURSUANT TO SECTION 302 OF THESARBANES-OXLEY ACT OF 2002
I, Bernard Freibaum, certify that:
1. I have reviewed this annual report on Form 10-K of General Growth Properties, Inc.;
2. Based on my knowledge, this report does not contain any untrue statement of a material fact or omit tostate a material fact necessary to make the statements made, in light of the circumstances under which suchstatements were made, not misleading with respect to the period covered by this report;
3. Based on my knowledge, the Ñnancial statements, and other Ñnancial information included in this report,fairly present in all material respects the Ñnancial condition, results of operations and cash Öows of theregistrant as of, and for, the periods presented in this report;
4. The registrant's other certifying oÇcer and I are responsible for establishing and maintaining disclosurecontrols and procedures (as deÑned in Exchange Act Rules 13a-15(e) and 15d-15(e)) and internal controlover Ñnancial reporting (as deÑned in Exchange Act Rules 13a-15(f) and 15d-15(f)) for the registrant andhave:
a) Designed such disclosure controls and procedures, or caused such disclosure controls andprocedures to be designed under our supervision, to ensure that material information relating to theregistrant, including its consolidated subsidiaries, is made known to us by others within those entities,particularly during the period in which this report is being prepared;
b) Designed such internal control over Ñnancial reporting, or caused such internal control overÑnancial reporting to be designed under our supervision, to provide reasonable assurance regarding thereliability of Ñnancial reporting and the preparation of Ñnancial statements for external purposes inaccordance with generally accepted accounting principles;
c) Evaluated the eÅectiveness of the registrant's disclosure controls and procedures and presented inthis report our conclusions about the eÅectiveness of the disclosure controls and procedures, as of the endof the period covered by this report based on such evaluation; and
d) Disclosed in this report any change in the registrant's internal control over Ñnancial reportingthat occurred during the registrant's most recent Ñscal quarter (the registrant's fourth Ñscal quarter in thecase of an annual report) that has materially aÅected, or is reasonably likely to materially aÅect, theregistrant's internal control over Ñnancial reporting; and
5. The registrant's other certifying oÇcer and I have disclosed, based on our most recent evaluation of internalcontrol over Ñnancial reporting, to the registrant's auditors and the audit committee of registrant's board ofdirectors (or persons performing the equivalent functions):
a) All signiÑcant deÑciencies and material weaknesses in the design or operation of internal controlover Ñnancial reporting which are reasonably likely to adversely aÅect the registrant's ability to record,process, summarize and report Ñnancial information; and
b) Any fraud, whether or not material, that involves management or other employees who have asigniÑcant role in the registrant's internal control over Ñnancial reporting.
/s/ BERNARD FREIBAUM
Bernard FreibaumExecutive Vice President and
Chief Financial OÇcer
Date: March 31, 2006
EXHIBIT 32.1
CERTIFICATION OF CHIEF EXECUTIVE OFFICER PURSUANT TOSECTION 906 OF THE SARBANES-OXLEY ACT OF 2002
In connection with the Annual Report of General Growth Properties, Inc. (the ""Company'') on Form 10-Kfor the period ending December 31, 2005, as Ñled with the Securities and Exchange Commission on the datehereof (the ""Report''), I, John Bucksbaum, in my capacity as Chief Executive OÇcer of the Company, dohereby certify, pursuant to 18 U.S.C. Section 1350, as adopted pursuant to Section 906 of the Sarbanes-OxleyAct of 2002, that:
(1) The Report fully complies with the requirements of Section 13 (a) or 15 (d) of the SecuritiesExchange Act of 1934; and
(2) The information contained in the Report fairly presents, in all material respects, the Ñnancialcondition and results of operations of the Company.
/s/ JOHN BUCKSBAUM
John BucksbaumChief Executive OÇcer
March 31, 2006
EXHIBIT 32.2
CERTIFICATION OF CHIEF FINANCIAL OFFICER PURSUANT TOSECTION 906 OF THE SARBANES-OXLEY ACT OF 2002
In connection with the Annual Report of General Growth Properties, Inc. (the ""Company'') on Form 10-Kfor the period ending December 31, 2005, as Ñled with the Securities and Exchange Commission on the datehereof (the ""Report''), I, Bernard Freibaum, in my capacity as Chief Financial OÇcer of the Company, dohereby certify, pursuant to 18 U.S.C. Section 1350, as adopted pursuant to Section 906 of the Sarbanes-OxleyAct of 2002, that:
(1) The Report fully complies with the requirements of Section 13 (a) or 15 (d) of the SecuritiesExchange Act of 1934; and
(2) The information contained in the Report fairly presents, in all material respects, the Ñnancialcondition and results of operations of the Company.
/s/ BERNARD FREIBAUM
Bernard FreibaumChief Financial OÇcer
March 31, 2006