Embed Size (px)
Citation preview

General Electric Advanced Technology Manual
Chapter 4.3
Power Oscillations

Rev 0912 4.3-i USNRC HRTD
TABLE OF CONTENTS
4.3 POWER OSCILLATIONS ..................................................................................... 1
4.3.1 Introduction ................................................................................................ 1
4.3.2 Discussion of Power Instability ................................................................... 3
4.3.3 Mitigation of Power Instability ..................................................................... 6
4.3.3.1 Solution Description Option I-A .................................................. 7
4.3.3.2 Solution Description Option I-D .................................................. 8
4.3.3.3 Solution Description Option II ..................................................... 8
4.3.3.4 Solution Description Option III .................................................... 8
4.3.4 Historical Perspective ................................................................................. 9
4.3.5 Operating Experience: Perry .................................................................... 11
4.3.6 References ............................................................................................... 13
LIST OF TABLES
Table 4.3-1 SIL-380 .................................................................................................... 15
Table 4.3-2 NRCB 88-07 Supplement 1 ...................................................................... 17
LIST OF FIGURES
4.3-1 Normal Observed Power Oscillation on APRMs
4.3-2 Density Wave Mechanism
4.3-3 Sinusoidal Pressure Drop
4.3-4 Reduced Rod Block & Scram Stability Protection for Option I-A
4.3-5 Administratively Controlled & Instability Region proposed for Option I-D
4.3-6 SIL - 380 Power/Flow Map
4.3-7 Typical Local Region Monitoring Scheme
4.3-8 NRCB Power/Flow Map
4.3-9 APRM, OPRM, 2/4 Logic Relationship
4.3-10 OPRM Trip Channel

Rev 0912 4.3-1 USNRC HRTD
4.3 POWER OSCILLATIONS Learning Objectives:
1. Recognize the potential consequences of unstable power oscillations.
2. Recognized why it can be difficult to detect power oscillations.
3. Recognize the regulatory requirements of GDC 12.
4. Recognize the conditions that can result in power instability and what can cause these conditions to occur.
5. Recognize the approaches used to prevent and/or respond to neutron flux oscillations.
6. Define the following terms: a. fuel time constant b. decay ratio c. limiting cycle ratio
7. Recognize how the following Oscillating Power Range Monitor (OPRMs). Algorithms produce alarms and trips a. Period Based Algorithm (PBA)
b. Amplitude Based Algorithm (ABA)
c. Growth Rate Based Algorithm (GRBA)
8. Identify when OPRM trips and alarms are automatically bypassed.
4.3.1 Introduction Boiling water reactors (BWRs) have complex dynamic responses that can result in the initiation of power oscillations. At least three instability types have been recognized in commercial BWRs: (1) Control system instabilities that may be caused by out of tune controllers.
(2) Channel thermohydraulic instabilities, that are purely thermohydraulic Instabilities,
related to the momentum dynamics of heated channel in a two-phase flow regime.

Rev 0912 4.3-2 USNRC HRTD
(3) Reactivity instabilities, that originate from the coupling of the reactor neutronics with the channel thermohydraulics, including momentum dynamics.
Two types of reactivity instabilities are recognized:
(a) In-phase or core-wide instabilities, when the neutron dynamics of the fundamental mode dominates resulting in core-wide oscillations.
(b) Out-of-phase or regional instabilities, when parallel channel momentum dynamics
is the dominant feedback loop and is reinforced by a subcritical mode of the neutronics.'
Of the various types of oscillations, those generated from control systems response are the most common. Controllers, such as the master recirculation flow controller, are typically more stable at the high end of their control band than at the low end. To account for this problem, interlocks and procedures prevent automatic master flow control below some value (typically less than 45%). Other control systems that effect BWR oscillations are the pressure control system and the feedwater control system. Even with the constant modulation of the turbine control valves to regulate reactor pressure and feedwater pump steam supply valves or feedwater regulating valves to control feedwater flow, a sinusoidal oscillation can be observed in reactor power during steady state operation. These oscillations are usually slow and small in magnitude. Figure 4.3-1 was taken from an operating recorder in a BWR control room and illustrates the power oscillations that occur at many plants during normal power operation. The amplitude of these observed oscillations has ranged from a few percent to fifteen percent. Oscillations that occur from control system responses are not normally divergent and do not challenge fuel safety limits. Unstable power oscillations can occur during power operations or in conjunction with an Anticipated Transient Without Scram (ATWS). The primary safety concern regarding unstable power oscillations during normal operations is the ability of the reactor protection system to detect and suppress oscillations before they can challenge the fuel safety limits (Minimum Critical Power Ratio). The type of instability that can lead to divergent oscillations and challenge fuel safety limits is a thermal-hydraulic, neutronic generated, density-wave instability that occurs inside fuel bundles. GE BWR plant and fuel design provide stable operation with margin within the normal operating domain. The possibility of power oscillations exists at all times during startup, shutdown, and throughout normal power operations. However, at the high power/low flow corner of the power/flow operating map, the probability of power oscillations is much higher. The major factors that can contribute to instability are void fraction, fuel time constant, power level, power shape, feedwater temperature and core flow. To provide assurance that the oscillations are detected and suppressed, technical

Rev 0912 4.3-3 USNRC HRTD
specifications require that APRM and LPRM flux levels be monitored when in the region of possible power oscillation. This requirement is based on the results of stability tests at operating BWRs. A conservative decay ratio of 0.6 was chosen as the basis for determining the generic region for monitoring for power oscillation. Decay ratio in this context is the measured stability of an oscillating system and is the quotient of the amplitude of one peak in an oscillation divided by the amplitude of the peak immediately preceding it. The amplitude is measured relative to the average amplitude of the signal. A stable system is characterized by a decay ratio of less than 1.0. As a result of actual power oscillation events in the industry, and a desire to minimize the possibility of exceeding the minimum critical power ratio (MCPR) safety limit, the BWROG and the NRC have agreed to three plausible options that are discussed in Section 4.3.3 on Mitigation of Power Instability.
4.3.2 Discussion of Power Instability The basic mechanism causing flow and power instabilities in BWRs is the density wave. The effect of a density wave is illustrated in Figure 4.3-2. Coolant flows in the upward direction through the core and is guided by the channels that surround the matrix of fuel rods. Local voiding within a fuel bundle may be increased either by an increase in the power at a constant inlet flow, by a decrease in the inlet flow at constant power, or by an increase in feedwater temperature. This resulting localized concentration of voids will travel upward, forming a propagating density wave which produces a change in the localized pressure drop at each axial location as it travels upward. The effective time for the voids to move upward through the core is referred to as the density wave propagation time. In two-phase flow regimes, the localized pressure drop is very sensitive to the local void fraction, becoming very large at the outlet of the bundle where the void fraction is normally the greatest. Because of this a significant part of the pressure drop is delayed in time relative to the original flow perturbation. If a sine wave perturbation of the inlet flow is used to illustrate this, Figure 4.3-3 is obtained. The localized axial pressure drops are also sinusoidal within the linear range; however, they are delayed in time with respect to the initial perturbation, the sine wave in this case. The total pressure drop across the bundle is the sum of the localized pressure drops. If the bundle outlet pressure drop (the most delayed with respect to the initial perturbation) is larger than the inlet pressure drop, then the total bundle pressure drop may be delayed by as much as 180 degrees with respect to the inlet flow perturbation and be of the opposite sign. This is the case in Figure 4.3-3, where an increase in inlet flow results in a decrease in the total bundle pressure drop. This causes the bundle flow to be unstable, inlet flow perturbations to reinforce themselves (positive feedback), and oscillations grow at the same unstable frequency. Bundle flow instability starts when the outlet (i.e., delayed) localized pressure drop equals the pressure drop at the inlet for a particular density wave propagation time. The oscillations themselves are

Rev 0912 4.3-4 USNRC HRTD
caused by interdependencies between thermo-hydraulic parameters and the reactivity feedback. In the instability region these interdependencies can result in an insufficiently damped oscillation of the neutron flux with increasing amplitudes. Power generation is a function of the reactivity feedback and, depends strongly on the core average void fraction. When a void fraction oscillation is established in a BWR, power oscillates according to the neutronic feedback and the core dynamics. Most important to this discussion are the void fraction response to changes in heat flux, including the inlet flow feedback via the recirculation loop, and the reactivity feedback dynamics. One important difference between the neutronic feedback dynamics and the flow feedback dynamics is the fuel time constant. Before the power generated in the fuel can affect the moderator density, it must change the fuel temperature and transfer heat to the coolant. The fuel in BWRs responds relatively slowly with a time constant between 6 and 10 seconds. The delay times for unstable density wave oscillation and void reactivity feedback are not the same. Differences in the delay times add additional phase delays and can cause the void feedback to reinforce the density wave oscillations (effectively positive feedback). Decreasing the time response of the fuel generally has a destabilizing effect. Smaller response times can be a problem even if only a small portion of the fuel has the decreased time response because the most unstable bundles dominate the response. When conditions within a reactor are such that it could become unstable (eg: high power and low flow), any perturbation in the inlet conditions can start the unstable oscillations. A moment before the instability event starts, the reactor is in a relatively steady condition with some particular power and flow. Initially the reactor will behave linearly and the oscillations will grow exponentially. As the oscillation becomes larger, the nonlinearities in the system begin to grow in importance. These nonlinearities have the effect of increasing the negative power feedback in the reactor. When a sufficiently large reactivity bias is reached, an equilibrium is established, and a limit cycle oscillation remains. The amplitude of the resulting limit cycle oscillation will depend on various parameters and can be many times greater than rated full power. A limit cycle oscillation is one with a decay ratio > 1. This causes the amplitude of the oscillations to diverge and become unstable. The oscillation amplitude continues to grow until it reaches a saturation value. At the point the system is said to be in a limit cycle. BWRs can experience unstable power oscillation either in a single bundle (localized) or core wide. In the case of core wide oscillations, the entire core can oscillate together or part of the core can be increasing in power while another part is decreasing in power (out of phase). The out of phase oscillation is important because it is more difficult to detect. BWRs monitor local power at various radial and axial locations with the use of Local Power Range Monitors (LPRMs). The LPRMs consist of up to 172 stationary in-core

Rev 0912 4.3-5 USNRC HRTD
detectors which are arranged in radially located assemblies of four detectors each, separated at axial intervals of three feet. The LPRMs in turn provide information to the Average Power Range Monitoring (APRM) System. In general, a set of individual LPRMs provide information to a single APRM channel. APRMs sample power both radially and axially in the core, and, therefore, may not indicate the worst case out-of-phase oscillation since the oscillation may be masked by the cancellation between out of phase LPRMs that provide signals to the same APRM channel. Bottom-peaked power shapes are more unstable because they tend to increase the axially averaged void fraction. This causes void perturbation to start at a lower axial level, and produces a longer delay time for the density wave which will be more unstable. Radial power shape is important because the most unstable bundles tend to dominate the overall response. Lower void velocities result in longer delay times for the density wave which will be more unstable. Increasing the subcooling of the feedwater inlet flow has two effects. First, it will tend to increase the operating power (a destabilizing effect) and second, it raises the boiling boundary (a stabilizing effect). In most cases the total effect is destabilizing. Many of these effects can accrue as a result of a single cause. As an example, fuel burnup will change the fuel isotopic composition as well as the axial power shape. Additionally, changes in other parameters can affect these factors. Increasing reactor pressure will decrease the core average void fraction and stabilize the reactor. Increasing the core inlet restriction (flow orificing) will increase the single phase component of the pressure drop across the core which retards dynamic increases in the flow rate (a stabilizing effect). Therefore, the effects of all parameters must be taken into account when evaluating mitigation strategies. The system conditions necessary to initiate unstable core oscillations are complex. There is no single trigger that is solely responsible for this phenomena but rather they may be thought of as contributing factors that when present will increase the probability of an unstable core oscillation occurring; eg. If one or more of these factors is present then the introduction of another factor may start the unstable power oscillations. To summarize the factors discussed previously, they are:
(1) High Power (2) Low Flow (3) Feedwater Temperature (4) Short fuel time constant (5) Bottom-peaked Power Shape (6) Void Fraction

Rev 0912 4.3-6 USNRC HRTD
High power is considered to be > 30% and low core flow is considered to be < 60%. If power is raised without a sufficient rise in core flow or if core flow is lowered without a sufficicient reduction in power, an unstable oscillation could be generated.
Increasing the subcooling of the feedwater inlet flow has two effects. First, it will tend to increase the operating power (a destabilizing effect) and second, it raises the boiling boundary (a stabilizing effect). In most cases the total effect is destabilizing. On the other hand, local voiding within a fuel bundle may be increased by an increase in feedwater temperature. In either case a change in feedwater temperature can start an unstable power oscillation.
A short fuel time constant acts as a reinforcement to the power oscillation and may cause the oscillations to grow in amplitude.
A bottom-peaked core lowers the boiling boundary thus there is an increased void fraction in the core.
A high void fraction means that more of the moderator is at saturation conditions and therefore more susceptible to the factors that can introduce a void density wave.
4.3.3 Mitigation of Power Instability General Design Criteria (GDC) 10, 12, and 20 of 10 CFR 50, Appendix. A, require that protection systems be designed to assure that specified acceptable fuel design limits are not exceeded. GDC 12 specifically addresses the phenomena of Power Oscillations as follows: Criteria 12 - Suppression of reactor power oscillations. The reactor core and associated coolant, control, and protection systems shall be designed to ensure that power oscillations which can result in conditions exceeding specified acceptable fuel design limits are not possible or can be readily detected and mitigated. Minimum Critical Power Ratio (MCPR) is the primary fuel design limit that is being protected during potential instabilities. The BWROG submitted to the U.S. Nuclear Regulatory Commission Topical Report NEDO31960, "Long-Term Stability Solutions Licensing Methodology" for staff review. Long-term solutions described in this report consist of conceptual designs for automatic protection systems developed by the BWROG with its contractor, the General Electric Company. The automatic protection systems are designed to either prevent stability related neutron flux oscillations or detect and suppress them if they occur. This report also described methodologies that have been developed to establish set points and demonstrate the adequacy of the protection systems to prevent violation of Minimum Critical Power Ratio limits in compliance with 10CFR50, Appendix A, GDC 10 and 12.

Rev 0912 4.3-7 USNRC HRTD
Because of the variety of plant types, the need to accommodate differing operational philosophies and owner-specific concerns, several alternative solutions were considered. For BWR/2s, existing systems and plant features already provide sufficient detection and suppression of reactor instabilities. This capability is limited primarily to those plants having quadrant average power range monitors (APRMs), It is referred to as Option II, and has been agreed upon by BWROG and the NRC. However, for most of the BWRs, new or modified plant systems may be necessary. A summary of the long-term solutions agreed upon by the BWROG and the NRC follows:
4.3.3.1 Solution Description Option I-A Regional Exclusion, Option I-A, assures compliance with GDC-12 by minimizing the occurrence of instability. This is accomplished by preventing entry into a power/flow region where instability might occur. An example of an exclusion region (I) is shown in Figure 4.3-4 along with the restricted (II) and monitored (III) regions. Upon entry into the exclusion region, an Automatic-Safety-Feature (ASF) function will cause the region to be exited. The ASF may be a full scram or a selected rod insert (SRI). For plants choosing SRI as their primary ASF, a full scram automatic backup must take place if the exclusion region is not exited within a reasonable period of time (a few seconds). For plants choosing to implement this option (full scram or SRI), the existing flow-biased scram cards were replaced. The microprocessor-based cards provide three independent functions: (1) a scram signal (that will be processed by the existing flow-biased scram system) if the exclusion region is entered, and (2) an alarm (directed to an existing alarm panel) if the restricted region is entered, and (3) automatic monitoring (using the period-based algorithm of solution III) within the monitored region to detect instabilities should they occur. Entry into the monitored region is unrestricted. This region only defines a region outside which the monitoring algorithm is not active. The main purpose is to avoid false alarms from the automated monitor when operating at very low powers during startup. Intentional entry into the restricted region is only permitted if certain stability controls are in place. These stability controls deal primarily with power distributions and may be implemented by monitoring a parameter defined as the boiling boundary. The purpose of these controls is to assure that plant conditions that are sensitive to stability are bounded by the assumptions of the exclusion region boundary analysis. Only two (2) plants use Option I-A they are Grand Gulf and River Bend

Rev 0912 4.3-8 USNRC HRTD
4.3.3.2 Solution Description Option I-D Regional Exclusion with Flow-Biased APRM Neutron Flux Scram, Option I-D, assures that BWRs with tight fuel inlet orificing (less than 2.43 inches) and an unfiltered, flow-biased scram comply with GDC-12 by providing an administrative boundary for normal operations in the vicinity of the region where instability could be expected to occur. During normal operation, the boundary of the exclusion region is administratively controlled, and operation within the region is to be avoided. If an unexpected operational event results in entry into the exclusion region, action to exit the region must be taken immediately. Oscillations that do occur in this situation should be automatically detected and eliminated by the flow-biased APRM neutron flux scram. This scram is based on a comparison of the unfiltered APRM signal to a set point that varies as a function of core flow. When the unfiltered APRM neutron flux signal exceeds the flow-biased set point, a scram signal is generated. An example of the administratively controlled region and the instability region is shown in Figure 4.3-5. The following plants implemented Option I-D: Duane Arnold, FitzPatrick, Monticello, Cooper, and Vermont Yankee
4.3.3.3 Solution Description Option II As discussed above in 4.3.3, Option II applies to the BWR 2 design, Oyster Creek and Nine Mile Point Unit 1. This design uses quadrant based APRMS and is capable of detecting out-of-phase oscillations. Therefore no modification was required for these plants.
4.3.3.4 Solution Description Option III Local Power Range Monitor (LPRM) based Oscillation Power Range Monitor (OPRM), Option III, is a microprocessor-based monitoring and protection system that detects a thermal hydraulic instability and initiates an alarm and ASF before safety limits are exceeded. The OPRM does not affect the design bases for the existing APRMs because it operates in parallel with and is independent of the installed APRM channels. The OPRM is automatically enabled when Total Core Flow is < 60% AND Reactor Power is > 30%. Each of the four OPRM channels consist of a microprocessor unit that takes amplified LPRM signals from available locations in the APRM cabinets. These LPRM signals are grouped together such that the resulting OPRM response provides adequate coverage of expected oscillation modes. If a thermal-hydraulic oscillation is detected, a scram signal will be sent to the ASF designed to suppress oscillations before the MCPR safety limit is exceeded. The OPRM would be installed and maintained as a reactor protection system (RPS) parameter input in the standard one-out-of-two-twice actuation scram logic.

Rev 0912 4.3-9 USNRC HRTD
The algorithms proposed for use in the automatic detection solutions, I-D and III are: Amplitude Based Algorithm, Growth Algorithm and Period Based Algorithm. The Amplitude Based Algorithm establishes a setpoint at some value above 100% power. In order to cause a scram the signal must pass through the setpoint with a positive slope followed by passing through the setpoint with a negative slope and then pass the setpoint a second time with a positive slope. When the setpoint is set well above the random fluctuations that occur in reactor operation, this algorithm will prevent scrams that would otherwise result from single spikes. The Growth Algorithm is designed to detect the presence of oscillations as they grow above the level of normal random noise. If the amplitude of an oscillation is greater than the previous oscillations amplitude by a predetermined amount, a scram signal will be generated. The Period-Based Algorithm is the most sensitive of the automatic detection solution algorithms. It detects the "periodicity" of the signal by maintaining statistical data of the intervals between consecutive peaks. When the "periodicity" is high, the reactor is considered to be approaching instability. Twenty five (25) plants use option III, they are: Hatch1/2, Brunswick1/2, Fermi 2, PB2/3, Perry, Hope Creek, NMP2, Quad1/2, Dresden2/3, LaSalle1/2, Limerick1/2, Clinton, Susq1/2, WNP2, and Browns Ferry 1/2/3.
4.3.4 Historical Perspective Evaluation of the probability of thermal-hydraulic instability in BWRs has been an ongoing study by General Electric starting with the first power production plants. Early testing consisted of moving a control rod one notch position while monitoring reactor performance. For BWR/3s, 4s, 5s, and 6s with high power density cores, a pressure disturbance technique was used to cause power instability. The pressure disturbance was accomplished using one of the four turbine control valves. The signal used to control the perturbation amplitude was adjusted to obtain an APRM neutron oscillation within 15% of the steady state signal. Tests following the instability scrams (one each in 1982 and 1983) at the Caorso Nuclear Power Station (Italian plant), indicated the possibility of power oscillation at high power and low flow conditions. These tests also indicated an out-of-phase neutron flux oscillation and showed that half of the core was oscillating 180 out of phase with respect to the flux oscillation in the other half of the core (as sensed by the LPRMs). These tests also showed that APRMs would not be as sensitive to such a phenomenon. While the LPRMs indicated oscillations of 60% of peak-to-peak power, APRMs indicated oscillations of only 12%. On February 10, 1984, General Electric issued Service Information Letter (SIL) 380, Revision 1, which discussed the BWR core thermal-hydraulic stability problems that could exist in different variations in all BWRs. The SIL provided a list of recommended actions

Rev 0912 4.3-10 USNRC HRTD
and identified the high power, low flow corner of the power-to-flow map as the region of least stability and one which should be avoided. If this region of instability was entered, guidance was to insert control rods to reduce reactor power below the 80 percent rod pattern line and monitor LPRMs and APRMs for oscillation. Generic Letter 86-02 was issued January 1986 to inform licensees of the acceptance criteria for thermal-hydraulic stability margin required in GDC 10 and GDC 12. The objective of the letter was to account for these criteria in future licensing submittals and in safety evaluations in support of 10 CFR 50.59 determinations. It also stated that plants may have to change technical specifications to comply with SIL 380, Rev. 1. On March 9, 1988 the Unit 2 reactor at the LaSalle Station was operating at 84% steady state power and 76% flow when an instrument technician made a valve lineup error that caused both recirculation pumps to trip. As a result of the rapid power decrease, the EHC system reduced steam flow to the main turbine causing a reduction of extraction steam. The rapid decrease in extraction steam caused severe perturbations in feedwater heater levels which eventually caused isolation of the heater strings. Feedwater temperature decreased 45 F in 4 minutes as a result of this significant reduction in feedwater heating, causing an increased power-to-flow ratio and further reducing the margin to instability. Between 4 and 5 minutes into the event, the APRMs were observed to be oscillating between 25 and 50% power every 2 to 3 seconds accompanied by oscillating LPRM up scale and down scale alarms. The unit automatically scrammed at the 7 minute mark from a fixed APRM scram signal of 118%. On December 30, 1988 NRC Bulletin 88-07, Supplement 1, dealing with power oscillations in BWRs was issued. The purpose of this supplement was to provide additional information concerning power oscillations in BWRs and to request that licensees take actions to ensure that the safety limit for minimum critical power ratio (MCPR) was not exceeded. In addition, within 30 days of receipt of Supplement 1, all BWRs were required to implement the GE interim stability recommendations derived for GE fuel. The supplement also specified that plants with ineffective automatic scram protection shall manually scram the reactor if both recirculation pumps should trip. Adequate automatic scram protection is available at plants with a flow biased APRM scram with no time delay. Inadequate automatic scram protection is provided at plants with a fixed APRM high flux scram and a separate thermal APRM, time delayed, flow-biased scram. During the startup of cycle 13, of the Ringhals-l plant in Sweden in 1989, an unexpected out of-phase oscillation occurred with a peak-to-peak amplitude of about 16 percent. The event was initiated when high neutron flux power level triggered an automatic pump run back from 79 percent power to 68 percent power. An analysis following the event appeared to indicate that the slope of the flow control line was altered by the new fuel

Rev 0912 4.3-11 USNRC HRTD
cycle and that an increase in recirculation flow resulted in greater-than-expected increases in power. The Caorso nuclear power station (a BWR/6 located in Italy) experienced an unexpected instability event in 1991. The event occurred during a reactor startup, using GE-7 fuel, and with plant conditions of minimum pump speed, minimum flow control valve position, and a rod pattern line of nearly 80 percent. Actual power and flow values were uncertain but were estimated to be in the range from 38 to 40.8 percent power and from 30.7 to 31.3 percent flow. This event demonstrated that oscillations below the 80 percent rod line are possible and suggested that the regions defined in NRC Bulletin 88-07 may not have been restrictive enough. This event occurred during a startup and was attributed to extreme bottom-peaking of the axial power shape. The feedwater heaters were still cold when the event occurred with a feedwater temperature of approximately 150oF and 56 BTU/lb of subcooling. An interesting effect occurred during the event. The power oscillations continued to grow in amplitude while core power was clearly decreasing as the operator inserted the control rods. The corrective action to avoid repetition of this event was to modify the plant startup procedures to require a hot feedwater temperature before power could be increased above 30 percent power. On August 15, 1992, Washington Nuclear Power Unit-2 experienced power oscillations during startup. The reactor core for cycle 8 consisted of mostly Siemens fuel (9*9-9x) that has a higher flow resistance than the GE 8*8 fuel. While on the 76% rod line following a power reduction with flow, a power oscillation was observed by the operators who then initiated a scram. An Augmented Inspection Team (AIT) found, by analyses using LAPUR code, that a major contributor was the core loading. The analyses indicated that a full core load of 9*9-9x fuel would be less stable than the old 8*8 fuel and that the mixed core was less stable than a fully loaded core of either type. This event indicated that the boundaries of the instability region defined in the BWROG interim corrective actions may not include all possible areas of instabilities.
4.3.5 Operating Experience: Perry At 2345 hours on December 23, 2004, both RRC pumps A and B unexpectedly transferred from fast to slow speed. At the time of RRC pump speed downshift, the plant was stable in Operational Condition 1 at 100 percent rated thermal power. After the downshift, reactor power stabilized at about 44 percent and then gradually increased to about 55 percent rated thermal power. The power and flow reduction placed the plant in the immediate exit region of the power-flow map. In this region, the reactor core is susceptible to power oscillations. At 2346 hours, off-normal instruction, "Unplanned Change in Reactor Power or Reactivity," was entered. At 2348 hours the first OPRM alarm was annunciated and subsequently cleared. The magnitude of the core power oscillations detected by the OPRM instrumentation was not observable to operators monitoring reactor power on the control room instrumentation. The OPRM alarm came in
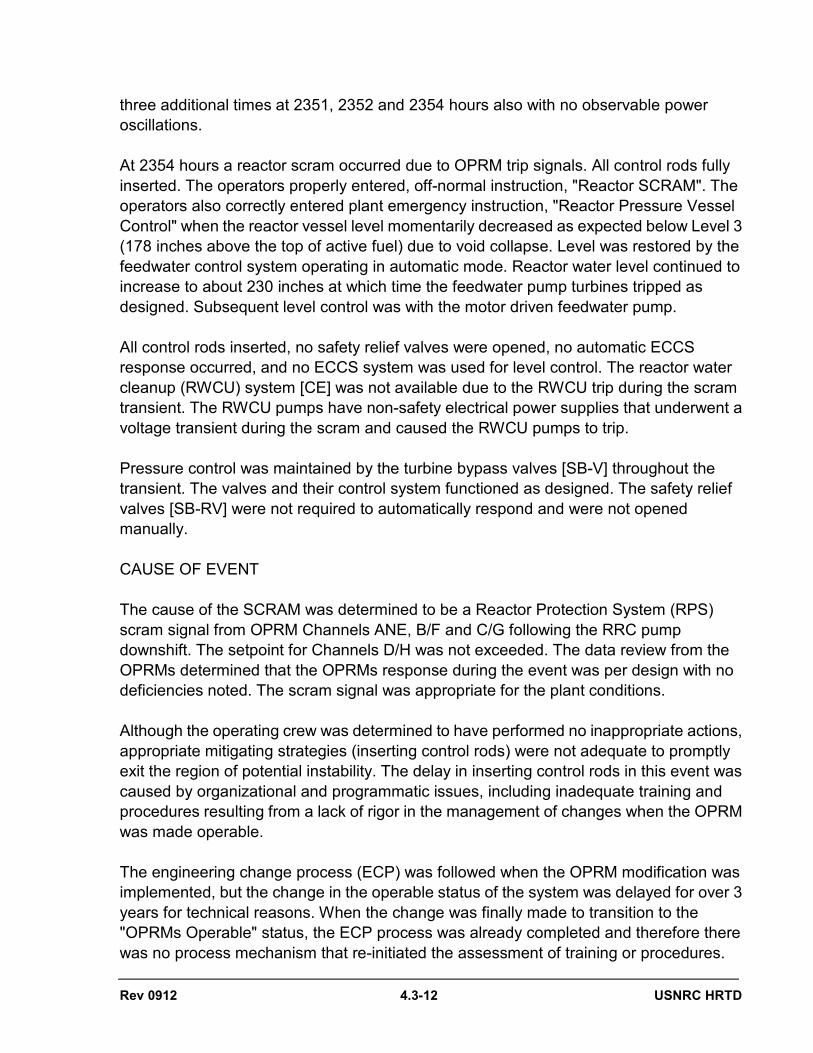
Rev 0912 4.3-12 USNRC HRTD
three additional times at 2351, 2352 and 2354 hours also with no observable power oscillations. At 2354 hours a reactor scram occurred due to OPRM trip signals. All control rods fully inserted. The operators properly entered, off-normal instruction, "Reactor SCRAM". The operators also correctly entered plant emergency instruction, "Reactor Pressure Vessel Control" when the reactor vessel level momentarily decreased as expected below Level 3 (178 inches above the top of active fuel) due to void collapse. Level was restored by the feedwater control system operating in automatic mode. Reactor water level continued to increase to about 230 inches at which time the feedwater pump turbines tripped as designed. Subsequent level control was with the motor driven feedwater pump. All control rods inserted, no safety relief valves were opened, no automatic ECCS response occurred, and no ECCS system was used for level control. The reactor water cleanup (RWCU) system [CE] was not available due to the RWCU trip during the scram transient. The RWCU pumps have non-safety electrical power supplies that underwent a voltage transient during the scram and caused the RWCU pumps to trip. Pressure control was maintained by the turbine bypass valves [SB-V] throughout the transient. The valves and their control system functioned as designed. The safety relief valves [SB-RV] were not required to automatically respond and were not opened manually. CAUSE OF EVENT The cause of the SCRAM was determined to be a Reactor Protection System (RPS) scram signal from OPRM Channels ANE, B/F and C/G following the RRC pump downshift. The setpoint for Channels D/H was not exceeded. The data review from the OPRMs determined that the OPRMs response during the event was per design with no deficiencies noted. The scram signal was appropriate for the plant conditions. Although the operating crew was determined to have performed no inappropriate actions, appropriate mitigating strategies (inserting control rods) were not adequate to promptly exit the region of potential instability. The delay in inserting control rods in this event was caused by organizational and programmatic issues, including inadequate training and procedures resulting from a lack of rigor in the management of changes when the OPRM was made operable. The engineering change process (ECP) was followed when the OPRM modification was implemented, but the change in the operable status of the system was delayed for over 3 years for technical reasons. When the change was finally made to transition to the "OPRMs Operable" status, the ECP process was already completed and therefore there was no process mechanism that re-initiated the assessment of training or procedures.

Rev 0912 4.3-13 USNRC HRTD
Because of this, the appropriate training needs analysis was not performed and the operators were not provided with adequate training or procedures that would have provided the basis for more timely actions that could have prevented an automatic scram under the conditions experienced on December 23, 2004. Troubleshooting of the RRC system pump speed downshift was initiated to identify the cause. These investigations focused on the RRC pump fast to slow speed downshift logic circuitry. Three of the five RRC pump downshift signals were eliminated as a potential cause since a scram would have initiated simultaneously with the downshift from those signals. Since the other sources of pump downshift signals were eliminated, the alarm cards for Low Feedwater Flow and Low Reactor Level were replaced prior to plant restart. These cards were considered the highest probability to have caused the RRC pump downshift based on historical failure trends. Since the RRC pump downshift signal was intermittent and could not definitively be confirmed, temporary recorders were installed to monitor the power supply and input voltage to the two replaced alarm cards and other points in the RRC circuitry. Subsequent to this event, on January 6, 2005, the RRC pumps again unexpectedly downshifted to slow speed. The cause of the downshift was determined to be an optical isolator intermittent failure as a result of an inadequate surge suppression network in the end-of-cycle reactor recirculation pump trip (EOC/RPT) control circuit for the RRC pumps (Reference PNPP LER 2005-001 for further information). This cause was also subsequently determined to be the reason for the RRC pump downshift on December 23, 2004.
4.3.6 References
1. NRC Bulletin 88-07 Supplement 1, Power Oscillations in Boiling Water Reactors, December 30, 1988.
2. NUREG/CR-6003 ORNL/TM-12130, Density Wave Instabilities in Boiling Water
Reactors, September 1992. 3. General Electric, BWR Core Thermal-hydraulic Stability, "SIL No. 380, Revision 1,"
February 1984. 4. Bernero, Robert M., Technical Resolution of Generic Issue B-19 - Thermal-hydraulic
Stability, "NRC Generic Letter 86-02", 1986. 5. Briefing Report, "LaSalle Unit 2 Oscillation Event," March 1988.

Rev 0912 4.3-14 USNRC HRTD
6. May, M.J., "Stability Operating Procedures for Kernkraftwerk Leibstadt plant," October
1984. 7. General Electric, BWR Owners' Group Long-Term Stability Solutions Licensing
Methodology, "NEDO-31960," May 1991. 8. General Electric, BWR Owners' Group Long-Term Stability Solutions Licensing
Methodology, "NEDO-31960 Supplement 1," March 1992. 9. Wulff, W., et al., BWR Stability Analysis with the BNL Engineering Plant Analyzer,
"NUREG/CR 5816," November 1991. 10. ORNL, "Acceptance for Referencing of Topical Reports NEDO-31960 and NEDO
31960 Supplement 1, July 1993. 11. W.P. Ang, et al., Special Inspection, NRC Inspection "Report No. 50-397/92-37,"
November 1992.
12. Perry LER 20040200

Rev 0912 4.3-15 USNRC HRTD
Table 4.3-1 SIL-380
General Electric recommends that BWR operators using GE BWR fuel monitor the inherent neutron flux signals and avoid or control abnormal neutron flux oscillations (with particular attention to the region of sensitivity in where the probability of sustained neutron flux oscillations increase) as follows:
1. Become familiar and aware of your plants normal average power range monitor (APRM) and
local power range monitor (LPRM) peak-to-peak neutron flux for all operating regions of the power/flow map and for all operating modes (e.g., two loop and single loop operation). In particular, establish an expected APRM and LPRM peak-to-peak signal for your plant at various operating states and also for special operating modes (single loop operation) if these modes will be used. The expected APRM noise amplitude can be easily determined from past steady state strip chart recordings or can be established based on current operating conditions.
2. Whenever making APRM or LPRM readings, verify that the neutron flux noise level is normal. If
there is any abnormal increase in the neutron flux response, follow the recommendation in Section 6d to suppress the abnormal noise signal.
3. The LPRM gains should be properly calibrated per current plant procedures. This will permit
the LPRM upscale alarm trip setpoints to be set as high as full scale while providing appropriate indication against unacceptable reduction in thermal margin because of power oscillations. The LPRM upscale alarm indicators should be regularly monitored and all upscale alarms should be investigated to determine the cause and to assure that local limits are not being exceeded.
4. Whenever changes are made or happen that cause reactor power to change, monitor the power
change on the APRMs and locally on the LPRMs to become familiar with the expected neutron flux signal characteristics.
5. If a recirculation pump(s) trip event results in operation in the crosshatched region of Figure
4.3-6: a. Immediately reduce power by inserting control rods to or below the 80% rod line
using the plant=s prescribed control rod shutdown insertion sequence. b. After inserting control rods, frequently monitor the APRMs and monitor the local
regions of the core by using the control rod select switch to display the various LPRM strings which surround the selected control rod. A minimum of nine control rods should be selected to adequately display LPRMs representing each octant of the core and the core center Figure 4.3-7. If there is any abnormal increase in the expected signals, insert additional control rods to suppress the oscillations using the plant=s prescribed control rod shutdown insertion sequence.
c. After inserting control rods, monitor the LPRM upscale alarm indicators and
verify (using recommendation 5b) that any LPRM upscale alarms which are received are not the result of neutron flux limit cycle oscillations.
d. When restarting recirculation pumps (or switching from low to high frequency
speed for flow control valve plants), the operation should be performed below the 80% rod line.
e. Once pumps have been restarted and recovery to power is to commence, follow
recommendations in Section 6.

Rev 0912 4.3-16 USNRC HRTD
Table 4.3-1 SIL-380
6. When withdrawing control rods during startup in dotted region of Figure 4.3-6:
a. Monitor the APRMs and the LPRMs surrounding control rod movement continually as power is being increased or flow is being reduced for any abnormal increase in the normal neutron flux response.
b. Monitor the LPRM upscale alarm indicators and verify (using recommendation 5b) that any LPRM upscale alarms which are received are not the result of neutron flux limit cycle oscillations.
c. Operate the core in as symmetric a mode as possible to avoid asymmetric power distributions. When possible, control rods should be moved in octant (sequence A) and, quadrant mirror (sequence B) symmetric patterns. Control rod movement should be restricted to no more than 2 feet at a time and control rods within a symmetric rod group should be within 2 feet of each other at all times. For BWR/6 plants with ganged rod withdrawal, control rods should be moved in gangs as much as possible to maintain symmetric rod patterns.
d. If there is any abnormal increase in the normally expected neutron flux response, the variations should be suppressed. It is suggested that the operation which caused the increase in neutron flux response be reversed, if practical, to accomplish this suppression. Control rod insertion or core flow increase (PCIOMRs should be followed during flow increases) will result in moving toward a region of increased stability.
e. An alternative to recommendations 6 a-d is to increase core flow such that operating in region 2 is avoided. PCIOMR guidelines should still be followed.
7. When performing control rod sequence exchanges:
a. Follow recommendations 6 a-d, or
b. Perform control rod sequence exchanges outside of both regions of Figure 4.3-6.
8. When inserting control rods during shutdown, insert control rods to or below the 80% rod line prior to reducing flow into dotted region of Figure 4.3-6 (i.e., avoid crosshatched region during shutdown).
9. Should any abnormal flux oscillations be encountered data should be recorded on the highest speed equipment available and all available power, flow, power shape, feedwater, pressure and rod pattern information documented for subsequent evaluation and operational guidance.

Rev 0912 4.3-17 USNRC HRTD
Table 4.3-2 NRCB 88-07 Supplement 1
1. Intentional operation shall not be allowed in Region A or Region B of Figure 4.3-8. 2. Group 1 plant operators shall take immediate actions to exit the region. Immediate action consists of either:
Insertion of predefined set of control rods which will most effectively reduce core thermal power.
or Increasing recirculation pump speed if one or more pumps are in operation.
Starting a recirculation pump to exit this region is NOT an appropriate action. Group 2 plant operators shall manually scram the reactor to exit the region. 3. If Region B is unintentionally entered: Group 1 and Group 2 operators shall take immediate action to exit the region. Immediate action consists of:
Insertion of a predefined set of control rods which will most effectively reduce core thermal power.
or Increasing recirculation pump speed or recirculation flow (FCV plants) if one or more pumps are in operation. Starting a recirculation pump or shifting from low to high speed (FCV plants)to exit this region is not an appropriate action.
4. Intentional operation in Region C shall be allowed only for control rod withdrawals during
startup requiring PCIOMR. This region should be avoided for control rod sequence exchanges, Surveillance testing and reactor shutdowns.
During control rod withdrawal, flux monitoring should be conducted in accordance with SIL 380, Revision 1. 5. If at any time during operation in Region A, B, or C, core thermal hydraulic instability
occurs, the plant operator shall manually scram the reactor. Evidence of thermal hydraulic instability consists of APRM peak to peak oscillations of greater than 10% or periodic LPRM upscale or Downscale alarms in addition to the guidance provided in SIL 380, Revision 1.

Rev 0912 4.3-18 USNRC HRTD
Table 4.3-2 NRCB 88-07 Supplement 1
Group 1
Oyster Creek Nine Mile 1 Dresden 2,3 Millstone Quad Cities 1,2 Pilgrim Monticello Duane Arnold Cooper Vermont Yankee Peach Bottom 2,3 Limerick
Group 2
Brunswick 1,2 Hatch 1,2 Browns Ferry 1,2,3 Fermi 2 Fitzpatrick Hope Creek Susquehanna 1,2 LaSalle 1,2 Hanford 2 Shoreham Nine Mile PT 2 Clinton Perry Riverbend Grand Gulf 1

Figure 4.3-1 Normal Observed Power Oscillation on APRMs

Figure 4.3-2 Density Wave Mechanism
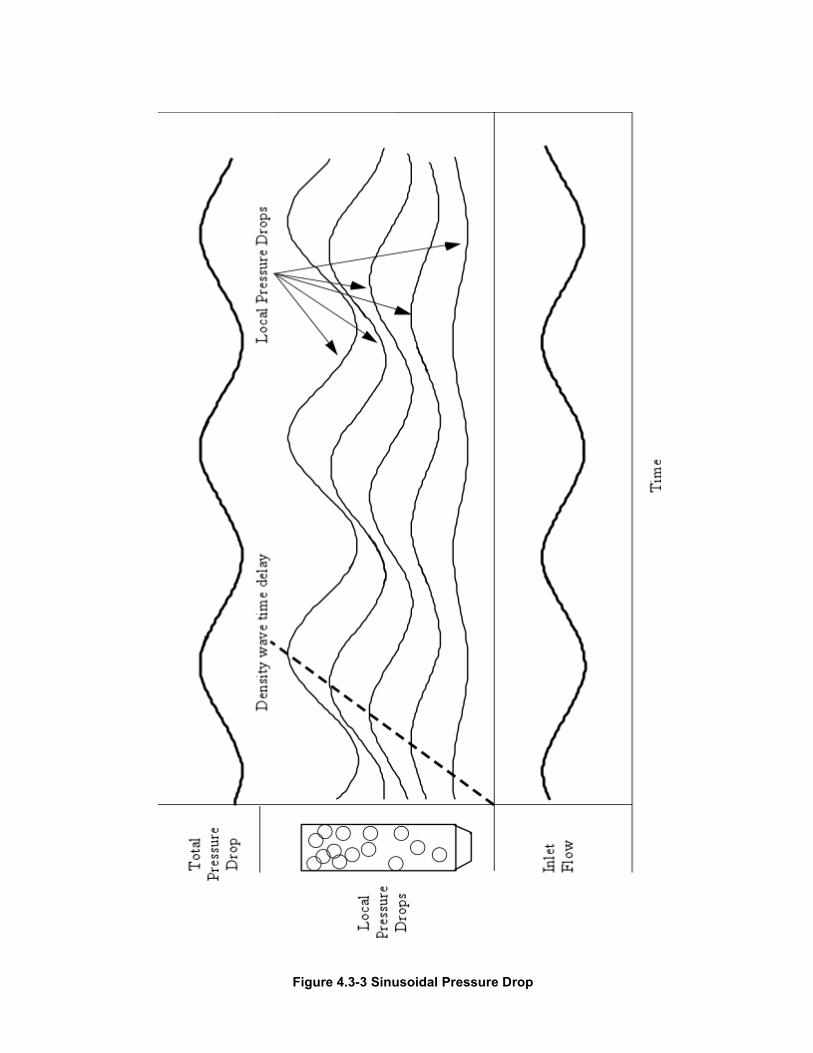
Figure 4.3-3 Sinusoidal Pressure Drop

Figure 4.3-4 Reduced Rod Block & Scram Stability Protection for Option I-A

Figure 4.3-5 Administratively Controlled & Instability Region proposed for Option I-D

Figure 4.3-6 SIL - 380 Power/Flow Map

Figure 4.3-7 Typical Local Region Monitoring Scheme

Figure 4.3-8 NRCB Power/Flow Map

Figure 4.3-9 APRM, OPRM, 2/4 Logic Relationship

Figure 4.3-10 OPRM Trip Channel