Embed Size (px)
Citation preview

GENERAL AGREEMENT
ON TARIFFS AND TRADE
RESTRICTEDDPC/W11401 September 1994
Special Distribution
(94-1777)
International Dairy Arrangement
INTERNATIONAL DAIRY PRODUCTS COUNCIL
Status Report on the World Market for Dairy Products
Note by the Secretariat

DPC/W/ 140Page 2
THE INTERNATIONAL DAIRY ARRANGEMENT
The International Dairy Arrangement entered into its fifteenth year of operationon 1 January 1994. Currently the IDA has sixteen participants: Argentina, Australia,Bulgaria, Egypt, the European Communities (and its twelve member States), Finland,Hungary, Japan, New Zealand, Norway, Poland, Romania, South Africa, Sweden,Switzerland and Uruguay.
The primary objectives of the Arrangement are to achieve the expansion andliberalization ofworld trade in dairy products underas stable as possible market conditions,on the basis of mutual benefit to exporting and importing countries, and to furthereconomic and social development in developing countries. In adopting these objectives,the economic importance of milk and dairy products to many countries was recognized,as weIl as the need to avoid surpluses and shortages and to maintain prices at an equitablelevel.
The objectives are advanced through the activities of the International DairyProducts Council and the Committees of the Protocols. Three Protocols annexed to theArrangement are integral parts of it: the Protocol Regarding Certain Milk Powders;the Protocol Regarding Milk. Fat and the Protocol Regarding Certain Cheeses.
Under these Protocols, minimum export prices have been established for skimmedmilk powder, whole milk powder, buttermilk powder, anhydrous milk fat, butter andcertain cheeses. The minimum expert prices are fixed for pilot products defined in theArrangement taking account, in particular, of the current market situation, dairy pricesin participating producing countries, the need to ensure equitable prices to consumers,and the desirability of maintaining a minimum return to the most efficient producers inorder to ensure stability of supply over the longer term. New minimum prices for allpilot products became effective on 20 September 1989 and have since remained unchanged.The minimum export prices for butter and anhydrous milk fat were suspended on4 May 1994 for a period of up to twelve months (Table 1).
Under specific circumstances, the Comnittees of the Protocols may grantderogations from the minimum export price requirements. Such a derogation was grantedin June 1993 by the Committee of the Protocol Regarding Milk Fat for sales of butterand butter oil to countries of the former Soviet Union, and extended twice, inDecember 1993 and in March 1994.

DPC/W/140Page 3
TABLE 1
Levels of Minimum Export Prices, 1980-94
(US$/metric ton f.o.b.)
Effective since
Pilot -products I Jan. 1 Oct. 1 Oct. 5 June 2 Oct. 25 June 23 Sept. 23 March 21 Sept. 20 Sept.
1980 1980 1981 1985 1986 1987 1987 1988 1988 1989
Skimmed 425 500 600 600 680 765 825 900 1,050 1,200milk powder
Whole milk 725 800 950 830 880 900 950 1,000 1,150 1,250powder
Buttermilk 425 500 600 600 680 765 825 900 1,050 1,200powder
Anhydrous 1|100 1.200 1,440 1,200 1.200 1,200 1.200 1,325 1,500 1.625*milJc fat*
Butter* 925 1.000 1,200 1,000 1,000 1,000 1,000 1,000 1,250 1,350*
Certain 800 900 1,000 1,000 1,030 1.030 1,120 1,200 1,350 1,500cheeses
*Minimum export prices were suspended on 4 May 1994 for a period of up to twelve months.

DPC/W/140Page 4
Explanatory Note
The present report has been prepared by the Secretariat in accordance with Article IV: 1 ofthe Arrangement and Rule 29 of the Rules of Procedure. The aim of this report is to facilitate thework of the Council and the Committees at their meetings in September 1994.
In preparing the report, the Secretariat based itself on replies to questionnaires, other informationsubmitted by participants and observers as well as information arising from the operation ofthe ProtocolRegarding Certain Milk Powders, the Protocol Regarding Milk Fat and the Protocol Regarding CertainCheeses. Furthermore, the Secretariat used supplementary information available from the Food andAgriculture Organization of the United Nations (FAO), the International Dairy Federation (IDF), theUN/Economic Commission for Europe (ECE), the Organisation for Economic Co-operation andDevelopment (OECD), the Commission ofthe European Communities, Agriculture Canada, the UnitedStates Department of Agriculture, Zentrale Markt- und Preisberichtstelle (ZMP), Agra Europe andother selected national and private sources.
Asterisks appearing in the body of this document indicate International Dairy Arrangementparticipants.
The report provides information on production, consumption, trade, stocks and prices for milkand principal dairy products in 1993. It covers developments in dairy policies through 1993, and,where possible, the outlook for 1994. The report should be read in conjunction with the statisticalinformation circulated in the following documents:
DPC/W/141 - Milk Deliveries and Production - Statistical Note by the Secretariat
DPC/PTL/W/143 - Committee of the Protoccl Regarding Certain Milk Powders -Summary Tables
DPC/PTLIW/144 - Committee ofthe Protocol Regarding Milk Fat - Summary Tables
DPC/PTL/W/145 - Committee of the Protocol Regarding Certain Cheeses - SummaryTables
Delegations wishing to suggest modifications or corrections, or to provide additional information,are invited to make submissions to the Secretariat, preferably in writing, as soon as possible. Suchsubmissions might cover both the present report and the statistical information mentioned above. Thedrafting of the present report was completed on 15 August 1994.

DPC/W/140Page 5
TABLE OF CONTENTS
Page
WORLD DAIRY MARKET HIGHLIGHTS
WORLD TRADE AND ECONOMIC ACTIVITY
AN OVERVIEW OF DAIRY POLICIES
WORLD MILK PRODUCTION AND CONSUMPTION
MILK POWDERSSkimmed Milk PowderWhole Milk Powder
BUTTER AND ANHYDROUS MILK FATButter and Butter OilAnhydrous Milk Fat
CHEESE
OTHER DAIRY PRODUCTSWhey in powder or block or concentrateConcentrated milkCasein
FOOD AID
INTERNATIONAL DAIRY PRICES
DAIRY PRODUCTION AND POLICIESAND REGIONS
NEW ZEALAND*Milk PowdersButter and Butter OilCheeseCasein
AUSTRALIA*Milk PowdersButter and Butter OilCheese
EUROPEAN COMMUNITIES*Milk PowdersButter and Butter OilCheese
Other Dairy Products
IN SELECTED COUNTRIES3535363637373738383939404141
42
9
10
11
13
151518
202024
26
30303030
31
32

DPC/W!140Page 6
Page
FINLAND* 42NORWAY* 43SWEDEN* 44SWITZERLAND* 45POLAND* 45HUNGARY* 48ROMANIA* 50BULGARIA* 51CZECH REPUBLIC 52SLOVAK REPUBLIC 53COMMONWEALTH OF INDEPENDENT STATES 53
Russia 54Ukraine 54Belarus 55
BALTIC REPUBLICS 55JAPAN* 56ARGENTINA* 57URUGUAY* 58BRAZIL 58UNITED STATES 58
Milk, Powders 60Butter and Butter Oil 60Cheese 61Other Dairy Products 61
CANADA 61MEXICO 63SOUTH AFRICA* 65EGYPT* 65ISRAEL 66ALGERIA 66INDIA 67CHINA 67KOREA 68
* Participant in the International Dairy Arrangement.
DPC/W/140Page 7
Page
TABLES
Table 1 - Levels of Minimum Export Prices 1980-94 3
Table 2 - Major Milk Producers 13
Table 3 - Major Skimmed Milk Powder Exporters 15
Table 4 - Major Skimmed Milk Powder Importers 15
Table 5 - Major Butter Producers 20
Table 6 - Major Butter Exporters 22
Table 7 - Major Butter Importers 22
Table 8 - Major Cheese Producers 26
Table 9 - Major Cheese Exporters 27
Table 10 - Major Cheese Importers 27
Table 11 - International Dairy Prices 1991-94 33
Table 12 - NZ Dairy Production in 1993/94 and Forecast for 1994/95 35
Table 13 - Australian Market Support Rates 38
Table 14 - Poland - Trade in Dairy Products 48
Table 15 - Hungary - Dairy Production 49
Table 16 - Trade and Consumption 49
Table 17 - Romania - Production and Trade 50
Table 18 - Bulgaria - Cheese Production and Trade 51
Table 19 - Bulgaria - Trade in Dairy Products 52
Table 20 - Czech Republic - Trade and Production in Dairy Products 53
Table 21 - Dairy Exports to Mexico in 1993 by Main Suppliers 64
Table 22 - Dairy Exports to Algeria in 1993 by Main Suppliers 67
GRAPHS
Graph 1 - Skimmed Milk Powder Production 1980-1993 16
Graph 2 - Skimmed milk Powder Exports 1980-1993 16
Graph 3 - Skimmed Milk Powder Stocks 1980-1994 17
Graph 4 - Skimmed Milk Powder Prices 1980-1994 17
Graph 5 - Whole Milk Powder Production 1980-1993 18
Graph 6 - Whole Milk Powder Exports 1980-1993 19
Graph 7 - Whole Milk Powder Prices 1980-1994 19

DPC/W/140Page 8
Page
Graph 8 - Butter Production 1980-1993 22
Graph 9 - Butter Exports 1980-1993 23
Graph 10 - Butter Stocks 1980-1994 23
Graph 11 - Butter Prices 1980-1994 24
Graph 12 - Anaydrous Milk Fat Production and Exports 1980-1993 25
Graph 13 - Anhydrous Milk Fat Prices 1980-1994 25
Graph 14 - Cheese Production 1980-1993 27
Graph 15 - Cheese Exports 1980-1993 28
Graph 16 - Cheese Stocks 1980-1994 28
Graph 17 - Cheese Prices 1980-1994 29
Graph 18 - Price Indices for Skimmed Milk Powder and Whole Milk Powder 34
Graph 19 - Price Indices for Butter and Cheese 34
Graph 20 - Milk Production and Deliveries in Poland 46

DPC/W/140Page 9
WORLD DAIRY MARKET HIGHLIGHTS
O World production of milk continued its declining trend in 1993. Production of all types ofmilk (including sheep, goat and buffalo milk) declined by 1 h per cent to 517 million tons.
O Production continued to decline throughout Europe. In the European Communities and otherNorthernandWesternEuropeancountries, modest declines resulted from governmental policiesto reduce production. There were steeper drops in dairy production in most of the Centraland Eastern European countries and the former Soviet Union. Continuing difficulties arisingfrom the economic restructuring of these countries has prevented dairy output from reachingits pre-transition levels.
C As a result of favourable weather, good herd conditions, higher farm prices and increasedsupplemental feeding, Australian and New Zealand production in 1993 reached record levels,the second consecutive year for New Zealand. High output is expected to be maintained inboth countries also for 1994.
O World production of skimmed milk powder remained stable in 1993, but is expected to declineby 4 per cent in 1994. Production of whole milk powder increased slightly in 1993. Worldmarket prices of both milk powders have declined somewhat from their relatively high 1992levels. Exports of skimmed milk powder returned to their declining trend in 1993, whereasthose of whole milk powder increased.
a World production of butter and butter oil continued its long-term diminishing trend in 1993,in spite of a slight increase in production in the European Communities. World consumptionalso continued to decline, although this trend seemed to be levelling offin a number ofcountries.Prices for butter and butter oil declined further in 1993, and sales of butter below the IDAminimum price level were frequently reported. Exports of butter continued to decline.
O In June 1993, the Committee of the Protocol Regarding Milk Fat granted a derogation fromthe minimum price provisions for sales of butter and butter oil to the former Soviet Union.The duration of the derogation was twice extended (in December 1993 and March 1994) andthe quantity eligible for the derogation increased. As a result, participants to the InternationalDairy Arrangement were exempted from the minimum price provisions for a total of 66,500 tonsof butter or butter oil exports per participant contracted before the end of May 1994, anddelivered before the end ofAugust 1994. Under these derogations, sales totalling 85,500 tonshad been notified by 31 May 1994.
O As of4 May 1994, the Committee of the Protocol Regarding Milk Fat decided to suspend theminimum export prices for butter and anhydrous milk fat for a period of up to twelve months.World market prices for butter and butter où will be kept under review, to permit re-introductionof an appropriate minimum price level as soon as feasible.
O World cheese production continued to expand in 1993, encouraged by the continuing rise indemand. Prices for Cheddar cheese remained relatively high throughout 1993 and the firsthalfof 1994. With demand for cheese growing more rapidly than production, high price levelsand continuing export growth are expected to be sustained in the near future.

DPC/W/140Page 10
WORLD TRADE AND ECONOMIC ACTIVITY
1. The volume growth of world trade in 1993 was estimated at 3 per cent, down from 5 ½h per centin the previous year. World output growth was up slightly last year to just below 2 per cent. Boththe figures for world trade and output growth remained well below the averages for the previous decade,confirming that the period of slow growth for the world economy, which began in 1989, continuedin 1993.
2. World trade on a value basis was US$3.6 trillion in 1993, down 1½ per cent. The gap betweenthe growth ofworld trade in volume and in value terms is explained by valuation effects such as decliningaverage fuel and non-fuel commodity prices and the appreciation of the US dollar with respect to majorEuropean currencies.'
3. Last year's slower pace of world trade activity in volume terms was largely due to recessionaryconditions in Western Europe, which led to a sharp decline in total imports of Western Europe, down3 ½h per cent.2 In contrast, import demand rose 10 per cent in Asia and 1½ per cent in North America.Although Latin America's import growth slowed sharply in 1993, estimates still point to a figure abovethe world average. Import volumes also rose at rates well above the world average in Central Europe.For other regions, preliminary estimates point to a stagnation in the import volumes of Africa, anddeclines for the Middle East and for the States comprising the former Soviet Union.
4. The recession in Western Europe contributed to a weaker export performance for regions forwhich Western Europe is the primary export market. In Asia, the region's import growth gave a strongstimulus to intra-regional trade and consequently to export volumes, up 7½ per cent, in spite of thecontinuing weakness in Japan and a sharp deceleration in China's export growth. Export volume growthin North America slowed due to weakness in the markets of Western Europe and Japan, as well asthe slowdown in import demand ofLatin America. Preliminary estimates indicate that growth ofexportvolumes in Latin America remained well above the world average. boosted by shipments to tradingpartners within the region and to Nort. America.
5. Evidence available as ofmid- 1994 points to the start ofeconomic recovery in Western Europe,mainly due to growth of exports. Growth in domestic demand, and consequently import demand,remains weak. Encouraging signs of a turnaround are also appearing in Japan. Together with thecontinuing moderate pace of growth being recorded in North America, Australia and New Zeaiand,the broader basis of economic activity among the OECD countries points to a rebound of economicand trade activity in 1994 and beyond for the OECD as a whole. In turn, recovery in the OECDcountries will help sustain the dynamic level of trade and economic activity in developing countriesas a whole. On a global basis, trade growth in 1994 is expected to be double the 1993 pace, in thevicinity of 7 per cent.
'In order to make trade figures of countries with different currencies comparable, world trade is denominated in US dollars.This affects the comparison with volume figures when currency movements (principally ofthe yen and ECU), or commodityprice changes. are important. Valuation effects in 1993 include the positive effect on world trade values of the appreciationof the yen relative to the US dollar, the negative effect of the depreciation of the ECU relative to the US dollar, and thedecline in US dollaï-denominated commodity prices.
2These world trade statistics include trade between the members of the European Union. Trade between the memberStates of the EU amounted to roughly one quarter of world merchandise trade in 1993.

DPC/W/140Page 11
AN OVERVIEW OF DAIRY POLICIES
6. The conclusion of the Uruguay Round negotiations should have significant but varying effectson different segments of the world dairy industry. Quotas and other non-tariff barriers to imports,whose use is widespread in the dairy sector, will be converted to more transparent tariffs ("tariffication").The levels of both the converted tariffs and existing tariffs will be reduced and bound. The phasedreduction ofthe tariffs should expand export opportunities for competitive dairy exporters. For productssubject to tariffication, minimum import levels of 3 per cent of total consumption will be permitted,rising to 5 per cent at the end of the six-year implementation period. Since imports of dairy productsinto many potential markets are now severely limited by quotas, these minimum access requirementsshould also contribute to expanded sales opportunities. Some countries stand to benefit from therequirement that import access should not be more restrictive than what was permitted during the 1986-88reference period. Under this provision, for example, the European Conmunities' quota for New Zealandbutter will be increased to the 76,700 ton average of 1986-88.
7. The phased reduction of export subsidies, particularly the 21 per cent reduction of the quantityofproduct benefiting from export subsidies in the 1986-90 reference period, will affect the internationalmarket for some dairy products, particularly cheese. Because exports of cheese have continued toincrease since the reference period, the quantitative reduction obligations for a number of subsidizingcountries will actually exceed 21 per cent. Recently introduced or expanded export subsidy programmes,such as the US Dairy Export Incentive Program (DEIP),. should also be significantly affected.
8. The required reduction of certain types of domestic agricultural support programmes shouldcomplement the policies already in place in many dairy producing countries. The EuropeanCommunities, the Nordic countries and Canada have been pursuing policies aimed at reducing surplusproduction and public expenditures through restrictive production quotas or reduced support prices.
9. Austria, Finland, Norway and Sweden concluded negotiation of the terms for their accessionto the European Communities in March 1994. Approval ofthe accession is being sought through publicreferendum (decided positively in Austria on 12 June 1994, scheduled for Finland in October and Norwayand Sweden in November). The application of the Common Agricultural Policy to the dairy sectorsof these countries will lead to considerable changes. In particular, on-going policies to reduce dairyproduction and support to farmers in the Nordic countries may be reversed.
10. In New Zealand and Australia excellent weather conditions, expanded dairy herds and relativelyhigh export price returns combined to result in record milk production for the second consecutive yearin 1993. The dairy cow herd in New Zealand has been expanding in the past decade, as dairying hasbecome a more attractive alternative than other traditional (sheep and cattle) operations. Productivityincreases in Australia have offset the long-tern decline in the national herd size. Expanded outputis expected to he maintained in 1994.
11. The dairy sectors of most Central and Eastern European countries continued to suffer fromthe economic restructuration. Production levels remained low while higher real retail prices and increasedavailability of competitive imported products discouraged traditional demand. A number of thesecountries retain the potential to become major dairy producers and exporters, but recovery of theirdairy sectors is not expected in the coming years.
12. The US DEIP allocation for 1994 is for a total of 169,850 tons of dairy products. This issubstantially below the initial allocations provided in 1993 (258,235 tons) and in 1992 (197,300 tons).The 1994 allocation, however, is much closer to what actual export levels have been: 156,800 tonsin 1993 and 155,500 tons in 1992. The 1994 DEIP makes available 136,900 tons of milk powder,

DPC/W/140Page 12
27,450 tons of butterfat and 5,500 tons of cheese. In 1993, Algeria and Mexico were the major DEIPrecipients, although DEIP sales to these two countries in the first half of 1994 have been minimal.
13. Dairy productivity continues to increase worldwide, through genetic improvements and augmentedfeed supplies. Many developing countries pursue programmes to expand their dairy industry productivityand yields. Since February 1994, the yield-enhancing hormone bovine somatotropin (BST), has beenavailable for commercial use in the United States. The use of BST has the potential of increasing milkyields in treated dairy cows by as much as 15 per cent. The extent of actual use of BST, which hasmet with considerable consumer resistance, is not yet known. In December 1993, the EuropeanCommunities extended by one year its ban on the use of BST.
14. The steadily increasing demand for certain dairy products, notably cheese and dairy proteins,and the resultant increase in their prices have stimulated the output and sales of a wide variety of dairysubstitutes. Dairy imitations often contain milk components such as casein, whey and skimmed milkpowder. Furthermore, in a number of new dairy products, notably light products and flavoured products,milk components (mostly fat) have frequently been replaced by ingredients of vegetable origin.
DPC/W/ 140Page 13
WORLD MILK PRODUCTION AND CONSUMPTION
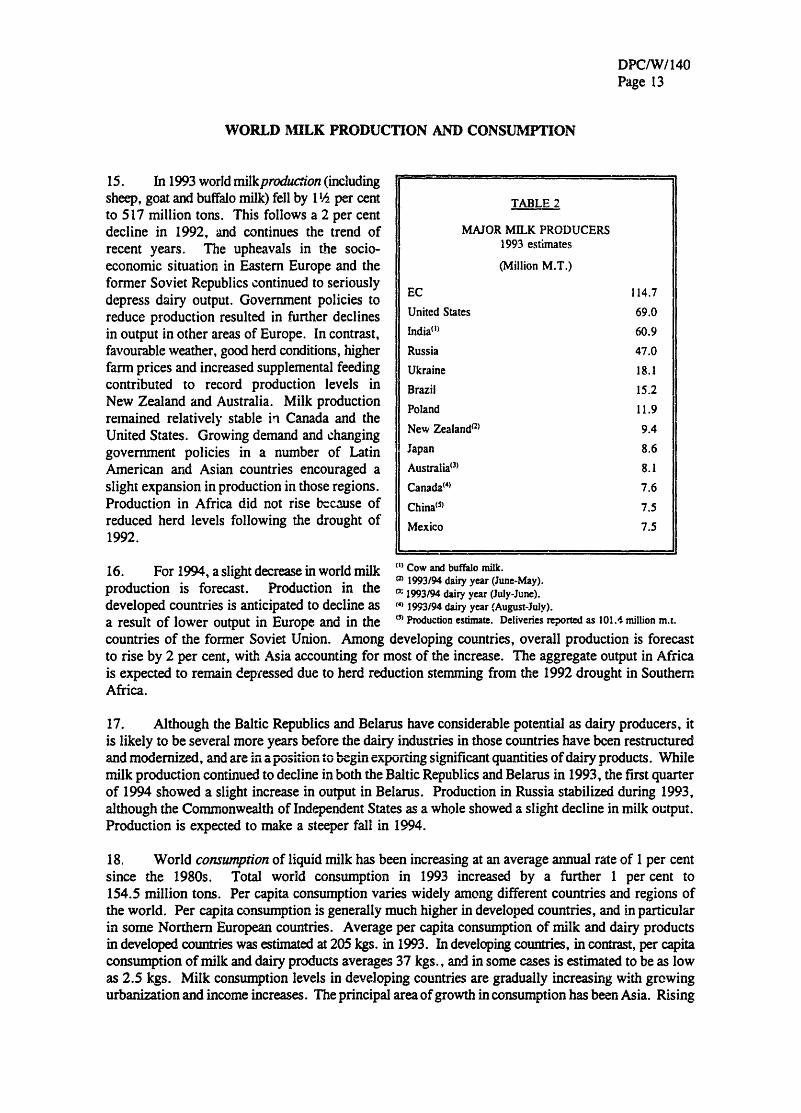
15. In 1993 world milkproduction (includingsheep, goat and buffalo milk) fell by 1½ per cent TABLE 2to 517 million tons. This follows a 2 per centdecline in 1992, and continues the trend of MAJOR MILK PRODUCERSrecent years. The upheavals in the socio- 1993 estimateseconomic situation in Eastern Europe and the (Million M.T.)former Soviet Republics continued to seriouslydepress dairy output. Government policies to EC 114.7reduce production resulted in further declines United States 69.0in output in other areas of Europe. In contrast, India(') 60.9favourable weather, good herd conditions, higher Russia 47.0farm prices and increased supplemental feeding Ukraine 18.1contributed to record production levels in Brazil 15.2New Zealand and Australia. Milk production Poland 11.9remained relatively stable ii Canada and the 9.4United States. Growing demand and changing New Zealand(2) 9.4government policies in a number of Latin Japan 8.6American and Asian countries encouraged a Australia(3) 8.1slight expansion in production in those regions. Canada(') 7.6Production in Africa did not rise because of China(<5 7.5reduced herd levels following the drought of Mexico 7.51992.
16. For 1994, a slight decrease in world milk " Cow and buffalo milk.forecast.Prodction in the 1993/94 dairy year (June-May).
production is forecast. Production in the 1993/94 dairy year (July-June).developed countries is anticipated to decline as (4) 1993/94 dairy year (August-July).a result of lower output in Europe and in the (5)Production estimate. Deliveries reported as 101.1, million m.t.countries of the former Soviet Union. Among developing countries, overall production is forecastto rise by 2 per cent, with Asia accounting for most of the increase. The aggregate output in Africais expected to remain depressed due to herd reduction stemming from the 1992 drought in SouthernAfrica.
17. Although the Baltic Republics and Belarus have considerable potential as dairy producers, itis likely to be several more years before the dairy industries in those countries have been restructuredand modernized, and are in a positiontobeginexporting significant quantities ofdairy products. Whilemilk production continued to decline in both the Baltic Republics and Belarus in 1993, the first quarterof 1994 showed a slight increase in output in Belarus. Production in Russia stabilized during 1993,although the Commonwealth of Independent States as a whole showed a slight decline in milk output.Production is expected to make a steeper fall in 1994.
18. World consumption of liquid milk has been increasing at an average annual rate of 1 per centsince the 1980s. Total world consumption in 1993 increased by a further 1 per cent to154.5 million tons. Per capita consumption varies widely among different countries and regions ofthe world. Per capita consumption is generally much higher in developed countries, and in particularin some Northern European countries. Average per capita consumption of milk and dairy productsin developed countries was estimated at 205 kgs. in 1993. In developing countries, in contrast, per capitaconsumption of milk and dairy products averages 37 kgs., and in some cases is estimated to be as lowas 2.5 kgs. Milk consumption levels in developing countries are gradually increasing with growingurbanization and income increases. The principal area ofgrowth in consumption has been Asia. Rising
DPC/W/140Page 14
incomes and changing food consumption habits provide a strong boost to demand for milk and dairyproducts. Many countries subsidize school milk and other campaigns to promote milk consumption.As a result, per capita milk consumption has steadily increased in countries such as the Republic ofKorea, Thailand, Indonesia, China and India. Consumption also increased in Latin America, particularlyin Mexico, Argentina and Chile.
19. In many Central and Eastern European countries, as well as in the former Soviet Union,per capita milk consumption has traditionally been very high. Since 1990, however, reduced milksupplies, rapid increases in retail prices, reduced purchasing power, distribution problems and otherstructural inefficiencies have led to important reductions in the consumption of milk and fresh milkproducts. Consumption in these countries continued to decline in 1993, especially in Hungary andthe CIS.
20. Per capita demand for milk has ceased to grow ina number ofdeveloped countries as a responseto concerns about the adverse health effects oftoo much fat in diets, and as substitute products becomeincreasingly available. Consumers in the European Communities and other Western European countries,as weil as in North America, show a growing preference for semi-skimmed types of milk and otherreduced-fat or reduced-calorie products. In the European Communities, this has resulted in no overallchange in consumption, whereas milk consumption has declined in some other Western Europeancountries and Canada.
21. The consumption of other fresh milk products, such as yogurt and other fermented or flavouredmilk, has increased steadily in a number of countries and is expected to continue its upward trend.The consumption of flavoured milk is also developing rapidly. In the European Communities, freshproduct output increased by 1 per cent in 1993. It is estimated that more than 30 per cent of the milkcollected is now marketed in this form. This development clearly reflects the underlying trend inconsumption. There is a potential demand for yogurt and flavoured milk in many developing countries,but consumption continues to be hampered by relatively high prices.
22. The strong demand for milk products has encouraged the development and production of dairysubstitutes and imitations, which to a variable degree contain milk components. Market informationfor such products is difficult to obtain, but it is generally believed that their role in the market stillremains limited in quantitative terms. Their increased availability in Central and Eastern Europeanmarkets is notable, however.

DPC/W/140Page 15
MILK POWDERS
Skimmed Milk Powder
23. World production of skimmed milk powder is expected to decline by 4 per cent in 1994. In1993, production remained stable at 3.20 million tons. Increases in output in the European Communities,the United States and Australia were offset by declines in other Western European countries and Canada.
24. World consumption of skimmed milk powder continued to decline in 1993, as world pricesremained relatively high. Imports increased in some developing countries.
25. After having increased in 1992, world expots ofskimmed milk powder returned to their decliningtrend of recent years and dropped to 800,000 tons in 1993. Exports from the European Communities,New Zealand and Canada declined substantially, whereas those of Australia and the United Statesincreased.
26. World stocks of skimmed milk powder decreased substantially in 1992, reflecting successfulefforts to reduce production and increase exports. Stocks remained low in all major producing countriesin 1993 and throughout the first half of 1994.
27. In the first halfof 1993, prices for skimmed milk powder dropped slightly in the face ofreduceddemand, in part due to exchange rate movements and some offers at lower prices. Prices declinedmore sharply in the third quarter, and offers below the minimum price were reported, mostly of EasternEuropean origin. Prices firmed in the fourth quarter of 1993, but then declined slightly in the firsthalf of 1994. The minimum export price lh been maintained at US$1,200 per ton fio.b. sinceSeptember 1989.
28. At their September 1993 meetings, the GATT Dairy Committees reviewed the minimum exportprices for products covered by the Protocols. New Zealand repeated its proposal to increase theminimum prices specified under the Protocol Regarding Certain Milk Powders, indicating that suchan increase remained justified in light of the criteria of Article 3:3(b) of the Protocol. There was,however, no consensus at that time to manke any changes in the minimum prices.
(I) Excluding EC intra-trade.
TABLE 3
MAJOR SKIMMED MILK POWDEREXPORTERS
1993 estimates
(Thousand M.T.)
EC(s) 299
Australia 118
New Zealand 107
Poland 86
United States 76
TABLE 4
MAJOR SKIMMED MILK POWDERIMPORTERS1993 estimates
thousandd M.T.)
Mexico 160Algeria 150
Japan 74
India 25Brazil 23
_

DPC/W/140Page 16
5.2
4.2
3.2
2.2
Graph 1 - SKIMMED MILK POWDER PRODUCTION1980- 1993
1980 81 82 83 84 85 86 87Years
88 89 90 91 92 93
Graph 2 - SKIMMED MILK POWDER EXPORTS1980- 1993
1980 81 82 83 84 85 86 87 88 89 90 91 92 93Years
o
2
World
IDA.
1.2
1,500
1,300
.
1,100
900
700
500
300

DPC/W/140Page 17
Graph 3 - SKIMMED MILK POWDER STOCKS 1980 - 1994IDA Participants and Austria, Canada and the US
Years
Graph 4 - SKIMMED MILK POWDER PRICES 1980 - 19942,5002,3002,1001,9001,7001,5001,300 International Price
1,100900MinimumPriceiuPic
700500
1980 81 82 83 84 85 86 87 88 89 90 91 92 93 54 .
Years
n
2,500
2,000
1,500
1,000
500
0
j
uu
DPC/W/140Page 18
Whole Milk Powder
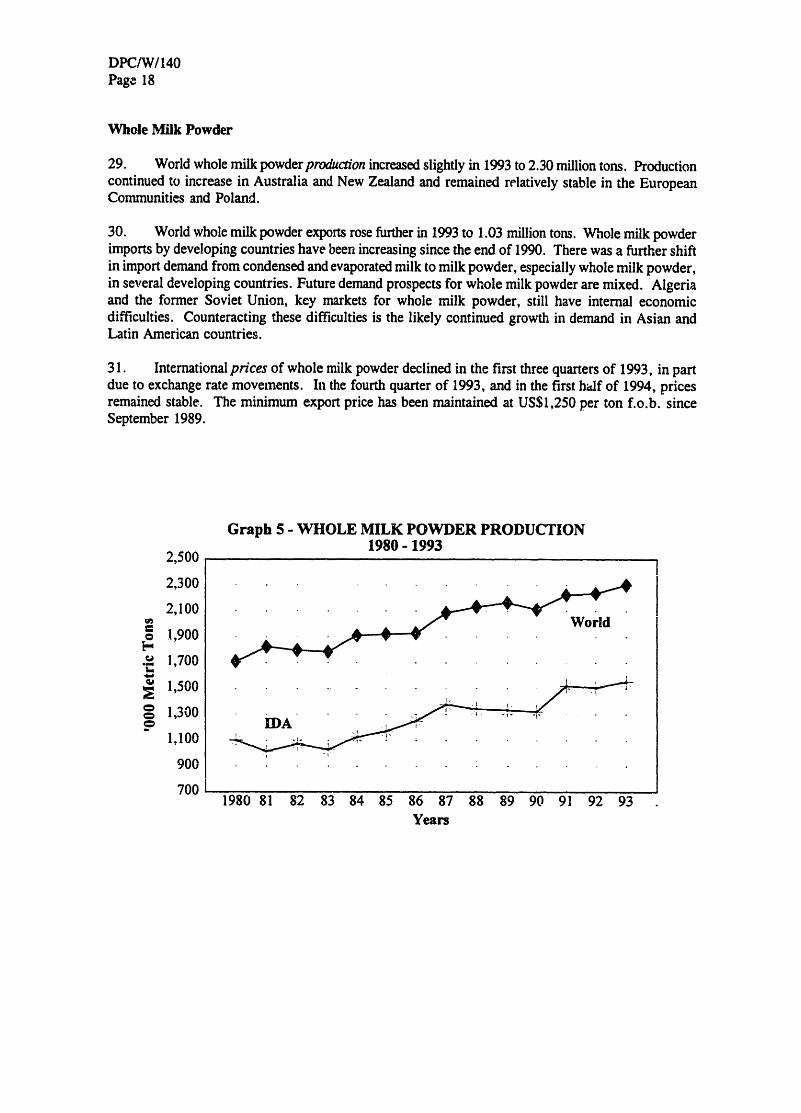
29. World whole milk powder production increased slightly in 1993 to 2.30 million tons. Productioncontinued to increase in Australia and New Zealand and remained relatively stable in the EuropeanCommunities and Poland.
30. World whole milk powder exports rose further in 1993 to 1.03 million tons. Whole milk powderimports by developing countries have been increasing since the end of 1990. There was a further shiftin import demand from condensed and evaporated milk to milk powder, especially whole milk powder,in several developing countries. Future demand prospects for whole milk powder are mixed. Algeriaand the former Soviet Union, kcy markets for whole milk powder, still have internal economicdifficulties. Counteracting these difficulties is the likely continued growth in demand in Asian andLatin American countries.
31. International prices of whole milk powder declined in the first three quarters of 1993, in partdue to exchange rate movements. In the fourth quarter of 1993, and in the first h;lf of 1994, pricesremained stable. The minimum export price has been maintained at US$1,250 per ton f.o.b. sinceSeptember 1989.
c
2,500
2,300
2,100
1,900
1,700
1,500
1,300
1,100
900
700
Graph 5 - WHOLE MILK POWDER PRODUCTION1980-1993
1980 81 82 83 84 85 86 87 88 89 90 91Years
92 93
World
l
IDA i.-i . -

DPC/W/140Page 19
Graph 6 - WHOLE MILK POWDER EXPORTS1980 - 1993
1980 81 82 83 84 85 86 87 88 89 90 91 92 93Years
Graph 7 - WHOLE MILK POWDER PRICES 1980 - 1994
90 91 92 93 94.
1,100
u
n
1,000
900
800
700
600
World
500
400
i
i
o
n
2,3002,1001,9001,7001,5001,3001,100900700500
87 88Years
DPC/W/140Page 20
BUTTER AND ANHYDROUS MILK FAT
Butter and Butter Oil
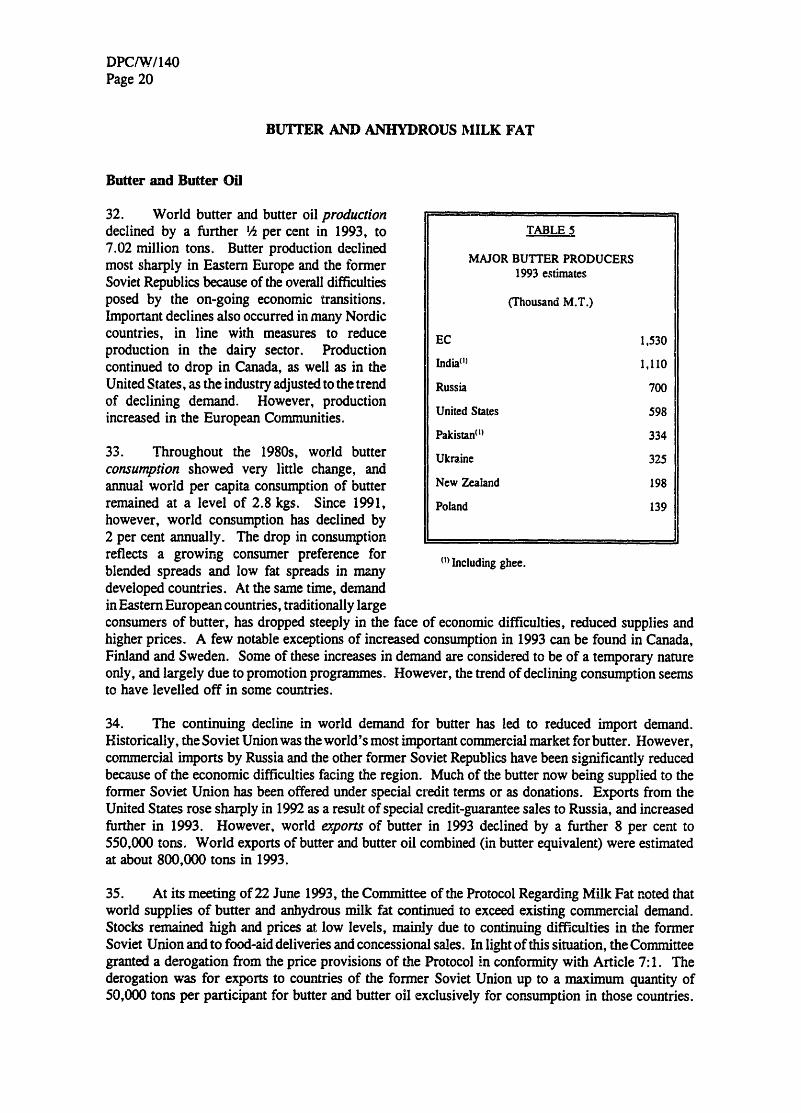
32. World butter and butter oil productiondeclined by a further ½ per cent in 1993, to TABLE 57.02 million tons. Butter production declined BUTTER PRODUCERSmost sharply in Eastern Europe and the former MAJOR1993 estimatesSoviet Republics because of the overall difficultiesposed by the on-going economic transitions. (Thousand M.T.)Important declines also occurred in many Nordiccountries, in line with measures to reduce EC 1,530production in the dairy sector. Production . Icontinued to drop in Canada, as well as in the India 1,110United States, as the industry adjusted to the trend Russia 700of declining demand. However, production Iincreased in the European Comrunities. United States 598
Pakistan(1) 33433. Throughout the 1980s, world butter Ukraine 325consumption showed very little change, andannual world per capita consumption of butter New Zealand 198remained at a level of 2.8 kgs. Since 1991, Poland 139however, world consumption has declined by2 per cent annually. The drop in consumptionreflects a growing consumer preference for <1>Including ghee.blended spreads and low fat spreads in manydeveloped countries. At the same time, demandin EasternEuropean countries, traditionally largeconsumers of butter, has dropped steeply in the face of economic difficulties, reduced supplies andhigher prices. A few notable exceptions of increased consumption in 1993 can be found in Canada,Finland and Sweden. Some of these increases in demand are considered to be of a temporary natureonly, and largely due to promotion programmes. However, the trend of declining consumption seemsto have levelled off in some countries.
34. The continuing decline in world demand for butter has led to reduced import demand.Historically, the Soviet Union was the world's most important commercial market for butter. However,commercial imports by Russia and the other former Soviet Republics have been significantly reducedbecause of the economic difficulties facing the region. Much of the butter now being supplied to theformer Soviet Union has been offered under special credit terms or as donations. Exports from theUnited States rose sharply in 1992 as a result of special credit-guarantee sales to Russia, and increasedfurther in 1993. However, world exports of butter in 1993 declined by a further 8 per cent to550,000 tons. World exports of butter and butter où combined (in butter equivalent) were estimatedat about 800,000 tons in 1993.
35. At its meeting of 22 June 1993, the Committee of the Protocol Regarding Milk Fat noted thatworld supplies of butter and anhydrous milk fat continued to exceed existing commercial demand.Stocks remained high and prices at low levels, mainly due to continuing difficulties in the formerSoviet Union and to food-aid deliveries and concessional sales. In light ofthis situation, the Committeegranted a derogation from the price provisions of the Protocol in conformity with Article 7:1. Thederogation was for exports to countries of the former Soviet Union up to a maximum quantity of50,000 tons per participant for butter and butter oil exclusively for consumption in those countries.

DPC/W/140Page 21
This derogation was for sales contracts unconditionally concluded before 31 December 1993 anddeliveries completed by 31 March 1994. Other provisions were designed to ensure that butter andbutter oil exported under this derogation to countries of the former Soviet Union were not deviatedto other countries. At its meeting of 20 December 1993, the Committee noted the continuing seriousnessof the situation facing the world butterfat market and the limited quantities of sales that had been madeunder the derogation of 22 June 1993. It decided to extend the period for concluding sales contractsunder the derogation until 31 March 1994, and the period for concluding deliveries under the derogationuntil 30 June 1994. All other conditions regarding the sales remained the same. At its meeting on29 March 1994, the Committee decided to again extend the derogation in view of limited opportunitiesfor sales above the existing minimum prices into the countries ofthe former Soviet Union. The extensionof the derogation applied to sales contracts unconditionally concluded before 31 May 1994 and deliveriesto be completed by 31 August 1994, and for a maximum of 16,500 metric tons (butter equivalent)in addition to the 50,000 tons per participant permitted under the previous Decisions.
36. These derogations permitted an increase in exports from some IDA participants. By31 May 1994, the following participants had notified the conclusion ofcontracts: Australia (16,500 tons),Finland (11,108 tons), Hungary (506 tons), New Zealand (50,000 tons) and Poland (7,388 tons).
37. At a special meeting on 2-3 May 1994, the Committee of the Protocol Regarding Milk Fatreviewed the level ofthe minimum prices. It noted the continuing structural imbalance facing the worldmarket for butterfats, and its Decisions to grant a derogation from the minimum price obligations forsales to the former Soviet Union area in light ofthe lack ofthe opportunities for sales above the minimumprice levels to that important market. The Committee noted the differing analyses ofthe market situationby participants and the difficulties of reaching agreement on an appropriate level of minimum pricesin the current market situation. In light of these considerations, the Committee decided to suspendthe minimum prices for butter and anhydrous milk fat for a period of up to twelve months as of4 May 1994.
38. On 1 January 1994, total stocks of butter in the European Communities, North America andOceania amounted to 417,000 tons, 25 per cent less than their level one year earlier. On 1 April 1994,stocks in these countries amounted to 370,000 tons, 24 per cent less than on 1 April 1993. In particular,there were steep decreases in stocks in the United States and New Zealand, with a smaller decline inthe European Communities. On 1 July 1994, stocks ofbutter in the main producing countries remainedrelatively high, even if substantially below 1993's level.
39. World butterprices continued to decline in the first halfof 1993 and demand for butter remainedweak. In the second halfof 1993, the world market situation for butter remained depressed, with demandvery low and concessional sales and donations continuing to have a negative effect on commercialdemand. Sales of butter below the minimum price were frequently reported. In the first quarter of1994, prices were in the range ofUS$1,350-US$1,500per ton. They declined to the range ofUS$1,100-US$1,500 per ton in the second quarter of 1994. Butter prices will continue to be under pressure atleast during the remainder of 1994.

DPC/W/140Page 22
(1) Exports of butter and milk fat in butter equivalent.(2) Excluding EC intra-trade.
10
e
v*
8
6
4
2
Graph 8 - BUTTER PRODUCTION 1980 - 1993
1980 81 82 83 84 85 86 87 88 89 90 91 92 93Years
TABLE 6
MAJOR BUTTER EXPORTERS1993 estimates
(Thousand M.T.)
New Zealand 196US(1) 121EC(2) 99
Australia 41Sweden 21Finland 17Poland 17
TABLE 7
MAJOR BUTTER IMPORTERS1993 estimates
(Thousand M.T.)
Former Soviet Union 160-180EC(2) 60
Egypt 45Algeria 43Poland 6Switzerland 6
0
IDA

DPC/W/140Page 23
Graph 9 - BUTTER EXPORTS 1980 - 1993
1980 81 82 83 84 85 86 87 88 89 90 91 92 93Years
Graph 10 - BUTTER STOCKS 1980 - 1994IDA Participants and Austria, Canada and the US
Jan Jan Jan Jan Jan
81 82 83 84 85
. . . . . . .. . . . . . . . ..I
........Jan.J..
86 87
Years
Jan Jan Jan Jan Jan Jan Jan .
88 89 90 91 92 93 94
1,200
1,000
.ru
800
600
400
Ifnn
Go
5.i
2,000
1,800
1,600
1,400
1,200
1,000
800
600
400
200
191
Fan
VV

DPC/W/140Page 24
Graph 11 - BUTTER PRICES 1980 - 19942,8002,6002,400 International Price2,2002,0001,8001,6001,4001,200
1,000Minimum Price800600400
1980 81 82 83 84 85 86 87 88 89 90 91 92 93 94*Years
* Butter minimum price suspended, effective 4 Muy 1994.* Butter minimum price suspended from 16 November 1984 to 5 June 1985.
Anhydrous MiIk Fat
40. In parallel with butter, international prices of anhydrous milk fat weakened further in 1993and in the first half of 1994. Certain sales were reportedly made at prices below the minimum exportprice. Future prices and sales ofanhydrous milk fat remain sensitive to competition from vegetable oils.

DPC/W/140Page 25
Graph 12 - ANHYDROUS MILK FATPRODUCTION & EXPORTS 1980 - 1993
(IDA participants only)
83 84 85 86 87 88 89 90 91 92 93Years
Graph 13 - ANHYDROUS MILK FAT PRICES 1980 - 1994
Years* Anbydrous Milk Fat minimum price suspended, effective 4 May 1994.* Anhydrous Milk Fat minimum price suspended from 16 November 1984 to 5 June 1985.
400
oe
EtMîCi
Qn
300
200
100
O
3,100
2,800
2,500
2,200
1,900
1,600
1,300
1,000
700
i
i
r

DPC/W/140Page 26
CHEESE
41. There was 1 per cent expansion in world production of cheese (all kinds including curd) in1993, to 14.9 million tons. Cheese production continued to grow in the European Communities,
Australia and New Zealand, in response togrowing demand and shifts away from butterproduction. In most Eastern European countries,
TABLE 8 however, production declined because of theMAJOR CHEESE PRODUCERS difficulties facing the dairy sectors as a whole.
1993 estimates Production also declined slightly in theUnited States.
(Thousand M.T.)42. In contrast to butter, world cheese
EC 5,550 consumption has grown by about 2 per cent perUnited States 2,932 year since the 1980s. Per capita consumption isEgypt 325 particularly high in Western Europe (aroundArgentina 321 13 kgs.) and in North America (around 11 kgs.).Russia 280 In these regions, demand for cheese is expected
Canada265 to expand at an annual rate of 2 to 3 per cent inAustralia 213 the 1990s. The demand for specialty cheeses isAustralia 213 growing more rapidly than that for traditionalNew Zealand 163 cheese, and there has been an increasing varietyUkraine 140 ofcheeses marketed in these developed countries.Switzerland 136 Consumption of cheese has also been growing
substantially in North Africa and the Middle Eastin recent years. The trend for growth in cheeseconsumption is expected to continue beyond 1994.
43. World cheese exports increased by 8 per cent in 1993, reaching 980,000 tons. Exports fromthe European Communities recovered, offsetting a slight decline from Switzerland. Australian andNew Zealand cheese exports continued to grow. These countries account for over 80 per cent of worldcheese exports.
44. On 1 January 1994, world cheese stocks were 9 per cent lower than a year earlier, and a furtherdecline was forecast for the end of 1994. Cheese carry-over stocks declined in the EuropeanCommunities, the United States, Canada, Argentina and Australia but increased somewhat inNew Zealand and Switzerland. On 1 July 1994, stocks of cheese in the main producing countries werelower than a year earlier. The domestic consumption and exports of most major cheese producersare expected to grow faster than production.
45. Cheddar cheese prices remained relatively high throughout 1993 and the first half of 1994.With demand for cheese growing more rapidly than production, cheese prices are expected to remainhigh for the remainder of 1994. The IDA minimum export price has been maintained unchanged atUS$1,500 per ton f.o.b. since September 1989.
46. The expansion in demand and consumption of cheese has encouraged the development andproduction of imitation cheeses, but such products still capture only a marginal share ofthe world market.However, cheese analogues, filled cheese and imitation cheese are, with some success, being marketedas ingredients for making pizzas and for other cooking applications, notably in the United States.

DPC/W/140Page 27
(1)Excluding EC intra-trade. (2)Information not available for certain major importerssuch as Egypt.
Graph 14 - CHEESE PRODUCTION 1980 - 1993
1980 81 82 83 84 85 86 87 88 89 90 91 92 93Years
TABLE 9
MAJOR CHEESE EXPORTERS1993 estimates
(Thousand M.T.)
EC(1) 524New Zealand 127Australia 87Switzerland 61
TABLE 10
MAJOR CHEESE IMPORTERS(2)1993 estimates
(Thousand M.T.)
United States 145Japan 134EC(1) 106Iran 82Poland 37Switzerland 30
18
16
e
u
n
e
14
12
10
8
6
World
IDA
4
2

DPC/W/140Page 28
Graph 15- CHEESE EXPORTS 1980 - 19931,000
900
800
700
600
1,200
I.000
800
600
400
1980 81 82 83 84 85 86 87 88 89 90 91 92 93Year
Graph 16- CHEESE STOCKS 1980 - 1994IDA Participants andAustria, Canada and the US
Jan Jan Jan Jan Jan Jan Jan Jan JanJanJanJan JanJanJan.1980 81 82 83 84 85 86 87 88 89 90 91 92 93 94
Years
World
IDA
,z
n
.

DPC/W/140Page 29
Graph 17- CHEESE PRICES 1980 - 19942,6002,4002,200
1600 International Price1,8001,6001,400 ie
1,2001,000800600400
1980 8182 83 84 85 86 87 88 89 90 91 92 93 94.Years

DPC/W/140Page 30
OTHER DAIRY PRODUCTS
Whey in powder or block or concentrate
47. Whey products are mainly by-products of cheese production. World production ofwhey powderincreased by a further 2 per cent to 1.71 million tons in 1993, in parallel with developments in productionof cheese. The main increases were registered in the European Communities and the United States.The production of other related milk concentrates, including lactose, also continued to expand, butlittle data is available for such products. In the past, much of the whey went into sewage systems aswaste. Many countries have now imposed environmental regulations preventing whey to be disposedofas waste, increasingthe commercial availabilityofwhey, notably inAustralia, Canada, the EuropeanCommunities and the United States.
48. Demand for liquid whey and concentrated whey as animal feed (particularly for calves) in 1993was adversely affected by the depressed market for veal calves. There is also, however, a growingdemand for whey and whey products for use in food products and pharmaceuticals. Import demandfor various whey products was furtherstimulated in 1993 byJapan's expansion ofimport quotas. Quotasfor prepared whey for infant formula, mineral concentrated whey and whey powder for animal feedwill be progressively increased through fiscal year 1994.
49. Whey powder prices continued to slide in the first six months of 1993. In June 1993, pricesin Europe were at US$350 per ton, their lowest level since September 1990; in the United States pricesfell to US$340 per ton compared to US$375 in June 1992, a drop of 9½ per cent. This weaknessstemmed from abundant whey powder supply due to the widespread rise in cheese production. However,in the second half of 1993, prices recovered in the United States and remained stable in Europe. InMay 1994, prices increased both in the United States and in Europe as compared to May 1993.
Concentrated milk
50. World production of condensed and evaporated milk declined throughout the 1980s, withcondensed milk being increasingly replaced by whole milk powder in the market. However, worldproduction of condensed milk recovered in 1992 and remained relatively stable in 1993 at4.6 million tons. From a peak ofnearly 1 million tons in 1985, world trade in condensed milk declinedto about 350,000 tons in 1991. World trade in condensed milk recovered in 1992 and 1993, withincreased exports from the European Cormmunities and Canada.
51. Prices for condensed milk, based on Dutch quotations, increased in 1991 and 1992 to reachHfl. 3,620 per ton in December 1992, which in light of a lower exchange rate corresponded toUS$2,030 per ton. In the first halfof 1993, Dutch quotations increased slightly to reach Hfl. 3,690 perton inJune (or US$2,053 per ton). Prices remained near Hfl. 3,690 throughout the second halfof 1993and the first half of 1994.
Casein
52. World caseinproduction declined by 7 per cent to 212,000 tons in 1993. This was primarilythe result of a sharp decline in EC production beginning in mid-1993. In the European Communities,increases in the casein subsidy had previously encouraged an upturn in production. However, the aidto manufacturers was reduced in July 1992 and was further cut in March 1993. World exports ofcaseinin 1993 declined to 145,000 tons.

DPC/W/140Page 31
53. Casein prices vary widely with quality. Following substantial increases during 1992, caseinprices declined during the first six rnonths of 1993. In July 1993, they were at US$4,730 per ton,8 per cent lower than a year earlier. They continued to decline in the second halfof 1993 to US$4,230per ton in December 1993, 20 per cent lower than in December 1992. In May 1994, they furtherdeclined by 16 per cent to US$4,090 per ton compared to May 1993.
FOOD AID
54. Food-aid deliveries of dairy products consist mainly of skimmed milk powder and anhydrousmilk fat (butter oil). The decline in global surpluses has affected the availability of milk products forfood-aid programmes. In recent years, food aid has accounted for about 20 per cent of total exportsof dairy products, most of it coming from the United States and the European Communities. Food-aidshipments of dairy products averaged nearly 400,000 tons (product weight) in the early 1980s, butfell below 100,000 tons in 1990. In 1991 and 1992, food-aid deliveries rose again to 220,000 tons(product weight). In particular, shipments of food aid to Eastern Europe and the former Soviet Unionincreased in 1991-92. World food-aid deliveries of dairy products in 1993 remained around200,000 tons. Participants to the International Dairy Arrangement have stressed the need to ensurethat food aid and concessional sales do not adversely affect commercial sales opportunities.
55. ECfood aid. European Communities' food-aid programmes provided for 5,000 tons of butteroilin 1993, compared to 6,800 tons in 1992. Actual food-aid deliveries of butter oil in 1993 amountedto 1,000 tons compared to 5,000 tons in 1992- Annual allocations of skimmed milk powder for foodaid were reduced from 150,000 tons at the beginning of the decade to 50,000 tons in 1993. In 1993,actual deliveries ofskimmed milk powder for food aid amounted to 55,000 tons, compared to 51,000 tonsin 1993. The EC notified to the Consultative Committee of Surplus Disposal (CSD) of the FAOtransactions of 38,000 tons of skimmed milk powder and 38,600 tons of butter/butter oil in 1993.
56. USfoodaid. In September 1992, the United States announced a fiscal year 1993 Russian food-aid package that included 16,800 tons ofbutter, 3,000 tons ofbaby food and 3,500 tons ofmilk powder.For the fiscal year starting October 1992, 25,000 tons of butter/butter oil were made available underthe PL 480 Prograin and 80,000 tons were allocated under Section 416(b). In May 1993, the UnitedStates announced food-aid programmes for over 60,000 tons of butter, of which some 50,000 tonshave been allocated forRussiaand 11,000 tons forvarious Eastern European States. Food-aid deliveriesunder PL 480 Title Il for fiscal year 1992 (as of October 1991) through June 1993 involved only1,800 tons of skimmed milk powder. At the same time, 11,000 tons of skimmed milk powder and16,000 tons of butter oil were shipped under the Section 416(b) export donation programme. TheUnited States notified to the CSD transactions of 8,300 tons ofskimmed milk powder and 74,000 tonsof butter/butter oil in 1993.

DPC/W/140Page 32
INTERNATIONAL DAIRY PRICES
57. During the fifteen-year period in which the International Dairy Arrangement has been inoperation, market prices have gone through various phases. At the beginning of the 1980s the worlddairy market was in reasonable balance. The year 1982 marked the beginning of a period of increasedworld milk production, not matched by increased demand, and the accumulation of surplus stocks notablyof butter and skimmed milk powder. Stocks remained high and continued to have a depressive impacton the prices of all dairy products until 1986-87. Thereafter a general recovery came about, first forpowders and cheese and later for butter and anhydrous milk fat. The prices for powder and cheesereached new record levels in 1988 and have generally continued to increase, while those for butterand anhydrous milk fat have not regained their levels of the early 1980s.
58. Milk proteins have few substitutes and have been, even at the higher price level, in a strongcompetitive position with vegetable proteins. This has not been the situation for milk fat, which hasbeen facing stiff competition from vegetable fat, at the same time as dietary advice has dampened thedemand for fats in general. Such advice, in contrast, favours demand for milk protein. This has beenevident in the recent developments in powder prices, with good quality skimmed milk powder forrecombination commanding a premium. The diverging market trends for the various milk componentsare clearly reflected in the changed patten of relative prices, and changes in the established minimumexport prices. A number of major producers, including the European Communities, the United Statesand Canada, have adjusted price relativities in favour ofmilk proteins. New Zealand recently adjustedthe basis for their pricing system to milk solids rather than only milk fat.

TABLE
11
InternationalDa
iryPr
ices
*(1
991-
94)
(US$
permetric
ton
f.o.b.)
1991
1992
1993
1994
Product
______
January-
Janu
ary-
Apri
l-July-
October-
lanu
ary-
April-
July-
Octo
ber-
Janu
ary-
Apri
l-De
cemb
erMarch
lune
Sept
embe
rDe
cemb
erMa
rch
lune
Sept
embe
rDe
cemb
crMa
rch
lune
Skimmed
milk
powd
er1,
250-
1,80
01,
550-
1,70
01,600-1,900|
1,800-2,170
1,77
5-1,
950
1,72
5-1,
920
i,650-2,000
1,40
0-1,
650
1,500-1,750
1,45
0-1,
600
1,425-1,620
Whole
milk
powder
1,250-1,800
1,55
0-1.
700
1,55
0-1,
900
1,750-2.100
1,700-1,900
1,625-1,800
1,57
5-2,
000
1,350-1,650
1,40
0-1,
600
1,380-1,560
1,42
5-1.
600
Anhy
drou
smi
lkfat
1,62
5-2,
250
1,700-1,950
1,62
5-1,
950
1,625-2,200
1,62
5-1,
950
1,625-1,720
1,625-1,800
1,62
5-1,
750
1,625-1,750
1,625-1,780
1,40
0-1,
800
Butt
er1,
350-
1,85
01,
400-
1,55
01,
350-
1,60
01,
350-
1,80
01,350-1,550
1,35
0-1,
430
1,350-1,500
1,35
0-i,5
501,350-1,500
1,35
0-1,
480
1,100-1,500
Ched
darch
eese
1,550-2,100
1,75
0-1,
950
1,750-2,100
1,800-2,200
1,90
0-2,
100
1,750-2,100
1,800-2,000
1,800-2,150
1,800-1,950
1,65
0-2,
000
1,75
0-1,
950
*Ran
ges
asreported
byIDA
participants.
ro b

DPC/W/140Page 34
220210200190180170160150140130120110100908070605040
16015014013012011010090807060504030
Graph 18 - PRICE INDICES FOR SKIMMED MILK POWDER& WHOLE MILK POWDER
Basis: 1st quarter 1981 = 100
1980 81 82 83 84 85 86 87 88Years
Note: Upper level of international price range
90 91 92 93 94.
u
Graph 19 - PRICE INDICES FOR BUTTER & CHEESEBasis: 1st quarter 1981 = 100
980 81 82 83 84 85 86 87 88 89 90 91 92 93 94.Years
Note: Upper level of international prise range

DPC/W/140Page 35
DAIRY PRODUCTION AND POLICIES IN SELECTED COUNTRIES AND REGIONS
NEW ZEALAND
59. New Zealand's milk production set another record in the 1993/94 dairy year (1 June to 31 May).Manufacturing milk production is estimated at 8.6 billion litres of whole milk or 735 million kgs. ofmilk solids, which amounts to an increase of 13 per cent over the 1992/93 season.' Early in the seasonthe increase in production was even higher. In September and October 1993, productionwas 20 per centand 18 per cent, respectively, above the same months in 1992. Growth rates declined to 11 to13 per cent in November/December and weredown to 10 per cent inJanuary as a result ofbelow averagerainfall through the NZ late summer and autumn. In general, cow conditions, pasture cover and feedavailability are considered below the levels required for optimal winter and spring production. It istherefore not expected that the high growth rates ofthe past two dairy years will be sustained. Accordingto the New Zealand Dairy Board, production in 1994/95 is assumed to remain stable. At the sametime, cow numbers (in milk) are forecast to rise by another 3½h per cent (see Table 12).
TABLE 12
NZ Dairy Production in 1993/94 and Forecast for 1994/95 (June to May)
1993/94 % Change over 1994/95 % Change overEstimate 1992/93 Forecast 1993/94
Total cows in milk('000 head) 2,584 3.0 2,675 3.5
Manufacturing milk(million litres) 8,603 12.8 8,600 0.0
Butter ('000 tons) 302 9.4 270-290 - 4-11
Cheese ('000 tons) 192 31.5 200-210 4-9
WMP ('000 tons) 296 4.6 315-330 6-11
SMP ('000 tons) 142 11.8 130-140 - 1-8
BMP ('000 tons) 26 13.0 20-25 - 4-23
Casein ('000 tons) 78 1.4 65-70 10-17
Source: New Zealand Dairy Board.
60. The main factors underlying the increase in NZ production in the past season include the goodcondition of both cattle and pastures at the beginning of the season; the sustained favourable weatheruntil early February 1994; improved pasture and herd management; and increased use of fertilizer.
'Manufacturing milk (excluding milk and cream for liquid consumption) has comprised 94 per cent of total NZ milkproduction in recent years, which compares to around 75 per cent in Australia and the European Communities,and 60-65 per cent in the United States and Canada. Total milk production in 1993/94 is thus estimated at 9.4 million tons.

DPC/W/140Page 36
It is estimated that the underlying rate of growth of New Zealand's milk production is about 3 per centper annum, but due to the seasonal impact actual production may fluctuate by some 10 per cent (plusor minus) around this trend rate.
61. New Zealand's share of world dairy trade (in tennis of milk equivalents) was in the magnitudeof 18-21 per cent in 1992-93, while the European Communities commanded 48 per cent. Unlike itsmajor competitors on the world market, New Zealand's exports are not subsidized. As world marketconditions have generally been weaker in the dairy year 1993/94, NZ farmgate prices were lower thana year before. The final milk value set by the NZ Dairy Board for the 1993/94 season was fixed at$NZ 2.90 per kg. milk solids ($NZ 5.05 per kg. milk fat), lower than the expected value for the seasonand 11 per cent lower than in 1992/93. The average fanngate price paid by dairies is expected to be$NZ 3.15 to $NZ 3.25 per kg. milk solids. For the 1994/95 season, the NZ Dairy Board set the initialmilk value at $NZ 2.40 per kg. milk solids, with the expectation that it may achieve a final value inthe range of $NZ 2.70 to $NZ 2.90. Since the 1993/94 season, "milk solids" has replaced milk fatas the key measure of production on which the Dairy Board's payment for milk is made.
Milk Powders
62. Unlike whole milk powder, there was been no increasing trend in the production of skimmedmilk powder in recent years. The increase in 1993/94 was a recovery from the depressed level in1992/93 when skimmed milk powder production was restrained at the expense of whole milk powder.
63. New Zealand's skimmed milk powder exports to Mexico, which were substantial in the late1980s (45,000 tons in 1989 and 22,500 tons in 1990), have been much lower in the 1990s (zero in1992 and 6,000 tons in 1993). On the other hand, New Zealand achieved major advances in wholemilk powder sales to Mexico, in particular since 1992. In 1993, Mexico became the number one exportdestination for whole milk powder, a position previously held by Malaysia. Exports reached 40,000 tonsin 1993, up from 27,000 tons in 1992. In the volatile Algerian market, New Zealand sold 39,000 tonsin1993, following 18,500 tons in 1992 and 34,500 tons in 1991.
64. In calendar year 1994, New Zealand has to date notified skimmed milk powder stockfeed salestotalling 4,454 tons. AIl sales were under derogation from the minimum price and destined for Japan.Export prices ranged from US$954 to US$19078 f.o.b. per ton.
Butter and Butter Oil
65. Despite the increase in dairy production, New Zeaiand has successfully accommodated thevolumes in the market, with relatively low end of season stocks. The revived butter trade with Russiawas an important factor in achieving this result. In calendar year 1993, NZ exports to Russia reachedalmost 50,000 tons, after negligible exports in calendar year 1992. Under the derogation from theminimum price for butterfats, New Zealand notified 50,000 tons of sales to Russia, a large part forshipment in 1994, at prices ranging from US$1,100 to US$1,200 c.i.f.
66. New Zealand's butter access quota to the European Communities has been reduced from79,000 tons in 1986 to 53,182 tons for calendar year 1994, subject to a reduced import levy ofECU 338.40 per ton. Since the creation of the EC Single Market in January 1993, the butter maybe traded throughout the European Communities after entry through the United Kingdom. As a resultof the Uruguay Round negotiations, New Zealand will be granted import access opportunities totalling76,667 tons at a tariff rate of ECU 868.80 per ton.

DPC/W/140Page 37
Cheese
67. In line with the industry's objective to reduce the share of milk used for butter manufacture,NZ dairy production expanded most strikingly for cheese (plus 31 per cent in 1993/94). In fact, NZproduction is forecast to double in the current dairy year 1994/95 compared to 1992/93 production.This expansion came in response to growing demand from New Zealand's overseas markets withoutadverse effects on prices. Exports to its major market, Japan, reached new heights at 42,000 tonsin calendar year 1993.
68. In calendar year 1994, New Zealand has so far made cheese sales under derogation from theminimum price totalling 895 tons. All sales were made to the European Communities.
Casein
69. Due to lower prices in the international market and increased milk powder production, themanufacture of casein has been restrained. Production in 1993/93 remained at similar levels (75,000 tons)as in the previous two dairy years. Virtually all production is exported. Exports in calendar year1993 totalled 65,200 tons, with the major destinations being the traditional markets, i.e. the United States(28,300 tons), Germany (12,100 tons) and Japan (10,600 tons). Export prices in 1993 averagedUS$4,000 per ton, lower than in 1992 but significantly higher than in 1991.
AUSTRALIA*
70. Australian milk production in the 1993/94 dairy year (July to June) is estimated at7.9 billion litres, an increase of around 8 per cent over 1992/93. Favourable weather conditions havebeen one of the main reasons for the rise in production. Australia's dairy production is mainly basedon year-round non-irrigated pasture grazing, with limited but rising use of concentrates. Dairy cowherds average about 113 cows. After declining for almost 30 years, dairy cow numbers have begunto increase since 1992. The reversal of the long-term trend reflects the relatively good returns fromdairying in recent years. Milk production in 1994/95 is forecast to increase marginally to7.95 billion litres, although average yields are expected to decline with a return to less favourable weatherconditions than in the past two years. The expansion of the dairy herd is expected to continue.
71. About 75 per cent of Australia's milk production is processed into dairy products (manufacturingmilk), with the remaining 25 per cent used as fresh milk (market milk). In the first three quartersof the past dairy year, production of skimmed milk powder and whole milk powder increased by25 per cent, while butter/anhydrous milk powder production was 10 per cent higher and cheese outputexpanded by only 3 per cent. This was despite the fact that world market prices for skimmed milkpowder and notably butter weakened during this time. The movement into lower paying product linesis one of the reasons why farmgate prices for manufacturing milk are estimated to be about 9 per centlower in 1993/94.
72. Some 40 per cent of total milk production is exported as manufactured dairy products.Australia's major export markets are concentrated in South East and East Asia, led by Japan. A largeportion of the increased production of manufactured products in 1993/94 found its way into exportand will continue to do so.
73. Progressive deregulation ofUie domestic liquid milk market encouraged new product developmentand increased marketing activity. Overall demand for milk in 1993 was relatively static at 100 litresper head. In contrast, there has been a recovery in demand for manufactured products. The trend
DPC/W/140Page 38
towards low fat product lines continued across all categories in the dairy market, from liquid milkto cheese, yogurt and butter blends.
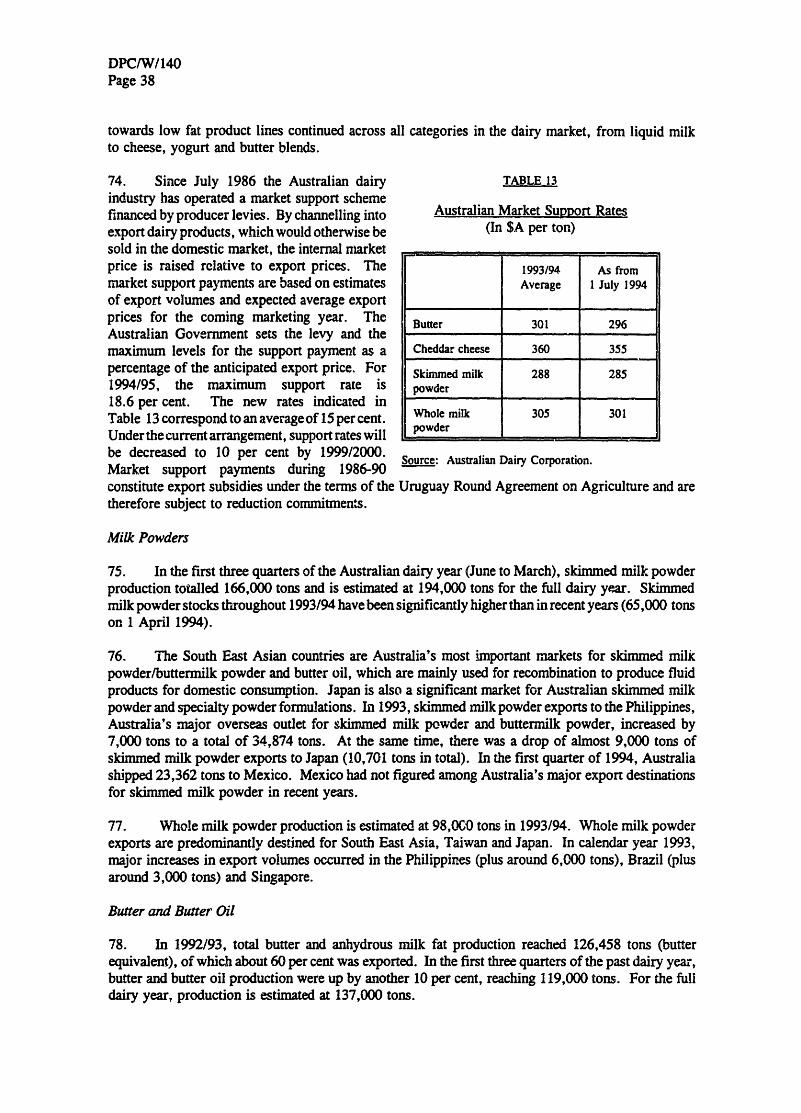
74. Since July 1986 the Australian dairyindustry has operated a market support schemefinanced by producer levies. By channelling intoexport dairy products, which would otherwise besold in the domestic market, the internal marketprice is raised relative to export prices. Themarket support payments are based on estimatesof export volumes and expected average exportprices for the coming marketing year. TheAustralian Govermnent sets the levy and themaximum levels for the support payment as apercentage of the anticipated export price. For1994/95, the maximum support rate is18.6 per cent. The new rates indicated inTable 13 correspond toan average of 15 percent.Under thecurrent arrangement, support rates willbe decreased to 10 per cent by 1999/2000.Market support payments during 1986-90constitute export subsidies under the terms of thetherefore subject to reduction commitments.
Milk Powders
TABLE 13
Australian Market Support Rates(In $A per ton)
1993/94 As fromAverage 1 July 1994
Butter 301 296
Cheddar cheese 360 355
Skimmed milk 288 285powder
Whole milk 305 301powder
Source: Australian Dairy Corporation.
Uruguay Round Agreement on Agriculture and are
75. In the first three quarters of the Australian dairy year (June to March), skimmed milk powderproduction totalled 166,000 tons and is estimated at 194,000 tons for the full dairy year. Skimmedmilk powder stocks throughout 1993/94 have been significantly higherthan in recent years (65,000 tonson 1 April 1994).
76. The South East Asian countries are Australia's most important markets for skimmed milkpowdert/buttermilk powder and butter oil, which are mainly used for recombination to produce fluidproducts for domestic consumption. Japan is also a significant market for Australian skimmed milkpowder and specialty powder formulations. In 1993, skimmed milk powder exports to the Philippines,Australia's major overseas outlet for skimmed milk powder and buttermilk powder, increased by7,000 tons to a total of 34,874 tons. At the same time, there was a drop of almost 9,000 tons ofskimmed milk powder exports to Japan (10,701 tons in total). In the first quarter of 1994, Australiashipped 23,362 tons to Mexico. Mexico had not figured among Australia's major export destinationsfor skimmed milk powder in recent years.
77. Whole milk powder production is estimated at 98,000 tons in 1993/94. Whole milk powderexports are predominantly destined for South East Asia, Taiwan and Japan. In calendar year 1993,major increases in export volumes occurred in the Philippines (plus around 6,000 tons), Brazil (plusaround 3,000 tons) and Singapore.
Butter and Butter Oil
78. In 1992/93, total butter and anhydrous milk fat production reached 126,458 tons (butterequivalent), of which about 60 per cent was exported. In the first three quarters ofthe past dairy year,butter and butter oil production were up by another 10 per cent, reaching 119,000 tons. For the fulldairy year, production is estimated at 137,000 tons.

DPC/W/140Page 39
79. Despite the weaker economy in 1993, butter consumption recovered due to aggressive pricediscounting. However, the trend towards low fat dairy products continued. Butter retail sales increasedby 2 per cent in 1993, while sales of butter-vegetable oil blends rose by 7 per cent, and sales of mono-unsaturate margarine (mainly based on canola oil) increased by 40 per cent.
80. Australian butter exports in calendar year 1993 totalled 40,889 tons, compared to some17,000 tons in 1992. Most of the increase was due to renewed exports to Russia (14,641 tons) andEgypt (8,529 tons). Under the derogation from minimum prices for butterfat effective since June 1993,Australia sold 16,500 tons to the former Soviet Union, with the bulk contracted at US$1,178 f.o.b.per ton. Butter stocks, at 15,000 tons at the end of the first quarter of 1994, were less than half ofone year earlier.
Cheese
81. Total Australian cheese production at 179,000 tons was 3 per cent higher in the first threequarters ofdairy year 1993/94. As a reflection ofconsumption trends, there was no increase in Cheddarproduction, but it still constitutes about 64 per cent of total cheese production. On the other hand,shredded and fresh cheese output expanded by 24 and 16 per cent, respectively.
82. Despite the generally unfavourable economic climate in 1989 to 1993, Australian cheeseconsumption has recovered to pre-recession levels. Per capital cheese consumption in 1992/93 wasback to 9.1 kgs. However, consumer preferences for cheese have been changing. Consumer demandhas been strong for non-traditional and locally-produced cheese, such as Camembert, Parmesan andMozzarella. There has been important growth for low fat cheese and convenience cheese products,such as pre-sliced and shredded or grated cheese.
83. Japan is the major export market for Australian cheese, with about half of total cheese exportsin calendar year 1993. Exports to Japan increased by 9,000 tons to nearly 46,000 tons. Traditionally,trade has been dominated by Cheddar cheese, but more recently there has been strong growth in exportsof cream cheese, Mozzarella and shredding cheese.
84. Cheese imports of most varieties enter under tariff quotas, except from New Zealand and thePacific Forum Islands. Under the free-trade agreement with New Zealand, dairy imports - mainlycheese - enter Australia free of duty. Out of 25,000 tons imported in 1993, 14,000 tons were fromNew Zealand. Australia does not permit the manufacture of cheese with unpasteurized milk. In early1994, it enforced a regulation that imported products must meet the same requirements and, as aconsequence, prohibited imports of unpasteurized cheese from Switzerland.
EUROPEAN COMMUNITIES*
85. Milk deliveries in 1993 wereat 101.4milliontons,just 1/2percent less than in 1992. Deliveriesare expected to decline in 1994. The EC dairy herd contracted by a further 2 per cent in 1993, aspolicies to encourage dairy farmers to reduce production were continued. The greatest reductions inthe last two years have occurred in former East Germany, where deliveries declined by 2 per centin 1993. As the dairy situation stabilizes in that area, the rate of herd reduction should slow downand production may increase slightly as a result of improved yields. Consumption of fluid milk in theEuropean Communities continued to increase by a further 2 to 3 per cent in 1993, to approximately33 million tons.

DPC/W/140Page 40
86. In July 1994, the Council of Ministers reached agreement on farm prices and other adjustmentsfor the 1994/95 marketing year. Butter intervention prices will be cut by 3 per cent. Last year theCouncil had accepted that a further 2 per cent price reduction would come into force in 1994/95. Anadditional I per cent cut has now been added to the pre-agreed 2 per cent for 1994/95. There is nocommitment to any price cut in 1994/95. Intervention for cheese is to be abolished.
87. Milk quotas will remain unchanged for both 1994/95 and 1995/96. However, the Italian quotaincrease agreed conditionally last year has been made definitive, although slightly revised downwardsto 9.6 million tons.
88. A single definition of butter for intervention is to be introduced. The Council has called forfurther technical work to be carried out before it takes a formal decision by 31 October 1994.
89. As a result of the Uruguay Round, the European Communities' bound tariffs on agriculturalproducts will be reduced in six equal instalments beginning in 1995 and ending in 2000. Thus, thetariff on butter will be reduced by 36 per cent from the base level of ECU 2,962 to ECU 1,896 perton; and the skimmed milk powder tariff will be cut by 20 per cent from ECU 1,485 to the final boundlevel of ECU 1,188 per ton. Furthermore, in 1995 the EC will establish tariff quotas for 76,667 tonsof butter reserved for New Zealand, and 15,250 tons of cheese reserved for New Zealand, Canadaand Australia. In addition, the EC will open new market opportunities (at reduced tariff rates) for41,000 tons of skimmed milk powder and 18,000 tons of cheese. During the implementation period,access opportunities will rise, in equal annual instalments, to final levels of 69,000 tons for skimmedmilk powder, 104,000 tons for cheese, and 10,000 tons for butter.
90. The European Communities is committed to successively reduce quantities and outlays ofsubsidized dairy products beginning in 1995. Thus, maximum allowable subsidized exports ofskimmedmilk powder will be 297,200 tons in 1995, to be reduced to 243,300 tons in 2000. Budgetary outlaysmust be reduced from ECU 347.9 million in 1995 to 236.9 million in 2000. The respective commitmentsfor butter are: 447,200 tons in 1995 to be reduced to 366,100 tons in 2000; outlays to be decreasedfrom ECU 1,245.9 million to ECU 848.2 million. For cheese: 406,700 tons in 1995 to be reducedto 305,100 tons; outlays to be cut from ECU 505.2 million to ECU 281.1 million. For other milkproducts: 1,161,400 tons to be reduced te 938,400 tons; and outlays tO be decreased fromECU 946.6 million to ECU 645.2 million.
Milk Powders
91. Skimmed milk powder production increased by 5 per cent in 1993 to 1.22 million tons. Thisis in contrast to the 24 per cent decline in 1992. The turn-around was largely due to the sharp declinein casein manufacture in 1993. Skimmed milk powder production in the first quarter of 1994 was5 per cent below the comparable 1993 level. This reduction is due to the decline in milk deliveriesas well as increased demand of milk for cheese.
92. With effect from I February 1993, the minimum incorporation rate for skimmed milk powderin mixed feeds was cut from 50 per cent to 35 per cent. It had been expected that the rate would returnto 50 per cent as of the beginning of 1994, however, in light of the firm market for skimmed milkpowder and the relatively weak market for veal, no change will be made in 1994. Total domesticconsumption of skimmed milk powder decreased by 18 per cent to 945,000 tons in 1993; the useof skimmed milk powder for animal feed also decreased by 18 per cent to 662,000 tons.
93. Following a 24 per cent decline in 1991, EC exports of skimmed milk powder increased by54 per cent to 390,000 tons in 1992. However, exports decreased by 23 per cent to 299,000 tons in1993.

DPC/W/140Page 41
94. EC public stocks ofskimmed milk powder continued to decline in the first six months of 1993.They amounted to only 29,000 tons at the end of June 1993, compared to 163,000 tons a year earlier.Public stocks rose slightly to 35,000 tons by 31 December 1993 and to 41,000 tons by 31 March 1994.However, by 30 June 1994, stocks had increased to 82,000 tons.
95. In 1993, whole milk powder production increased by ½ per cent to 944,000 tons comparedwith 1992. Exports increased by 1 ½ per cent to 589,000 tons in 1993.
Butter and Butter Oil
96. Lower output of milk, coupled with further increases in domestic demand for cheese and freshmilk products, led to a decrease in EC butter production in 1992. In 1993, however, production at1.53 million tons was 1 ½ percent higher than in 1992. In the first quarter of 1994, production declinedby 4 per cent to 353,000 tons.
97. Butter from intervention stocks continues to be available at subsidized prices for non-profitorganizations. Member States also subsidize butter for social purposes and the European Communitiescontributes financially to national schemes for school milk. Measures under the milk co-responsibilityregime continued until May 1993, providing funds for subsidized butter to be used in pastry products,ice-cream and sugar confectionery. The total volume of butter taken under the pastry and ice-creamregulation in 1993 was 392,000 tons, highlighting the importance this use of butter has in the EuropeanCommunities. The volume of butter taken up by the pastry and ice-cream industry in January throughMay 1994 was 200,000 tons, 16 per cent more than in the corresponding period of 1993. In addition,in an attempt to slow down the decline in butter consumption, a two-year programme ofmaking butteravailable at reduced prices to recipients of social security measures has been continued. Preliminaryestimates of EC butter consumption in 1993 indicated an apparent and unexpected increase of about3 per cent as compared to 1992. It may thus be possible that the trend of declining consumption haslevelled off. Consumption ofmargarine seems to be stable at a level ofabout 4.7 kgs. per head, whereasconsumption of butter and vegetable oil blended spreads appears to be increasing.
98. In 1993, exports of butter to third countries decreased by 29 per cent to 99,000 tons. At thesame time, exports of butter oil decreased by 6 per cent to 79,000 tons. Under provisions permittingthe importation of New Zealand butter into the European Communities, a quota of 53,182 tons hasbeen set for 1994. In accordance with the provisions of the Uruguay Round Agreement on Agriculture,the European Communities will provide access for New Zealand butter at its 1986-88 base year levelof 76,667 tons, at the import levy applied at that time.
99. Intervention purchases of butter up to May 1994 amounted to 16,000 tons, about 40 per centless than during the same period in 1993. The total quantity of butter bought in 1993 was 32,200 tons.In January 1993, public and private stocks of butter stood at 241,000 tons compared to 302,000 torsa year earlier. In mid-December 1993, stocks totalled 211,000 tons of butter. On 30 June 1994, stockstotalled 239,000 tons of butter.
Cheese
100. Cheese production in the European Communities grew by 1 per cent to 5.55 million tons in1993 in response to sustained growth in domestic and export demand.
101. Cheese consumption continued to expand albeit by only ½ per cent in 1993. The great varietyof cheese available and further product diversification (i.e. low-fat cheeses) are the main reasons forthis trend.

DPC/W/140Page 42
102. In 1993, EC cheese exports recovered to 524,000 tons, compared ta 466,000 tons in 1992.Imports, mostly from Switzerland, were 106,000 tons in 1993.
Other Dairy Products
103. EC production of whey powder has expanded at a rate of 5 per cent in recent years and nowaccounts for more than halfofworld production. Production continued to increase by about 3 per centto924,000 tons in 1993, following the expansion in cheese production. Exports of whey remained
stable in 1992 at 32,000 tons.
104. Condensedmilk output decreased by 4 per cent to 1.2 million tons compared to 1992. Exportsrecovered to 343,000 tons in 1992, following a drop to 316,000 tons in 1991. This recovery occurredas traditional buyers increased their purchases at the same time as East European countries emergedas buyers.
105. The European Communities' casein production is highly dependent on aid programmes. Asfrom 10 October 1990, the casein subsidy programme was altered to reduce difficulties ofcontrollingend-use, and the production subsidy on casein was increased. EC production subsequently increasedin 1992 to 138,000 tons. However, the casein production subsidy was cut from ECU 7.94 to ECU 7per 100 kgs. of skimmed milk in July 1992 and farther reduced to ECU 6.30 per 100 kgs. ofskimmedmilk as of 1 March 1993. Production decreased by 13 per cent to 120,000 tons in 1993.
FINLAND*
106. In 1993, milk deliveries continued theirdownward trend, reaching 2.3 million tons. The slightdecline was probably due to the slaughtering ofcows. In the first quarter of 1994 milk deliveries were4 per cent higher than in the same period of the previous year. It is expected, however, that2.3 million tons of milk will again be processed by Finnish dairies by the end of 1994. Penalties forfarmers exceeding their production quotas have been set at Fmk 1.65/litre for the year 1993/1994.
107. The drop in milk production, along with changes inconsumption patterns towards low-fat dairyproducts, resulted in a decline of Finnish butter production in recent years. The amount of milkprocessed into butter fellby 30 per cent since the early 1980s. In 1993, per capita consumption ofbutter was at 5.7 kgs., almost half the level of 1985. Butter production is estimated to increase by5 per cent to 59,000 tons in 1994. Consumption of butter is expected to remain stable at 39,000 tonsby the end of the year. Exports are estimated ta reach 20,000 tons by the end of 1994. Finnish butterexports are recovering after a sharp decline in the past years. Under the derogation from the minimumprices effective sinceJune 1993, Finland notified salesof 1 1, 108 tons ofbutter at prices ranging betweenUS$1,000 and US$1,310 per ton to countries of the former Soviet Union. In the first quarter of 1994.Finish exports totalled 8,800 tons.
108. In the first three months of 1994, 3,700 tons of skimmed milk powder were produced. Forthe full year 1994, skimmed milk powder production is expected to remain at 1993's level of 15,000 tons,while consumption declines further. In 1993, exports halted aImost completely due to the lowerproduction level. From January to Marchof 1994, only 2 tons ofskimmed milk powder were exported.Exports for 1994 are forest to total 5,000 tons.
109. Only negligible quantities ofwholemilkpowder wereproduced in 1993. In 1994, output, whichis entirely for export, will barely reach 1,000 tons. Exports, mainly destined to the former Soviet Union,will fall to 200 tons. Stocks in April were 400 tons.

DPC/W/140Page 43
110. In 1993, cheeseproduction continued to increase, reaching 90,000 tons. Inthefirst three monthsof 1994 output rose modestly to 22,700 tons. However, production is expected to decrease to89,000 tons for the year as a whole and may fall further in the future in line with reduced milk output.Cheese consumption has risen by 80 per cent since the 1980s. For 1994 it is estimated at 70,000 tons.Per capita disappearance in Finland last year was over 13 kgs., similar to many European countries.Finish exports are forecast to remain steady at 25,000 tons by the end of 1994, in spite of a lowerexport level registered in the period January-March.
111. Although Finland is trying to diversify its agricultural production into neat, milk still accountsfor 35 per cent of the total returns of agriculture production. The Finnish producer price of milk iscurrently 40 to 50 per cent higher than the average producer price in the EC countries. InFebruary 1992, Finland applied for full membership in the European Communities. According to theTreaty of Accession concluded in June, Finland will have to align its producer prices to the EuropeanCommunities' price level if its referendum results in a decision to join. However, the country willbenefit from a five-year transition period and will receive a compensation grant amounting toECU 457 million. The Finnish milk quota will be fixed within the Common Agricultural Policy onthe basis of historical production. at 2,552 thousand tons, including "SLOM' reserve and direct sales.
NORWAY*
112. The Norwegian dairy sector is supported by various instruments. Farmers receive a basic subsidyfor each litre of milk delivered to the dairies, regardless of the final utilization of the milk. For theyears 1993 and 1994, the basic subsidy was fixed at NKr 0.283 per litre. Moreover, a special regionalsubsidy is paid to farmers. For 1993 and 1994 it ranges from NKr 0.11 to NKr 1.60 per litre, withthe highest support provided in the northernmost regions of the country. A fixed payment is givento each dairy holding as structural income support. Consumer price subsidies on liquid miilk anddomestically consumed cheese were abolished on 30 June 1993. However, since 1 July 1993 the VATon dairy products has been cut to 15 per cent from the 22 per cent general level. This measure issupposed to stimulate consumption and benefit low-income families.
113. In 1993, milk production continued its downward trend to 1,806 million tons. Output is forecastto decrease slightly to 1.796 million tons by the end of 1994. Whole milk consumption has declinedsteadily since 1980, with the decrease being partly offset by an increase in low-fat milk consumption.In 1993, per capita consumption of skimmed and low-fat milk totalled 113 kgs. while whole milkconsumption decreased to 49 kgs. Total consumption of liquid milk is estimated to have dropped to700 million kgs.
114. Skimmed milkpowder production declined to 8,000 tons in 1993. In the first quarter of 1994,it decreased by 14 per cent to 2,400 tons. Skimmed milk powder consumption was down by 340 tonscompared to the same quarter of the previous year. Exports in the first three months of 1994 werenegligible. No significant exports of skimmed milk powder are expected due to compulsory returndeliveries to milk producers. Whole milk powder output and consumption rose slightly.
115. Butter production continued to decline. In the period January-March 1994, output was downby 11per cent at 4,600 tons and consumption declined by a further 5 percent. In the fist three monthsof the year, only 1,200 tons of butter were exported. Butter was delivered mostly to North Africancountries, at an average export price of US$1,350 per ton f.o.b. Butter stocks on 1 April 1994 haddecreased to 2,300 tons.

DPC/W/140Page 44
116. Cheese production has risen by 20 per cent since the early 1980s. However, in the first quarterof 1994, cheese production decreased slightly to 21,400 tons. Cheese consumption has been stablein the last few years. In 1993, total consumption reached 57,600 tons while per capita consumptionwas at 13.3 kgs. Although cheese is the only dairy product exported on a significant scale, in the firstthree months of 1994 cheese exports dropped by almost 17 per cent to 5,300 tons. Main destinationswere the European Communities, Japan, Australia, Canada, the United States, Sweden and Mexico.
117. In November 1992, Norway presented its accession request to the European Communities.An agreement on the conditions of its entry was reached in March 1994. Norway, like Finland, willhave a transitional period of five years to align its producer prices to the lower EC price levels. Thecountry will be compensated with a temporary financial aid in the amount of ECU 260 million.According to the Treaty of Accession, Norway's overall milk quota will be 2,017 thousand tons,including the "SLOM" reserve.
SWEDEN*
118. MiL production is the most important type of production in Swedish agriculture. Current policiesfor milk and dairy products are aimed at reducing production to a level that can be absorbed in thedomestic market or exported without subsidies. Consumer subsidies and export subsidies were rermovedas part of the 1990 food policy reforms. Special funds have been allocated to dairy farmers ceasingmilk production. Following the implementation of the reforms, the Swedish dairy sector bas beenrestructured. Milk production fell significantly through 1992 due also to a sharp reduction in dairycow numbers. However, the amount of milk processed by Swedish dairies began to increase againin 1993. In the first quarter of 1994, milk deliveries rose by 1½ per cent to 1,136 million kgs.Expanded milk production for the year as a whole may lead to a surplus. This is due to the Swedishapplication to join the European Communities and the expectation of the reintroduction, within theCommon Agricultural Policy, of a milk quota system.
119. Skimmed milk powder production is declining in Sweden. In 1993, production of skimmedmilk powder was 23 percent lower than in the early 1980s. In the first four months of 1994. it droppedby 25 per cent to 8,600 tons compared to the first quarter of 1993. In the period January-March 1994,an estimated 2,600 tons of skimmed milk powder were exported at an average price of US$1,550 perton f.o.b. Stocks continued theirdownward trend. On 1 April 1994 they wereat 2,800 tons, adecreaseofneariy 18 percent compared to theprevious year. Whole milkpowder production, which is destinedfor internal consumption, increased slightly to 2,000 tons.
120. In the first quarter of 1994, butter production dropped by 30 per cent to 8,200 tons. Thiswas due to a switch from butter to cheese production. In contrast, consumption of butter was 4 per centhigher at 4,900 tons compared to the same period of 1993. Butter exports dropped to negligiblequantities. InJune, the average export price was US$1,300 per ton f.o.b. At the end ofthe first quarter,butter stocks had declined by 35 per cent compared to the first four months of 1993.
121. In 1993, cheese production increased to almost 126,000 tons. In the period January-March 1994,cheese output rose by 15 per cent to 33,800 tons. Consumption of cheese during that period reached143,000 tons, a 10 per cent increase compared to 1993. This resulted in a slight rise in imports ofcheese. Since 1991, as compensation for the abolition of the systerm of collectively financed exportsubsidies, theSwedish Govermment has provided temporary, direct-exportsubsidypayments. For 1994,export refunds for cheese will total approximately SKr 50 million. On 1 April, cheese stocks were13 per cent above last year's level.

DPCIW/140Page 45
122. In December 1990, when Sweden applied for membership in the European Communities, itsproducer prices, support levels and production costs in the dairy sector were significantly higher thanthose of the European Communities. The reduction of border protection as from 1 July 1991, andthe devaluation of the Swedish krona in 1992, lowered the discrepancy. Price and support levels arestill higher for the dairy and the livestock sectors. Nevertheless, Sweden will be the only applicantamong the EFTA countries which will not benefit from a transitional period to align producer pricesto the level set in the European Communities. In compensation, the country will phase-in its budgetarycomunitments over four years. According to the accession agreement concluded in March 1994, andifthe forthcoming Swedish referendum on membership has a positive outcome, the Swedish productionquota for milk will be fixed at 3,303 thousand tons including direct sales.
SWITZERLAND*
123. The dairy industry, accounting for onc third of the gross value of agricultural production, isthe most important sector of Swiss farming. Milk production is primarily destined for fresh domesticconsumption. Cheese processing is given priority over butter production. Therefore, butter importsare encouraged. As from 1 September 1993, the guaranteed producer price for milk was lowered by10 centimes to 97 centimes per litre. As a compensation for the SwF 293 million cut in price support,the Swiss Government increased direct payments to dairy farmers by SwF 200 million. For 1994,direct payments will total SwF 800 million. In the first quarter of 1994, milk deliveries continuedto rise slightly, reaching 1.06 million tons due to higher productivity.
124. The skimmedmilk powder industry is recovering. In the first three months of 1994, productionand consumption increased significantly compared to the first quarter of 1993. This was due to higherdeliveries. The 25 percent rise in consumption resulted inno exports. Stocks at the end ofMarch 1994had declined to 5,600 tons.
125. Afteradecline in 1993, butterproductionroseto 11 ,300tons intheperiod January-March 1994.Butter imports dropped modestly although a 24 per cent increase in consumption, presumably due tolower butter prices, was registered in the first three months of 1994. In order to keep a desired balancebetween butter and margarine, the butter price will be reduced by a further 50 to 60 centimes per kg.as from 1 November 1994, depending on the packaging of the butter. Butter stocks on 1 April 1994were unchanged.
126. In 1993, cheese production increased by 2½ per cent due to higher milk deliveries. However,in the first quarter of 1994, output declined to 30,200 tons, a 7½ per cent reduction compared to thesame period of the previous year. In the first three months of 1994, cheese consumption fell modestlywhile exports recovered to 14,000 tons after the drop in 1993. In spite of lower consumption, Swissimports ofcheese continued to increase, reaching 7,200 tons in the period January-March 1994. Stockson April 1 1994 rose to 27,000 tons.
POLAND*
127. Poland's share of world milk production was just over 2 per cent in 1993, which far exceedsthat of all other Eastern and Central European countries. In comparison with Western Europe, Poland'sproduction is exceeded only by Germany, France and the United Kingdom. However, total livestockproduction fell by about 12 per cent in 1993, due mainly to reduced profitability as the drought in1992 pushed up feed prices.

DPC/W/140Page 46
128. At the beginning of this decade, the level of producer support within the agricultural sectorfell sharply as the country moved away from central planning. However, in response to the weakperformance of the country's agriculture in recent years, there has been a progressive increase in tariffsbetween 1991 and 1993. For dairy products, the tariffs range from 10 to 40 per cent (40 per centfor butter). A temporary import surcharge of6 per cent in response to balance-of-payments problemshas been effective sincemid-December 1992. The PolishGovernment has notified its intention to extendthe application of the import surcharge until 1997 in order to further remedy its balance-of-paymentsposition. The surcharge is scheduled to be reduced to 5 per cent in 1995; to 3 per cent in 1996 anddiscontinued altogether from 1997. Themotivation behind the extension, according to Polish authorities,is evidence that the trade balance deficit is ofa more structural nature thanpreviously suspected. Importshave continued to grow faster than exports, and, as a result, despite the 8 per cent devaluation of thezloty in August 1993, the trade balance has deteriorated. Also, a prolonged recession among principaltrading partners, as well as a higher than expected average burden of debt servicing in the near future,is expected to have an adverse effect on Poland's balance-of-payments position.
Graph 20 - Milk Production and Deliveries in Poland20
15
119
5
O 11990 1991 1992 yy3
DPC/W/140Page 47
129. The declining trend in Polish milk production continued through 1993. Production fell to11.9 million tons in 1993, about 9 per cent below the previous year and approximately 40 per centbelow the 1989 level. A further slight decrease is expected in 1994. Cow numbers have declinedsteadily since 1990 and the herd level is now about 3.9 million head. At the end of March 1994, cownumbers had decreased by 5.8 per cent compared to the same date in 1993. Delivery levels inproportionto total production have fallen since 1989; currently they have stabilized at approximately 55 per centof total production volume. This reduction can be attributed to the increase of direct deliveries fromfarmers to the market. In the first half of 1994, supplies to dairies were forecast to remain stable.
130. The structure of the Polish dairy sector is characterized by a great number of very small herdsthat contribute the bulk of the milk produced (over 80 per cent). These fans have a low capital inputand an average of only 1 to 3 cows. Although progress has been achieved, this small-scale productiongives rise to problems related to the handling of the milk and leaves much to be desired with regardto quality and yield levels (currently 3,100 litres per cow). Presently, a great majority ofthe country'sdairies operate at a loss, with consequences also for farmers. According to recommendations of theNational Association of Dairy Co-operatives, concentration of dairy production, amelioration of milkquality and amore efficient promotion ofdairy products, as well as amodernization ofdairy technology,are necessary for an improved dairy structure.
131. In 1993, production of skimmed milk powder and whole milk powder remained stable atapproximately 147,000 tons and 65,000 tons, respectively. However, during the first quarter of 1994,production of skimmed milk powder dropped by 30 per cent compared to the same period the previousyear. On 21 June 1994, Poland introduced a new import levy on skimmed milk powder amountingto ZI 16,200 per kg. Whole milk powder production remained unchanged. Whilealmost all productionof whole milk powder was consumed domestically, close to 60 per cent of skimmed milk powderproduction was exported. The export prices for skimmed milk powder ranged between US$1,230 andUSS1,530 per metric ton.
132. Butterproductiondroppedby almost 8 per cent to 139,000 tons in 1993, a less dramatic declinecompared to that of recent years (production almost halved between 1989 and 1992). During the firstquarter of 1994, the fall was fùrther compounded by a drop of 12 per cent compared to the same periodin 1993. Most of the butter produced in the country was also consumed there, only relatively smallamounts were imported. Under the derogation for sales of butter and butter oil to the formerSoviet Union since June 1993, Poland has notified exports of 7,388 tons. Over the past three years,the average monthly consumption of butter has gradually dropped to about 0.47 kgs. per month in1993. During the same period, consumption of margarine has increased. The trend appears to beone ofdeclining animal fat consumption and increasing consumption ofvegetable fats. This is thoughtto reflect changes in dietary behaviour and, also, lower prices of margarine in relation to butter.
133. Cheddar cheese production showed an increase of 8 per cent in 1993. Production increasedby 20 per cent in the first quarter of 1994, compared to the first quarter of 1993. Cheese consumptionfell about 6 per cent in 1993, and a further 12½ per cent in the first quarter of 1994 compared to thesame period in 1993.

DPC/W/140Page 48
TABLE 14
Poland - Trade in Dairv Products
('000 metric tons; ()= % change from comparable period)
SMP WMP Butter Cheese
Imports1993 14.7 (104%) 3.5 (n.a.) 6.1 (-42%) 37.4 (70%)
1st qtr 1994 0.5 (-90%) 0.05 (-97%) 0.05 (-98%) 2.4 (-84%)
Exports1993 86.2 (-5%) 3.7 (-61%) 17.0(1) (n.a.) 11.7 (102%)
1st qtr 1994 16.0 (13%) 1.0 (400%) 8.0(1) (300%) 10.0 (3200%)
'"Of which 2.4 tons for food aid.(2)Of which 1.5 tons for food aid.
Source: GATT.
HVNGARY*
134. In Hungary, overall agricultural output fell by a little less than 10 per cent in 1993. The fallin output from the livestock sector was more pronounced than in other sectors. Since 1990, milkproduction in Hungary has decreased by some 30 per cent to a level ofaround 2.1 million tons in 1993.During 1993, milk production declined by 11 per cent. Cow numbers have been declining for overten years. In the December 1993 census, the herd was estimated to have been 450,000 head - down9 per cent from 1992. Higher production costs and a lack of sufficient capital investment are amongthe main factors behind the decline in the Hungarian livestock sector.
135. Despite the gloomy outlook for the dairy sector, prospects for Hungarian agriculture, as a whole,look brighter in 1994. An increase of5 to 8 per cent is expected in agricultural production. Probablythe single most significant factor in this upturn is the Hungarian land reform. By 1 January 1994,31 per cent of total arable land was in private hands compared to 8 per cent in 1990. State farms arescheduled to be privatized in the latter half of 1994. Due to this reform process, less land is expectedto remain uncultivated this year, thus the forecast rise in output. Also, improvements for loan ternsto small farm entrepreneurs in 1994 may ease the financial burden suffered in previous years.
136. In relation to other Central and Eastern European countries, Hungary's milk production is onthe lower end. Yields are relatively high and match Western European standards. Deliveries to dairiesare commonly just below 90 per cent of production. Except for cheese, production has generallydeclined for dairy products in Hungary. The trend did not change in the first quarter of 1994.
137. In 1988, consumer subsidies were removed onmilk while support to producers was maintained.This led to price increases and a fall in consumption of dairy products. Milk consumption in Hungaryis currently among the lowest in Europe. Hungarians consume 150 litres of domestically produceddairy products a year (in milk equivalents). Liquid milk consumption amounts to 67 kgs. per capita,about half the corresponding European level.

DPC/W/140Page 49
138. Export subsidies for butter have been reduced to 10 per cent in 1994 (previously 30 per cent).For cheese, the subsidy is 30 per cent and, for milk powders it varies: 10 per cent between1 November to 30 April, and 20 per cent between 1 May to 31 October. Dairies received governmentsubsides between 1 June 1993 and 31 December 1993. This temporary support to milk wholesalerswas extended in 1994.
139. In 1993, Hungarian dairy exports decreased some 11 per cent in value terms. The value ofimports, on the other hand, increased by 19 per cent. Despite this differential, Hungary still enjoysa trade surplus in dairy products. The positive trade balance for ail agri-food trade in Hungary is muchlarger than in any other Central or Eastern European country.
TABLE 15
Hungary- Dairy Production
1992 1993 1992/93 1st qtr 1994 Change from1st qtr 1993
Milk 2,370 2,100 - 11% n.a. n.a.
SMP 9.4 5.3 - 44% 0.9 -18%
WMP 6.5 5.8 - 11% 0.9 0%
Butter 17.4 14.2 - 18% 3.2 -20%
Cheese 43.4 47.3 9% 11.5 4%
Source: GATT; *FAO.
TABLE 16
Hungary - Trade and Consumption
('000 metric tons; () % change from comparable period)
SMP W-P Butter Cheese
Imports1993 0.2 (from zero) 0.5 (25%) 0.2 (from zero) 6.5 (183%)
1st qtr 1994 0.2 (from zero) 0.0 (0.0%) 0.0 (0.0%) 1.1 (175%)
Exports1993 0.7 (-50%) 2.8 (48%) 4.5 (18%) 12.9 (-10%)
Ist qtr 1994 0.3 (from zero) 0.0 (0.0%) 0.1 (-91%) 2.1 (-25%)
Consumption1993 4.6 (41%) 3.6 (140%) 10.7 (-23%) 38.4 (16%)
1st qtr 1994 1.2 (9%) 0.9 (-10%) 2.7 (4%) 9.1 (17%)
Source: GATT.
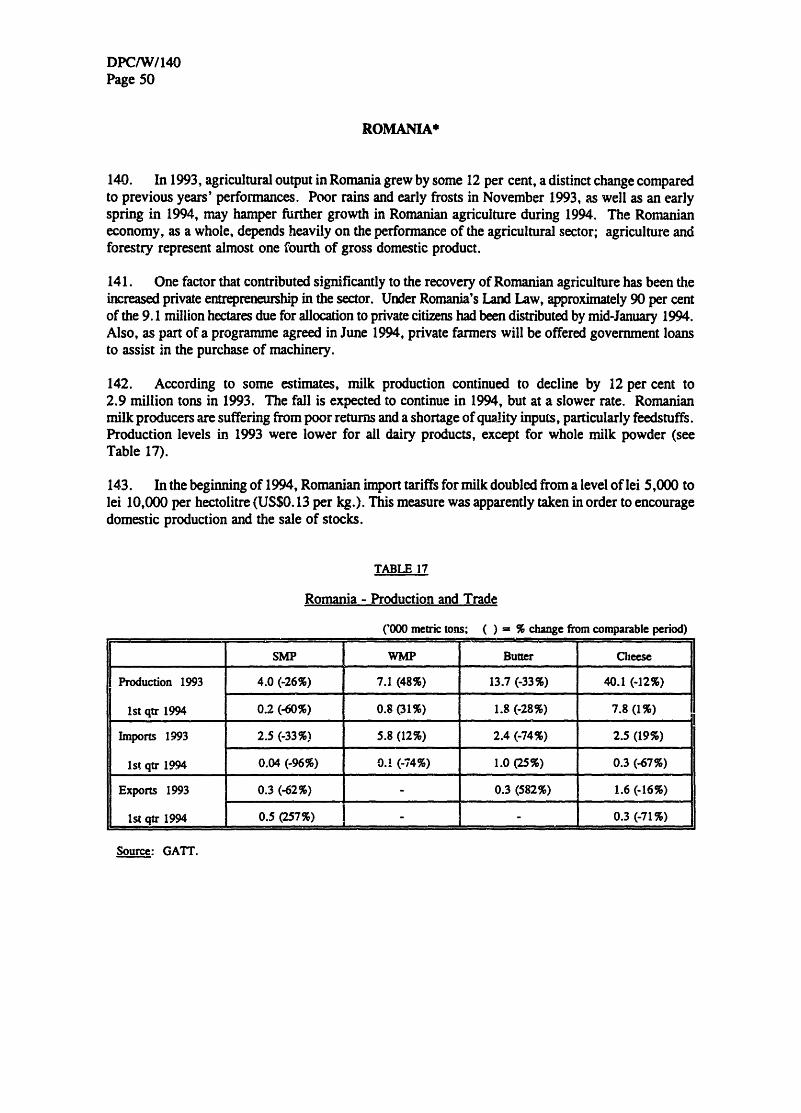
DPC/W/140Page 50
ROMANIA*
140. In 1993, agricultural output in Romania grew by some 12 per cent, a distinct change comparedto previous years' performances. Poor rains and early frosts in November 1993, as well as an earlyspring in 1994, may hamper further growth in Romanian agriculture during 1994. The Romanianeconomy, as a whole, depends heavily on the performance of the agricultural sector; agriculture andforestry represent almost one fourth of gross domestic product.
141. One factor that contributed significantly to the recovery of Romanian agriculture has been theincreased private entrepreneurship in the sector. Under Romania's Land Law, approximately 90 per centof the 9.1 million hectares due for allocation to private citizens had been distributed by mid-January 1994.Also, as part of a programme agreed in June 1994, private farmers will be offered government loansto assist in the purchase of machinery.
142. According to some estimates, milk production continued to decline by 12 per cent to2.9 million tons in 1993. The fall is expected to continue in 1994, but at a slower rate. Romanianmilk producers are suffering from poor returns and a shortage of quality inputs, particularly feedstuffs.Production levels in 1993 were lower for ail dairy products, except for whole milk powder (seeTable 17).
143. In the beginning of 1994, Romanian import tariffs for milk doubled from a level of lei 5,000 tolei 10,000 per hectolitre (US$0. 13 per kg.). This measure was apparently taken in order to encouragedomestic production and the sale of stocks.
TABLE 17
Romania - Production and Trade
('000 metric tons; ( ) = % change from comparable period)
Source: GATT.
SMP WMP Butter Cheese
Production 1993 4.0 (-26%) 7.1 (48%) 13.7 (-33%) 40.1 (-12%)
lstqtr 1994 0.2 (-60%) 0.8 (31%) 1.8 (-28%) 7.8 (1%)
Imports 1993 2.5 (-33%) 5.8 (12%) 2.4 (-74%) 2.5 (19%)
lst qtr 1994 0.04 (-96%) 0.1 (-74%) 1.0 (25%) 0.3 (-67%)
Exports 1993 0.3 (-62%) - 0.3 (582%) 1.6 (-16%)
1st qtr 1994 0.5 (257%) _- 0.3 (-71%)

DPCIW/140Page 51
BULGARIA
144. Drought, still persisting after two years, continues to have a negative influence on Bulgarianagriculture. Total agricultural output is preliminarily estimated to have fallen by 16 to 20 per centduring 1993. Livestock numbers declined sharply; by 1 April 1994, cow numbers had fallen by18 per cent compared to the same date in 1993. Among the Central and Eastern European countries,Bulgaria is one of the smallest producers.
145. Milk production fell by 18 per cent to 1.3 million kgs. in 1993. The fall, markedly steeperthan in previous years, escalated the trend of declining milk production. This trend continued intothe first quarter of 1994, with milk production falling another 16 per cent compared to the same periodin 1993. Whole milk powder and butter production were down 60 and 50 per cent, respectively, from1992 levels. In the first quarter of 1994, both butter and whole milk powder production were wellbelow comparable levels in 1993.
146. Bulgaria has traditionally been an important cheese producer and exporter; however, productionhas decreased substantially over the past years (see Table 18). Under the Interim Agreements betweenthe European Conununities and Bulgaria, the quota for cheese imports to the European Conununitieswas set at 1.000 tons for the first half of 1994. These imports are subject to a 40 per cent reductionin levies.
TABLE 18
Bulgaria - Cheese Production and Trade
('000 mewic tons;,= % change from comparable period)
1990 1991 1992 i993 1st qtr 1994
Production 142.2 116.5 83.6 59.7 6.4______________ _______ ______ ______________(-29%) (-50%)
Exports 18.0 23.9 20.2 13.2 2.7(-35%) (35%)
Imports 1.4 - 0.4 3.7 0.2(825%) (-75%)
Consumpion 129.7 85.3 n.a. 52.6 n.a.
Source: GATT.
147. In spite ofthe overall situation, dairy production in the private sector has increased substantially.The private sector grew as animals were relocated from the collective sector. Yields per cow alsoincreased, ifonly by 1 per cent; however, they still remained below the country's average. The currentstructure of Bulgarian agriculture comprises 171 agri-industrial farms, which rank among the largestfarms in the world (average size of 16,000 hectares). The privatization process in Bulgaria began laterthan in the other Central and Eastern European countries, and is expected to take up to 20 years tocomplete.
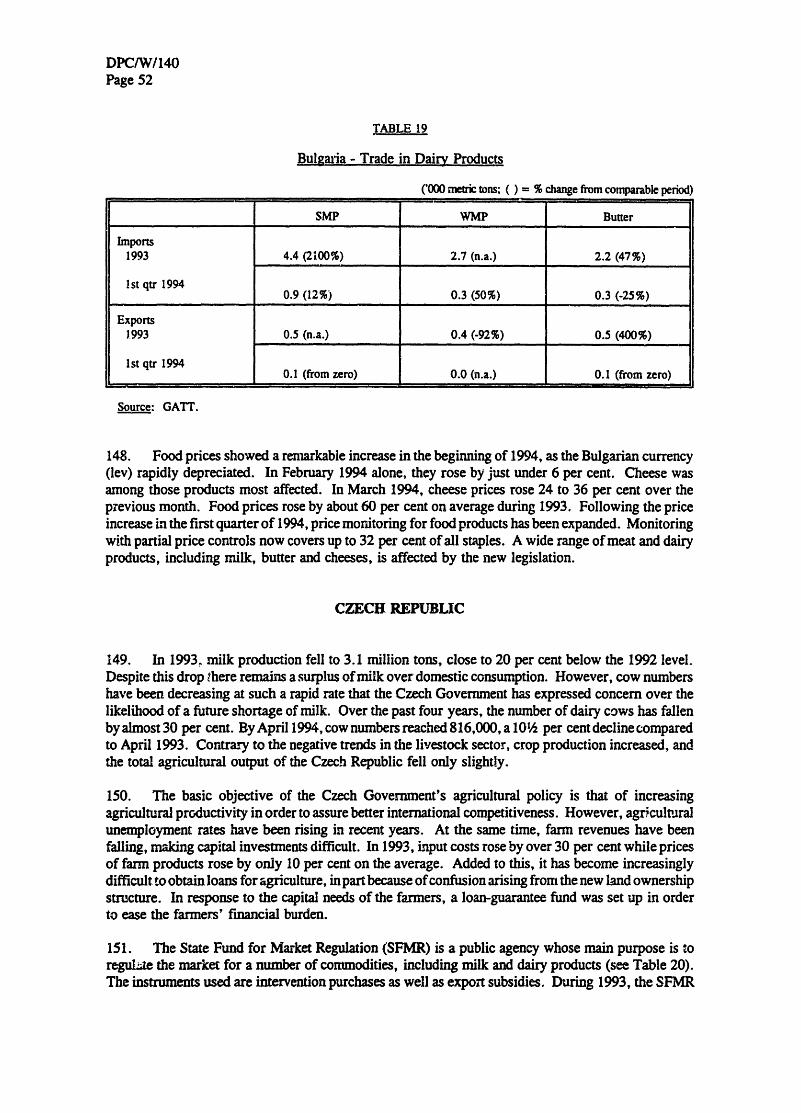
DPC/W/140Page 52
TABLE 19
Bulgaria - Trade in Daiar Products
('000 metric tons;,)= % change fmom comparable period)
SMP WMP Butter
Imports1993 4.4 (2100%) 2.7 (n.a.) 2.2 (47%)
1st qtr 1994 0.9 (12%) 0.3 (50%) 0.3 (-25%)
Exports1993 0.5 (n.a.) 0.4 (-92%) 0.5 (400%)
1st qtr 19940.1 (from zero) 0.0 (n.a.) 0.1 (from zero)
Source: GATT.
148. Food prices showed a remarkable increase in the beginning of 1994, as the Bulgarian currency(lev) rapidly depreciated. In February 1994 alone, they rose by just under 6 per cent. Cheese wasamong those products most affected. In March 1994, cheese prices rose 24 to 36 per cent over theprevious month. Food prices rose by about 60 per cent on average during 1993. Following the priceincrease in the first quarter of 1994, price monitoring for food products has been expanded. Monitoringwith partial price controls now covers up to 32 per cent of all staples. A wide range ofmeat and dairyproducts, including milk, butter and cheeses, is affected by the new legislation.
CZECH REPUBLIC
149. In 1993. milk production fell to 3.1 million tons, close to 20 per cent below the 1992 level.Despite this drop here remains a surplus ofmilk over domestic consumption. However, cow numbershave been decreasing at such a rapid rate that the Czech Government has expressed concern over thelikelihood of a future shortage of milk. Over the past four years, the number of dairy cows has fallenby almost 30 per cent. By April 1994, cow numbers reached 816,000, a 10h per cent declinecomparedto April 1993. Contrary to the negative trends in the livestock sector, crop production increased, andthe total agricultural output of the Czech Republic fell only slightly.
150. The basic objective of the Czech Government's agricultural policy is that of increasingagriculture] productivity in order to assure better international competitiveness. However, agriculturalunemployment rates have been rising in recent years. At the same time, farm revenues have beenfalling, making capital investments difficult. In 1993, input costs rose by over 30 per cent while pricesof farm products rose by only 10 per cent on the average. Added to this, it has become increasinglydifficult to obtainloans for agriculture, inpart because ofconfusion arising from thenew land ownershipstructure. In response to the capital needs of the farmers, a loan-guarantee fund was set up in orderto ease the farmers' financial burden.
151. The State Fund for Market Regulation (SFMR) is a public agency whose main purpose is toreguUe the market for a number of commodities, including milk and dairy products (see Table 20).The instruments used are intervention purchases as well as export subsidies. During 1993, the SFMR

DPC/W/140Page 53
managed 96 per cent of butter exports, about 22 per cent of total skimmed milk powder exports, and14 per cent of cheese exports.
TABLE 20
Czech Republic - Trade and Production in Dairy Products
('000 metric tons)
SMP Butter Cheese
1992 1993 1992 1993 1992 1993
Production 113.4 92.0 86.3 66.6 76.8 52.5
Total exports 48.0 66.4 29.4 31.7 10.8 10.4
SFMR exp. 12.0 14.5 28.3 30.5 7.4 1.5
Total 0.5 0.6 0.02 0.05 2.0 5.0
SFMR (Stâtnf Fond Trzní Regulace) is the Czech Government's State Fund for Market Regulation.
Source: GATT.
SLOVAK REPUBLIC
152. In 1994, GDP is expected to decline by 2 per cent and could be followed by further stagnationin 1995. On the other hand, agricultural output, which fell by approximately 6 to 7 per cent in 1993,is expected to show a 2 per cent growth in 1994. In general, livestock productivity was poor in 1993and dairy cow numbers fell to 422,700 head, down 12 per cent from 1993. Milk production declinedby 11 per cent to 1.3 million tons. Food consumption fell in Slovakia, as food prices rose approximately20 per cent during 1993. Milk consumption fell by about 10 per cent in 1993 compared to 1992.
153. As of 3 March 1994, the Slovak Republic imposed an import surcharge of 10 per cent on allimports.
COMMONWEALTH OF INDEPENDENT STATES
154. The Commonwealth of Independent States (CIS) produced approximately 16 per cent of theworld's milk output in 1993. Russia alone is one of the major cow milk producers in the world, onlysurpassed by the European Communities and the United States. The bulk ofthe milk originating withinthe CIS comes from Russia, Ukraine and Belarus. Their respective proportions of total milk deliveriesin 1993 were approximately 60 per cent from Russia, 25 per cent from Ukraine and 9 per cent fromBelarus. Kazakhistan was not far behind, with some 5 per cent of the total. Milk production in 1993feil only 2 per cent from the previous year's level to an estimated 83.6 million tons. Deliveries,however, decreased by 8 per cent and amounted to only 42½ million tons. On 1 April 1994, cownumbers were down by 6 per cent compared to 1 April 1993. In almost all CIS States, output fellduring the first quarter of 1994, compared to the same period in 1993; only in Belarus and Tadjikistanwas milk production slightly higher.
DPC/W/140Page 54
155. The former Soviet Union is a major importer of butter. However, compared to the late 1980s,butter imports by the former Soviet Union have fallen substantially and are presently well below theirprior volumes. Butter exports from participants ofthe International Dairy Arrangement to the Republicsof the former Soviet Union grew by over 50 per cent in 1993 to 91,100 tons1, stimulated by thederogation from the IDA minimum price inJune 1993. At the same time, exports from the United Stateswere up 45 per cent and attained 70,900 tons. This is still well below the peak import level of440,000tons in 1988. In 1994, it is expected that the countries of the former Soviet Union - especiallyRussia - will continue to be principal outlets for butter on the international market. In a Decisioneffective 4 May 1994, the Committee of the Protocol Regarding Milk Fat decided to suspend theminimum prices for butter and anhydrous milk fat for a period of up to twelve months.
Russia
156. In 1993, total agricultural output declined by some 4 per cent and is forecast to decline a further5 per cent in 1994. This situation has to be seen in light ofan overall economy that plunged 18 per centin tennis of real GDP during 1992, and "recovered" to a 12 per cent decline in 1993. Nevertheless,output of the major agricultural products fell by as much as 18 per cent during the first quarter of 1994.
157. After years of decline, milk production in Russia stabilized at approximately 47 million tonsin 1993. During the first four months of 1994, production was down by as much as 15 per cent fromthe comparable period of the previous year. A recent forecast estimates that total milk productionin 1994 could decline to around 42 million tons (down about 10 per cent). At 24.6 million tons, Statepurchases of milk in 1993 were 5 per cent below last year's level. On the other hand, milk deliveriesto non-State sources increased substantially in the beginning of 1994. About 6 per cent of total milkproduction (all categories of fans) was sold through channels other than the official procurement networkin the first quarter of 1994. The livestock sector is characterized by problems associated with feeding.In general, fodder quality and composition is poor. Also, the level of profitability has droppedsubstantially in recent years as the disparity between input and output prices has grown. At the sametime, prices for milk and dairy products have risen at a much slower rate than those for most otheragricultural products. On 1 April 1994, cow numbers, which had declined slightly during 1993, weredown 10 per cent compared to the same date last year.
158. Butter production was estimated to have fallen by 6 per cent in 1993 to about 700,000 tons.For the CIS as a whole, the decline was around 10 per cent. However, butter production fell stronglyin the first quarter of 1994, by some estimates as much as 33 per cent compared to the same periodin 1993. Imports in 1994 are expected to increase and in the first quarter of the year, imports roseby 28 per cent.
159. An import duty ofup to 15 per cent on milk and dairy products, effective from 15 March 1994,was suspended after two months. The reintroduction of the duty is currently under consideration.
Ukraine
160. Total agricultural production in Ukraine is estimated to have fallen by a little under 2 per centin 1993, while real GDP growth decreased by as much as i7 per cent. In the past three years(1991 to 1993), real GDP in Ukraine fell by 43 per cent. Preliminary forecasts for 1994 and 1995point towards a continued fall of about 10 per cent per annum. The first quarter of 1994 showed adecline ofalmost 5 per cent in agricultural output compared to the same period in 1993. Also, inflation
'For the EC the figure only includes exports between January and June 1993.

DPC/W/140Page 55
has been a major problem in Ukrainian agriculture; prices for milk and dairy products rose 115-foldduring the course of 1993.
161. In 1993, milk production in Ukraine fell by approximately 5 per cent to 18.1 million tons.The number of private farmers continued to increase, albeit at a modest rate. Currently, the area heldby private farmers amounts to just over 1 per cent of the total agricultural land area. The dairyproduction from these farmers represents a minute proportion ofthe total milk production in the country.Ukraine, which used to be a net exporter of dairy products to other Republics of the former Soviet Union,has since 1992 been relying on imports - notably of butter. Butter production decreased to approximately325,000 tons in 1993. Cheese production followed suit, and fell by about 12 per cent to 140,000 tonsduring the same year. Dairy products for children were among the few food-industry products thatrecorded an increase during 1993.
Belarus
162. The agricultural crisis in Belarus has deepened. In the first quarter of 1994, agri-food productiondropped by almost 16 per cent as compared to the same period in 1993. Livestock production accountsfor about 60 per cent of total agricultural production in Belarus. Milk production fell by a quartertO approximately 5.6 million tons in 1993. Deliveries declined by about 9 per cent in 1993 toapproximately 3.7 million tons. By 1 January 1994. cow numbers were down about 2 per cent to1.5 million head. However, on 1 April 1994, cow numbers had recuperated somewhat and were upsome 2 per cent on the corresponding level in 1993. Contrary to the great majority ofthe CIS Republics,milk production actually increased marginally in the first quarter of 1994. The effect on deliveriesis uncertain, as State purchasing authorities, including the dairy processing industry, are havingdifficulties in paying the farmers. The Republic has the highest per capita milk consumption levelin the CIS, although in 1993, per capita consumption fell by 6 per cent to 537 kgs. Given the relativelyhigh level of milk production, Belarus is a net exporter of dairy products.
BALTIC REPUBLICS
163. Milk production inthe Baltic States has beendeclining in recentyears. In 1992, theircombinedproduction was 5 million tons. This volume was estimated to have fallen to 4 million tons in 1993.In Lithuania, the largest dairy producer of the Baltic States, total agricultural production fell byapproximately 8 per cent. The decline was attributed mainly to debts owed by the food industries totheir suppliers. Because of transportation problems, farmers found it difficult to bypass the Stateprocessing plants in order to sell directly on the market. In 1993, milk production is estimated te havefallen by about 12 per cent in Lithuania.
164. The agricultural sector is of considerable importance to the Estonian economy. Currentlythe sector employs 50 per cent of the country's workforce and accounts for 21 per cent of exports.The sector is, however, lagging behind the overall economy and farm privatization has been proceedingslowly. Total agricultural production is estimated to have fallen by about 17 per cent in 1993. Since1991, the livestock herd has been halved. Milk production fell from 1.3 million tons to 600,000 tonsin 1993, reportedly the average level of the 1930s. In January 1994, milk deliveries were down17 per cent compared te the same month in 1993.

DPC/W/140Page 56
JAPAN*
165. In 1993, Japan production of raw milk increased by 4 per cent to 8.58 million tons; howeverthe overall demand for dairy products stagnated, due mainly to the economic slowdown. Import demandby Japan has been reduced due to surplus production and substantial stock accumulation. In orderto cope with this situation, the milk producers organization reduced the milk production target quantityfor FY 1993 (April 1993 to March 1994) to 98 per cent of the original plan. As the market is stillover-supplied, the milk production target was set for FY 1994 at 95.3 per cent of the revised amountforFY 1993. However, milk production inJapan is expected todecrease inthe near future.and increasedimports are expected to meet any growth in demand. Japan is one of the world's largest net importersof dairy products in terms of both quantities and value.
166. Forthe fiscal yearbegining April 1992, a temporary programme was introduced tocompensatedairy farmers for reduced income from the sale ofcalves for beefproduction. This programme providedfor higher payments for milk sold to manufacturers. The 1993-94 guaranteed price for raw milk usedfor processing remained unchanged, but the standard transaction price (price paid by dairies) waslowered. As a result, the 1993-94 government per unit payment (difference between guaranteed priceand standard transaction price) was increased.However the total quantity benefiting from thispayment declined, total government outlays were reduced.
167. In 1993, skimmed milk powder production continued to increase in Japan by 7 per cent te222,000 tons. Total consumption decreased. imports also decreased by 24 per cent to 74,000 tonsin i993. In the first quarter of 1994, production decreased by 10 per cent to 53,000 tons. Importsalso decreased, by 5 per cent to 19,000 tons.
168. Given the rise in manufacturing milk supplies, butter output continued to increase in 1993.Japan's butter consumption increased only slightly, not offsetting the increase in output. This resultedin a significant increase in butter stocks. To address this stock increase, measures to reduce the dairyherd and te encourage greater use of milk for calf feed were taken. Intervention purchases of butterbegan in August 1993.
169. Japanese cheese production increased by 9 per cent in 1993. Domestic consumption of cheesehas nearly doubled in ten years and is likely to continue to increase. Since the demand for cheeseis still growing, the production of natural cheese is expected to increase in the mid or long term. In1993, Japanese cheese sports incresed by 6 per cent to 134,000 tons. The European Communities,New Zealand and Australia remained the main suppliers. Japanese imports ofcheese are forecast toincrease by 5 per cent in 1994 te reach 140,000 tons.
170. In late September 1992, Japanannounced increases in import quotas for various whey products.Import quotas for prepared whey for infant formula and for mineral concentrated whey is increasedby 2,000 tons each fiscal year from 1992 through 1994. The fiscal year 1991 quota levels were19,000 tons for prepared whcy for infant formula and 8,000 tons for mineral concentated whey. Thequota for whey powder for animal food is increased by 3,000 tons each fiscal year, starting from the1991 level of 8,000 tons. The quota for other dairy products was set at 91,000 tons for fiscal year1992, with increased of 10,000 tons annually through 1994.
171. Condensed milk production decreased by 8 per cent in 1993, reaching 57,800 tons. Therewas a further decrease in production of the same order in the first quarter of 1994.

DPC/W/140Page 57
172. As a result ofthe Uruguay Round, Japan's base rate ofduty on skimmed milk powder, equalling25 per cent plus Y 466 per kg., will be reduced in six equal instalments to 21.3 per cent plus Y 396per kg. In the case of skimmed milk powder and butterfat, for example, the duty is composed of anad valorem duty and a specific amount collected by the Governnent of Japan from its agents. Forskimmed milk powder used as animal feed only the specific duty is bound. The tariff on butter willbe reduced from the base level of 35 per cent plus Y 1,159 per kg. to 29.8 per cent plus Y 985 per kg.The tariffs on all types of cheeses (except processed and grated cheeses) will be reduced from 35 percent to 29.8 per cent over the implementation period.
173. Japan will open tariff quotas for dairy products totalling 442,455 tons in the initial year andrising to 451,755 tons in the final year. These quantities inciade two tariff quotas for skimnmed milkpowder for a total of 93,143 tons; three tariff quotas for whey for a total of 84,000 tons; 1,873 tonsof butter/anhydrous milk fat. Furthermore, Japan consolidated an aggregate tariff quota for "otherdairy products for general use' amounting to 124,640 tons in 1995 and rising to 133,940 tons in 2000.This quota is expressed in whole milk equivalents (rather thanproduct weight' and covers dairy productsother than butter, anhydrous milk fat and cheese. In addition, Japan will establish an aggregate tariffquota of 137,202 tons milk equivalent for 'designated dairy products for general use" which coversproducts other than fresh milk/cream (HS 0401) and cheese. Japan will also bind and successivelyreduce the mark-up applicable to imports underthe tariffquotafor 'designated dairy products for generaluse". Japan did not consolidate any tariff quotas for cheese.
174. Japan undertakes not to introduce any agricultural export subsidies.
ARGENTINA*
175. In Argentina, all restrictions on production and marketing, other than sanitary regulation ofdaiiy produces, have been abolished. There is no guaranteed or support price for either producersor manufacturers. In addition, following the trade liberalization measures implemented in April 1991,imports of dairy products increased, purting further competitive pressure on domestic producers.
176. Production and consunption of whole mik powder decreased in 1993. Argentinean exportsrecovered in 1993. Whole milk powder imports dropped Skimmd milkpowder production fell byas much as 46 per cent in 1993. Consumption also dropped by 42 per cent to 21,000 tons. Skimmedmilk powder exports recovered from the steep decline of 1992, to 6,400 tons. Imports dropped byas much as 70 per cent during 1993. The decline in imports of milk powders was mainly due to theimposition ofcountervailing duties, as ofOctober 1992, on imports ofmilk powders, soft cheese, semi-hard cheese and blue cheese originating in the European Communities. In the first quarter of 1994,production ofwhole milk powder increased while domestic consumption and exports declined steeply.For skirnmed milk powder, production and imports increased while domestic consumption and exportsdeclined.
177. Production of butter continued to expand in 1993 and reached 49,800 tons, 40 per cent morethar. in 1992. Consumption also increased, by 20 per cent, during 1993. Exports of butter fromArgentina, which were negligible in 1992, increased to 920 tons in 1993. Imports of butter droppedby 70 per cent to 2,000 tons. In the first quarter of 1994, production of butter remained stable.Consuirption and imports decreased. Expons, which were negligible in the first quarter of 1993,increased to 230 tons in the first quarter of 1994.
178. Cheese production grew by 10 per cent in 1993 te 321,000 tons. Consuznption aiso grew,by almost 9 per cent, to 320.000 tons in 1993. Exports in 1993 increased to 3,500 tons compared

DPC/W/140Page 58
to 1992. Imports decreased from 6,300 tons in 1992 to 2,800 tons in 1993, also in response to thecountervailing duties. In the first quarter of 1994, production, imports and exports ofcheese increasedwhile consumption decreased.
URUGUAY*
179. In Uruguay, nuLk production in 1992 reached 669,000 tons, a decrease by 6"A per cent over1991. The producer price ofmilk for consumption is fixed every four months in relation to movementsin production costs. Higher producer prices combined with favourable weather conditions stimulatedproduction in 1993.
BRAZIL
1J80. Milk production recovered in 1992 from the previous year's drought, and increased a further1 'h per cent to 15.2 million tons in 1993. The slight 1993 increase reflected slow growth in consumerdemand. In 1994, small productivity gains are expected to maintain the low rate of expansion. Milkyields in Brazil average 790 kgs. per cow, although in some regions yields are as high as 2,600 kgs.Currently. the Brazilian dairy herd numbers an estimated 20 million head. Consuniption ofdairy productshas declined since 1988, largely as a result of worsening economic conditions.
181. Brazil reformed its tariff schedule in March 1990, and subsequently reduced import tariffson dairy products. However, in August 1992, Brazil imposed countervailing duties of 21 per centon imports ofmilk powders from the Euripean Communities. This action gave rise to a dispute subjectto examination by a panel established by tlcGAT Comunittee on Subsidies and Countervailing Duties.In April 1994, the Committee adopted the report of the panel which ruled that Brazil had actedinconsistently with its obligations under the Agreement on subsidies when imposing countervailingduties on impos of milk powders from the European Communities
182. Brazilian miL powder production is estimated to have increased by as much as 45 per centto 80,000 tons in 1992, and to have rernained unchanged ai that level in 1993- Imports decreased to10,000 tons in 1992, due to the coning general decline in danmid for daiiy products. Despite reducedfunding for govermnnent-operated feeding programmes, imports are estimated to have increased to23,O00 tons in 1993.
UNITED STATES
183. Milkproducion. MiLk production in the United States remained roWghly stable at 69 million tonsin 1993. This was the result of increased yields per cow (up 1 per cent) offsetting the effects of adeclining herd (down 1 per cen;). The United States thus continued its long tern structural adjustmentin milk production with dairy cow numbers declining year after year. Decreasing real milk pricescontributed to this development. A 1 per cent increase in yields per cow followed an alrnost 4 per centincrease in 1992, due to excellent fodder quality that year.
184. In 1994, milk production is expected to show a small increase to 69.3 million tons. This forecastis, however, subject to anumber ofuncertainties, including the impact ofthe use ofbovine somatotropin(BST) on output. The 1993 Budget Act required a ninety-day moratorium on the sale of BST after

DPC/W/140Page 59
it was approved by the Food and Drug Administration (FDA) in November 1993. As ofFebruary 1994,the Monsanto company has thus begun to market the first BST product. It is expected that farmerswill adopt the product only gradually as they assess the risks involved, such as consumers' reactionsto BST-treated milk. The USDA projects that 10 per cent of the national herd will be treated by theend of 1994, resulting in a 820 kg. increase in yields per treated cow. Average milk yields are forecastto rise by 2 per cent in 1994. In 1993, average yields per cow in the United States were 7,036 kgs.
185. In the United States. surplus production had become a pressing problem since the early 1980s.The USDA Commodity Credit Corporation (CCC) owned dairy stocks, peaked between 1981 and 1983at a level of 6 to 8 million tons of milk equivalent on a milk fat basis. Since then, the support pricefor milk has been reduced continuously from US$13. 10 per hundredweight in 1983 (US$0.29 per kg.of milk) to US$10. 10 per hundredweight (US$0.22 per kg.) currently. The price support mechanismtakes the form ofCCC purchases of cheese, butter and non-fat dry milk from dairies at prices designed"to enable plant operators to pay dairy farmers, on the average, a price equal to the support level".In July 1993, the CCC purchase price for butter was reduced by 15 per cent to US$1,432 per ton whilethe support price for non-fat dry milk was raised by 6 per cent to US$2,27ô per ton. There are noquota constraints to output, but US dairy farmers have ta pay a 3 per cent assessment on milk marketings,which is refunded if they certify that they did not increase milk marketings over the previous year'slevel. In 1993, farmgate prices for milk averaged about US$12.80 per hundredweight (US$0.28 perkg. of milk), 3 per cent less than in 1992. In 1994, milk prices are expected ta drop further as thereis expected to be a sizeable surplus of both milk fat and skim solids.
186. In the period 1987 to 1992, commercial use of skim solids grew by more than 2 per centannually, while growth in milk fat sales slowed to 1.1 per cent annually. This trend led ta dramaticallyaltered relative prices. However, in 1993 there was a sudden change in the cream and skim solidsmarkets, with butter sales exceeding 454,000 tons for the first time since the mid-1960s. Commercialbutterfat use grew by 2 to 3 per cent in 1993. The USDA considers this a long-delayed adjustmentto the steady shift in the valuation ofmilk away from cream and towards skimmed milk. As a result,CCC net removals of milk fat (including DEIP) dropped from 454,000 tons in 1992 to90,000-140,000 tons in 1993. In fact, from August to year end 1993, theCCC was selling butter backto the industry. Net removals of skim solids, on the other hand, were substantial throughout the year.They increased from 90,000 tons in 1992 to 140,000 tons in 1993. In 1994, the USDA expects a milkfat surplus in the magnitude of 270,000 to 320,000 tons, and a skim solids surplus as large. Suchprojected equivalence last happened in 1987.
187. Tradepolicy. The US dairy industry is protected by import quotas as required by Section 22of the 1'933 Agricultural Adjustment Act. Imports of dairy products are limited to 111,000 tons andcover mainly cheese but also apply to butter, certain dried milk products, malted milk and other milkand cream products. Most-favoured-nation tariffs on dairy products averaged 10 per cent in 1993,ranging from zero to 25 per cent. Most cheeses were dutiable at the maximum rate. Under NAFTA,the United States will receive duty-free access into Mexico for 40,000 tons ofmilk powder, increasingby 3 per cent annually over a fifteen-year transition period. This quota equals US subsidized salesof non-fat dry milk under the DEIP in 1992. The United States will establish an aggregate initial duty-free quantity of 5,500 tons for cheese. For dairy products other than cheese, the United States willestablish several "basket" quotas totalling about 5 per cent ofcurrent US quota imports. The agreementincludes provisions on reprocessing and rules oforigin in order to prevent Mexico becoming an "exportplatform" for non-NAFTA parties. (Sec also section on Mexico.)
188. As a result of the Uruguay Round negotiations, the United States will replace its dairy importquotas with tariffequivalents, which will be reduced by 15 per cent in equal annual instalments oversix years beginning in 1995. The tarifffor skimmed milk powder will be reduced from 101.8 cents/lkg.ta 85.6 cents/kg.; that for butter from 181.3 cents/kg. toa 154.1 cents/kg.; and for Cheddar cheese

DPC/W/140Page 60
from 144.3 cents/kg. to 122.7 cents/kg. The current import quota for cheese of 110,999 tons willbe converted to a tariff rate quota and increased to 141,991 tons by the year 2000. The new accesswill be allocated by country. Total market access opportunities for dairy products (covered underChapter 4 of the HS) will rise from approximately 150,000 tons in 1995 to 200,000 tons in 2000.
189. The United States will establish a ceiling for the quantity of subsidized exports and budgetaryoutlays for dairy products. For butter and butter oil,the annual allowable quantity will be decreasedfrom 42,989 tons in 1995 to 21,097 tons in 2000. The allowable budgetary outlay will be reducedfrom US$44.8 million to US$30.5 million during the same period. For skimmed milk powder, thecomparable quantity decrease will be from 108,227 to 68,201, whereas the decline in the budgetaryoutlay ceiling will be from US$12 1.1 million to US$82.5 million. Themaximum quantity ofsubsidizedcheese exports will be reduced from 3,829 tons in 1995 to 3,030 tons in 2000, while the budgetaryoutlay ceiling is dropped from US$5.3 million to US$3.6 million during the same period.
190. Dairy ExportlncentiveProgram. The DEIP provides cash subsidies (called bonuses) to privateexporters for a range of dairy products for sale in targeted countries and regions. After the sharpincrease of subsidized exports in 1992, which coincided with a significant build-up of CCC stocks,sales remained at that level in 1993. Subsidy awards totalled 156,800 tons compared to 155,500 tonsin 1992. Sales of skimmed milk powder and whole milkpowder remained almost unchanged at117,00 tons and 16,000 tons, respectively. Butterfat sales decreased slightly to 20,000 tons. Totalawards were thus considerably smaller than initial allocations for the 1993 DEIP, which provided for204,000 tons of milk powders alone. The main export destinations were again Algeria (77,000 tons),followedby Mexico (37,000 tons). DEIP expenditure totalled US$143 million in 1993 (US$140 millionin 1992); the average subsidy per ton ofdairy product was US$911. In March 1994, the United Statesannounced details of the 1994 DEIP. Some 136,900 tons of milk powder is available for distributionto 95 countries, 27,450 tons of butterfat to 69 countries and 5,500 tons of cheese to 22 countries.The total 1994 allocation - 169,850 tons of dairy products - compares with 258,235 tons in 1993.The total quantity is also well below the initial allocations for 1992 (197,300 tons), but it is more inline with what has actually been exported under the DEIP in the past two years.
MiIkPowders
191. Non-fat dry milk production in 1993 recovered to 420,000 tons. This follows the decline to396,000 tons in 1992 as larger quantities of milk were diverted to cheese production. Domesticconsumption ofskimmed milk powder regained its 1990 level of about 340,000 tons in 1992, but declinedagain to 263,000 tons in 1993. In the first quarter of 1994, non-fat dry milk production increasedby 15 per cent to 120,000 tons.
192. In 1993, exports of skimmed milk powder increased by 2 per cent to 76,000 tons. Exportsin the first quarter of 1994 increased to 27,500 tons compared to 19,500 tons in the first quarter of1993. Total stocks of skimmed milk powder increased slightly throughout 1993 and by the end ofthe year were at 40,600 tons compared to 36,800 tons a year earlier. Stocks at the end of June 1994were estimated at 52,000 tons.
193. Whole milk powder production declined in 1993 by 10 per cent to 68,400 tons. Exportscontinued to rise during 1993, by as much as 34 per cent to 37,600 tons. However, in the first quarterof 1994 exports declined sharply to 6,000 tons, compared to 20,200 tons in the first quarter of 1993.
Butter and Butter Oil
194. In 1993, butter production declined by 3½ per cent to 598,000 tons, as surplus milk suppliesdeclined and the output ofcheese continued to grow. New domestic food labelling rules may contribute

DPC/W/140Page 61
to the increased production of lower fat versions of products with high milk fat content, such as butter.In the first quarter of 1994, butter production decreased by 6 per cent to 180,000 tons.
195. In the period from early 1993 to August 1993, US sales and donations to the former SovietUnion under various programmes approximated 98,000 tons of dairy products, 72,000 tons of whichwere butter. Two-thirds of these sales and aid shipments, almost exclusively butter and butter oil,were destined for Russia. A further donation of 2,500 tons of butter and 5,500 tons of butter oil toRussia has recently been reported. In the first four months of 1994, US sales or donations to otherRepublics of the former Soviet Union amounted to 4,500 tons of butter, 7,250 tons of butter oil and2,575 tons of whole milk powder.
196. Butter stocks have declined continuously. From 275,000 tons in June 1993, stocks droppedto 224,000 tons on 1 September, as compared to 326,000 tons one year earlier. By the end of 1993,stocks had decreased to 128,000 tons. Butter stocks totalled 89,000 tons at the end of June 1994.
Cheese
197. US cheese production decreased slightly in 1993 to2.93 million tons. The US market continuedto show strong growth in cheese consumption with annual gains around 5 per cent in 1992 and cheeseconsumption continued to grow, albeit at a slower rate. in 1993. Cheese exports increased by 7 percent to 16,300 tons in 1993. In the first quarter of 1994, cheese production increased by 4 per centto 730,000 tons. Exports increased by 10 per cent to 4,300 tons.
198. US cheese imports reached 145,000 tons in 1993 (up 12 per cent). The bulk of the importswas from the European Commnunities and New Zealand. In the first quarter of 1994, cheese importsincreased by 28 per cent to 31,800 tons.
Other Dairy Products
199. Whey powder production increased by 1 per cent in 1993, to 557,000 tons. However, outputdecreased by 10 per cent in the first quarter of 1994.
200. In 1993, concentratedmilk production decreased zo 254,000 tons, 5 per cent less than in 1992.Production continued to decrease in the first quarter of 1994.
201. The United States is the world's largest importer of casein. Imports increased by 6'k per centin 1992 to 91,300 tons. Their value increased by 24 per cent from US$294 million in 1991 toUS$366 million in 1992, reflecting a substantial increase in average import prices. In 1993, however,casein imports declined by 15 percent to 77,400 tons, and their value declined by 13 percent comparedto 1992. The main supplier remained the European Communities and New Zealand. In the first quarterof 1994, imports increased sharply to 21,400 tons compared to only 14,100 tons in the first quarterof 1993.
CANADA
202. In Canada, milk is marketed either as industrial milk or as fluid milk. Industrial milk (some59 per cent of total production) is milk destined for the manufacture of dairy products such as butter,cheese, yogurt, and ice-cream. Fluid milk includes table milk and fresh cream. Canada's supplymanagement in the dairy sector at the national level is aimed at balancing domestic industrial milkproduction with domestic requirements, measured in terms ofbutterfat. Milk production is constrained
DPC/W/140Page 62
by the National Market Sharing Quota (MSQ), which is adjusted periodically to reflect changes indemand. The production quotas are individual farm quotas. Over-quota production is discouraged byhigh over-quota producer levies, and exports are financed by in-quota levies. For fluid milk, deliveryentitlements are established at the provincial level, with part of the MSQ serving as a reserve forunforeseen requirements. Dairy imports are limited to 20,400 tons of cheese under quota (unchangedsince 1978) and small volumes of other dairy products.
203. The Canadian Government supports the price for industrial milk received by dairy farmersin two ways. The Canadian Dairy Commission, a government agency, purchases butter and skimmedmilk powder at prices sufficient to maintain a target return for dairy farmers. In addition, the AgricultureStabilization Board pays a direct subsidy on deliveries within the MSQ. A 10 per cent subsidy cutin August 1993 will be followed by further 5 per cent cuts in the next two dairy years. No decisionhas been made so far as to whether producers will have to absorb the income effects of the subsidyreduction or whether they will be offset through higher prices to consumers. In August 1993, the targetreturn was raised to Can$50.84 per litre, while the support prices were further adjusted in favour ofskim solids. The butter support price was lowered by 0.7 per cent to Can$5,324 per ton and theskimmed milk powder support price was increased by 4.8 per cent to Can$3,498 per ton.
204. Milk deliveries decreased to 6.8 million tons ;1 1993, 3 per cent less than in 1992. Thisdevelopment is in line with the past trend of decreasing production as a result of successive MSQ cuts.However, since August 1993, the MSQ for 1993-94 was increased twice in order to counter butterfatshortages. As of November 1993, the MSQ is 4.19 billion litres. The scarcity situation is consideredonly temporary because milk production and milk fat yields in Ontario in summer 1993 were unusuallylow. In October and November 1993, milk deliveries increased 5 per cent compared to year earlierlevels. Delivery estimates for the 1993-94 dairy year (August-July) indicate that farm sales remainedstable at around 7.7 million tons. Production and consumption of fluid milk are forecast at 3 millionlitres. In 1993-94, total milk production is estimated to have increased by 2 percent to 7.6 million tons.
205. The increase in t.e MSQ, albeit temporary, is noteworthy because since 1988 the MSQ hadconsistently been adjusted downward in line with the long-term trend of declining milk fat demand.In fact, in the 1992-93 dairy year, Canada was operating very close to the cross-over point when domesticrequirements were no longer driven by the demand for butterfat, with a resulting structural surplusof non-fat solids.
206. Skimmed milkpowder production at 51,600 tons was 3½ per cent lower in 1993, comparedto 1992. Exports were low in the 1993-94 dairy year, down to 14,000 tons. This compares with61,000 tons in 1991-92 and 17,000 tons in 1992-93. Due to the close supply-demand balance betweensolids-non-fat and butterfat, skimmed milk powder exports are forecast to drop further to 10,000 tonsby 1994-95.
207. In the second half of 1993, demand for butterfat showed a significant increase, particularlyfor industrial use. By the end of 1993, butter stocks were at 5,400 tons compared to 10,200 tons atthe beginning of 1993. Stocks on 1 April 1994 increased to 12,500 tons as production increased.The increase in consumption for industrial use was due to price incentives offered through the CanadianButterfat Utilization Program and the Rebate Program for Further Processors. These schemes, aimedat boosting demand, are expected only to delay the problem of structural surpluses of butter.
208. In the 1993-94 dairy year, domestic use of butter is expected to have increased from 81,000 to83,000 tons. Butter stocks declined to 16,000 tons by July 1994 (end of 1993-94 dairy year). Butterproduction and consumption are expected to drop by 2½h per cent and 3½,i per cent, respectively, in1994/95. In the medium tenn, Canada will be faced with growing butterfat surpluses, unless industrialmilk production declines, as continuing growth in the consumption of low-fat fluid milk and other low-fat

DPC/W/140Page 63
dairy products will generate increased skim-off available for butter production. At the same time,butter consumption can be expected to decrease further as Canadians become an ageing and more health-conscious population.
209. Canadian cheese production for the 1993-94 dairy year is estimated at 114,000 tons for Cheddarand 162,000 tons for specialty cheeses. Cheddar cheese production and consumption are forecast tostay close to the same level for 1994!95. Specialty cheese production and consumption are still expectedto increase by 2 per cent and 3 per cent, respectively. The trend for specialty cheeses should continuein future years. Cheese exports, as well as exports of butter and sweetened condensed milk, benefitfrom the Dairy Export Assistance Programme of the Canadian Dairy Commission. Exports of cheesedecreased to 9,000 tons in 1993.
210. In Canada's Uruguay Round schedule of tariff concessions, most tariffs for dairy products arefixed in ad valorem terms, subject to a minimum specific duty. For example, Canacia's base ratesof duty for cheese will be 289 per cent, subject to a minimum ranging from Can$4, 149 (Cheddar,Mozzarella) to Can$6,805 per ton (Camembert). All base tariffs for cheese will be reduced by15 per cent in six equal annual instalments, with the first tariff cut due in 1995. The base tariff forskimmed milk powder, which amounts to 237.2 per cent but flot less than Can$2,360 per ton, willbe reduced to a final bound tariff of 201.6 per cent but not less than Can$2,006 per ton. The baserate of duty for butter, 351.4 per cent but not less than Can$4,780 per ton, will be decreased to298.7 per cent but not less than Can$4,001 per ton.
211. Canada will establish tariff quotas for dairy products totalling 96,065 tons in 1995 and risingto 97,375 tons in 2000. Of this aggregate quantity, 64,500 tons represent the estimated annual cross-border purchases imported by Canadian consumers. Furthermore, 20,412 tons of cheese have beenconsolidated. Access opportunities for butter will increase from 1,964 tons in 1995 to 3,274 tons in2000, most of which will be reserved for New Zealand. Imports under tariff quotas will be subjectto reduced rates of duty.
212. Canada is committed to reduce subsidized exports of cheese, butterfat and skimmed milk powder,and "other milk products", a category which includes whole milk powder. Maximum allowablesubsidized exports of skimmed milk powder will be 54,910 tons in 1995 and 44,953 tons in 2000;and for butter 9,464 tons in 1995 declining to 3,500 tons in 2000.
MEXICO
213. Mexico's economic crisis began in 1982. Real incomes fell by 2½h per cent annually between1983 and 1988. With a certain time lag, Mexico's dairy sector followed the economic downturn.Milk production peaked at 7,474 million litres in 1985 and then declined sharply. Production droppedto as low as 5,704 million litres in 1989 and has since then recovered rapidly. For 1993, milk productionis estimated at 7,226 million litres (up 4 per cent from the previous year), with a cow herd of6½h million head.
214. One of the reasons for the contraction of Mexico's milk production in the 1980s was the policyof government procurement and milk price controls during 1982-88, which had the effect of heavilytaxing dairy farmers (i.e., the producer subsidy equivalent was negative). Until 1988, delivery priceswere 45 per cent less than in the United States. Many dairies diversified into the production of cheese,butter, yogurt and otherproducts whose prices were not controlled. Since 1989, thegovernment's policyhas been to align prices paid to producers in Mexico with producer prices in the southern United States.This price alignment has almost been achieved but there remains scope for improved herd management

DPC/W/140Page 64
and reduced production costs. Bovine somatotropin (BST) was approved for use in Mexico inJuly 1990.
Specialized dairies use it and yield increases are reportedly in the magnitude of those obtained in the
United States.
215. Per capita consumption of fluid milk declined from 113 litres in 1980 to 46 litres in 1990.Per capita consumption of dairy products in Mexico is less than half that in most developed countries,
but consumption has been expanding at a faster rate than domestic supply. The bulk of dairy
consumption, both from production and imports, is in the form of milk. In 1992, about 32 per cent
of consumption was in the form of processed dairy products and 2 per cent in the form of cheese.
For 1992, milk consumption is estimated at 9,569 million litres (fluid milk equivalents), of which
7,122 million litres were from domestic production and the remainder was reconstituted imported milk
powder.
216. The Mexican Government has traditionally been a major participant in the marketing ofpowderedmilk. LICONSA, CONASUPO's dairy affiliate, intervened as the sole importer and as the majorwholesaler to industry, retailers and consumers. The social milk supply programme of LICONSA
provides reconstituted milk to poor families at subsidized prices (about 5 million litres per day).Although private traders are now allowed to import milk powders, LICONSA's share remains high,
86 per cent in 1992.
217. Mexico has been one of the world's largest importers of skimmed milkpowder in recent years.During the 1980s, when Mexico's dairy price policy had a strong consumer bias, imports rose sharplyin line with the fall in domestic production. Imports of milk powders peaked in 1990 at 300,000 tons,and are estimated at 185,000 tons in 1992 and at 160,000 tons in 1993. The forecast for 1994 is for
170,000 tons of imports. This 6 per cent increase over 1993 reflects increasing fluid milk consumptionas a result of rising incomes and the Mexican Government's policy of subsidizing milk to the lower
income segment of the population. Mexico has been a major beneficiary of the United States DairyExport Incentive Program (DEIP). In 1993, DEIP sales to Mexico totalled 37,000 tons of skimmedmilk powder. Australia reportedly contracted for the sale of 20,000 tons of milk powders to Mexicoin early 1994. New Zealand's exports of whole milk powder to Mexico totalled 40,300 tons in 1993,compared with 27,000 tons in 1992.
218. Imports of cheese are forecast to climb to 35,000 tons in 1994, compared to 30,000 tons in
1993 and to only 2,000 tons in 1989.
TABLE 21
Dairy Exports to Mexico in 1993 by Main Suppliers (inr metric tons)
Period SMP WMP Butter Butter oil
US Dairy Export IncentiveProgram Sales in CY 1993 37,200 - - -
European Communities Jan.-Nov. 1993 exports 88,955 3,789 - 9,623
New Zealand Sales in CY 1993 5,700 40,300 - 13,800
Australia Sales in CY 1993 3,043 - - 3,577

DPC/W/140Page 65
219. Under NAFTA, trade in agriculture will be governed by three separate bilateral undertakingsbetween Canada, Mexico and the United States. Mexico and Canada decided to make no market accessconcessions. The US-Mexico agreement provides for gradually increased market access culminatingin complete trade liberalization. For its part, Mexico eliminated its import licensing scheme effective1 January 1994, and introduced tariff rate quotas. The United States was granted duty-free accessfor 40,000 tons of milk powder to be increased by 3 per cent annually over a fifteen-year transitionperiod. The over-quota tariff is 139 per cent ad valorem (US$1, 160 per ton) and will be phased outas well over fifteen years. For other products, such as evaporated milk and cheeses, the previous20 per cent tariff will be reduced by 2 percentage points over ten years. (See also section on theUnited States.)
SOUTH AFRICA*
220. Until the beginning of 1992, stabilization measures and the determination of a minimum producerprice for milk were implemented by the South African Dairy Board as part of the Dairy Scheme. TheDairy Board was abolished as of 1993. The instruments of stabilization are now determinedindependently by milk buyers. There are no support prices and no producer subsidies, average actualreturns to producers are independently determined by die milk buyers. As a result of the UruguayRound, South Africa will be replacing its dairy import quotas by tariffs.
221. In 1993, total milk production increased by less than 1 per cent to 1.94 million tons. Domesticconsumption of milk during the year was 958,000 tons, a decrease of 4½h per cent from the previousyear, reflecting lower consumption of fresh milk and milk used for industrial processes.
222. Skimmed milk powder production in 1993 decreased by almost 15 per cent to 16,300 tons.Consumption in 1993 decreased by 23 per cent in line with the long-tenu trend. Whole milk powderproduction increased by 19 per cent to a level of 15,600 tons. Consumption also increased, by25 per cent, to 14,000 tons. Butter production decreased by 14 per cent to 14,000 tons in 1993.Consumption of butter remained unchanged vis-à-vis 1992 and 1991. This resulted in a fall of butterstocks by as much as 76 per cent compared to the level at the beginning of the year. No butter wasimported but 3,700 tons of butter were exported in 1993. Production and consumption of cheese in1993 were 35,600 and 33,600 tons, respectively. This represented an increase of4 per cent in productionand a decrease ofabout4 per cent in consumption during 1993 as compared to 1992. Inthe first quarterof 1994, production ofskimmed milk powder decreasedby 8 per cent to 5,000 tons. However, domesticconsumption increased by as much as 40 per cent to 3,500 tons. Whole milk powder productiondecreased by 33 per cent to 3,000 tons. Domestic consumption increased by 3 per cent to 3,800 tons.Butter production remained stable at 4,300 tons. Domestic consumption decreased by 7 per cent to3,600 tons. Exports decreased from 1,100 tons in the first quarter of 1993 to 400 tons in the firstquarter of 1994. Production and consumption of cheese were both 7,900 tons. This represented adecrease of 6 per cent in production and of 8 per cent in consumption during the first quarter of 1994compared to the first quarter of 1993.
EGYPT*
223. Efforts are being made in Egypt to develop and increase milk production. The target for milkproduction in the year 2000 is 4 million tons, and the aim is to achieve full self-sufficiency in liquidmilk and fresh milk products. These objectives are being pursued through increased production offeed, genetic improvement and advances in cattle health and fertility. In addition, attempts are being

DPC/W/140Page 66
made to establish an efficient processing, storage and marketing system. More than half of the milkproduced in Egypt is buffalo milk. Total production of milk recovered to 2.28 million tons in 1993,2 per cent up from the previous year. In 1993, the growth in demand was greater and imports increased.A mere 4,000 tons of butter was manufactured in Egypt in 1991 and 1992 due to poor climaticconditions. Consequently, Egypt imported 44,100 tons of butter and butter où in 1992, up 16,300 tonson 1991. Imports in 1993 are estimated at 45,000 tons of butter and butter oil. Imports of skimmedmilkpowder totalled 25,300 tons in 1992. up4,800 tons on 1991. They declined in 1993 but are forecastto regain their 1992 level of 25,000 tons in 1994. However, imports of cheese in 1992, at 22,000 tons,were 5,600 tons lower than in 1991. Domestic production of cheese totalled 317,000 tons in 1992and 325,000 tons in 1993. Per capita consumption of cheese is around 6-7 kgs. per head. Egypt wasthe third largest beneficiary of the DEIP in 1993. United States sales to Egypt under DEIP totalled9,000 tons, 5,500 tons of which were skimmed milk powder.
ISRAEL
224. Milkproduction in Israel increased by 'h per cent to 1.02 million tons in 1993. Average milkyields in Israel, at 9,300 kgs. per cow in 1993, are the highest in the world.
ALGERIA
225. Algeria continues to be an important import market for dairyproducts, and in particular formilk powders and butter. In 1992, Algeria imported an estimated 220,000 tons of milk powders,and 43,000 tons of butter, despite internal economic difficulties. Algeria was the most importantdestination for United States dairy exports under the DEIP in 1992 and 1993. In 1993, United Statessales under DEIP reached 77,000 tons (see Table 22). Imports of butter in 1993 are estimated at43,000 tons. Algeria, already considered one of the largest dairy importers in the world, is expectedto continue to increase its demand for imported dairy products as domestic cow milk production continuesto be hampered by low productivity due to poor feed, lack of inputs and technical knowledge, as wellas the general instability in the agricultural sector. Inaddition, the Algerian Government has designatedmilk as a principal source of protein for Algerians, it is classified as an essential commodity and itsconsumer price remains heavily subsidized. The Algerian population is increasing at a rate of2.5-2.7 per cent annually and 65 per cent of the population is less than twenty-five years old. TheGovernment of Algeria is attempting to adopt a strategy to substitute some of the 100,000 tons ofimported whole milk powder, with reconstituted milk made from imports of skimmed milk powderand butter oil. In 1993, it is estimated that 24,000 tons of butter oil and 150,000 tons of skimmedmilk powder were imported and 1.44 million tons of reconstituted milk were produced, supplying around65 per cent of Algeria's needs. The balance was provided by whole milk powder. Imports ofskimmedmilk powder may increase in the future. Furthermore, the Goveninent of Algeria has lifted the importban on cheese that was imposed in October 1992 in an effort to conserve foreign exchange. However,the current political situation in the country may result in restricted trade opportunities in 1994.

DPC/W/140Page 67
TABLE 22
Dairy Exports to Algeria in 1993 by Main Suppliers (in metric tons)
INDIA
226. India is the largest producer among the developing countries and has been pursuing an activeprogramme of development of its dairy industry. About 50 per cent of milk produced in India isbuffalo milk. Cow and buffalo milk production expanded by a further 4 per cent in 1993 to60.9 million tons, of which 30.5 million tons were cow milk. This is the result of increasing yields,stemming from genetic improvements and improved pastureand fodder supplies. Production is expectedto be further stimulated by higher milk prices following the increased involvement of private firmsin dairy processing, stemming from the easing ofgovernment regulations regarding access to the sector.Total milk output is projected to reach 63 million tons in 1994 and 66 million tons in 1995. Annualper capita consumption is forecast to increase from its present level of 58 kgs. to about 68 kgs. bythat time.
227. Skimmed milk powder output in India decreased by 10 per cent in 1991 to 65,000 tons andremained unchanged in 1992. However, in 1993 output recovered to 75,000 tons and is forecast toremain stable in 1994.
CHINA
228. Dairy production in China continued to expand by an estimated 7 per cent in 1992, toapproximately 7.5 million tons. Government policies encourage further expansion but milk productionstagnated in 1993, after a number of years of strong growth, reflecting profitability being squeezedby rising input costs, especially for feed, while farmgate prices were static. However, as the size ofChina's dairy herd has not declined, a resumption of growth, albeit at a slower rate than formerly,is anticipated.
Period SMP WMP Butter Butter oil
US Dairy Export Incentive Sales in CY 1993 60,000 - 3,000 12,000Program __-,
European Communities Jan.-Nov. 1993 34,500 71,200 1,200 8,500exports
New Zealand Sales in CY 1993 2,000 39,300 - 4,000

DPC/W/140Page 68
KOREA
229. Inthe RepublicofKorea, milkproduction increased steadily until 1990, when itdeclinedslightlyto 1.74 million tons. The stagnation in production is apparently due to the limited pasture availableand to the high costs of milk production in Korea. The milk industry of Korea is characterized bya low level of processing - about 70 per cent of total milk production is consumed in its liquid formn.Total milk consumption in 1991 reached 1.9 million tons, asthegovernment relaxed import restrictionsand foreign products were permitted to meet rising demand. Per capita consumption of milk productshas trebled over the past ten years to 45 kgs. of milk equivalent in 1991. Per capita consumption isexpected to continue to expand to 70-0 kgs. by the year 2000. The production is expected to increaseby 7 per cent to reach 2 million tons in 1994.
230. The Republic ofKorea announced that imports of 1 1,000 tons ofmilk powder will be authorizedin 1994. In early 1993, this same quantity was approved, however actual imports throughNovember 1993 had reached 16,300 tons.