Embed Size (px)
Citation preview

ARTICLE OPEN
Gene expression signatures of human cell and tissue longevityInge Seim1,2, Siming Ma1 and Vadim N Gladyshev1
Different cell types within the body exhibit substantial variation in the average time they live, ranging from days to the lifetime ofthe organism. The underlying mechanisms governing the diverse lifespan of different cell types are not well understood. Toexamine gene expression strategies that support the lifespan of different cell types within the human body, we obtained publiclyavailable RNA-seq data sets and interrogated transcriptomes of 21 somatic cell types and tissues with reported cellular turnover, abona fide estimate of lifespan, ranging from 2 days (monocytes) to a lifetime (neurons). Exceptionally long-lived neurons presenteda gene expression profile of reduced protein metabolism, consistent with neuronal survival and similar to expression patternsinduced by longevity interventions such as dietary restriction. Across different cell lineages, we identified a gene expressionsignature of human cell and tissue turnover. In particular, turnover showed a negative correlation with the energetically costly cellcycle and factors supporting genome stability, concomitant risk factors for aging-associated pathologies. In addition, the expressionof p53 was negatively correlated with cellular turnover, suggesting that low p53 activity supports the longevity of post-mitotic cellswith inherently low risk of developing cancer. Our results demonstrate the utility of comparative approaches in unveiling geneexpression differences among cell lineages with diverse cell turnover within the same organism, providing insights intomechanisms that could regulate cell longevity.
npj Aging and Mechanisms of Disease (2016) 2, 16014; doi:10.1038/npjamd.2016.14; published online 7 July 2016
INTRODUCTIONNature can achieve exceptional organismal longevity, 4100 yearsin the case of humans. However, there is substantial variationin ‘cellular lifespan’, which can be conceptualized as the turnoverof individual cell lineages within an individual organism.1 Turnoveris defined as a balance between cell proliferation and death thatcontributes to cell and tissue homeostasis.2 For example, theintegrity of the heart and brain is largely maintained by cells withlow turnover/long lifespan, while other organs and tissues, such asthe outer layers of the skin and blood cells, rely on high cellturnover/short lifespan.3–5 Variation in cellular lifespan is alsoevident across lineages derived from the same germ layers formedduring embryogenesis. For example, the ectoderm gives rise toboth long-lived neurons4,6,7 and short-lived epidermal skin cells.8
Similarly, the mesoderm gives rise to long-lived skeletal muscle4
and heart muscle9 and short-lived monocytes,10,11 while theendoderm is the origin of long-lived thyrocytes (cells of thethyroid gland)12 and short-lived urinary bladder cells.13
How such diverse cell lineage lifespans are supported within asingle organism is not clear, but it appears that differentiationshapes lineages through epigenetic changes to establishbiological strategies that give rise to lifespans that support thebest fitness for cells in their respective niche. As fitness is subjectto trade-offs, different cell types will adjust their gene regulatorynetworks according to their lifespan. We are interested in geneexpression signatures that support diverse biological strategies toachieve longevity. Prior work on species longevity can helpinform strategies for tackling this research question. Specieslongevity is a product of evolution and is largely shaped bygenetic and environmental factors.14 Comparative transcriptome
studies of long-lived and short-lived mammals, and analyses thatexamined the longevity trait across a large group of mammals(tissue-by-tissue surveys, focusing on brain, liver and kidney),have revealed candidate longevity-associated processes.15,16 Theyprovide gene expression signatures of longevity across mammalsand may inform on interventions that mimic these changes,thereby potentially extending lifespan. It then follows that, inprinciple, comparative analyses of different cell types and tissuesof a single organism may similarly reveal lifespan-promotinggenes and pathways. Such analyses across cell types would beconceptually similar, yet orthogonal, to the analysis across species.Publicly available transcriptome data sets (for example, RNA-seq)generated by consortia, such as the Human Protein Atlas (HPA),17
Encyclopedia of DNA Elements (ENCODE),18 Functional AnnotationOf Mammalian genome (FANTOM)19 and the Genotype-TissueExpression (GTEx) project,20 are now available. They offer anopportunity to understand how gene expression programsare related to cellular turnover, as a proxy for cellular lifespan.Here we examined transcriptomes of 21 somatic cells and tissuesto assess the utility of comparative gene expression methods forthe identification of longevity-associated gene signatures.
RESULTSWe interrogated publicly available transcriptomes (paired-endRNA-seq reads) of 21 human cell types and tissues, comprising 153individual samples, with a mean age of 56 years (Table 1; details inSupplementary Table S1). Their turnover rates (an estimate ofcell lifespan4) varied from 2 (monocytes) to 32,850 (neurons)days, with all three germ layers giving rise to both short-lived and
1Division of Genetics, Department of Medicine, Brigham and Women’s Hospital and Harvard Medical School, Boston, MA, USA.Correspondence: VN Gladyshev ([email protected])2Current address: Comparative and Endocrine Biology Laboratory, Translational Research Institute – Institute of Health and Biomedical Innovation, Queensland University ofTechnology, Woolloongabba, QLD 4102, Australia.Received 21 August 2015; revised 8 March 2016; accepted 30 March 2016
www.nature.com/npjamdAll rights reserved 2056-3973/16
© 2016 Japanese Society of Anti-Aging Medicine/Macmillan Publishers Limited
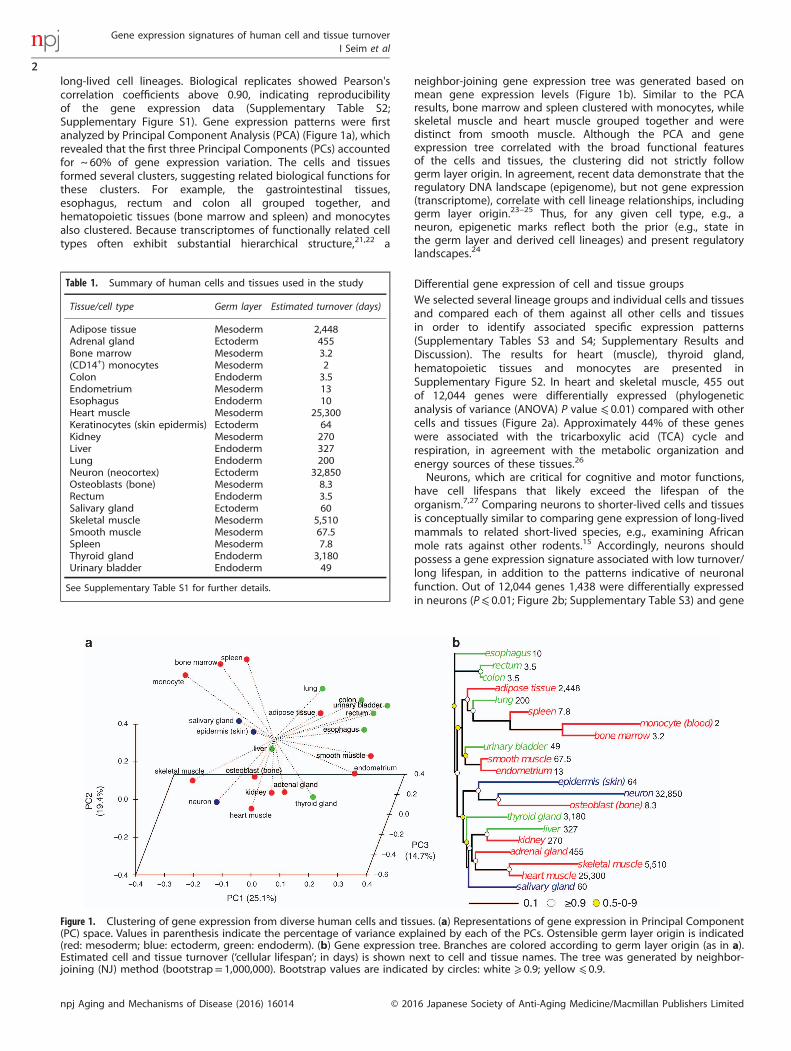
long-lived cell lineages. Biological replicates showed Pearson'scorrelation coefficients above 0.90, indicating reproducibilityof the gene expression data (Supplementary Table S2;Supplementary Figure S1). Gene expression patterns were firstanalyzed by Principal Component Analysis (PCA) (Figure 1a), whichrevealed that the first three Principal Components (PCs) accountedfor ~ 60% of gene expression variation. The cells and tissuesformed several clusters, suggesting related biological functions forthese clusters. For example, the gastrointestinal tissues,esophagus, rectum and colon all grouped together, andhematopoietic tissues (bone marrow and spleen) and monocytesalso clustered. Because transcriptomes of functionally related celltypes often exhibit substantial hierarchical structure,21,22 a
neighbor-joining gene expression tree was generated based onmean gene expression levels (Figure 1b). Similar to the PCAresults, bone marrow and spleen clustered with monocytes, whileskeletal muscle and heart muscle grouped together and weredistinct from smooth muscle. Although the PCA and geneexpression tree correlated with the broad functional featuresof the cells and tissues, the clustering did not strictly followgerm layer origin. In agreement, recent data demonstrate that theregulatory DNA landscape (epigenome), but not gene expression(transcriptome), correlate with cell lineage relationships, includinggerm layer origin.23–25 Thus, for any given cell type, e.g., aneuron, epigenetic marks reflect both the prior (e.g., state inthe germ layer and derived cell lineages) and present regulatorylandscapes.24
Differential gene expression of cell and tissue groupsWe selected several lineage groups and individual cells and tissuesand compared each of them against all other cells and tissuesin order to identify associated specific expression patterns(Supplementary Tables S3 and S4; Supplementary Results andDiscussion). The results for heart (muscle), thyroid gland,hematopoietic tissues and monocytes are presented inSupplementary Figure S2. In heart and skeletal muscle, 455 outof 12,044 genes were differentially expressed (phylogeneticanalysis of variance (ANOVA) P value ⩽ 0.01) compared with othercells and tissues (Figure 2a). Approximately 44% of these geneswere associated with the tricarboxylic acid (TCA) cycle andrespiration, in agreement with the metabolic organization andenergy sources of these tissues.26
Neurons, which are critical for cognitive and motor functions,have cell lifespans that likely exceed the lifespan of theorganism.7,27 Comparing neurons to shorter-lived cells and tissuesis conceptually similar to comparing gene expression of long-livedmammals to related short-lived species, e.g., examining Africanmole rats against other rodents.15 Accordingly, neurons shouldpossess a gene expression signature associated with low turnover/long lifespan, in addition to the patterns indicative of neuronalfunction. Out of 12,044 genes 1,438 were differentially expressedin neurons (P⩽ 0.01; Figure 2b; Supplementary Table S3) and gene
Table 1. Summary of human cells and tissues used in the study
Tissue/cell type Germ layer Estimated turnover (days)
Adipose tissue Mesoderm 2,448Adrenal gland Ectoderm 455Bone marrow Mesoderm 3.2(CD14+) monocytes Mesoderm 2Colon Endoderm 3.5Endometrium Mesoderm 13Esophagus Endoderm 10Heart muscle Mesoderm 25,300Keratinocytes (skin epidermis) Ectoderm 64Kidney Mesoderm 270Liver Endoderm 327Lung Endoderm 200Neuron (neocortex) Ectoderm 32,850Osteoblasts (bone) Mesoderm 8.3Rectum Endoderm 3.5Salivary gland Ectoderm 60Skeletal muscle Mesoderm 5,510Smooth muscle Mesoderm 67.5Spleen Mesoderm 7.8Thyroid gland Endoderm 3,180Urinary bladder Endoderm 49
See Supplementary Table S1 for further details.
Figure 1. Clustering of gene expression from diverse human cells and tissues. (a) Representations of gene expression in Principal Component(PC) space. Values in parenthesis indicate the percentage of variance explained by each of the PCs. Ostensible germ layer origin is indicated(red: mesoderm; blue: ectoderm, green: endoderm). (b) Gene expression tree. Branches are colored according to germ layer origin (as in a).Estimated cell and tissue turnover (‘cellular lifespan’; in days) is shown next to cell and tissue names. The tree was generated by neighbor-joining (NJ) method (bootstrap= 1,000,000). Bootstrap values are indicated by circles: white ⩾ 0.9; yellow ⩽ 0.9.
Gene expression signatures of human cell and tissue turnoverI Seim et al
2
npj Aging and Mechanisms of Disease (2016) 16014 © 2016 Japanese Society of Anti-Aging Medicine/Macmillan Publishers Limited
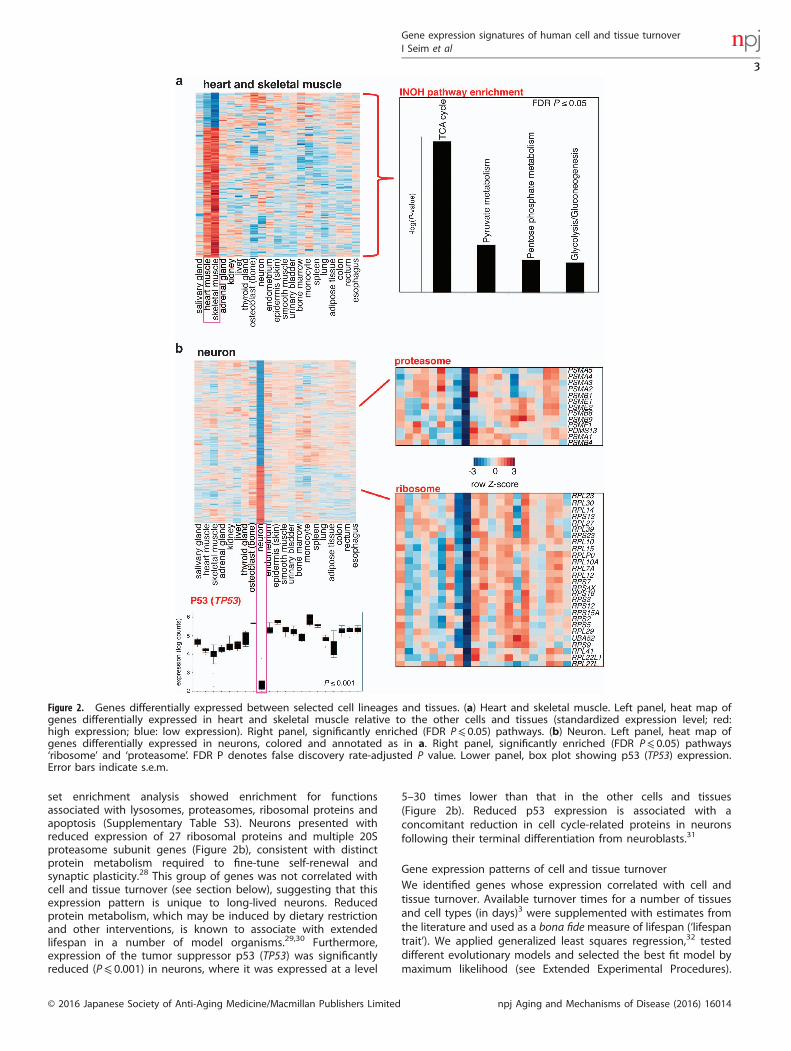
set enrichment analysis showed enrichment for functionsassociated with lysosomes, proteasomes, ribosomal proteins andapoptosis (Supplementary Table S3). Neurons presented withreduced expression of 27 ribosomal proteins and multiple 20Sproteasome subunit genes (Figure 2b), consistent with distinctprotein metabolism required to fine-tune self-renewal andsynaptic plasticity.28 This group of genes was not correlated withcell and tissue turnover (see section below), suggesting that thisexpression pattern is unique to long-lived neurons. Reducedprotein metabolism, which may be induced by dietary restrictionand other interventions, is known to associate with extendedlifespan in a number of model organisms.29,30 Furthermore,expression of the tumor suppressor p53 (TP53) was significantlyreduced (P⩽ 0.001) in neurons, where it was expressed at a level
5–30 times lower than that in the other cells and tissues(Figure 2b). Reduced p53 expression is associated with aconcomitant reduction in cell cycle-related proteins in neuronsfollowing their terminal differentiation from neuroblasts.31
Gene expression patterns of cell and tissue turnoverWe identified genes whose expression correlated with cell andtissue turnover. Available turnover times for a number of tissuesand cell types (in days)3 were supplemented with estimates fromthe literature and used as a bona fidemeasure of lifespan (‘lifespantrait’). We applied generalized least squares regression,32 testeddifferent evolutionary models and selected the best fit model bymaximum likelihood (see Extended Experimental Procedures).
Figure 2. Genes differentially expressed between selected cell lineages and tissues. (a) Heart and skeletal muscle. Left panel, heat map ofgenes differentially expressed in heart and skeletal muscle relative to the other cells and tissues (standardized expression level; red:high expression; blue: low expression). Right panel, significantly enriched (FDR P⩽ 0.05) pathways. (b) Neuron. Left panel, heat map ofgenes differentially expressed in neurons, colored and annotated as in a. Right panel, significantly enriched (FDR P⩽ 0.05) pathways‘ribosome’ and ‘proteasome’. FDR P denotes false discovery rate-adjusted P value. Lower panel, box plot showing p53 (TP53) expression.Error bars indicate s.e.m.
Gene expression signatures of human cell and tissue turnoverI Seim et al
3
© 2016 Japanese Society of Anti-Aging Medicine/Macmillan Publishers Limited npj Aging and Mechanisms of Disease (2016) 16014
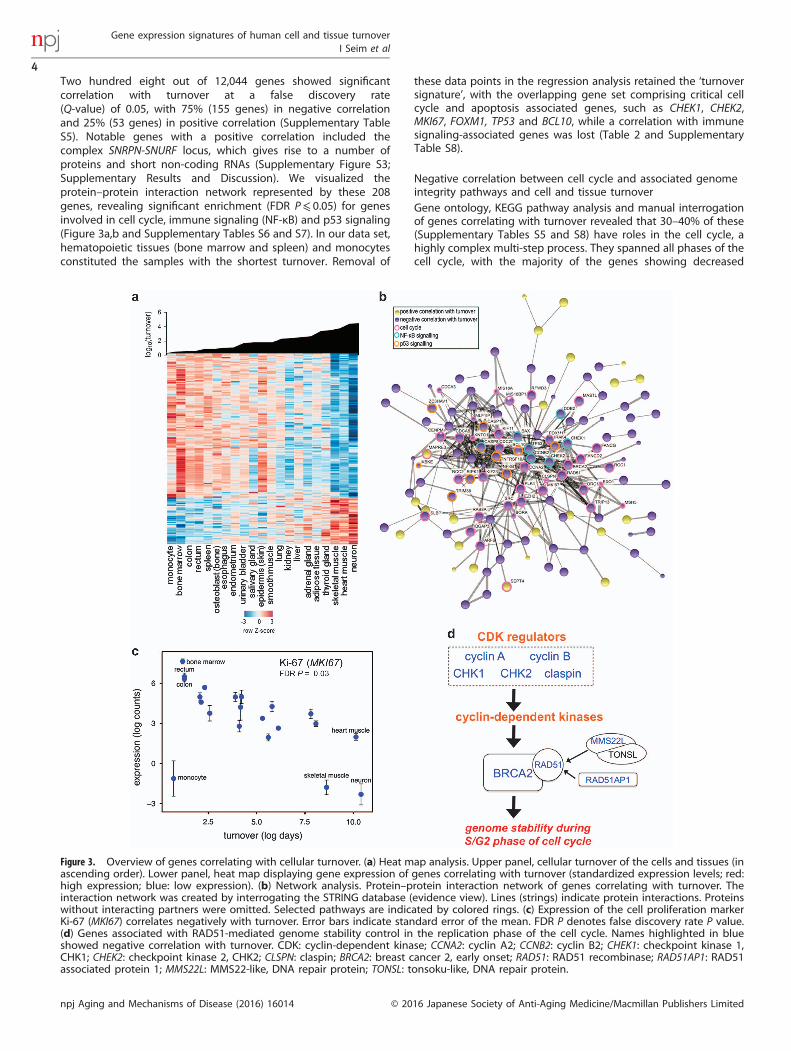
Two hundred eight out of 12,044 genes showed significantcorrelation with turnover at a false discovery rate(Q-value) of 0.05, with 75% (155 genes) in negative correlationand 25% (53 genes) in positive correlation (Supplementary TableS5). Notable genes with a positive correlation included thecomplex SNRPN-SNURF locus, which gives rise to a number ofproteins and short non-coding RNAs (Supplementary Figure S3;Supplementary Results and Discussion). We visualized theprotein–protein interaction network represented by these 208genes, revealing significant enrichment (FDR P⩽ 0.05) for genesinvolved in cell cycle, immune signaling (NF-κB) and p53 signaling(Figure 3a,b and Supplementary Tables S6 and S7). In our data set,hematopoietic tissues (bone marrow and spleen) and monocytesconstituted the samples with the shortest turnover. Removal of
these data points in the regression analysis retained the ‘turnoversignature’, with the overlapping gene set comprising critical cellcycle and apoptosis associated genes, such as CHEK1, CHEK2,MKI67, FOXM1, TP53 and BCL10, while a correlation with immunesignaling-associated genes was lost (Table 2 and SupplementaryTable S8).
Negative correlation between cell cycle and associated genomeintegrity pathways and cell and tissue turnoverGene ontology, KEGG pathway analysis and manual interrogationof genes correlating with turnover revealed that 30–40% of these(Supplementary Tables S5 and S8) have roles in the cell cycle, ahighly complex multi-step process. They spanned all phases of thecell cycle, with the majority of the genes showing decreased
Figure 3. Overview of genes correlating with cellular turnover. (a) Heat map analysis. Upper panel, cellular turnover of the cells and tissues (inascending order). Lower panel, heat map displaying gene expression of genes correlating with turnover (standardized expression levels; red:high expression; blue: low expression). (b) Network analysis. Protein–protein interaction network of genes correlating with turnover. Theinteraction network was created by interrogating the STRING database (evidence view). Lines (strings) indicate protein interactions. Proteinswithout interacting partners were omitted. Selected pathways are indicated by colored rings. (c) Expression of the cell proliferation markerKi-67 (MKI67) correlates negatively with turnover. Error bars indicate standard error of the mean. FDR P denotes false discovery rate P value.(d) Genes associated with RAD51-mediated genome stability control in the replication phase of the cell cycle. Names highlighted in blueshowed negative correlation with turnover. CDK: cyclin-dependent kinase; CCNA2: cyclin A2; CCNB2: cyclin B2; CHEK1: checkpoint kinase 1,CHK1; CHEK2: checkpoint kinase 2, CHK2; CLSPN: claspin; BRCA2: breast cancer 2, early onset; RAD51: RAD51 recombinase; RAD51AP1: RAD51associated protein 1; MMS22L: MMS22-like, DNA repair protein; TONSL: tonsoku-like, DNA repair protein.
Gene expression signatures of human cell and tissue turnoverI Seim et al
4
npj Aging and Mechanisms of Disease (2016) 16014 © 2016 Japanese Society of Anti-Aging Medicine/Macmillan Publishers Limited

expression associated with increased turnover. As expected, theclassic DNA replication marker, Ki-67 (MKI67), which is onlyexpressed during the cell cycle,33 was present at high levels inrapidly proliferating tissues such as bone marrow, rectum andcolon. It was expressed at very low levels in monocytes (themajority of which do not proliferate) and in post-mitotic skeletalmuscle and neurons (most of which are incapable of cell division;Figure 3c). Ki-67 was expressed at a moderate level in heartmuscle, which can proliferate at a limited rate,9 and where Ki-67may promote postnatal cardiac remodeling.34
A negative correlation between the cell cycle machinery andcell and tissue turnover is not surprising, as proliferativehomeostasis, a balance between cell growth and death, isessential for normal turnover (as occurs in epidermal cells, forexample). In contrast, terminally differentiated cells comprisingheart muscle, skeletal muscle and neurons, have permanently orlargely exited the cell cycle. They are, therefore, expected toexpress low levels of genes related to cell cycle checkpoints andthe maintenance of replication fidelity. We noted that a number ofgenes essential for genome stability during the premitotic phase
(G2), a process tightly linked to tumor development,35 werenegatively correlated with turnover (Figure 3d). This includedregulators of cyclin-dependent kinases, such as cyclin A (CCNA2)and B (CCN2B), checkpoint kinase 1 (CHEK1) and its regulatorclaspin (CLSPN), and CHEK2, which together with breast cancer 2early onset (BRCA2), RAD51 recombinase (RAD51), its enhancerRAD51AP1 (RAD51AP1), and MMS22-like DNA repair protein(MMS22L) promote genome stability.35 These data supportrecent work showing that RAD51 and BRCA2 are major facilitatorsof genome integrity in proliferating cells.35–37 Genes in thep53 pathway can halt progression of the cell cycle (inducesenescence), or inhibit apoptosis in proliferating cells, andblocking apoptosis is crucial for the survival of differentiatedpost-mitotic cells.38 In agreement with a reduction in theinvolvement of cell cycle in longer-lived cells and tissues, multiplep53 pathway associated genes, including p53 itself (TP53), werenegatively correlated with turnover (Supplementary Figure S4;Supplementary Tables S5 and S8). They encompassed severalcheckpoint kinases (CHEK1 and CHEK2), BCL2-associated X protein
Table 2. Overlap of genes correlating with turnover before and after removal of immune system-associated cells and tissues (monocytes, bonemarrow and spleen)
Gene Description Correlation with cellturnover
Function(s)
BCL10 B-cell CLL/lymphoma 10 Negative ApoptosisBRCA2 Breast cancer 2, early onset Negative Cell cycleCCDC92 Coiled-coil domain containing 92/limkain
beta-2Positive —
CCNB2 Cyclin B2 Negative Cell cycleCDC42 Cell division cycle 42 Negative Cell cycleCDCA3 Cell division cycle associated 3 Negative Cell cycleCDCA8 Cell division cycle associated 8 Negative Cell cycleCENPW Centromere protein W Negative Cell cycleCHEK1 Checkpoint kinase 1 Negative Cell cycleCHEK2 Checkpoint kinase 2 Negative Cell cycleCRELD1 Cysteine-rich with EGF-like domains 1 Positive Putative cell adhesion moleculeCRY2 Cryptochrome circadian clock 2 Positive Core circadian clock geneDDB2 Damage-specific DNA binding protein 2,
48 kDaNegative DNA repair
EXO1 Exonuclease 1 Negative DNA repairFANCD2 Fanconi anemia, complementation group D2 Negative Cell cycleFOXM1 Forkhead box M1 Negative Cell cycleHEY1 Hes-related family bHLH transcription factor
with YRPW motif 1Positive Transcription factor
HNRNPF Heterogeneous nuclear ribonucleoprotein F Negative mRNA stability and transportKIF11 Kinesin family member 11 Negative Cell cycleKIF23 Kinesin family member 23 Negative Cell cycleMKI67 Marker of proliferation Ki-67 Negative Cell cycleMSH5 mutS homolog 5 Negative DNA repairNADSYN1 NAD synthetase 1 Negative Redox reaction coenzyme, precursor for cell signaling molecules,
and substrate for protein post-translational modificationsNCAPG Non-SMC condensin I complex, subunit G Negative Cell cycleNCAPH Non-SMC condensin I complex, subunit H Negative Cell cycleNUF2 NUF2, NDC80 kinetochore complex
componentNegative Cell cycle
ORC1 Origin recognition complex, subunit 1 Negative Cell cyclePARPBP PARP1 binding protein Negative Cell cyclePLK4 Polo-like kinase 4 Negative Cell cycleRCC1 Regulator of chromosome condensation 1 Negative Cell cycleSAMD9 Sterile alpha motif domain containing 9 Negative ApoptosisSNRPN Small nuclear ribonucleoprotein polypeptide
NPositive Complex SNURF-SNRPN locus: mRNA processing, short non-
coding RNA precursorSTK26 Serine/threonine protein kinase 26 Negative ApoptosisSTK38 Serine/threonine kinase 38 Negative Cell cycle and apoptosisTP53 Tumor protein p53 Negative ApoptosisZWINT ZW10 interacting kinetochore protein Negative Cell cycle
Abbreviation: mRNA, messenger RNA.
Gene expression signatures of human cell and tissue turnoverI Seim et al
5
© 2016 Japanese Society of Anti-Aging Medicine/Macmillan Publishers Limited npj Aging and Mechanisms of Disease (2016) 16014
(BAX), which activates apoptosis, and ASC/TMS1 (PYCARD), whichwhen downregulated inhibits BAX translocation to mitochondria.To further investigate the connection between gene expression
and turnover, we turned to the library of integrated network-based cellular signatures (LINCS) to identify perturbations (geneoverexpression and knockdown) that produce a similar overallgene expression profile to our regression analysis. We found thatthe most similar profiles came from genes associated with cellcycle control and associated DNA repair (Supplementary TableS11). This included overexpression of the major cell cycleinhibitors p18 (also known as INK4C; CDKN2C), p21 (CDKN1A)and p27 (CDKN1B), in agreement with the negative correlationbetween downstream genes and turnover in our data set.
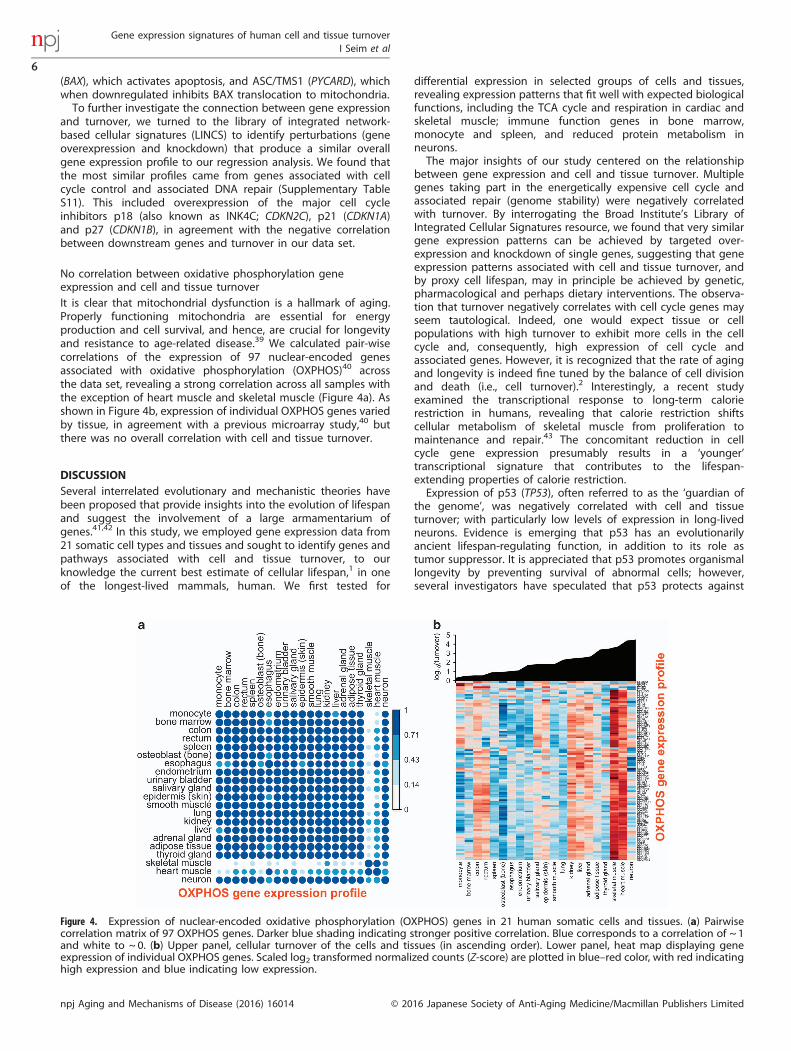
No correlation between oxidative phosphorylation geneexpression and cell and tissue turnoverIt is clear that mitochondrial dysfunction is a hallmark of aging.Properly functioning mitochondria are essential for energyproduction and cell survival, and hence, are crucial for longevityand resistance to age-related disease.39 We calculated pair-wisecorrelations of the expression of 97 nuclear-encoded genesassociated with oxidative phosphorylation (OXPHOS)40 acrossthe data set, revealing a strong correlation across all samples withthe exception of heart muscle and skeletal muscle (Figure 4a). Asshown in Figure 4b, expression of individual OXPHOS genes variedby tissue, in agreement with a previous microarray study,40 butthere was no overall correlation with cell and tissue turnover.
DISCUSSIONSeveral interrelated evolutionary and mechanistic theories havebeen proposed that provide insights into the evolution of lifespanand suggest the involvement of a large armamentarium ofgenes.41,42 In this study, we employed gene expression data from21 somatic cell types and tissues and sought to identify genes andpathways associated with cell and tissue turnover, to ourknowledge the current best estimate of cellular lifespan,1 in oneof the longest-lived mammals, human. We first tested for
differential expression in selected groups of cells and tissues,revealing expression patterns that fit well with expected biologicalfunctions, including the TCA cycle and respiration in cardiac andskeletal muscle; immune function genes in bone marrow,monocyte and spleen, and reduced protein metabolism inneurons.The major insights of our study centered on the relationship
between gene expression and cell and tissue turnover. Multiplegenes taking part in the energetically expensive cell cycle andassociated repair (genome stability) were negatively correlatedwith turnover. By interrogating the Broad Institute’s Library ofIntegrated Cellular Signatures resource, we found that very similargene expression patterns can be achieved by targeted over-expression and knockdown of single genes, suggesting that geneexpression patterns associated with cell and tissue turnover, andby proxy cell lifespan, may in principle be achieved by genetic,pharmacological and perhaps dietary interventions. The observa-tion that turnover negatively correlates with cell cycle genes mayseem tautological. Indeed, one would expect tissue or cellpopulations with high turnover to exhibit more cells in the cellcycle and, consequently, high expression of cell cycle andassociated genes. However, it is recognized that the rate of agingand longevity is indeed fine tuned by the balance of cell divisionand death (i.e., cell turnover).2 Interestingly, a recent studyexamined the transcriptional response to long-term calorierestriction in humans, revealing that calorie restriction shiftscellular metabolism of skeletal muscle from proliferation tomaintenance and repair.43 The concomitant reduction in cellcycle gene expression presumably results in a ‘younger’transcriptional signature that contributes to the lifespan-extending properties of calorie restriction.Expression of p53 (TP53), often referred to as the ‘guardian of
the genome’, was negatively correlated with cell and tissueturnover; with particularly low levels of expression in long-livedneurons. Evidence is emerging that p53 has an evolutionarilyancient lifespan-regulating function, in addition to its role astumor suppressor. It is appreciated that p53 promotes organismallongevity by preventing survival of abnormal cells; however,several investigators have speculated that p53 protects against
Figure 4. Expression of nuclear-encoded oxidative phosphorylation (OXPHOS) genes in 21 human somatic cells and tissues. (a) Pairwisecorrelation matrix of 97 OXPHOS genes. Darker blue shading indicating stronger positive correlation. Blue corresponds to a correlation of ~ 1and white to ~ 0. (b) Upper panel, cellular turnover of the cells and tissues (in ascending order). Lower panel, heat map displaying geneexpression of individual OXPHOS genes. Scaled log2 transformed normalized counts (Z-score) are plotted in blue–red color, with red indicatinghigh expression and blue indicating low expression.
Gene expression signatures of human cell and tissue turnoverI Seim et al
6
npj Aging and Mechanisms of Disease (2016) 16014 © 2016 Japanese Society of Anti-Aging Medicine/Macmillan Publishers Limited
cancer in proliferating cells at the cost of accelerated aging.3,44,45
Thus, in non-dividing cells p53 may, in effect, reduce lifespan. Itwas found that suppression of TP53 orthologs in animal modelssuch as the mouse and fruit fly can extend organismal lifespan(reviewed in ref. 46). Dominant-negative Drosophila p53 (Dmp53)significantly extends organismal lifespan when expressed inadult neurons, but not other tissues (such as muscle) via insulin/insulin-like signaling (IIS) and TOR (target of rapamycin)pathways.47,48 Several p53 (TP53) retrogenes have been recentlyreported in the elephant genome,49 however, while elephantlymphocytes and fibroblasts show an increased response to DNAdamage compared with human cells,49 it is currently not knownhow many of these retrogenes are actively translated and exhibitp53 function, nor whether the expression of p53 is appropriatelyactivated and/or elevated in all elephant cells. Thus, the elephant’sresistance to cancer may stem from other mechanisms and itwould be of interest to examine the expression of TP53in elephant neurons and other cell types. Interestingly, thecancer-resistant long-lived blind mole rat, Spalax, has evolved anenhanced necrotic and reduced apoptotic defense (via adominant negative form of p53) against cancer, possibly to adaptto an oxygen-poor underground environment, which wouldnormally result in extensive p53-mediated cell death.50,51 WhetherSpalax p53 contributes to the longevity of this cancer-resistantrodent is not known, but is an exciting possibility under thehypothesis that reduced p53 activity exerts beneficial effects oncellular lifespan if tumor formation is avoided. Taken together, wespeculate that very low levels of endogenous p53 contribute tothe exceptional lifespan of cells and tissues with low turnover,such as neuron, heart muscle and skeletal muscle, and perhapsalso organismal longevity.It is now appreciated that expression of OXPHOS genes
decreases with age in diverse cells and tissues in species rangingfrom nematode to human.39 However, the link betweenmitochondrial homeostasis and lifespan is currently enigmatic.39
Interestingly, lifespans of different strains of the single-celled yeastis associated with upregulation of OXPHOS genes.52 In our dataset of 21 human cells and tissues, expression of individualOXPHOS genes, and more generally metabolic genes, did notcorrelate with cell turnover. Thus, we propose that while cellsand tissues share a gene expression signature manifested asreduced mitochondrial function with age, the overall integrity ofmitochondria in long-lived human cell types is achieved bydistinct gene expression strategies.Our study has several limitations. Future studies should attempt
to more accurately determine the turnover of cells andcell populations (tissues) in the body, and sequence thetranscriptomes of additional long-lived post-mitotic cells, such asosteocytes.53 Single-cell RNA sequencing is rapidly evolving54 andwould greatly advance the study of cell turnover, especially as itwould avoid the analysis of organs that are composed ofheterogeneous cell types. Multiple cells and tissues from thesame individual are also becoming available.55 Finally, thecontribution of epigenetics56,57 and long-lived proteins58,59 to celland tissue turnover is largely unknown but likely important.Owing to a lack of a matching set of samples and limited numberof biological replicates, we did not interrogate other species, suchas the mouse, for turnover-associated genes. It is currentlyunknown whether individual genes identified through ourprocedure would overlap among species,60 but is an importantquestion for future studies. Although some common features maybe observed, human cell types may also harbor signatures quitedistinct from other animals, including other primates, sincehumans are one of the most exceptionally long-lived species.61
Overall, our analysis, employing cellular turnover, as a proxy oflifespan, is a first step to a molecular understanding of celland tissue longevity. We reveal a gene signature of exceptionallylong-lived post-mitotic neurons, and genes and pathways that
correlate with turnover across 21 somatic cells and tissues.The data suggest that human cell lineages utilize both commonand lineage-specific strategies to alter their lifespan. This newperspective should provide further impetus to the study of thelifespan trait (longevity) and the aging process.
MATERIALS AND METHODSSee Supplementary Information for detailed methods.
Biological samplesOur analysis was restricted to 21 adult somatic cells and tissues with morethan three biological replicates and bona fide lifespan estimates(cell turnover in days) derived from a recent comprehensive review3 andthe additional data collected through primary literature searches(see Supplementary Experimental Procedures).
Transcriptome data relationship inferenceThe relationship of publicly available transcriptomes (RNA-seq data) fromthe 21 cells and tissues was investigated by principal component analysisand a gene expression tree (see Supplementary Experimental Procedures).
Identification of genes differentially expressed between cell andtissue groupsDifferentially expressed genes in a particular group (e.g., heart and skeletalmuscle) were identified by ANOVA, taking into account the hierarchicalrelationship between samples in our data set (tissue autocorrelation by‘phylogenetic ANOVA’). See Supplementary Experimental Procedures forfurther details.
Identification of genes correlating with cell and tissue turnoverTo identify genes correlating with cell turnover (a bona fide lifespanestimate) we employed generalized least squares regression(Supplementary Experimental Procedures).
ACKNOWLEDGEMENTSWe acknowledge financial support from NIH (AG047745 and AG021518).
CONTRIBUTIONSI.S. performed the analyses. V.N.G. supervised the study. All authors contributed todata interpretation. I.S. and V.N.G. wrote the paper, with significant contributionsfrom S.M.
COMPETING INTERESTSThe authors declare no conflict of interest.
REFERENCES1. Spalding, K. L. et al. Dynamics of fat cell turnover in humans. Nature 453,
783–787 (2008).2. Pellettieri, J. & Sanchez Alvarado, A. Cell turnover and adult tissue homeostasis:
from humans to planarians. Annu. Rev. Genet. 41, 83–105 (2007).3. Richardson, R. B., Allan, D. S. & Le, Y. Greater organ involution in highly
proliferative tissues associated with the early onset and acceleration of ageingin humans. Exp. Gerontol. 55, 80–91 (2014).
4. Spalding, K. L., Bhardwaj, R. D., Buchholz, B. A., Druid, H. & Frisen, J. Retrospectivebirth dating of cells in humans. Cell 122, 133–143 (2005).
5. Bergmann, O. et al. Dynamics of cell generation and turnover in the human heart.Cell 161, 1566–1575 (2015).
6. Huttner, H. B. et al. The age and genomic integrity of neurons after cortical strokein humans. Nat. Neurosci. 17, 801–803 (2014).
7. Magrassi, L., Leto, K. & Rossi, F. Lifespan of neurons is uncoupled from organismallifespan. Proc. Natl Acad. Sci. USA 110, 4374–4379 (2013).
8. Halprin, K. M. Epidermal ‘turnover time’--a re-examination. Br. J. Dermatol. 86,14–19 (1972).
9. Bergmann, O. et al. Evidence for cardiomyocyte renewal in humans. Science 324,98–102 (2009).
Gene expression signatures of human cell and tissue turnoverI Seim et al
7
© 2016 Japanese Society of Anti-Aging Medicine/Macmillan Publishers Limited npj Aging and Mechanisms of Disease (2016) 16014

10. Fahy, R. J., Doseff, A. I. & Wewers, M. D. Spontaneous human monocyte apoptosisutilizes a caspase-3-dependent pathway that is blocked by endotoxin and isindependent of caspase-1. J. Immunol. 163, 1755–1762 (1999).
11. Mangan, D. F. & Wahl, S. M. Differential regulation of human monocyteprogrammed cell death (apoptosis) by chemotactic factors and pro-inflammatorycytokines. J. Immunol. 147, 3408–3412 (1991).
12. Coclet, J., Foureau, F., Ketelbant, P., Galand, P. & Dumont, J. E. Cell populationkinetics in dog and human adult thyroid. Clin. Endocrinol. (Oxf) 31,655–665 (1989).
13. Leblond, C. P. & Walker, B. E. Renewal of cell populations. Physiol. Rev. 36,255–276 (1956).
14. Govindaraju, D., Atzmon, G. & Barzilai, N. Genetics, lifestyle and longevity: Lessonsfrom centenarians. Appl. Transl. Genomics 4, 23–32 (2015).
15. Fang, X. et al. Adaptations to a subterranean environment and longevity revealedby the analysis of mole rat genomes. Cell Rep. 8, 1354–1364 (2014).
16. Fushan, A. A. et al. Gene expression defines natural changes in mammalianlifespan. Aging Cell 14, 352–365 (2015).
17. Uhlen, M. et al. Proteomics. Tissue-based map of the human proteome. Science347, 1260419 (2015).
18. ENCODE Project Consortium. An integrated encyclopedia of DNA elements in thehuman genome. Nature 489, 57–74 (2012).
19. Fantom Consortium. A promoter-level mammalian expression atlas. Nature 507,462–470 (2014).
20. Mele, M. et al. Human genomics. The human transcriptome across tissues andindividuals. Science 348, 660–665 (2015).
21. Liang, C., Consortium, F., Forrest, A. R. & Wagner, G. P. The statistical geometry oftranscriptome divergence in cell-type evolution and cancer. Nat. Commun. 6,6066 (2015).
22. Kin, K., Nnamani, M. C., Lynch, V. J., Michaelides, E. & Wagner, G. P. Cell-typephylogenetics and the origin of endometrial stromal cells. Cell Rep. 10,1398–1409 (2015).
23. Chen, H. et al. An integrative analysis of TFBS-clustered regions revealsnew transcriptional regulation models on the accessible chromatin landscape.Sci. Rep. 5, 8465 (2015).
24. Stergachis, A. B. et al. Developmental fate and cellular maturity encoded inhuman regulatory DNA landscapes. Cell 154, 888–903 (2013).
25. Roadmap Epigenomics Consortium. Integrative analysis of 111 reference humanepigenomes. Nature 518, 317–330 (2015).
26. Gibala, M. J., Young, M. E. & Taegtmeyer, H. Anaplerosis of the citric acid cycle:role in energy metabolism of heart and skeletal muscle. Acta Physiol. Scand. 168,657–665 (2000).
27. Herndon, L. A. et al. Stochastic and genetic factors influence tissue-specificdecline in ageing C. elegans. Nature 419, 808–814 (2002).
28. Dong, C., Bach, S. V., Haynes, K. A. & Hegde, A. N. Proteasome modulates positiveand negative translational regulators in long-term synaptic plasticity. J. Neurosci.34, 3171–3182 (2014).
29. Stout, G. J. et al. Insulin/IGF-1-mediated longevity is marked by reduced proteinmetabolism. Mol. Syst. Biol. 9, 679 (2013).
30. Mayer, C. & Grummt, I. Ribosome biogenesis and cell growth: mTOR coordinatestranscription by all three classes of nuclear RNA polymerases. Oncogene 25,6384–6391 (2006).
31. Ferreira, A. & Kosik, K. S. Accelerated neuronal differentiation induced by p53suppression. J. Cell Sci. 109, 1509–1516 (1996).
32. Rohlf, F. J. A comment on phylogenetic correction. Evolution 60,1509–1515 (2006).
33. Scholzen, T. & Gerdes, J. The Ki-67 protein: from the known and the unknown.J. Cell. Physiol. 182, 311–322 (2000).
34. Ciulla, M. M. et al. Ki67 cytoplasmic expression: observations in normal tissuefrom heart atrial appendages of healthy rats. Cell Cycle 8, 2125 (2009).
35. Yata, K. et al. BRCA2 coordinates the activities of cell-cycle kinases to promotegenome stability. Cell Rep. 7, 1547–1559 (2014).
36. Esashi, F. et al. CDK-dependent phosphorylation of BRCA2 as a regulatorymechanism for recombinational repair. Nature 434, 598–604 (2005).
37. O'Donnell, L. et al. The MMS22L-TONSL complex mediates recovery fromreplication stress and homologous recombination. Mol. Cell 40, 619–631 (2010).
38. Campisi, J. & d'Adda di Fagagna, F. Cellular senescence: when bad things happento good cells. Nat. Rev. Mol. Cell Biol. 8, 729–740 (2007).
39. Wang, Y. & Hekimi, S. Mitochondrial dysfunction and longevity in animals:Untangling the knot. Science 350, 1204–1207 (2015).
40. Mootha, V. K. et al. Integrated analysis of protein composition, tissue diversity,and gene regulation in mouse mitochondria. Cell 115, 629–640 (2003).
41. Gladyshev, V. N. The free radical theory of aging is dead. Long live the damagetheory!. Antioxid. Redox Signal. 20, 727–731 (2014).
42. Lopez-Otin, C., Blasco, M. A., Partridge, L., Serrano, M. & Kroemer, G. The hallmarksof aging. Cell 153, 1194–1217 (2013).
43. Mercken, E. M. et al. Calorie restriction in humans inhibits the PI3K/AKT pathwayand induces a younger transcription profile. Aging Cell 12, 645–651 (2013).
44. van Heemst, D. et al. Variation in the human TP53 gene affects old age survivaland cancer mortality. Exp. Gerontol. 40, 11–15 (2005).
45. Rodier, F., Campisi, J. & Bhaumik, D. Two faces of p53: aging and tumor sup-pression. Nucleic Acids Res. 35, 7475–7484 (2007).
46. Ukraintseva, S. V. et al. Trade-offs between cancer and other diseases: do theyexist and influence longevity? Rejuvenation Res. 13, 387–396 (2010).
47. Bauer, J. H., Poon, P. C., Glatt-Deeley, H., Abrams, J. M. & Helfand, S. L. Neuronalexpression of p53 dominant-negative proteins in adult Drosophila melanogasterextends life span. Curr. Biol. 15, 2063–2068 (2005).
48. Bauer, J. H., Chang, C., Bae, G., Morris, S. N. & Helfand, S. L. Dominant-negativeDmp53 extends life span through the dTOR pathway in D. melanogaster.Mech. Ageing Dev. 131, 193–201 (2010).
49. Abegglen, L. M. et al. Potential mechanisms for cancer resistance in elephantsand comparative cellular response to DNA damage in humans. JAMA 314,1850–1860 (2015).
50. Ashur-Fabian, O. et al. Evolution of p53 in hypoxia-stressed Spalax mimics humantumor mutation. Proc. Natl Acad. Sci. USA 101, 12236–12241 (2004).
51. Fang, X. et al. Genome-wide adaptive complexes to underground stresses inblind mole rats Spalax. Nat. Commun. 5, 3966 (2014).
52. Kaya, A. et al. Defining molecular basis for longevity traits in natural yeast isolates.npj Aging Mech. Dis. 1, 15001 (2015).
53. Knothe Tate, M. L., Adamson, J. R., Tami, A. E. & Bauer, T. W. The osteocyte.Int. J. Biochem. Cell Biol. 36, 1–8 (2004).
54. Shapiro, E., Biezuner, T. & Linnarsson, S. Single-cell sequencing-basedtechnologies will revolutionize whole-organism science. Nat. Rev. Genet. 14,618–630 (2013).
55. GTEx Consortium. Human genomics. The Genotype-Tissue Expression (GTEx) pilotanalysis: multitissue gene regulation in humans. Science 348, 648–660 (2015).
56. Horvath, S. et al. Obesity accelerates epigenetic aging of human liver. Proc. NatlAcad. Sci. USA 111, 15538–15543 (2014).
57. Horvath, S. DNA methylation age of human tissues and cell types. Genome Biol.14, R115 (2013).
58. Toyama, B. H. et al. Identification of long-lived proteins reveals exceptionalstability of essential cellular structures. Cell 154, 971–982 (2013).
59. Savas, J. N., Toyama, B. H., Xu, T., Yates, J. R. 3rd & Hetzer, M. W. Extremelylong-lived nuclear pore proteins in the rat brain. Science 335, 942 (2012).
60. Khaitovich, P. et al. A neutral model of transcriptome evolution. PLoS Biol. 2,E132 (2004).
61. Pickering, A. M., Lehr, M. & Miller, R. A. Lifespan of mice and primates correlateswith immunoproteasome expression. J. Clin. Invest. 125, 2059–2068 (2015).
This work is licensed under a Creative Commons Attribution 4.0International License. The images or other third party material in this
article are included in the article’s Creative Commons license, unless indicatedotherwise in the credit line; if the material is not included under the Creative Commonslicense, users will need to obtain permission from the license holder to reproduce thematerial. To view a copy of this license, visit http://creativecommons.org/licenses/by/4.0/
Supplementary Information accompanies the paper on the npj Aging and Mechanisms of Disease website (http://www.nature.com/npjamd)
Gene expression signatures of human cell and tissue turnoverI Seim et al
8
npj Aging and Mechanisms of Disease (2016) 16014 © 2016 Japanese Society of Anti-Aging Medicine/Macmillan Publishers Limited


![Widespread signatures of selection for secreted peptidases ... · 2015) and transcriptome [32]. To calculate the gene counts HTSeq v0.6.1 [33] was used. Differential gene expression](https://img.pdfslide.us/doc/110x75/5fc4379c2cf99c3e5e3e8a41/widespread-signatures-of-selection-for-secreted-peptidases-2015-and-transcriptome.jpg)