Embed Size (px)
Citation preview
Gender Impact of Labour Saving Devices’ Use in Maize Seed Groups
Timor-Leste Ministry of Agriculture and FisheriesSeeds of Life - Fini ba Moris
November 2015

StudyReport
MinistryofAgricultureandFisheries
SeedsofLife/FinibaMoris
November 2015
GenderImpactofLabour
SavingDevices’Usein
MaizeSeedGroups

Seeds of Life (Fini ba Moris) is a program within the Timor-Leste
(East Timor) Ministry of Agriculture and Fisheries (MAF).
The Governments of Timor-Leste and Australia collaboratively fund
the program. Australian funding is through Australian Aid,
Department of Foreign Affairs and Trade, plus the Australian Centre
for International Agricultural Research (ACIAR) and is managed by
ACIAR. The Centre for Plant Genetics and Breeding (PGB) within the
University of Western Australia (UWA) coordinates the Australian
funded activities.
The data for the study was collected by Octaviana Ferreira
Agostinho, Maria Fernandes and Anita Ximenes. The data analysis
and report preparation was done by Julie Imron, with assistance
from Luc Spyckerelle.
Cover photo. Women farmer operating a maize sheller, Commercial
Seed Producer group Lacabasi, suco Meligo, municipality Bobonaro
© Lucia Viana Branco
Suggested citation:
Seeds of Life. 2015. Gender Impact of Labour Saving Devices’ Use in
Maize Seed Groups. Study for the Seeds of Life program, Ministry of
Agriculture and Fisheries, Dili, Timor-Leste.

i
Tableofcontents Table of contents ------------------------------------------------------------------------------------------ i
Index of Tables ------------------------------------------------------------------------------------------- iii
Index of Figures------------------------------------------------------------------------------------------ iv
Abbreviations and Acronyms -------------------------------------------------------------------------- v
Executive summary ------------------------------------------------------------------------------------- vi
1. Purposeandmethodology-------------------------------------------------------------------1
1.1 Purpose of the survey ----------------------------------------------------------------------- 1
1.2 Methodology ---------------------------------------------------------------------------------- 2
1.3 Sample ----------------------------------------------------------------------------------------- 2
2. Generalinformationongroups-------------------------------------------------------------5
2.1 Number of group members ---------------------------------------------------------------- 5
2.2 Groups’ production activities ------------------------------------------------------------- 5
2.2.1 Land cultivated ---------------------------------------------------------------------- 5
2.2.2 Production details ------------------------------------------------------------------ 6
2.3 Equipment used for land preparation and cultivation ------------------------------- 8
3. Divisionoflabouramonggroupmembers ----------------------------------------------9
3.1 Preliminary explanations ------------------------------------------------------------------ 9
3.2 Overall gender division of labour ------------------------------------------------------ 10
3.3 Gender division of labour per municipality ------------------------------------------ 11
3.4 Gender division of labour per land size ----------------------------------------------- 12
3.5 Gender division of labour per activity ------------------------------------------------- 13
4. Accesstolaboursavingdevicesbygroupsandtheirmembers------------------15
4.1 Distribution of labour saving devices to CSPs and CSPGs ------------------------- 15
4.1.1 Number of devices received -------------------------------------------------------- 15
4.1.2 Source of devices and year of distribution ------------------------------------- 17
4.2 Use and handling of the devices distributed ----------------------------------------- 18
4.2.1 Use of the labour saving devices by groups ------------------------------------ 18
4.2.2 Control over the devices by group members ---------------------------------- 19
ii
4.3 Use of the labour saving devices by group members ------------------------------ 20
4.3.1 Methods used before using the labour saving devices ---------------------- 20
4.3.2 Access to the labour saving devices by male and female members ----- 21
4.3.3 Perception of the impact of these labour saving devices
on the groups --------------------------------------------------------------------------- 23
4.3.4 Use of other methods in parallel -------------------------------------------------- 27
4.4 Repairing labour saving devices -------------------------------------------------------- 29
4.5 Feedback from group leaders ----------------------------------------------------------- 30
5. Groups’accesstodrums--------------------------------------------------------------------31
5.1 General information ----------------------------------------------------------------------- 31
5.2 Use of the drums by men and women ------------------------------------------------- 31
5.3 General feedback -------------------------------------------------------------------------- 32
6. Personalmaizeproduction----------------------------------------------------------------33
6.1 General information on personal maize production ------------------------------- 33
6.2 Are members or outside farmers allowed to borrow the groups’ tools?------- 33
6.3 Respondents borrowing groups’ equipment for personal maize production - 34
6.4 Respondents’ perception on the difficulty to perform housekeeping
and agricultural activities ---------------------------------------------------------------- 35
7. Conclusions------------------------------------------------------------------------------------36
Appendix I: Data cleaning--------------------------------------------------------------------------38

iii
IndexofTables
Table 1. Sampled municipalities and number of respondents ................................................ 3
Table 2. Leading positions interviewed ........................................................................................... 4
Table 3. Average number of male and female members in CSPs and CSPGs ..................... 5
Table 4. Average number of plots and area cultivated by the group .................................... 6
Table 5. Average seed production ...................................................................................................... 7
Table 6. Equipment used for land preparation ............................................................................. 8
Table 7. Source of equipment used for cultivating the crops .................................................. 8
Table 8. Example of how questions on labour division was asked and answered.......... 9
Table 9. Example of how questions on food preparation was asked and answered .... 10
Table 10. Overall gender division of labour .................................................................................... 10
Table 11. Gender division of labour per municipality ................................................................ 11
Table 12. Comparison of results obtained for the CSP Buras Hamutuk in Lautem.......... 12
Table 13. Gender division of labour per category of land size ................................................ 12
Table 14. Gender division of labour per activity - agricultural activities ............................ 13
Table 15. Gender division of labour per activity – food preparation activities ................ 14
Table 16. Proportion of respondents declaring their group received labour saving devices ......................................................................................................................... 15
Table 17. Number of labour saving devices received.................................................................. 16
Table 18. Receiving both models of shellers .................................................................................. 17
Table 19. Source of devices distributed ............................................................................................ 17
Table 20. Year of distribution ............................................................................................................... 17
Table 21. Use of the devices by the groups ..................................................................................... 18
Table 22. Number of cycles labour saving devices were used ................................................. 19
Table 23. Gender of the person responsible of the devices distributed .............................. 19
Table 24. Explaining how to repair broken devices .................................................................... 19
Table 25. For how long are farmers able to use these devices before taking a break .... 23
Table 26. Use of the time saved ........................................................................................................... 24
Table 27. Proportion of respondents saying the groups still use another method ......... 27
Table 28. Proportion of the total maize processed with other methods ............................. 28
Table 29. Broken and repaired devices ............................................................................................ 29
Table 30. Use of drums by men and women members............................................................... 32
Table 31. Women able to use drums without the help of men ................................................ 32
Table 32. Equipment used by respondents for maize production ......................................... 34

iv
IndexofFigures Figure 1. Labour saving devices distributed to CSPGs and CSPs ----------------------------- 1
Figure 2. Two models of shellers ----------------------------------------------------------------- 16
Figure 3. Other methods used for grinding and sorting kernels --------------------------- 20
Figure 4. Maize grinded with the grinding machine distributed to groups -------------- 21
Figure 5. Who is shelling, grinding, sorting kernels – before and after receiving labour
saving devices ---------------------------------------------------------------------------- 22
Figure 6. Impact on time spent according to women and men respondents ------------ 24
Figure 7. Impact on the difficulty of the tasks according to women and men
respondents ------------------------------------------------------------------------------- 25
Figure 8. Impact on the results of shelling, grinding and sorting seeds, according to
women and men respondents --------------------------------------------------------- 26
Figure 9. Group members during a demonstration of the maize grinder ---------------- 29
Figure 10. Source of drums and year of receiving drums ------------------------------------- 31
Figure 11. Difficulty of conducting housekeeping and agricultural activities ------------ 35
Figure 12. Woman farmer operating a maize grinder ----------------------------------------- 37

v
AbbreviationsandAcronyms
AS Adoption survey (conducted for Seeds of Life in 2014)
CSP Commercial Seed Producer
CSPG Community Seed Production Group
HH Household
IFAD International Fund for Agricultural Development
MAF Ministry of Agriculture and Fisheries
MTS Mid-Term Survey (conducted for Seeds of Life in 2013)
NA Not Available / Not Asked
NGO Non-governmental organization
SP Sweet potato
SEO Suco Extension Officer
SoL Seeds of Life
T Metric tonne (1,000 kg)

vi
Executivesummary
The purpose of this survey is to evaluate whether and how, the introduction of labour saving devices, such as maize shellers, grinders and screens, has impacted on gender, and in particular on the gender division of tasks within farmer groups growing maize seed. To achieve this, 50 men and 24 women members of Commercial Seed Producers (CSPs) and Community Seed Production Groups (CSPGs) were interviewed in mid-2015 in eight municipalities: Aileu, Ainaro, Baucau, Bobonaro, Lautem, Liquica, Manufahi and Viqueque. Generalinformationongroups
According to the answers provided, membership within CSPs and CSPGs seems to be quite gender balanced (47% women for CSPs and CSPGs combined) with a slighter higher participation of men in CSPs (57% men in CSPs only). CSPs cultivate on average 4.1 ha vs. 2.6 ha for CSPGs. The average seed production ranges from about 5 T for CSPs to about 1 T for CSPGs. The largest area and seed production was reported for the CSP Buras Hamutuk in Lautem (13 ha cultivated and about 7 T of seeds produced). All group members, besides two, said their group used MAF’s tractor to plough the groups’ land, but most reported that they used farmers’ personal tools to cultivate crops after that. Labourdivisionwithinthegroup
Overall, estimating the total labour required at each step of the maize cycle of production, and differentiating men and women’s work, was a very difficult exercise for both farmers and enumerators. As a result, figures obtained were very much over-estimated (three to four times higher than reality) but still provide an interesting overview of how men and women members usually share the work to be done. The main observation is that gender division of labour seems to be very much balanced: 50% of the total work to be performed is conducted by women members (when including food preparation during work). Grading cobs and shelling are the "non-food preparation activities" where women seem to be slightly more involved than men: 53% and 52% of the total person-days required for these tasks were performed by women. Indeed, women are considered more thorough in performing these activities, and are thus traditionally more involved in them. This confirms the importance of labour-saving devices such as shellers and screens to reduce the workload of women within groups.

vii
Accesstolaboursavingdevicesbygroupmembers
Nearly all respondents confirmed that their groups had received from MAF/SoL shellers and screens (about four shellers and three screens per group) while about 78% only said their group also received grinders (two grinders on average). Screens are the devices that were the most used (97% of the respondents reported their groups did use the screens they were given), followed by shellers (89%) and grinders (61%). The two main reasons for some groups not to use these devices are that: (1) tools are out of order or (2) there aren’t enough tools for all group members or all CSPGs to be able to use these. Note that 31% and 19% of respondents said some shellers and grinders respectively were out of order but in most cases, no repairs were apparently undertaken. Inregardtothecontroloverthesedevices, about 50% of the respondents said that men alone are responsible for these tools. In second position, about 40% of respondents said both women and men are responsible for the tools and lastly, for about 10% of the respondents, it is women alone who are responsible for these devices. These results reflect the fact that it is mainly the group leaders who are responsible to store and maintain the group’s equipment, and only two out of the ten CSPs sampled were headed by a woman. Still, the survey also pointed out that there was no discrimination between men and women members in regards to who received information on how to repair those devices. In regards to the use of these devices, the most common practice is for men and women to have equal access to this equipment: 70% of respondents using the screen said both men and women members use these equally, and 52% and 34% answered similarly for shellers and grinders respectively. Before receiving these devices, in most cases it was also reported that both men and women were shelling, sorting seeds and grinding – even though more women were usually grinding maize, mainly because it relates more closely to cooking. There seems to be no physical barrier for women to use these tools: nearly all respondents said women could use them without the help of a man, and the average duration men and women reported usually using these tools is very similar (about 20-30 minutes in a row without taking a break). The main changes that were observed after the introduction of these tools contribute to a more gender-balanced division of labour for these specific tasks:
A slightly higher proportion of men are now involved in the shelling of the maize (no more cases of women shelling alone in the group).
A significantly higher proportion of men are now helping women to grind maize which definitely reduces women's burden (no more cases of women grinding alone).
Sorting kernels, which was initially more an activity conducted by either men or women, is now done by men and women together according to 70% of respondents (with men being a bit more involved than women).

viii
Note that 200 litres drums were also distributed to maize groups in order to store the seeds produced. On average, it was reported that CSPs received about 12 drums and CSPGs about seven drums. Most were distributed by MAF in 2014, but about 14% were apparently purchased through the IFAD drum program1. While most women are able to fill the drums without the help of men, 33% of respondents said it is men alone who usually take seeds out of the drums. This is probably related to the fact that it is difficult for women to tilt filled drums on their own. Impactofthetoolsdistributed
Overall, both men and women respondents were very much satisfied with the different devices in regards to:
the time saved: overall, more than 75% said they spend less or much less time now,
their ease of use: more than 80% said it is easier to work now, and the results obtained: more than 70% said the results obtained were
satisfying or very satisfying. The time saved on these tasks is used by about 80% of the respondents to do other work for the group, and for about 20% of the respondents to take some rest. Screens are the most appreciated tools because they replace manual sorting which was a very exhausting and time consuming task: 87% of respondents were sorting seeds manually in the past. On the other hand, grinders are a bit less appreciated, mainly because 51% of respondents reported their groups are also using powered grinders which can grind larger quantities at once and are less tiring to use. The main issue reported by group members is the lack of devices, which prevents all the maize produced from being processed with these tools, and therefore limits the overall impact on gender. As a result: 87% of respondents said their groups still shell by hand; 91% said they still grind part of the maize with a grinding stone, or a pound, or a powered grinder; and finally, 90% said they still sort kernels manually, or with a winnowing basket. Most groups continue processing the harvested maize in batches in order to spread the workload over several days.
1 The IFAD-supported ‘Timor-Leste Maize Storage Project’ enabled maize farmers in selected municipalities to obtain 200 litres drums at US $ 10 per drum. Depending on previous harvest results, farmers could purchase up to four drums.

ix
Personalmaizeproductionandborrowinggroups’equipment
55% of the respondents said they grow maize on their own farm. On average, farmers who were able to estimate their productions reported growing 0.6 ha of maize and harvested 155 kg in the last season. About 40% of the respondents said members are allowed to borrow shellers, grinders or screens to process the maize they grow on their own plots. Only three farmers said that was also possible for non-members. But in practice, only one respondent said he actually borrowed a sheller and a screen. This reality mainly results from the fact that groups have a limited number of devices and therefore not many can be lent out, especially after harvest. Conclusions
This survey revealed a rather male dominated control over the labour-saving devices distributed, simply because most group leaders are men. But in nearly all cases, access to these tools is very much gender balanced, which contributes to reducing women’s burden. Overall, very positive feedback was collected in regards to the time saved, the ease of use of these tools, and the results obtained. But this positive impact is limited by the number of tools which can be insufficient in relation to the number of CSPGs and farmers taking part in the CSP. Consequently, the impact of these devices across the groups’ boundaries is rather small. A non-subsidized channel where groups would be able to purchase such equipment according to their needs would enable larger volumes of maize to be processed faster, and consequently reduce even more women’s work burden. It could also become an alternative income generation activity for groups renting some of their tools.

1
1. Purposeandmethodology
1.1 Purposeofthesurvey The Seeds of Life program (SoL) has distributed a number of labour saving devices to CSPGs and CSPs growing maize, such as:
Seed screens (pinera) which are used to sort seeds, Maize shellers (makina behu batar) which are used to shell maize after harvest, Maize grinders (makina dulas batar), used to grind maize into cornmeal. These
were only distributed in 2014.
Figure 1. Labour saving devices distributed to CSPGs and CSPs2
Traditionally, maize processing – and more particularly sorting seeds – is mainly done by women as they are considered to do this more thoroughly than men. Thepurposeofthis survey is to evaluate whether, and how, the introduction of these laboursavingdeviceshasimpactedongender,andinparticularonthegenderdivisionoftaskswithinmaizegroups.
2 Pictures from Samuel Bacon (sheller, first model and grinder), Alexia Skok (screen).
Screen Grinder
Shellers (two models)
2
1.2 Methodology Interviews were conducted using e-questionnaires in May, June and July 2015 with members of ten CSPs located in seven municipalities. The questionnaire included general questions on the CSPs, as well as more specific questions on the division of the work in the group, as well as how the labour saving devices were used, and how it has impacted on the way members share the work to be done. For this, respondents were asked to compare how the situation was before receiving these tools, and afterwards. As part of the interview, some questions were also asked about the possible use of these tools to process maize grown by the family of the respondents (and not the CSPG), in order to evaluate if such tools also had an impact beyond the groups’ activities.
1.3 Sample The survey was conducted with ten groups of maize growing Commercial Seed Producers (CSPs) in the municipalities Aileu, Ainaro, Baucau, Bobonaro, Liquica, Lautem, Manufahi and Viqueque. In all municipalities except Lautem, these CSPs were formed from an association of Community Seed Production Groups (CSPGs) that were established in 2011 and 2012. For the purpose of this gender impact survey, only municipalities where maize shellers were first distributed to CSPGs were selected, in order to ensure the longest use of these tools. Moreover, in those CSPs, the enumerators only interviewed members who said they used these labour saving devices. The CSP in the municipality of Lautem was also added, even though it wasn’t formed on the basis of existing CSPGs3. The group was added because of its involvement in a research activity collecting some similar data. Comparison with the results obtained in this survey and in the research would provide complementary information. Table 1 presents the detail of the sample interviewed.
3 It was a single farmers’ group which applied for, and obtained, Commercial Seed Producer status.

3
Table 1. Sampled municipalities and number of respondents
Municipality#of
respondents%of
respondents%offemalerespondents
CSPs'names#ofrespondents
perCSP
Aileu 10 14% 20% Kokoroek Manufoni 10
Ainaro 6 8% 33% Hatudi Fini 6
Baucau 11 15% 46% Fitun Leste 4
Monabulat 7
Bobonaro 4 5% 75% Lacabasi 4
Lautem 5 7% 40% Buras Hamutuk 5
Liquica 29 39% 31% Naroman 25
Mofau 4
Manufahi 5 7% 0% Raikotu Manufahi 5
Viqueque 4 5% 25% Tane Fini 4
Total 74 100% 33%
74
Overall, one third of the respondents interviewed were women even though it was reported that nearly 50% of group members are women. This is a bit disappointing given women's perception on the different questions will be less represented than men's. As a result, most statistical tests will not be strong enough to detect significant differences between women and men's answers on the different questions. RespondentsandtheirCSPs/CSPGs
Note that all 74 respondents are members of a CSP and a CSPG (except for the Lautem CSP which followed a slightly different development path). But, in order to simplify the interview4, respondents were first asked: “Are you mainly using the shellers/ grinders/ screens for the CSPG production, or the CSP production?”. Depending on the answer given, the rest of the interview focused on either the activities within the CSPG (if tools are mainly used for the CSPG production), or within the CSP (if tools are mainly used for the CSP production, or for both CSP and CSPG productions). As a result:
66% of the respondents said they mainly used the tools to process the maize of the CSPG.
18% said they use the tools to process the maize of both the CSPG and the CSP. 16% said they use the tools to process the maize of the CSP.
4 There were two modules in the interview: one for a CSP member, and one for a CSPG member.

4
Some of the tables in this report differentiate answers according to whether respondents were supposed to answer from the perspective of the CSP or the CSPG activities. Still, as shown later, it appeared that most members do not differentiate clearly the activities they conduct within their CSP or their CSPG due to different reasons: similarity of the production activities, use of CSPG land for producing maize of the CSP, fluidity of the lists of group members, etc. Consequently, it is likely that the answers provided to the above question do not reflect the reality and that data disaggregated per type of group (CSP/CSPG) are not entirely reliable. Representationofgroupleadersinthesample
Table 2 presents how many group leaders, secretaries and treasurers were interviewed. Among the ten CSPs sampled, at least eight had their chiefs interviewed as part of this survey. And among the 26 CSPGs sampled, at least 21 had their chiefs interviewed as part of this survey. Two also had the secretary or the treasurer interviewed. In other words, most group leaders were met, which ensures more reliability on some of the questions (number of tools received by groups, number of members, etc.). It was also important to cover as many group leaders as possible because some questions are asked only to group leaders (general satisfaction regarding tools and their impact).
Table 2. Leading positions interviewed
#ofrespondentsinleadingpositions
GroupLeader Secretary Treasurer
Male Female Male Female Male Female
CSPs 6 2 1 1 1
CSPGs 18 3 1
As shown above, men are the ones usually heading CSPs or CSPGs. Still, in two CSPs (Lacabasi in Bobonaro, and Aidak Laran in Ainaro), the leaders are women. They head groups of 25 to 27 members respectively:
In the CSP Lacabasi, female members outnumber men (two-thirds of women-members).
While in the CSP Aidak Laran, men constitute a majority of members (about two-thirds as well).
Even though, men are still dominating in the leading positions, the fact that two CSPs out of eight have women leaders shows some acceptance and a possibility for more changes in the future.
5
2. Generalinformationongroups
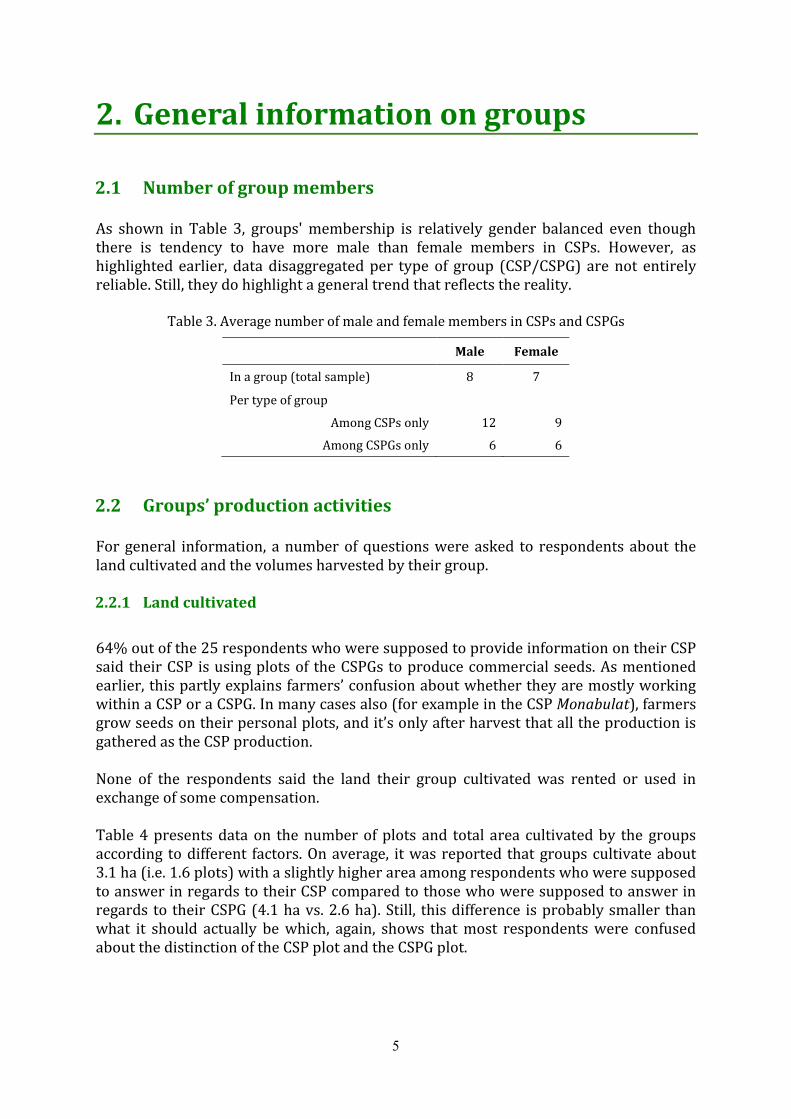
2.1 Numberofgroupmembers As shown in Table 3, groups' membership is relatively gender balanced even though there is tendency to have more male than female members in CSPs. However, as highlighted earlier, data disaggregated per type of group (CSP/CSPG) are not entirely reliable. Still, they do highlight a general trend that reflects the reality.
Table 3. Average number of male and female members in CSPs and CSPGs
Male Female
In a group (total sample) 8 7
Per type of group
Among CSPs only 12 9
Among CSPGs only 6 6
2.2 Groups’productionactivities For general information, a number of questions were asked to respondents about the land cultivated and the volumes harvested by their group. 2.2.1 Landcultivated
64% out of the 25 respondents who were supposed to provide information on their CSP said their CSP is using plots of the CSPGs to produce commercial seeds. As mentioned earlier, this partly explains farmers’ confusion about whether they are mostly working within a CSP or a CSPG. In many cases also (for example in the CSP Monabulat), farmers grow seeds on their personal plots, and it’s only after harvest that all the production is gathered as the CSP production. None of the respondents said the land their group cultivated was rented or used in exchange of some compensation. Table 4 presents data on the number of plots and total area cultivated by the groups according to different factors. On average, it was reported that groups cultivate about 3.1 ha (i.e. 1.6 plots) with a slightly higher area among respondents who were supposed to answer in regards to their CSP compared to those who were supposed to answer in regards to their CSPG (4.1 ha vs. 2.6 ha). Still, this difference is probably smaller than what it should actually be which, again, shows that most respondents were confused about the distinction of the CSP plot and the CSPG plot.

6
Table 4. Average number of plots and area cultivated by the group
#ofcases
Average#ofplots
#ofcasesAverage
area
Among total sample 74 1.6 71 3.1 ha
Minimum # of plots 1 0.04 ha
Maximum # of plots 6 16 ha
Per type of group
Among CSPs 25 1.8 23 4.1 ha
Among CSPGs 49 1.4 48 2.6 ha
Per municipality
Aileu 10 1.6 10 1.8 ha
Ainaro 6 2.7 6 4.7 ha
Baucau 11 1.3 8 1.5 ha
Bobonaro 4 1 4 6 ha
Lautem 5 1 5 13 ha
Liquica 29 1.6 29 1.5 ha
Manufahi 5 1 5 2 ha
Viqueque 4 2.5 4 4.7 ha
The only statistically significant relation was with the municipality5: respondents from Lautem, Ainaro and Viqueque reported the highest number of plots and/or largest areas (13 ha for Lautem and 4.7 ha for Ainaro and Viqueque). Indeed, in these municipalities, many farmers reported the number of plots or area their CSPs is cultivating. 2.2.2 Productiondetails
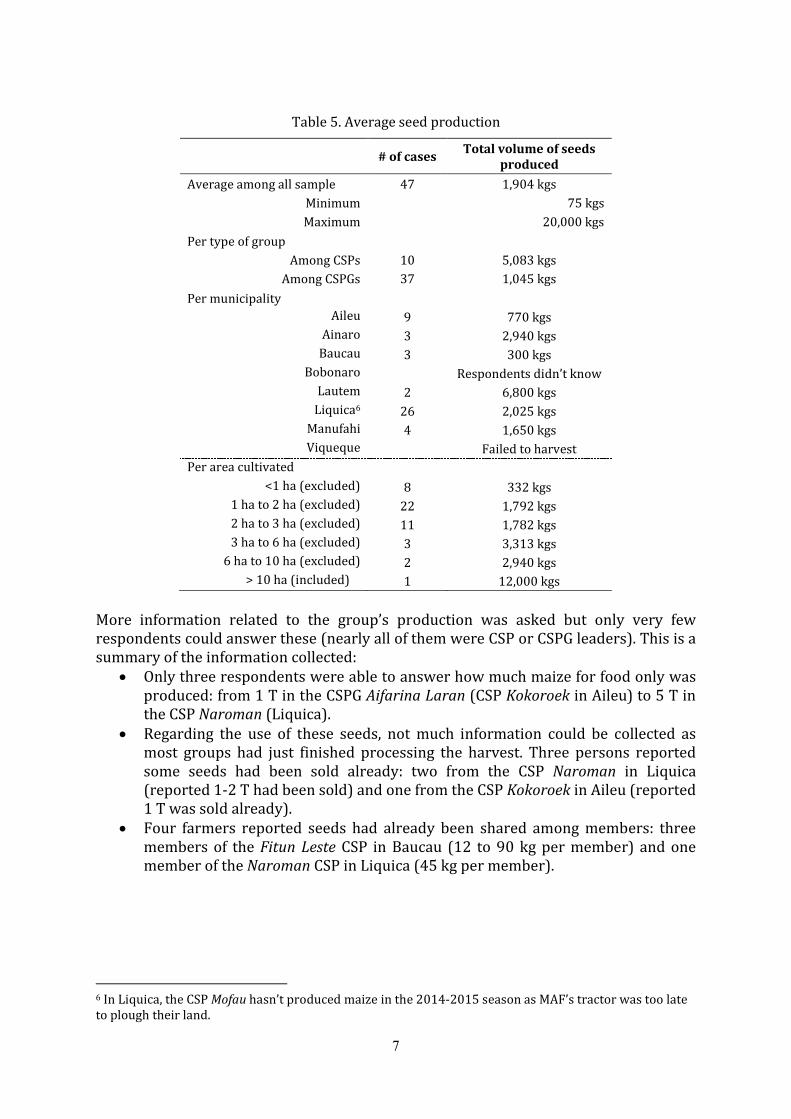
93% of the respondents said their group grows only one cycle per year. Only five respondents (four from Ainaro - CSP Hatudu Fini; one from Manufahi - CSP Raikotu) said their group grows two cycles per year. Crops are harvested mainly in March-April, but the exact timing might be slightly different for members of the same groups when crops are cultivated on members’ individual plots. Respondents were also asked about the volumes harvested and the total amount of seeds produced for the growing season prior the interview (November 2014 – March 2015). As shown in Table 5, many farmers were not able to answer these questions, partly because some groups were still waiting for their productions to be weighted. On average, groups produced about 2 T of seeds with a much larger production in CSPs: 5 T vs. 1 T on average among CSPGs. As expected, the larger the area cultivated, the bigger the volume of seeds produced: from 332 kg for small areas under 1 ha (for example in the CSP Monabulat in Baucau) up to 12 T as reported by the CSP Leader of the Buras Hamutuk CSP in Liquica. On average, respondents from the Lautem CSP reported the largest production (6.8 T).
5 Result of Anova test for number of plots: Sig. = 0.1, p<.05 and for area: Sig.=0, p<.05
7
Table 5. Average seed production
#ofcasesTotalvolumeofseeds
produced
Average among all sample 47 1,904 kgs
Minimum 75 kgs
Maximum 20,000 kgs
Per type of group
Among CSPs 10 5,083 kgs
Among CSPGs 37 1,045 kgs
Per municipality
Aileu 9 770 kgs
Ainaro 3 2,940 kgs
Baucau 3 300 kgs
Bobonaro Respondents didn’t know
Lautem 2 6,800 kgs
Liquica6 26 2,025 kgs
Manufahi 4 1,650 kgs
Viqueque Failed to harvest
Per area cultivated
<1 ha (excluded) 8 332 kgs
1 ha to 2 ha (excluded) 22 1,792 kgs
2 ha to 3 ha (excluded) 11 1,782 kgs
3 ha to 6 ha (excluded) 3 3,313 kgs
6 ha to 10 ha (excluded) 2 2,940 kgs
> 10 ha (included) 1 12,000 kgs
More information related to the group’s production was asked but only very few respondents could answer these (nearly all of them were CSP or CSPG leaders). This is a summary of the information collected:
Only three respondents were able to answer how much maize for food only was produced: from 1 T in the CSPG Aifarina Laran (CSP Kokoroek in Aileu) to 5 T in the CSP Naroman (Liquica).
Regarding the use of these seeds, not much information could be collected as most groups had just finished processing the harvest. Three persons reported some seeds had been sold already: two from the CSP Naroman in Liquica (reported 1-2 T had been sold) and one from the CSP Kokoroek in Aileu (reported 1 T was sold already).
Four farmers reported seeds had already been shared among members: three members of the Fitun Leste CSP in Baucau (12 to 90 kg per member) and one member of the Naroman CSP in Liquica (45 kg per member).
6 In Liquica, the CSP Mofau hasn’t produced maize in the 2014-2015 season as MAF’s tractor was too late to plough their land.
8
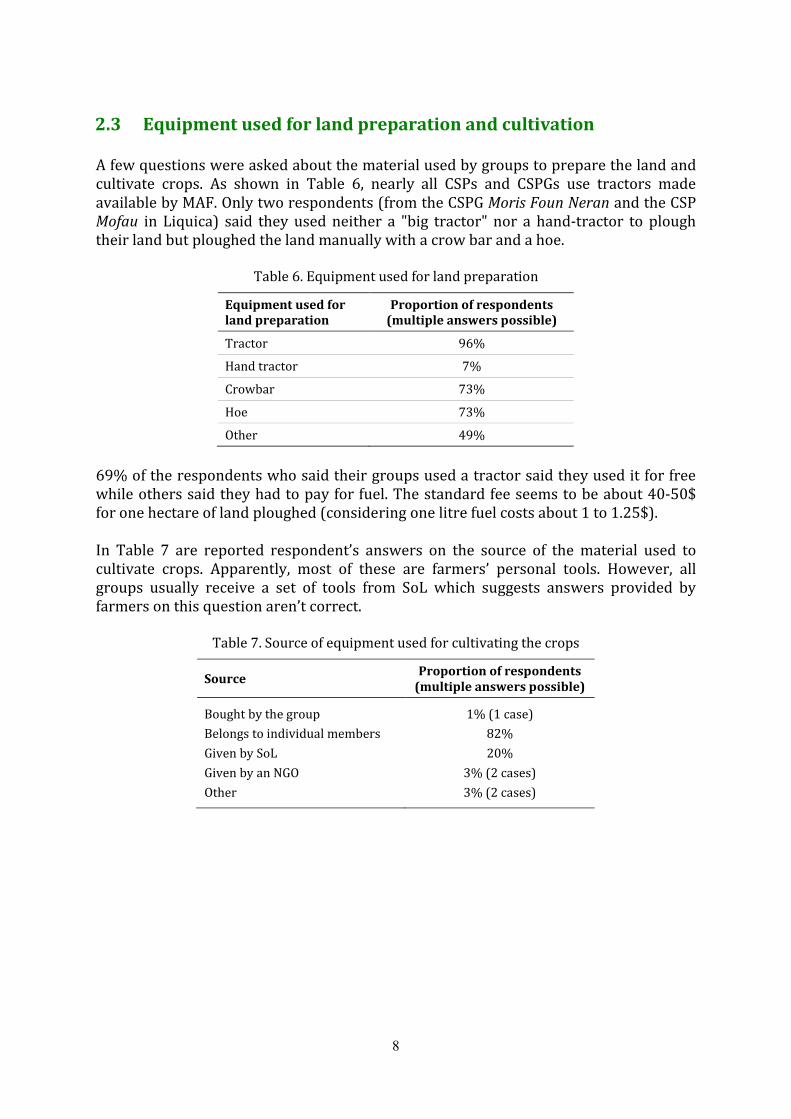
2.3 Equipmentusedforlandpreparationandcultivation A few questions were asked about the material used by groups to prepare the land and cultivate crops. As shown in Table 6, nearly all CSPs and CSPGs use tractors made available by MAF. Only two respondents (from the CSPG Moris Foun Neran and the CSP Mofau in Liquica) said they used neither a "big tractor" nor a hand-tractor to plough their land but ploughed the land manually with a crow bar and a hoe.
Table 6. Equipment used for land preparation
Equipmentusedforlandpreparation
Proportionofrespondents(multipleanswerspossible)
Tractor 96%
Hand tractor 7%
Crowbar 73%
Hoe 73%
Other 49%
69% of the respondents who said their groups used a tractor said they used it for free while others said they had to pay for fuel. The standard fee seems to be about 40-50$ for one hectare of land ploughed (considering one litre fuel costs about 1 to 1.25$). In Table 7 are reported respondent’s answers on the source of the material used to cultivate crops. Apparently, most of these are farmers’ personal tools. However, all groups usually receive a set of tools from SoL which suggests answers provided by farmers on this question aren’t correct.
Table 7. Source of equipment used for cultivating the crops
SourceProportionofrespondents
(multipleanswerspossible)
Bought by the group 1% (1 case)
Belongs to individual members 82%
Given by SoL 20%
Given by an NGO 3% (2 cases)
Other 3% (2 cases)

9
3. Divisionoflabouramonggroupmembers
3.1 Preliminaryexplanations Respondents were asked how male and female members of their groups shared the work to be done during the last cycle of maize production (November 2014 to March 2015). To do this, all the activities usually conducted to produce maize seeds were listed (i.e. preparing the land, planting, weeding, harvesting, etc.) and respondents were asked how many days the activity lasted, how many men and women were involved in the activity, and how many men-days/women-days this represented. Time spent on preparing food for people working during each of these activities was also included in the list of activities to produce maize. Table 8 presents an example of how the question was asked for one activity (harvesting) and how it was answered by a respondent in Liquica (CSP Naroman).
Table 8. Example of how questions on labour division was asked and answered
Activity:HARVEST Answers
Total days the activity lasted: .......... 7 days
Total number of men participating in this activity: ....... 4 men
Total number of women participating in this activity: ...... 3 women
Estimate the total number of men-days: .............. 28 men-days
Estimate the total number of women-days: ............ 21 women-days
Note that for women-days and men days, most enumerators mainly multiplied the total number of days by the number of men/women participating in the activity. In reality, not all four men or three women in this example, work for five full-days (some work only part of the day, others take turn, etc.). But this level of detail was too complicated to collect. Overall, this was a difficult exercise for farmers and enumerators who aren't comfortable with such estimations and calculations. In many cases as well, seeds are produced on several farmers’ individual plots which makes this exercise even more difficult. Thus, the following data should be treated with caution. For food preparation, if the respondent said that some food was prepared for the members (so for example in the above case, for the four men and three women harvesting maize during seven days), data on how long it took to prepare that food was also collected. Table 9 presents an example of how the question was asked and answered (same respondent).

10
Table 9. Example of how questions on food preparation was asked and answered
Activity:PreparingfoodforgroupmembersduringHARVEST Answers
Total days the activity lasted: .......... 7 days
Total number of men participating in this activity: ......... 0 men
Total number of women participating in this activity: ............. 1 woman
Estimate the total number of men-days: .......... 0 men-days
Estimate the total number of women-days: ........ 7 women-days
Here also, enumerators simply multiplied seven days by one woman to get the number of women-days but in reality, it is likely that it doesn't take one full day to cook for seven persons (even if there is more than one meal).
3.2 Overallgenderdivisionoflabour Overall, gender division of labour seems to be very much balanced: 49% of the total work to be performed is conducted by women members (Table 10). Clearly, women are the main ones involved in food preparation but they are equally involved in non-food preparation related activities.
Table 10. Overall gender division of labour
#of
casesAverage#of
men-daysAverage#ofwomen-days
Proportionofwomen-days
Average for ALL activities 737 351 339 49%
Per type of activity:
Non-food preparation activities 73 335 285 46%
Food preparation activities 74 16 54 77%
Per gender of respondent:
Male respondents 50 363 336 48% Female respondents 24 325 347 52%
Note that given the way enumerators rounded-up most calculations of women-days/men-days (as mentioned in part 3.1), it is likely that the total number of person-days is very much over-estimated. Also, men probably participate less in food-preparation than shown in Table 10 (or participate in other ways like to transport the food to the field). This proportion varies slightly according to the gender of the respondent: women will say they spend a bit more time working for the groups than men, and vice-versa. However, this difference isn’t statistically significant.
7 The number of cases is 73 only because for one respondent, the number of women-days spent for weeding couldn't be estimated and therefore, any data derived from this was also not calculated.

11
3.3 Genderdivisionoflabourpermunicipality As shown in Table 11, among the eight municipalities surveyed, Bobonaro, Lautem and Aileu are those where a higher proportion of women involvement was reported. These are also the three municipalities where the highest number of women members was reported, which is probably the main explanation to this. On the other side, in Baucau and Viqueque, men were reported as spending more time working in the groups than women. Again, these are the two municipalities where the highest number of men members was reported (about twice the number of women members).
Table 11. Gender division of labour per municipality
Municipality#of
casesAverage#of
men-daysAverage#ofwomen-days
Proportionofwomen-days
Aileu 10 157 187 54%
Ainaro 6 393 399 50%
Baucau 11 519 276 35%
Bobonaro 4 307 656 68%
Lautem 5 520 743 59%
Liquica 29 264 264 50%
Manufahi 5 313 331 51%
Viqueque 4 818 503 38%
SpecificcaseofLautem-CSP Buras Hamutuk
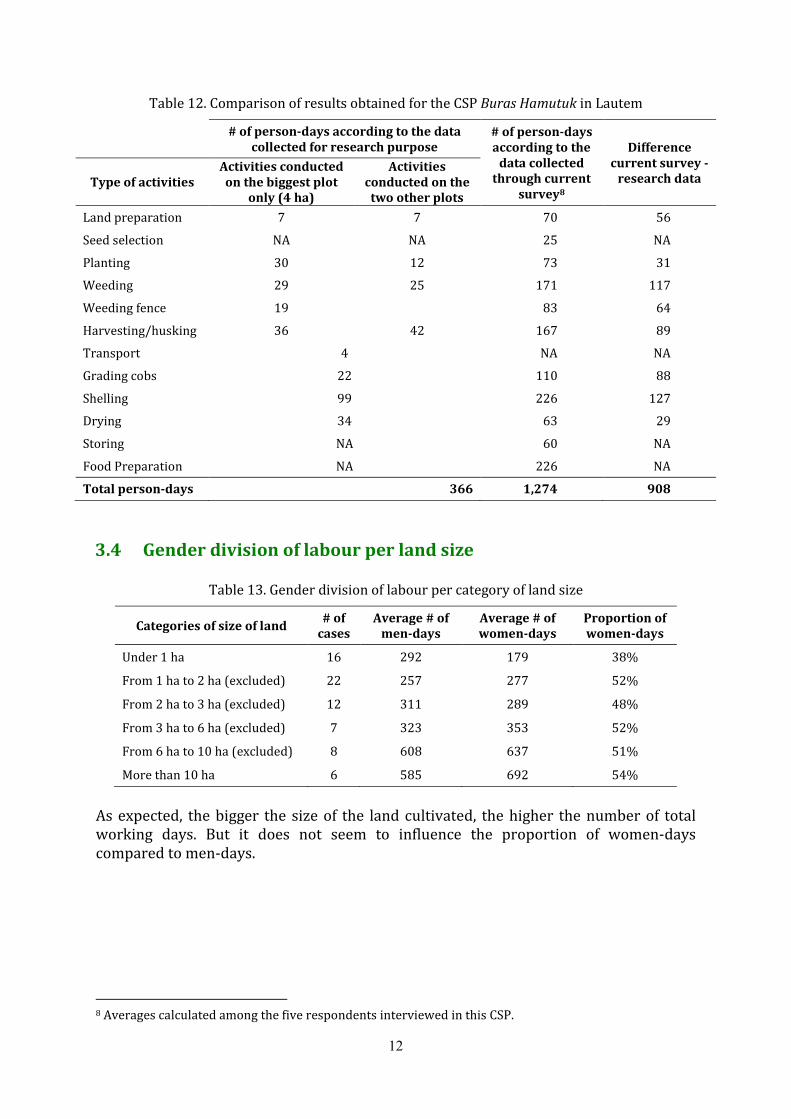
For this specific CSP, comparison was made with data collected systematically by Samuel Bacon, the SoL Cropping Systems Advisor, and the local Suco Extension Officer (SEO) for research purpose. Even though the data collected for research purpose isn't gender disaggregated, it gives a good indication of how the overall figures presented here compare to the reality. The data collected by the SoL advisor and the SEO is considered much more reliable than the data collected from individual farmers through the survey. Table 12 presents the number of person-days (men and women) obtained through both the research and the survey. Very clearly, the data on labour as reported by farmers directly is over-estimated (about three times the reality in the case of Lautem). As a result, thedataonlabourcollectedfrom this survey shouldn't be used as such but only to compare proportions of workload according to different criteria: for example men-days vs. women-days or according to municipalities or gender of the respondent, etc.
12
Table 12. Comparison of results obtained for the CSP Buras Hamutuk in Lautem
#ofperson-daysaccordingtothedata
collectedforresearchpurpose#ofperson-daysaccordingtothe
datacollectedthroughcurrent
survey8
Differencecurrentsurvey-
researchdataTypeofactivitiesActivitiesconductedonthebiggestplot
only(4ha)
Activitiesconductedonthe
twootherplots
Land preparation 7 7 70 56
Seed selection NA NA 25 NA
Planting 30 12 73 31
Weeding 29 25 171 117
Weeding fence 19
83 64
Harvesting/husking 36 42 167 89
Transport 4 NA NA
Grading cobs 22 110 88
Shelling 99 226 127
Drying 34 63 29
Storing NA 60 NA
Food Preparation NA 226 NA
Totalperson-days 366 1,274 908
3.4 Genderdivisionoflabourperlandsize
Table 13. Gender division of labour per category of land size
Categoriesofsizeofland#of
casesAverage#of
men-daysAverage#ofwomen-days
Proportionofwomen-days
Under 1 ha 16 292 179 38%
From 1 ha to 2 ha (excluded) 22 257 277 52%
From 2 ha to 3 ha (excluded) 12 311 289 48%
From 3 ha to 6 ha (excluded) 7 323 353 52%
From 6 ha to 10 ha (excluded) 8 608 637 51%
More than 10 ha 6 585 692 54%
As expected, the bigger the size of the land cultivated, the higher the number of total working days. But it does not seem to influence the proportion of women-days compared to men-days.
8 Averages calculated among the five respondents interviewed in this CSP.
13
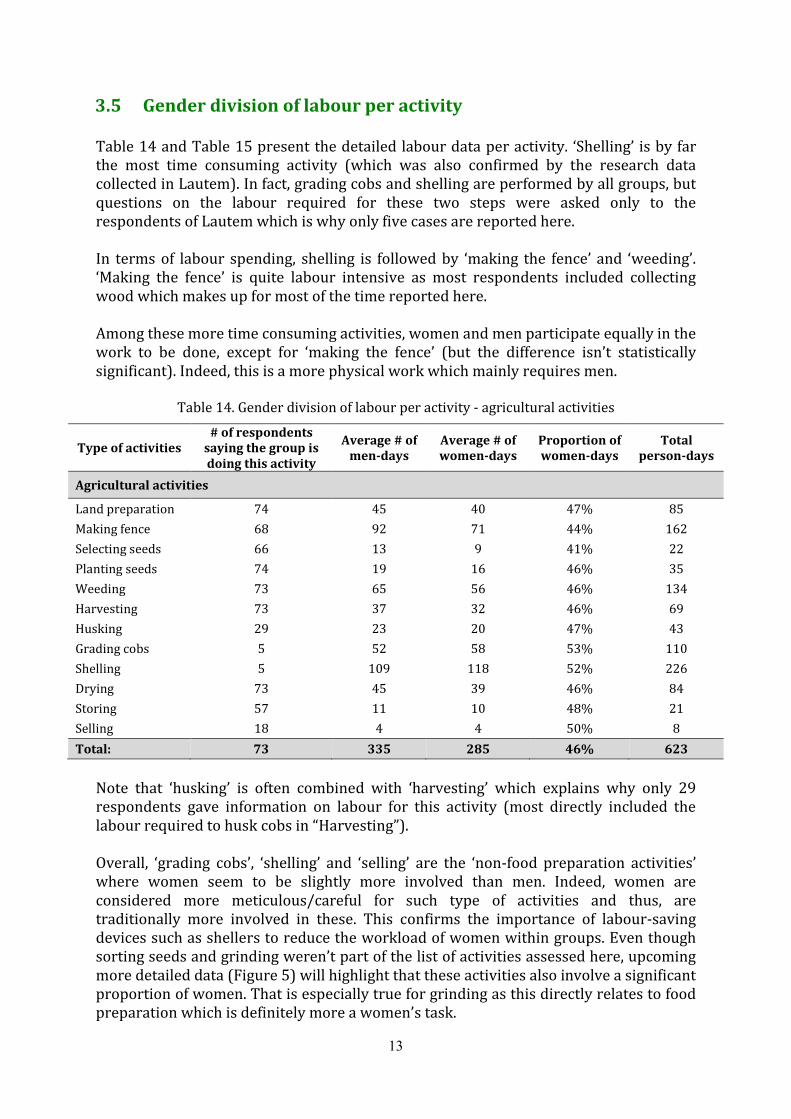
3.5 Genderdivisionoflabourperactivity Table 14 and Table 15 present the detailed labour data per activity. ‘Shelling’ is by far the most time consuming activity (which was also confirmed by the research data collected in Lautem). In fact, grading cobs and shelling are performed by all groups, but questions on the labour required for these two steps were asked only to the respondents of Lautem which is why only five cases are reported here. In terms of labour spending, shelling is followed by ‘making the fence’ and ‘weeding’. ‘Making the fence’ is quite labour intensive as most respondents included collecting wood which makes up for most of the time reported here. Among these more time consuming activities, women and men participate equally in the work to be done, except for ‘making the fence’ (but the difference isn’t statistically significant). Indeed, this is a more physical work which mainly requires men.
Table 14. Gender division of labour per activity - agricultural activities
Typeofactivities#ofrespondents
sayingthegroupisdoingthisactivity
Average#ofmen-days
Average#ofwomen-days
Proportionofwomen-days
Totalperson-days
Agriculturalactivities
Land preparation 74 45 40 47% 85
Making fence 68 92 71 44% 162
Selecting seeds 66 13 9 41% 22
Planting seeds 74 19 16 46% 35
Weeding 73 65 56 46% 134
Harvesting 73 37 32 46% 69
Husking 29 23 20 47% 43
Grading cobs 5 52 58 53% 110
Shelling 5 109 118 52% 226
Drying 73 45 39 46% 84
Storing 57 11 10 48% 21
Selling 18 4 4 50% 8
Total: 73 335 285 46% 623
Note that ‘husking’ is often combined with ‘harvesting’ which explains why only 29 respondents gave information on labour for this activity (most directly included the labour required to husk cobs in “Harvesting”). Overall, ‘grading cobs’, ‘shelling’ and ‘selling’ are the ‘non-food preparation activities’ where women seem to be slightly more involved than men. Indeed, women are considered more meticulous/careful for such type of activities and thus, are traditionally more involved in these. This confirms the importance of labour-saving devices such as shellers to reduce the workload of women within groups. Even though sorting seeds and grinding weren’t part of the list of activities assessed here, upcoming more detailed data (Figure 5) will highlight that these activities also involve a significant proportion of women. That is especially true for grinding as this directly relates to food preparation which is definitely more a women’s task.

14
Table 15. Gender division of labour per activity – food preparation activities
Typeofactivities#ofrespondents
sayingthegroupisdoingthisactivity
Average#ofmen-days
Average#ofwomen-days
Proportionofwomen-days
Totalperson-days
Foodpreparationactivitiesfor
Land preparation 39 4 14 78% 18
Fence making 30 5 27 84% 32
Seed selection 20 4 4 50% 8
Planting seeds 44 2 7 78% 9
Weeding 44 7 19 73% 26
Harvest 44 4 12 75% 15
Husking 15 3 12 80% 15
Grading cobs 5 4 13 76% 17
Shelling 5 1 56 98% 57
Drying 29 5 13 72% 18
Storing 11 1 4 80% 5
Selling 1 0 2 100% 2
Total: 74 16 54 77% 70
In regards to food-preparation, each group has its’ own way of functioning. In some groups, each worker brings his own food from home (not reported in this data). And in other groups, food is prepared collectively by a few members to feed the workers during the day (reported in Table 15). This mainly happens during planting, weeding and harvesting. According to this data, men also participate in cooking (23% on average) which sounds surprising in Timor Leste but might be partly true (men can help collecting wood to prepare the fire for cooking, or help cook the rice, etc.).
15
4. Accesstolaboursavingdevicesbygroupsandtheirmembers
4.1 DistributionoflaboursavingdevicestoCSPsandCSPGs 4.1.1 Numberofdevicesreceived
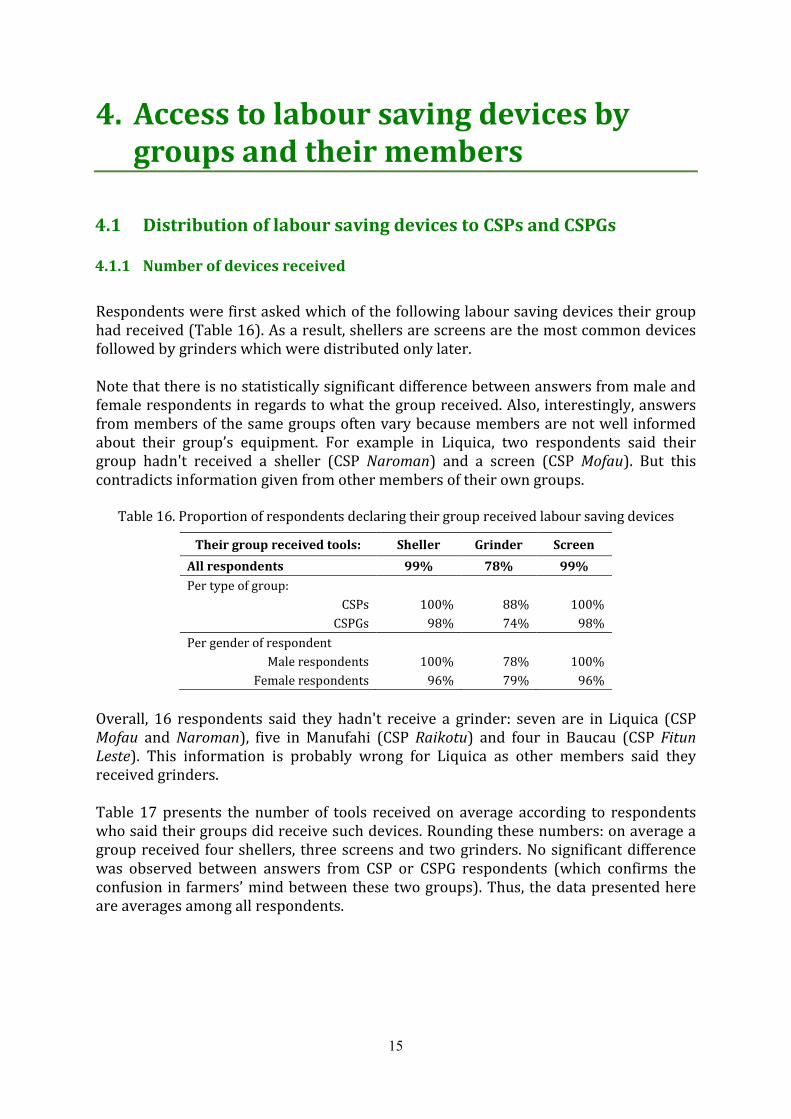
Respondents were first asked which of the following labour saving devices their group had received (Table 16). As a result, shellers are screens are the most common devices followed by grinders which were distributed only later. Note that there is no statistically significant difference between answers from male and female respondents in regards to what the group received. Also, interestingly, answers from members of the same groups often vary because members are not well informed about their group’s equipment. For example in Liquica, two respondents said their group hadn't received a sheller (CSP Naroman) and a screen (CSP Mofau). But this contradicts information given from other members of their own groups.
Table 16. Proportion of respondents declaring their group received labour saving devices
Theirgroupreceivedtools: Sheller Grinder Screen
Allrespondents 99% 78% 99%
Per type of group:
CSPs 100% 88% 100%
CSPGs 98% 74% 98%
Per gender of respondent
Male respondents 100% 78% 100%
Female respondents 96% 79% 96%
Overall, 16 respondents said they hadn't receive a grinder: seven are in Liquica (CSP Mofau and Naroman), five in Manufahi (CSP Raikotu) and four in Baucau (CSP Fitun Leste). This information is probably wrong for Liquica as other members said they received grinders. Table 17 presents the number of tools received on average according to respondents who said their groups did receive such devices. Rounding these numbers: on average a group received four shellers, three screens and two grinders. No significant difference was observed between answers from CSP or CSPG respondents (which confirms the confusion in farmers’ mind between these two groups). Thus, the data presented here are averages among all respondents.
16
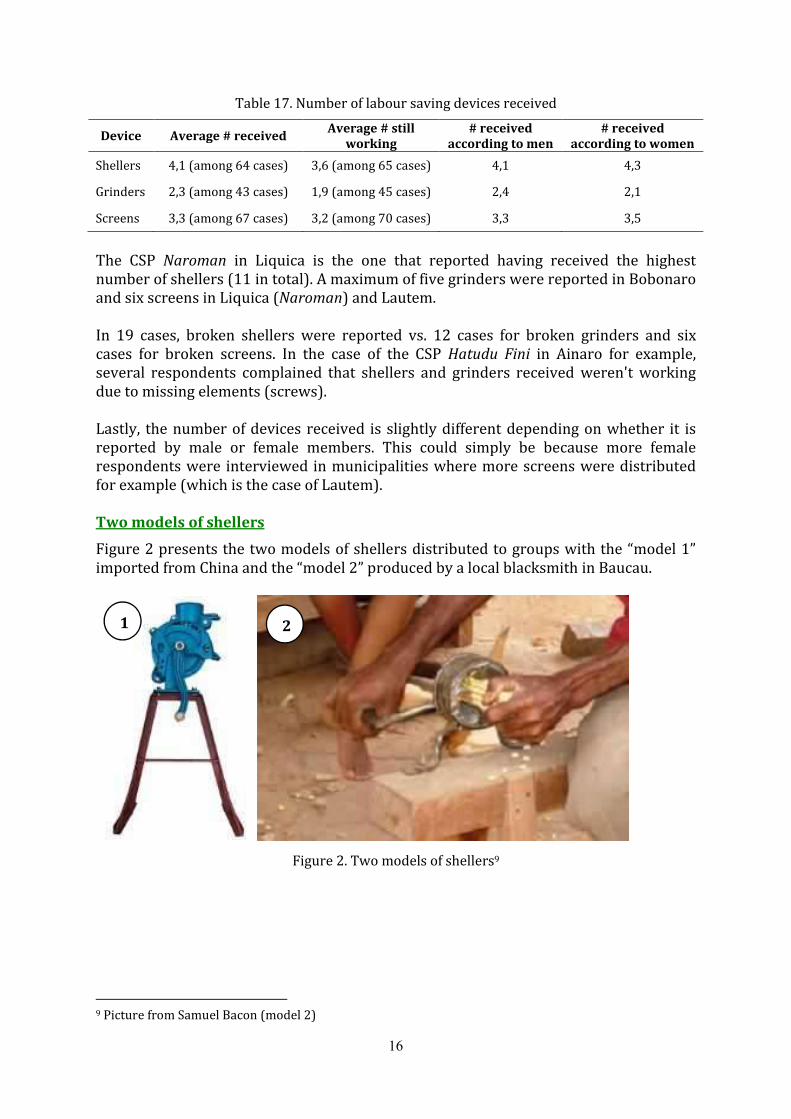
Table 17. Number of labour saving devices received
Device Average#receivedAverage#still
working#received
accordingtomen#received
accordingtowomen
Shellers 4,1 (among 64 cases) 3,6 (among 65 cases) 4,1 4,3
Grinders 2,3 (among 43 cases) 1,9 (among 45 cases) 2,4 2,1
Screens 3,3 (among 67 cases) 3,2 (among 70 cases) 3,3 3,5
The CSP Naroman in Liquica is the one that reported having received the highest number of shellers (11 in total). A maximum of five grinders were reported in Bobonaro and six screens in Liquica (Naroman) and Lautem. In 19 cases, broken shellers were reported vs. 12 cases for broken grinders and six cases for broken screens. In the case of the CSP Hatudu Fini in Ainaro for example, several respondents complained that shellers and grinders received weren't working due to missing elements (screws). Lastly, the number of devices received is slightly different depending on whether it is reported by male or female members. This could simply be because more female respondents were interviewed in municipalities where more screens were distributed for example (which is the case of Lautem). Twomodelsofshellers
Figure 2 presents the two models of shellers distributed to groups with the “model 1” imported from China and the “model 2” produced by a local blacksmith in Baucau.
Figure 2. Two models of shellers9
9 Picture from Samuel Bacon (model 2)
1 2

17
According to Table 18, about half of the respondents said their group received both types of shellers but overall, more "model 1” shellers were distributed.
Table 18. Receiving both models of shellers
"Model1" "Model2"
Proportion of respondents 89% 60%
Average # of shellers received 2,9 2,7
Average # of shellers still working 2,5 2,2
Among those who received both models, 71% said they preferred the "model 1" for different reasons. From most to least common reasons: (1) faster, (2) easy to use/not tiring to use, (3) maize grains do not disperse during shelling. 4.1.2 Sourceofdevicesandyearofdistribution
As shown in Table 19, most respondents are well informed on the source of the devices received by the group: nearly all said MAF/SoL distributed the tools.
Table 19. Source of devices distributed
Device MAF/SoL NGO Don'tknow
Sheller (73 cases) 96% 1% 3%
Grinder (58 cases) 90%
10%
Screens (73 cases) 97%
3%
In Table 20, it appears that about three quarters of the respondents said their groups received the devices in 2014, which suggests they should have used it at least once (or twice) since these were distributed and therefore should be able to provide some feedback about its impact on labour. Note that two respondents said their group received grinders in 2013 which isn't possible (first distributions of grinders happened in 2014). Also, in several cases, devices were distributed before 2015 but not all members were aware of it as they didn’t use it until 2015. Thus they told enumerators devices were distributed in 2015.
Table 20. Year of distribution
Device 2013 2014 2015
Sheller (73 cases) 3% 81% 16%
Grinder (58 cases) 2% 72% 26%
Screens (73 cases) 4% 77% 19%

18
4.2 Useandhandlingofthedevicesdistributed 4.2.1 Useofthelaboursavingdevicesbygroups
The devices that are the most used are the screens to sort kernels (97%), followed by the shellers (89%, see Table 21).
Table 21. Use of the devices by the groups
Device Groupisusing
thedeviceGroupisnotusing
thedevice
Sheller (72 cases10) 89% 11%
Grinder (57 cases) 61% 39%
Screens (72 cases) 97% 3% (2 cases)
All the respondents who said their group is not currently using the different devices also specified that their group had never used it at all, even just after receiving it. Grinders are the devices that were the least used due to the following reasons:
In Ainaro, all respondents said grinders were out of order (six cases, see part 4.1.1).
In Aileu, some respondents said they haven't used grinders in their CSPG because these were stored at the CSP’s office which is far (four cases among ten in Aileu).
In Liquica, some respondents said the number of grinders distributed wasn't sufficient so their CSPG were still waiting their turn to use it (four cases among 29 in Liquica).
In Baucau, the main reason for not using it was because maize was not dry enough (three cases among 11 in Baucau).
Similar reasons were given by the eight and two farmers who said their group isn’t using shellers and screens respectively. Respondents were also asked if they, themselves, used the different devices received by the group in order to make sure they would be able to answer accurately to the following questions in regards to the use of these devices. Only two persons said they had never used the sheller and one of them had never used the screen. These two persons were not asked the following questions specific to the tools they had never used.
10 All proportions in this table are calculated among respondents who declared their group received these devices, i.e. 72, 57 and 72 persons for shellers, grinders and screens.

19
As shown in Table 22, at the time of data collection, these devices had been used only during 1-2 cycles which is coherent with the year these devices were distributed. The two persons who mentioned four cycles probably referred to the number of times they used the devices themselves and not the number of cycles the group as a whole used these.
Table 22. Number of cycles labour saving devices were used
Device 1cycle 2cycles 4cycles
Sheller (63 cases) 48% 51% 2% (1 case)
Grinder (35 cases) 71% 26% 3% (1 case)
Screen (70 cases) 53% 47%
4.2.2 Controloverthedevicesbygroupmembers
Respondents were also asked who is usually responsible for the devices distributed (Table 23). As expected, men are usually given the responsibility for these devices, mainly because they are the group leaders. All the respondents who said a woman is responsible for these devices belonged to groups where the leader is a woman (CSP of Bobonaro, one CSP in Ainaro, and one of the CSPGs of the Naroman CSP).
Table 23. Gender of the person responsible of the devices distributed
Device Men Women Men&women
Sheller (64 cases) 50% 9% (6 cases) 41%
Grinder (35 cases) 51% 11% (4 cases) 37%
Screen (70 cases) 54% 6% (4 cases) 40%
Along the same line, respondents were asked if they had been explained how to deal with the shellers or grinders in case they jammed up (Table 24). Overall, there seems to be a lack of information by MAF SEOs to farmers about how to deal with such situations: only 24% of respondents said they would know what to do in case a sheller is out of order, and 6% in case a grinder is out of order. But there is no significant discrepancy between men and women members in regards to this.
Table 24. Explaining how to repair broken devices
Wereyouexplainedhowtorepairbrokendevices?
Sheller Grinder
Yes (all cases) 24% (15/62 cases) 6% (2/35 cases)
Among women respondents 26% 8%
Among men respondents 23% 4%
20
1: Pound and hollow log
2: Sorting seeds by hand (in the front)
3: Powered grinder/grinding machine
21
3
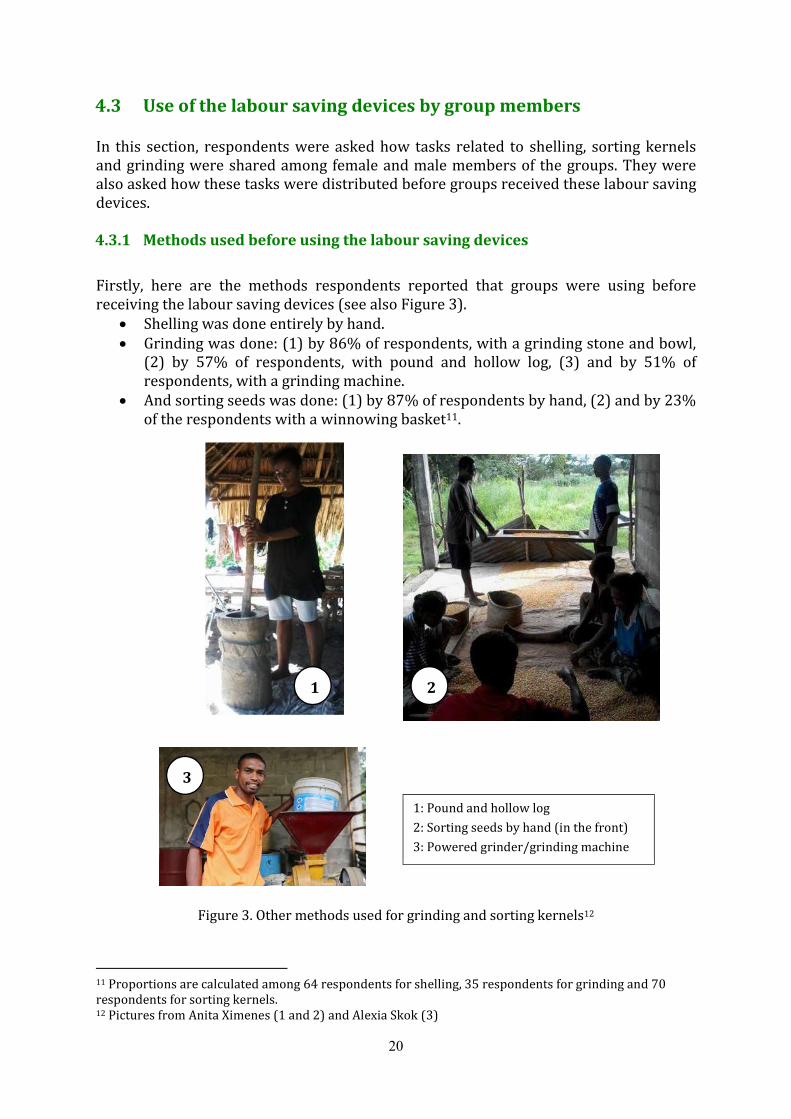
4.3 Useofthelaboursavingdevicesbygroupmembers In this section, respondents were asked how tasks related to shelling, sorting kernels and grinding were shared among female and male members of the groups. They were also asked how these tasks were distributed before groups received these labour saving devices. 4.3.1 Methodsusedbeforeusingthelaboursavingdevices
Firstly, here are the methods respondents reported that groups were using before receiving the labour saving devices (see also Figure 3).
Shelling was done entirely by hand. Grinding was done: (1) by 86% of respondents, with a grinding stone and bowl,
(2) by 57% of respondents, with pound and hollow log, (3) and by 51% of respondents, with a grinding machine.
And sorting seeds was done: (1) by 87% of respondents by hand, (2) and by 23% of the respondents with a winnowing basket11.
Figure 3. Other methods used for grinding and sorting kernels12
11 Proportions are calculated among 64 respondents for shelling, 35 respondents for grinding and 70 respondents for sorting kernels. 12 Pictures from Anita Ximenes (1 and 2) and Alexia Skok (3)

21
4.3.2 Accesstothelaboursavingdevicesbymaleandfemalemembers
Specificgroupofmembersallowedtousethedevicesvs.allmembers
First respondents were asked if any member of the group is allowed to use these devices, or if only a specific group of persons are the ones usually using these. The majority of respondents said all group members are allowed to use the devices to process the maize of the group. Only three respondents said shellers can be used mainly by groups of maximum four men designated by the members themselves. Similar statements were made by five respondents for the grinders. The main reason for assigning only some specific persons to use the shellers and grinders is the lack of devices, and the fact that some groups have access to powered grinders which they prefer (for example in the Lautem CSP). In such cases, it is important to ensure that both men and women can use these tools. Lastly, just one respondent said screens could only be used by a specific group of persons (mainly women). The same question was asked for the period before groups received these devices: were all members participating in shelling, grinding and sorting seeds, or only some specific persons? Interestingly, a slightly higher number of members (one, twelve and two respectively) said shelling, grinding and sorting kernels was mainly the task of a specific group of persons. And in more than 50% of these cases, the "specific groups" in charge of these activities were mainly composed of women (especially for grinding). This suggests that, before receiving these tools, men were not as much involved in these activities (especially in grinding).
Figure 4. Maize grinded with the grinding machine distributed to groups13
13 Picture by Yessy Octaviana Betty.
22
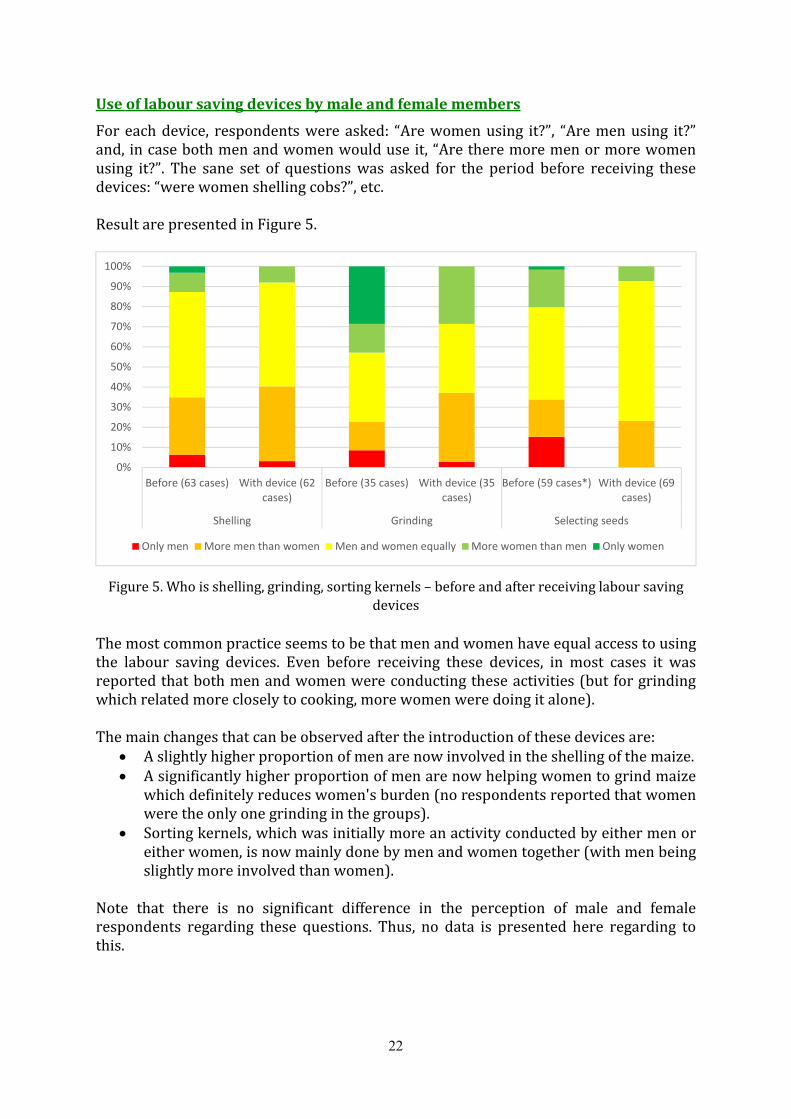
Useoflaboursavingdevicesbymaleandfemalemembers
For each device, respondents were asked: “Are women using it?”, “Are men using it?” and, in case both men and women would use it, “Are there more men or more women using it?”. The sane set of questions was asked for the period before receiving these devices: “were women shelling cobs?”, etc. Result are presented in Figure 5.
Figure 5. Who is shelling, grinding, sorting kernels – before and after receiving labour saving
devices
The most common practice seems to be that men and women have equal access to using the labour saving devices. Even before receiving these devices, in most cases it was reported that both men and women were conducting these activities (but for grinding which related more closely to cooking, more women were doing it alone). The main changes that can be observed after the introduction of these devices are:
A slightly higher proportion of men are now involved in the shelling of the maize. A significantly higher proportion of men are now helping women to grind maize
which definitely reduces women's burden (no respondents reported that women were the only one grinding in the groups).
Sorting kernels, which was initially more an activity conducted by either men or either women, is now mainly done by men and women together (with men being slightly more involved than women).
Note that there is no significant difference in the perception of male and female respondents regarding these questions. Thus, no data is presented here regarding to this.
0%
10%
20%
30%
40%
50%
60%
70%
80%
90%
100%
Before (63 cases) With device (62cases)
Before (35 cases) With device (35cases)
Before (59 cases*) With device (69cases)
Shelling Grinding Selecting seeds
Only men More men than women Men and women equally More women than men Only women

23
Difficultytousethesedevicesforfemalemembers
Farmers were also asked if they thought women would be able to use the device without the help of men. Only three respondents said “No” for the sheller, and one said “No” for the grinder. Note that three of these respondents were men. In conclusion, there seems to be no physical barrier for women to use these tools. Along the same line, farmers were asked how long on average, do they usually operate the device before taking a break. Results are presented in Table 25. Note that none of these durations were verified. It is only based on farmer's perception/estimations.
Table 25. For how long are farmers able to use these devices before taking a break
DeviceAll
respondentsAmongmale
respondentsonlyAmongfemale
respondentsonly
Shellers (62 cases, including 43 men) 33 min 35 min 28 min
Grinders (35 cases including 23 men) 27 min 26 min 27 min
Screens (69 cases including 47 men) 24 min 21 min 31 min
In general, shellers are the devices that can apparently be used for the longest time without taking a break (33 minutes) and screens for the shortest durations (24 minutes). Note that two persons have to operate the screen at the same time14. Even though the data is also presented separately for men and women respondents, statistical tests (one-way ANOVA) highlighted that there is no significant difference between men and women regarding how long they can use these devices 4.3.3 Perceptionoftheimpactoftheselaboursavingdevicesonthegroups
The respondents were asked a set of questions related to various impacts of the introduction of these devices in the group, and on their work. Impactontimespent
The first impact question was: “Compared to before you used the sheller, do you (personally) spend more or less time than before shelling?” (example for the sheller). Likert scale response options were then proposed to respondents: (1) I spend much more time now, (2) I spend more time now, (3) Same as before, (4) I spend less time now, (5) I spend much less time now, (6) I don't know.
14 Some groups are experimenting with a new method. Instead of two persons carrying the screen at both ends, the screen is hung up at both ends over a beam, and swung back and forth. This can be done by one person alone. This method also has the advantage that the weight of the screen and the maize does not have to be carried, and all the effort is only needed to swing the screen back and forth.

24
Results are presented in Figure 6. Note that for all the charts of these impact questions, answers are presented for men and women respondents separately. In the legend, colours on the left represent answers from women respondents (with spotted pattern), and on the right from men respondents (plain colours).
Figure 6. Impact on time spent according to women and men respondents
Overall, the different devices were all perceived as decreasing the time spent on these different activities, with shellers and screens having a more positive impact than grinders. Three men from the CSP Kokoroek in Aileu mentioned spending more time grinding maize now than before. Indeed, this CSP has also access to a powered grinder which can grind larger quantities than the grinders distributed by MAF/SoL. For probably the same reasons, six respondents said they spend as much time as before on grinding. Lastly, even though data presented in this chart shows answers from men and women respondents separately, statistical analysis concluded that there isn't a significant difference between men's and women's perception on this question. This could be because the sample size, especially for women respondents, wasn't large enough. Respondents who said they now spend less time on these activities were asked what they did with the time saved. The results are presented in Table 26.
Table 26. Use of the time saved
DeviceIdootherwork
forthegroupIdootherworkonmyownfarm
Idootherworkformyfamily/house
Itakerest
Sheller (60 cases) 82% 7% 7% 22%
Grinder (26 cases) 81% 4% 8% 19%
Screen (67 cases) 78% 2% 6% 28%
0%
20%
40%
60%
80%
100%
Shellers (62 cases including19 women)
Grinders (35 cases including12 women)
Screens (69 cases including 22women)
Pro
po
rtio
n o
f re
spo
nd
ents
Spend much more time now Spend much more time nowSpend more time now Spend more time nowSame as before Same as beforeSpend less time now Spend less time nowSpend much less times now Spend much less times now

25
Overall, most respondents said they did other work for the group. In the case of grinders, this observation is especially true among men who said unanimously that they used this saved time to do other tasks for the group (vs. only half of women respondents). In other cases, no statistically significant difference was found between men and women's answers even though in general men tend to use this extra time to work in the group, and women to work at home for the family or relax. Impactonthedifficultyofthetask
The second impact question was about the difficulty of shelling, grinding and sorting seeds since they used the devices. Respondents were asked if, compared to before they used the sheller for example, has shelling become: (1) much more difficult than before, (2) more difficult than before, (3) as difficult as before, (4) easier than before, (5) much easier than before. Results are presented in Figure 7. A very large majority of respondents said all three devices make shelling, grinding and sorting easier than before. But again, grinders are the devices for which a slightly higher number of respondents do not see significant improvements: one respondent said it is more difficult to grind now and five others said the difficulty is the same now. Note that, as for the previous impact question, there is no significant difference between men and women answers.
Figure 7. Impact on the difficulty of the tasks according to women and men respondents
0%
10%
20%
30%
40%
50%
60%
70%
80%
90%
100%
Shellers (62 cases including19 women)
Grinders (35 cases including12 women)
Screens (69 cases including 22women)
Much more difficult now Much more difficult now More difficult now
More difficult now Same as before Same as before
Easier now Easier now Much easier now
Much easier now
26
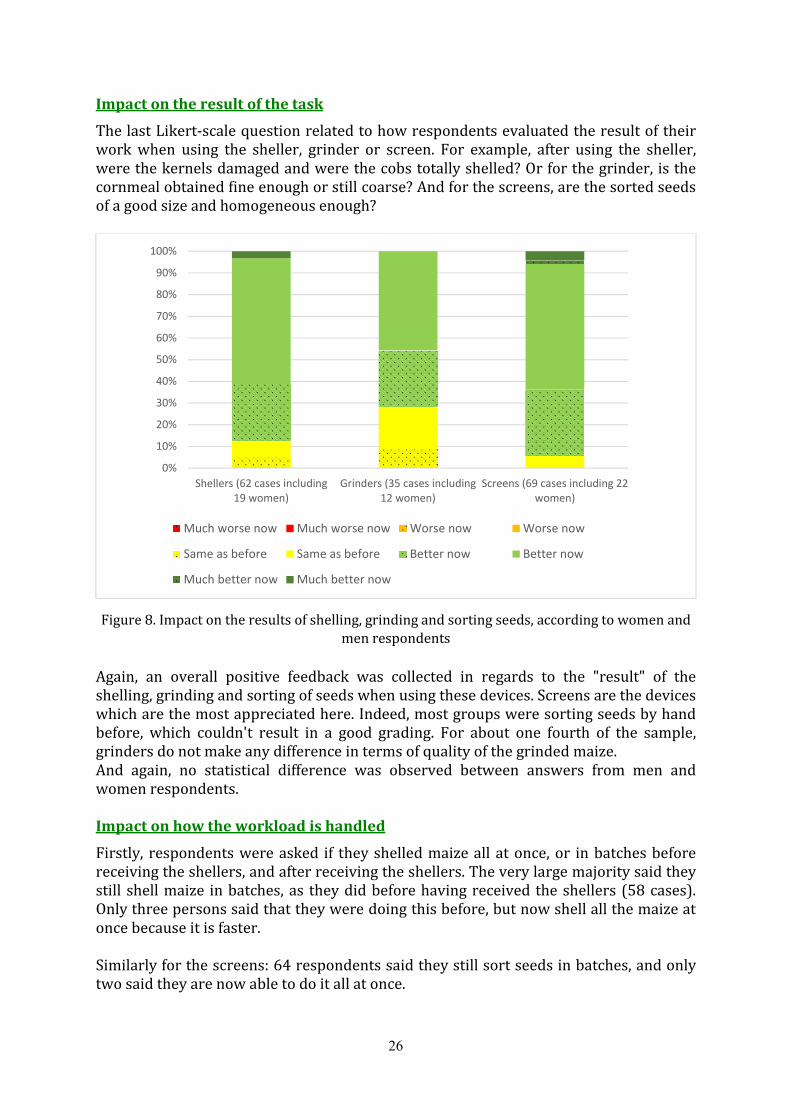
Impactontheresultofthetask
The last Likert-scale question related to how respondents evaluated the result of their work when using the sheller, grinder or screen. For example, after using the sheller, were the kernels damaged and were the cobs totally shelled? Or for the grinder, is the cornmeal obtained fine enough or still coarse? And for the screens, are the sorted seeds of a good size and homogeneous enough?
Figure 8. Impact on the results of shelling, grinding and sorting seeds, according to women and men respondents
Again, an overall positive feedback was collected in regards to the "result" of the shelling, grinding and sorting of seeds when using these devices. Screens are the devices which are the most appreciated here. Indeed, most groups were sorting seeds by hand before, which couldn't result in a good grading. For about one fourth of the sample, grinders do not make any difference in terms of quality of the grinded maize. And again, no statistical difference was observed between answers from men and women respondents. Impactonhowtheworkloadishandled
Firstly, respondents were asked if they shelled maize all at once, or in batches before receiving the shellers, and after receiving the shellers. The very large majority said they still shell maize in batches, as they did before having received the shellers (58 cases). Only three persons said that they were doing this before, but now shell all the maize at once because it is faster. Similarly for the screens: 64 respondents said they still sort seeds in batches, and only two said they are now able to do it all at once.
0%
10%
20%
30%
40%
50%
60%
70%
80%
90%
100%
Shellers (62 cases including19 women)
Grinders (35 cases including12 women)
Screens (69 cases including 22women)
Much worse now Much worse now Worse now Worse now
Same as before Same as before Better now Better now
Much better now Much better now

27
For grinding, the question was asked differently. They were asked for how many days did they prepare cornmeal in one go, before and after having received the grinders. As for other devices, apparently the grinder hasn't changed the "rhythm of work" of members: 23 said they usually grind maize for one day at a time. Only three said they are now grinding more maize at once now than before (for three to five days instead of one day before). The main reason, which explains why groups did not change the way they handle their workload is the fact that the number of devices distributed is quite limited in comparison with the number of members and therefore, not all members can access these tools. Otherfeedbackfromrespondents
To end this section on impact, respondents were asked an open-ended question about each tool: "Is there anything you would like to add about the sheller/grinder/screen: did you like it or not, any problems to report, etc." The very large majority of the statements were not directly related to the impact but was to request more shellers/grinders/screens to be distributed. Some information may however be highlighted here: the fact that the number of devices distributed should relate to the size of the group in terms of number of CSPGs and members and quantity of maize harvested. Eight persons also said the bigger model of sheller ("model 1") was better mainly because it is fixed onto a stand. Six persons said they would prefer a powered grinder because it grinds larger volumes. And finally, three persons said they preferred the screens with the bigger diameter (8mm instead of 7mm). The only real impact-related comments were that these devices helped doing the work faster: five cases for the shellers, eight cases for the screens, and only one case for the grinder. 4.3.4 Useofothermethodsinparallel
Finally, respondents were asked if the group also used other methods to shell/grind/sort seeds besides using the tools they were given. Table 27 shows how many answered yes to this question and which are the other methods used.
Table 27. Proportion of respondents saying the groups still use another method
DeviceUsingother
methodWhichothermethod(canusemorethanonemethod)?
Sheller (62 cases) 87% All of these shell the rest of the maize by hand
Grinder (39 cases) 91% 84% of these grind maize with a grinding stone and bowl, 66% with a pound and hollow log, and finally 53% with a powered grinder.
Screen (69 cases) 90% 97% of these also sort seeds by hand and 10% with a winnowing basket

28
The first observation is that most respondents said their group continued using other methods besides using the sheller/grinder/screen. For all these respondents (besides three cases for the grinders), the only reason for the group to also use another method was the limited number of labour saving devices the group had. For the grinders, three respondents said they also used another method because it was too tiring to use the grinder they received from MAF-SoL (two of these use a powered machine and the other one a grinding stone and bowl). Following this, respondents were asked how much of the total maize they had to process was indeed processed with other methods than with the labour saving devices they were given (Table 28).
Table 28. Proportion of the total maize processed with other methods
Proportionofthetotalmaizeprocessedwiththeothermethod
Shelling(54cases)
Grinding(32cases)
Sorting(62cases)
Little 11% 3% 13%
Less than half 32% 22% 44%
Same 32% 31% 29%
More than half 4% 3% 5%
Most 22% 41% 10%
The above data is coherent with the observations made earlier:
Among the three devices, screens are the ones for which the highest proportion of respondents said most of the maize is processed with it (in comparison to other methods used to sort kernels). They were also the devices for which men and women work together the most.
And grinding is the activity for which the highest proportion of respondents said that nearly all the maize was grinded without the grinders from MAF/SoL.

29
4.4 Repairinglaboursavingdevices A number of questions were also asked to assess how the group deals with broken devices as this is critical to ensure the long term use of these devices within groups. First, farmers were asked who usually pays to repair the group's equipment when it's out of order. As a result, 80% said they usually use the group’s money, and only 20% mentioned member’s personal money15. This suggests groups have enough fund to deal with such problems. Still, farmers’ answers should be interpreted carefully as several respondents from the same groups answered different things.
Figure 9. Group members during a demonstration of the maize grinder
Note that there is no significant difference between answers from male and female members on this question. Secondly, respondents were asked if any of this equipment had been broken already, and if yes, had it been repaired (Table 29).
Table 29. Broken and repaired devices
DeviceYes,somehavebeenbroken.
Yes,theyhavebeenrepaired.
Sheller 31% (22 cases) 6/22 cases
Grinder 19% (10 cases) 1/10 cases
Screen 7% (5 cases) 1/5 cases
15 Proportions calculated among 56 valid answers.

30
Screens are overall the devices that have been the least damaged (very basic tool, no mechanical part). According to about one third of the respondents, shellers were broken which is quite significant, especially given most groups complain about not having enough devices. But unfortunately, only a very small proportion of the broken devices were repaired. It is definitely worthwhile to explore the reasons for this situation.
4.5 Feedbackfromgroupleaders Overall, 28 group leaders were interviewed, CSPs and CSPGs combined. A set of specific questions were asked to such respondents as they were expected to have a better overview of the impact labour saving devices had on their groups. Beingconsultedandsharinginformationwithmembers
Among the 28 group leaders interviewed, 64% said they had been consulted before receiving these tools. There is no major difference between men or women leaders neither between CSP or CSPG leaders in regards to this question. In most of these cases, the topic discussed during these consultations was about which equipment they would receive and how these worked. All of these group leaders (besides one) also shared this information with their members (men and women) before receiving these tools. Buyingnewequipment
Eight group leaders among the 28 interviewed said they planned to buy new equipment for their group. Two plan to buy more drums, one plans to buy more grinders, another one plans to buy more shellers. Five others said they still need to consult with their members to decide what equipment to buy. Generalfeedbackontheimpactoflaboursavingdevices
About half of the group leaders repeated that the main benefit of these tools was that members were able to work faster. Six said working with these new equipment also made the work easier (less difficult/tiring). And five gave a general positive feedback about the tools without giving more details. Finally, two specifically talked about the benefits of using drums to prevent seeds from being infested by weevils.

31
5. Groups’accesstodrums A set of questions were also asked about drums that groups received from MAF/SoL or purchased themselves. This chapter summarizes the results obtained.
5.1 Generalinformation 84% of the respondents declared their group received drums. On average, groups received 12 drums16: 22 among respondents who talked about their CSP, and seven among those who talked about their CSPG. A maximum of 103 drums was reported by the leader of the CSP Naroman in Liquica. In fact, in some cases, respondents said each member received one drum (Baucau, CSP Monabulat), others said they had purchased many drums through the IFAD program (up to 72 drums reported for the CSP Lacabasi in Bobonaro).
Figure 10. Source of drums and year of receiving drums
5.2 Useofthedrumsbymenandwomen 95% of the respondents who said their groups received drums said they now use the drums. Among the three respondents who said they aren't using the drums now, one said they are going to use it as soon as the maize is dry enough. The other two didn't give any explanation. Questions were then asked about the use of the drums by men and women members of the groups (Table 30).
16 Answers available for 48 respondents only).
86%
7%
13%
Soure of drums
MAF-SoL
NGOs
Other (mainlyIFAD)
2% 8%
61%
29%
Year receiving drums
2012 2013 2014 2015

32
Table 30. Use of drums by men and women members
Percentagesamongallrespondents(amongwomen/amongmen)
Women Men Men&women
Who usually fills in the drum? 13% (6%/16%)
87% (94%/84%)
Who usually takes seeds out of the drum?
2% (6%/0%)
33% (35%/32%)
65% (59%/68%)
According to two-thirds or more of the respondents, both men and women fill the drum and take out seeds of it. Others said it is only men who do these tasks. The differences of answers between men and women respondents isn't statistically significant.
Table 31. Women able to use drums without the help of men
Yes(amongallrespondents)
Yes(amongwomenrespondents)
Yes(amongmenrespondents)
Are women able to fill in the drum without help of men?
95% 100% 92%
Are women able to take seeds out of the drum without help of men?
38% 18% 47%
Table 31 shows that women do not have equal access to drums when seeds (or grains for food) have to be taken out of it. Indeed, overall only 38% of the respondents said women can take seeds out of the drum without the help of a man. And when looking only at female respondents (who most likely have a more objective opinion on this than men), it seems that even less women can do this without the help of a man. Indeed, in order to take out large amount of seeds from the drums, farmers need to tilt the drums, which is very difficult when the drum is full.
5.3 Generalfeedback At the end of this section, respondents were asked if they wanted to share any other observations related to drums. Again, most feedback was that more drums are still needed (but some mentioned they would buy them themselves). Only five said drums were useful to prevent maize from being infested by weevils. Two said they preferred silos above drums, and another one said large silos aren't easy to use.
33
6. Personalmaizeproduction The last section of the questionnaire was about farmer's personal maize production. Most results in this section are presented among a maximum of 41 respondents which is the number of respondents who also grow maize on their own farm.
6.1 Generalinformationonpersonalmaizeproduction Among the 74 respondents interviewed, 55% (i.e. 41 cases) said they grew maize on their own farm. This is much lower than the national proportion of farmers growing maize, but that is mainly because most respondents spend already a lot of time working for the groups' productions and therefore do not have time to grow maize on their personal plots as well. Some farmers, as in Baucau, prefer to use their spare time to grow rice for their family rather than maize. Note that there is no statistically significant difference between men and women members interviewed: 60% among men, 46% among women. All 41 respondents who grow maize on their personal farms (besides one) grow only one cycle each year and grow it on one plot only. On average, they reported growing about 1.76 ha which seems quite large. When excluding extreme cases that are probably wrong (25 ha per persons), this average goes down to 0.6 ha which is a standard size for a farming family in Timor-Leste. Also on average among the 38 cases who were able to estimate their total production from the last cycles, the average production was 155 kg17.
6.2 Aremembersoroutsidefarmersallowedtoborrowthegroups’
tools? 44% of the respondents answered “yes” to the question “are members allowed to borrow shellers for their personal production?”. Similarly, 41% answered “yes” for grinders and 45% said “yes” for screens. According to all respondents (besides one), both men and women usually borrow these equipment. The only person who answered differently said men mostly borrow these tools. Nearly all respondents said these devices are lent for free. Only one CSPG leader in Baucau said members had to pay 1$ if they wanted to borrow a sheller, a grinder or a screen for their personal use, but other members from his CSPG said they could borrow these tools for free.
17 Note that none of these quantitative estimations were verified

34
Respondents who said members were not allowed to borrow these devices said that was mainly because the group didn't have enough devices to process its own production (94% out of 33 responses). Another 46% said tools were not lent to members simply because members themselves are not interested in borrowing these equipment. Only three respondents said people outside the groups could also borrow these tools.
6.3 Respondentsborrowinggroups’equipmentforpersonalmaize
production First, farmers were asked which of the following equipment they use for their maize production (Table 32).
Table 32. Equipment used by respondents for maize production
Equipment%respondentsborrowingit:
SourceoftheequipmentborrowedAmongallrespondents(41)
Amongwomen(11)
Amongmen(30)
Tractor 42% 27% 47% Farmers use MAF's tractor and pay a fee per hectare (as the group does)
Hand tractor 5% 9% 3% Farmer's own hand-tractor (obtained through NGOs)
Sheller 2% 0 3% Borrowed from the group
Grinder 0 0 0
Drum 5% 0 7% Borrowed from the group (one case), own drum (one case)
Screen 2% 0 3% Borrowed from the group
Note that 54% out of the 41 respondents growing maize do not use any of the above equipment. The most commonly used equipment are the MAF’s tractors. Surprisingly, even though about 40% of respondents said borrowing labour saving devices from the groups is possible (part 6.2), only one person (a man) said he actually borrowed a sheller, a screen and a drum from his CSPG to use for his personal production (CSPG Kokoroek Manufoni in Aileu). This member said he borrowed the sheller of the group once only for two days. He used it to shell himself part of his production. He says that usually, both male and female members of the family shell maize by hand but that takes longer than with the sheller. The farmer had difficulties answering the question on how much time it took to shell ten cobs of maize with or without the sheller, but said anyway it was faster when using the sheller. This same respondent also borrowed the group's screen for one day only because it was faster. He said both men and women of his family used the screen. They were able to sort about 25 kilos of seeds while they usually sort about 20 kg of seeds by hand in a day. The respondent also estimated it took about five minutes to sort one kilogram of seeds with the screen and ten minutes to sort the same quantity by hand.

35
6.4 Respondents’perceptiononthedifficultytoperform
housekeepingandagriculturalactivities In this section, the respondents were asked a number of questions on housekeeping and agricultural activities. For each activity, respondents had to say if they perceived it as an easy, normal or difficult activity. From there, an average score was calculated for each of these tasks based on the following scale: 1 point for “easy”, 2 for “normal” and 3 for “difficult”. Average scores among all 41 respondents growing maize on their farm are presented in Figure 11.
Figure 11. Difficulty of conducting housekeeping and agricultural activities
Overall, both men and women agree that agricultural activities are more tiring than housekeeping tasks. But regarding housework, about one third of the men consider these not to be heavy works while nearly most women agree that these are heavy/tiring activities. This is particularly true for the activity "laundry, washing-up" for which there is a statistically significant difference between answers from men and women: score of 2.7 for men vs 3 for women. This can be perceived as a sign of disregard of housework by men in comparison to productive activities such as farming.
0
0.5
1
1.5
2
2.5
3
Takingwater
Collectingfire wood
Cooking Laundry,washing up
Ploughing Weeding Take careof animals
Harvestmaize
Housekeeping tasks Agricultural activities
Average score
All respondentsFemale respondents onlyMale respondents only

36
7. Conclusions Overall, gender division of labour seems to be very much balanced: 49% of the total work to be performed is conducted by women members (when including food preparation for workers in the field). But shelling and grinding are among the activities that involve a slightly higher proportion of women. And sorting seeds is a meticulous task which takes a lot of time for both men and women members of CSPs and CSPGs. This confirms the importance of labour-saving devices such as shellers, grinders and screens to reduce the workload of women within groups. Mainly a male dominated control over the labour saving devices distributed
“Control” here refers mainly to the person who is responsible to store, maintain and decides how the tool will be used. The survey revealed an important gender discrepancy in regards to the control over these tools. Indeed, in most cases, men are responsible for such tools, mainly because they are the group leaders. About 10% only of the respondents said a woman is responsible for these devices, and that is in groups where the leader is a woman (CSP of Bobonaro, one CSP in Ainaro, and one of the CSPGs of the Naroman CSP). Still, the survey pointed out that there is no discrimination between men and women members in regards to who received information on how to repair those devices. Gender balanced access to the tools and positive impact on labour division
This is probably the most significant gender impact highlighted through this survey: the introduction of these tools has helped creating a more gender balanced division of labour for the three specific tasks of shelling, sorting seeds and grinding. Indeed, the most common practice is for men and women to have equal access to these labour saving devices and in nearly all cases, it was reported that women could use all three devices without requiring help of men. In terms of the use of the tools, it appears that a significantly higher proportion of men are helping women to grind maize since the group received the grinders, which definitely reduces women's burden. Also, a slightly higher proportion of men are now involved in the shelling of the maize. And finally, sorting kernels, which was initially more an activity conducted by either men or women, is now mainly done by men and women together. Drums were also distributed to groups to store maize. If these devices are well appreciated by all farmers, they aren’t as easy to use for women as for men when having to take out large volumes of maize out of the drums. An overall very positive impact but still limited due to the insufficient number of tools distributed
Overall, all three devices were very much satisfying for both men and women respondents in regards to the time saved, their ease of use and the results obtained. Especially, screens were very much appreciated as sorting kernels is traditionally done by hand which is very time consuming. Only grinders were a bit less appreciated, mainly because some groups also use powered grinders which can grind large quantities and are obviously less tiring to use.
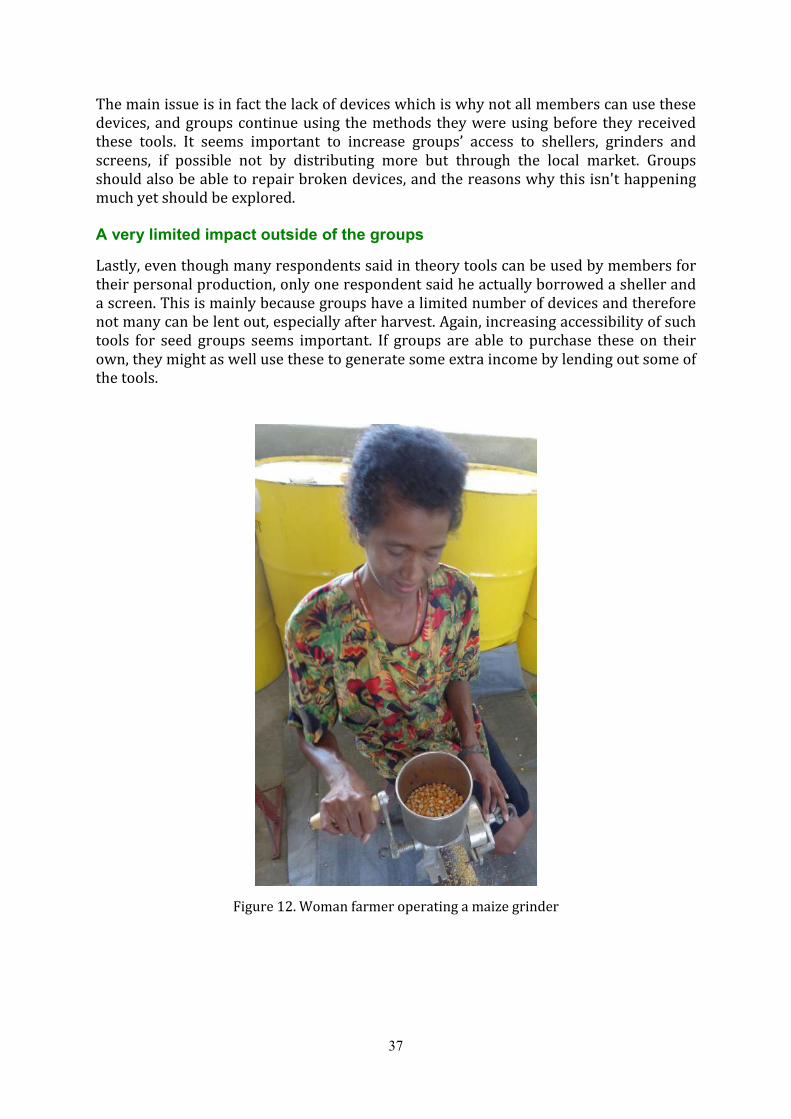
37
The main issue is in fact the lack of devices which is why not all members can use these devices, and groups continue using the methods they were using before they received these tools. It seems important to increase groups’ access to shellers, grinders and screens, if possible not by distributing more but through the local market. Groups should also be able to repair broken devices, and the reasons why this isn't happening much yet should be explored. A very limited impact outside of the groups
Lastly, even though many respondents said in theory tools can be used by members for their personal production, only one respondent said he actually borrowed a sheller and a screen. This is mainly because groups have a limited number of devices and therefore not many can be lent out, especially after harvest. Again, increasing accessibility of such tools for seed groups seems important. If groups are able to purchase these on their own, they might as well use these to generate some extra income by lending out some of the tools.
Figure 12. Woman farmer operating a maize grinder

38
AppendixI:Datacleaning
Section Specific question
Problem encountered
Action taken Number of cases this happened
General information on respondents
Position of the respondent within the group
Wrong data or missing data
Corrected after cross-checking with enumerators
2 cases (HH # 2 and 10)
Gender division of labour
All questions asking about # of person-days
Wrong number of person or days or person-days
Corrected after cross-checking with enumerators
47 cases
Group’s production
Months of harvest
Did not select months for harvest in 2015
Added month for harvest in 2015 after cross-checking with enumerators
22 cases
Volumes produced
Unclear information: writing 0 while actually the group had produced seeds but didn’t know how many kilos
Replaced most 0 by 999
Tools received Preference for which type of sheller
This question was asked even when groups received only one model of sheller
Deleted all the cases when groups received only 1 model
Use of shellers
Has the respondent use the sheller?
Inconsistent information about whether or not respondent has used shellers.
Checked info: respondent has never used the sheller. Deleted all following data on use of sheller
1 case (HH ID 4)
Number of cycles shellers were used
Inconsistent information between year received sheller and number of cycles used.
Rectified data: used the sheller for 3 cycles, not 2.
1 case (HH ID 59)

39
Section Specific question
Problem encountered
Action taken Number of cases this happened
Use of shellers (continued)
Duration of use of sheller
Use for 1 minute only (too short)
After checking with enumerator, replaced by 15 minutes
1 case (HH ID 54)
Use of the time saved from shelling
Wrong data entry
Rectified. 3 cases (HH ID 6, 7, 8)
Use of grinders
Number of grinders received
Said received grinders but then entered “0” for the number of grinders received
Replaced by 999 (the group received some grinders but they were out of order so the enumerator initially wrote “0”)
1 case (HH ID 22)
Reason for not using the grinder
Incomplete information
Completed information after consulting enumerators
7 cases (HH ID 25, 37, 40, 58, 61, 66, 67)
Number of persons allowed to use the grinder
Missing answer
Added after confirmation from enumerator
2 cases (HH ID 41 and 43)
Use of screens
Year of distribution
Inconsistent information
Rectified from received in 2015 to 2014
2 cases (HH ID 62, 63)
Number of cycles used screens
Inconsistent information
Changed 3 to 2 cycles
1 case (HH ID 59)
Were women sorting seeds before receiving screens
Inconsistent information
Changed all “No” to “yes”
9 cases (HH ID 65 to 73)
Use of drums Use of drums Inconsistent information
Changed “not use drums” to “use” after cross checking information
1 case (HH ID 66)

40
Section Specific question
Problem encountered
Action taken Number of cases this happened
Repairing devices
Have devices been broken
Enumerator said devices were broken while they were actually out of order due to missing screws since delivery
Changed “broken” to “not broken”
4 cases (HH ID 18, 22, 25, 26)
Lending out devices
Can devices be borrowed by members
Inconsistent information
Changed “cannot lend” to “ can lend”
2 cases (HH ID 25, 27)
Personal maize production
Volume harvested
Unknown unit or unit not in kilograms
Use conversion table and consider 1 “talin” has 12 cobs and 1 cob about 80 gr of grains.
Most cases
Missing unit
Added unit after checking with enumerator
2 cases (HH ID 37, 38)