Embed Size (px)
Citation preview
Gender Gaps in Unemployment Rates
in OECD Countries
Ghazala Azmat, Maia Güell and Alan Manning
January 2004
Abstract There is an enormous literature on gender gaps in pay and labour market participation but virtually no literature on gender gaps in unemployment rates. Although there are some countries in which there is essentially no gender gap in unemployment, there are others in which the female unemployment rate is substantially above the male. Although it is easy to give plausible reasons for why more women than men may decide not to want work, it is not so obvious why, once they have decided they want a job, women in some countries are less likely to be in employment than men. This is the subject of this paper. We show that, in countries where there is a large gender gap in unemployment rates, there is a gender gap in both flows from employment into unemployment and from unemployment into employment. We investigate different hypotheses about the sources of these gaps. Most hypotheses find little support in the data and the gender gap in unemployment rates (like the gender gap in pay) remains largely unexplained. But it does seem to correlate with attitudes on whether men are more deserving of work than women so that discrimination against women may explain part of the gender gap in unemployment rates in the Mediterranean countries. JEL Classification: J16, J64 Keywords: Gender Gap, Unemployment Rates This paper was produced as part of the Centre’s Labour Markets Programme. The Centre for Economic Performance is financed by the Economic and Social Research Council. Acknowledgements We would like to thank seminar participants at CEMFI, IFS, LSE, Pompeu Fabra and Princeton and Marco Manacorda and Steve Pischke for their comments. Ghazala Azmat is an Occasional Research Assistant at the Centre for Economic Performance, London School of Economics. Maia Güell is an Assistant Professor at Universitat Pompeu Fabra, Spain. She is also a Research Associate at the Centre for Economic Performance, London School of Economics and a Research Fellow at the Institute for the Study of Labour (IZA), Bonn. Alan Manning is a Programme Director at the Centre for Economic Performance and Professor of Economics, London School of Economics. Published by Centre for Economic Performance London School of Economics and Political Science Houghton Street London WC2A 2AE All rights reserved. No part of this publication may be reproduced, stored in a retrieval system or transmitted in any form or by any means without the prior permission in writing of the publisher nor be issued to the public or circulated in any form other than that in which it is published. Requests for permission to reproduce any article or part of the Working Paper should be sent to the editor at the above address. G. Azmat, M. Güell and A. Manning, submitted 2004 ISBN 0 7530 1708 3 Individual copy price: £5
1
Introduction
There is an enormous literature on gender gaps in pay and a vast literature on gender
gaps in labour force participation rates (see Altonji and Blank, 1999, for an overall
survey and Blau and Kahn, 2003, for a recent international comparison). Yet, there is
very little written on gender gaps in unemployment rates (though see Ham, Svejnar
and Terrell, 1999, for an examination of two transition countries): for example a
recent OECD paper on the economic position of women baldly stated on the first page
that “the analysis concentrates on gender differences in employment, the organisation
and characteristics of jobs and their remuneration, leaving aside the examination of
unemployment or inactivity” (OECD, 2002, p63). If there were no interesting gender
gaps in unemployment rates then this lack of literature might be understandable. But,
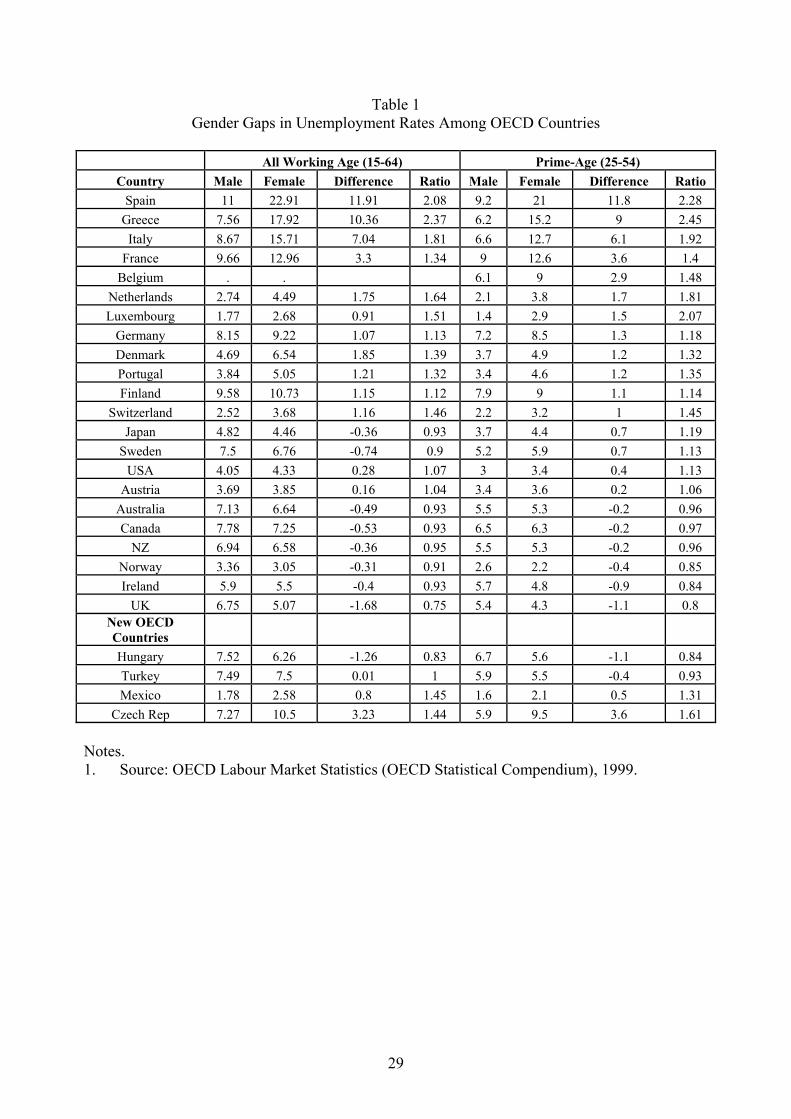
as Table 1 shows, this is not the case: while the gender gap in unemployment rates
(measured as the female minus the male) is small (or even negative) in some
countries, there are others in which it is very large. For example in the UK, the
prime-age female unemployment rate is 1.1 percentage points below the male while in
Spain it is 11.8 percentage points above. It should be emphasized that the
unemployment rates in Table 1 are all computed using the standardized ILO
definition1 so are meant to be comparable across countries. In terms of the gender gap
in unemployment rates, one can identify several distinct groups of countries in Table
1. First, the highest gender gaps in unemployment rates are to be found in the
Mediterranean countries (Spain, Greece, Italy and France). Next come the Benelux
countries (Belgium, Netherlands and Luxembourg), then the ‘Germanic’ countries
(Germany, Austria and Switzerland), then the ‘Nordic’ countries (Sweden, Finland
and Norway) and, finally the ‘Anglo-Saxon’ (US, UK, Ireland, Australia, Canada and
1 To be unemployed according to the ILO definition, one must not be currently in employment, one must have looked for work in the last 4 weeks and be available to start work within 2 weeks.
2
New Zealand). In a number of the Mediterranean countries the ‘unemployment
problem’ is largely a problem of female unemployment2. For future use we will refer
to the countries in which the female unemployment rate is much higher than the male
as the ‘high-gap’ countries and those in which the female-male gap in unemployment
rates is small or even negative as the ‘low-gap’ countries.
One might wonder whether the pattern of gender gaps in unemployment rates
across countries has always been as Table 1 shows it is now. Figure 1 looks at the
evolution of male and female unemployment rates over time. One can see that there
is an interesting reversal. Most of the countries that now have large gaps used to have
small or non-existent gaps and the gap only emerged in the 1960s and 1970s whereas
some countries like the US used to have a gender gap but now do not (although it was
always much smaller than seen in some countries today).
This paper starts from the premise that this gender gap in unemployment rates
is interesting and attempts to understand why this gap exists and how the cross-
country variation can be explained. One should emphasize that the question we are
interested in answering is not ‘why are women less likely to be in employment than
men?’ (either measured as the employment-population ratio or the labour force
participation rate) for which there are fairly obvious answers in terms of the allocation
of domestic responsibilities and a large literature on the subject but the question ‘why,
once they have decided they want a job, are women in some countries much less
likely to be in employment than men?’3.
2 Typically these countries also have very high youth unemployment rates though we do not consider this issue here. 3 Of course, it may not be so easy to separate participation from unemployment decisions and the possible links between the two are discussed below.
3
The structure of the paper is as follows. In the next section we consider the
gender gap in unemployment rates in more detail, investigating whether the aggregate
figures (as presented in Table 1 and Figure 1) can be explained by gender gaps in
characteristics among those in the labour force. The answer, probably unsurprisingly,
is ‘no’. This section also investigates variation in the gender gap in unemployment
rates across different characteristics: we find that the gender gap in unemployment
rates tends to be larger for the young, married women and those with young children.
The second section then looks at gender differences in labour market
dynamics, the flows into and out of employment, unemployment and inactivity.
Women tend to have higher flows out of employment into unemployment in the
‘high-gap’ countries and higher flows into inactivity in all countries. But, the ‘high-
gap’ countries also tend to have large gender differentials in the flow out of
unemployment into employment. We need to understand both why employed women
in some countries leave employment for unemployment at a faster rate than men and
why unemployed women in some countries find it so much more difficult than men to
get a job.
The third section investigates in more detail flows out of employment into
unemployment. We show that, in most countries, one cannot explain much of the
gender gap in these flows using gender differences in the types of jobs that men and
women do. We also show that domestic responsibilities (primarily child care) only
account for a small fraction of job endings that result in unemployment (most job
endings for these reasons end up in inactivity) so that it is not primarily gender
differences in domestic responsibilities that can account for the gender differences in
the flows from employment to unemployment.
4
The fourth section investigates the flow from unemployment to employment.
We find no evidence that the female unemployed are less ‘serious’ about wanting
work than their male counterparts in the ‘high-gap’ countries. The gender gap in
reported search activity seems similar in both ‘high-gap’ and ‘low-gap’ countries and
and the receipt of welfare benefits by women in ‘high-gap’ countries is typically quite
low.
The fifth section considers the hypothesis that it is the behaviour of employers
that makes it difficult for unemployed women to get jobs in some countries. We
present evidence that in countries where attitudes are more gender biased the gender
gap in unemployment rates is higher. We suggest that, when the overall
unemployment rate is high and there are queues for most jobs, it is relatively easy for
employers to indulge in discriminatory behaviour.
The sixth section investigates the hypothesis that, in some countries, there is a
mismatch between the types of jobs that unemployed women want and employers are
offering. Perhaps the most notable possible example is the availability of part-time
work. It is true that there is a lot of variation in the extent of part-time employment
and that it tends to be relatively rare in the ‘Mediterranean’ countries which have
large gender gaps in unemployment rates. But, the unemployed women in these
countries do not report that they are looking for part-time jobs and it seems likely that
the lack of availability of part-time work can explain low female participation rates in
some countries but not their high unemployment rates.
Our conclusion is that it is easier to provide evidence against certain
hypotheses about the source of gender gaps in unemployment rates than it is to
provide evidence for hypotheses. In this there is perhaps a parallel to the gender pay
gap that is also hard to fully explain. However, we do suggest that attitudes towards
5
male and female unemployment may be important in explaining the gap in countries
where unemployment is high.
1. Variations in the gender gap in unemployment rates
It is conceivable that the gender gaps in unemployment rates observed in
Table 1 can be explained away by gender gaps in characteristics that vary across
countries. Some descriptive statistics of men and women in the labour force are
presented in Table A1 in the Data Appendix. For the European countries, we use data
from the first six waves of the European Community Household Panel Survey
(ECHPS) that cover the period 1994-19994 and, for the United States, we use data
from the Current Population Survey (CPS) from 1996-2000 (to have an approximately
comparable period).
Table A1 contains a lot of information but the following seem the most
noteworthy features. There are some features that seem true of most countries:
unemployed women tend to be younger than unemployed men, and a higher fraction
of women (both in employment and unemployment) are divorced or separated. But
there are some features of the raw data that differ across countries. For example in
Spain, Greece, Ireland, and Italy women (both employed and unemployed) tend to
have higher education levels than their male counterparts and lower levels of work
experience, while France, Belgium, UK, US and the Netherlands do not have marked
gender gaps in these variables. This pattern fits with differences in the labour force
participation rates and suggests a stronger relationship between education and labour
market participation in countries with a low overall female participation rate.
4 For details of the ECHPS see Peracchi (2002) and Nicoletti and Peracchi (2002) who discuss, among other things, sample attrition. Because there may be concerns about the representativeness of the ECHPS we have checked the results for the UK and Spain using their respective Labour Force Surveys: these results are very similar and are available on request from the authors.
6
Regarding the number of children, there are, crudely, three groups of
countries. In Spain, Greece, Italy, France, Luxemburg, and Ireland, there are no
differences between unemployed men and women, but there are more employed
women that have either no children or young children. In Belgium, the Netherlands,
Denmark, Sweden there are no differences among the employed workers but there are
more unemployed females that have young children. Finally, in the UK, US, Portugal
and Finland there are no significant differences between males and females in these
variables.
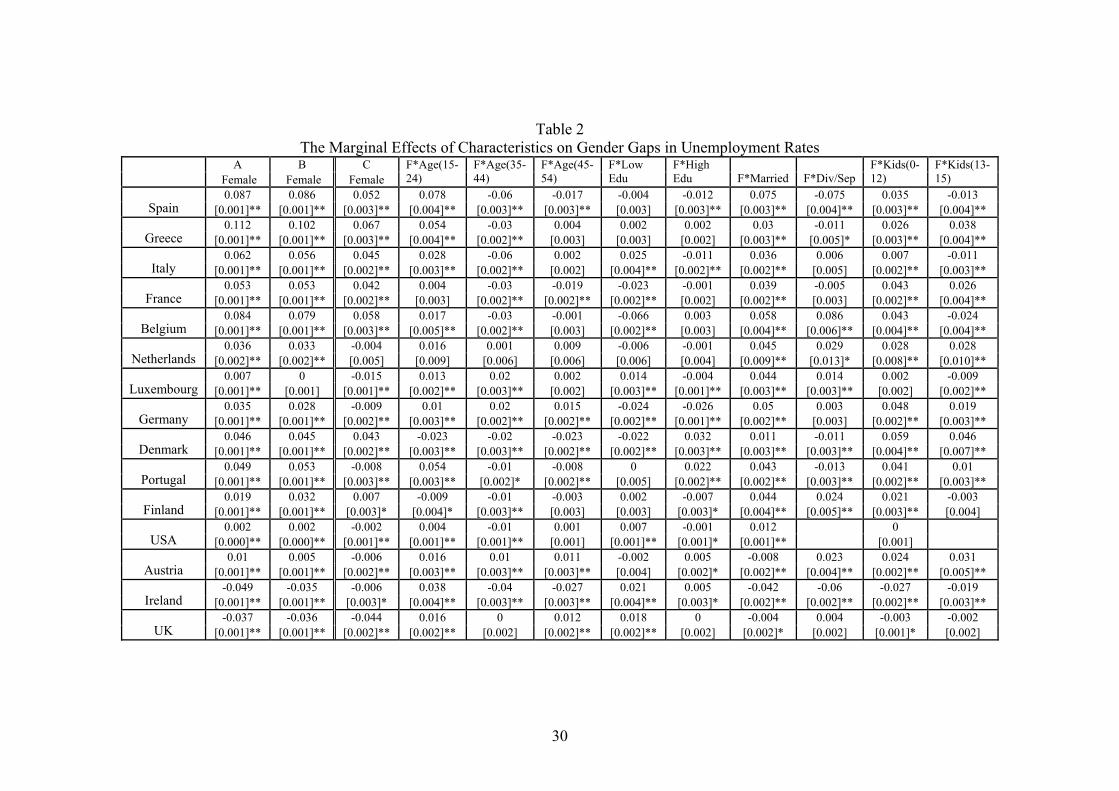
To investigate the hypothesis that differences in characteristics can explain
gender gaps in unemployment rates we estimate probit models for the probability of
being unemployed (conditional on being in the labour force so that we are looking at
unemployment rates) including a variety of characteristics as well as a female
dummy. The other characteristics included are dummies for age, education, marital
status, and the presence of kids in the household. The results are reported in Table 2
where countries are ordered by the gender gap in unemployment rates among prime-
age workers as reported in Table 1 (we also follow this practice in all subsequent
Tables). The first column reports the marginal effects when only a female dummy is
included i.e. we estimate a model of the form:
( ) ( )0 1Pr 1U femaleβ β= = Φ + (1)
These marginal effects should be comparable to the gender gaps in aggregate
unemployment rates presented in Table 1. They are similar though not identical, the
reason being that the data come from different sources and refer to different periods.
The second column then reports the marginal effect of the female dummy when the
other characteristics are included in the model (their coefficients are not reported to
save space) i.e. we estimate a model of the form:
7
( ) ( )0 1 2Pr 1U female xβ β β= = Φ + + (2)
where x is the vector of other characteristics. Although there is a very slight tendency
for the gender gap in unemployment rates to fall in the ‘Mediterranean’ countries the
amount of the gender gap that can be explained using these characteristics is small
and substantial gender gaps in unemployment remain in the countries where they exist
in the aggregate data.
The model estimated so far assumes that all women, whatever their other
characteristics, have a higher chance of being unemployed. But, it may be the case
that the gender gap varies with characteristics. So, we then estimate a model in which
all the characteristics are interacted with a female dummy i.e. a model of the form:
( ) ( )0 1 2 3Pr 1 *U female x female xβ β β β= = Φ + + + (3)
The marginal effects of these interactions are reported in the third through twelfth
column of Table 2. Because the probit model is non-linear one cannot exactly read
off the gender gaps in unemployment rates for different sorts of workers from this part
of Table 2 but, to a first approximation, one can work out the gap in unemployment
rates between men and women with a given set of characteristics, x, by adding the
coefficients that apply to them. So, to work out the gender gap for married people
with young children one would add the marginal effects for having young children
and being female, the marginal effect for being married and female and the marginal
effect for being female. There is obviously a lot of information here so the results are
hard to digest. But, the coefficient on the female dummy itself remains large and
significant in the ‘high-gap’ countries and, where the interaction terms are significant,
it seems to be that it is among the young, the married and those with young children
that the gender gaps in unemployment rates are largest.
8
All of the discussion so far has been about whether differences in observed
characteristics can explain the gender gap in unemployment rates. But, it is possible
that differences in unobserved characteristics might also be important, especially in
countries where the female participation rate is low and selection into the labour force
by women is an important question. But, it seems plausible to think that these
unobservable characteristics related to labour market participation would actually
exacerbate the gender gap in unemployment rates, not explain them away. To
illustrate this suppose that individuals differ in their ‘employability’, denoted by x,
and that the unemployment rate is a negative function of x (denote it by u(x)).
Further, assume that, in the population, x is equally distributed across men and women
so that the ‘true’ gender gap in unemployment rates is zero. If all men participate in
the labour market then we will have pm(x)=1 where pm(x) is the labour force
participation rate for a man with characteristics x5. For women in countries where
female labour force participation is low (e.g. Spain), we have pf (x)<1 and it seems
likely that pf’(x)>0 so there is a positive relationship between ‘employability’ and
labour market participation (we saw evidence of this earlier in the fact that Spanish
women in the labour force are better educated than men). In this example we would
observe the female unemployment rate to be below that of the male simply because
the women in the labour force are more positively selected than the men in terms of
their employability. This means we would tend to underestimate the true gender gap
in the unemployment rate that, in this example, is zero.
This section has shown that the raw gender gaps in unemployment rates
cannot be explained away by gender gaps in characteristics and that, in ‘high-gap’
countries, even women without the burdens of a partner or children are more likely to
5 The conclusion will also go through if we assume that male participation rates are a function of x as long as the sensitivity to x is weaker than for women.
9
be unemployed than equivalent men (though having a partner and/or children worsens
this disadvantage).
A natural next question is whether the gender gap in unemployment rates that
we observe in some countries is the result of gender differences in flows into
unemployment or flows out of unemployment: this is the subject of the next section.
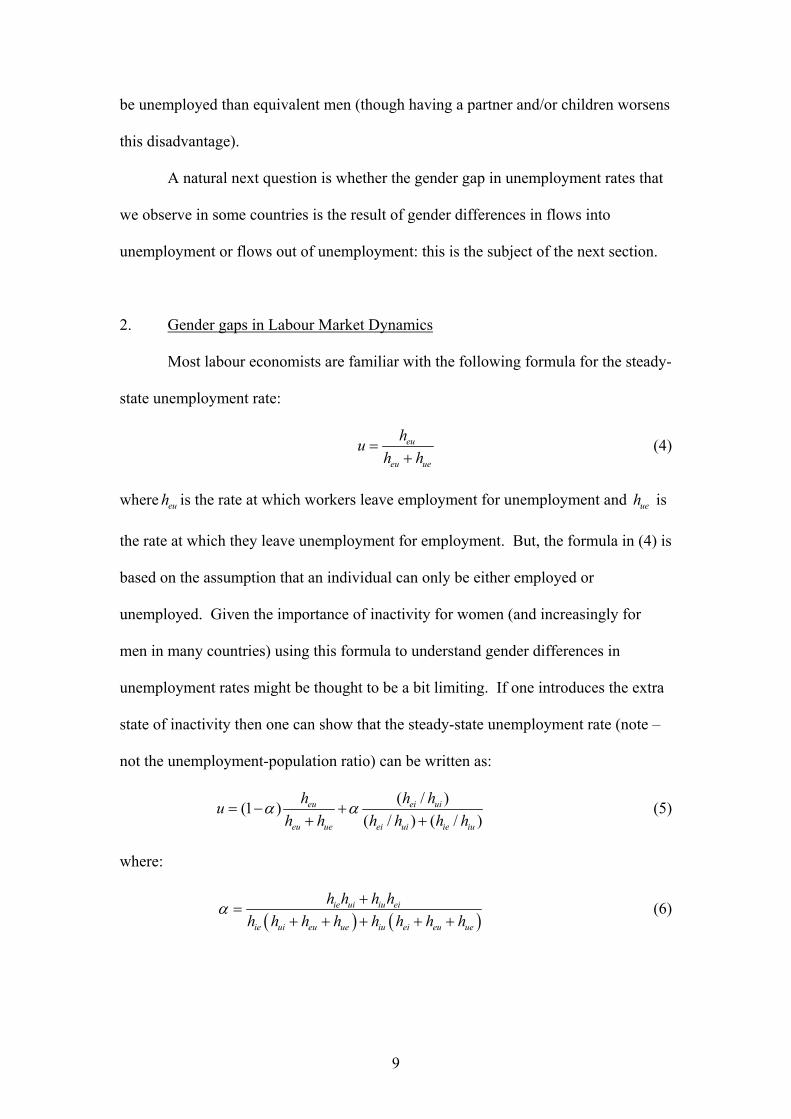
2. Gender gaps in Labour Market Dynamics
Most labour economists are familiar with the following formula for the steady-
state unemployment rate:
eu
eu ue
huh h
=+
(4)
where euh is the rate at which workers leave employment for unemployment and ueh is
the rate at which they leave unemployment for employment. But, the formula in (4) is
based on the assumption that an individual can only be either employed or
unemployed. Given the importance of inactivity for women (and increasingly for
men in many countries) using this formula to understand gender differences in
unemployment rates might be thought to be a bit limiting. If one introduces the extra
state of inactivity then one can show that the steady-state unemployment rate (note –
not the unemployment-population ratio) can be written as:
( / )(1 )( / ) ( / )
eu ei ui
eu ue ei ui ie iu
h h huh h h h h h
α α= − ++ +
(5)
where:
( ) ( )ie ui iu ei
ie ui eu ue iu ei eu ue
h h h hh h h h h h h h
α +=
+ + + + + (6)
10
The interpretation of (5) is the following. It says that the overall unemployment rate
can be thought of as a weighted average of two ‘component’ unemployment rates.
The first term on the right-hand side of (5) is the unemployment rate if there were
never any flows into or out of inactivity (it is simply the formula in (4)). The second
term on the right-hand side of (5) is what the unemployment rate would be if there
were never any direct flows between employment and unemployment only indirect
flows via inactivity. Note that, for this unemployment rate, it is the relative size of
flows from employment/unemployment to inactivity and vice versa that is important.
So, if workers flow at a faster rate from employment to inactivity than from
unemployment to inactivity this will tend to raise the unemployment rate.
So, one of the terms in (5) assumes inactivity is unimportant in determining
the unemployment rate and the other that it is very important. The weight α is then a
measure of the relative importance of flows via inactivity in generating
unemployment though it is hard to give an intuition for its exact functional form.
If there are gender differences in unemployment rates this must be because of
gender differences in some (or all) of the hazard rates in (5). Which differences are
most important is likely to be helpful in understanding gender differences in
unemployment rates. We now consider this issue.
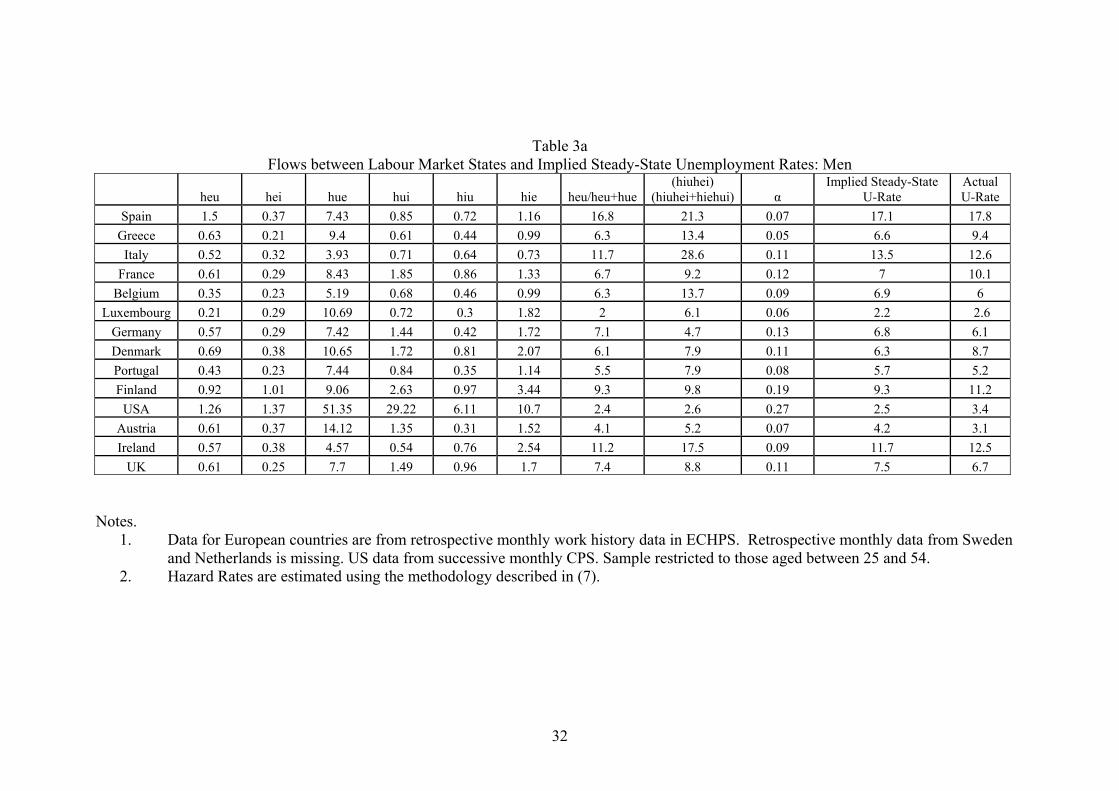
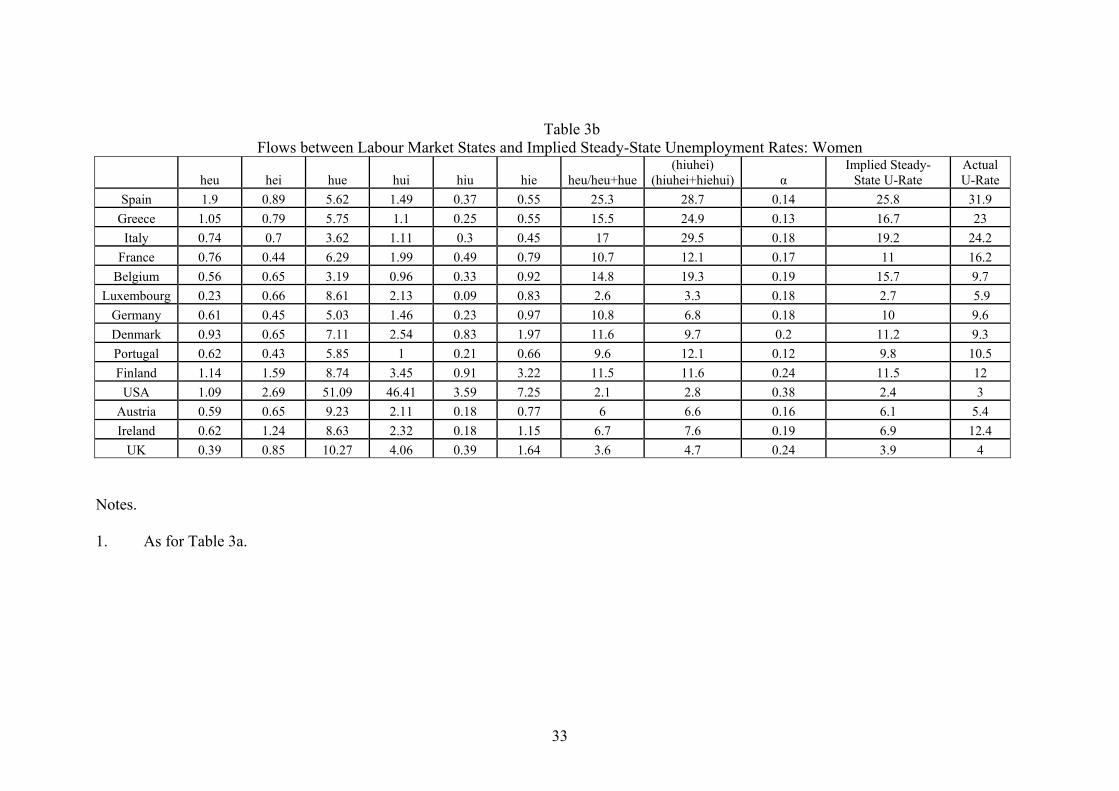
Table 3a presents estimates of the hazard rates and computation of the
different components in (5) for men and Table 3b the corresponding information for
women. The data we use for this comes from the retrospective monthly employment
history that all individuals in the ECHPS are asked to complete and from consecutive
monthly CPS files matching those individuals who are in the sample in consecutive
months. Our method for estimating the labour market transition rates is the following.
We have observations on the labour market state an individual is in one month
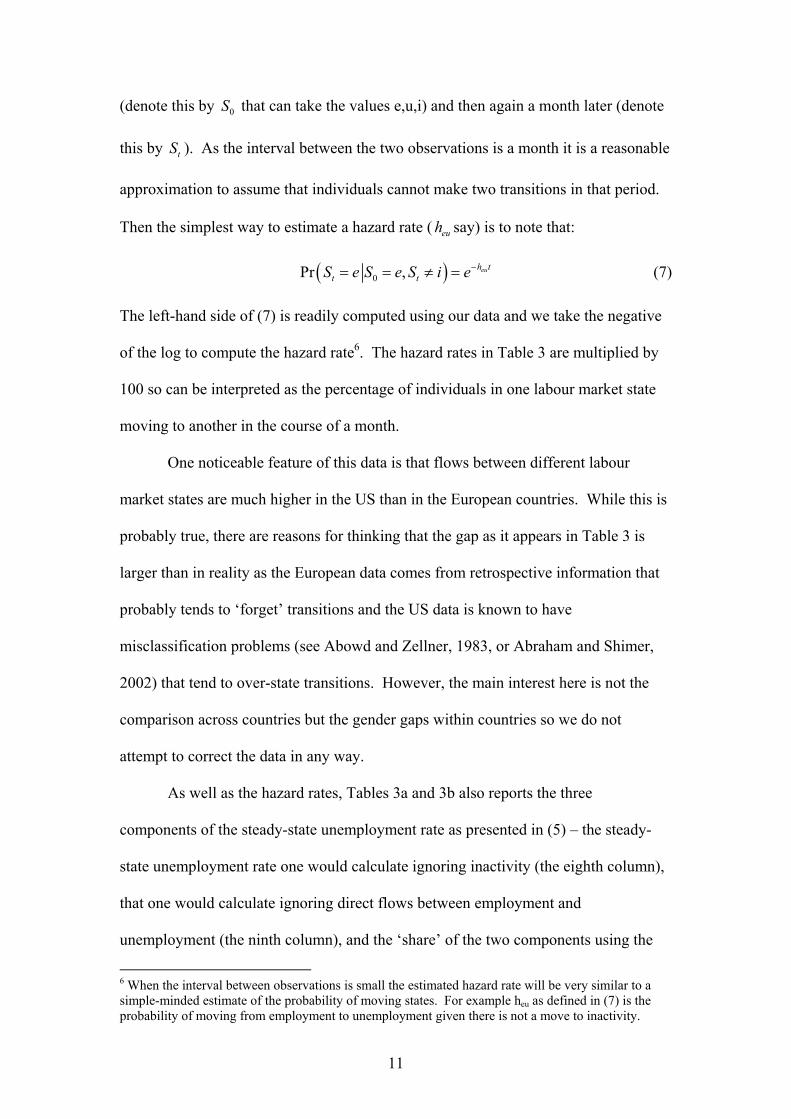
11
(denote this by 0S that can take the values e,u,i) and then again a month later (denote
this by tS ). As the interval between the two observations is a month it is a reasonable
approximation to assume that individuals cannot make two transitions in that period.
Then the simplest way to estimate a hazard rate ( euh say) is to note that:
( )0Pr , euh tt tS e S e S i e−= = ≠ = (7)
The left-hand side of (7) is readily computed using our data and we take the negative
of the log to compute the hazard rate6. The hazard rates in Table 3 are multiplied by
100 so can be interpreted as the percentage of individuals in one labour market state
moving to another in the course of a month.
One noticeable feature of this data is that flows between different labour
market states are much higher in the US than in the European countries. While this is
probably true, there are reasons for thinking that the gap as it appears in Table 3 is
larger than in reality as the European data comes from retrospective information that
probably tends to ‘forget’ transitions and the US data is known to have
misclassification problems (see Abowd and Zellner, 1983, or Abraham and Shimer,
2002) that tend to over-state transitions. However, the main interest here is not the
comparison across countries but the gender gaps within countries so we do not
attempt to correct the data in any way.
As well as the hazard rates, Tables 3a and 3b also reports the three
components of the steady-state unemployment rate as presented in (5) – the steady-
state unemployment rate one would calculate ignoring inactivity (the eighth column),
that one would calculate ignoring direct flows between employment and
unemployment (the ninth column), and the ‘share’ of the two components using the
6 When the interval between observations is small the estimated hazard rate will be very similar to a simple-minded estimate of the probability of moving states. For example heu as defined in (7) is the probability of moving from employment to unemployment given there is not a move to inactivity.
12
formula in (5) and (6) (the tenth column) . Finally, the penultimate column presents
the steady-state unemployment rate computed using the hazard rates and the final
column the actual unemployment rate in the data as a check on the internal
consistency. The last two columns are similar, differences arising from the fact that
the labour markets are not in a steady state.
Looking at the results for men in Table 3a one can see that the ‘α’ is small,
implying that flows into and out of inactivity are relatively unimportant in explaining
the male unemployment rate. Also, the two component unemployment rates are very
similar. So, the bottom line is that the difference in the steady-state unemployment
rates computed using the formulae in (4) and (5) are very small and that, to a first
approximation, one can ignore inactivity. Given the high labour force participation
rates for men this is probably not that surprising.
What might be found more surprising are the results for women in Table 3b. It
is true that ‘α’ is larger for women than for men, implying a more important role for
inactivity but, in many countries, it is still very low. This is quite consistent with a
low female participation rate if inactivity is a very stable state. And, again the two
component unemployment rates tend to be quite similar with the conclusion that the
use of (4) rather than (5) will not lead to seriously misleading conclusions.
Given the results in Tables 3a and 3b we will, in the interests of keeping the
paper to a manageable length, concentrate in the rest of this paper on gender gaps in
flows between employment and unemployment and largely ignore gender differences
in flows involving inactivity. One must be careful here: the results in Tables 3a and
3b do not suggest that gender gaps in flows involving inactivity are non-existent, it is
simply that they (for some reason) mirror gender gaps in flows that do not involve
inactivity. This needs to be borne in mind.
13
We now estimate the hazard rates including other relevant controls. As the
hazard rates must be non-negative a convenient empirical model is:
eu xeuh eβ= (8)
where x is a vector of characteristics (that will include female dummies). Substituting
(8) into (7) suggests that a simple way to estimate euβ is to restrict the sample to those
who are initially in employment and not subsequently in inactivity and then use a
complementary log-log model to estimate the probability that the individual is in
employment. A similar methodology can be used to estimate all the other hazard
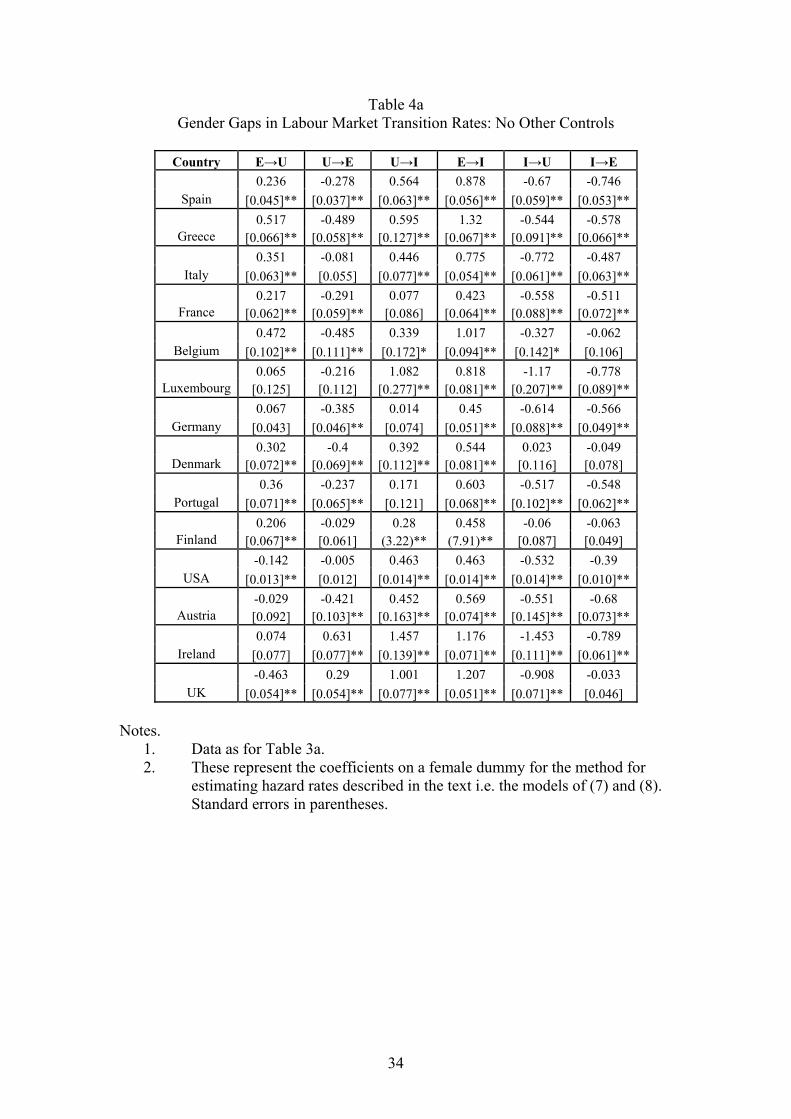
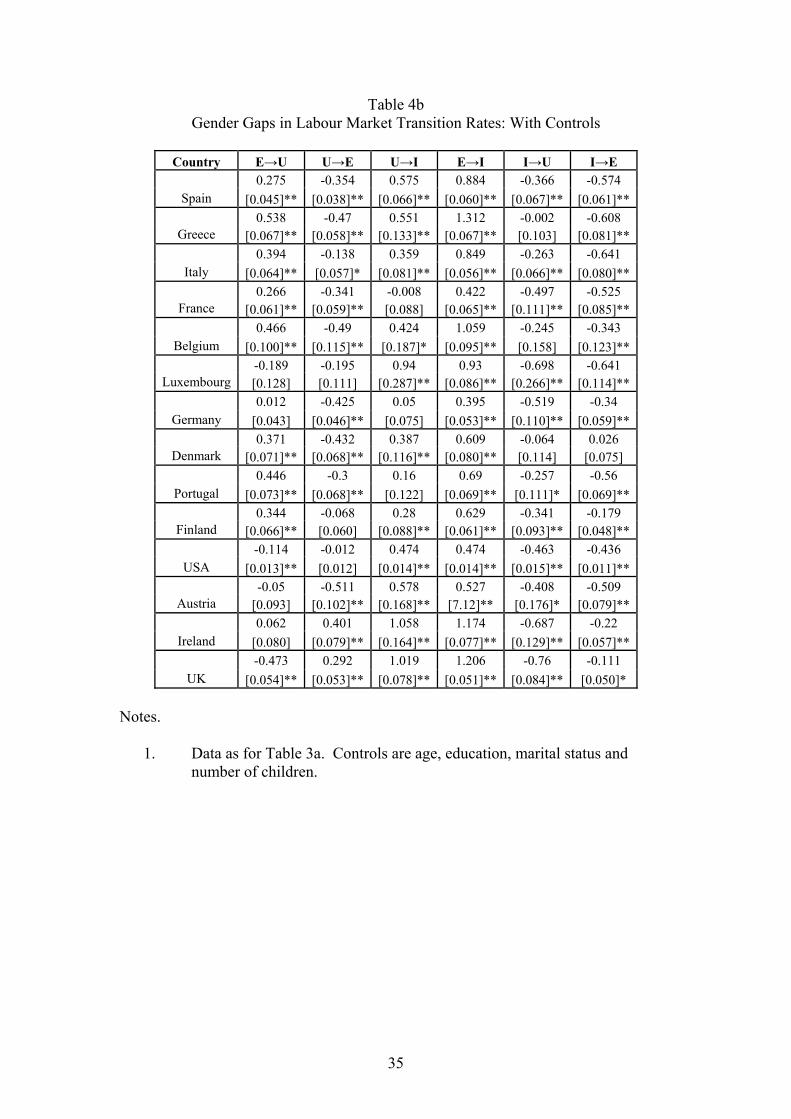
rates. The coefficients on a female dummy are reported in Table 4a without any other
controls) and in Table 4b with controls for personal characteristics7.
Note that the coefficient estimates will be the extent to which the hazard rate for
a particular labour market transition is proportionately different for women. So, when
we see in the column headed euh that the coefficient on the female dummy for
Germany is 0.067 this means that women are 6.7% more likely to leave employment
for unemployment than men8.
There is a lot of information in Tables 4a and 4b but the most important points
are the following. If we consider direct flows between employment and
unemployment, the ‘high-gap’ countries seem to have large gender gaps in both the
7 Because we want a common specification for all the hazard rates, the controls do not include any variables that are ‘state-specific’ e.g. characteristics of a job if one is in employment. But, Tables 6 and 12 do provide information on the importance of these characteristics. 8 One might wonder whether proportionate or absolute differences in hazard rates are the more important: we think proportionate differences for the following reason. To keep things simple, consider the formula for the steady-state unemployment rate in (4). Then simple, differentiation shows that:
(1 )ln( ) ln( )eu ue
u uu uh h
∂ ∂= − = −
∂ ∂
so that a proportionate change in euh will have the same impact on unemployment (though with the
opposite sign) as an equal proportionate change in ueh . This means that we can, more or less, compare the coefficients on the female dummy for different transition rates.
14
flows from employment to unemployment and the flows from unemployment to
employment than ‘low-gap’ countries (read down a column to see this). Both of these
gender gaps need to be understood to get a good understanding of the source the
gender gap in unemployment rates. One might be concerned about the robustness of
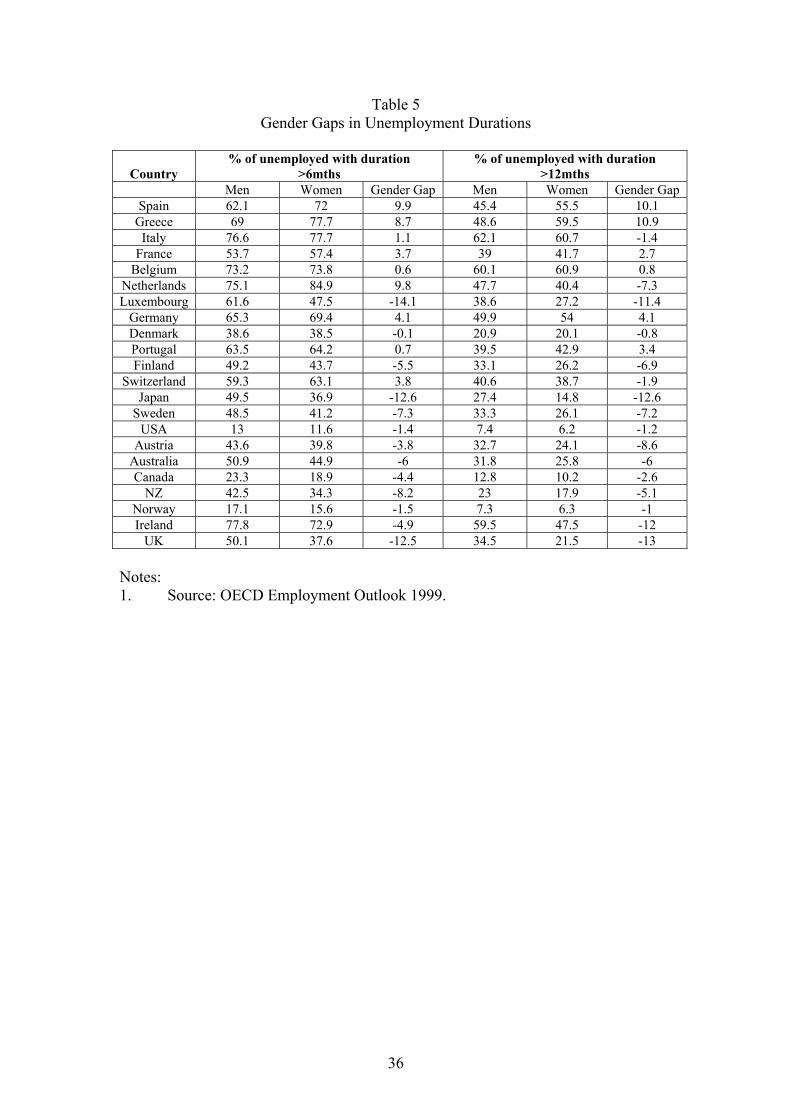
this conclusion but other data support it. If women find it harder than men to leave
unemployment in some countries then we would expect their durations of
unemployment to be higher on average. This is what we see in Table 5.
If we consider flows involving inactivity, women in all countries tend to have
higher flows into inactivity both from employment and unemployment. But, as the
discussion of (5) above made clear, it is the proportional difference in the hazard rates
from employment and unemployment to inactivity that is important for the
unemployment rate so that one should look at the difference between the female
dummy on the EI transition and the UI transition in Table 4a or 4b. In the ‘high-gap’
countries there is some indication that the gender gap in the flow from employment to
inactivity is larger than the gender gap in the flow from unemployment to inactivity:
this will tend to increase the unemployment rate. There is a less systematic pattern in
the gender gap in flows from inactivity to employment or unemployment.
Given the evidence in Tables 4a and 4b we focus first on the flows from
employment to unemployment, then on the flows from unemployment to
employment.
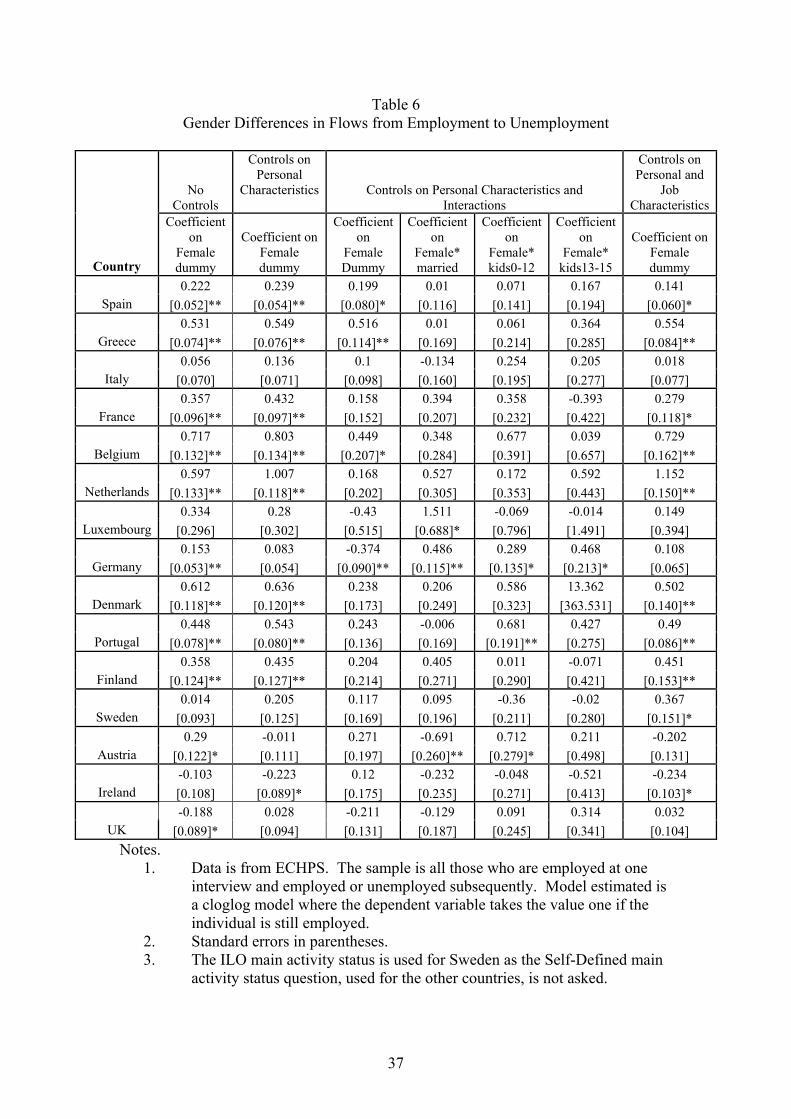
3. Gender Differences in Flows from Employment to Unemployment
As Table 4 has shown, women in the ‘high-gap’ countries leave employment for
unemployment at a higher rate than do men. The flow from employment to
unemployment is investigated further in Table 6. These regressions are similar to
15
those we estimated in Tables 4a and 4b except that, in some specifications, we include
some characteristics of the job – notably, industry, occupation, the size of employer,
the type of contract and whether the job is public sector to investigate whether gender
gaps in these variables can help to explain gender gaps in flows from employment to
unemployment9. Also, because the information on the characteristics of the job held
are only available for jobs held at the annual interview, these equations are estimated
on annual data.
In the first column of Table 6 we report estimates of models for the transition
from employment to unemployment that include only a female dummy. The
qualitative pattern of these coefficients that are based on annual data is the same as
those in Table 4a (that were based on monthly data) with women having higher rates
of transition from employment to unemployment than men in the ‘high-gap’
countries. The second column then introduces personal characteristics as extra
controls: this has only marginal effects on the coefficient on the female dummy. The
next four columns then report results when we interact the female dummy with
marital status and the number of children to see whether there is significant variation
in the gender gap in the flow from employment to unemployment. Almost all of these
interaction terms have coefficients that are insignificantly different from zero
suggesting that domestic responsibilities do not play a big role in transitions from
employment to unemployment. This is not to say that domestic responsibilities do not
play an important role in women’s flows out of employment, just that women with
children are more likely to leave employment for inactivity than unemployment. This
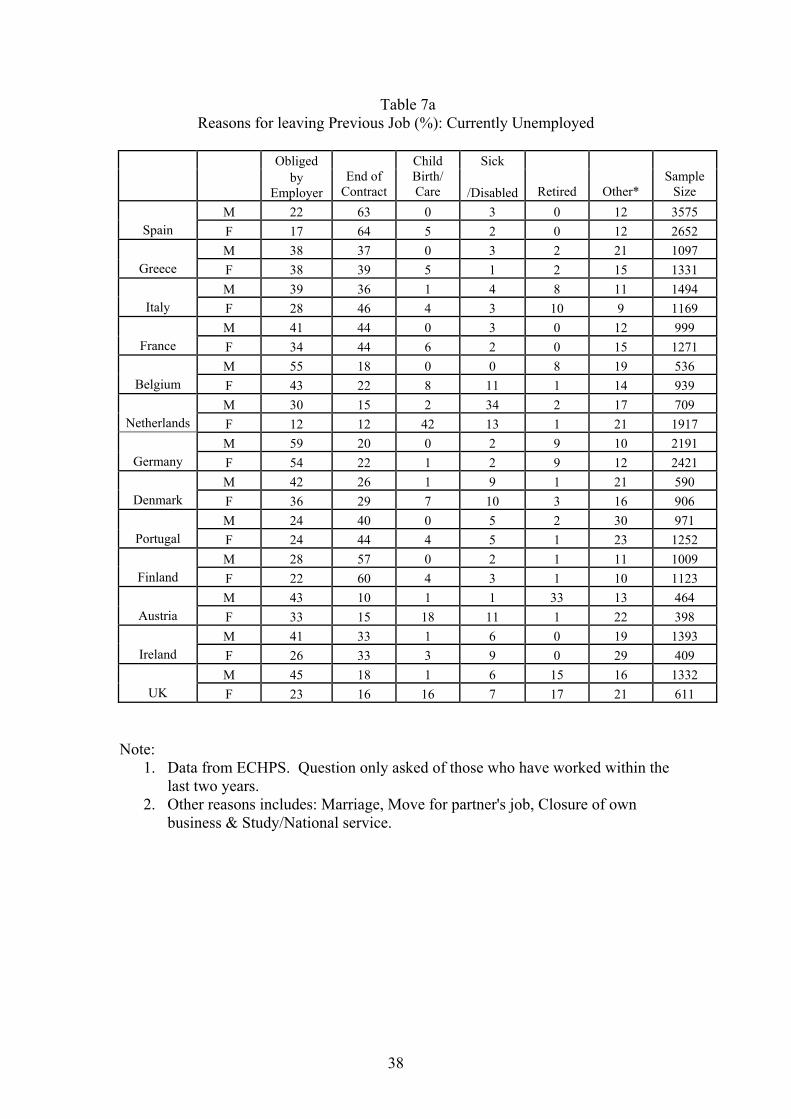
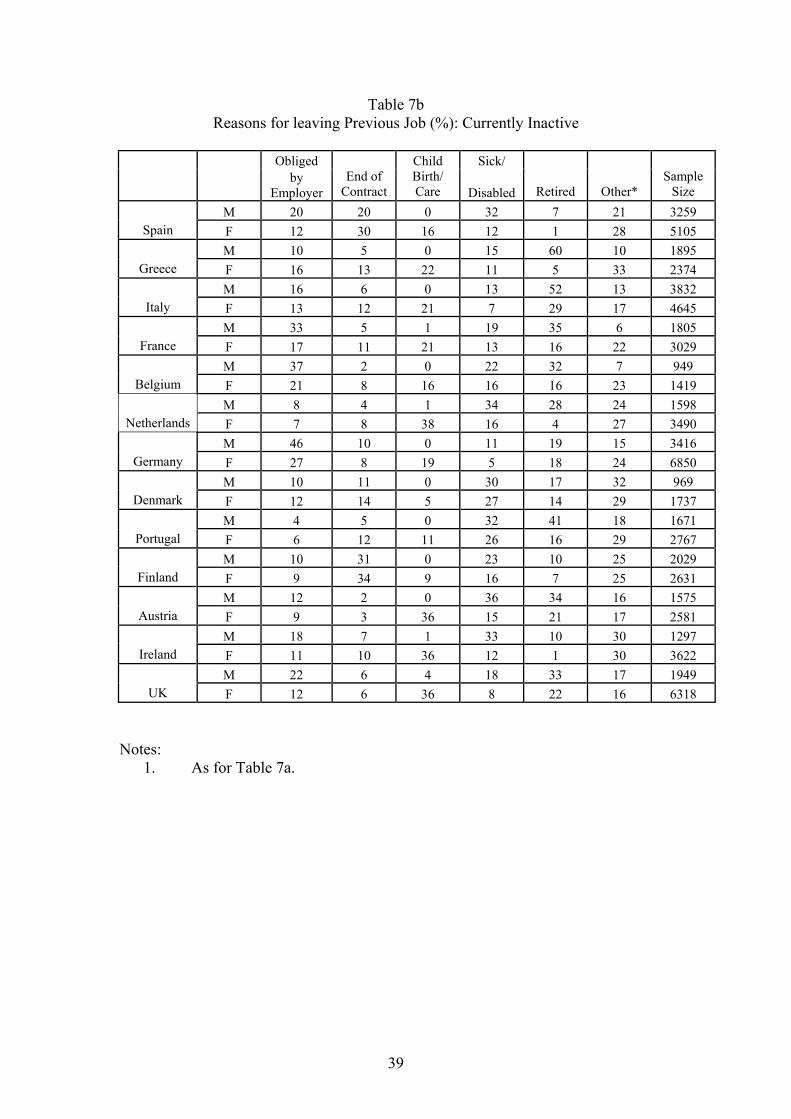
conclusion is consistent with information on the reasons given for why jobs end.
Table 7a tabulates the reasons given by the currently unemployed for why their
9 We did not do this in Tables 4a and 4b because we wanted to adopt a common specification for all the hazard rates so could only include covariates that are defined in all labour market states.
16
previous job ended and in Table 7b reasons are given by the currently inactive for
why the previous job ended. With the exception of a couple of countries, reasons
connected with ‘caring’ account for a very small fraction of jobs ending where the
individual is currently unemployed10. This is not surprising: most women leaving
employment to have children go directly into inactivity.
In many countries men are more likely than women to be laid-off. In
countries like the UK this difference is extreme – 45% of male jobs end because the
worker is laid-off compared to 23% of women. In the ‘high-gap’ countries, the most
striking feature of Table 7a is that there does not seem to be a large gender gap in the
reasons for why workers leave employment for unemployment in the ‘high-gap’
countries. This hints that it may be employers who are choosing to end the contracts
of married women with children rather than those women choosing to quit.
The final column in Table 6 reports the coefficient on the female dummy
when job characteristics (industry, occupation, public/private size of firm, full-/part-
time, permanent/temporary, job tenure) are also included in a model of the transitions
from employment to unemployment. Petrongolo (2003) has documented how female
workers are over-represented in temporary and part-time jobs that are generally at
more risk of ending. In France and Spain (which are heavy users of temporary
contracts) the introduction of these variables does significantly reduce the coefficient
on the female dummy but the addition of these variables makes little difference to the
gender gap in most countries.
Now, let us turn to flows in the opposite direction, from unemployment to
employment.
10 In fact, Table 7a probably overstates the proportion as women who had children and left employment for inactivity but are now trying to get a job again will be included in the ‘currently’ unemployed category.
17
4. Flows from Unemployment to Employment: The behaviour of workers
The actions of both individuals and employers are likely to affect the flow from
unemployment to employment. In this section we consider the actions of the
unemployed themselves and the following section considers the actions of employers.
The unemployment rate is meant to measure the fraction of people who want a
job but do not have one. The ILO definition of unemployment uses evidence that
people have looked for work in the recent past and are available to start work in the
near future to determine whether people without work currently want it. But some
economists think that, while there is a meaningful distinction between employment
and non-employment, the distinction between unemployment and inactivity is
meaningless. On this view the fact that fewer women want paid work (largely
because of domestic responsibilities) ‘spills over’ into a higher unemployment rate
and does not simply show up in a lower labour force participation rate. If this is true
then, in some sense, the female unemployed in ‘high-gap’ countries may be less
serious about wanting a job and taking steps to get one than the male unemployed.
There are a number of ways in which one might test this hypothesis.
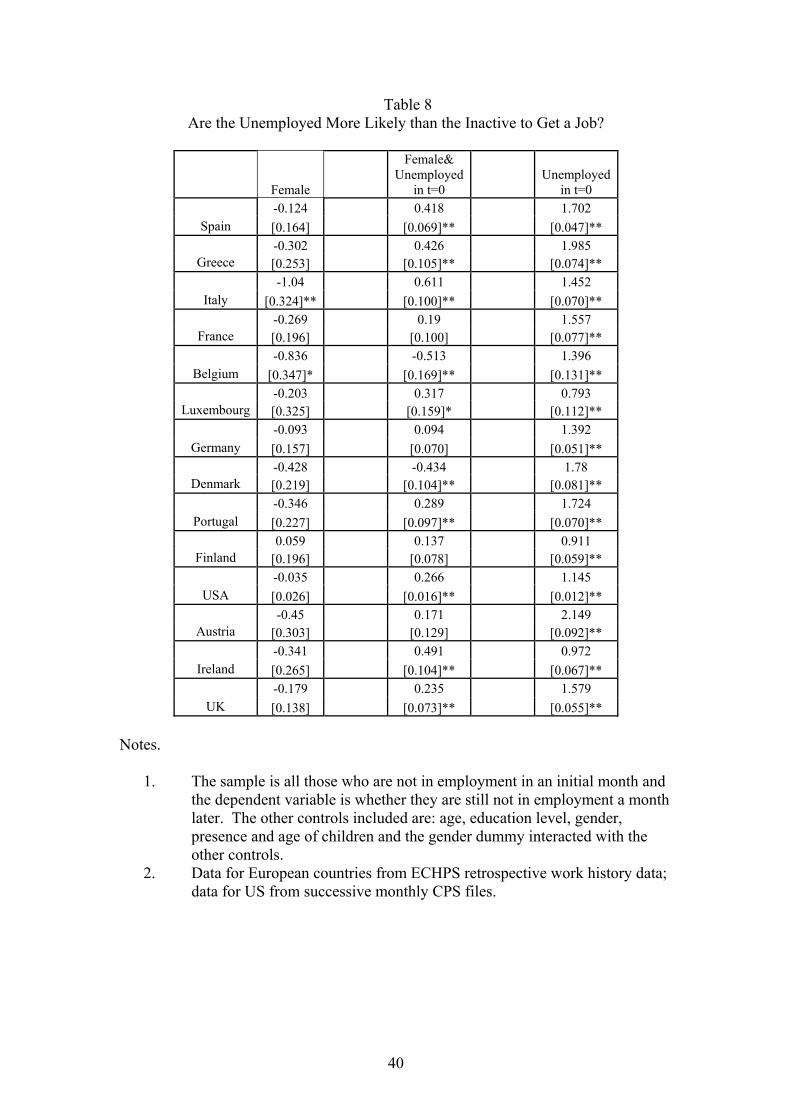
Whether unemployment and inactivity are distinct labour market states was a
question first posed by Flinn and Heckman (1983) and subsequently also addressed by
Jones and Riddell (1999). The basis of their tests is to see whether there is a
significant difference between the probability of entering employment between those
who are unemployed and those who are inactive.
Table 8 reports results for this exercise for the countries in the ECHPS. The
sample is those who are either unemployed or inactive in the initial observation and
the dependent variable is binary according to whether the individual is subsequently
in employment or not. We report the marginal effect of being in employment in a
18
month’s time of being unemployed rather than inactive. We also interact a female
dummy with this variable to see whether there are significant gender differences. In
all countries the unemployed are more likely to get a job than the inactive. The extent
of this is similar in ‘high-gap’ and ‘low-gap’ countries. Further, the interaction of the
‘initially unemployed’ variable with the female dummy is not noticeably smaller in
the ‘high-gap’ countries as one would expect if the female unemployed are less
serious about getting work than their male counterparts: indeed the interaction term is
largest in some of the ‘high-gap’ countries. There is no evidence here that, in the
‘high-gap’ countries, the difference between the unemployed and the inactive is more
blurred than in the ‘low-gap’ countries.
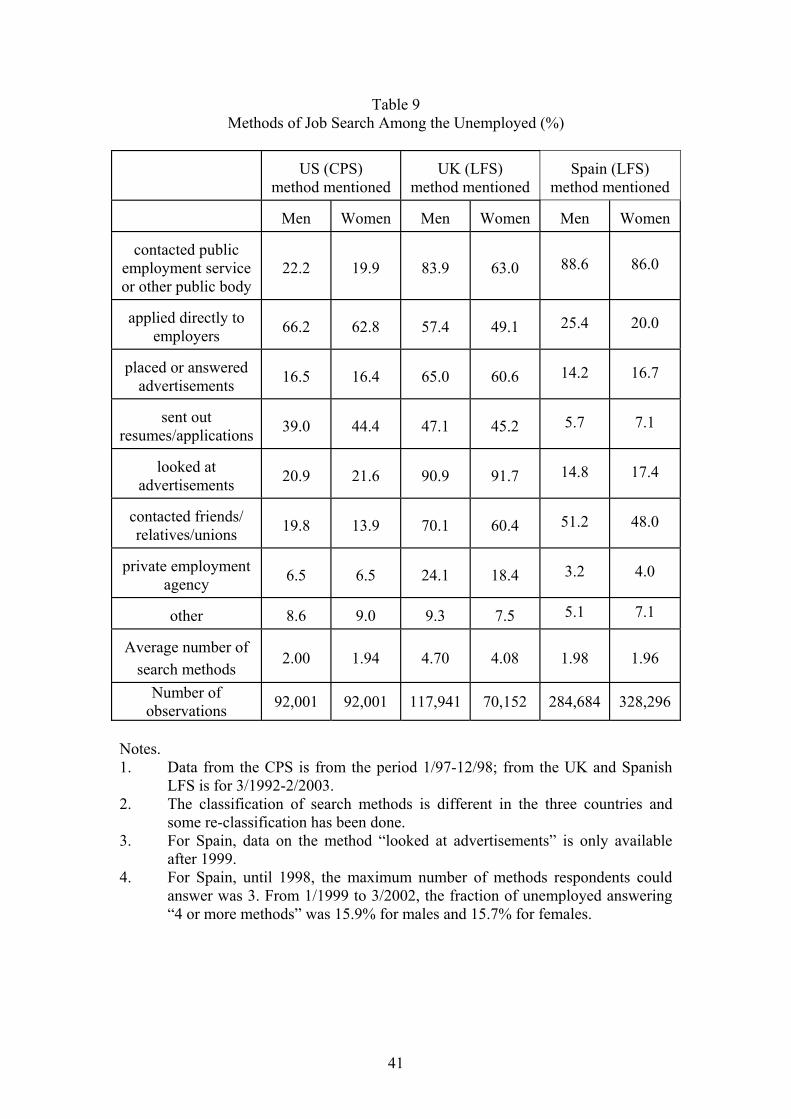
Another way to consider the hypothesis that the female unemployed in some
countries are less serious about getting work is to look at evidence on job search
intensity. Measuring search intensity is problematic and the only available evidence
is on numbers and types of job search methods that the unemployed report using
(though it should be noted that those who report using more search methods do
typically have lower durations of unemployment so these measures do seem to
capture something of what we might expect). Table 9 presents evidence for the three
countries for which we have been able to obtain it – Spain, the UK and the US. There
are sizeable and well-known differences in the use of different search methods across
countries with, for example, the unemployed in the US being much less likely to
report use of the public employment service and to report the use of personal contacts
and the UK unemployed report the use of more search methods than those in the US
and Spain11 (see Pellizari, 2003, for a cross-country comparison of search methods
used to get jobs and the wage premia associated with them). In all countries men 11 One should not make too much of this as the different countries allow respondents a different maximum number of search methods to be listed and this may influence responses although very few report the maximum allowed.
19
report using slightly more search methods than women but this gap is similar in Spain
(a ‘high-gap’ country) and the US/UK (both ‘low-gap’ countries). The limited
evidence presented provides no support for the view that the women in ‘high-gap’
countries are much less serious in their desire for work as evidenced by their search
effort.
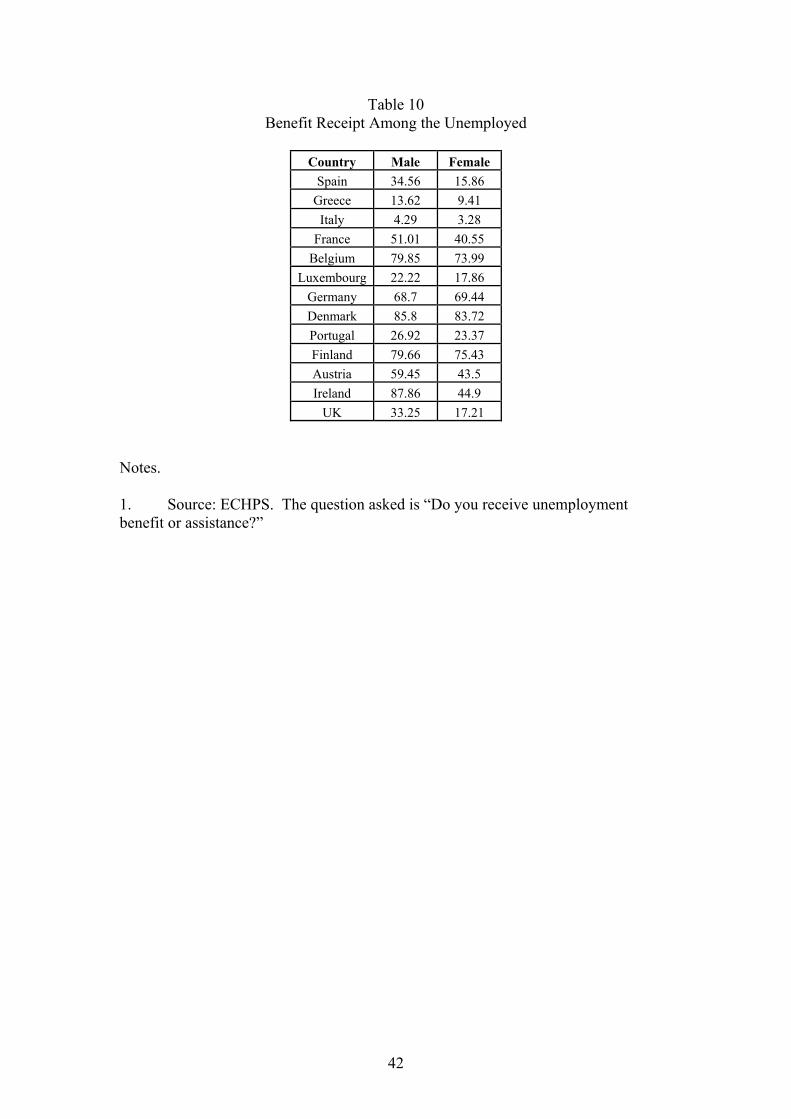
Another variant of this hypothesis is that the level and availability of welfare
benefits affects exit rate from unemployment through an effect on the reservation
wage. Table 10 presents some data on the fraction of the unemployed of different
genders who report receiving any form of welfare benefit. In most countries women
are less likely to receive welfare benefits than men, probably because their weaker
employment history makes them less likely to have established entitlement and
because unemployed women may be living with employed men so are not eligible for
means-tested benefits. Looking at this table it is very hard to see how it could
possibly form the basis of an explanation as to why, in some countries, there is such a
large gender gap in unemployment rates. For example, virtually no-one, male or
female, in Italy receives any benefits and the proportions of men and women doing so
in Spain and the UK are very similar even though they have very different gender
gaps in unemployment rates.
However, while we might expect reservation wages to be influenced by
welfare benefits, there are other factors that might be important in determining the
minimum level of wages acceptable to the unemployed. The ECHPS directly asks the
unemployed about the minimum acceptable wage at which they would work. The
female unemployed report lower reservation wages than the male unemployed but this
is unsurprising given the existence of a gender pay gap and a more pertinent question
is whether the gap between reservation wages and the average level of wages is higher
20
for women than for men. We used the ECHPS to compute gender gaps in both wages
and reservation wages corrected for personal characteristics (note that to maintain
comparability with our measure of the gender gap in unemployment rates as the
female minus the male we measure all gender gaps in this way even though the
gender gap in wages is normally measured the other way round). We then computed
a gender gap in the log of the reservation wage minus the log of the wage (we will call
this, with some abuse of terminology the gender gap in the replacement ratio) and, in
Figure 2, plot this against the gender gap in unemployment rates. The gender gap in
the replacement ratio is generally positive indicating a smaller gender gap in
reservation wages than in actual wages. But, there is no indication that the countries
with a large gender gap in replacement ratios have a large gender gap in
unemployment rates: indeed the regression line (shown on Figure 2) is negatively
sloped albeit with a t-statistic of only 1.1.
This section has explored the hypothesis that, for some reason, women in
some countries who are classified as unemployed are not as serious about wanting
work as the male unemployed or are more selective about the jobs they will take. But,
there is no evidence whatsoever for this hypothesis.
Another possible hypothesis about why women in some countries seem to find
it hard to get jobs is that employers are less likely to give women jobs. The next
section considers this.
5. Do Employers favour Men?
There are a number of possible economic and social reasons why employers in
some countries might favour men when it comes to filling jobs.
21
A natural first place to start is the relationship between the gender gap in
unemployment rate and the gender gap in wages: this is explored graphically in
Figure 312. There is a weak positive relationship between the two (the t-statistic is
1.2) suggesting that countries in which women’s pay is a lot below men’s pay have
lower gender gaps in unemployment rates. As Blau and Kahn (2003) have suggested
that cross-country differences in the gender pay gap can be better explained by
gender-unspecific labour market institutions like the minimum wage and collective
bargaining (all OECD countries now have some form of equal pay legislation), this
could be taken as weak evidence that compressing the wage structure results in higher
unemployment rates for those workers (here, women) who would, in a free market,
earn relatively low wages. But, this evidence is hardly overwhelming and the
decision to employ a man rather than a woman may not be based on a comparison of
wages alone.
For example, one sometimes hears the argument that employers prefer to
appoint men because hiring is costly and men are more likely to stick in their jobs or
because women are more likely to take time off work because their children are
sick13. Even if this is true it cannot really explain why there is a gender gap in
unemployment rates in some countries but not others. In fact, in the Mediterranean
countries where firing costs are high one would expect employers to be relatively
more favourably inclined towards employing women as groups with a higher
voluntary separation rate will be relatively attractive workers. So, this hypothesis
does not seem to have much mileage. An alternative hypothesis is that differences in
12 These gender gaps come from a regression in which personal characteristics are also included. 13 Or that because women are likely to work fewer hours than men, employers find it harder to cover the fixed costs of employment. However these differences seem small: to give one example, among full-time workers men in Spain work 2.1 hours per week more than women while in the UK the gap is 4.6 hours. Among part-time workers Spanish women work 1.3 hours less than the men whereas British women work 0.4 hours more than the men (figures from the Labour Force Surveys).
22
maternity leave legislation make employers more favourably inclined towards men in
some countries. But, as Table 11 shows, the differences in maternity leave
regulations across EU countries are relatively small and the Nordic countries which
have generous maternity provisions also have small gender gaps in unemployment
rates. Ruhm (1998) found that maternity leave was positively associated with female
employment to population ratios (he did not consider unemployment rates).
Of course, it may not be legislation that makes men more attractive to
employers than women: it could be lower levels of accumulated labour market
experience among unemployed women. This might particularly be thought to be true
in some of the ‘Mediterranean’ countries where, until recently, female labour market
participation was very low. To investigate this we estimated a model for the flows
from unemployment to employment excluding and including information on the work
history of the individual. The ECHPS does not contain information on actual labour
market experience and the best we can do is to include a variable denoting whether
the individual has ever worked before and, if so, a variable measuring the length of
time since last worked. As Table 12 shows the inclusion of these variables does little
to reduce the gender gap in flows from unemployment to employment, suggesting that
differences in work history are relatively unimportant.
Another hypothesis is prejudice or discrimination. Employers may simply feel
that women are less deserving of employment than men and make their hiring
decisions accordingly. We can get some idea as to how widespread are
discriminatory attitudes from the 1996 Eurobarometer survey that asks respondents
whether they agree with the statement “when jobs are scarce, men should have more
right to a job than women”. In all countries men are more likely than women to think
that women are less deserving of employment. But, there are also substantial
23
differences across countries with, crudely, the Nordic countries being less
discriminatory and the Mediterranean countries more so. There are also differences
across regions within countries e.g. Southern Italy is more discriminatory than
Northern Italy. Figure 4 plots the proportion against the gender differential in the
unemployment rate at regional level, marking the observations with a two-letter code
for the country to which they refer. There is a clear positive relationship between the
two variables [with a t-stat of 4.65]. One might think that all of this is driven by
differences across countries but a regression for the 139 regions shown in Figure 4
that also includes country fixed effects leads to the following results (standard errors
in parentheses):
Gender gap in unemployment rate=2.47+5.71*prejudice+country fixed effects
(0.69) (1.98)
so that there is a significant relationship between the gender gap in the unemployment
rate and the extent of prejudice against women even within countries suggesting that
some degree of discrimination may be partly responsible for the gender gap in
unemployment rates.
However, a problem with this hypothesis is that the discriminatory attitudes
have been around for a long time (as can be confirmed by examination of the 1973
and 1986 Eurobarometer surveys that contain similar questions) but, as Figure 1
showed, large gender gaps in unemployment rates are a relatively recent phenomenon.
One way to reconcile this is the following idea. When overall unemployment rates
are high and there are many applicants for most jobs, employers may be faced with a
large number of job applicants who are more or less equivalent. In this situation they
are more or less free to indulge any slight discriminatory preferences they may have
without suffering any loss in profits from doing so (Becker’s, 1957, model of
24
discrimination would predict this). In contrast, in tight labour markets, waiting for a
male job applicant rather than hiring a female one may be a much more costly
strategy. Hence, putting prejudices into practice is easier when unemployment is high
and there are long queues for jobs as has been the situation in most of the ‘high-gap’
countries in the 1980s and 1990s. This does not mean that the exercise of such
prejudice is costless: to the extent that certain groups are protected from competition
for jobs from other groups, the result is likely to be higher wage pressure and a higher
natural rate of unemployment. This conclusion is usually derived in the context of
prejudice against the long-term unemployed (see, for example, the ‘ranking’ model of
Blanchard and Diamond, 1994) but the same principles apply to other sorts of
prejudice.
A similar idea to this can be found in a recent paper by Algan and Cahuc
(2003) who focus on gender differences in employment-population ratios across
countries. They suggest that a ‘male breadwinner’ mindset, associated with the
Catholic religion, can explain the cross-country variation. This is similar to the idea
we have expressed here but they argue that the institutional form that this
discrimination takes is job protection legislation that penalizes groups of workers (like
women who have more domestic responsibilities) who have weaker labour market
attachment. But, it is not obvious that this hypothesis can explain much of the gender
gaps in the flows between employment and unemployment that we have found.
6. Mismatch
The previous two sections have explored the hypotheses that the female unemployed
in some countries might be less serious about getting work than men and that
employers might be less inclined to give jobs to women. Another possibility is that
25
there is simply a mismatch between the desires of the female unemployed in terms of
jobs they like and the jobs that employers are offering. Perhaps the most plausible
form of mismatch is that women may want part-time jobs but these are very rare in
some countries.
We do have some way of investigating this mismatch hypothesis as a number
of surveys ask the unemployed whether they are looking for full- or part-time
employment. Table 13 presents the raw data. There is not much evidence here that
there is a large disparity between the type of jobs that women report they want and the
type of jobs that are available. For example in Spain the desire for part-time
employment among the unemployed is lower than the incidence of part-time working
in the employed population (see also Petrongolo, 2003, for evidence that, in ‘high-
gap’ countries a higher proportion of women working part-time report that they would
prefer a full-time job which is also consistent with this). It seems more likely that, if
there is a deficit of part-time jobs in some countries, this results primarily in lower
female labour force participation and not in higher unemployment rates.
7. Conclusions
In many of the European countries with high unemployment rates, the female
unemployment rate is substantially above the male. This important gender gap has
hardly been studied: remedying that deficiency is the purpose of this paper. We show
that, in the countries with a large gender gap in unemployment rates, there tends to be
a large gender gap in both flows from employment into unemployment and from
unemployment into employment.
Providing explanations for this is not so easy and it is much simpler to present
evidence against hypotheses than evidence in favour of them. For example, the
26
gender gap is not well-explained by differences in the type of jobs that men and
women do, by differences in benefit receipt, by differences in the gender wage gap,
by differences in search intensity and by differences in labour market transitions
caused by the allocation of domestic responsibilities. There does seem to be some
correlation with social attitudes about whether men are more deserving of work than
women but, at the end of the paper one is left with a large part of this gender gap that
we are incapable of explaining. This, of course has its parallels in the literature on the
gender pay gap, which economists have also struggled to fully account for. An
unsatisfactory conclusion, but one that can, as usual, be used as a call for further
research.
27
References
Abowd, John M. and Arnold Zellner, (1985), “Estimating Gross Labor Force Flows”, Journal of Business and Economic Statistics, 3(3), pages 254-83. Abraham, Katherine G. and Robert Shimer, (2002), “Changes in Unemployment Duration and Labor-Force Attachment”, in Alan B. Krueger and Robert M. Solow (eds) The Roaring Nineties: Can Full Employment Be Sustained?, New York: Russell Sage Foundation. Algan, Yann and Pierre Cahuc, (2003), “Job Protection and Family Policies: the Macho Hypothesis “, University of Paris I-Pantheon Sorbonne, October. Altonji, Joseph, G. and Rebecca, M. Blank, (1999), “Race and Gender in the Labor Market”, in Ashenfelter, Orley and David Card (eds) Handbook of Labor Economics. Volume 3C. Handbooks In Economics, vol. 5. Amsterdam: North-Holland, pages 3143-3259. Becker, G. S., (1957), The Economics of Discrimination, Chicago: The University of Chicago Press. Blanchard, Olivier J. and Peter Diamond, (1994), “Ranking, Unemployment Duration, and Wages”, The Review of Economic Studies, Vol. 61, No. 3, July, pages 417-434. Blau, Francine D. and Lawrence M. Kahn, (2003), “Understanding International Differences in the Gender Pay Gap”, Journal of Labor Economics, 21, pages 106-144. Cohen, B. et al., (1999), Parental Leave: Progress or Pitfall?. Reasearch and Policy Issues in Europe, Peter Moss and Fred Deven (eds), NIDI CGGS Publications. Flinn, Christopher J. and James J. Heckman, (1983), “Are Unemployment and Out of the Labor Force Behaviorally Distinct Labor Force States?” Journal of Labor Economics; 1(1), January, pages 28-42. Ham, John C., Jan Svejnar and Katharine Terrell, (1999), “Women’s Unemployment During Transition”, Economics of Transition, 7, pages 47-78. Jones, Stephen R.G. and W. Craig Riddell, (1999), “The Measurement of Unemployment: An Empirical Approach”, Econometrica; 67(1), January , pages 147-61. Nicoletti, Cheti and Franco Peracchi, (2002), “A cross-country comparison of survey participation in the ECHP”, ISER Discussion Paper, University of Essex. OECD, (2002), “Women at work: who are they and how are they faring?”, OECD Employment Outlook, 2002, pages 61-126.

28
Pellizari, Michele, (2003), “Do Friends and Relatives Really Help in Getting a Good Job?”, Centre for Economic Performance, LSE. Peracchi, Franco, (2002), “The European Community Household Panel: A review”, Empirical economics, 27, pages 63-90. Petrongolo, Barbara, (2003), “Gender segregation in employment contracts”, Centre for Economic Performance, LSE. Ruhm, Christopher J., (1998), “The Economic Consequences of Parental Leave Mandates: Lessons from Europe”, Quarterly Journal of Economics, pages 285-317.
29
Table 1 Gender Gaps in Unemployment Rates Among OECD Countries
All Working Age (15-64) Prime-Age (25-54)
Country Male Female Difference Ratio Male Female Difference Ratio Spain 11 22.91 11.91 2.08 9.2 21 11.8 2.28
Greece 7.56 17.92 10.36 2.37 6.2 15.2 9 2.45 Italy 8.67 15.71 7.04 1.81 6.6 12.7 6.1 1.92
France 9.66 12.96 3.3 1.34 9 12.6 3.6 1.4 Belgium . . 6.1 9 2.9 1.48
Netherlands 2.74 4.49 1.75 1.64 2.1 3.8 1.7 1.81 Luxembourg 1.77 2.68 0.91 1.51 1.4 2.9 1.5 2.07
Germany 8.15 9.22 1.07 1.13 7.2 8.5 1.3 1.18 Denmark 4.69 6.54 1.85 1.39 3.7 4.9 1.2 1.32 Portugal 3.84 5.05 1.21 1.32 3.4 4.6 1.2 1.35 Finland 9.58 10.73 1.15 1.12 7.9 9 1.1 1.14
Switzerland 2.52 3.68 1.16 1.46 2.2 3.2 1 1.45 Japan 4.82 4.46 -0.36 0.93 3.7 4.4 0.7 1.19
Sweden 7.5 6.76 -0.74 0.9 5.2 5.9 0.7 1.13 USA 4.05 4.33 0.28 1.07 3 3.4 0.4 1.13
Austria 3.69 3.85 0.16 1.04 3.4 3.6 0.2 1.06 Australia 7.13 6.64 -0.49 0.93 5.5 5.3 -0.2 0.96 Canada 7.78 7.25 -0.53 0.93 6.5 6.3 -0.2 0.97
NZ 6.94 6.58 -0.36 0.95 5.5 5.3 -0.2 0.96 Norway 3.36 3.05 -0.31 0.91 2.6 2.2 -0.4 0.85 Ireland 5.9 5.5 -0.4 0.93 5.7 4.8 -0.9 0.84
UK 6.75 5.07 -1.68 0.75 5.4 4.3 -1.1 0.8 New OECD Countries Hungary 7.52 6.26 -1.26 0.83 6.7 5.6 -1.1 0.84 Turkey 7.49 7.5 0.01 1 5.9 5.5 -0.4 0.93 Mexico 1.78 2.58 0.8 1.45 1.6 2.1 0.5 1.31
Czech Rep 7.27 10.5 3.23 1.44 5.9 9.5 3.6 1.61
Notes. 1. Source: OECD Labour Market Statistics (OECD Statistical Compendium), 1999.
30
Table 2 The Marginal Effects of Characteristics on Gender Gaps in Unemployment Rates
A B C Female Female Female
F*Age(15-24)
F*Age(35-44)
F*Age(45-54)
F*Low Edu
F*High Edu F*Married F*Div/Sep
F*Kids(0-12)
F*Kids(13-15)
0.087 0.086 0.052 0.078 -0.06 -0.017 -0.004 -0.012 0.075 -0.075 0.035 -0.013 Spain [0.001]** [0.001]** [0.003]** [0.004]** [0.003]** [0.003]** [0.003] [0.003]** [0.003]** [0.004]** [0.003]** [0.004]**
0.112 0.102 0.067 0.054 -0.03 0.004 0.002 0.002 0.03 -0.011 0.026 0.038 Greece [0.001]** [0.001]** [0.003]** [0.004]** [0.002]** [0.003] [0.003] [0.002] [0.003]** [0.005]* [0.003]** [0.004]**
0.062 0.056 0.045 0.028 -0.06 0.002 0.025 -0.011 0.036 0.006 0.007 -0.011 Italy [0.001]** [0.001]** [0.002]** [0.003]** [0.002]** [0.002] [0.004]** [0.002]** [0.002]** [0.005] [0.002]** [0.003]**
0.053 0.053 0.042 0.004 -0.03 -0.019 -0.023 -0.001 0.039 -0.005 0.043 0.026 France [0.001]** [0.001]** [0.002]** [0.003] [0.002]** [0.002]** [0.002]** [0.002] [0.002]** [0.003] [0.002]** [0.004]**
0.084 0.079 0.058 0.017 -0.03 -0.001 -0.066 0.003 0.058 0.086 0.043 -0.024 Belgium [0.001]** [0.001]** [0.003]** [0.005]** [0.002]** [0.003] [0.002]** [0.003] [0.004]** [0.006]** [0.004]** [0.004]**
0.036 0.033 -0.004 0.016 0.001 0.009 -0.006 -0.001 0.045 0.029 0.028 0.028 Netherlands [0.002]** [0.002]** [0.005] [0.009] [0.006] [0.006] [0.006] [0.004] [0.009]** [0.013]* [0.008]** [0.010]**
0.007 0 -0.015 0.013 0.02 0.002 0.014 -0.004 0.044 0.014 0.002 -0.009 Luxembourg [0.001]** [0.001] [0.001]** [0.002]** [0.003]** [0.002] [0.003]** [0.001]** [0.003]** [0.003]** [0.002] [0.002]**
0.035 0.028 -0.009 0.01 0.02 0.015 -0.024 -0.026 0.05 0.003 0.048 0.019 Germany [0.001]** [0.001]** [0.002]** [0.003]** [0.002]** [0.002]** [0.002]** [0.001]** [0.002]** [0.003] [0.002]** [0.003]**
0.046 0.045 0.043 -0.023 -0.02 -0.023 -0.022 0.032 0.011 -0.011 0.059 0.046 Denmark [0.001]** [0.001]** [0.002]** [0.003]** [0.003]** [0.002]** [0.002]** [0.003]** [0.003]** [0.003]** [0.004]** [0.007]**
0.049 0.053 -0.008 0.054 -0.01 -0.008 0 0.022 0.043 -0.013 0.041 0.01 Portugal [0.001]** [0.001]** [0.003]** [0.003]** [0.002]* [0.002]** [0.005] [0.002]** [0.002]** [0.003]** [0.002]** [0.003]**
0.019 0.032 0.007 -0.009 -0.01 -0.003 0.002 -0.007 0.044 0.024 0.021 -0.003 Finland [0.001]** [0.001]** [0.003]* [0.004]* [0.003]** [0.003] [0.003] [0.003]* [0.004]** [0.005]** [0.003]** [0.004]
0.002 0.002 -0.002 0.004 -0.01 0.001 0.007 -0.001 0.012 0 USA [0.000]** [0.000]** [0.001]** [0.001]** [0.001]** [0.001] [0.001]** [0.001]* [0.001]** [0.001]
0.01 0.005 -0.006 0.016 0.01 0.011 -0.002 0.005 -0.008 0.023 0.024 0.031 Austria [0.001]** [0.001]** [0.002]** [0.003]** [0.003]** [0.003]** [0.004] [0.002]* [0.002]** [0.004]** [0.002]** [0.005]**
-0.049 -0.035 -0.006 0.038 -0.04 -0.027 0.021 0.005 -0.042 -0.06 -0.027 -0.019 Ireland [0.001]** [0.001]** [0.003]* [0.004]** [0.003]** [0.003]** [0.004]** [0.003]* [0.002]** [0.002]** [0.002]** [0.003]**
-0.037 -0.036 -0.044 0.016 0 0.012 0.018 0 -0.004 0.004 -0.003 -0.002 UK [0.001]** [0.001]** [0.002]** [0.002]** [0.002] [0.002]** [0.002]** [0.002] [0.002]* [0.002] [0.001]* [0.002]
31
Notes: 1. Data for European countries come from ECHPS, data for US from CPS. The sample is restricted to to those aged 15-54 inclusive. Dependent variable is whether individual is unemployed conditional on being in the labour force. The reported coefficients are the marginal effects. 2. Coefficient in Column marked A is that on female dummy in probit model of (1). Coefficient in Column marked B is that on female dummy in probit model of (2) where the controls are age, education (high being college graduates, ISCED 5-7, and low being less than second stage of secondary education, ISCED 0-2), marital status and number of children aged 0-12 and 13-15. Coefficient in Column marked C and subsequent columns is that on female dummy and female dummy interacted with characteristics in probit model of (3). 3. Standard errors in parentheses. ** denotes 1% significance level and * denotes 5% significance level.
32
Table 3a
Flows between Labour Market States and Implied Steady-State Unemployment Rates: Men
heu hei hue hui hiu hie heu/heu+hue (hiuhei)
(hiuhei+hiehui) α Implied Steady-State
U-Rate Actual U-Rate
Spain 1.5 0.37 7.43 0.85 0.72 1.16 16.8 21.3 0.07 17.1 17.8 Greece 0.63 0.21 9.4 0.61 0.44 0.99 6.3 13.4 0.05 6.6 9.4 Italy 0.52 0.32 3.93 0.71 0.64 0.73 11.7 28.6 0.11 13.5 12.6
France 0.61 0.29 8.43 1.85 0.86 1.33 6.7 9.2 0.12 7 10.1 Belgium 0.35 0.23 5.19 0.68 0.46 0.99 6.3 13.7 0.09 6.9 6
Luxembourg 0.21 0.29 10.69 0.72 0.3 1.82 2 6.1 0.06 2.2 2.6 Germany 0.57 0.29 7.42 1.44 0.42 1.72 7.1 4.7 0.13 6.8 6.1 Denmark 0.69 0.38 10.65 1.72 0.81 2.07 6.1 7.9 0.11 6.3 8.7 Portugal 0.43 0.23 7.44 0.84 0.35 1.14 5.5 7.9 0.08 5.7 5.2 Finland 0.92 1.01 9.06 2.63 0.97 3.44 9.3 9.8 0.19 9.3 11.2
USA 1.26 1.37 51.35 29.22 6.11 10.7 2.4 2.6 0.27 2.5 3.4 Austria 0.61 0.37 14.12 1.35 0.31 1.52 4.1 5.2 0.07 4.2 3.1 Ireland 0.57 0.38 4.57 0.54 0.76 2.54 11.2 17.5 0.09 11.7 12.5
UK 0.61 0.25 7.7 1.49 0.96 1.7 7.4 8.8 0.11 7.5 6.7
Notes.
1. Data for European countries are from retrospective monthly work history data in ECHPS. Retrospective monthly data from Sweden and Netherlands is missing. US data from successive monthly CPS. Sample restricted to those aged between 25 and 54.
2. Hazard Rates are estimated using the methodology described in (7).
33
Table 3b Flows between Labour Market States and Implied Steady-State Unemployment Rates: Women
heu hei hue hui hiu hie heu/heu+hue (hiuhei)
(hiuhei+hiehui) α Implied Steady-
State U-Rate Actual U-Rate
Spain 1.9 0.89 5.62 1.49 0.37 0.55 25.3 28.7 0.14 25.8 31.9 Greece 1.05 0.79 5.75 1.1 0.25 0.55 15.5 24.9 0.13 16.7 23 Italy 0.74 0.7 3.62 1.11 0.3 0.45 17 29.5 0.18 19.2 24.2
France 0.76 0.44 6.29 1.99 0.49 0.79 10.7 12.1 0.17 11 16.2 Belgium 0.56 0.65 3.19 0.96 0.33 0.92 14.8 19.3 0.19 15.7 9.7
Luxembourg 0.23 0.66 8.61 2.13 0.09 0.83 2.6 3.3 0.18 2.7 5.9 Germany 0.61 0.45 5.03 1.46 0.23 0.97 10.8 6.8 0.18 10 9.6 Denmark 0.93 0.65 7.11 2.54 0.83 1.97 11.6 9.7 0.2 11.2 9.3 Portugal 0.62 0.43 5.85 1 0.21 0.66 9.6 12.1 0.12 9.8 10.5 Finland 1.14 1.59 8.74 3.45 0.91 3.22 11.5 11.6 0.24 11.5 12
USA 1.09 2.69 51.09 46.41 3.59 7.25 2.1 2.8 0.38 2.4 3 Austria 0.59 0.65 9.23 2.11 0.18 0.77 6 6.6 0.16 6.1 5.4 Ireland 0.62 1.24 8.63 2.32 0.18 1.15 6.7 7.6 0.19 6.9 12.4
UK 0.39 0.85 10.27 4.06 0.39 1.64 3.6 4.7 0.24 3.9 4
Notes. 1. As for Table 3a.
34
Table 4a Gender Gaps in Labour Market Transition Rates: No Other Controls
Country E→U U→E U→I E→I I→U I→E
0.236 -0.278 0.564 0.878 -0.67 -0.746 Spain [0.045]** [0.037]** [0.063]** [0.056]** [0.059]** [0.053]**
0.517 -0.489 0.595 1.32 -0.544 -0.578 Greece [0.066]** [0.058]** [0.127]** [0.067]** [0.091]** [0.066]**
0.351 -0.081 0.446 0.775 -0.772 -0.487 Italy [0.063]** [0.055] [0.077]** [0.054]** [0.061]** [0.063]**
0.217 -0.291 0.077 0.423 -0.558 -0.511 France [0.062]** [0.059]** [0.086] [0.064]** [0.088]** [0.072]**
0.472 -0.485 0.339 1.017 -0.327 -0.062 Belgium [0.102]** [0.111]** [0.172]* [0.094]** [0.142]* [0.106]
0.065 -0.216 1.082 0.818 -1.17 -0.778 Luxembourg [0.125] [0.112] [0.277]** [0.081]** [0.207]** [0.089]**
0.067 -0.385 0.014 0.45 -0.614 -0.566 Germany [0.043] [0.046]** [0.074] [0.051]** [0.088]** [0.049]**
0.302 -0.4 0.392 0.544 0.023 -0.049 Denmark [0.072]** [0.069]** [0.112]** [0.081]** [0.116] [0.078]
0.36 -0.237 0.171 0.603 -0.517 -0.548 Portugal [0.071]** [0.065]** [0.121] [0.068]** [0.102]** [0.062]**
0.206 -0.029 0.28 0.458 -0.06 -0.063 Finland [0.067]** [0.061] (3.22)** (7.91)** [0.087] [0.049]
-0.142 -0.005 0.463 0.463 -0.532 -0.39 USA [0.013]** [0.012] [0.014]** [0.014]** [0.014]** [0.010]**
-0.029 -0.421 0.452 0.569 -0.551 -0.68 Austria [0.092] [0.103]** [0.163]** [0.074]** [0.145]** [0.073]**
0.074 0.631 1.457 1.176 -1.453 -0.789 Ireland [0.077] [0.077]** [0.139]** [0.071]** [0.111]** [0.061]**
-0.463 0.29 1.001 1.207 -0.908 -0.033 UK [0.054]** [0.054]** [0.077]** [0.051]** [0.071]** [0.046]
Notes.
1. Data as for Table 3a. 2. These represent the coefficients on a female dummy for the method for
estimating hazard rates described in the text i.e. the models of (7) and (8). Standard errors in parentheses.
35
Table 4b Gender Gaps in Labour Market Transition Rates: With Controls
Country E→U U→E U→I E→I I→U I→E
0.275 -0.354 0.575 0.884 -0.366 -0.574 Spain [0.045]** [0.038]** [0.066]** [0.060]** [0.067]** [0.061]**
0.538 -0.47 0.551 1.312 -0.002 -0.608 Greece [0.067]** [0.058]** [0.133]** [0.067]** [0.103] [0.081]**
0.394 -0.138 0.359 0.849 -0.263 -0.641 Italy [0.064]** [0.057]* [0.081]** [0.056]** [0.066]** [0.080]**
0.266 -0.341 -0.008 0.422 -0.497 -0.525 France [0.061]** [0.059]** [0.088] [0.065]** [0.111]** [0.085]**
0.466 -0.49 0.424 1.059 -0.245 -0.343 Belgium [0.100]** [0.115]** [0.187]* [0.095]** [0.158] [0.123]**
-0.189 -0.195 0.94 0.93 -0.698 -0.641 Luxembourg [0.128] [0.111] [0.287]** [0.086]** [0.266]** [0.114]**
0.012 -0.425 0.05 0.395 -0.519 -0.34 Germany [0.043] [0.046]** [0.075] [0.053]** [0.110]** [0.059]**
0.371 -0.432 0.387 0.609 -0.064 0.026 Denmark [0.071]** [0.068]** [0.116]** [0.080]** [0.114] [0.075]
0.446 -0.3 0.16 0.69 -0.257 -0.56 Portugal [0.073]** [0.068]** [0.122] [0.069]** [0.111]* [0.069]**
0.344 -0.068 0.28 0.629 -0.341 -0.179 Finland [0.066]** [0.060] [0.088]** [0.061]** [0.093]** [0.048]**
-0.114 -0.012 0.474 0.474 -0.463 -0.436 USA [0.013]** [0.012] [0.014]** [0.014]** [0.015]** [0.011]**
-0.05 -0.511 0.578 0.527 -0.408 -0.509 Austria [0.093] [0.102]** [0.168]** [7.12]** [0.176]* [0.079]**
0.062 0.401 1.058 1.174 -0.687 -0.22 Ireland [0.080] [0.079]** [0.164]** [0.077]** [0.129]** [0.057]**
-0.473 0.292 1.019 1.206 -0.76 -0.111 UK [0.054]** [0.053]** [0.078]** [0.051]** [0.084]** [0.050]*
Notes.
1. Data as for Table 3a. Controls are age, education, marital status and number of children.
36
Table 5 Gender Gaps in Unemployment Durations
Country % of unemployed with duration
>6mths % of unemployed with duration
>12mths Men Women Gender Gap Men Women Gender Gap
Spain 62.1 72 9.9 45.4 55.5 10.1 Greece 69 77.7 8.7 48.6 59.5 10.9
Italy 76.6 77.7 1.1 62.1 60.7 -1.4 France 53.7 57.4 3.7 39 41.7 2.7
Belgium 73.2 73.8 0.6 60.1 60.9 0.8 Netherlands 75.1 84.9 9.8 47.7 40.4 -7.3 Luxembourg 61.6 47.5 -14.1 38.6 27.2 -11.4
Germany 65.3 69.4 4.1 49.9 54 4.1 Denmark 38.6 38.5 -0.1 20.9 20.1 -0.8 Portugal 63.5 64.2 0.7 39.5 42.9 3.4 Finland 49.2 43.7 -5.5 33.1 26.2 -6.9
Switzerland 59.3 63.1 3.8 40.6 38.7 -1.9 Japan 49.5 36.9 -12.6 27.4 14.8 -12.6
Sweden 48.5 41.2 -7.3 33.3 26.1 -7.2 USA 13 11.6 -1.4 7.4 6.2 -1.2
Austria 43.6 39.8 -3.8 32.7 24.1 -8.6 Australia 50.9 44.9 -6 31.8 25.8 -6 Canada 23.3 18.9 -4.4 12.8 10.2 -2.6
NZ 42.5 34.3 -8.2 23 17.9 -5.1 Norway 17.1 15.6 -1.5 7.3 6.3 -1 Ireland 77.8 72.9 -4.9 59.5 47.5 -12
UK 50.1 37.6 -12.5 34.5 21.5 -13
Notes: 1. Source: OECD Employment Outlook 1999.
37
Table 6 Gender Differences in Flows from Employment to Unemployment
No Controls
Controls on Personal
Characteristics Controls on Personal Characteristics and Interactions
Controls on Personal and
Job Characteristics
Country
Coefficient on
Female dummy
Coefficient on Female dummy
Coefficient on
Female Dummy
Coefficient on
Female* married
Coefficient on
Female* kids0-12
Coefficient on
Female* kids13-15
Coefficient on Female dummy
0.222 0.239 0.199 0.01 0.071 0.167 0.141 Spain [0.052]** [0.054]** [0.080]* [0.116] [0.141] [0.194] [0.060]*
0.531 0.549 0.516 0.01 0.061 0.364 0.554 Greece [0.074]** [0.076]** [0.114]** [0.169] [0.214] [0.285] [0.084]**
0.056 0.136 0.1 -0.134 0.254 0.205 0.018 Italy [0.070] [0.071] [0.098] [0.160] [0.195] [0.277] [0.077]
0.357 0.432 0.158 0.394 0.358 -0.393 0.279 France [0.096]** [0.097]** [0.152] [0.207] [0.232] [0.422] [0.118]*
0.717 0.803 0.449 0.348 0.677 0.039 0.729 Belgium [0.132]** [0.134]** [0.207]* [0.284] [0.391] [0.657] [0.162]**
0.597 1.007 0.168 0.527 0.172 0.592 1.152 Netherlands [0.133]** [0.118]** [0.202] [0.305] [0.353] [0.443] [0.150]**
0.334 0.28 -0.43 1.511 -0.069 -0.014 0.149 Luxembourg [0.296] [0.302] [0.515] [0.688]* [0.796] [1.491] [0.394]
0.153 0.083 -0.374 0.486 0.289 0.468 0.108 Germany [0.053]** [0.054] [0.090]** [0.115]** [0.135]* [0.213]* [0.065]
0.612 0.636 0.238 0.206 0.586 13.362 0.502 Denmark [0.118]** [0.120]** [0.173] [0.249] [0.323] [363.531] [0.140]**
0.448 0.543 0.243 -0.006 0.681 0.427 0.49 Portugal [0.078]** [0.080]** [0.136] [0.169] [0.191]** [0.275] [0.086]**
0.358 0.435 0.204 0.405 0.011 -0.071 0.451 Finland [0.124]** [0.127]** [0.214] [0.271] [0.290] [0.421] [0.153]**
0.014 0.205 0.117 0.095 -0.36 -0.02 0.367 Sweden [0.093] [0.125] [0.169] [0.196] [0.211] [0.280] [0.151]*
0.29 -0.011 0.271 -0.691 0.712 0.211 -0.202 Austria [0.122]* [0.111] [0.197] [0.260]** [0.279]* [0.498] [0.131]
-0.103 -0.223 0.12 -0.232 -0.048 -0.521 -0.234 Ireland [0.108] [0.089]* [0.175] [0.235] [0.271] [0.413] [0.103]*
-0.188 0.028 -0.211 -0.129 0.091 0.314 0.032 UK [0.089]* [0.094] [0.131] [0.187] [0.245] [0.341] [0.104]
Notes. 1. Data is from ECHPS. The sample is all those who are employed at one
interview and employed or unemployed subsequently. Model estimated is a cloglog model where the dependent variable takes the value one if the individual is still employed.
2. Standard errors in parentheses. 3. The ILO main activity status is used for Sweden as the Self-Defined main
activity status question, used for the other countries, is not asked.
38
Table 7a Reasons for leaving Previous Job (%): Currently Unemployed
Obliged Sick
by
Employer End of
Contract
Child Birth/ Care /Disabled Retired Other*
Sample Size
M 22 63 0 3 0 12 3575 Spain F 17 64 5 2 0 12 2652
M 38 37 0 3 2 21 1097 Greece F 38 39 5 1 2 15 1331
M 39 36 1 4 8 11 1494 Italy F 28 46 4 3 10 9 1169
M 41 44 0 3 0 12 999 France F 34 44 6 2 0 15 1271
M 55 18 0 0 8 19 536 Belgium F 43 22 8 11 1 14 939
M 30 15 2 34 2 17 709 Netherlands F 12 12 42 13 1 21 1917
M 59 20 0 2 9 10 2191 Germany F 54 22 1 2 9 12 2421
M 42 26 1 9 1 21 590 Denmark F 36 29 7 10 3 16 906
M 24 40 0 5 2 30 971 Portugal F 24 44 4 5 1 23 1252
M 28 57 0 2 1 11 1009 Finland F 22 60 4 3 1 10 1123
M 43 10 1 1 33 13 464 Austria F 33 15 18 11 1 22 398
M 41 33 1 6 0 19 1393 Ireland F 26 33 3 9 0 29 409
M 45 18 1 6 15 16 1332 UK F 23 16 16 7 17 21 611
Note:
1. Data from ECHPS. Question only asked of those who have worked within the last two years.
2. Other reasons includes: Marriage, Move for partner's job, Closure of own business & Study/National service.
39
Table 7b Reasons for leaving Previous Job (%): Currently Inactive
Obliged Sick/
by
Employer End of
Contract
Child Birth/ Care Disabled Retired Other*
Sample Size
M 20 20 0 32 7 21 3259 Spain F 12 30 16 12 1 28 5105
M 10 5 0 15 60 10 1895 Greece F 16 13 22 11 5 33 2374
M 16 6 0 13 52 13 3832 Italy F 13 12 21 7 29 17 4645
M 33 5 1 19 35 6 1805 France F 17 11 21 13 16 22 3029
M 37 2 0 22 32 7 949 Belgium F 21 8 16 16 16 23 1419
M 8 4 1 34 28 24 1598 Netherlands F 7 8 38 16 4 27 3490
M 46 10 0 11 19 15 3416 Germany F 27 8 19 5 18 24 6850
M 10 11 0 30 17 32 969 Denmark F 12 14 5 27 14 29 1737
M 4 5 0 32 41 18 1671 Portugal F 6 12 11 26 16 29 2767
M 10 31 0 23 10 25 2029 Finland F 9 34 9 16 7 25 2631
M 12 2 0 36 34 16 1575 Austria F 9 3 36 15 21 17 2581
M 18 7 1 33 10 30 1297 Ireland F 11 10 36 12 1 30 3622
M 22 6 4 18 33 17 1949 UK F 12 6 36 8 22 16 6318
Notes:
1. As for Table 7a.
40
Table 8 Are the Unemployed More Likely than the Inactive to Get a Job?
Female
Female& Unemployed
in t=0 Unemployed
in t=0 -0.124 0.418 1.702
Spain [0.164] [0.069]** [0.047]** -0.302 0.426 1.985
Greece [0.253] [0.105]** [0.074]** -1.04 0.611 1.452
Italy [0.324]** [0.100]** [0.070]** -0.269 0.19 1.557
France [0.196] [0.100] [0.077]** -0.836 -0.513 1.396
Belgium [0.347]* [0.169]** [0.131]** -0.203 0.317 0.793
Luxembourg [0.325] [0.159]* [0.112]** -0.093 0.094 1.392
Germany [0.157] [0.070] [0.051]** -0.428 -0.434 1.78
Denmark [0.219] [0.104]** [0.081]** -0.346 0.289 1.724
Portugal [0.227] [0.097]** [0.070]** 0.059 0.137 0.911
Finland [0.196] [0.078] [0.059]** -0.035 0.266 1.145
USA [0.026] [0.016]** [0.012]** -0.45 0.171 2.149
Austria [0.303] [0.129] [0.092]** -0.341 0.491 0.972
Ireland [0.265] [0.104]** [0.067]** -0.179 0.235 1.579
UK [0.138] [0.073]** [0.055]**
Notes.
1. The sample is all those who are not in employment in an initial month and the dependent variable is whether they are still not in employment a month later. The other controls included are: age, education level, gender, presence and age of children and the gender dummy interacted with the other controls.
2. Data for European countries from ECHPS retrospective work history data; data for US from successive monthly CPS files.
41
Table 9 Methods of Job Search Among the Unemployed (%)
US (CPS) method mentioned
UK (LFS)
method mentioned
Spain (LFS)
method mentioned
Men Women
Men
Women
Men
Women
contacted public
employment service or other public body
22.2
19.9
83.9
63.0 88.6 86.0
applied directly to
employers
66.2
62.8
57.4
49.1 25.4 20.0
placed or answered
advertisements
16.5
16.4
65.0
60.6 14.2 16.7
sent out
resumes/applications
39.0
44.4
47.1
45.2 5.7 7.1
looked at
advertisements
20.9
21.6
90.9
91.7 14.8 17.4
contacted friends/ relatives/unions
19.8
13.9
70.1
60.4 51.2 48.0
private employment
agency
6.5
6.5
24.1
18.4 3.2 4.0
other
8.6
9.0
9.3
7.5 5.1 7.1
Average number of
search methods
2.00
1.94
4.70
4.08
1.98
1.96
Number of observations 92,001 92,001 117,941 70,152 284,684 328,296
Notes. 1. Data from the CPS is from the period 1/97-12/98; from the UK and Spanish
LFS is for 3/1992-2/2003. 2. The classification of search methods is different in the three countries and
some re-classification has been done. 3. For Spain, data on the method “looked at advertisements” is only available
after 1999. 4. For Spain, until 1998, the maximum number of methods respondents could
answer was 3. From 1/1999 to 3/2002, the fraction of unemployed answering “4 or more methods” was 15.9% for males and 15.7% for females.
42
Table 10 Benefit Receipt Among the Unemployed
Country Male Female
Spain 34.56 15.86 Greece 13.62 9.41 Italy 4.29 3.28
France 51.01 40.55 Belgium 79.85 73.99
Luxembourg 22.22 17.86 Germany 68.7 69.44 Denmark 85.8 83.72 Portugal 26.92 23.37 Finland 79.66 75.43 Austria 59.45 43.5 Ireland 87.86 44.9
UK 33.25 17.21
Notes. 1. Source: ECHPS. The question asked is “Do you receive unemployment benefit or assistance?”
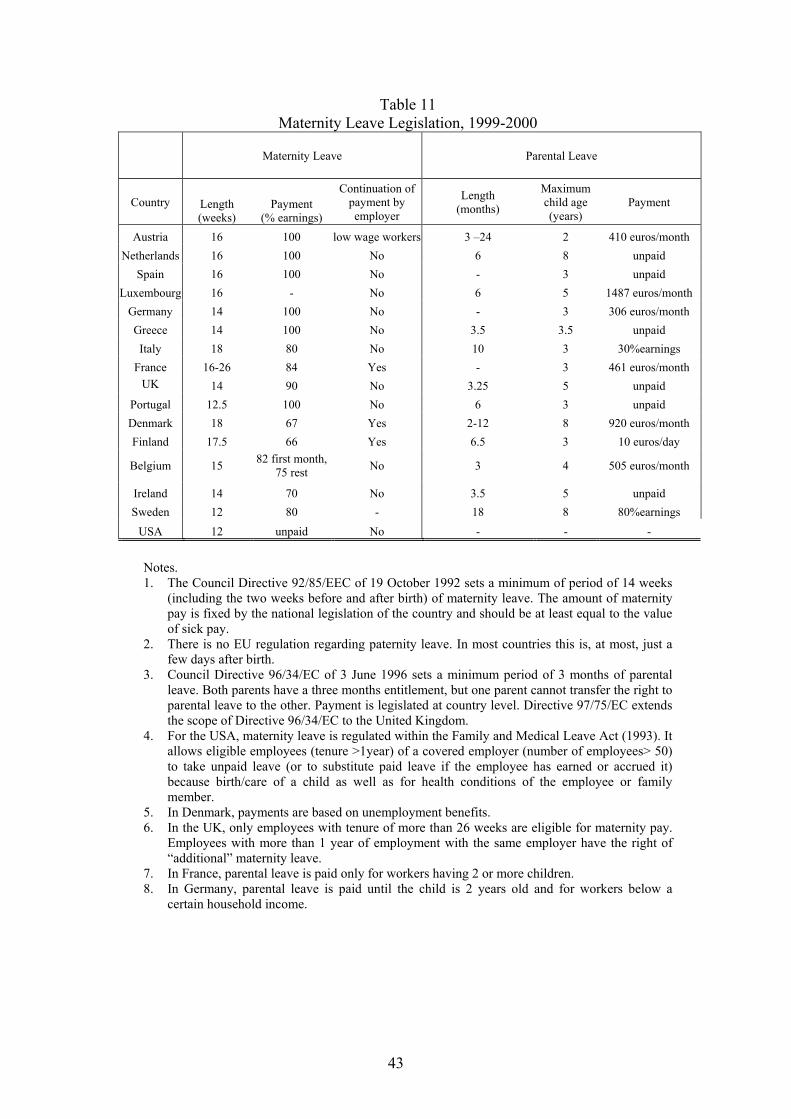
43
Table 11 Maternity Leave Legislation, 1999-2000
Maternity Leave Parental Leave
Country Length (weeks)
Payment (% earnings)
Continuation of payment by employer
Length (months)
Maximum child age (years)
Payment
Austria 16 100 low wage workers 3 –24 2 410 euros/month Netherlands 16 100 No 6 8 unpaid
Spain 16 100 No - 3 unpaid Luxembourg 16 - No 6 5 1487 euros/month
Germany 14 100 No - 3 306 euros/month Greece 14 100 No 3.5 3.5 unpaid Italy 18 80 No 10 3 30%earnings
France 16-26 84 Yes - 3 461 euros/month UK 14 90 No 3.25 5 unpaid
Portugal 12.5 100 No 6 3 unpaid Denmark 18 67 Yes 2-12 8 920 euros/month Finland 17.5 66 Yes 6.5 3 10 euros/day
Belgium 15 82 first month, 75 rest No 3 4 505 euros/month
Ireland 14 70 No 3.5 5 unpaid Sweden 12 80 - 18 8 80%earnings
USA 12 unpaid No - - -
Notes. 1. The Council Directive 92/85/EEC of 19 October 1992 sets a minimum of period of 14 weeks
(including the two weeks before and after birth) of maternity leave. The amount of maternity pay is fixed by the national legislation of the country and should be at least equal to the value of sick pay.
2. There is no EU regulation regarding paternity leave. In most countries this is, at most, just a few days after birth.
3. Council Directive 96/34/EC of 3 June 1996 sets a minimum period of 3 months of parental leave. Both parents have a three months entitlement, but one parent cannot transfer the right to parental leave to the other. Payment is legislated at country level. Directive 97/75/EC extends the scope of Directive 96/34/EC to the United Kingdom.
4. For the USA, maternity leave is regulated within the Family and Medical Leave Act (1993). It allows eligible employees (tenure >1year) of a covered employer (number of employees> 50) to take unpaid leave (or to substitute paid leave if the employee has earned or accrued it) because birth/care of a child as well as for health conditions of the employee or family member.
5. In Denmark, payments are based on unemployment benefits. 6. In the UK, only employees with tenure of more than 26 weeks are eligible for maternity pay.
Employees with more than 1 year of employment with the same employer have the right of “additional” maternity leave.
7. In France, parental leave is paid only for workers having 2 or more children. 8. In Germany, parental leave is paid until the child is 2 years old and for workers below a
certain household income.
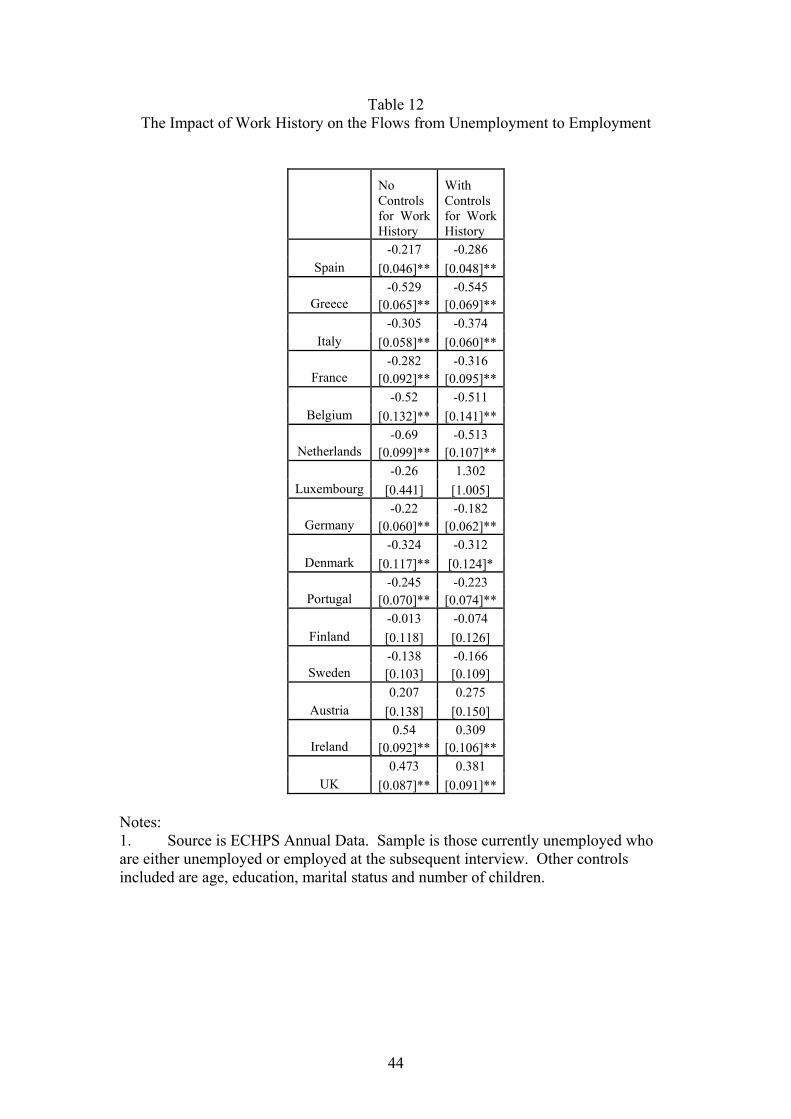
44
Table 12 The Impact of Work History on the Flows from Unemployment to Employment
No Controls for Work History
With Controls for Work History
-0.217 -0.286 Spain [0.046]** [0.048]**
-0.529 -0.545 Greece [0.065]** [0.069]**
-0.305 -0.374 Italy [0.058]** [0.060]**
-0.282 -0.316 France [0.092]** [0.095]**
-0.52 -0.511 Belgium [0.132]** [0.141]**
-0.69 -0.513 Netherlands [0.099]** [0.107]**
-0.26 1.302 Luxembourg [0.441] [1.005]
-0.22 -0.182 Germany [0.060]** [0.062]**
-0.324 -0.312 Denmark [0.117]** [0.124]*
-0.245 -0.223 Portugal [0.070]** [0.074]**
-0.013 -0.074 Finland [0.118] [0.126]
-0.138 -0.166 Sweden [0.103] [0.109]
0.207 0.275 Austria [0.138] [0.150]
0.54 0.309 Ireland [0.092]** [0.106]**
0.473 0.381 UK [0.087]** [0.091]**
Notes: 1. Source is ECHPS Annual Data. Sample is those currently unemployed who are either unemployed or employed at the subsequent interview. Other controls included are age, education, marital status and number of children.
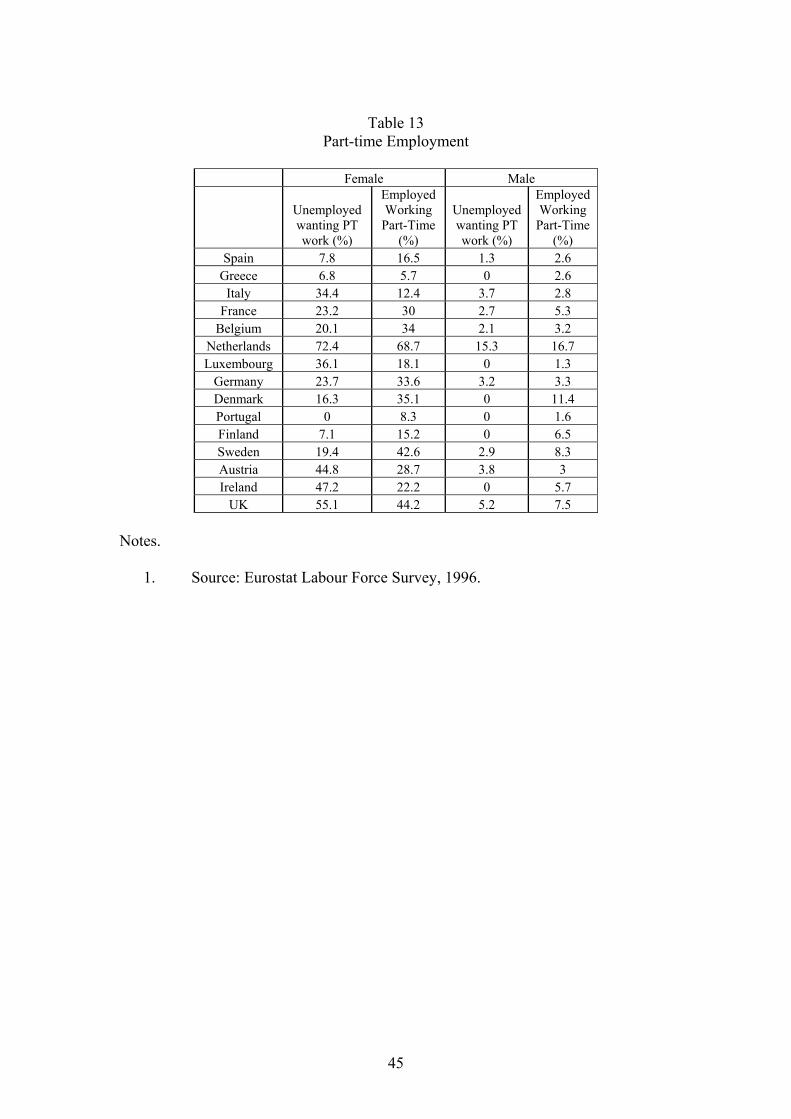
45
Table 13
Part-time Employment
Female Male
Unemployed wanting PT work (%)
Employed Working Part-Time
(%)
Unemployed wanting PT work (%)
Employed Working Part-Time
(%) Spain 7.8 16.5 1.3 2.6
Greece 6.8 5.7 0 2.6 Italy 34.4 12.4 3.7 2.8
France 23.2 30 2.7 5.3 Belgium 20.1 34 2.1 3.2
Netherlands 72.4 68.7 15.3 16.7 Luxembourg 36.1 18.1 0 1.3
Germany 23.7 33.6 3.2 3.3 Denmark 16.3 35.1 0 11.4 Portugal 0 8.3 0 1.6 Finland 7.1 15.2 0 6.5 Sweden 19.4 42.6 2.9 8.3 Austria 44.8 28.7 3.8 3 Ireland 47.2 22.2 0 5.7
UK 55.1 44.2 5.2 7.5
Notes.
1. Source: Eurostat Labour Force Survey, 1996.
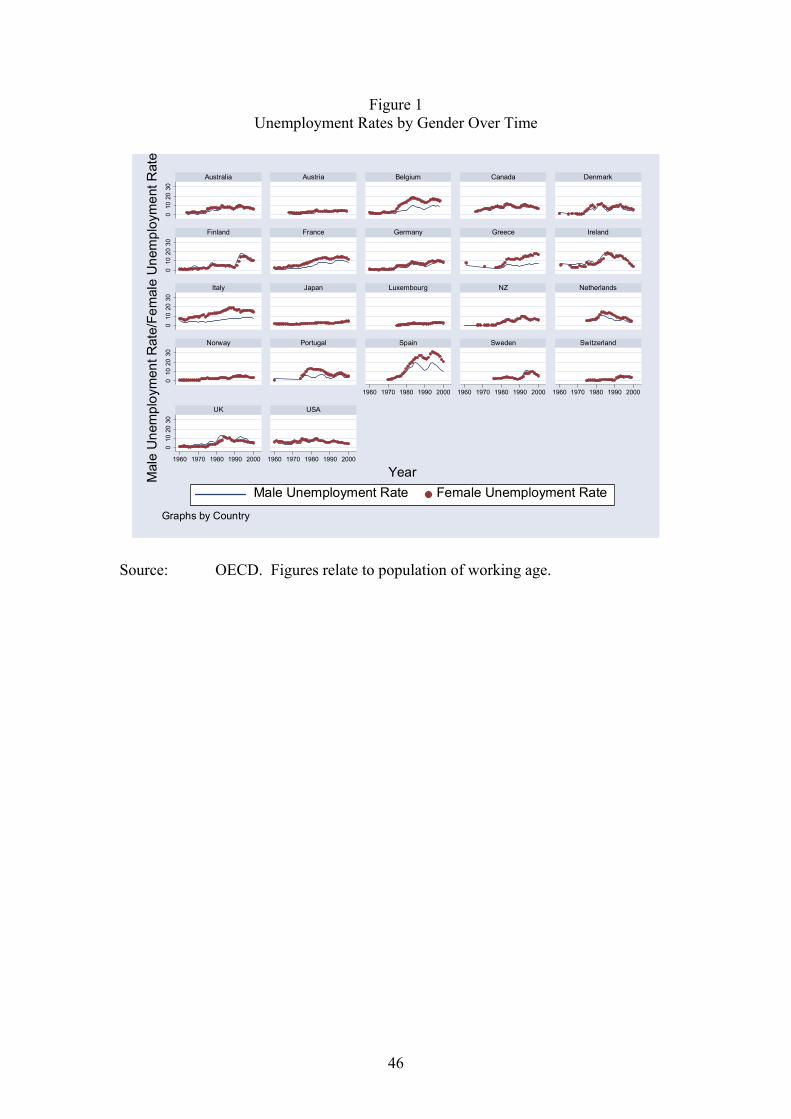
46
Figure 1 Unemployment Rates by Gender Over Time
0
1020
300
1020
300
1020
300
1020
300
1020
30
1960 1970 1980 1990 2000 1960 1970 1980 1990 2000 1960 1970 1980 1990 2000
1960 1970 1980 1990 2000 1960 1970 1980 1990 2000
Australia Austria Belgium Canada Denmark
Finland France Germany Greece Ireland
Italy Japan Luxembourg NZ Netherlands
Norway Portugal Spain Sweden Switzerland
UK USA
Male Unemployment Rate Female Unemployment Rate
Mal
e U
nem
ploy
men
t Rat
e/Fe
mal
e U
nem
ploy
men
t Rat
e
Year
Graphs by Country
Source: OECD. Figures relate to population of working age.
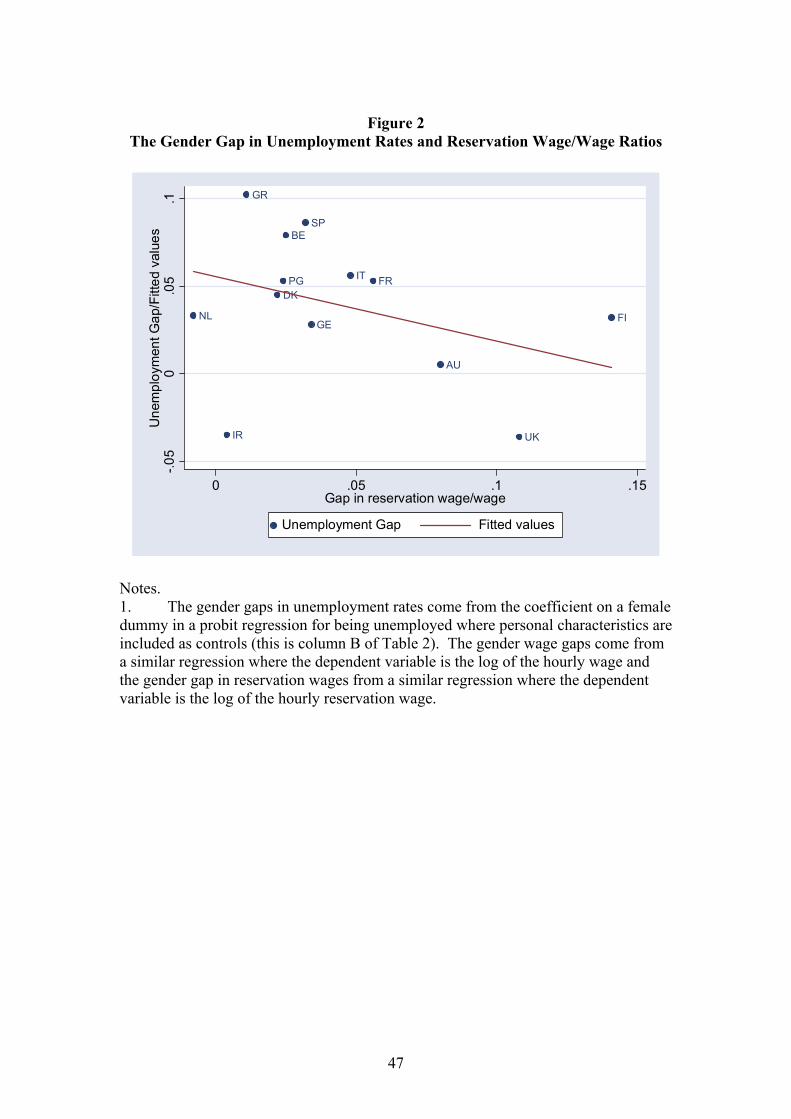
47
Figure 2
The Gender Gap in Unemployment Rates and Reservation Wage/Wage Ratios
AU
BE
DK
FI
FR
GE
GR
IR
IT
NL
PG
SP
UK
-.05
0.0
5.1
Une
mpl
oym
ent G
ap/F
itted
val
ues
0 .05 .1 .15Gap in reservation wage/wage
Unemployment Gap Fitted values
Notes. 1. The gender gaps in unemployment rates come from the coefficient on a female dummy in a probit regression for being unemployed where personal characteristics are included as controls (this is column B of Table 2). The gender wage gaps come from a similar regression where the dependent variable is the log of the hourly wage and the gender gap in reservation wages from a similar regression where the dependent variable is the log of the hourly reservation wage.
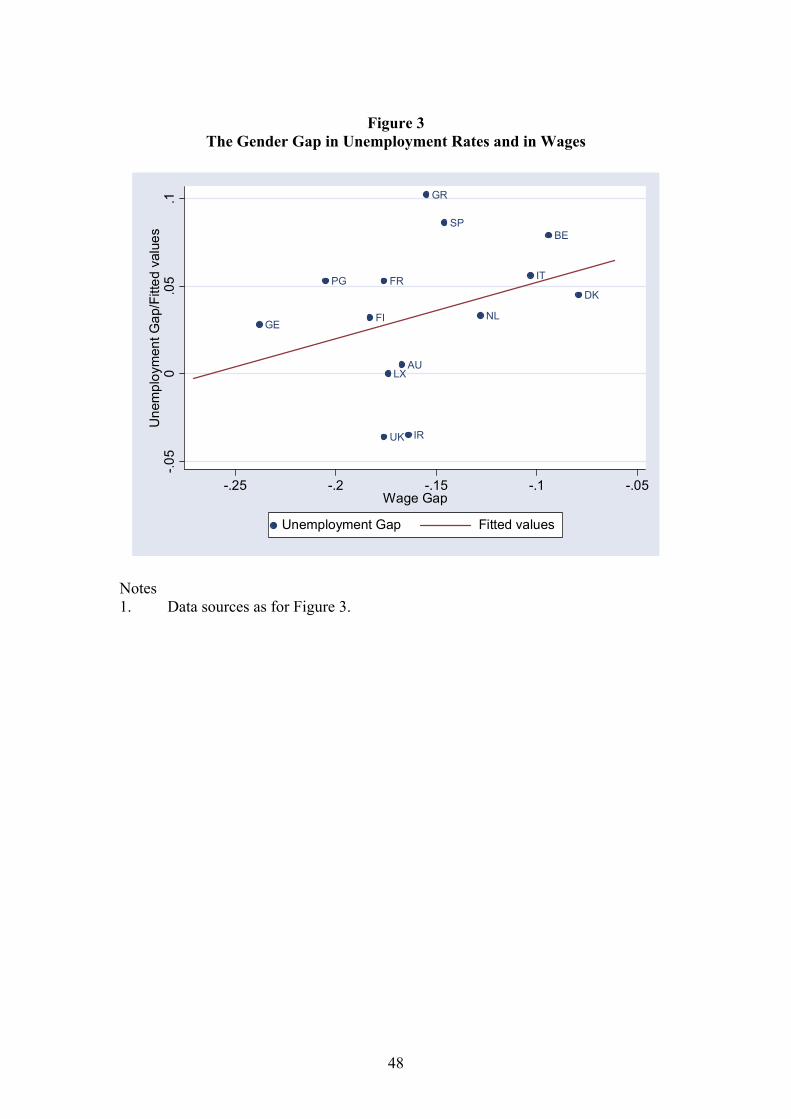
48
Figure 3
The Gender Gap in Unemployment Rates and in Wages
AU
BE
DK
FI
FR
GE
GR
IR
IT
LX
NL
PG
SP
UK
-.05
0.0
5.1
Une
mpl
oym
ent G
ap/F
itted
val
ues
-.25 -.2 -.15 -.1 -.05Wage Gap
Unemployment Gap Fitted values
Notes 1. Data sources as for Figure 3.
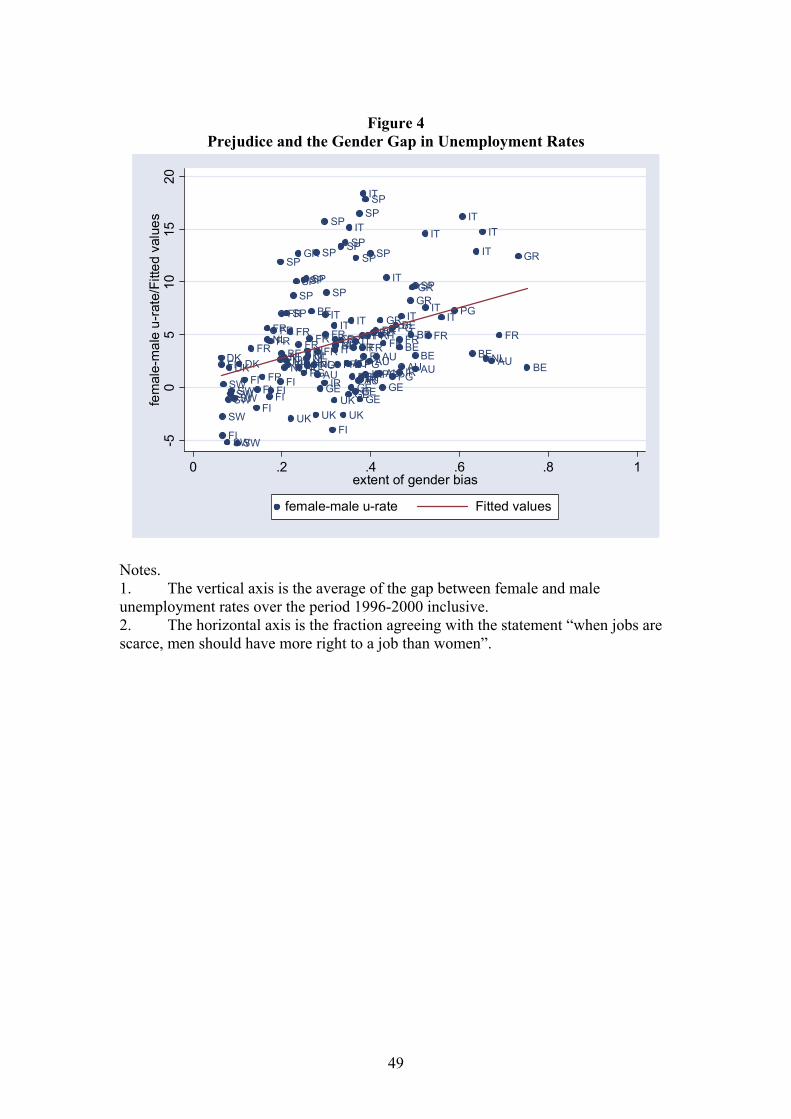
49
Figure 4
Prejudice and the Gender Gap in Unemployment Rates
BE
BE
BE
BE
BE BEBEBE
BE
BE
BE
DK DKDK
GEGE GEGEGE
GE
GR
GR
GR
GR
GR
SP
SP
SP SP
SP
SP
SP
SP
SP
SP
SPSP
SPSP
SP
SP
FR FRFRFR
FR
FR FRFRFR
FRFRFR FRFR
FR
FR
FR
FR FR
FR
FRFR
IRIR
IRIRIRIT
IT
IT
ITIT
IT
IT
IT
IT
ITIT
IT
IT
ITIT
IT
IT
IT
IT
NLNL
NL
NLNL
NL
NL
NLNLNL NLNLPG
PG
PGPG
PG
PGPG
UKUK UKUK
AUAUAU AU
AUAU
AUAUAU
SW
SW
SW
SW
SW
SWSWSWFI
FI
FIFI
FI
FI
FI FI
FI
FI
FIFI
-50
510
1520
fem
ale-
mal
e u-
rate
/Fitt
ed v
alue
s
0 .2 .4 .6 .8 1extent of gender bias
female-male u-rate Fitted values
Notes. 1. The vertical axis is the average of the gap between female and male unemployment rates over the period 1996-2000 inclusive. 2. The horizontal axis is the fraction agreeing with the statement “when jobs are scarce, men should have more right to a job than women”.
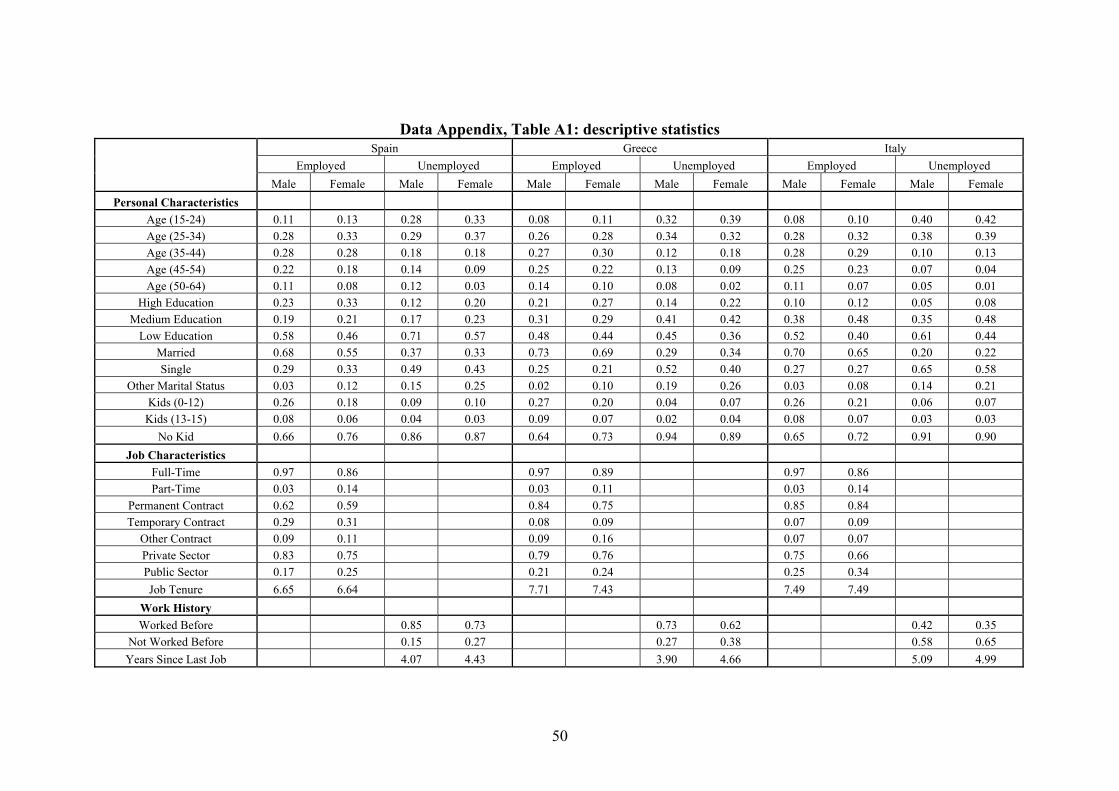
50
Data Appendix, Table A1: descriptive statistics Spain Greece Italy
Employed Unemployed Employed Unemployed Employed Unemployed Male Female Male Female Male Female Male Female Male Female Male Female
Personal Characteristics Age (15-24) 0.11 0.13 0.28 0.33 0.08 0.11 0.32 0.39 0.08 0.10 0.40 0.42 Age (25-34) 0.28 0.33 0.29 0.37 0.26 0.28 0.34 0.32 0.28 0.32 0.38 0.39 Age (35-44) 0.28 0.28 0.18 0.18 0.27 0.30 0.12 0.18 0.28 0.29 0.10 0.13 Age (45-54) 0.22 0.18 0.14 0.09 0.25 0.22 0.13 0.09 0.25 0.23 0.07 0.04 Age (50-64) 0.11 0.08 0.12 0.03 0.14 0.10 0.08 0.02 0.11 0.07 0.05 0.01
High Education 0.23 0.33 0.12 0.20 0.21 0.27 0.14 0.22 0.10 0.12 0.05 0.08 Medium Education 0.19 0.21 0.17 0.23 0.31 0.29 0.41 0.42 0.38 0.48 0.35 0.48
Low Education 0.58 0.46 0.71 0.57 0.48 0.44 0.45 0.36 0.52 0.40 0.61 0.44 Married 0.68 0.55 0.37 0.33 0.73 0.69 0.29 0.34 0.70 0.65 0.20 0.22 Single 0.29 0.33 0.49 0.43 0.25 0.21 0.52 0.40 0.27 0.27 0.65 0.58
Other Marital Status 0.03 0.12 0.15 0.25 0.02 0.10 0.19 0.26 0.03 0.08 0.14 0.21 Kids (0-12) 0.26 0.18 0.09 0.10 0.27 0.20 0.04 0.07 0.26 0.21 0.06 0.07 Kids (13-15) 0.08 0.06 0.04 0.03 0.09 0.07 0.02 0.04 0.08 0.07 0.03 0.03
No Kid 0.66 0.76 0.86 0.87 0.64 0.73 0.94 0.89 0.65 0.72 0.91 0.90 Job Characteristics
Full-Time 0.97 0.86 0.97 0.89 0.97 0.86 Part-Time 0.03 0.14 0.03 0.11 0.03 0.14
Permanent Contract 0.62 0.59 0.84 0.75 0.85 0.84 Temporary Contract 0.29 0.31 0.08 0.09 0.07 0.09
Other Contract 0.09 0.11 0.09 0.16 0.07 0.07 Private Sector 0.83 0.75 0.79 0.76 0.75 0.66 Public Sector 0.17 0.25 0.21 0.24 0.25 0.34 Job Tenure 6.65 6.64 7.71 7.43 7.49 7.49
Work History Worked Before 0.85 0.73 0.73 0.62 0.42 0.35
Not Worked Before 0.15 0.27 0.27 0.38 0.58 0.65 Years Since Last Job 4.07 4.43 3.90 4.66 5.09 4.99
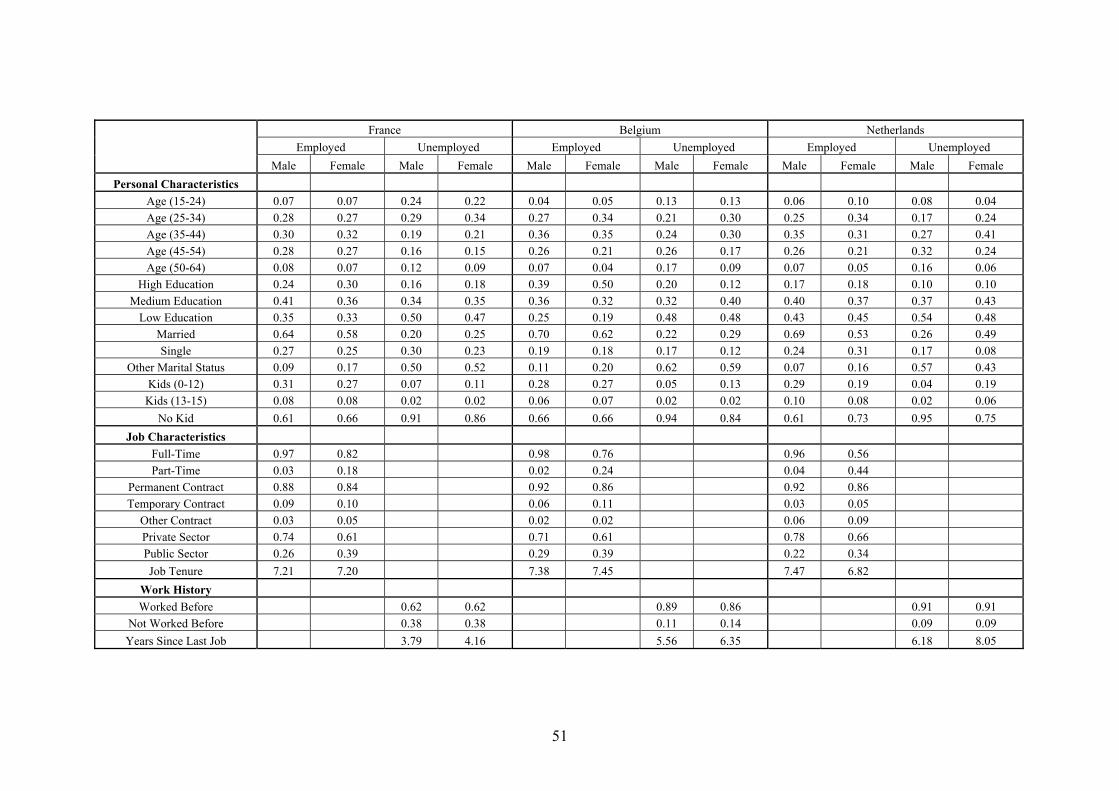
51
France Belgium Netherlands Employed Unemployed Employed Unemployed Employed Unemployed
Male Female Male Female Male Female Male Female Male Female Male Female Personal Characteristics
Age (15-24) 0.07 0.07 0.24 0.22 0.04 0.05 0.13 0.13 0.06 0.10 0.08 0.04 Age (25-34) 0.28 0.27 0.29 0.34 0.27 0.34 0.21 0.30 0.25 0.34 0.17 0.24 Age (35-44) 0.30 0.32 0.19 0.21 0.36 0.35 0.24 0.30 0.35 0.31 0.27 0.41 Age (45-54) 0.28 0.27 0.16 0.15 0.26 0.21 0.26 0.17 0.26 0.21 0.32 0.24 Age (50-64) 0.08 0.07 0.12 0.09 0.07 0.04 0.17 0.09 0.07 0.05 0.16 0.06
High Education 0.24 0.30 0.16 0.18 0.39 0.50 0.20 0.12 0.17 0.18 0.10 0.10 Medium Education 0.41 0.36 0.34 0.35 0.36 0.32 0.32 0.40 0.40 0.37 0.37 0.43
Low Education 0.35 0.33 0.50 0.47 0.25 0.19 0.48 0.48 0.43 0.45 0.54 0.48 Married 0.64 0.58 0.20 0.25 0.70 0.62 0.22 0.29 0.69 0.53 0.26 0.49 Single 0.27 0.25 0.30 0.23 0.19 0.18 0.17 0.12 0.24 0.31 0.17 0.08
Other Marital Status 0.09 0.17 0.50 0.52 0.11 0.20 0.62 0.59 0.07 0.16 0.57 0.43 Kids (0-12) 0.31 0.27 0.07 0.11 0.28 0.27 0.05 0.13 0.29 0.19 0.04 0.19 Kids (13-15) 0.08 0.08 0.02 0.02 0.06 0.07 0.02 0.02 0.10 0.08 0.02 0.06
No Kid 0.61 0.66 0.91 0.86 0.66 0.66 0.94 0.84 0.61 0.73 0.95 0.75 Job Characteristics
Full-Time 0.97 0.82 0.98 0.76 0.96 0.56 Part-Time 0.03 0.18 0.02 0.24 0.04 0.44
Permanent Contract 0.88 0.84 0.92 0.86 0.92 0.86 Temporary Contract 0.09 0.10 0.06 0.11 0.03 0.05
Other Contract 0.03 0.05 0.02 0.02 0.06 0.09 Private Sector 0.74 0.61 0.71 0.61 0.78 0.66 Public Sector 0.26 0.39 0.29 0.39 0.22 0.34 Job Tenure 7.21 7.20 7.38 7.45 7.47 6.82
Work History Worked Before 0.62 0.62 0.89 0.86 0.91 0.91
Not Worked Before 0.38 0.38 0.11 0.14 0.09 0.09 Years Since Last Job 3.79 4.16 5.56 6.35 6.18 8.05
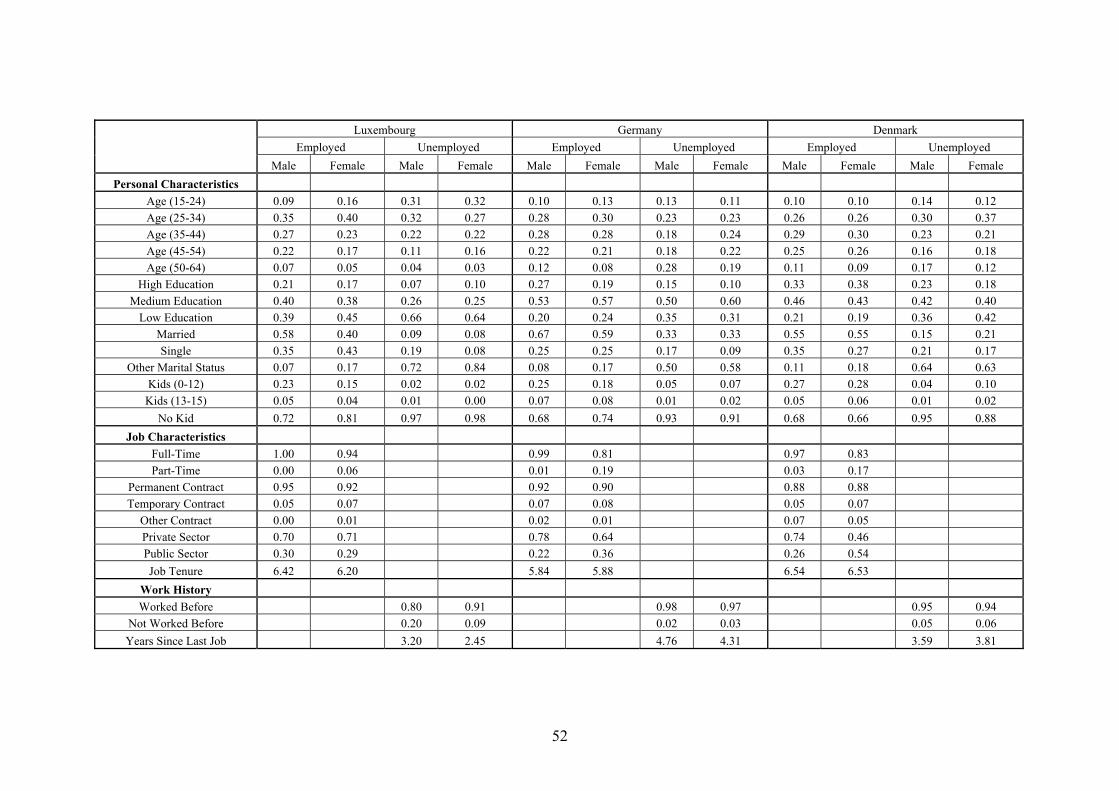
52
Luxembourg Germany Denmark Employed Unemployed Employed Unemployed Employed Unemployed
Male Female Male Female Male Female Male Female Male Female Male Female Personal Characteristics
Age (15-24) 0.09 0.16 0.31 0.32 0.10 0.13 0.13 0.11 0.10 0.10 0.14 0.12 Age (25-34) 0.35 0.40 0.32 0.27 0.28 0.30 0.23 0.23 0.26 0.26 0.30 0.37 Age (35-44) 0.27 0.23 0.22 0.22 0.28 0.28 0.18 0.24 0.29 0.30 0.23 0.21 Age (45-54) 0.22 0.17 0.11 0.16 0.22 0.21 0.18 0.22 0.25 0.26 0.16 0.18 Age (50-64) 0.07 0.05 0.04 0.03 0.12 0.08 0.28 0.19 0.11 0.09 0.17 0.12
High Education 0.21 0.17 0.07 0.10 0.27 0.19 0.15 0.10 0.33 0.38 0.23 0.18 Medium Education 0.40 0.38 0.26 0.25 0.53 0.57 0.50 0.60 0.46 0.43 0.42 0.40
Low Education 0.39 0.45 0.66 0.64 0.20 0.24 0.35 0.31 0.21 0.19 0.36 0.42 Married 0.58 0.40 0.09 0.08 0.67 0.59 0.33 0.33 0.55 0.55 0.15 0.21 Single 0.35 0.43 0.19 0.08 0.25 0.25 0.17 0.09 0.35 0.27 0.21 0.17
Other Marital Status 0.07 0.17 0.72 0.84 0.08 0.17 0.50 0.58 0.11 0.18 0.64 0.63 Kids (0-12) 0.23 0.15 0.02 0.02 0.25 0.18 0.05 0.07 0.27 0.28 0.04 0.10 Kids (13-15) 0.05 0.04 0.01 0.00 0.07 0.08 0.01 0.02 0.05 0.06 0.01 0.02
No Kid 0.72 0.81 0.97 0.98 0.68 0.74 0.93 0.91 0.68 0.66 0.95 0.88 Job Characteristics
Full-Time 1.00 0.94 0.99 0.81 0.97 0.83 Part-Time 0.00 0.06 0.01 0.19 0.03 0.17
Permanent Contract 0.95 0.92 0.92 0.90 0.88 0.88 Temporary Contract 0.05 0.07 0.07 0.08 0.05 0.07
Other Contract 0.00 0.01 0.02 0.01 0.07 0.05 Private Sector 0.70 0.71 0.78 0.64 0.74 0.46 Public Sector 0.30 0.29 0.22 0.36 0.26 0.54 Job Tenure 6.42 6.20 5.84 5.88 6.54 6.53
Work History Worked Before 0.80 0.91 0.98 0.97 0.95 0.94
Not Worked Before 0.20 0.09 0.02 0.03 0.05 0.06 Years Since Last Job 3.20 2.45 4.76 4.31 3.59 3.81
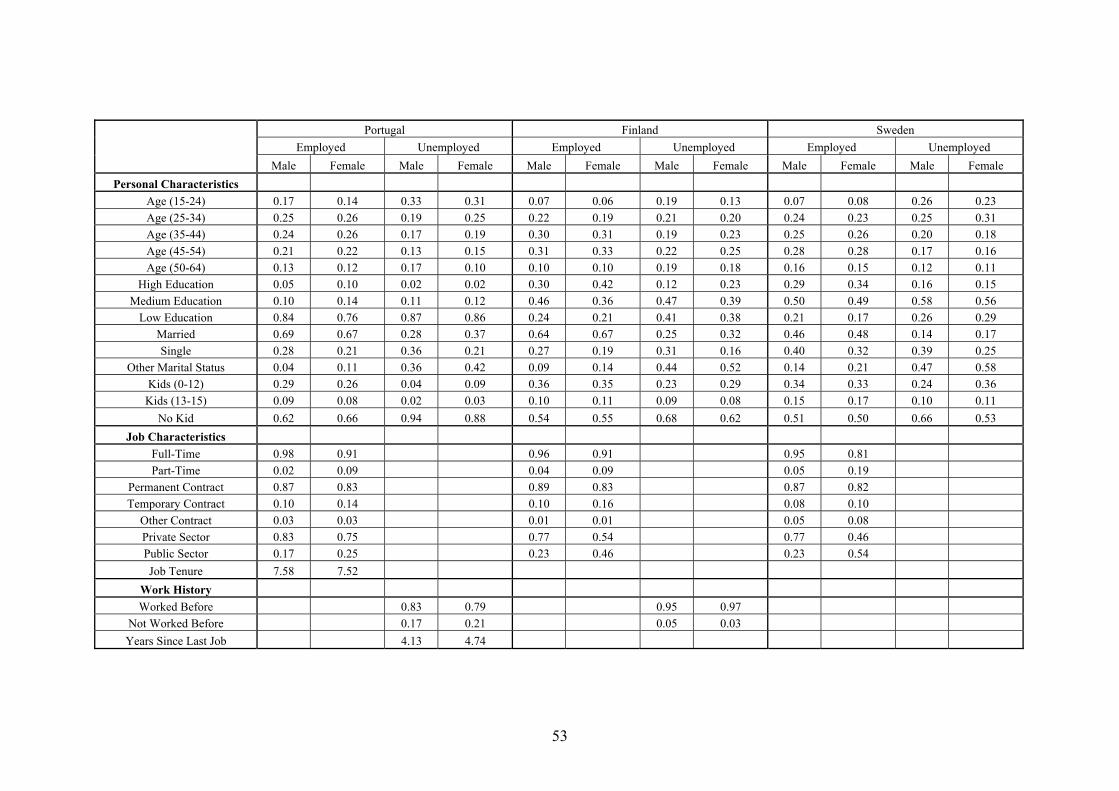
53
Portugal Finland Sweden Employed Unemployed Employed Unemployed Employed Unemployed
Male Female Male Female Male Female Male Female Male Female Male Female Personal Characteristics
Age (15-24) 0.17 0.14 0.33 0.31 0.07 0.06 0.19 0.13 0.07 0.08 0.26 0.23 Age (25-34) 0.25 0.26 0.19 0.25 0.22 0.19 0.21 0.20 0.24 0.23 0.25 0.31 Age (35-44) 0.24 0.26 0.17 0.19 0.30 0.31 0.19 0.23 0.25 0.26 0.20 0.18 Age (45-54) 0.21 0.22 0.13 0.15 0.31 0.33 0.22 0.25 0.28 0.28 0.17 0.16 Age (50-64) 0.13 0.12 0.17 0.10 0.10 0.10 0.19 0.18 0.16 0.15 0.12 0.11
High Education 0.05 0.10 0.02 0.02 0.30 0.42 0.12 0.23 0.29 0.34 0.16 0.15 Medium Education 0.10 0.14 0.11 0.12 0.46 0.36 0.47 0.39 0.50 0.49 0.58 0.56
Low Education 0.84 0.76 0.87 0.86 0.24 0.21 0.41 0.38 0.21 0.17 0.26 0.29 Married 0.69 0.67 0.28 0.37 0.64 0.67 0.25 0.32 0.46 0.48 0.14 0.17 Single 0.28 0.21 0.36 0.21 0.27 0.19 0.31 0.16 0.40 0.32 0.39 0.25
Other Marital Status 0.04 0.11 0.36 0.42 0.09 0.14 0.44 0.52 0.14 0.21 0.47 0.58 Kids (0-12) 0.29 0.26 0.04 0.09 0.36 0.35 0.23 0.29 0.34 0.33 0.24 0.36 Kids (13-15) 0.09 0.08 0.02 0.03 0.10 0.11 0.09 0.08 0.15 0.17 0.10 0.11
No Kid 0.62 0.66 0.94 0.88 0.54 0.55 0.68 0.62 0.51 0.50 0.66 0.53 Job Characteristics
Full-Time 0.98 0.91 0.96 0.91 0.95 0.81 Part-Time 0.02 0.09 0.04 0.09 0.05 0.19
Permanent Contract 0.87 0.83 0.89 0.83 0.87 0.82 Temporary Contract 0.10 0.14 0.10 0.16 0.08 0.10
Other Contract 0.03 0.03 0.01 0.01 0.05 0.08 Private Sector 0.83 0.75 0.77 0.54 0.77 0.46 Public Sector 0.17 0.25 0.23 0.46 0.23 0.54 Job Tenure 7.58 7.52
Work History Worked Before 0.83 0.79 0.95 0.97
Not Worked Before 0.17 0.21 0.05 0.03 Years Since Last Job 4.13 4.74
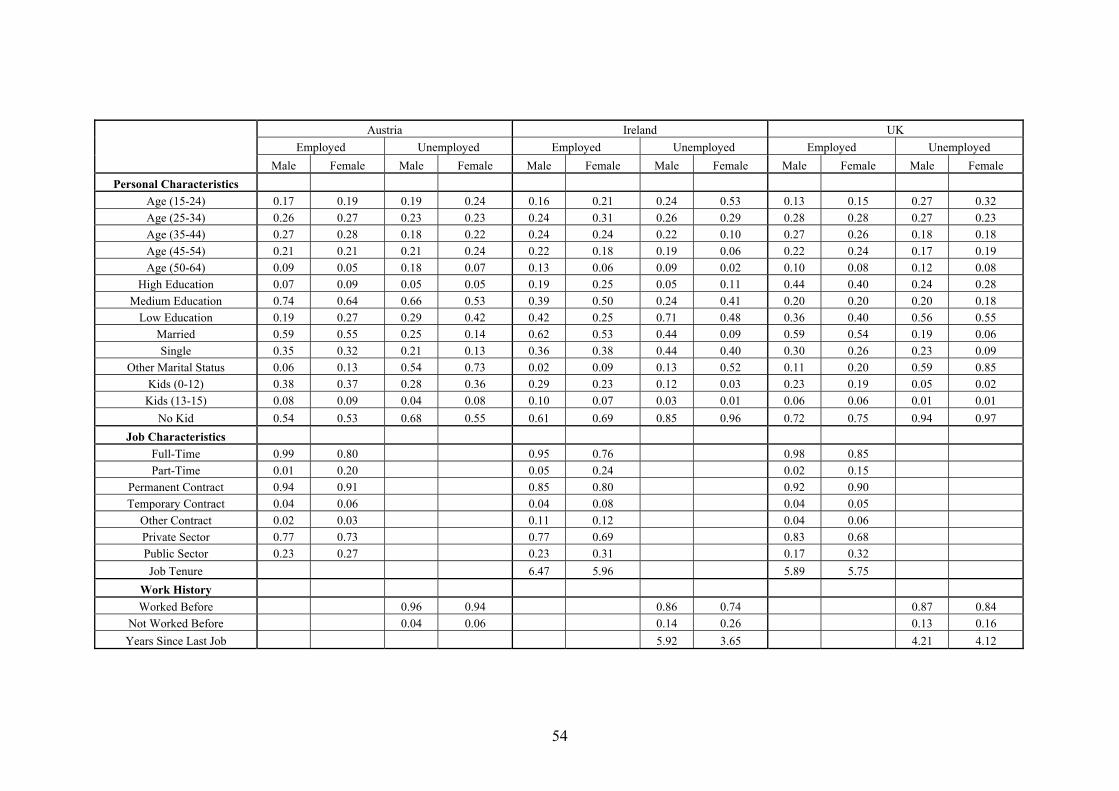
54
Austria Ireland UK Employed Unemployed Employed Unemployed Employed Unemployed
Male Female Male Female Male Female Male Female Male Female Male Female Personal Characteristics
Age (15-24) 0.17 0.19 0.19 0.24 0.16 0.21 0.24 0.53 0.13 0.15 0.27 0.32 Age (25-34) 0.26 0.27 0.23 0.23 0.24 0.31 0.26 0.29 0.28 0.28 0.27 0.23 Age (35-44) 0.27 0.28 0.18 0.22 0.24 0.24 0.22 0.10 0.27 0.26 0.18 0.18 Age (45-54) 0.21 0.21 0.21 0.24 0.22 0.18 0.19 0.06 0.22 0.24 0.17 0.19 Age (50-64) 0.09 0.05 0.18 0.07 0.13 0.06 0.09 0.02 0.10 0.08 0.12 0.08
High Education 0.07 0.09 0.05 0.05 0.19 0.25 0.05 0.11 0.44 0.40 0.24 0.28 Medium Education 0.74 0.64 0.66 0.53 0.39 0.50 0.24 0.41 0.20 0.20 0.20 0.18
Low Education 0.19 0.27 0.29 0.42 0.42 0.25 0.71 0.48 0.36 0.40 0.56 0.55 Married 0.59 0.55 0.25 0.14 0.62 0.53 0.44 0.09 0.59 0.54 0.19 0.06 Single 0.35 0.32 0.21 0.13 0.36 0.38 0.44 0.40 0.30 0.26 0.23 0.09
Other Marital Status 0.06 0.13 0.54 0.73 0.02 0.09 0.13 0.52 0.11 0.20 0.59 0.85 Kids (0-12) 0.38 0.37 0.28 0.36 0.29 0.23 0.12 0.03 0.23 0.19 0.05 0.02 Kids (13-15) 0.08 0.09 0.04 0.08 0.10 0.07 0.03 0.01 0.06 0.06 0.01 0.01
No Kid 0.54 0.53 0.68 0.55 0.61 0.69 0.85 0.96 0.72 0.75 0.94 0.97 Job Characteristics
Full-Time 0.99 0.80 0.95 0.76 0.98 0.85 Part-Time 0.01 0.20 0.05 0.24 0.02 0.15
Permanent Contract 0.94 0.91 0.85 0.80 0.92 0.90 Temporary Contract 0.04 0.06 0.04 0.08 0.04 0.05
Other Contract 0.02 0.03 0.11 0.12 0.04 0.06 Private Sector 0.77 0.73 0.77 0.69 0.83 0.68 Public Sector 0.23 0.27 0.23 0.31 0.17 0.32 Job Tenure 6.47 5.96 5.89 5.75
Work History Worked Before 0.96 0.94 0.86 0.74 0.87 0.84
Not Worked Before 0.04 0.06 0.14 0.26 0.13 0.16 Years Since Last Job 5.92 3.65 4.21 4.12
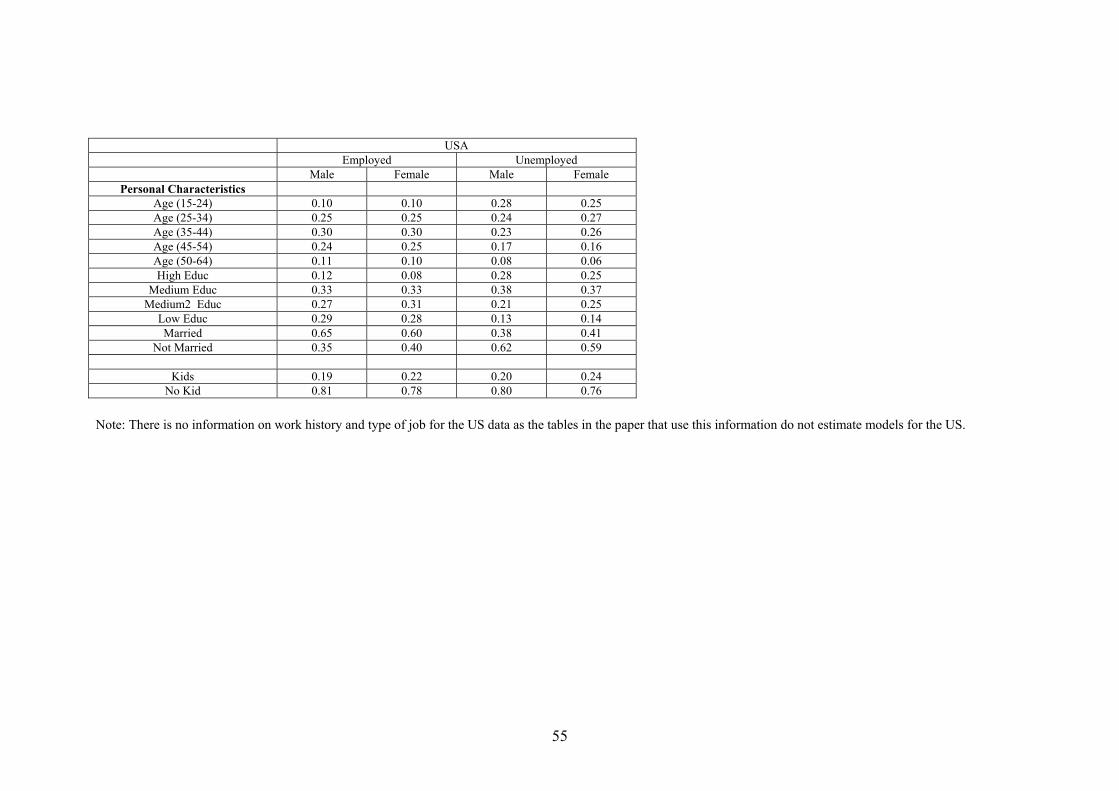
55
USA
Employed Unemployed Male Female Male Female
Personal Characteristics Age (15-24) 0.10 0.10 0.28 0.25 Age (25-34) 0.25 0.25 0.24 0.27 Age (35-44) 0.30 0.30 0.23 0.26 Age (45-54) 0.24 0.25 0.17 0.16 Age (50-64) 0.11 0.10 0.08 0.06 High Educ 0.12 0.08 0.28 0.25
Medium Educ 0.33 0.33 0.38 0.37 Medium2 Educ 0.27 0.31 0.21 0.25
Low Educ 0.29 0.28 0.13 0.14 Married 0.65 0.60 0.38 0.41
Not Married 0.35 0.40 0.62 0.59
Kids 0.19 0.22 0.20 0.24 No Kid 0.81 0.78 0.80 0.76
Note: There is no information on work history and type of job for the US data as the tables in the paper that use this information do not estimate models for the US.

CENTRE FOR ECONOMIC PERFORMANCE Recent Discussion Papers
606 Henry G. Overman
L. Alan Winters The Geography of UK International Trade
605 Stephen Machin Stephen Wood
Looking for HRM/Union Substitution: Evidence from British Workplaces
604 Maarten Goos Alan Manning
Lousy and Lovely Jobs: the Rising Polarization of Work in Britain
603 Nan-Kuang Chen Hsiao-Lei Chu
Collateral Value and Forbearance Lending
602 Ricardo Peccei Helen Bewley Howard Gospel Paul Willman
Is it Good To Talk? Information Disclosure and Organisational Performance in the UK Incorporating evidence submitted on the DTI discussion paper ‘High Performance Workplaces – Informing and Consulting Employees’
601 Andy Charlwood The Anatomy of Union Decline in Britain 1990-1998
600 Christopher A. Pissarides Unemployment in Britain: A European Success Story
599 Stephen Bond Dietmar Harhoff John Van Reenen
Corporate R&D and Productivity in Germany and the United Kingdom
598 Michael Storper Anthony J. Venables
Buzz: Face-to-Face Contact and the Urban Economy
597 Stephen Gibbons Alan Manning
The Incidence of UK Housing Benefit: Evidence from the 1990s Reforms
596 Paul Gregg Maria Gutiérrez-Domènech Jane Waldfogel
The Employment of Married Mothers in Great Britain: 1974-2000
595 Stephen Bond Dietmar Harhoff John Van Reenen
Investment, R&D and Financial Constraints in Britain and Germany
594 Andrew B. Bernard Stephen Redding Peter K. Schott
Product Choice and Product Switching
593 Anthony J. Venables Spatial Disparities in Developing Countries: Cities, Regions and International Trade
592 Sylvie Charlot Gilles Duranton
Communication Externalities in Cities
591 Paul Willman Alex Bryson Rafael Gomez
Why Do Voice Regimes Differ?
590 Marco Manacorda Child Labor and the Labor Supply of Other Household Members: Evidence from 1920 America
589 Alex Bryson Rafael Gomez
Why Have Workers Stopped Joining Unions?
588 Henry G. Overman L. Alan Winters
Trade Shocks and Industrial Location: the Impact of EEC Accession on the UK
587 Pierre-Philippe Combes Henry G. Overman
The Spatial Distribution of Economic Activities in the European Union
586 Henry G. Overman Can We Learn Anything from Economic Geography Proper?
585 A. B. Bernard J. Bradford Jensen P. K. Schott
Falling Trade Costs, Heterogeneous Firms and Industry Dynamics
584 A. B. Bernard J. Bradford Jensen P. K. Schott
Survival of the Best Fit: Exposure to Low-Wage Countries and the (Uneven) Growth of U.S. Manufacturing Plants
583 S. Wood S. Moore
Reviewing the Statutory Union Recognition (ERA 1999)
To order a discussion paper, please contact the Publications Unit Tel 020 7955 7673 Fax 020 7955 7595 Email [email protected]
Web site http://cep.lse.ac.uk


![Climate Finance Gaps and Challenges - UNESCAP 5. Climate finance gaps...Climate Finance Gaps and Challenges ... protection, disaster risk reduction) ... Lending interest rate [%] OECD](https://img.pdfslide.us/doc/110x75/5ab54ce47f8b9a156d8ca701/climate-finance-gaps-and-challenges-5-climate-finance-gapsclimate-finance.jpg)