Embed Size (px)
Citation preview
1
[ Journal of Labor Economics, 2006, vol. 24, no. 1]� 2006 by The University of Chicago. All rights reserved.0734-306X/2006/2401-0001$10.00
Gender Gaps in Unemployment Ratesin OECD Countries
Ghazala Azmat, Centre for Economic Performance,
London School of Economics
Maia Guell, Universitat Pompeu Fabra, CREA, Centre for
Economic Performance, CEPR, and IZA
Alan Manning, Centre for Economic Performance,
London School of Economics
In some OECD countries the male and female unemployment ratesare very similar but in others (notably the Mediterranean countries)the female unemployment rate is much higher than the male. Ex-plaining these cross-country differences is the subject of this article.We show that, in countries where there is a large gender gap inunemployment rates, there is a gender gap in both flows fromemployment into unemployment and from unemployment into em-ployment. We conclude that differences in human capital accumu-lation between men and women interacted with labor market insti-tutions is an important part of the explanation.
We would like to thank seminar participants at CEMFI, IFS, IZA, the LondonSchool of Economics, Universitat Pompeu Fabra, and Princeton University; andDaniel Hamermersh, Marco Manacorda, and Steve Pischke for their comments.Guell gratefully acknowledges financial support from the Fundacion BBVA (proj-ect FAMRISK). Contact the corresponding author, Alan Manning, at [email protected].
2 Azmat et al.
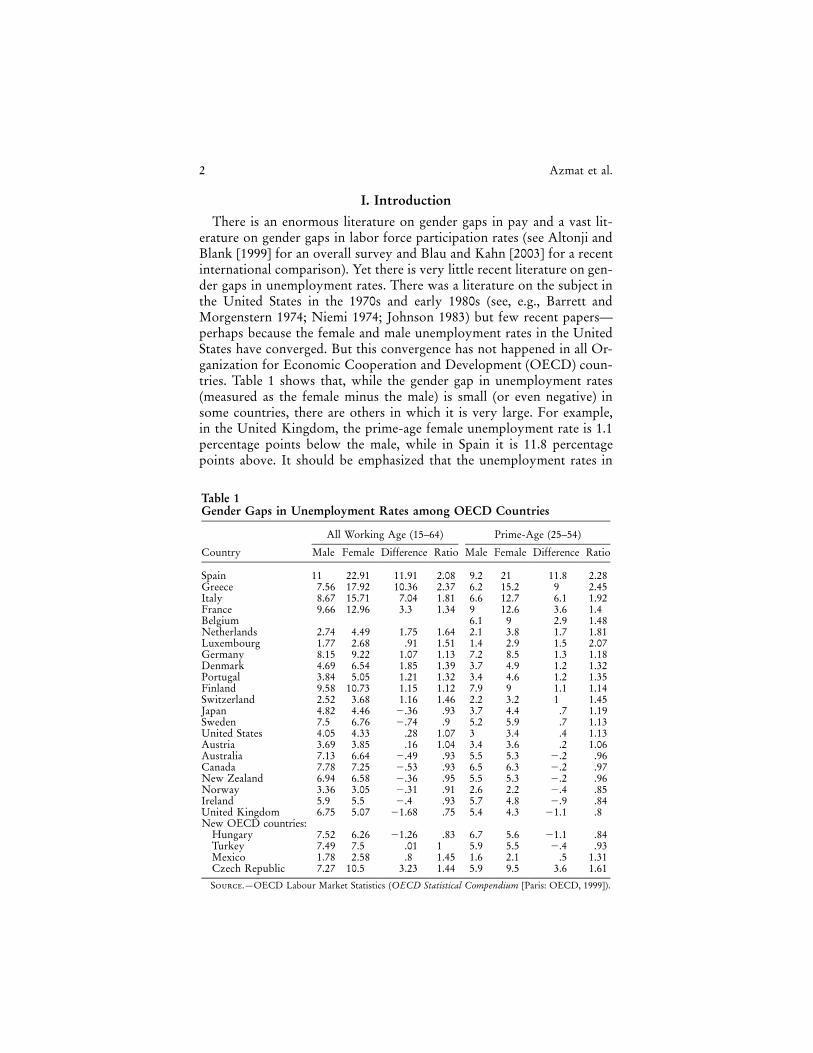
Table 1Gender Gaps in Unemployment Rates among OECD Countries
Country
All Working Age (15–64) Prime-Age (25–54)
Male Female Difference Ratio Male Female Difference Ratio
Spain 11 22.91 11.91 2.08 9.2 21 11.8 2.28Greece 7.56 17.92 10.36 2.37 6.2 15.2 9 2.45Italy 8.67 15.71 7.04 1.81 6.6 12.7 6.1 1.92France 9.66 12.96 3.3 1.34 9 12.6 3.6 1.4Belgium 6.1 9 2.9 1.48Netherlands 2.74 4.49 1.75 1.64 2.1 3.8 1.7 1.81Luxembourg 1.77 2.68 .91 1.51 1.4 2.9 1.5 2.07Germany 8.15 9.22 1.07 1.13 7.2 8.5 1.3 1.18Denmark 4.69 6.54 1.85 1.39 3.7 4.9 1.2 1.32Portugal 3.84 5.05 1.21 1.32 3.4 4.6 1.2 1.35Finland 9.58 10.73 1.15 1.12 7.9 9 1.1 1.14Switzerland 2.52 3.68 1.16 1.46 2.2 3.2 1 1.45Japan 4.82 4.46 �.36 .93 3.7 4.4 .7 1.19Sweden 7.5 6.76 �.74 .9 5.2 5.9 .7 1.13United States 4.05 4.33 .28 1.07 3 3.4 .4 1.13Austria 3.69 3.85 .16 1.04 3.4 3.6 .2 1.06Australia 7.13 6.64 �.49 .93 5.5 5.3 �.2 .96Canada 7.78 7.25 �.53 .93 6.5 6.3 �.2 .97New Zealand 6.94 6.58 �.36 .95 5.5 5.3 �.2 .96Norway 3.36 3.05 �.31 .91 2.6 2.2 �.4 .85Ireland 5.9 5.5 �.4 .93 5.7 4.8 �.9 .84United Kingdom 6.75 5.07 �1.68 .75 5.4 4.3 �1.1 .8New OECD countries:
Hungary 7.52 6.26 �1.26 .83 6.7 5.6 �1.1 .84Turkey 7.49 7.5 .01 1 5.9 5.5 �.4 .93Mexico 1.78 2.58 .8 1.45 1.6 2.1 .5 1.31Czech Republic 7.27 10.5 3.23 1.44 5.9 9.5 3.6 1.61
Source.—OECD Labour Market Statistics (OECD Statistical Compendium [Paris: OECD, 1999]).
I. Introduction
There is an enormous literature on gender gaps in pay and a vast lit-erature on gender gaps in labor force participation rates (see Altonji andBlank [1999] for an overall survey and Blau and Kahn [2003] for a recentinternational comparison). Yet there is very little recent literature on gen-der gaps in unemployment rates. There was a literature on the subject inthe United States in the 1970s and early 1980s (see, e.g., Barrett andMorgenstern 1974; Niemi 1974; Johnson 1983) but few recent papers—perhaps because the female and male unemployment rates in the UnitedStates have converged. But this convergence has not happened in all Or-ganization for Economic Cooperation and Development (OECD) coun-tries. Table 1 shows that, while the gender gap in unemployment rates(measured as the female minus the male) is small (or even negative) insome countries, there are others in which it is very large. For example,in the United Kingdom, the prime-age female unemployment rate is 1.1percentage points below the male, while in Spain it is 11.8 percentagepoints above. It should be emphasized that the unemployment rates in
Gender Gaps in OECD Unemployment 3
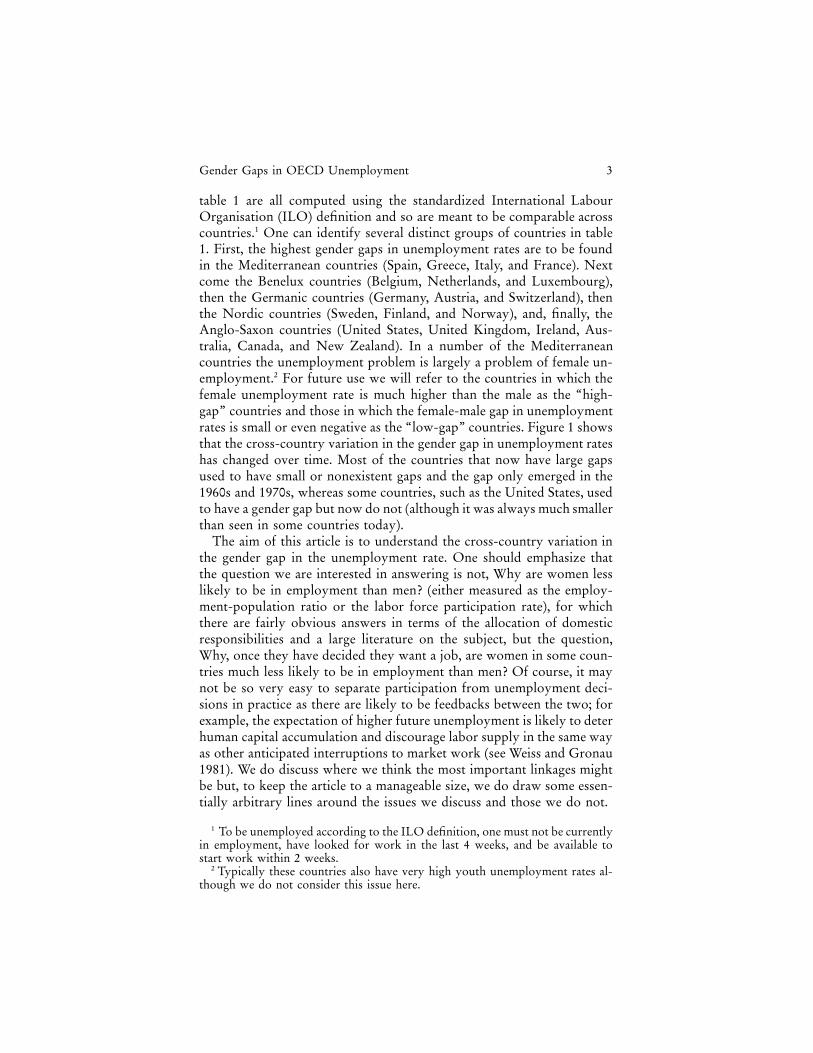
table 1 are all computed using the standardized International LabourOrganisation (ILO) definition and so are meant to be comparable acrosscountries.1 One can identify several distinct groups of countries in table1. First, the highest gender gaps in unemployment rates are to be foundin the Mediterranean countries (Spain, Greece, Italy, and France). Nextcome the Benelux countries (Belgium, Netherlands, and Luxembourg),then the Germanic countries (Germany, Austria, and Switzerland), thenthe Nordic countries (Sweden, Finland, and Norway), and, finally, theAnglo-Saxon countries (United States, United Kingdom, Ireland, Aus-tralia, Canada, and New Zealand). In a number of the Mediterraneancountries the unemployment problem is largely a problem of female un-employment.2 For future use we will refer to the countries in which thefemale unemployment rate is much higher than the male as the “high-gap” countries and those in which the female-male gap in unemploymentrates is small or even negative as the “low-gap” countries. Figure 1 showsthat the cross-country variation in the gender gap in unemployment rateshas changed over time. Most of the countries that now have large gapsused to have small or nonexistent gaps and the gap only emerged in the1960s and 1970s, whereas some countries, such as the United States, usedto have a gender gap but now do not (although it was always much smallerthan seen in some countries today).
The aim of this article is to understand the cross-country variation inthe gender gap in the unemployment rate. One should emphasize thatthe question we are interested in answering is not, Why are women lesslikely to be in employment than men? (either measured as the employ-ment-population ratio or the labor force participation rate), for whichthere are fairly obvious answers in terms of the allocation of domesticresponsibilities and a large literature on the subject, but the question,Why, once they have decided they want a job, are women in some coun-tries much less likely to be in employment than men? Of course, it maynot be so very easy to separate participation from unemployment deci-sions in practice as there are likely to be feedbacks between the two; forexample, the expectation of higher future unemployment is likely to deterhuman capital accumulation and discourage labor supply in the same wayas other anticipated interruptions to market work (see Weiss and Gronau1981). We do discuss where we think the most important linkages mightbe but, to keep the article to a manageable size, we do draw some essen-tially arbitrary lines around the issues we discuss and those we do not.
1 To be unemployed according to the ILO definition, one must not be currentlyin employment, have looked for work in the last 4 weeks, and be available tostart work within 2 weeks.
2 Typically these countries also have very high youth unemployment rates al-though we do not consider this issue here.
Fig. 1.—Unemployment rates by gender over time
Gender Gaps in OECD Unemployment 5
The structure of the article is as follows. In the next section we discusshuman capital, institutions, and discrimination as the likely determinantsof the gender gap in unemployment rates to act as a framework for theempirical evidence that follows. Section III investigates the variation inthe gender gap in unemployment rates across countries and for differentpopulation groups. Section IV looks at gender differences in labor marketdynamics, the flows into and out of employment, unemployment, andinactivity. We find that in the high-gap countries there are large genderdifferentials in both the flow out of employment into unemployment andthe flow out of unemployment into employment. The rest of the articlethen explores these gender differences in flows in more detail. Section Vinvestigates in more detail flows from employment into unemployment.The sixth and seventh sections investigate the flow from unemploymentto employment from the supply side and the demand side, respectively.
Our overall conclusion is that human capital theory and institutionscan explain a large part (though probably not all) of the gender gap inunemployment rates. In addition, there is some evidence that attitudestoward male and female unemployment may be important in explainingthe gap in countries where unemployment is high.
II. Explanations of the Gender Gap in Unemployment Rates
In this section we review a number of possible theories for why theremight be a gender gap in unemployment rates. There is not much writtenon this aspect of the differences between men and women, but a goodstarting point is the very large literature on the gender pay gap.
Part of the pay gap between men and women is undoubtedly the resultof differences in labor market attachment that lead to differences in humancapital accumulation. There remains some debate about how much of thegender pay gap can be explained by differences in human capital, butthere is no longer any debate (as there once was) that this hypothesis hasconsiderable explanatory power (see Altonji and Blank 1999; or Polachek2004). It is also true that differences in unemployment rates across de-mographic groups other than gender are related to differences in humancapital, for example, more education is associated with lower unemploy-ment (see, e.g., Ashenfelter and Ham 1979). The most plausible reasonfor this relationship between unemployment rates and human capital isthat the gap between marginal product when in work and the reservationwage is smaller for those with low levels of human capital. There areother reasons why differences in labor market attachment may result indifferences in unemployment rates: for example, Johnson (1983) suggeststhat the female unemployment rate is likely to be higher than the malebecause women wanting to move from home production into market
6 Azmat et al.
work are likely to go through a period of intervening unemploymentwhile men who want to change jobs are likely to remain in employment.
Hence, human capital theory predicts higher unemployment rates forwomen than for men and, among women, higher unemployment ratesfor women who are likely to have accumulated less human capital, suchas married women and those with children. And, across countries, thosewith lower levels of female labor market attachment would be expectedto have higher unemployment rates.3 And over time we would expect tosee rising female labor market participation associated with changes inthe gender gap in unemployment rates.4
The relationship between gender differences in human capital and gen-der differences in unemployment rates is also likely to be influenced bylabor market institutions. First, institutions that compress the distributionof wages, such as minimum wage laws and trade unions, may reduce theincentives to employ workers with lower levels of human capital, leadingto higher unemployment rates for these groups. Blau and Kahn (2003)find that these institutions have an important impact on the gender paygap, so we should not be too surprised if they also have an importantimpact on the gender gap in unemployment rates (Bertola, Blau, and Kahn[2002] find evidence that high gender gaps in unemployment rates andhigh youth unemployment rates are associated with wider union cover-age).
Second, institutions that reduce the turnover of labor (such as firingcosts) or those that make it difficult for groups of workers who are lessfirmly attached to the labor force to stay in employment (such as thewidespread use of temporary contracts) are also likely to increase the gapin unemployment rates between workers with high and low levels of labormarket attachment. For example, firing costs seem to reduce the invol-untary part of the flow out of employment especially for workers withlong job tenures but also seem to be associated with reductions in thehiring rate. If women have a higher outflow rate from employment thanmen this reduction in hiring will tend to magnify the gender gap in theunemployment rate.
Finally, part of the gender pay gap may be the result of discriminationagainst women. In the presence of equal pay legislation (which all the
3 There is one factor that works in the opposite direction. In countries with alow level of female labor market participation, it tends to be the higher-skilledwomen who are in the labor force. This selection effect will tend to reduce themeasured gender gap in unemployment rates if unemployment rates are negativelyrelated to skill.
4 Although this relationship may not be monotonic if increasing female labormarket participation initially takes the form of the entry of women into the labormarket with low levels of accumulated experience; see Polachek (2004) for thisargument applied to the gender pay gap.
Gender Gaps in OECD Unemployment 7
OECD countries now have) the only way for employers to exercise anyprejudice may be through differential hiring rates, something that maybe easier when labor markets are slack. Algan and Cahuc (2004) suggestthat a “male breadwinner” mind-set, associated with the Catholic religion,can explain part of the cross-country variation in gender differences inemployment-population ratios. In what follows we will use this discussionas a framework for interpreting the results that we find and the hypotheseswe investigate.
III. Variations in the Gender Gap in Unemployment Rates
For the European countries, the main data used in this article comefrom the first six waves of the European Community Household PanelSurvey (ECHPS) that cover the period 1994–99;5 for the United States,we use data from the Current Population Survey (CPS) from 1996 to2000 (to have an approximately comparable period). Description of thedata can be found in more detail in Azmat, Guell, and Manning (2004).
We first check that the pattern of gender gaps in unemployment ratesin the ECHPS mirrors that presented in table 1. We first estimate a probitmodel for the probability of being unemployed (conditional on being inthe labor force so that we are looking at unemployment rates) includinga dummy variable for being female as the only explanatory variable, thatis, the estimated model is of the form
Pr (U p 1) p F(b � b female). (1)0 1
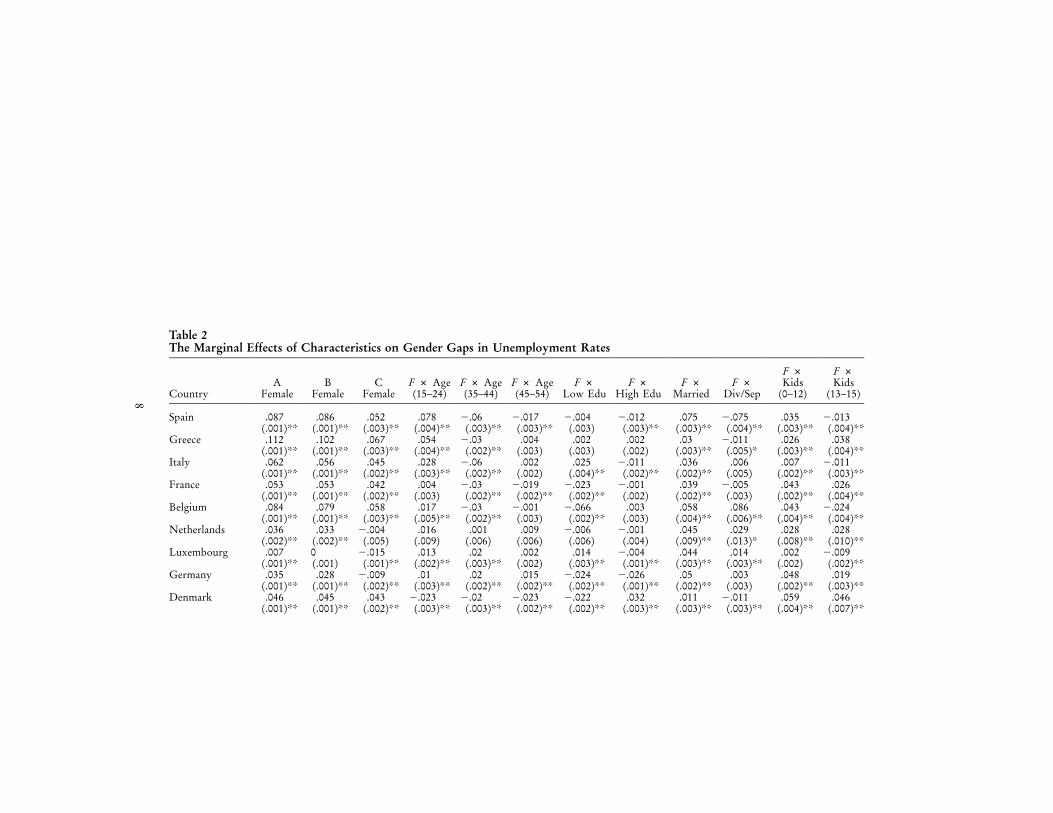
The first column of table 2 reports the marginal effect of being femalewhere countries are ordered by the gender gap in unemployment ratesamong prime-age workers as reported in table 1 (we also follow thispractice in all subsequent tables). These marginal effects should be com-parable to the gender gaps in aggregate unemployment rates presented intable 1. They are similar though not identical because the data come fromdifferent sources and refer to different periods.
The gender gaps in unemployment rates observed in table 1 and thefirst column of table 2 could be explained by gender gaps in characteristicsthat vary across countries. To investigate this hypothesis we simply mod-ify (1) to
Pr (U p 1) p F(b � b female � b x), (2)0 1 2
where x is a variety of characteristics—age, education, marital status, and
5 For details of the ECHPS, see Peracchi (2002) and Nicoletti and Peracchi(2002), who discuss, among other things, sample attrition. Because there may beconcerns about the representativeness of the ECHPS we have checked the resultsfor the United Kingdom and Spain using their respective labor force surveys;these results are very similar and are available on request from the authors.
8
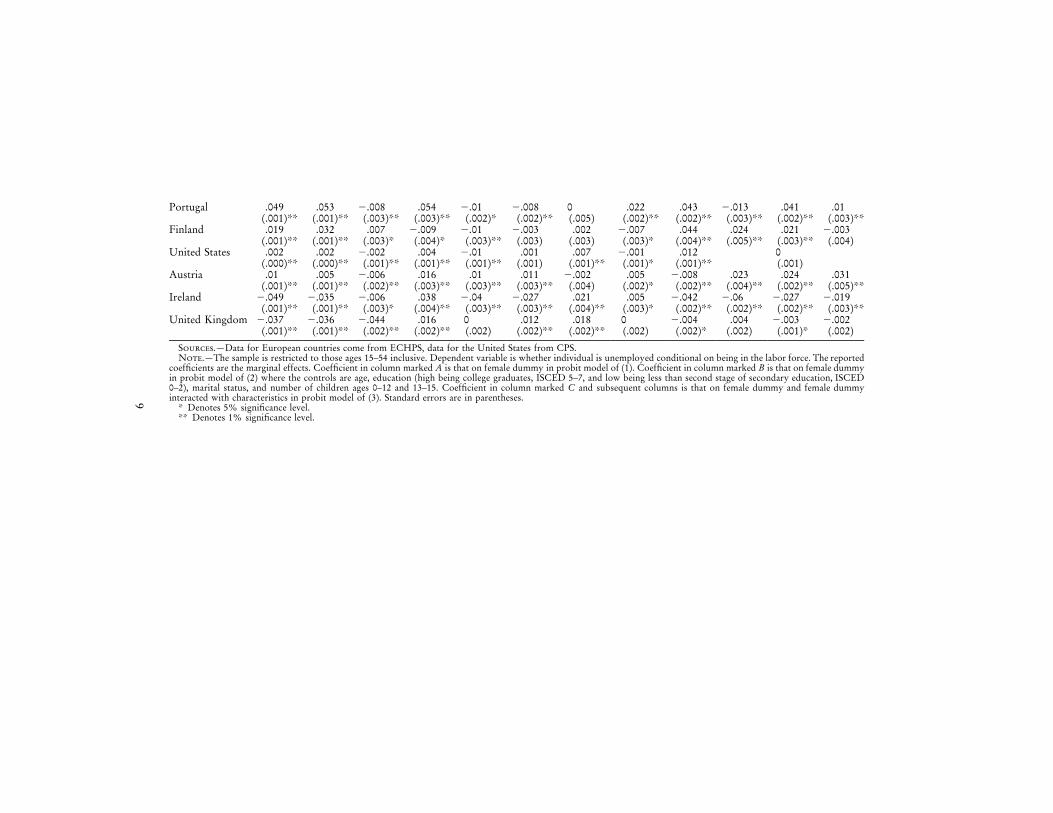
Table 2The Marginal Effects of Characteristics on Gender Gaps in Unemployment Rates
CountryA
FemaleB
FemaleC
FemaleF # Age(15–24)
F # Age(35–44)
F # Age(45–54)
F #Low Edu
F #High Edu
F #Married
F #Div/Sep
F #Kids
(0–12)
F #Kids
(13–15)
Spain .087 .086 .052 .078 �.06 �.017 �.004 �.012 .075 �.075 .035 �.013(.001)** (.001)** (.003)** (.004)** (.003)** (.003)** (.003) (.003)** (.003)** (.004)** (.003)** (.004)**
Greece .112 .102 .067 .054 �.03 .004 .002 .002 .03 �.011 .026 .038(.001)** (.001)** (.003)** (.004)** (.002)** (.003) (.003) (.002) (.003)** (.005)* (.003)** (.004)**
Italy .062 .056 .045 .028 �.06 .002 .025 �.011 .036 .006 .007 �.011(.001)** (.001)** (.002)** (.003)** (.002)** (.002) (.004)** (.002)** (.002)** (.005) (.002)** (.003)**
France .053 .053 .042 .004 �.03 �.019 �.023 �.001 .039 �.005 .043 .026(.001)** (.001)** (.002)** (.003) (.002)** (.002)** (.002)** (.002) (.002)** (.003) (.002)** (.004)**
Belgium .084 .079 .058 .017 �.03 �.001 �.066 .003 .058 .086 .043 �.024(.001)** (.001)** (.003)** (.005)** (.002)** (.003) (.002)** (.003) (.004)** (.006)** (.004)** (.004)**
Netherlands .036 .033 �.004 .016 .001 .009 �.006 �.001 .045 .029 .028 .028(.002)** (.002)** (.005) (.009) (.006) (.006) (.006) (.004) (.009)** (.013)* (.008)** (.010)**
Luxembourg .007 0 �.015 .013 .02 .002 .014 �.004 .044 .014 .002 �.009(.001)** (.001) (.001)** (.002)** (.003)** (.002) (.003)** (.001)** (.003)** (.003)** (.002) (.002)**
Germany .035 .028 �.009 .01 .02 .015 �.024 �.026 .05 .003 .048 .019(.001)** (.001)** (.002)** (.003)** (.002)** (.002)** (.002)** (.001)** (.002)** (.003) (.002)** (.003)**
Denmark .046 .045 .043 �.023 �.02 �.023 �.022 .032 .011 �.011 .059 .046(.001)** (.001)** (.002)** (.003)** (.003)** (.002)** (.002)** (.003)** (.003)** (.003)** (.004)** (.007)**
9
Portugal .049 .053 �.008 .054 �.01 �.008 0 .022 .043 �.013 .041 .01(.001)** (.001)** (.003)** (.003)** (.002)* (.002)** (.005) (.002)** (.002)** (.003)** (.002)** (.003)**
Finland .019 .032 .007 �.009 �.01 �.003 .002 �.007 .044 .024 .021 �.003(.001)** (.001)** (.003)* (.004)* (.003)** (.003) (.003) (.003)* (.004)** (.005)** (.003)** (.004)
United States .002 .002 �.002 .004 �.01 .001 .007 �.001 .012 0(.000)** (.000)** (.001)** (.001)** (.001)** (.001) (.001)** (.001)* (.001)** (.001)
Austria .01 .005 �.006 .016 .01 .011 �.002 .005 �.008 .023 .024 .031(.001)** (.001)** (.002)** (.003)** (.003)** (.003)** (.004) (.002)* (.002)** (.004)** (.002)** (.005)**
Ireland �.049 �.035 �.006 .038 �.04 �.027 .021 .005 �.042 �.06 �.027 �.019(.001)** (.001)** (.003)* (.004)** (.003)** (.003)** (.004)** (.003)* (.002)** (.002)** (.002)** (.003)**
United Kingdom �.037 �.036 �.044 .016 0 .012 .018 0 �.004 .004 �.003 �.002(.001)** (.001)** (.002)** (.002)** (.002) (.002)** (.002)** (.002) (.002)* (.002) (.001)* (.002)
Sources.—Data for European countries come from ECHPS, data for the United States from CPS.Note.—The sample is restricted to those ages 15–54 inclusive. Dependent variable is whether individual is unemployed conditional on being in the labor force. The reported
coefficients are the marginal effects. Coefficient in column marked A is that on female dummy in probit model of (1). Coefficient in column marked B is that on female dummyin probit model of (2) where the controls are age, education (high being college graduates, ISCED 5–7, and low being less than second stage of secondary education, ISCED0–2), marital status, and number of children ages 0–12 and 13–15. Coefficient in column marked C and subsequent columns is that on female dummy and female dummyinteracted with characteristics in probit model of (3). Standard errors are in parentheses.
* Denotes 5% significance level.** Denotes 1% significance level.
10 Azmat et al.
the presence of children in the household. The results are reported in thesecond column of table 2. Although there is a very slight tendency forthe gender gap in unemployment rates to fall in the Mediterranean coun-tries, little of the gender gap can be explained using these characteristics,and substantial gender gaps in unemployment rates remain in the countrieswhere they exist in the aggregate data.6
The model estimated so far assumes that all the gender gap in unem-ployment rates is constant across all segments of the labor force. But, itmay be the case that the gender gap varies with characteristics. So, wethen estimate a model in which all the characteristics are interacted witha female dummy, that is, a model of the form
Pr (U p 1) p F(b � b female � b x � b female * x). (3)0 1 2 3
The marginal effects of these interactions are reported in the third throughtwelfth column of table 2. Because the probit model is nonlinear onecannot exactly read off the gender gaps in unemployment rates for dif-ferent sorts of workers from this part of table 2 but, to a first approxi-mation, one can work out the gap in unemployment rates between menand women with a given set of characteristics, x, by adding the coefficientsthat apply to them. So, to work out the gender gap for married peoplewith young children one would add the marginal effects for having youngchildren and being female, the marginal effect for being married and femaleand the marginal effect for being female. There is obviously a lot ofinformation, but certain broad patterns emerge.
First, the gender gap in unemployment rates is larger for those whoare married and those who have young dependent children. This is con-sistent with human capital theory as these groups are likely to have largergender differences in human capital. These results also mirror the findingin earnings functions that gender pay gaps are typically larger for themarried and those with young children. However, the variation in thegender gap in unemployment rates over the life cycle does not seem tomirror so obviously the gender gap in pay—in the high-gap countries thegender gap in unemployment rates seems highest among the young whilethe other countries seem to show little consistent pattern of variation. Itshould also be noted that in most of the high-gap countries there remainsa gender gap in unemployment rates for single childless individuals al-though there are some countries where the gender gap in unemploymentrates for these groups is very small. A natural next question is whether
6 We do not make any attempt to correct for the selection of women into thelabor force. In countries where female labor force participation is low (like manyof the Mediterranean countries), the higher-skilled women are more likely to bein the labor force so that the gender gaps in unemployment rates are probablyunderstated when we do not correct for selection on unobservables.
Gender Gaps in OECD Unemployment 11
the gender gap in unemployment rates that we observe in some countriesis the result of gender differences in flows into unemployment or flowsout of unemployment: this is the subject of the next section.
IV. Gender Gaps in Labor Market Dynamics
Most labor economists are familiar with the following formula for thesteady-state unemployment rate:
heuu p , (4)h � heu ue
where is the rate at which workers leave employment for unemploy-heu
ment and is the rate at which they leave unemployment for employ-hue
ment. But, the formula in (4) assumes that there are only two labor marketstates—employment and unemployment. Given the importance of inac-tivity for women (and increasingly for men in many countries) using thisformula to understand gender differences in unemployment rates mightbe thought to be limiting. If one introduces the extra state of inactivity,then one can show that the steady-state unemployment rate (note—notthe unemployment-population ratio) can be written as
h (h /h )eu ei uiu p (1 � a) � a , (5)h � h (h /h ) � (h /h )eu ue ei ui ie iu
where
h h � h hie ui iu eia p . (6)
h (h � h � h ) � h (h � h � h )ie ui eu ue iu ei eu ue
The interpretation of (5) is the following. It says that the overall unem-ployment rate can be thought of as a weighted average of two “com-ponent” unemployment rates. The first term on the right-hand side of(5) is the unemployment rate if there are never any flows into or out ofinactivity (it is simply the formula in [4]). The second term on the right-hand side of (5) is what the unemployment rate would be if there werenever any direct flows between employment and unemployment, onlyindirect flows via inactivity.7 The weight is then a measure of the relativea
importance of flows via inactivity in generating unemployment, althoughit is hard to give an intuition for its exact functional form.
If there are gender differences in unemployment rates, this must bebecause of gender differences in some (or all) of the hazard rates in (5).
7 Note that, for this unemployment rate, it is the relative size of flows fromemployment/unemployment to inactivity and vice versa that is important. So, ifworkers flow at a faster rate from employment to inactivity than from unem-ployment to inactivity, this will tend to raise the unemployment rate.
12 Azmat et al.
Which differences are most important is likely to be helpful in under-standing gender differences in unemployment rates. Table 3 presents es-timates of the hazard rates and computation of the different componentsin (5) for men and table 4 the corresponding information for women. Thedata we use for this come from the retrospective monthly employmenthistory that all individuals in the ECHPS are asked to complete and fromconsecutive monthly CPS files matching those individuals who are in thesample in consecutive months.8 Our method for estimating the labor mar-ket transition rates is the following. We have observations on the labormarket state an individual is in one month (denote this by that canS0
take the values e, u, i) and then again a month later (denote this by ).St
As the interval between the two observations is a month, it is a reasonableapproximation to assume that individuals cannot make two transitions inthat period. Then the simplest way to estimate a hazard rate ( say) isheu
to note that
�h teuPr (S p eFS p e, S ( i) p e . (7)t 0 t
The left-hand side of (7) is readily computed using our data, and we takethe negative of the log to compute the hazard rate.9 The hazard rates intable 3 are multiplied by 100 so that they can be interpreted as the per-centage of individuals in one labor market state moving to another in thecourse of a month.
As well as the hazard rates, tables 3 and 4 also report the three com-ponents of the steady-state unemployment rate as presented in (5)—thesteady-state unemployment rate one would calculate ignoring inactivity(the eighth column), that one would calculate ignoring direct flows be-tween employment and unemployment (the ninth column), and the“share” of the two components using the formula in (5) and (6) (the tenthcolumn). The penultimate column presents the steady-state unemploy-ment rate computed using the hazard rates and the final column the actualunemployment rate in the data as a check on the internal consistency.
8 One noticeable feature of these data is that flows between different labormarket states are much higher in the United States than in the European countries.While this is probably true, the differences are probably overstated in our dataas the European data come from retrospective information that probably tendsto “forget” transitions, and the U.S. data are known to have misclassificationproblems (see Abowd and Zellner 1985; or Abraham and Shimer 2002) that tendto overstate transitions. However, the main interest here is not the comparisonof the levels of transition rates across countries but the gender differences intransition rates across countries. As these are likely to be less affected by mea-surement issues, we do not attempt to correct the data in any way.
9 When the interval between observations is small, the estimated hazard ratewill be very similar to a simple-minded estimate of the probability of movingstates. For example heu as defined in (7) is the probability of moving from em-ployment to unemployment given that there is not a move to inactivity.
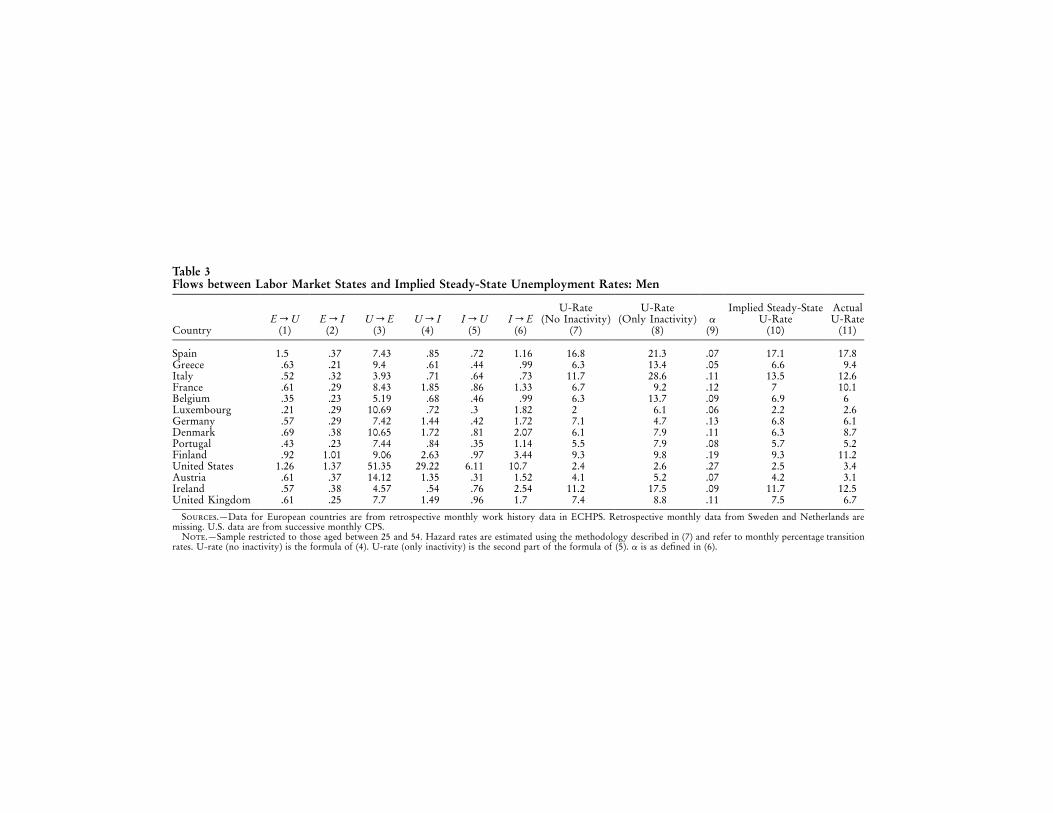
Table 3Flows between Labor Market States and Implied Steady-State Unemployment Rates: Men
CountryE r U
(1)E r I
(2)U r E
(3)U r I
(4)I r U
(5)I r E
(6)
U-Rate(No Inactivity)
(7)
U-Rate(Only Inactivity)
(8)a
(9)
Implied Steady-StateU-Rate
(10)
ActualU-Rate
(11)
Spain 1.5 .37 7.43 .85 .72 1.16 16.8 21.3 .07 17.1 17.8Greece .63 .21 9.4 .61 .44 .99 6.3 13.4 .05 6.6 9.4Italy .52 .32 3.93 .71 .64 .73 11.7 28.6 .11 13.5 12.6France .61 .29 8.43 1.85 .86 1.33 6.7 9.2 .12 7 10.1Belgium .35 .23 5.19 .68 .46 .99 6.3 13.7 .09 6.9 6Luxembourg .21 .29 10.69 .72 .3 1.82 2 6.1 .06 2.2 2.6Germany .57 .29 7.42 1.44 .42 1.72 7.1 4.7 .13 6.8 6.1Denmark .69 .38 10.65 1.72 .81 2.07 6.1 7.9 .11 6.3 8.7Portugal .43 .23 7.44 .84 .35 1.14 5.5 7.9 .08 5.7 5.2Finland .92 1.01 9.06 2.63 .97 3.44 9.3 9.8 .19 9.3 11.2United States 1.26 1.37 51.35 29.22 6.11 10.7 2.4 2.6 .27 2.5 3.4Austria .61 .37 14.12 1.35 .31 1.52 4.1 5.2 .07 4.2 3.1Ireland .57 .38 4.57 .54 .76 2.54 11.2 17.5 .09 11.7 12.5United Kingdom .61 .25 7.7 1.49 .96 1.7 7.4 8.8 .11 7.5 6.7
Sources.—Data for European countries are from retrospective monthly work history data in ECHPS. Retrospective monthly data from Sweden and Netherlands aremissing. U.S. data are from successive monthly CPS.
Note.—Sample restricted to those aged between 25 and 54. Hazard rates are estimated using the methodology described in (7) and refer to monthly percentage transitionrates. U-rate (no inactivity) is the formula of (4). U-rate (only inactivity) is the second part of the formula of (5). is as defined in (6).a
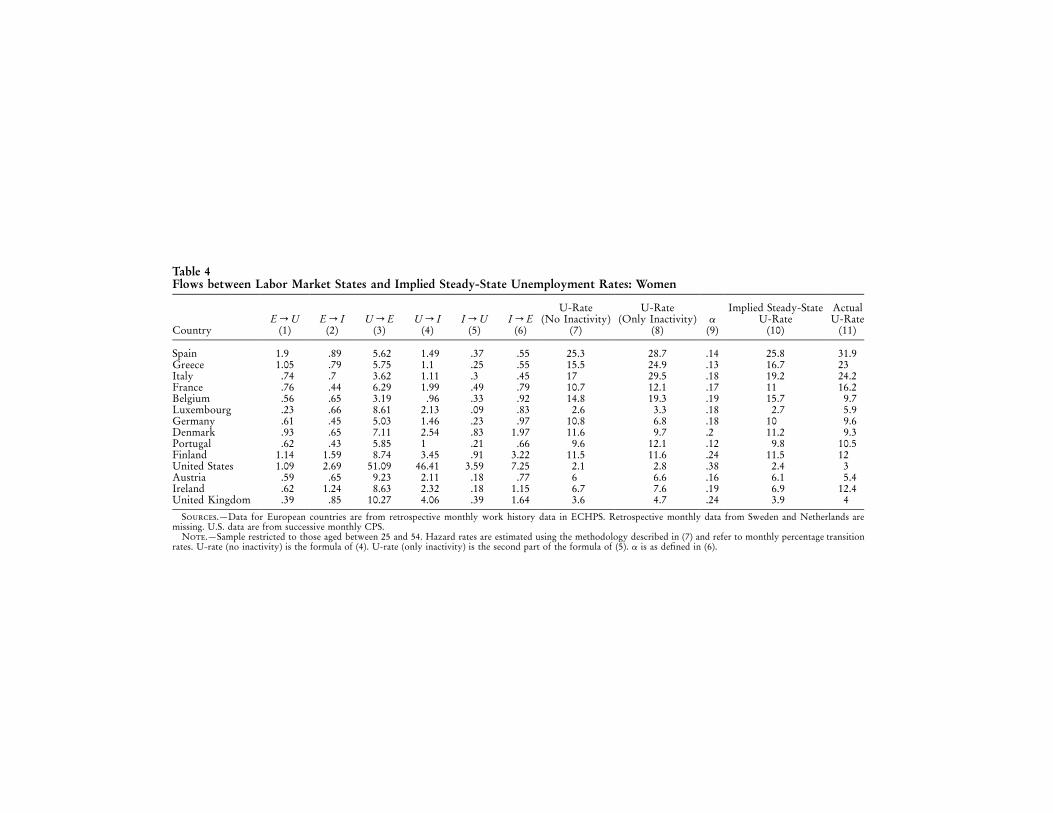
Table 4Flows between Labor Market States and Implied Steady-State Unemployment Rates: Women
CountryE r U
(1)E r I
(2)U r E
(3)U r I
(4)I r U
(5)I r E
(6)
U-Rate(No Inactivity)
(7)
U-Rate(Only Inactivity)
(8)a
(9)
Implied Steady-StateU-Rate
(10)
ActualU-Rate
(11)
Spain 1.9 .89 5.62 1.49 .37 .55 25.3 28.7 .14 25.8 31.9Greece 1.05 .79 5.75 1.1 .25 .55 15.5 24.9 .13 16.7 23Italy .74 .7 3.62 1.11 .3 .45 17 29.5 .18 19.2 24.2France .76 .44 6.29 1.99 .49 .79 10.7 12.1 .17 11 16.2Belgium .56 .65 3.19 .96 .33 .92 14.8 19.3 .19 15.7 9.7Luxembourg .23 .66 8.61 2.13 .09 .83 2.6 3.3 .18 2.7 5.9Germany .61 .45 5.03 1.46 .23 .97 10.8 6.8 .18 10 9.6Denmark .93 .65 7.11 2.54 .83 1.97 11.6 9.7 .2 11.2 9.3Portugal .62 .43 5.85 1 .21 .66 9.6 12.1 .12 9.8 10.5Finland 1.14 1.59 8.74 3.45 .91 3.22 11.5 11.6 .24 11.5 12United States 1.09 2.69 51.09 46.41 3.59 7.25 2.1 2.8 .38 2.4 3Austria .59 .65 9.23 2.11 .18 .77 6 6.6 .16 6.1 5.4Ireland .62 1.24 8.63 2.32 .18 1.15 6.7 7.6 .19 6.9 12.4United Kingdom .39 .85 10.27 4.06 .39 1.64 3.6 4.7 .24 3.9 4
Sources.—Data for European countries are from retrospective monthly work history data in ECHPS. Retrospective monthly data from Sweden and Netherlands aremissing. U.S. data are from successive monthly CPS.
Note.—Sample restricted to those aged between 25 and 54. Hazard rates are estimated using the methodology described in (7) and refer to monthly percentage transitionrates. U-rate (no inactivity) is the formula of (4). U-rate (only inactivity) is the second part of the formula of (5). is as defined in (6).a
Gender Gaps in OECD Unemployment 15
The last two columns are similar, differences arising from the fact thatthe labor markets are not in a steady state.10
Looking at the results for men in table 3, one can see that the a issmall, implying that flows into and out of inactivity are relatively un-important in explaining the male unemployment rate. Also, the two com-ponent unemployment rates are very similar. This implies that the dif-ference in the steady-state unemployment rates computed using theformulae in (4) and (5) are small so that, to a first approximation, onecan ignore inactivity. Given the high labor force participation rates formen, this is probably not that surprising.
What might be found more surprising are the results for women intable 4. It is true that a is larger for women than for men, implying amore important role for inactivity, but, in many countries, it is still verylow. This is quite consistent with a low female participation rate ifinactivity is a very stable state. And, again the two component unem-ployment rates tend to be quite similar, with the conclusion that theuse of (4) rather than (5) will not lead to seriously misleading conclu-sions.
Given the results in tables 3 and 4, we will, in the interests of keepingthe article to a manageable length, concentrate on gender gaps in flowsbetween employment and unemployment and ignore gender differencesin flows involving inactivity. One must be careful here: the results intables 3 and 4 do not suggest that gender gaps in flows involving inactivityare nonexistent, it is simply that they (for some reason) mirror gendergaps in flows that do not involve inactivity. This needs to be borne inmind.
The results in tables 3 and 4 can also shed light on whether the hy-pothesis of Johnson (1983) can explain the cross-country variation in thegender gap in unemployment rates. Johnson argued that there is a gendergap in unemployment rates because women wanting to move from in-activity to employment often go through a period of intervening un-employment. However, the result that turning off the flows involvinginactivity results in very similar cross-country variation in unemploymentrates suggests that this cannot be the whole story. There are sizable gendergaps in direct flows between employment and unemployment in the high-gap countries, and it is not clear that Johnson’s arguments can explainthis.
We now estimate the gender differences in hazard rates controlling for
10 It is worth noting that the gap between the computed steady-state and actualunemployment rates is noticeably larger for women than for men, especially inthe high-gap countries. This is what one would expect when labor market par-ticipation of women is increasing markedly, as is the case in many of thesecountries.
16 Azmat et al.
Table 5Gender Gaps in Labor Market Transition Rates: With Controls
Country E r U U r E U r I E r I I r U I r E
Spain .275 �.354 .575 .884 �.366 �.574(.045)** (.038)** (.066)** (.060)** (.067)** (.061)**
Greece .538 �.47 .551 1.312 �.002 �.608(.067)** (.058)** (.133)** (.067)** (.103) (.081)**
Italy .394 �.138 .359 .849 �.263 �.641(.064)** (.057)* (.081)** (.056)** (.066)** (.080)**
France .266 �.341 �.008 .422 �.497 �.525(.061)** (.059)** (.088) (.065)** (.111)** (.085)**
Belgium .466 �.49 .424 1.059 �.245 �.343(.100)** (.115)** (.187)* (.095)** (.158) (.123)**
Luxembourg �.189 �.195 .94 .93 �.698 �.641(.128) (.111) (.287)** (.086)** (.266)** (.114)**
Germany .012 �.425 .05 .395 �.519 �.34(.043) (.046)** (.075) (.053)** (.110)** (.059)**
Denmark .371 �.432 .387 .609 �.064 .026(.071)** (.068)** (.116)** (.080)** (.114) (.075)
Portugal .446 �.3 .16 .69 �.257 �.56(.073)** (.068)** (.122) (.069)** (.111)* (.069)**
Finland .344 �.068 .28 .629 �.341 �.179(.066)** (.060) (.088)** (.061)** (.093)** (.048)**
United States �.114 �.012 .474 .474 �.463 �.436(.013)** (.012) (.014)** (.014)** (.015)** (.011)**
Austria �.05 �.511 .578 .527 �.408 �.509(.093) (.102)** (.168)** (7.12)** (.176)* (.079)**
Ireland .062 .401 1.058 1.174 �.687 �.22(.080) (.079)** (.164)** (.077)** (.129)** (.057)**
United Kingdom �.473 .292 1.019 1.206 �.76 �.111(.054)** (.053)** (.078)** (.051)** (.084)** (.050)*
Sources.—Data for European countries are from retrospective monthly work history data in ECHPS.Retrospective monthly data from Sweden and Netherlands are missing. U.S. data are from successivemonthly CPS.
Note.—Sample restricted to those aged between 25 and 54. Hazard rates are estimated using themethodology described in (7) and refer to monthly percentage transition rates. U-rate (no inactivity) isthe formula of (4). U-rate (only inactivity) is the second part of the formula of (5). is as defined ina(6). Controls are age, education, marital status, and number of children.
* Denotes 5% significance level.** Denotes 1% significance level.
other relevant variables. As the hazard rates must be nonnegative, a con-venient empirical model is
b xeuh p e , (8)eu
where x is a vector of characteristics (that will include female dummies).Substituting (8) into (7) suggests that a simple way to estimate is tobeu
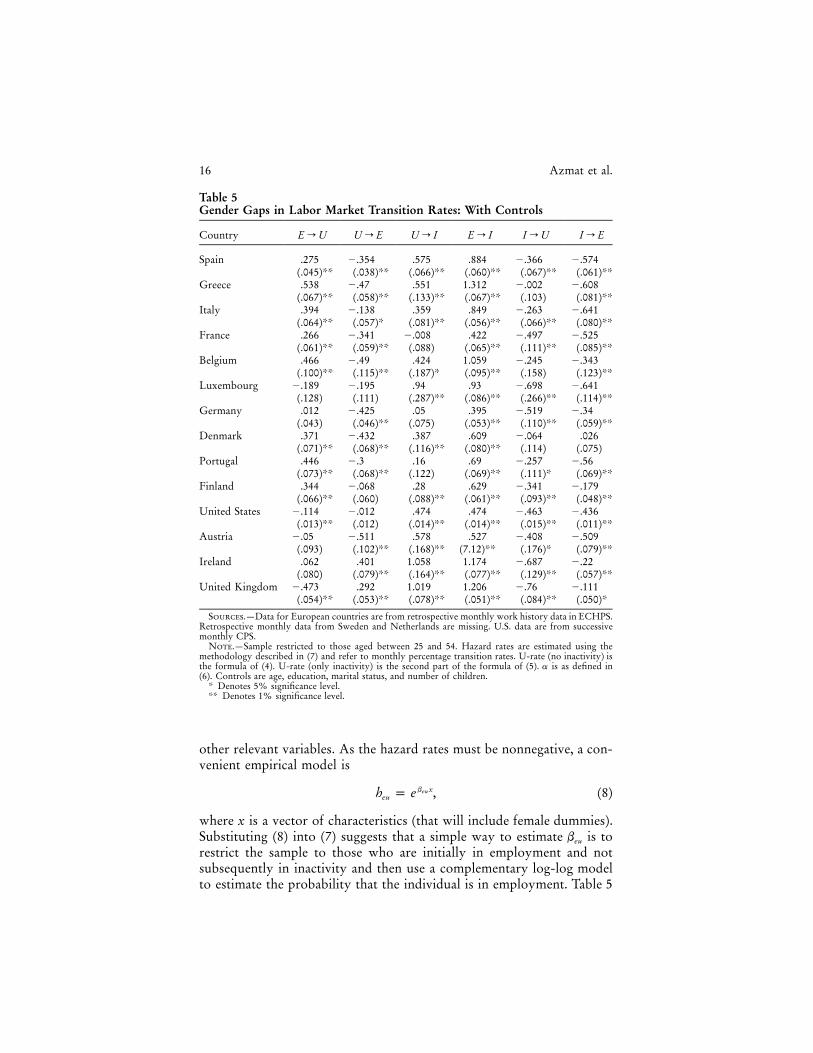
restrict the sample to those who are initially in employment and notsubsequently in inactivity and then use a complementary log-log modelto estimate the probability that the individual is in employment. Table 5
Gender Gaps in OECD Unemployment 17
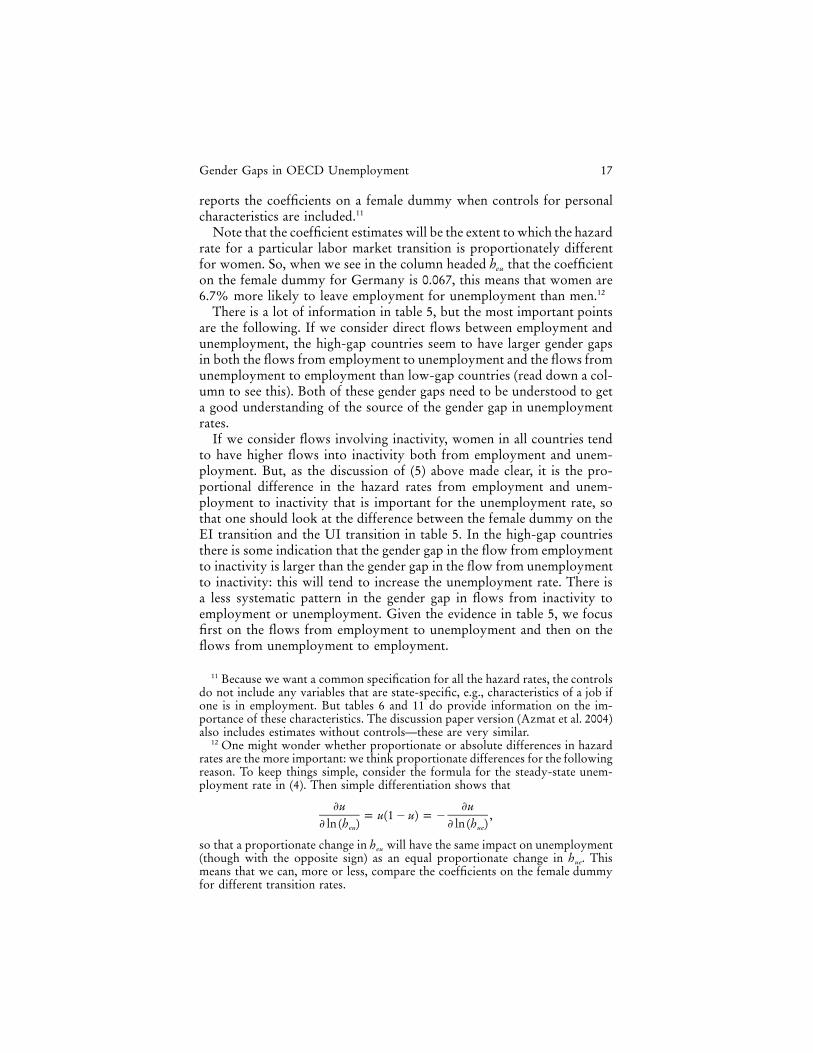
reports the coefficients on a female dummy when controls for personalcharacteristics are included.11
Note that the coefficient estimates will be the extent to which the hazardrate for a particular labor market transition is proportionately differentfor women. So, when we see in the column headed that the coefficientheu
on the female dummy for Germany is 0.067, this means that women are6.7% more likely to leave employment for unemployment than men.12
There is a lot of information in table 5, but the most important pointsare the following. If we consider direct flows between employment andunemployment, the high-gap countries seem to have larger gender gapsin both the flows from employment to unemployment and the flows fromunemployment to employment than low-gap countries (read down a col-umn to see this). Both of these gender gaps need to be understood to geta good understanding of the source of the gender gap in unemploymentrates.
If we consider flows involving inactivity, women in all countries tendto have higher flows into inactivity both from employment and unem-ployment. But, as the discussion of (5) above made clear, it is the pro-portional difference in the hazard rates from employment and unem-ployment to inactivity that is important for the unemployment rate, sothat one should look at the difference between the female dummy on theEI transition and the UI transition in table 5. In the high-gap countriesthere is some indication that the gender gap in the flow from employmentto inactivity is larger than the gender gap in the flow from unemploymentto inactivity: this will tend to increase the unemployment rate. There isa less systematic pattern in the gender gap in flows from inactivity toemployment or unemployment. Given the evidence in table 5, we focusfirst on the flows from employment to unemployment and then on theflows from unemployment to employment.
11 Because we want a common specification for all the hazard rates, the controlsdo not include any variables that are state-specific, e.g., characteristics of a job ifone is in employment. But tables 6 and 11 do provide information on the im-portance of these characteristics. The discussion paper version (Azmat et al. 2004)also includes estimates without controls—these are very similar.
12 One might wonder whether proportionate or absolute differences in hazardrates are the more important: we think proportionate differences for the followingreason. To keep things simple, consider the formula for the steady-state unem-ployment rate in (4). Then simple differentiation shows that
�u �up u(1 � u) p � ,
� ln (h ) � ln (h )eu ue
so that a proportionate change in will have the same impact on unemploymentheu
(though with the opposite sign) as an equal proportionate change in . Thishue
means that we can, more or less, compare the coefficients on the female dummyfor different transition rates.
18 Azmat et al.
V. Gender Differences in Flows from Employmentto Unemployment
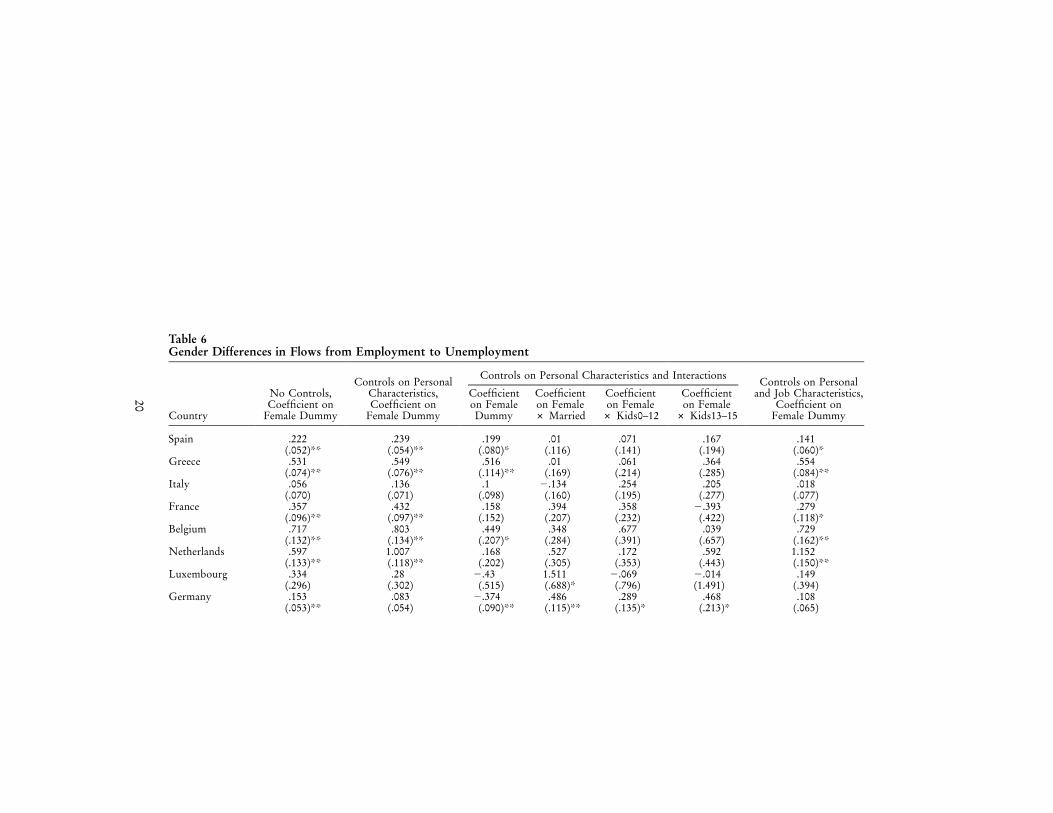
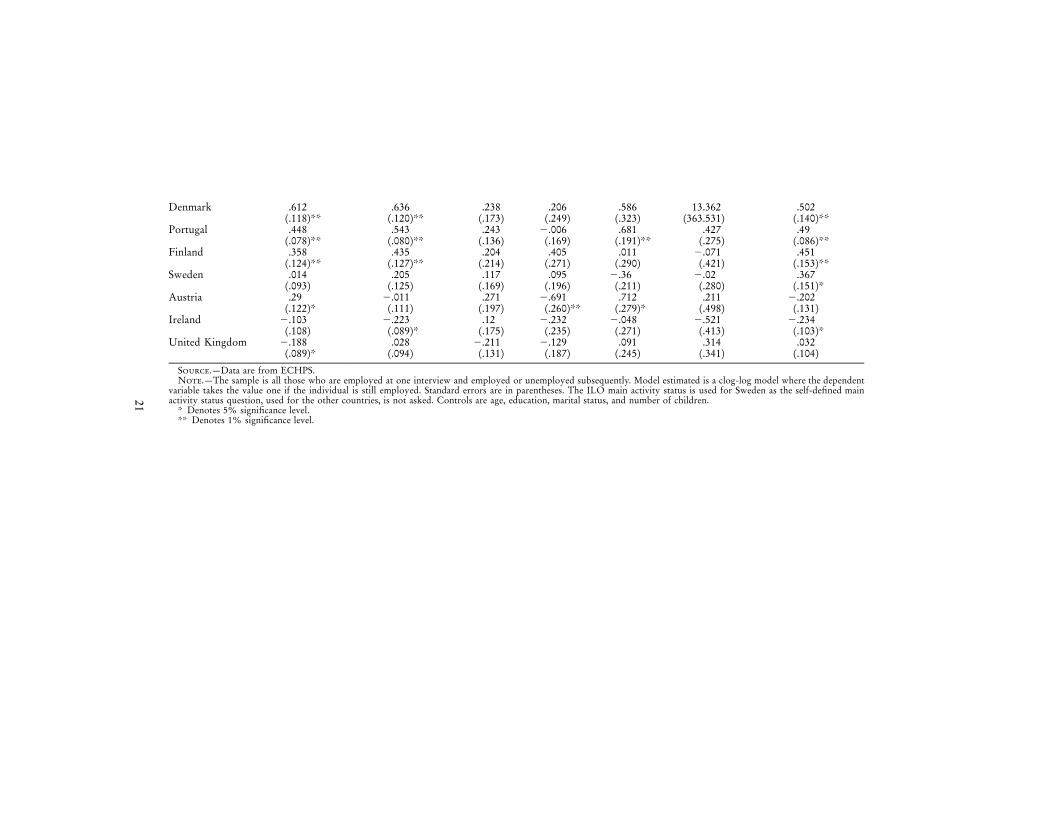
As table 5 has shown, women in the high-gap countries leave employ-ment for unemployment at a higher rate than do men. The flow fromemployment to unemployment is investigated further in table 6. Theseregressions are similar to the one estimated in table 5 except that, in somespecifications, we include some characteristics of the job as extra controls.Also, because the information on the characteristics of the job held areonly available for jobs held at the annual interview, these equations areestimated on annual data.
The first column of table 6 reports estimates of models for the transitionfrom employment to unemployment that include only a female dummy.The qualitative patterns of these coefficients that are based on annual dataare the same as those in table 5 (that were based on monthly data) withwomen having higher rates of transition from employment to unem-ployment than men in the high-gap countries. The second column thenintroduces personal characteristics as extra controls: this has only marginaleffects on the coefficient on the female dummy. The next four columnsthen report results when we interact the female dummy with marital statusand the number of children to see whether there is significant variationin the gender gap in the flow from employment to unemployment. Thesigns of these interaction terms do suggest that married women andwomen with children have higher rates of leaving employment for un-employment (as would be predicted by the human capital model), butmost of the coefficients are insignificantly different from zero and thesecoefficients are not noticeably higher in the high-gap countries.13
This suggests that domestic responsibilities do not play a big role intransitions from employment to unemployment. This is not to say thatdomestic responsibilities do not play an important role in women’s flowsout of employment, just that women with children are more likely toleave employment for inactivity than unemployment. This conclusion isconsistent with information on the reasons given for why jobs end thatis tabulated in table 7 both for those who are currently unemployed andthose who are currently inactive. With the exception of a couple of coun-tries, reasons connected with “caring” account for a very small fractionof jobs ending where the individual is currently unemployed.14 This is
13 This result is a little different from that in the literature on education andunemployment where the high unemployment rate of the less-educated is pri-marily due to a higher incidence and not a longer duration.
14 In fact, table 7 probably overstates the proportion, as women who had chil-dren and left employment for inactivity but are now trying to get a job againwill be included in the currently unemployed category.
Gender Gaps in OECD Unemployment 19
not surprising: most women leaving employment to have children godirectly into inactivity.
In many countries men are more likely than women to be laid-off. Incountries such as the United Kingdom this difference is extreme—45%of male jobs end because the worker is laid-off compared to 23% ofwomen. In the high-gap countries, the most striking feature of table 7 isthat there is not a large gender difference in the fraction of jobs endingin layoff. A plausible explanation of this is that men in the high-gapcountries are much more likely to be in long-term permanent jobs inwhich the right of employers to fire workers is severely restricted. Womenare less likely to be in these jobs because they are more likely to havehad interruptions in their work histories.
This hypothesis is explored further in the final column in table 6, wherewe report the coefficient on the female dummy when job characteristics(industry, occupation, public/private size of firm, full-/part-time, per-manent/temporary, job tenure) are also included in a model of the tran-sitions from employment to unemployment. Petrongolo (2004) has doc-umented how female workers are overrepresented in temporary andpart-time jobs that are generally at more risk of ending. In some of thehigh-gap countries, notably France and Spain (which are heavy users oftemporary contracts; see Azmat et al. [2004, table A1]), the introductionof these variables does significantly reduce the coefficient on the femaledummy, suggesting that the “two-tier” labor market operated in thesecountries that protects the jobs of some workers at the expense of othersworks to the disadvantage of women. Now, let us turn to flows in theopposite direction, from unemployment to employment.
VI. Flows from Unemployment to Employment:The Behavior of Workers
The actions of both individuals and employers are likely to affect theflow from unemployment to employment. In this section, we considerthe actions of the unemployed themselves; the following section considersthe actions of employers.
The unemployment rate is meant to measure the fraction of people whowant a job but do not have one. The ILO definition of unemploymentuses evidence that people have looked for work in the recent past andare available to start work in the near future to determine whether peoplewithout work currently want it. But some economists think that, whilethere is a meaningful distinction between employment and nonemploy-ment, the distinction between unemployment and inactivity is meaning-less. On this view, the fact that fewer women want paid work (largelybecause of domestic responsibilities) spills over into a higher unemploy-ment rate and does not show up only in a lower labor force participation
20
Table 6Gender Differences in Flows from Employment to Unemployment
Country
No Controls,Coefficient on
Female Dummy
Controls on PersonalCharacteristics,Coefficient on
Female Dummy
Controls on Personal Characteristics and InteractionsControls on Personal
and Job Characteristics,Coefficient on
Female Dummy
Coefficienton FemaleDummy
Coefficienton Female# Married
Coefficienton Female
# Kids0–12
Coefficienton Female
# Kids13–15
Spain .222 .239 .199 .01 .071 .167 .141(.052)** (.054)** (.080)* (.116) (.141) (.194) (.060)*
Greece .531 .549 .516 .01 .061 .364 .554(.074)** (.076)** (.114)** (.169) (.214) (.285) (.084)**
Italy .056 .136 .1 �.134 .254 .205 .018(.070) (.071) (.098) (.160) (.195) (.277) (.077)
France .357 .432 .158 .394 .358 �.393 .279(.096)** (.097)** (.152) (.207) (.232) (.422) (.118)*
Belgium .717 .803 .449 .348 .677 .039 .729(.132)** (.134)** (.207)* (.284) (.391) (.657) (.162)**
Netherlands .597 1.007 .168 .527 .172 .592 1.152(.133)** (.118)** (.202) (.305) (.353) (.443) (.150)**
Luxembourg .334 .28 �.43 1.511 �.069 �.014 .149(.296) (.302) (.515) (.688)* (.796) (1.491) (.394)
Germany .153 .083 �.374 .486 .289 .468 .108(.053)** (.054) (.090)** (.115)** (.135)* (.213)* (.065)
21
Denmark .612 .636 .238 .206 .586 13.362 .502(.118)** (.120)** (.173) (.249) (.323) (363.531) (.140)**
Portugal .448 .543 .243 �.006 .681 .427 .49(.078)** (.080)** (.136) (.169) (.191)** (.275) (.086)**
Finland .358 .435 .204 .405 .011 �.071 .451(.124)** (.127)** (.214) (.271) (.290) (.421) (.153)**
Sweden .014 .205 .117 .095 �.36 �.02 .367(.093) (.125) (.169) (.196) (.211) (.280) (.151)*
Austria .29 �.011 .271 �.691 .712 .211 �.202(.122)* (.111) (.197) (.260)** (.279)* (.498) (.131)
Ireland �.103 �.223 .12 �.232 �.048 �.521 �.234(.108) (.089)* (.175) (.235) (.271) (.413) (.103)*
United Kingdom �.188 .028 �.211 �.129 .091 .314 .032(.089)* (.094) (.131) (.187) (.245) (.341) (.104)
Source.—Data are from ECHPS.Note.—The sample is all those who are employed at one interview and employed or unemployed subsequently. Model estimated is a clog-log model where the dependent
variable takes the value one if the individual is still employed. Standard errors are in parentheses. The ILO main activity status is used for Sweden as the self-defined mainactivity status question, used for the other countries, is not asked. Controls are age, education, marital status, and number of children.
* Denotes 5% significance level.** Denotes 1% significance level.
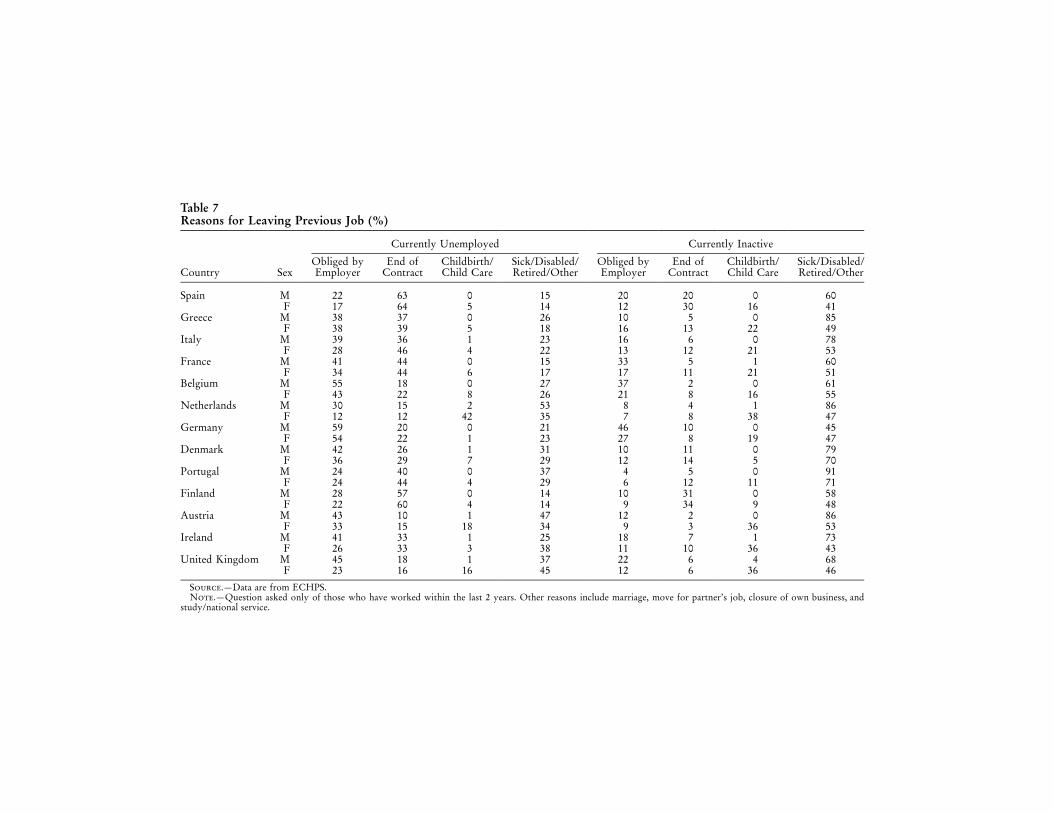
Table 7Reasons for Leaving Previous Job (%)
Country Sex
Currently Unemployed Currently Inactive
Obliged byEmployer
End ofContract
Childbirth/Child Care
Sick/Disabled/Retired/Other
Obliged byEmployer
End ofContract
Childbirth/Child Care
Sick/Disabled/Retired/Other
Spain M 22 63 0 15 20 20 0 60F 17 64 5 14 12 30 16 41
Greece M 38 37 0 26 10 5 0 85F 38 39 5 18 16 13 22 49
Italy M 39 36 1 23 16 6 0 78F 28 46 4 22 13 12 21 53
France M 41 44 0 15 33 5 1 60F 34 44 6 17 17 11 21 51
Belgium M 55 18 0 27 37 2 0 61F 43 22 8 26 21 8 16 55
Netherlands M 30 15 2 53 8 4 1 86F 12 12 42 35 7 8 38 47
Germany M 59 20 0 21 46 10 0 45F 54 22 1 23 27 8 19 47
Denmark M 42 26 1 31 10 11 0 79F 36 29 7 29 12 14 5 70
Portugal M 24 40 0 37 4 5 0 91F 24 44 4 29 6 12 11 71
Finland M 28 57 0 14 10 31 0 58F 22 60 4 14 9 34 9 48
Austria M 43 10 1 47 12 2 0 86F 33 15 18 34 9 3 36 53
Ireland M 41 33 1 25 18 7 1 73F 26 33 3 38 11 10 36 43
United Kingdom M 45 18 1 37 22 6 4 68F 23 16 16 45 12 6 36 46
Source.—Data are from ECHPS.Note.—Question asked only of those who have worked within the last 2 years. Other reasons include marriage, move for partner’s job, closure of own business, and
study/national service.
Gender Gaps in OECD Unemployment 23
Table 8Are the Unemployed More Likely than the Inactive to Get a Job?
FemaleFemale & Unemployed
in t p 0 Unemployed in t p 0
Spain �.124 .418 1.702(.164) (.069)** (.047)**
Greece �.302 .426 1.985(.253) (.105)** (.074)**
Italy �1.04 .611 1.452(.324)** (.100)** (.070)**
France �.269 .19 1.557(.196) (.100) (.077)**
Belgium �.836 �.513 1.396(.347)* (.169)** (.131)**
Luxembourg �.203 .317 .793(.325) (.159)* (.112)**
Germany �.093 .094 1.392(.157) (.070) (.051)**
Denmark �.428 �.434 1.78(.219) (.104)** (.081)**
Portugal �.346 .289 1.724(.227) (.097)** (.070)**
Finland .059 .137 .911(.196) (.078) (.059)**
United States �.035 .266 1.145(.026) (.016)** (.012)**
Austria �.45 .171 2.149(.303) (.129) (.092)**
Ireland �.341 .491 .972(.265) (.104)** (.067)**
United Kingdom �.179 .235 1.579(.138) (.073)** (.055)**
Sources.—Data for European countries are from ECHPS retrospective work history data; data forUnited States are from successive monthly CPS files.
Note.—The sample is all those who are not in employment in an initial month, and the dependentvariable is whether they are still not in employment a month later. The other controls included are age,education level, gender, presence and age of children, and the gender dummy interacted with the othercontrols.
* Denotes 5% significance level.** Denotes 1% significance level.
rate. If this is true, then, in some sense, the female unemployed in high-gap countries may be less serious about wanting a job and taking stepsto get one than the male unemployed. There are a number of ways inwhich one might test this hypothesis.
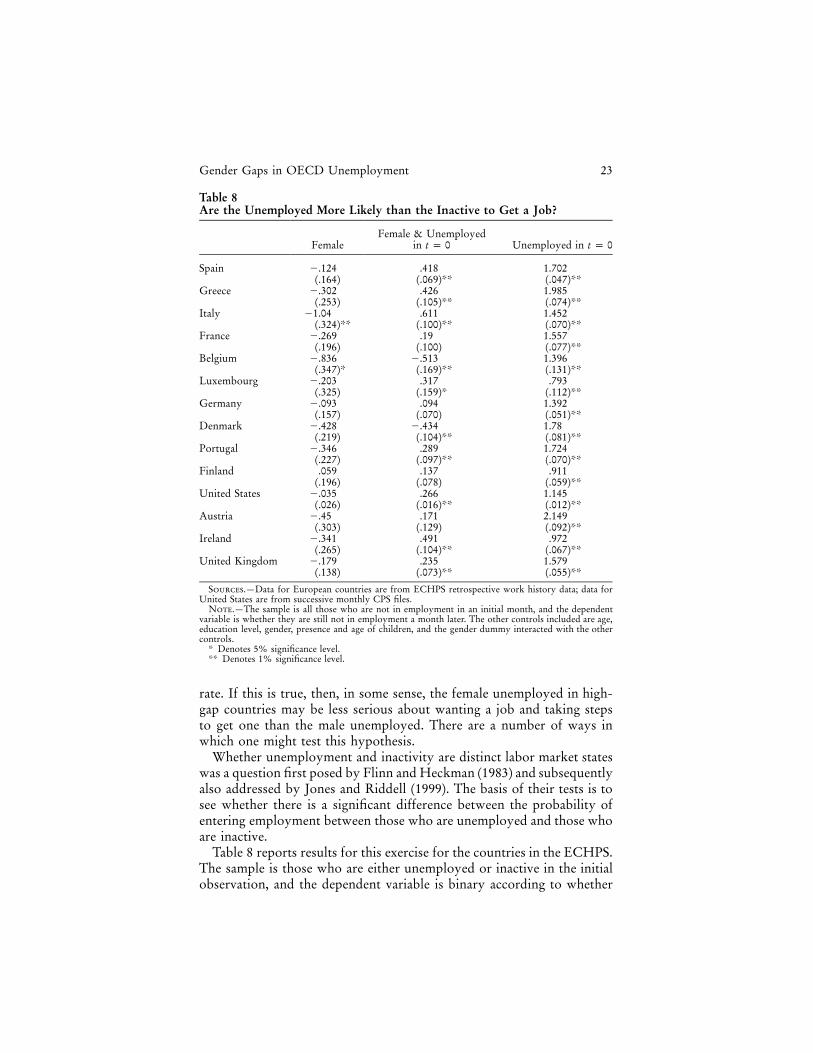
Whether unemployment and inactivity are distinct labor market stateswas a question first posed by Flinn and Heckman (1983) and subsequentlyalso addressed by Jones and Riddell (1999). The basis of their tests is tosee whether there is a significant difference between the probability ofentering employment between those who are unemployed and those whoare inactive.
Table 8 reports results for this exercise for the countries in the ECHPS.The sample is those who are either unemployed or inactive in the initialobservation, and the dependent variable is binary according to whether
24 Azmat et al.
the individual is subsequently in employment or not. We report the mar-ginal effect of being in employment in a month’s time of being unem-ployed rather than inactive. We also interact a female dummy with thisvariable to see whether there are significant gender differences. In allcountries the unemployed are more likely to get a job than the inactive.The extent of this is similar in high-gap and low-gap countries. Further,the interaction of the initially unemployed variable with the femaledummy is not noticeably smaller in the high-gap countries, as one wouldexpect if the female unemployed are less serious about getting work thantheir male counterparts: indeed the interaction term is largest in some ofthe high-gap countries. There is no evidence here that, in the high-gapcountries, the difference between the unemployed and the inactive is moreblurred for women than in the low-gap countries.
Another way to consider the hypothesis that the female unemployedin some countries are less serious about getting work is to look at evidenceon job search intensity. Measuring search intensity is problematic, andthe only available evidence is on numbers and types of job search methodsthat the unemployed report using (though it should be noted that thosewho report using more search methods do typically have lower durationsof unemployment). Table 9 presents evidence for the three countries forwhich we have been able to obtain it—Spain, the United Kingdom, andthe United States. There are sizable and well-known differences in theuse of different search methods across countries, with, for example, theunemployed in the United States being much less likely to report use ofthe public employment service and to report the use of personal contactsand the United Kingdom unemployed reporting the use of more searchmethods than those in the United States and Spain (see Pellizzari [2004]for a cross-country comparison of search methods used to get jobs andthe wage premia associated with them).15 In all countries men report usingslightly more search methods than women, but this gap is similar in Spain(a high-gap country) and the United States/United Kingdom (both low-gap countries). The limited evidence presented provides no support forthe view that the women in high-gap countries are much less serious intheir desire for work, as evidenced by their search effort.
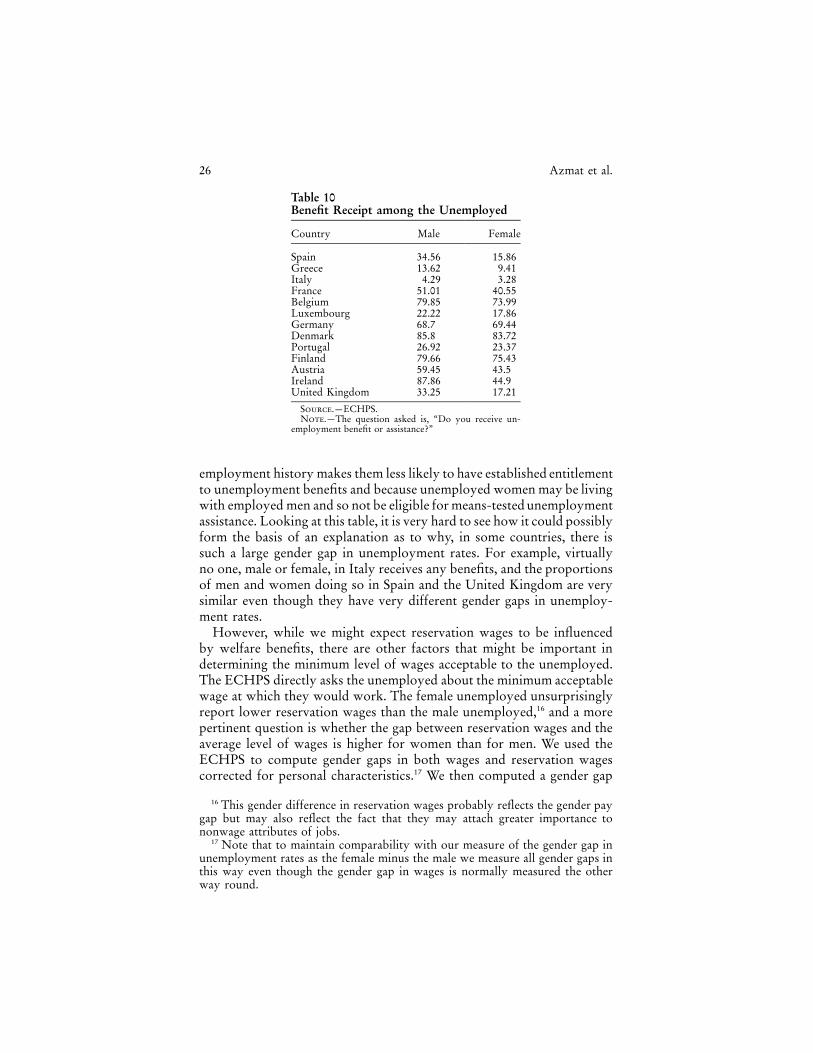
Another variant of this hypothesis is that the level and availability ofwelfare benefits affect the reservation wage and, hence, the exit rate fromunemployment. Table 10 presents some data on the fraction of the un-employed of different genders who report receiving any form of welfarebenefit associated with unemployment. In most countries women are lesslikely to receive welfare benefits than men, primarily because their weaker
15 One should not make too much of this as the different countries allow re-spondents a different maximum number of search methods to be listed, and thismay influence responses, although very few report the maximum allowed.
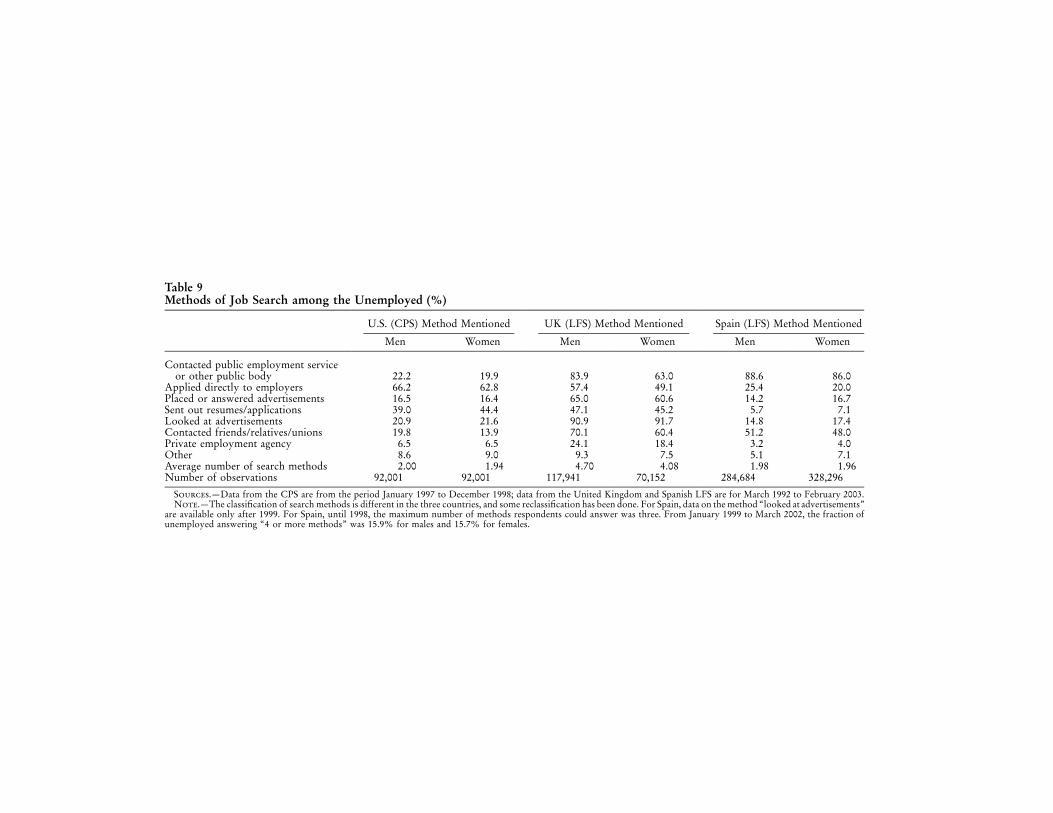
Table 9Methods of Job Search among the Unemployed (%)
U.S. (CPS) Method Mentioned UK (LFS) Method Mentioned Spain (LFS) Method Mentioned
Men Women Men Women Men Women
Contacted public employment serviceor other public body 22.2 19.9 83.9 63.0 88.6 86.0
Applied directly to employers 66.2 62.8 57.4 49.1 25.4 20.0Placed or answered advertisements 16.5 16.4 65.0 60.6 14.2 16.7Sent out resumes/applications 39.0 44.4 47.1 45.2 5.7 7.1Looked at advertisements 20.9 21.6 90.9 91.7 14.8 17.4Contacted friends/relatives/unions 19.8 13.9 70.1 60.4 51.2 48.0Private employment agency 6.5 6.5 24.1 18.4 3.2 4.0Other 8.6 9.0 9.3 7.5 5.1 7.1Average number of search methods 2.00 1.94 4.70 4.08 1.98 1.96Number of observations 92,001 92,001 117,941 70,152 284,684 328,296
Sources.—Data from the CPS are from the period January 1997 to December 1998; data from the United Kingdom and Spanish LFS are for March 1992 to February 2003.Note.—The classification of search methods is different in the three countries, and some reclassification has been done. For Spain, data on the method “looked at advertisements”
are available only after 1999. For Spain, until 1998, the maximum number of methods respondents could answer was three. From January 1999 to March 2002, the fraction ofunemployed answering “4 or more methods” was 15.9% for males and 15.7% for females.
26 Azmat et al.
Table 10Benefit Receipt among the Unemployed
Country Male Female
Spain 34.56 15.86Greece 13.62 9.41Italy 4.29 3.28France 51.01 40.55Belgium 79.85 73.99Luxembourg 22.22 17.86Germany 68.7 69.44Denmark 85.8 83.72Portugal 26.92 23.37Finland 79.66 75.43Austria 59.45 43.5Ireland 87.86 44.9United Kingdom 33.25 17.21
Source.—ECHPS.Note.—The question asked is, “Do you receive un-
employment benefit or assistance?”
employment history makes them less likely to have established entitlementto unemployment benefits and because unemployed women may be livingwith employed men and so not be eligible for means-tested unemploymentassistance. Looking at this table, it is very hard to see how it could possiblyform the basis of an explanation as to why, in some countries, there issuch a large gender gap in unemployment rates. For example, virtuallyno one, male or female, in Italy receives any benefits, and the proportionsof men and women doing so in Spain and the United Kingdom are verysimilar even though they have very different gender gaps in unemploy-ment rates.
However, while we might expect reservation wages to be influencedby welfare benefits, there are other factors that might be important indetermining the minimum level of wages acceptable to the unemployed.The ECHPS directly asks the unemployed about the minimum acceptablewage at which they would work. The female unemployed unsurprisinglyreport lower reservation wages than the male unemployed,16 and a morepertinent question is whether the gap between reservation wages and theaverage level of wages is higher for women than for men. We used theECHPS to compute gender gaps in both wages and reservation wagescorrected for personal characteristics.17 We then computed a gender gap
16 This gender difference in reservation wages probably reflects the gender paygap but may also reflect the fact that they may attach greater importance tononwage attributes of jobs.
17 Note that to maintain comparability with our measure of the gender gap inunemployment rates as the female minus the male we measure all gender gaps inthis way even though the gender gap in wages is normally measured the otherway round.
Gender Gaps in OECD Unemployment 27
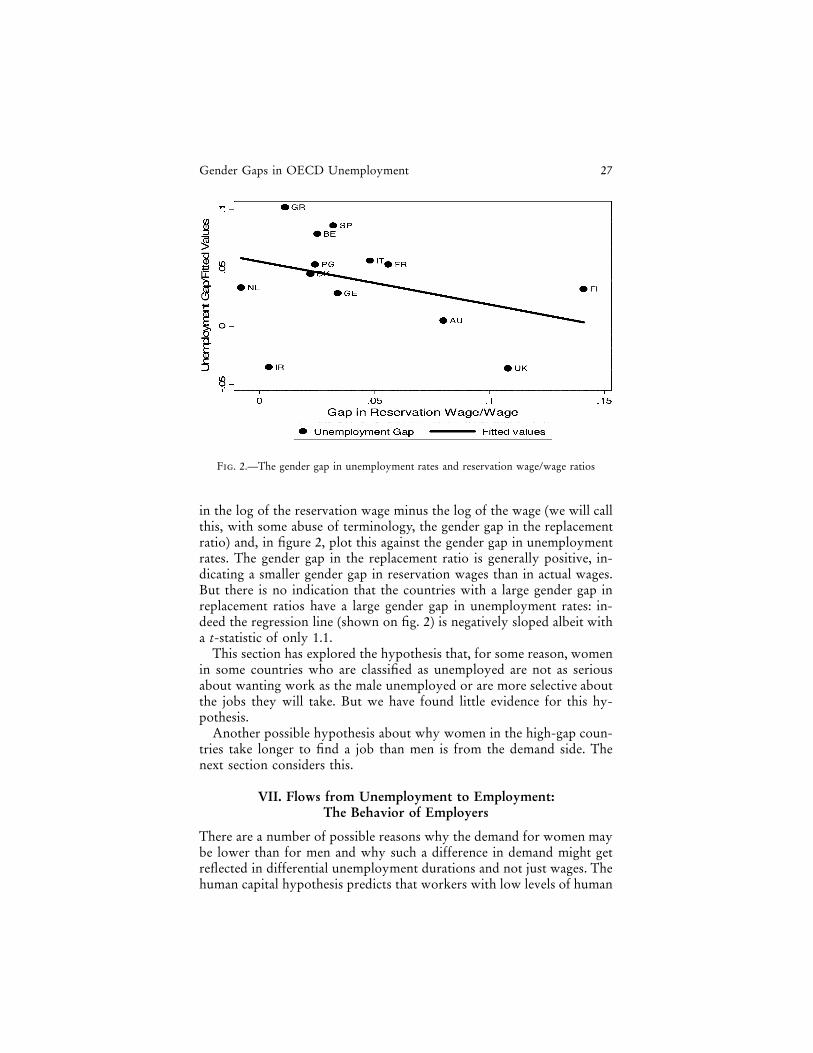
Fig. 2.—The gender gap in unemployment rates and reservation wage/wage ratios
in the log of the reservation wage minus the log of the wage (we will callthis, with some abuse of terminology, the gender gap in the replacementratio) and, in figure 2, plot this against the gender gap in unemploymentrates. The gender gap in the replacement ratio is generally positive, in-dicating a smaller gender gap in reservation wages than in actual wages.But there is no indication that the countries with a large gender gap inreplacement ratios have a large gender gap in unemployment rates: in-deed the regression line (shown on fig. 2) is negatively sloped albeit witha t-statistic of only 1.1.
This section has explored the hypothesis that, for some reason, womenin some countries who are classified as unemployed are not as seriousabout wanting work as the male unemployed or are more selective aboutthe jobs they will take. But we have found little evidence for this hy-pothesis.
Another possible hypothesis about why women in the high-gap coun-tries take longer to find a job than men is from the demand side. Thenext section considers this.
VII. Flows from Unemployment to Employment:The Behavior of Employers
There are a number of possible reasons why the demand for women maybe lower than for men and why such a difference in demand might getreflected in differential unemployment durations and not just wages. Thehuman capital hypothesis predicts that workers with low levels of human
28 Azmat et al.
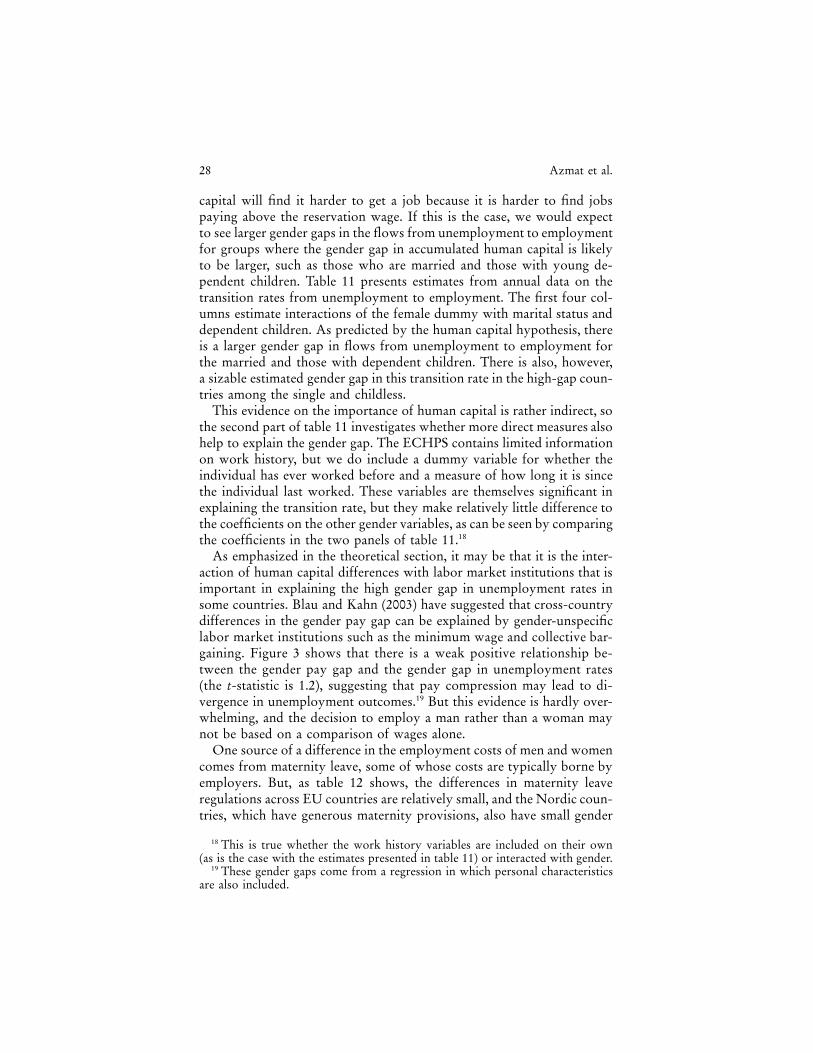
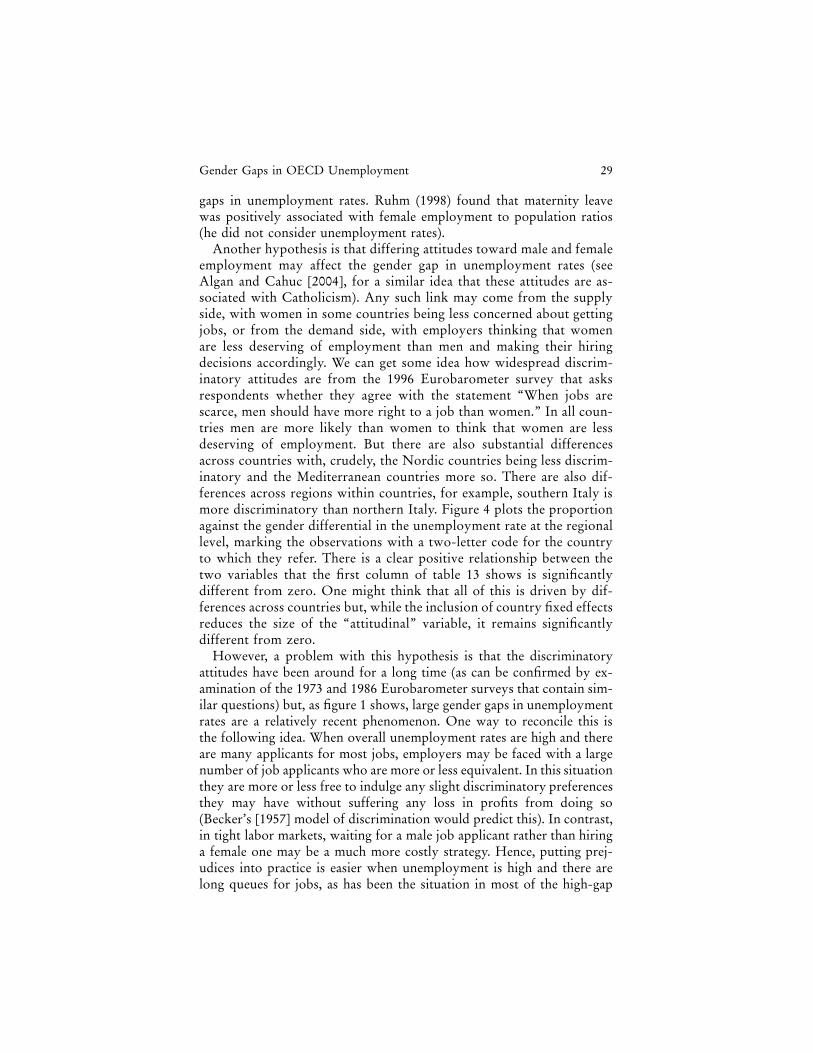
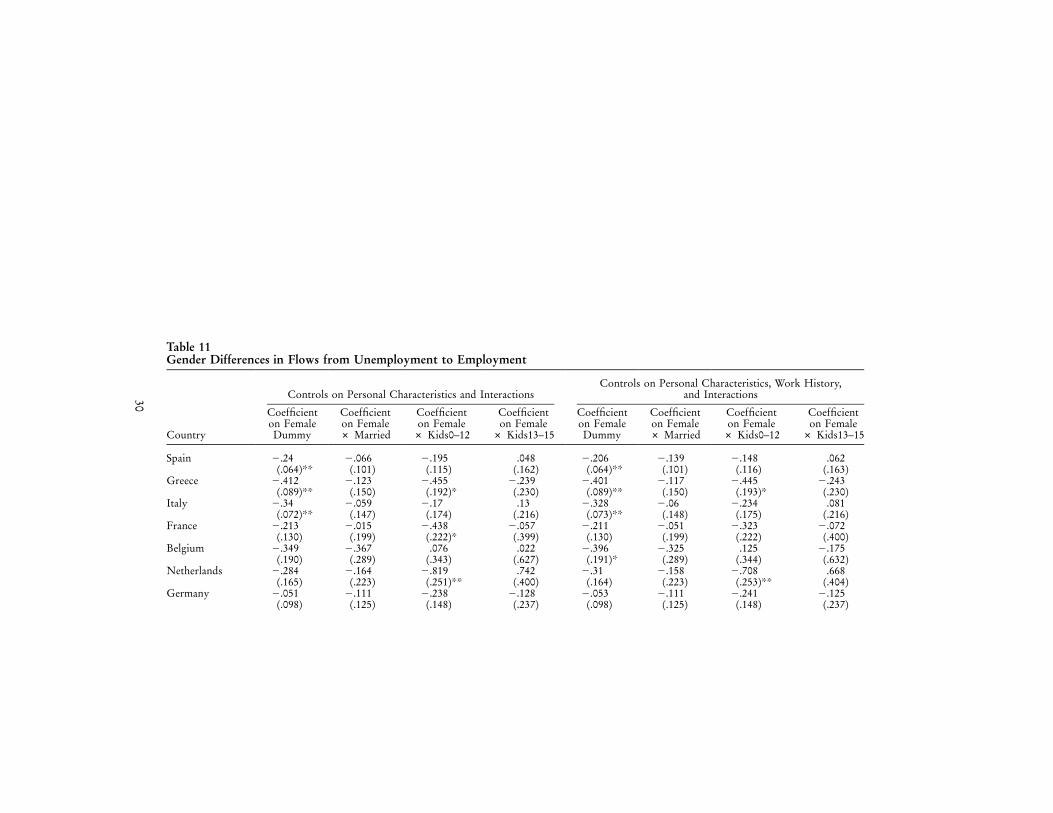
capital will find it harder to get a job because it is harder to find jobspaying above the reservation wage. If this is the case, we would expectto see larger gender gaps in the flows from unemployment to employmentfor groups where the gender gap in accumulated human capital is likelyto be larger, such as those who are married and those with young de-pendent children. Table 11 presents estimates from annual data on thetransition rates from unemployment to employment. The first four col-umns estimate interactions of the female dummy with marital status anddependent children. As predicted by the human capital hypothesis, thereis a larger gender gap in flows from unemployment to employment forthe married and those with dependent children. There is also, however,a sizable estimated gender gap in this transition rate in the high-gap coun-tries among the single and childless.
This evidence on the importance of human capital is rather indirect, sothe second part of table 11 investigates whether more direct measures alsohelp to explain the gender gap. The ECHPS contains limited informationon work history, but we do include a dummy variable for whether theindividual has ever worked before and a measure of how long it is sincethe individual last worked. These variables are themselves significant inexplaining the transition rate, but they make relatively little difference tothe coefficients on the other gender variables, as can be seen by comparingthe coefficients in the two panels of table 11.18
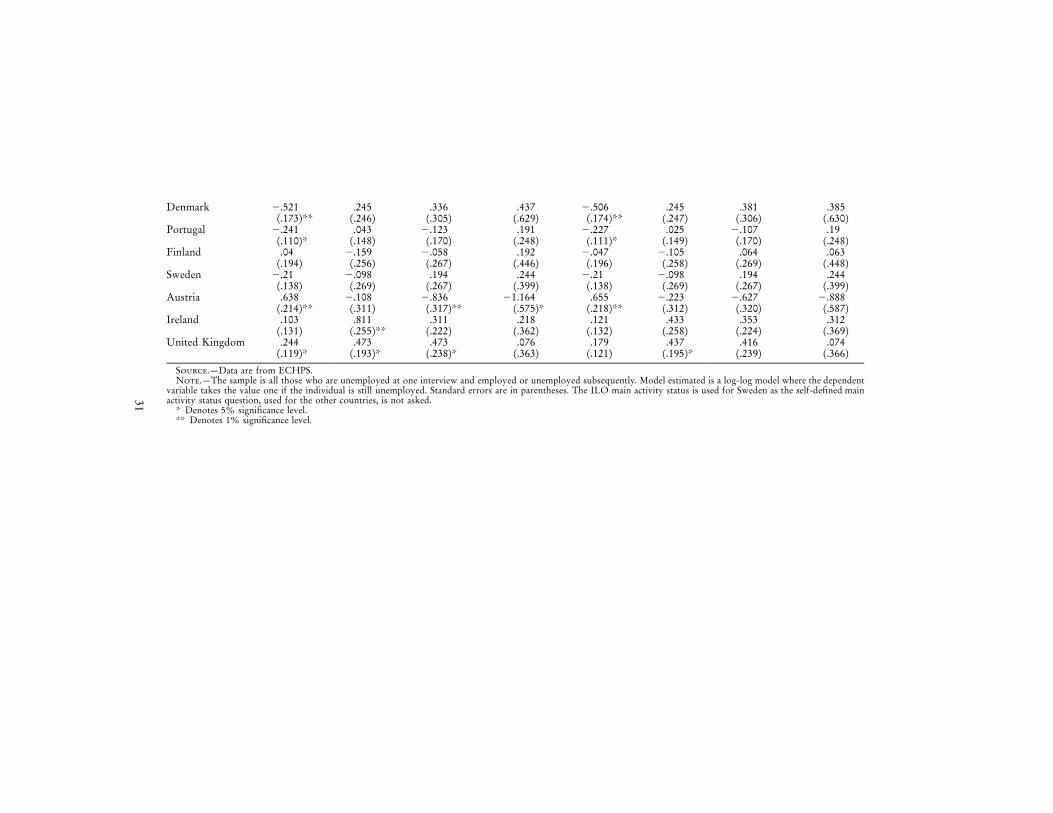
As emphasized in the theoretical section, it may be that it is the inter-action of human capital differences with labor market institutions that isimportant in explaining the high gender gap in unemployment rates insome countries. Blau and Kahn (2003) have suggested that cross-countrydifferences in the gender pay gap can be explained by gender-unspecificlabor market institutions such as the minimum wage and collective bar-gaining. Figure 3 shows that there is a weak positive relationship be-tween the gender pay gap and the gender gap in unemployment rates(the t-statistic is 1.2), suggesting that pay compression may lead to di-vergence in unemployment outcomes.19 But this evidence is hardly over-whelming, and the decision to employ a man rather than a woman maynot be based on a comparison of wages alone.
One source of a difference in the employment costs of men and womencomes from maternity leave, some of whose costs are typically borne byemployers. But, as table 12 shows, the differences in maternity leaveregulations across EU countries are relatively small, and the Nordic coun-tries, which have generous maternity provisions, also have small gender
18 This is true whether the work history variables are included on their own(as is the case with the estimates presented in table 11) or interacted with gender.
19 These gender gaps come from a regression in which personal characteristicsare also included.
Gender Gaps in OECD Unemployment 29
gaps in unemployment rates. Ruhm (1998) found that maternity leavewas positively associated with female employment to population ratios(he did not consider unemployment rates).
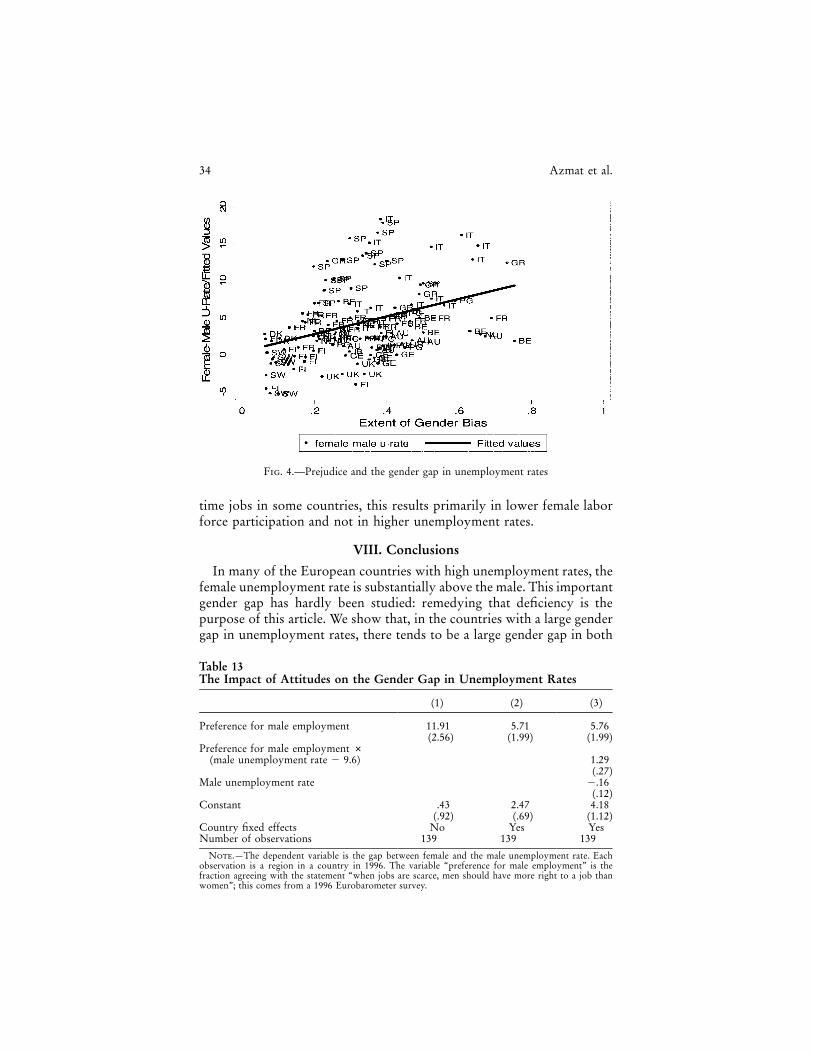
Another hypothesis is that differing attitudes toward male and femaleemployment may affect the gender gap in unemployment rates (seeAlgan and Cahuc [2004], for a similar idea that these attitudes are as-sociated with Catholicism). Any such link may come from the supplyside, with women in some countries being less concerned about gettingjobs, or from the demand side, with employers thinking that womenare less deserving of employment than men and making their hiringdecisions accordingly. We can get some idea how widespread discrim-inatory attitudes are from the 1996 Eurobarometer survey that asksrespondents whether they agree with the statement “When jobs arescarce, men should have more right to a job than women.” In all coun-tries men are more likely than women to think that women are lessdeserving of employment. But there are also substantial differencesacross countries with, crudely, the Nordic countries being less discrim-inatory and the Mediterranean countries more so. There are also dif-ferences across regions within countries, for example, southern Italy ismore discriminatory than northern Italy. Figure 4 plots the proportionagainst the gender differential in the unemployment rate at the regionallevel, marking the observations with a two-letter code for the countryto which they refer. There is a clear positive relationship between thetwo variables that the first column of table 13 shows is significantlydifferent from zero. One might think that all of this is driven by dif-ferences across countries but, while the inclusion of country fixed effectsreduces the size of the “attitudinal” variable, it remains significantlydifferent from zero.
However, a problem with this hypothesis is that the discriminatoryattitudes have been around for a long time (as can be confirmed by ex-amination of the 1973 and 1986 Eurobarometer surveys that contain sim-ilar questions) but, as figure 1 shows, large gender gaps in unemploymentrates are a relatively recent phenomenon. One way to reconcile this isthe following idea. When overall unemployment rates are high and thereare many applicants for most jobs, employers may be faced with a largenumber of job applicants who are more or less equivalent. In this situationthey are more or less free to indulge any slight discriminatory preferencesthey may have without suffering any loss in profits from doing so(Becker’s [1957] model of discrimination would predict this). In contrast,in tight labor markets, waiting for a male job applicant rather than hiringa female one may be a much more costly strategy. Hence, putting prej-udices into practice is easier when unemployment is high and there arelong queues for jobs, as has been the situation in most of the high-gap
30
Table 11Gender Differences in Flows from Unemployment to Employment
Country
Controls on Personal Characteristics and InteractionsControls on Personal Characteristics, Work History,
and Interactions
Coefficienton FemaleDummy
Coefficienton Female# Married
Coefficienton Female
# Kids0–12
Coefficienton Female
# Kids13–15
Coefficienton FemaleDummy
Coefficienton Female# Married
Coefficienton Female
# Kids0–12
Coefficienton Female
# Kids13–15
Spain �.24 �.066 �.195 .048 �.206 �.139 �.148 .062(.064)** (.101) (.115) (.162) (.064)** (.101) (.116) (.163)
Greece �.412 �.123 �.455 �.239 �.401 �.117 �.445 �.243(.089)** (.150) (.192)* (.230) (.089)** (.150) (.193)* (.230)
Italy �.34 �.059 �.17 .13 �.328 �.06 �.234 .081(.072)** (.147) (.174) (.216) (.073)** (.148) (.175) (.216)
France �.213 �.015 �.438 �.057 �.211 �.051 �.323 �.072(.130) (.199) (.222)* (.399) (.130) (.199) (.222) (.400)
Belgium �.349 �.367 .076 .022 �.396 �.325 .125 �.175(.190) (.289) (.343) (.627) (.191)* (.289) (.344) (.632)
Netherlands �.284 �.164 �.819 .742 �.31 �.158 �.708 .668(.165) (.223) (.251)** (.400) (.164) (.223) (.253)** (.404)
Germany �.051 �.111 �.238 �.128 �.053 �.111 �.241 �.125(.098) (.125) (.148) (.237) (.098) (.125) (.148) (.237)
31
Denmark �.521 .245 .336 .437 �.506 .245 .381 .385(.173)** (.246) (.305) (.629) (.174)** (.247) (.306) (.630)
Portugal �.241 .043 �.123 .191 �.227 .025 �.107 .19(.110)* (.148) (.170) (.248) (.111)* (.149) (.170) (.248)
Finland .04 �.159 �.058 .192 �.047 �.105 .064 .063(.194) (.256) (.267) (.446) (.196) (.258) (.269) (.448)
Sweden �.21 �.098 .194 .244 �.21 �.098 .194 .244(.138) (.269) (.267) (.399) (.138) (.269) (.267) (.399)
Austria .638 �.108 �.836 �1.164 .655 �.223 �.627 �.888(.214)** (.311) (.317)** (.575)* (.218)** (.312) (.320) (.587)
Ireland .103 .811 .311 .218 .121 .433 .353 .312(.131) (.255)** (.222) (.362) (.132) (.258) (.224) (.369)
United Kingdom .244 .473 .473 .076 .179 .437 .416 .074(.119)* (.193)* (.238)* (.363) (.121) (.195)* (.239) (.366)
Source.—Data are from ECHPS.Note.—The sample is all those who are unemployed at one interview and employed or unemployed subsequently. Model estimated is a log-log model where the dependent
variable takes the value one if the individual is still unemployed. Standard errors are in parentheses. The ILO main activity status is used for Sweden as the self-defined mainactivity status question, used for the other countries, is not asked.
* Denotes 5% significance level.** Denotes 1% significance level.
32 Azmat et al.
Fig. 3.—The gender gap in unemployment rates and in wages
countries in the 1980s and 1990s.20 We investigate this hypothesis in thethird column of table 13, including the interaction of the male unem-ployment rate with the attitudinal variable (as well as the level of the maleunemployment rate). The interaction term is positive and significantlydifferent from zero.
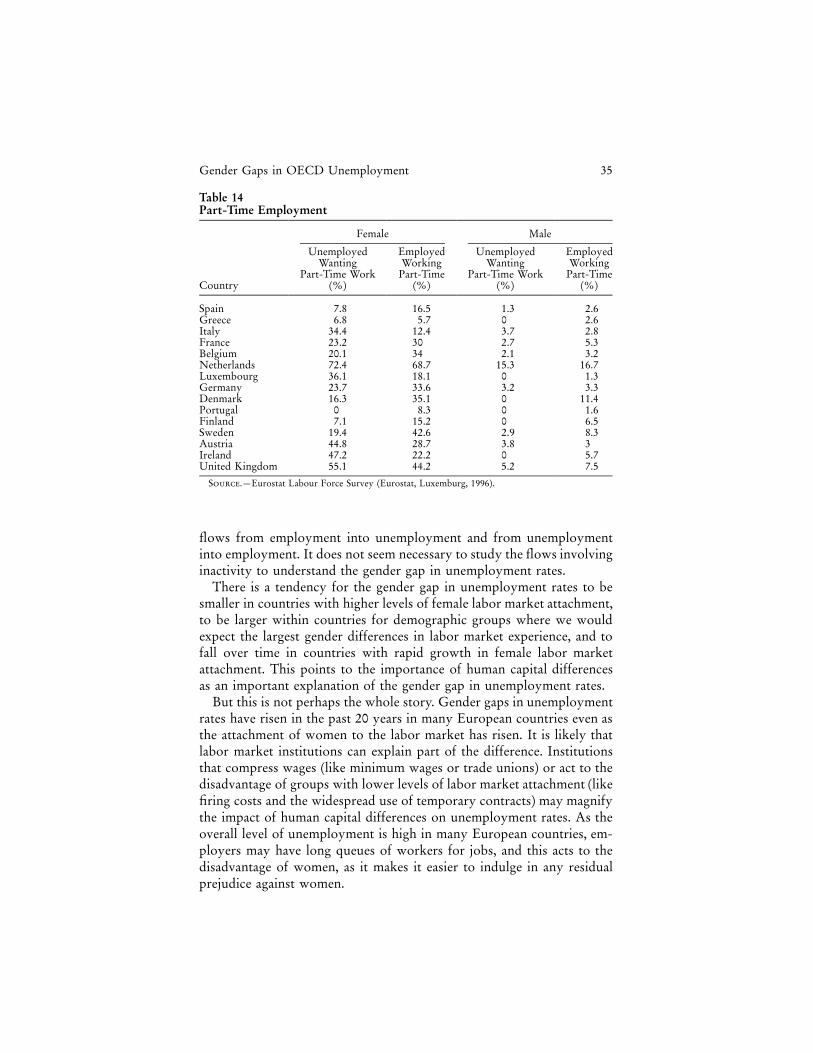
Finally, another possibility is that there is simply a mismatch betweenthe types of jobs wanted by the female unemployed and the jobs thatemployers are offering. Perhaps the most plausible form of mismatch isthat women may want part-time jobs but these are very rare in somecountries.
Table 14 investigates this hypothesis by presenting a comparison of thefraction of the unemployed who say they want part-time work and theshare of employment that is part-time. There is no evidence that there isa large disparity between the type of jobs that women want and the typeof jobs that are available. For example, in Spain the desire for part-timeemployment among the unemployed is lower than the incidence of part-time working in the employed population (see also Petrongolo [2004] forevidence that, in high-gap countries a higher proportion of women work-ing part-time report that they would prefer a full-time job which is alsoconsistent with this). It seems more likely that, if there is a deficit of part-
20 This does not mean that the exercise of such prejudice is costless: to the extentthat certain groups are protected from competition for jobs from other groups,the result is likely to be higher wage pressure and a higher natural rate of un-employment. This conclusion is usually derived in the context of prejudice againstthe long-term unemployed (see, e.g., the “ranking” model of Blanchard and Dia-mond [1994]), but the same principles apply to other sorts of prejudice.
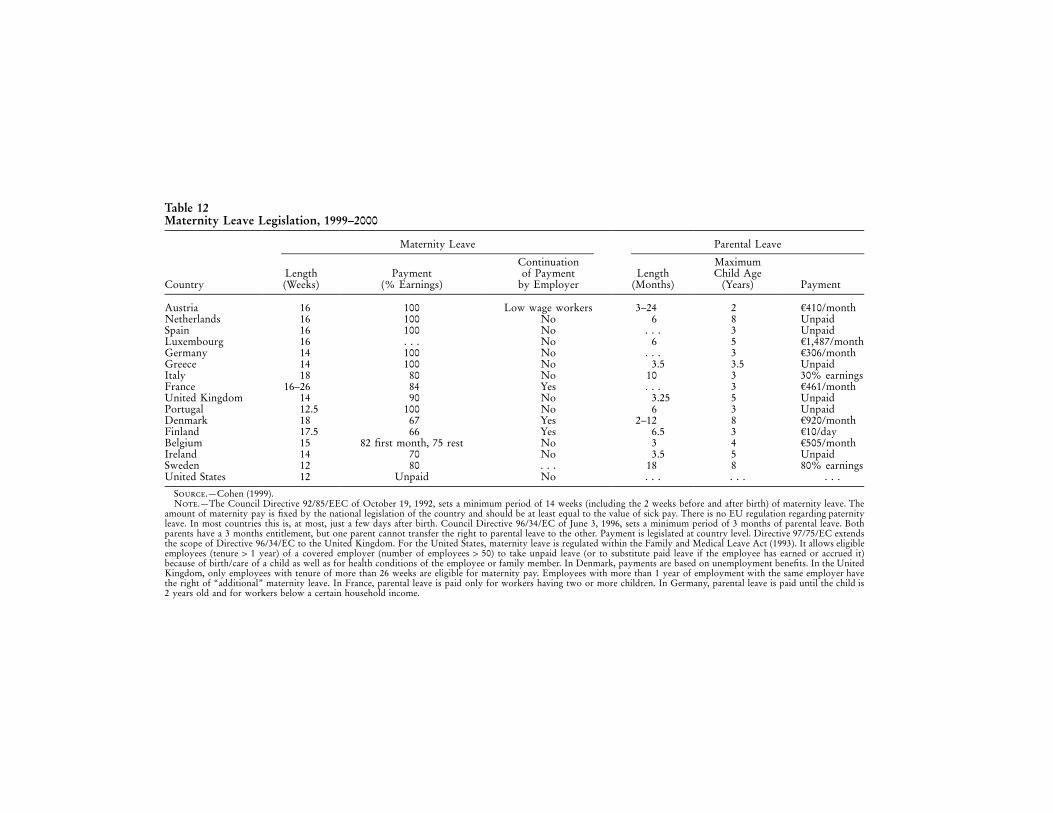
Table 12Maternity Leave Legislation, 1999–2000
Country
Maternity Leave Parental Leave
Length(Weeks)
Payment(% Earnings)
Continuationof Payment
by EmployerLength
(Months)
MaximumChild Age
(Years) Payment
Austria 16 100 Low wage workers 3–24 2 i410/monthNetherlands 16 100 No 6 8 UnpaidSpain 16 100 No . . . 3 UnpaidLuxembourg 16 . . . No 6 5 i1,487/monthGermany 14 100 No . . . 3 i306/monthGreece 14 100 No 3.5 3.5 UnpaidItaly 18 80 No 10 3 30% earningsFrance 16–26 84 Yes . . . 3 i461/monthUnited Kingdom 14 90 No 3.25 5 UnpaidPortugal 12.5 100 No 6 3 UnpaidDenmark 18 67 Yes 2–12 8 i920/monthFinland 17.5 66 Yes 6.5 3 i10/dayBelgium 15 82 first month, 75 rest No 3 4 i505/monthIreland 14 70 No 3.5 5 UnpaidSweden 12 80 . . . 18 8 80% earningsUnited States 12 Unpaid No . . . . . . . . .
Source.—Cohen (1999).Note.—The Council Directive 92/85/EEC of October 19, 1992, sets a minimum period of 14 weeks (including the 2 weeks before and after birth) of maternity leave. The
amount of maternity pay is fixed by the national legislation of the country and should be at least equal to the value of sick pay. There is no EU regulation regarding paternityleave. In most countries this is, at most, just a few days after birth. Council Directive 96/34/EC of June 3, 1996, sets a minimum period of 3 months of parental leave. Bothparents have a 3 months entitlement, but one parent cannot transfer the right to parental leave to the other. Payment is legislated at country level. Directive 97/75/EC extendsthe scope of Directive 96/34/EC to the United Kingdom. For the United States, maternity leave is regulated within the Family and Medical Leave Act (1993). It allows eligibleemployees (tenure 1 1 year) of a covered employer (number of employees 1 50) to take unpaid leave (or to substitute paid leave if the employee has earned or accrued it)because of birth/care of a child as well as for health conditions of the employee or family member. In Denmark, payments are based on unemployment benefits. In the UnitedKingdom, only employees with tenure of more than 26 weeks are eligible for maternity pay. Employees with more than 1 year of employment with the same employer havethe right of “additional” maternity leave. In France, parental leave is paid only for workers having two or more children. In Germany, parental leave is paid until the child is2 years old and for workers below a certain household income.
34 Azmat et al.
Fig. 4.—Prejudice and the gender gap in unemployment rates
Table 13The Impact of Attitudes on the Gender Gap in Unemployment Rates
(1) (2) (3)
Preference for male employment 11.91 5.71 5.76(2.56) (1.99) (1.99)
Preference for male employment #(male unemployment rate � 9.6) 1.29
(.27)Male unemployment rate �.16
(.12)Constant .43 2.47 4.18
(.92) (.69) (1.12)Country fixed effects No Yes YesNumber of observations 139 139 139
Note.—The dependent variable is the gap between female and the male unemployment rate. Eachobservation is a region in a country in 1996. The variable “preference for male employment” is thefraction agreeing with the statement “when jobs are scarce, men should have more right to a job thanwomen”; this comes from a 1996 Eurobarometer survey.
time jobs in some countries, this results primarily in lower female laborforce participation and not in higher unemployment rates.
VIII. Conclusions
In many of the European countries with high unemployment rates, thefemale unemployment rate is substantially above the male. This importantgender gap has hardly been studied: remedying that deficiency is thepurpose of this article. We show that, in the countries with a large gendergap in unemployment rates, there tends to be a large gender gap in both
Gender Gaps in OECD Unemployment 35
Table 14Part-Time Employment
Country
Female Male
UnemployedWanting
Part-Time Work(%)
EmployedWorking
Part-Time(%)
UnemployedWanting
Part-Time Work(%)
EmployedWorking
Part-Time(%)
Spain 7.8 16.5 1.3 2.6Greece 6.8 5.7 0 2.6Italy 34.4 12.4 3.7 2.8France 23.2 30 2.7 5.3Belgium 20.1 34 2.1 3.2Netherlands 72.4 68.7 15.3 16.7Luxembourg 36.1 18.1 0 1.3Germany 23.7 33.6 3.2 3.3Denmark 16.3 35.1 0 11.4Portugal 0 8.3 0 1.6Finland 7.1 15.2 0 6.5Sweden 19.4 42.6 2.9 8.3Austria 44.8 28.7 3.8 3Ireland 47.2 22.2 0 5.7United Kingdom 55.1 44.2 5.2 7.5
Source.—Eurostat Labour Force Survey (Eurostat, Luxemburg, 1996).
flows from employment into unemployment and from unemploymentinto employment. It does not seem necessary to study the flows involvinginactivity to understand the gender gap in unemployment rates.
There is a tendency for the gender gap in unemployment rates to besmaller in countries with higher levels of female labor market attachment,to be larger within countries for demographic groups where we wouldexpect the largest gender differences in labor market experience, and tofall over time in countries with rapid growth in female labor marketattachment. This points to the importance of human capital differencesas an important explanation of the gender gap in unemployment rates.
But this is not perhaps the whole story. Gender gaps in unemploymentrates have risen in the past 20 years in many European countries even asthe attachment of women to the labor market has risen. It is likely thatlabor market institutions can explain part of the difference. Institutionsthat compress wages (like minimum wages or trade unions) or act to thedisadvantage of groups with lower levels of labor market attachment (likefiring costs and the widespread use of temporary contracts) may magnifythe impact of human capital differences on unemployment rates. As theoverall level of unemployment is high in many European countries, em-ployers may have long queues of workers for jobs, and this acts to thedisadvantage of women, as it makes it easier to indulge in any residualprejudice against women.
36 Azmat et al.
References
Abowd, John M., and Arnold Zellner. 1985. Estimating gross labor forceflows. Journal of Business and Economic Statistics 3 (July): 254–83.
Abraham, Katherine G., and Robert Shimer. 2002. Changes in unem-ployment duration and labor-force attachment. In The Roaring Nine-ties: Can full employment be sustained? ed. Alan B. Krueger and RobertM. Solow. New York: Russell Sage Foundation.
Algan, Yann, and Pierre Cahuc. 2004. Job protection and family policies:The macho hypothesis. IZA Discussion Paper no. 1192, Bonn.
Altonji, Joseph G., and Rebecca M. Blank. 1999. Race and gender in thelabor market. In Handbook of labor economics, vol. 3C, ed. OrleyAshenfelter and David Card. Amsterdam: North-Holland.
Ashenfelter, Orley, and John Ham. 1979. Education, unemployment, andearnings. Journal of Political Economy 87 (October): S99–S116.
Azmat, Ghazala, Maia Guell, and Alan Manning. 2004. Gender gaps inunemployment rates in OECD countries. Discussion Paper no. 604,CEP, London School of Economics.
Barrett, Nancy S., and Richard D. Morgenstern. 1974. Why do blacksand women have high unemployment rates? Journal of Human Re-sources 9 (Fall): 452–64.
Becker, G. S. 1957. The economics of discrimination. Chicago: Universityof Chicago Press.
Bertola, Giuseppe, Francine D. Blau, and Lawrence Kahn. 2002. Labourmarket institutions and demographic employment patterns. DiscussionPaper no. 3448, CEPR, London.
Blanchard, Olivier J., and Peter Diamond. 1994. Ranking, unemploymentduration, and wages. Review of Economic Studies 61 (July): 417–34.
Blau, Francine D., and Lawrence M. Kahn. 2003. Understanding inter-national differences in the gender pay gap. Journal of Labor Economics21 (January): 106–44.
Cohen, B. 1999. Parental leave: Progress or pitfall? In Research and policyissues in Europe, ed. Peter Moss and Fred Deven. The Hague: Neth-erlands Interdisciplinary Demographic Institute Publications.
Flinn, Christopher J., and James J. Heckman. 1983. Are unemploymentand out of the labor force behaviorally distinct labor force states? Jour-nal of Labor Economics 1 (January): 28–42.
Johnson, Janet L. 1983. Sex differentials in unemployment rates: A casefor no concern. Journal of Political Economy 91 (June): 293–303.
Jones, Stephen R. G., and W. Craig Riddell. 1999. The measurement ofunemployment: An empirical approach. Econometrica 67 (January):147–61.
Nicoletti, Cheti, and Franco Peracchi. 2002. A cross-country comparison
Gender Gaps in OECD Unemployment 37
of survey participation in the ECHP. Discussion Paper no. 2002–32,ISER, University of Essex, Colchester.
Niemi, Beth. 1974. The female-male differential in unemployment rates.Industrial and Labor Relations Review 27 (April): 331–50.
Pellizzari, Michele. 2004. Do friends and relatives really help in gettinga good job? Discussion Paper no. 623, CEP, London School ofEconomics.
Peracchi, Franco. 2002. The European community household panel: Areview. Empirical Economics 27:63–90.
Petrongolo, Barbara. 2004. Gender segregation in employment contracts.Journal of the European Economic Association Papers and Proceedings2 (April/May): 331–45.
Polachek, Solomon. 2004. How the human capital model explains whythe gender wage gap narrowed. Discussion Paper no. 1102, IZA, Bonn.
Ruhm, Christopher J. 1998. The economic consequences of parental leavemandates: Lessons from Europe. Quarterly Journal of Economics 113(February): 285–317.
Weiss, Yoram, and Reuben Gronau. 1981. Expected interruptions in la-bour force participation and sex-related differences in earnings growth.Review of Economic Studies 48 (October): 607–19.


![Climate Finance Gaps and Challenges - UNESCAP 5. Climate finance gaps...Climate Finance Gaps and Challenges ... protection, disaster risk reduction) ... Lending interest rate [%] OECD](https://img.pdfslide.us/doc/110x75/5ab54ce47f8b9a156d8ca701/climate-finance-gaps-and-challenges-5-climate-finance-gapsclimate-finance.jpg)