Embed Size (px)
Citation preview

DI
SC
US
SI
ON
P
AP
ER
S
ER
IE
S
Forschungsinstitut zur Zukunft der ArbeitInstitute for the Study of Labor
Gender Gaps in PISA Test Scores:The Impact of Social Norms and theMother’s Transmission of Role Attitudes
IZA DP No. 6338
February 2012
Ainara González de San RománSara de la Rica Goiricelaya

Gender Gaps in PISA Test Scores:
The Impact of Social Norms and the Mother’s Transmission of Role Attitudes
Ainara González de San Román UPV-EHU
Sara de la Rica Goiricelaya
UPV-EHU, FEDEA and IZA
Discussion Paper No. 6338 February 2012
IZA
P.O. Box 7240 53072 Bonn
Germany
Phone: +49-228-3894-0 Fax: +49-228-3894-180
E-mail: [email protected]
Any opinions expressed here are those of the author(s) and not those of IZA. Research published in this series may include views on policy, but the institute itself takes no institutional policy positions. The Institute for the Study of Labor (IZA) in Bonn is a local and virtual international research center and a place of communication between science, politics and business. IZA is an independent nonprofit organization supported by Deutsche Post Foundation. The center is associated with the University of Bonn and offers a stimulating research environment through its international network, workshops and conferences, data service, project support, research visits and doctoral program. IZA engages in (i) original and internationally competitive research in all fields of labor economics, (ii) development of policy concepts, and (iii) dissemination of research results and concepts to the interested public. IZA Discussion Papers often represent preliminary work and are circulated to encourage discussion. Citation of such a paper should account for its provisional character. A revised version may be available directly from the author.

IZA Discussion Paper No. 6338 February 2012
ABSTRACT
Gender Gaps in PISA Test Scores: The Impact of Social Norms and the Mother’s Transmission of Role Attitudes*
The existence of gender gaps in test scores has been documented in the relevant literature for a wide range of countries. In particular, the Programme for International Student Assessment (PISA) conducted by the OECD over the past ten years reveals that on average female students underperform (outperform) males in maths (reading) test scores in most of the countries that take part in the evaluation programme. We find that differences in culture and social norms across countries and across regions within the same country are crucial determinants in understanding gender differences in PISA 2009 test scores: girls perform relatively better in both maths and reading in societies where gender equality is enhanced, and the effect varies over the distribution of scores. In addition, we find substantial evidence for the intergenerational transmission of gender role attitudes, especially from mothers to daughters, as the performance of girls – not that of boys, is better in families where the mother works outside home. JEL Classification: C14, C33, I21, I24, J16 Keywords: PISA, test scores, achievement, gender differences, culture, role attitudes,
intergenerational transmission Corresponding author: Sara de la Rica Goiricelaya Departamento de Fundamentos del Análisis Económico II Universidad del País Vasco Lehendakari Aguirre 83 48015 Bilbao Spain E-mail: [email protected]
* Financial support from the Spanish Ministry of Science and Innovation under the project BES-2007-14507, and ECON2009-10818 is gratefully acknowledged.

2
1. Introduction
A great deal of attention has recently been paid to gender differences in test scores
(see Goldin 1994, and more recent, Hausmann et al. 2008) as indicators of gender
inequality at early stages of life. A large body of research has focused on the study of
the determinants of these gender differences. In this vein, there are basically two distinct
schools of thought: those who stress that they are mainly the result of biological
differences (nature) and those who stress the importance of cultural and social gender
inequalities (nurture). Supporters of the first school argue that innate differences in
spatial ability, higher order thinking, or brain development account for most of the gap
in achievement. Research in this domain includes work on differences in brain
composition (Cahill 2005; Gallagher & Kaufman 2005), differences in strategy
(Fennema & Carpenter 1998; Kucian et. al 2005), and differences in spatial ability
(Lawton & Hatcher 2005).
The hypothesis that nurture is the main determinant of gender differences in
scholastic achievement is based on the idea that gender differences are a result of social
gender stratification. This idea was first proposed by Baker et al. in 1993. They
hypothesised that the higher scores obtained in math tests by male students compared to
their female counterparts reflected gender inequalities in the educational and economic
opportunities available in a given culture. This proposition has obtained a great deal of
support from the empirical perspective. For instance, Riegle-Crumb (2005), using cross-
national data from the Third International Mathematics and Science Study (TIMSS),
supports this hypothesis for the US. The relationship between social norms and the
gender gap in test scores has also been documented across OECD countries. Guiso,
Monte, Sapienza & Zingales (2008) make use of the 2003 PISA survey, construct
several measures of the degree of gender equality of a country – e.g. the Gender Gap
Index (World Economic Forum), and find a higher mean math performance for females
in countries with more gender-equal cultures.
Alongside the theoretical and empirical interest in the study of the determinants of
gender differences in scholastic achievement, another body of research has focused on
the economic and social consequences of gender inequality in education. Several
authors in this field highlight that inequality in education can negatively impact
macroeconomic variables such as economic growth (Dollar & Gatti 1999; Klassen
2002) or fertility (Basu 2002). Policy measures directed at enhancing female education
not only help increase income and growth, as a result of the increase in human capital,
but also lead to additional positive intergenerational transfers through the positive
influence of mothers on the education and health of their children (Schultz 2002;
Doepke & Tertilt, 2009). For instance, the presence of a working mother has been found
to influence strongly not only children’s behaviour but also the gender role attitudes of
adolescents (see Burt & Scott, 2002).
3
The transmission of gender role attitudes across generations has been the focus of a
large proportion of recent research. Farré & Vella (2007) test for such intergenerational
transmission and find that mothers with less traditional views about the role of women
in society are more likely to have working daughters. A related study by Fernández et
al. (2004) highlights the increasing number of men growing up in families with working
mothers as an important factor in explaining the increase in women’s involvement in the
labour force. Moreover, changes in gender role attitudes over time appear to map very
well with changes in female labour force participation across OECD countries (Fortin,
2005). However, the role of culture and its implications for economic behaviour across
generations is relatively unexplored in empirical studies on scholastic achievement. Our
paper seeks to help fill this gap.
More specifically, this paper gives empirical support to both the social gender
stratification theory and the intergenerational transmission of gender roles. With respect
to the former, we confirm and extend the social gender stratification hypothesis (i) by
updating previous results to the latest available PISA survey (2009) and adding new
gender equality measures to those already used in the relevant literature; and (ii) by
extending the analysis to relate social norms to gender differences across regions within
the same country, which constitutes a more homogeneous institutional setting. We make
use of regional variation in Spain where the education system is decentralised and
decisions concerning the management and organisation of education are therefore
devolved to the different regional governments. Hence regional differences in the
gender gap may emerge as a result of distinct views of social gender stratification2. In
addition, Spain is one of the few countries where regional disaggregation allows
analysis across regions with the PISA database.
We contribute to the analysis of intergenerational transmission of gender roles by
investigating whether gender role attitudes, and in particular the component related to
the mother’s labour market participation, can explain the subsequent relative
underperformance of girls with respect to boys in maths skills. Taking as given the
strong evidence of Vella & Farre (2007) we argue that culture attitudes towards gender
roles are transmitted from generation to generation and that this cultural transmission
has important implications for the younger cohorts.
Our results show that in more gender-equal societies – be they countries or regions
within a country, – girls perform better in both subjects reducing the gap in maths and
increasing their advantage in reading. In addition, gender role attitudes within the family
environment, measured by whether mothers participate in the labour market, is found to
affect girls’ performance positively. The effect is indeed quite similar for girls at both
2 Although the gender gap across regions has not been explicitly accounted for before, some related papers have
attempted to explain regional differences in test scores. For instance, Ciccone and García-Fontes (2008) compare the
education systems in Catalonia and the rest of Spain through the 2006 PISA scores. Regional studies in this area for
other European countries include the paper by Bratti et al. (2007) which analyses the differences in PISA 2003 results
between the three Italian macro areas.

4
tails of the test score distributions. This effect is stronger in countries with low FLFP,
where girls with working mothers have less of a disadvantage in maths but there is no
effect on reading with respect to boys, which points to intergenerational transmission of
gender role attitudes from mothers to daughters. Such transmission is stronger among
Spanish families and in that case it is mainly driven by the most highly-educated
participating mothers.
The remainder of the paper is organised as follows. Section 2 addresses the relevant
data issues and provides a brief summary of the differences in children’s scholastic
achievement across countries. Section 3 focuses on how girls compare to boys in
mathematics and reading skills, provides both descriptive and parametric evidence on
culture and social norms across countries and analyses the implications for the gender
differences observed in performance. Section 4 further investigates the extent to which
gender role attitudes within the family, measured by the participation of mothers and
fathers in the labour market, may be transmitted across generations and provides some
evidence on the mechanisms that could be behind such intergenerational transmission.
Section 5 focus on a more homogeneous institutional framework by restricting the
analysis to a single country: Spain. It carries out an analysis similar to that of the two
previous sections making use of the regional disaggregation of Spain in the PISA 2009
data set. Section 6 concludes with a summary of our findings.
2. Data
PISA is a rich data set at student and school levels with information on test scores
for 15-year-old students in OECD and partner countries. The survey covers results in
three fields: maths, reading and science. Background questionnaires are completed by
students and school principals which help by providing detailed information on
children, family and school characteristics, some of which are used as control variables
in our individual estimation exercise. The PISA sample is stratified at two stages. First,
schools are randomly selected and second, students at each school are randomly
assigned to carry out the test in all three subjects. Test scores are scaled to have a mean
of 500 and a standard deviation of 100 in the OECD student population. PISA assigns a
probability distribution to the response pattern in each test. These values are called
plausible values because they represent alternative estimates of students’ ability that
could have been obtained. We use plausible values in all analyses that involve test
scores. In particular, estimation procedures involve the calculation of the required
statistic five times, one for each set of plausible values. The final estimate is the
arithmetic average of the five estimates3.
3 This strategy follows the specific recommendations produced by the OECD for the use of PISA data. However, we
conducted the same analysis using the first plausible value for any estimation rather than the arithmetic average of all
five. Although the magnitude of the effect varies slightly (more or less depending on the estimation), the results are
qualitatively the same in all cases.

5
The PISA 2009 data set contains 475,460 students attending year seven or above at
17,093 schools in 64 countries, 34 of which belong to the OECD. Liechtenstein is
dropped from the data set because it provides only 329 observations, which makes any
calculation at the tails of the distribution problematic. We end up with 475,131 students
at 17,081 schools in 63 countries4.
Overall, the range of performances from country to country is wide, representing
large differences in how well students in different countries can read or think
mathematically. The mean maths score is 465.35 across the 63 countries in our sample
and 499.70 across OECD countries. The partner countries Shanghai-China and
Singapore show mean maths scores that are much higher than those of any other
country that participated in PISA 2009. Shanghai-China is furthest ahead, with students
there having scores more than 35 points higher, on average, than those in any other
country (around 100 points above the OECD average and more than 130 points above
the overall average). Korea is the top-performing OECD country (46.3 points above the
OECD average), closely followed by Finland, which was the PISA winner in 2003.
Australia, Belgium, Canada, Chinese-Taipei, Denmark, Estonia, Germany, Hong Kong,
Iceland, Japan, Netherlands, New Zealand, Slovenia and Switzerland all score
significantly above the OECD average in maths. On the other side, the worst performing
countries (more than 100 points below the OECD average) are Albania, Argentina,
Brazil, Colombia, Indonesia, Jordan, Kyrgyzstan, Panama, Peru, Qatar and Tunisia.
Within the OECD Chile and Mexico are better placed but still show a significant
difference of close to 70 points. Spanish students score on average 483.71 at the maths
competency, similar to the average for the United States and neighbouring European
countries such as Italy, Portugal, Ireland, Latvia and Luxembourg. Austria, Czech
Republic, France, Norway, Poland, Sweden and the UK show no significant differences
from the OECD average.
The average score for reading skills is 457.16 across the sample of 63 countries and
489.81 across OECD countries. Shanghai-China also shows the highest average reading
performance (65 and nearly 100 points above the OECD and the overall averages
respectively), closely followed by Korea and Finland. Australia, Canada, Hong Kong,
Japan, New Zealand and Singapore score at least 20 points above the OECD average.
Belgium, Estonia, Iceland, Netherlands, Norway, Poland and Switzerland also perform
significantly better than the OECD average but with smaller differences. The lowest
performing countries at reading are the same to those reported for maths, with Colombia
being the worst OECD country with a difference of close to 100 points. Spain is around
10 points below the OECD average, a similar significant difference to that of Greece
and Italy. As before, Sweden, France and the UK show average reading scores that are
not significantly different from the OECD average.
4 For the sake of comparability with the results of Guiso et al. (2008) in the cross-country analysis, we use both the
entire sample of countries available for 2009, and the set of countries used in their paper (the 40 countries that took
part in the PISA 2003 survey).

6
3. Culture and Gender Differences in Test Scores across Countries
This section focuses on international gender differences in test scores. We compute
differences in maths and reading scores between girls and boys for each country by
running a regression of the maths and reading scores separately on a constant and a
gender indicator (which is 1 if the student is female), where each observation is
weighted by the student’s final weight. Figure 1 shows a World Map with countries
grouped by colours depending on the range in which their average maths gender gap lies
(see legend). In most countries boys have better scores in maths than girls, and the
differences are statistically significant for 44 out of the 63 countries. In the remaining
countries, there is no statistical gender difference in math skills5. There are isolated
cases - coloured green in the figure - in which girls outperform boys (e.g. Albania,
Lithuania, Trinidad & Tobago, Qatar and Kyrgyzstan).
Figure 1. Maths Gender Gap across PISA 2009 participating countries -World Map
Figure 2 depicts gender differences in maths and reading scores for a set of selected
countries. Countries are ranked in ascending order by their gender gap in maths scores.
On average girls’ maths scores are 8.64 lower than those of boys (10.75 lower across
Guiso countries and 12 lower across OECD countries) but the results vary considerably
from country to country. The biggest difference is found in Colombia (-33.32) whereas
in Sweden girls outperform boys (by 1.08). Spain ranks 7th out of 63 countries in the
average gap in maths with -19.32 points. In neighbouring countries such as Italy, France
and Portugal the difference in maths between girls and boys is smaller than in Spain.
5 Here we find top-performing countries such as Shangai-China, or Finland, Korea, and Sweden among OECD
participants, but also low performers such us Panama, Jordan or Indonesia, what makes it difficult to establish a
relationship between average performance and gender differences in achievement.

7
Figure 2. Gender difference in test performance for a set of selected countries
Figure 2 also reveals that the gender gap is reversed in reading6. Girls score on
average 40.54 higher than boys in reading (around 39 points across Guiso countries and
OECD countries), and the gap is positive and statistically significant for all countries,
although there are major quantitative differences – for instance, in Colombia the
difference is 9.46 and in Finland it is 55.53. The advantage in reading of Spanish girls is
below average (28.66) and is similar to the corresponding gap for the United Kingdom
and the United States. A comparison of this figure with a similar one constructed by
Guiso et al. (2008) for the PISA 2003 survey reveals major changes in the gender gaps
in some countries in this six-years period. For example, the United Kingdom has shifted
from a negligible gender difference in maths in 2003 to one of the biggest gaps in 2009
(similar patterns are found for the United States and Belgium). The opposite has
happened in the emerging economy of South Korea. Overall, the average gender gap in
maths has remained stable in this six-year period but the average gap in reading has
widened (from 32.70 to 38.78). In some countries the reason is that girls’ reading
performance has improved considerably; but in others, such as France and Sweden, the
main reason is a decline in performance among boys.
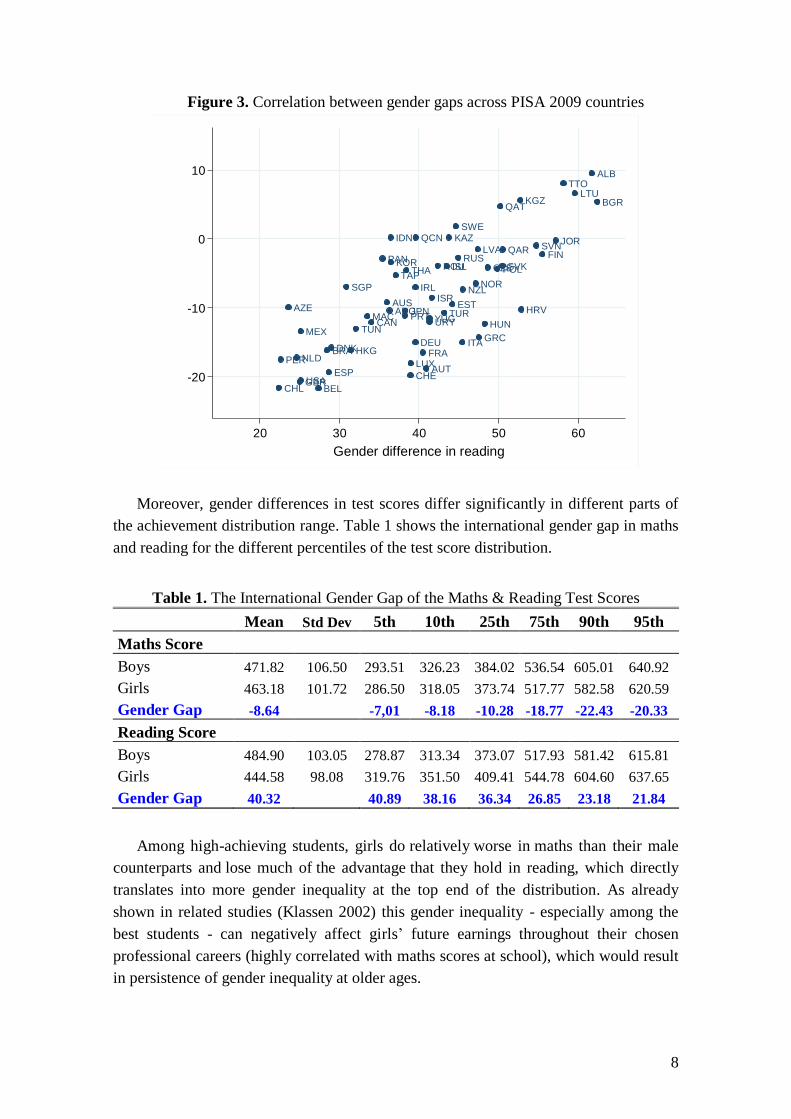
Figure 3 shows the correlation between the average gender gaps in mathematics and
reading across countries (with Colombia excluded as an outlier), which is 0.7764. This
means that where girls have the biggest advantage in reading over boys they also tend to
have the smallest disadvantage in maths. The correlation here is around 18 percentage
points higher than that shown by Guiso et al. for 2003.
6 This is consistent with prior literature, both for the U.S. (Baker & Jones 1993; Fuchs & Woessmann, 2008; Fryer &
Levitt 2009) and for most of the PISA participating countries (Guiso et al. 2008).
8
Figure 3. Correlation between gender gaps across PISA 2009 countries
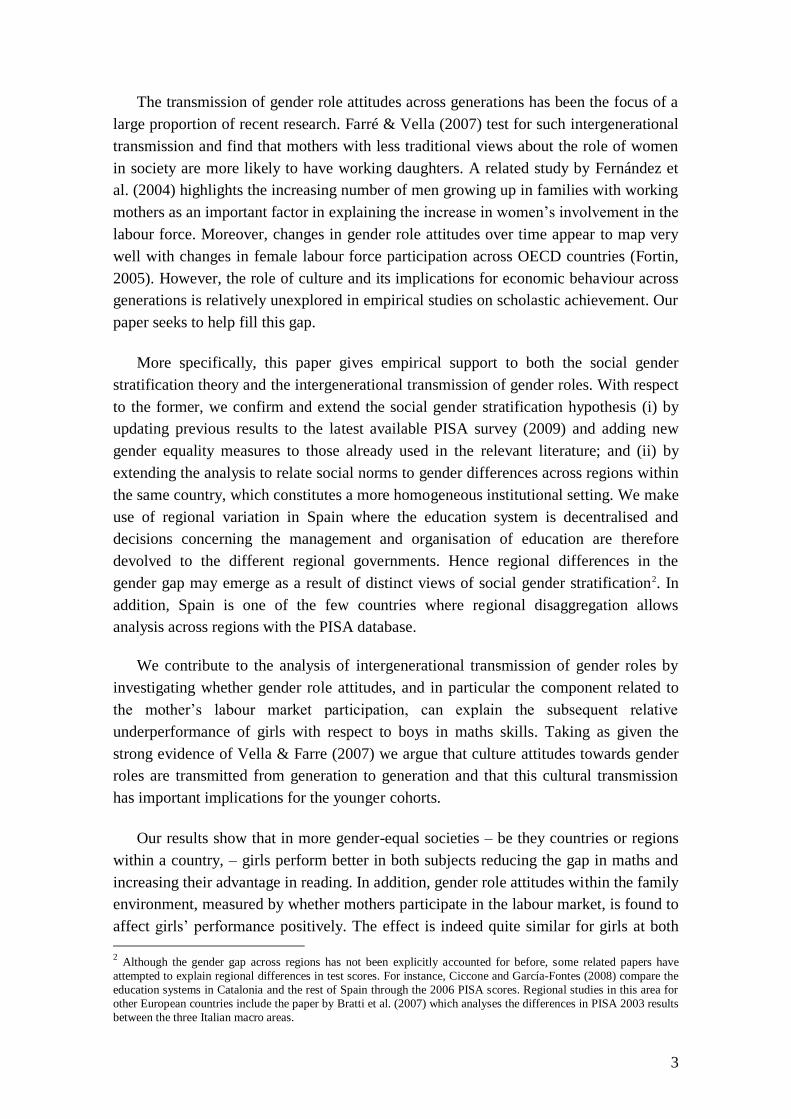
Moreover, gender differences in test scores differ significantly in different parts of
the achievement distribution range. Table 1 shows the international gender gap in maths
and reading for the different percentiles of the test score distribution.
Table 1. The International Gender Gap of the Maths & Reading Test Scores
Mean Std Dev 5th 10th 25th 75th 90th 95th
Maths Score
Boys 471.82 106.50 293.51 326.23 384.02 536.54 605.01 640.92
Girls 463.18 101.72 286.50 318.05 373.74 517.77 582.58 620.59
Gender Gap -8.64 -7,01 -8.18 -10.28 -18.77 -22.43 -20.33
Reading Score
Boys 484.90 103.05 278.87 313.34 373.07 517.93 581.42 615.81
Girls 444.58 98.08 319.76 351.50 409.41 544.78 604.60 637.65
Gender Gap 40.32 40.89 38.16 36.34 26.85 23.18 21.84
Among high-achieving students, girls do relatively worse in maths than their male
counterparts and lose much of the advantage that they hold in reading, which directly
translates into more gender inequality at the top end of the distribution. As already
shown in related studies (Klassen 2002) this gender inequality - especially among the
best students - can negatively affect girls’ future earnings throughout their chosen
professional careers (highly correlated with maths scores at school), which would result
in persistence of gender inequality at older ages.
ALB
AZE ARGAUS
AUT
BEL
BRA
BGR
CAN
CHL
QCN
TAP
HRV
CZE
DNK
EST
FIN
FRADEU
GRC
HKG
HUN
ISL
IDN
IRLISR
ITA
JPN
KAZ JOR
KOR
KGZ
LVA
LTU
LUX
MAC
MEX
NLD
NZLNOR
PAN
PER
POL
PRT
QAT
ROURUS
SGP
SVK
SVN
ESP
SWE
CHE
THA
TTO
QAR
TUN
TUR
GBRUSA
URYYUG
-20
-10
0
10
Ge
nd
er
diffe
rence
in m
ath
20 30 40 50 60
Gender difference in reading

9
3.1. Measures of Gender-equal Societies
For the sake of comparability, we first construct for 2009 similar gender-equality
measures to those already used in the literature (Fortin 2005; Vella & Farré 2007; Guiso
et al. 2008) summarizing the gender role attitudes of countries towards women. The
countries for which information is available differ depending on the measure. Higher
values in any of these measures indicate a better position of women in society.
(1) The Gender Gap Index (GGI), or women’s emancipation index, is taken from
the 2009 Global Gender Gap report prepared by the World Economic Forum
and synthesises the position of women in any given country by taking into
account economic opportunities, economic participation, educational attainment,
health and well-being.
(2) The Political Empowerment Index from the same source, measures women’s
political participation and is based on three components: (i) the ratio of women
to men with seats in parliament; (ii) the ratio of women to men at ministerial
level; (iii) the ratio of the number of years with a woman as head of state to the
years with a man.
(3) The Average World Value Survey (WVS) Indicator, which is constructed by
averaging the level of disagreement with a series of statements on the role of
women in society, such us “When jobs are scarce, men should have more right
to a job than a women”- taken from all waves of the World Value Survey.
We add another set of measures which are more related to how women and men use
their time at home and with regard to the decision to participate in the labor market.
Both can be also be considered as proxies for the gender culture of a country and larger
values also point to a better position of women in society.
(4) The Female Labour Force Participation Rate 15+ (FLFP) ) taken from the
International Labour Organization (ILO) website, represents the proportion of
the female population aged 15 and older who are active (either working or
searching for a job) in the labour market in 2009.
(5) The Female Labour Force Participation Rate 35-54 (FLFP 35-54): Like
measure (4) this is taken from ILO. It is defined as the proportion of the female
population aged 35 to 54 years who actively participate in the labour market in
2009. We use this measure since it represents a particular cohort of women
which coincides with the age interval of the mothers of our PISA students.
(6) The Gender Housework Ratio from the Harmonized Time Use Survey (2003)
which is defined as the ratio of time devoted to housework (men/women).7
Higher values of these measures also indicate a better position of women in society.
7 The Gender Housework Ratio is not available for 2009. However, the persistence over time of women’s attitudes as
homemakers documented in previous studies (See Fortin 2005) justifies its inclusion for 2003.

10
Sample statistics for all measures for both the full set of available countries and the
same set of countries as in Guiso et al. (2008) are reported below.
Table 2. Summary statistics of the different measures for gender-equal societies
All Countries
Countries in Guiso et al.
(2008)
Average Std Dev Obs. Average Std Dev Obs.
Women’s emancipation 0.703 0.052 59 0.713 0.058 37
Political Empowerment 0.199 0.142 59 0.239 0.157 37
Avg WVS Indicator 2.715 0.186 32 2.715 0.186 32
FLFP 15+ 0.519 0.095 62 0.527 0.096 40
FLFP 35-54 0.729 0.149 62 0.748 0.141 40
Gender Housework ratio 0.529 0.148 22 0.521 0.163 18
There is little difference between the statistics from the two different samples. The
sample with the smaller set of countries (mainly the most developed ones) has slightly
higher averages for the different measures and similar standard deviations. Table 3
shows the correlation between the different measures of gender equality for the full set
of available countries in 2009 (there are no significant differences if the Guiso et al.
sample of countries is used instead). All correlations are positive and significant.
Table 3. Correlation between gender-equality measures across countries
GGI Political Avg. FLFP FLFP Housework
Emp. WVS 15+ 35-54 ratio
GGI 1
Political Emp. 0.8729 1
Avg WVS Index 0.7454 0.6879 1
FLFP 15+ 0.7166 0.4977 0.6251 1
FLFP 35-54 0.6885 0.3829 0.4120 0.7736 1
Housework ratio 0.8457 0.7009 0.6993 0.8308 0.8528 1
Several interesting features emerge from Table 3. First, the close correlations of the
Gender Housework ratio with the other measures already used in the relevant literature
suggest that the former can also be used as a proxy for gender equality. Second, the
close correlation of this measure with female labour force participation measures
indicates that the more collaborative men are at home the easier it is for women to join
the labour market. Finally, the positive correlation of the Average WVS indicator with
the economic participation measures is in line with previous studies in the relevant
literature that find a clear and positive association between gender role attitudes and
female labour force participation. See Fortin (2005) and Vella & Farré (2007).

11
3.2. Gender equality Measures and Gender Differences in Test Scores
We next analyse the extent to which these measures affect the gender differences
observed in test scores in both maths and reading following two different approaches.
First, we carry out a cross-country analysis where the unit of observation is the country.
And secondly, to avoid any potential underlying unobserved heterogeneity problem, we
estimate the impact of these measures directly in our sample of 2009 PISA students, by
using the gender equality measures described above interacted with a female indicator.
A) Cross-country analysis
To assess the correlation between measures of gender equality and gender
differences in test scores we run OLS regressions of the dependent variable - the gender
gap (maths and reading, separately) – on each measure of gender equality plus a
constant and the 2009 log GDP per capita8. For the sake of comparability with Guiso et
al. (2008) we restrict the sample to the 40 countries for which data were also available
in 20039. The estimation results are reported in Tables 4A-4B.
Table 4A. OLS estimation – Dep. Variable: Gender Gap in Maths Test Scores
GGI 90.13***
(19.54)
Political 24.03*** Empowerm. (6.74)
Avg. WVS 17.13**
indicator (7.01)
FLFP 15+ 42.32***
(7.98)
FLFP 35-54 25.24***
(5.48) Housework 33.41***
ratio (10.71)
Log GDP -9.30*** -7.91*** -5.19* -6.77*** -6.73*** -13.36*** p.cap, 2009 (1.84) (1.79) (2.59) (1.53) (1.72) (3.57) Countries 37 37 32 40 40 18
R2 0.462 0.325 0.189 0.379 0.311 0.279
Note: Robust standard errors in parentheses; *** p<0.01, ** p<0.05, * p<0.1. Each column presents the coefficients of a separate regression.
We find a positive correlation between the gender gap in math scores and each of
the gender equality measures (Table 4A). Therefore, the first conclusion is that the
results in Guiso et al. (2008) are also found for the 2009 PISA wave. Second, similar
results are observed from the new measures that we have incorporated, i.e. the
housework ratio and FLFP aged 35-54.
8 In line with the importance of controlling for income in the cross-country analysis already pointed out in related
studies, we take the 2009 real GDP per capita deflated with Laspeyres price index from the Penn World Table 7.0. 9 When the cross-country analysis is conducted with the full sample of available countries, correlations are still
positive but lower and in some cases not statistically significant.
12
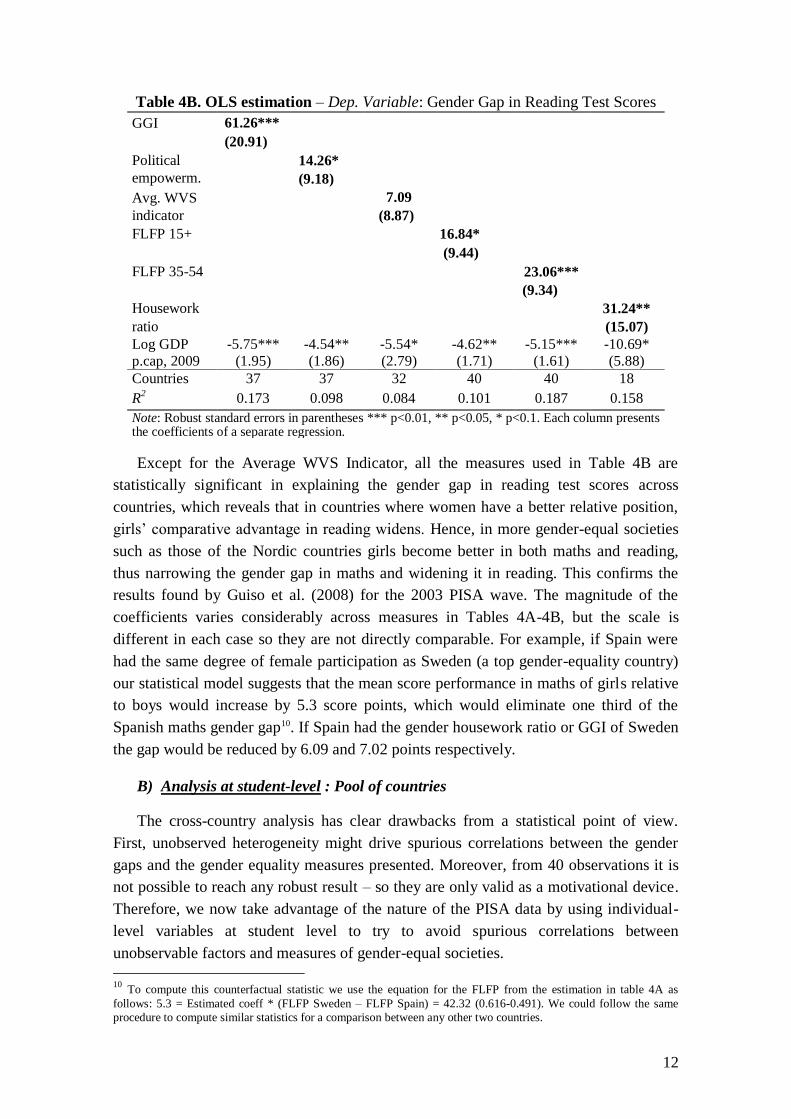
Table 4B. OLS estimation – Dep. Variable: Gender Gap in Reading Test Scores
GGI 61.26***
(20.91)
Political 14.26* empowerm. (9.18)
Avg. WVS 7.09
indicator (8.87)
FLFP 15+ 16.84*
(9.44)
FLFP 35-54 23.06***
(9.34)
Housework 31.24**
ratio (15.07) Log GDP -5.75*** -4.54** -5.54* -4.62** -5.15*** -10.69* p.cap, 2009 (1.95) (1.86) (2.79) (1.71) (1.61) (5.88) Countries 37 37 32 40 40 18
R2 0.173 0.098 0.084 0.101 0.187 0.158
Note: Robust standard errors in parentheses *** p<0.01, ** p<0.05, * p<0.1. Each column presents the coefficients of a separate regression. Except for the Average WVS Indicator, all the measures used in Table 4B are
statistically significant in explaining the gender gap in reading test scores across
countries, which reveals that in countries where women have a better relative position,
girls’ comparative advantage in reading widens. Hence, in more gender-equal societies
such as those of the Nordic countries girls become better in both maths and reading,
thus narrowing the gender gap in maths and widening it in reading. This confirms the
results found by Guiso et al. (2008) for the 2003 PISA wave. The magnitude of the
coefficients varies considerably across measures in Tables 4A-4B, but the scale is
different in each case so they are not directly comparable. For example, if Spain were
had the same degree of female participation as Sweden (a top gender-equality country)
our statistical model suggests that the mean score performance in maths of girls relative
to boys would increase by 5.3 score points, which would eliminate one third of the
Spanish maths gender gap10. If Spain had the gender housework ratio or GGI of Sweden
the gap would be reduced by 6.09 and 7.02 points respectively.
B) Analysis at student-level : Pool of countries The cross-country analysis has clear drawbacks from a statistical point of view.
First, unobserved heterogeneity might drive spurious correlations between the gender
gaps and the gender equality measures presented. Moreover, from 40 observations it is
not possible to reach any robust result – so they are only valid as a motivational device.
Therefore, we now take advantage of the nature of the PISA data by using individual-
level variables at student level to try to avoid spurious correlations between
unobservable factors and measures of gender-equal societies.
10
To compute this counterfactual statistic we use the equation for the FLFP from the estimation in table 4A as
follows: 5.3 = Estimated coeff * (FLFP Sweden – FLFP Spain) = 42.32 (0.616-0.491). We could follow the same
procedure to compute similar statistics for a comparison between any other two countries.

13
We estimate the individual test scores for all students in the PISA 2009 sample on a
set of demographic, family and school variables11 as well as an indicator for Female and
interactions between gender equality measures (at country level) and Female. We also
include country fixed effects and an interaction term between Female and Log GDP per
capita (2009) to ensure that any improvement in maths or reading scores is related not
just to economic development but to improvements in the role of women in society. A
positive and significant coefficient for the interaction term between Female and the
gender equality measure indicates that the more gender equal the society is, the higher
the score for females is. Table 5 presents the estimation results for the whole set of
countries in PISA 2009 for maths and reading separately. Estimations are drawn up at
average level and for the 25th
and 75th
quantiles to see whether societal gender equality
indicators affect students differently at different points of the test score distribution
range. Each cell in the table presents the coefficient for the interaction between Female
and the corresponding gender equality measure from a different estimation.
Table 5. Culture – The impact of Gender-equality measures on Girls’ Test Scores
Average 25th Quantile 75th Quantile
Maths Reading Maths Reading Maths Reading
Female*GGI 53.45*** 47.75*** 48.45*** 60.07*** 57.38*** 38.95***
(12.72) (12.02) (13.79) (13.99) (13.22) (13.94)
Female*Political 14.78*** 12.83*** 14.15** 19.26*** 25.57*** 16.93***
empowerment (5.53) (5.53) (7.54) (6.86) (6.21) (6.29)
Female*Avg -1.16 -3.42 -8.74 -7.19 7.07 4.73
WVS indicator (4.85) (4.96) (5.77) (6.43) (5.77) (5.71)
Female*FLFP15+ 38.13*** 13.86*** 36.98*** 17.51*** 35.26*** 7.22
(5.14) (4.86) (6.54) (5.56) (6.31) (6.47)
Female*FLFP 35-54 35.41*** 33.32*** 34.38*** 35.57*** 32.73*** 24.72***
(3.65) (3.37) (4.60) (3.89) (4.26) (4.23)
Female*House- 32.92*** 34.13*** 27.49*** 38.55*** 37.65*** 29.87***
work ratio (2,94) (2.91) (3.87) (3.88) (3.72) (3.46)
Notes: Robust standard errors in parentheses *** p<0.01, ** p<0.05, * p<0.1. Individual level controls,
school variables and country fixed effects are included. Iceland is taken as the country of reference. An
interaction term of Female with the log GDP per capita of 2009 is also included. Students’ weights used
in the estimations. Obs (R2) range from 174,755 (0.29) to 361,083 (0.45) depending on the measure.
The first thing that stands out from a quick glance at Table 5 is that most
interactions between Female and gender equality measures are positive and significant
for both subject areas, at the average and also at the different tails of the distribution,
11
Individual level controls include dummies for any students who are in a grade different from the modal one in the
country, the immigration status of the child, an indicator for nuclear families (i.e. living with both parents), parental
education level (university), parental occupational status and cultural possessions at home. School level controls
include school type (private), percentage of girls and student-teacher ratio. Adding or removing controls changes
neither the sign nor the significance of the estimated coefficients of interest.

14
except for the average WVS indicator12. This confirms that girls perform better in both
maths and reading in more gender-equal societies and that in most cases the effect is
greater for maths than for reading. It is also consistent with the positive correlations
already revealed by the cross-country analysis performed before, which ensures that
those correlations were not driven by unobserved heterogeneity.
Focussing on the estimation results at the tails of the distribution range, features are
different depending on the subject. On one hand, for the maths test score the impacts of
some of the indicators (GGI, political empowerment or housework ratio) are stronger
for high achieving females. Given that the gap is greater precisely at the right tail – as
seen in Table 1, this fact helps close the gap throughout the math score distribution
range. By contrast, we find no statistical differences throughout the distribution for the
reduction of the gap in maths associated with measures related to the participation of
women in the labour market, which suggests differences in terms of interpretation
between these two groups of indicators. On the other hand, the results for reading are
quite similar for all measures and go in the opposite direction. In this case it is low-
achieving girls who increase their advantage over boys by relatively more, as all the
coefficients are larger for the 25th
quantile of the distribution.
In summary, the international analysis in this section reveals that in approximately
70% of the PISA 2009 participating countries girls underperform boys in maths and that
the reverse occurs for reading. The differences are exacerbated to the detriment of girls
among high achieving students. By constructing several gender equality measures at the
country level, we find a positive and significant correlation between those indicators
and both gender gaps, suggesting that in more gender-equal societies girls reduce the
gap in maths and enhance their advantage in reading. The effect is even stronger for the
upper tail of the distribution in maths and the bottom end of the distribution in reading.
12
Qualitatively similar results obtained with the set of 40 participating countries in 2003 are available upon request. A comparison of these results with those of Guiso et al (2008) for the 2003 PISA sample shows that ours are higher
except for FLFP 15+, which is somewhat lower in our estimation.
15
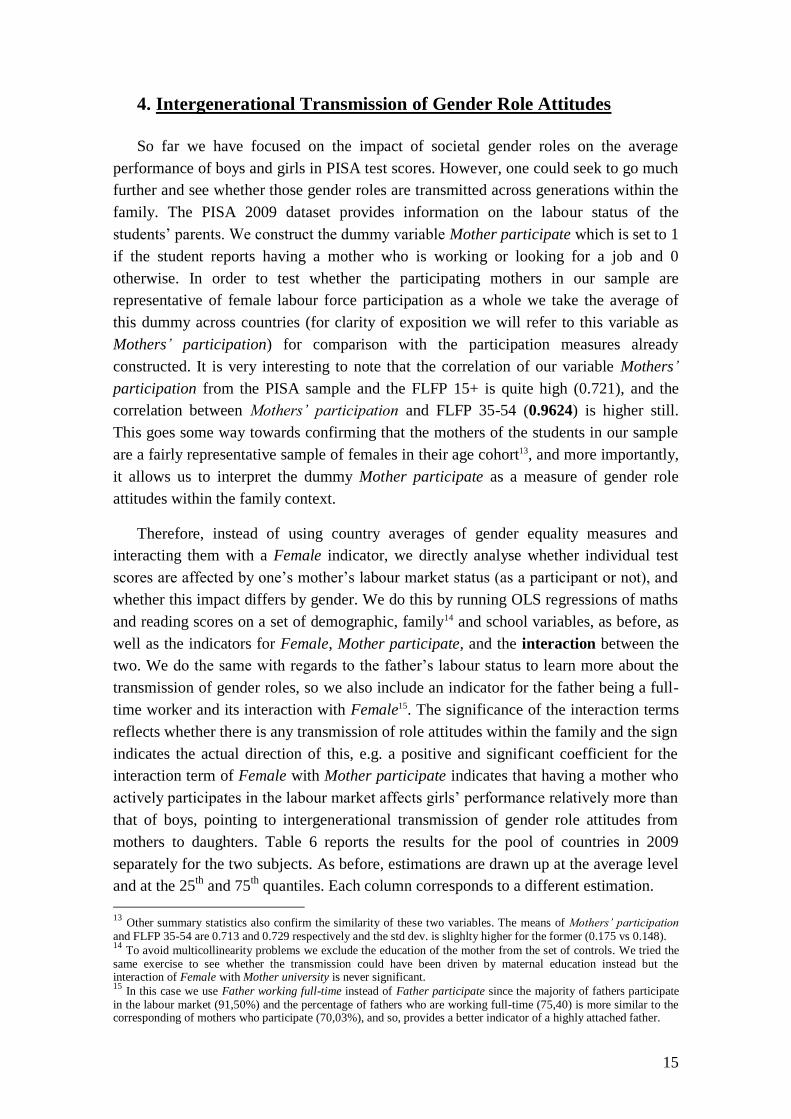
4. Intergenerational Transmission of Gender Role Attitudes
So far we have focused on the impact of societal gender roles on the average
performance of boys and girls in PISA test scores. However, one could seek to go much
further and see whether those gender roles are transmitted across generations within the
family. The PISA 2009 dataset provides information on the labour status of the
students’ parents. We construct the dummy variable Mother participate which is set to 1
if the student reports having a mother who is working or looking for a job and 0
otherwise. In order to test whether the participating mothers in our sample are
representative of female labour force participation as a whole we take the average of
this dummy across countries (for clarity of exposition we will refer to this variable as
Mothers’ participation) for comparison with the participation measures already
constructed. It is very interesting to note that the correlation of our variable Mothers’
participation from the PISA sample and the FLFP 15+ is quite high (0.721), and the
correlation between Mothers’ participation and FLFP 35-54 (0.9624) is higher still.
This goes some way towards confirming that the mothers of the students in our sample
are a fairly representative sample of females in their age cohort13, and more importantly,
it allows us to interpret the dummy Mother participate as a measure of gender role
attitudes within the family context. Therefore, instead of using country averages of gender equality measures and
interacting them with a Female indicator, we directly analyse whether individual test
scores are affected by one’s mother’s labour market status (as a participant or not), and
whether this impact differs by gender. We do this by running OLS regressions of maths
and reading scores on a set of demographic, family14 and school variables, as before, as
well as the indicators for Female, Mother participate, and the interaction between the
two. We do the same with regards to the father’s labour status to learn more about the
transmission of gender roles, so we also include an indicator for the father being a full-
time worker and its interaction with Female15. The significance of the interaction terms
reflects whether there is any transmission of role attitudes within the family and the sign
indicates the actual direction of this, e.g. a positive and significant coefficient for the
interaction term of Female with Mother participate indicates that having a mother who
actively participates in the labour market affects girls’ performance relatively more than
that of boys, pointing to intergenerational transmission of gender role attitudes from
mothers to daughters. Table 6 reports the results for the pool of countries in 2009
separately for the two subjects. As before, estimations are drawn up at the average level
and at the 25th
and 75th
quantiles. Each column corresponds to a different estimation.
13
Other summary statistics also confirm the similarity of these two variables. The means of Mothers’ participation and FLFP 35-54 are 0.713 and 0.729 respectively and the std dev. is slighlty higher for the former (0.175 vs 0.148). 14
To avoid multicollinearity problems we exclude the education of the mother from the set of controls. We tried the same exercise to see whether the transmission could have been driven by maternal education instead but the interaction of Female with Mother university is never significant. 15
In this case we use Father working full-time instead of Father participate since the majority of fathers participate in the labour market (91,50%) and the percentage of fathers who are working full-time (75,40) is more similar to the corresponding of mothers who participate (70,03%), and so, provides a better indicator of a highly attached father.

16
Table 6. Gender Roles - The impact of Parents’ labour status on Children’s Scores
Average 25th Quantile 75th Quantile
Maths Reading Maths Reading Maths Reading
Female -22.34*** 20.52*** -21.52*** 20.98*** -24.51*** 18.85***
(1.31) (1.31) (1.67) (1.50) (1.87) (1.82)
Mother 0.82 -1.38 -0.81 -1.05 1.93 1.75
Participate (0.99) (0.98) (1.15) (1.12) (1.31) (1.30)
Female*Mother 2.85** 4.91*** 4.31*** 6.01*** 3.04* 2.35
participate (1.29) (1.27) (1.52) (1.49) (1.65) (1.61)
Father working 11.81*** 11.89*** 10.29*** 9.54*** 10.84*** 9.53***
full-time (1.01) (1.04) (1.19) (1.17) (1.34) (1.32)
Female*Father 1.04 1.25 0.76 1.97 0.56 1.52
full-time (1.34) (0.37) (1.61) (1.58) (1.64) (1.78)
R2 0.408 0.387 0.252 0.205 0.252 0.217
Notes: Robust standard errors in parentheses *** p<0.01, ** p<0.05, * p<0.1. Individual level controls, school variables and country fixed effects are included. Iceland is taken as the country of reference. Students’ final weights are used in the estimations. Obs: 368,714 students in the estimation.
Several interesting features emerge from Table 6. First, the positive and significant
coefficient for the interaction of Female with Mother participate reveals that girls’
scores are higher in families where the mother participates in the labour market16, and
that the impact is higher for girls than for boys. Second, the insignificant coefficient of
the indicator for Mother participate (throughout the second row) reflects that boys have
on average the same scores regardless of his mother’s attachment to the labour market.
Third, the fact that the interaction term of Female with Father full-time is not
significantly different from zero together with the positive and significant coefficient for
Father full-time reveals that in families where the father works full-time children
perform better but that there is no gender differential in that effect. This clearly points to
some intergenerational transmission of gender role attitudes within the family from
mothers to daughters, and only in that direction. Finally, the quantile estimations reflect
a bigger impact of gender role attitudes for low-achieving females, which in fact turns
out to be not as significant for those girls at the upper tail of the distribution.
Although Table 6 suggests some transmission of gender role attitudes from mothers
to daughters, the effect is not very large (it goes from 2.35 to 6.01 points). These
estimations include all PISA participating countries, and hence cover countries which
range from very low to very high female labour force participation levels. In countries
where female participation is very high, the fact that the mother participates in the
labour market may be expected to exert a lower transmission effect to girls than in those
countries where FLFP is lower. Therefore, we next perform an analysis which is the
same as that of the previous table but with countries separated into three groups by their
FLFP 35-54 to measure the extent to which the effect of transmission depends on the
16
Very similar results are found if instead of Mother participate we include Mother working full-time (full-timers
account for 45.40% of the total sample of mothers and 65.61% of all working mothers).

17
level of Female Participation in each country. To construct the groups we first compute
the 25th
and 75th
quantile values of the FLFP 35-54 distribution. The High-Participating
group consists of those countries whose FLFP 35-54 value lies above the 75th
quantile
(e.g. Shanghai-China, Finland, Germany and Sweden). The Low-Participating group is
formed by those countries whose FLFP 35-54 value lies below the 25th
quantile17. And
finally, the remaining countries form the Medium-Participating group, which includes
Spain, Portugal, France and the U.S. among others. Table 7 present the estimation
results at the average and 25th
quantile18 for both subjects separately for the three
different groups.
Table 7. Gender Roles – Countries at different levels of the FLFP 35-54 distribution
Countries High FLFP 35-54 Medium FLFP 35-54 Low FLFP 35-54
Average Maths Reading Maths Reading Maths Reading
Female -17.43*** 30.14*** -24.44*** 18.62*** -22.26*** 20.95***
(4,14) (4.22) (2.17) (2,23) (1.78) (1.63)
Mother 1.41 4.83 0.77 -2.23 0.52 -0.35
participate (2.64) (2.56) (1.61) (1.66) (1.38) (1,24)
Female*Mother 0.65 1.48 3.31* 4.82** 3.89** 2.14
participate (3.64) (3.61) (1.86) (2.21) (1.76) (1.63)
Father working 15.17*** 13.97*** 14.24*** 13.78*** 6.52*** 8.05***
full-time (2.59) (2.56) (1.58) (1.73) (1.43) (1.31)
Female*Father 0.87 1.44 0.77 0.65 1.09 1.61
full-time (3.45) (3.42) (2.05) (2.22) (1.97) (1.75)
Observations 65.494 65.494 185.200 185.200 110.769 110.769
R2 0.316 0.332 0.402 0.394 0.467 0.431
Quantile 25th Maths Reading Maths Reading Maths Reading
Female -18.70*** 36.13*** -21.01*** 19.85*** -23.44*** 20.64***
(4,18) (4.41) (2.77) (2.95) (2.25) (1.81)
Mother 2.85 3.61 1-04 -2.28 -1.86 -1.48
participate (2.69) (2.80) (1.97) (2.07) (1.75) (1.38)
Female*Mother 0.81 0.82 2.31 6.61*** 6.34*** 7.17***
participate (3.76) (3.93) (2.63) (2.79) (2.29) (1.86)
Father working 22.62*** 18.70*** 14.81*** 14.61*** 8.21*** 9.08***
full-time (2.49) (2.55) (1.91) (2.05) (1.82) (1.46)
Female*Father 2.10 1.65 1.22 2.49 1.21 0.74
full-time (3.45) (3.54) (2.54) (2.72) (2.45) (1.99)
R2 0.142 0.167 0.223 0.208 0.223 0.221
Notes: Robust standard errors in parentheses *** p<0.01, ** p<0.05, * p<0.1. Individual level controls,
school variables and country fixed effects are included. Students’ final weights used in the estimations.
17
High-Participating group: Shanghai-China, Germany, Bulgaria, Norway, Lithuania, Iceland, Latvia, Denmark,
Estonia, Russian Fed., Finland, Czech Republic, Sweden, Slovenia, Slovak Rep., Kazakhstan.
Low-Participating group: Tunisia, Turkey, Jordan, Dubai, Colombia, Qatar, Mexico, Chile, Indonesia, Korea, Panama, Italy, Hong Kong, Greece, Trinidad & Tobago, Albania. 18
Since there are no big differences with respect to the average for the top quantile we do not present them. However
they are available upon request.

18
The table above reveals that among the high-participating group of countries there is
no transmission of gender role attitudes from mothers to daughters or indeed from
fathers to sons. Second, the sample of countries with medium female participation
shows a very similar pattern to that of the pooled sample in Table 6. As expected, the
greatest effects and differences are found for the low-participating group of countries as
we summarize next. At the average, the fact that the mother participates in these
countries affects maths and reading scores differently. More specifically, girls whose
mothers participate reduce their disadvantage in maths but do not increase their
advantage over boys in reading. However, the results for low-achieving girls in the
second panel of Table 7 reveal that the transmission acts similarly in the two subjects
and that those effects are the greatest (the reduction of the gap in maths for those girls is
around 27 per cent – computing the ratio between 6.34 and 23.44 from the last column) One possible interpretation for this that has gained popularity over the last ten
years19 and that is highly consistent with our results from the first panel of the table
above is that agents’ decisions may be driven by a gender identity that implies strong
behavioural prescriptions indicating what is appropriate for men and for women to do.
In this case, those mothers participating in the labour market are somehow breaking the
traditional view of men working in the labour force and women staying at home. Then,
the mother transmits to her daughter this break with the traditional gender role attitudes
which make her feel that she is not inferior to boys and thus believe that she can
compete also in those subjects a priori better suited to boys. This ultimately leads to
girls developing better maths skills and hence reducing the gap with boys in maths.
Another possible interpretation of our results concerns differences in effort at school
among girls whose mothers differ in their level of attachment to the labour market. If
this were the case, we should observe an improvement in girls’ scores in both maths and
reading associated with having a working mother, and this is exactly what happens for
the 25th
quantile20.
Finally, we analyse for the group of Low FLFP 35-54 Countries21, whether the
education level of mothers (university-educated or not) is a differential factor in
explaining the mechanism of the transmission. To that end we add to the specification
of Table 7 an indicator for the mother being highly educated, an interaction between
that indicator (Mother university) and Mother participate and another interaction
between Female and the former. A positive and significant coefficient for this last
interaction would suggest that the transmission is mainly driven by highly-educated
mothers. We find no differential effect on the transmission for the highly educated
mothers. Therefore, we conclude that the gender roles are transmitted similarly by all
mothers, and not only by the most educated ones.
19
See Marianne Bertrand (2010) for a review of the literature on the new perspectives on gender in Chapter 17 of the
Handbook of Labor Economics, Volume 4b. 20 This interpretation may also fit the findings of Section 3, where girls in more gender-equal cultures show
improvements in both maths and reading. 21
The next section shows this analysis for Spain, which is in the group of medium-participating countries.

19
In summary, we find that gender role attitudes within the family, as measured by the
attachment of mothers to the labour market, affect girls’ performance positively,
suggesting intergenerational transmission of gender identities from mothers to
daughters, an effect that is indeed found to be bigger for females at the lower tail of the
test score distributions. The transmission is not found in high-participating countries
since for this group the fact of having a working mother is not such a clearly
distinguishing feature. But among low-LFP countries our results suggest that daughters
inherit a break with traditional gender role attitudes due to having a mother who
participates in the labour market. This makes them perform relatively better in maths
(but has no effect in reading at the average). Furthermore, we find no significant
differential effects by gender of having a father working full-time, indicating that there
is no such transmission from fathers to sons.
5. A particular case: cross-regional analysis within Spain
One of the downsides of the international analysis in the previous sections is the
huge variability that exists in the evolutionary history of the different populations across
countries, with biological differences between them being one of the factors possibly
responsible for these results. To account for this, Guiso et al. (2008) divide the sample
into two groups of countries based on genetic distance22, and find that results are
substantially unchanged for either of the two groups, which ensures that they are not
driven by biological differences across countries. In this section, we validate the results
within a more comparable scenario by comparing regions of a particular country,
Spain23, which in addition to having a similar historical evolution, helps provide a more
homogeneous institutional framework. Furthermore, the huge differences in terms of
achievement between students from different Spanish regions highlighted in recent
literature, together with the large gender gaps in both maths and reading already
documented in this paper provide enough variability for the analysis. Thus, we can
investigate whether girls and boys perform better in more gender-equal regions in Spain
than in less gender-equal regions, and determine the extent to which the
intergenerational transmission of gender role attitudes from mothers to daughters is also
present among Spanish families.
22
This genetic measure is based on the frequency of each allele across DNA polymorphisms taken from the History
and Geography of Human Genes by Cavalli-Sforza et al. (1996) 23
One of the characteristics of the PISA survey is that countries can provide regional representative samples. We
chose Spain as the country of analysis because other than Italy it is the only PISA participating country that provides
regional disaggregation. Moreover, the disaggregation provided is much broader than that of Italy.

20
5.1. Data Description
The 2009 wave provides disaggregated data for 15 different Spanish regions. After
excluding Ceuta and Melilla we end up with 23,708 students from 839 schools. Most
regions have samples of about 1,500 students and 50 schools, except for the Basque
sample24
which includes nearly 4,800 students from 180 schools. Sample sizes are
12,068 for boys and 11,640 for girls. Table 8 reports the average maths and reading test
scores for each region in 2009. For comparability purposes, the OECD and Spanish
averages are also reported and the samples of students and schools for which we have
information for each region. A glance at the table shows remarkable raw differences
across regions, so the poor results obtained by Spain on average cannot be extrapolated
to all regions that participate in the evaluation programme. There are regions whose
results are above the national and OECD averages, such as Castilla-León, Navarra and
the Basque Country, while Andalusia, Murcia and the Islands are clearly below the
national average and a long way from the OECD average.
Table 8. The Math and Reading Test Scores across Spanish regions
Students Schools Maths Score Reading Score
Castilla-León 1,515 51 515.13 503.41
Navarra 1,504 49 510.98 497.15
Basque Country 4,768 177 509.17 494.19
Aragón 1,514 52 505.03 494.38
La Rioja 1,288 46 502.73 497.89
OECD average 499.70 489.81
Madrid 1,453 51 496.43 504.10
Cantabria 1,516 51 495.48 488.12
Catatonia 1,381 50 494.89 497.29
Asturias 1,536 54 493.95 490.21
Galicia 1,585 54 488.38 484.52
Spain average 23,708 839 483.99 483.30
Murcia 1,321 51 479.03 480.49
Balearics 1,463 52 464.15 458.20
Andalusia 1,416 51 462.73 460.53
Canaries 1,448 50 433.95 448.13
Note: Regions are ranked by their mean maths score. Students’ final weights are used.
With respect to the gender gap in achievement, on average girls’ maths scores are
19.32 lower than those of boys (3.72% less than the mean average score for boys) but
girls score 28.66 more in reading (6.07% higher than the mean average score for boys).
In Figure 4, regions are ranked from high to low gender gaps in their maths test scores.
The figure also depicts the gender gap in both test scores for Finland and for the OECD
and EU-15 averages.
24
The only PISA requirement for regional disaggregation is that the selection of schools and students within each
school should be random, but it is left up to each region what size sample they wish to provide. The Basque sample
was also the biggest of the five regions that participated in the 2003 PISA wave.

21
AND
ARA
AST
IBA
ICA CANCLE
CAT
GAL
RIO
MAD
MUR
NAV
PVA
-30
-25
-20
-15
-10
-5
Ge
nd
er
diffe
rence
in m
ath
15 20 25 30 35 40Gender difference in reading
Figure 4. Gender Gap in Test Performance for Spanish Regions
Although boys outperform girls in maths in all regions while girls score relatively
better than boys in reading, the magnitude of the gap differs significantly. Interestingly,
the fact that the lowest maths gender gap is that of Finland (the top-performing
European country in the PISA scores) while the highest are those of Andalusia and the
Islands (the worst-performing Spanish regions) suggests a negative relationship between
gender inequality in test scores and average performance that was not so clear in the
international analysis in Section 3. Moreover, the gender gap in the maths test score of
Castilla-León is very similar to the OECD average, whereas other regions such as
Asturias, Navarra, Madrid, Galicia and the Basque Country exhibit smaller gender gaps
in maths. Finally, Figure 5 shows that the correlation between the average gender gaps
in maths and reading across regions is lower than the one exhibited across countries - on
average, it amounts to 0.503.
Figure 5. Correlation between Gender Gaps across Spanish regions

22
By looking at the gender gaps at the tails of the distribution range, Table 9 shows
that the gender gap in maths is slightly wider (in absolute terms) for the top percentiles,
while the reading gender gap is sharply decreasing along the test score distribution.
Table 9. The Spanish Maths & Reading Gender Gaps over the distribution range
Mean Std Dev 5th 10th 25th 75th 90th 95th
Maths Score
Boys 493.54 90.37 339.47 372.18 433.72 558.35 608.12 635.91
Girls 474.16 88.98 320.77 355.83 415.8 535.84 584.44 613.58
Gender Gap -19.32 -18.7 -16.35 -17.92 -22.51 -23.68 -22.33
Reading Score
Boys 467.13 88.81 310.54 348.94 408.26 529.39 578.3 604.27
Girls 495.82 83.47 348.8 384.47 444.21 553.12 597.21 621.44
Gender Gap 28.66 38.26 35.53 35.95 23.73 18.91 17.17
This is consistent with the international pattern observed in Table 1. Nevertheless,
the variability over the maths gender gap distribution range is lower for the case of
Spain. This can be easily checked by computing the difference between the 90th
and 10th
percentiles in both cases. For Spain, the figure is -7.33 while for the international case it
is almost double at -14.25.
5.2. Regional Gender-Equality Measures and Gender Differences in Test Scores
We now focus on several regional measures related to gender roles and social norms
to explain the gender gap in test scores across Spanish regions. As in previous sections,
we relate gender gaps in test performance across regions in Spain to socio-economic
regional characteristics. We classify regions according to six measures of gender
equality in line with those used in the international analysis. Except for the Women’s
Emancipation index (GGI), which is not available at regional level, most of the
indicators used here are similar to those of the previous section.
(1) Female political participation in regional parliaments from INE 2009: similar
to the political empowerment index of the international analysis.
(2) We construct a regional index of cultural attitudes towards women based on the
average level of disagreement with the following statement: “When jobs are
scarce, men should have more right to a job than women”. Answers to this
question can take five values that range from 1 (strongly agree) to 5 (strongly
disagree). We compute the average across regions and call it Avg ESS index. It
is taken from the 2008 European Social Survey25.
25
This indicator is similar to the Average World Value Survey Indicator in the previous section, except that this one
only includes the answers to one of the questions included in its international counterpart since the remaining
questions are not available at the Spanish regional level.
23
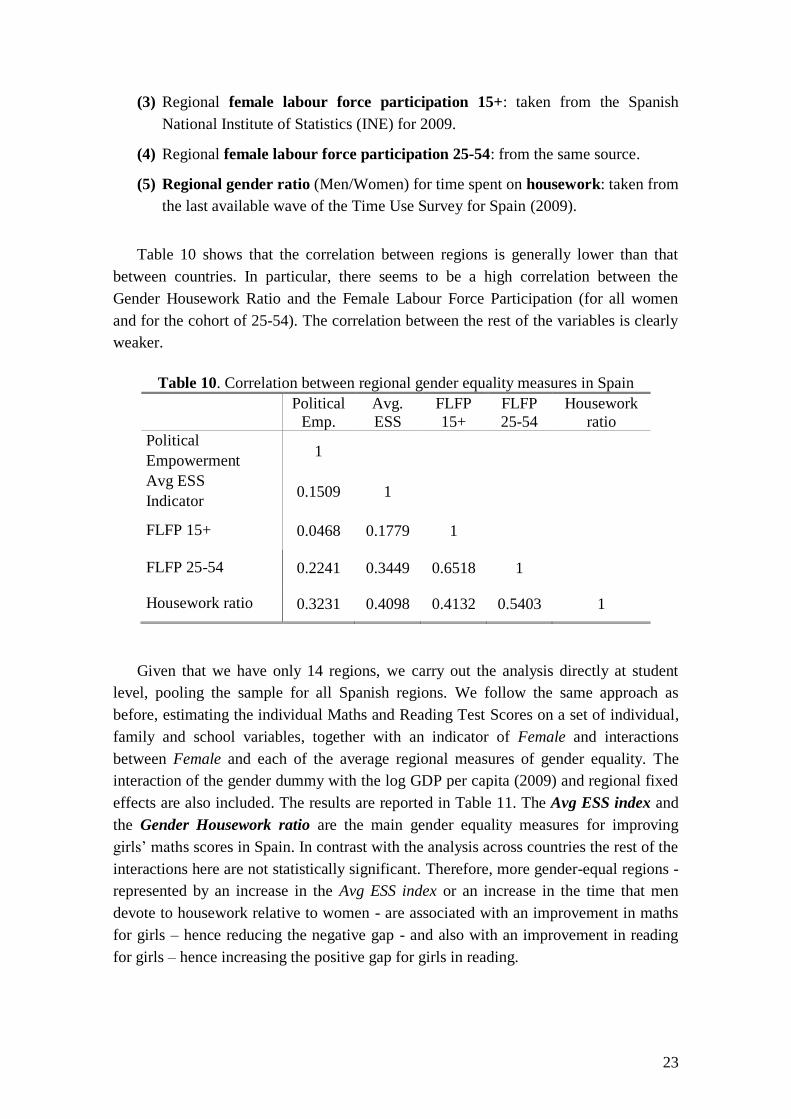
(3) Regional female labour force participation 15+: taken from the Spanish
National Institute of Statistics (INE) for 2009.
(4) Regional female labour force participation 25-54: from the same source.
(5) Regional gender ratio (Men/Women) for time spent on housework: taken from
the last available wave of the Time Use Survey for Spain (2009).
Table 10 shows that the correlation between regions is generally lower than that
between countries. In particular, there seems to be a high correlation between the
Gender Housework Ratio and the Female Labour Force Participation (for all women
and for the cohort of 25-54). The correlation between the rest of the variables is clearly
weaker.
Table 10. Correlation between regional gender equality measures in Spain
Political Avg. FLFP FLFP Housework
Emp. ESS 15+ 25-54 ratio
Political
Empowerment 1
Avg ESS
Indicator 0.1509 1
FLFP 15+ 0.0468 0.1779 1
FLFP 25-54 0.2241 0.3449 0.6518 1
Housework ratio 0.3231 0.4098 0.4132 0.5403 1
Given that we have only 14 regions, we carry out the analysis directly at student
level, pooling the sample for all Spanish regions. We follow the same approach as
before, estimating the individual Maths and Reading Test Scores on a set of individual,
family and school variables, together with an indicator of Female and interactions
between Female and each of the average regional measures of gender equality. The
interaction of the gender dummy with the log GDP per capita (2009) and regional fixed
effects are also included. The results are reported in Table 11. The Avg ESS index and
the Gender Housework ratio are the main gender equality measures for improving
girls’ maths scores in Spain. In contrast with the analysis across countries the rest of the
interactions here are not statistically significant. Therefore, more gender-equal regions -
represented by an increase in the Avg ESS index or an increase in the time that men
devote to housework relative to women - are associated with an improvement in maths
for girls – hence reducing the negative gap - and also with an improvement in reading
for girls – hence increasing the positive gap for girls in reading.

24
Table 11. Culture – The Impact of Regional Gender-equality Measures on Girls’ Scores
Average 25th Quantile 75th Quantile
Maths Reading Maths Reading Maths Reading
Female*Political -14.01 -6.40 -32.40 -3.99 -11.89 15.85
empowerment (36.07) (34.21) (51.60) (45.86) (43.85) (45.20)
Female*Avg 21.57*** 9.11* 21.61*** 12.31*** 22.73*** 9.22
ESS indicator (5.44) (5.03) (7.65) (5.38) (8.11) (6.69)
Female*FLFP15+ 4.55 20.47 -32.61 16.27 -23.81 8.74
(37.28) (35.46) (54.55) (49.98) (48.08) (44.03)
Female*FLFP 66.93* 71.80* 36.17 73.21* 47.88 70.10
35-54 (39.53) (38.35) (57.40) (42.74) (49.45) (49.73)
Female*House- 61.98** 69.16** 72.24* 71.86* 14.27 23.57
work ratio (31.46) (31.35) (41.49) (38.17) (43.59) (41.42)
Notes: Robust standard errors in parentheses *** p<0.01, ** p<0.05, * p<0.1. Individual level controls,
school variables and regional fixed effects included. Castilla-León is taken as the region of reference.
Students’ final weights are used in the estimations. Obs: 19,532. R2 from 0.245 to 0.402
However, the significance of the coefficient for the interaction term of Female with
the Gender Housework ratio disappears for both maths and reading in the top quantile
of the distribution range. The same goes for the significance of the interaction of
Female with the Avg ESS index in reading. The results here imply that the evidence is
weaker across Spanish regions than across countries. This could be explained simply by
the lower variability of equality measures at Spanish regional level.
5.3. The Intergenerational transmission of gender roles
As before, instead of using regional averages of gender equality measures and
interacting them with a gender indicator, we next analyse whether individual test scores
for Spanish students are affected by the mother’s labour market status (as participants or
not) and whether this impact differs by gender26. To that end we run OLS regressions on
Maths and Reading Test Scores on a set of demographic, family and school variables, as
before, as well as indicators for Female, Mother Participate, and interactions between
the two. We also include, as before, Father full-time and an interaction with Female, to
see whether there is any intergenerational transmission from the side of the father in
Spain. Table 12 reports the results for both test scores.
26
The correlation between Mothers’ participation and FLFP 25-54 across Spanish regions is 0.8591 which is lower
than the cross-country correlation (which is 0.96) but also ensures that the mothers in the Spanish sample are
representative of the population of women in that age cohort, and that the indicator can be used as a proxy for gender
role attitudes. The reason why the correlation is lower now is that here, due to data restrictions, we include younger
females, from 25 to 35, an age interval which cannot include the mothers of our students.

25
Table 12. Gender Roles - Impact of Parental Labour Status on Test Scores in Spain
Average 25th Quantile 75th Quantile
Maths Reading Maths Reading Maths Reading
Female -42.54*** 6.82* -47.44*** 6.59 -43.18*** 2.80
(4.05) (3.97) (4.75) (5.86) (4.93) (4.27)
Mother 1.54 -1.49 -1.07 -0.51 3.34 0.22
participate (2.51) (2.52) (2.92) (3.57) (2.98) (2.59)
Female*Mother 8.37*** 9.97*** 10.06*** 8.49** 7.95** 10.34***
Participate (3.49) (3.38) (4.13) (4.05) (3.92) (3.58)
Father working 0.69 -2.86 -3.36 -1.23 2.54 -3.82
full-time (2.62) (2.64) (3.01) (3.73) (3.15) (2.73)
Female*Father 4.94 5.40 5.32 6.03 3.78 5.39
full-time (3.68) (3.61) (4.26) (5.24) (4.33) (3.78)
R2 0.402 0.397 0.237 0.246 0.226 0.203
Notes: Robust standard errors in parentheses *** p<0.01, ** p<0.05, * p<0.1. Individual level controls,
school variables and regional fixed effects are included. Castilla-León is taken as the region of reference.
Students’ final weights are used in the estimations. Observations: 19,695 students in the estimation.
Various aspects of the above table should be highlighted. First, a positive and
significant coefficient for the interaction of Female with Mother participate is found for
both subjects at the average and at the different quantiles of the distribution range. More
importantly, those coefficients more than double the corresponding ones in the
international estimation in all cases – See Table 6 for comparison. This suggests that the
intergenerational transmission of gender role attitudes from mothers to daughters is
stronger within Spanish families. Second, the coefficient of Mother Participate which
reflects the impact of this variable on boys (given that the interaction of that variable
with Female is already included) is not significant reflecting that boys’ scores are
neither affected by their mothers’ labour status in Spain. Similar to what we found in
the previous section, the fact that interaction of Father full-time with Female is not
significant indicates that there is no specific transmission from fathers to daughters.
Finally, the quantile estimations reveal no significant differences on the impact of
gender role attitudes over the test score distribution range for the Spanish case.
Next we look further, as before, into the transmission mechanism and look at
whether there is a differential effect of Mother’s participation on girls’ performance
depending on the educational attainment of the mother. Table 13 presents the results of
the estimation of individual test scores once an indicator is included for university/non-
university education of the mother as well as her participation status. In contrast with
the results for the set of low-participating countries, the transmission of gender role
attitudes in Spain is driven by the most highly-educated mothers, since those girls
whose mothers participate in the labour market and in addition have a university
education perform better in maths (but not in reading) with respect to boys.

26
Table 13. Transmission Mechanisms – Importance of Higher Education in Spain
Maths Reading Maths Reading
Female -42.54*** 6.82* -38.45*** 7.66***
(4.05) (3.97) (3.02) (2.94)
Mother participate 1.54 -1.49 1.55 -2.69
(2.51) (2.52) (2.85) (2.87)
Female*Mother 8.37*** 9.97*** 4.79 10.51***
participate (3.49) (3.38) (3.81) (3.70)
Female*Mother uni* 8.41*** -1.69
Mother participate (3.57) (3.49)
R2 0.402 0.397 0.403 0.398
Notes: Robust standard errors in parentheses *** p<0.01, ** p<0.05, * p<0.1. Individual level controls,
school variables and regional fixed effects are included. Castilla-León is taken as the region of
reference. Students’ final weights are used in the estimations. Obs: 19,695 students in the estimation.
6. Conclusions
In most PISA 2009 participating countries and in all Spanish regions there is a
significant gender gap in both maths and reading. In particular, girls underperform boys
in maths and the reverse occurs for reading. These gaps are exacerbated in detriment of
girls among high-achieving students. We construct several gender equality measures at
both country and regional levels, some of which have been already used in the relevant
literature, which help us to validate new measures that we introduce. We find a positive
and significant correlation between those indicators and both gender gaps, suggesting
that in more gender-equal societies girls reduce the gap in maths and enhance their
advantage in reading. This relationship is more apparent across countries than across
regions in Spain.
Moreover, gender role attitudes within the family, as measured by the attachment of
mothers to the labour market, is found to affect girls’ performance positively,
suggesting intergenerational transmission of gender identities from mothers to
daughters, an effect that is indeed bigger for females at the lower tail of the test score
distribution range. This transmission is stronger among Spanish families and in Spain is
mainly driven by the most highly-educated mothers. The transmission is not found in
high-participating countries since for this group the fact that the mother participates
does not represent a distinguishing feature. One interpretation for this result that has
been advocated in the relevant literature (See Bertrand (2010)) is that agents’ decisions
may be driven by a gender identity that implies strong behavioural prescriptions
indicating what is appropriate for men and for women to do. In this case, those mothers
who participate in the labour market are somehow breaking the traditional view of men
working in the labour force and women at home. Thus mothers pass on to their
daughters this break with traditional gender role attitudes. This ultimately leads to their
developing better maths skills and closing the gap with boys in maths.

27
Finally, we find no significant differential effects by gender of having a father
working full-time in the pooling of countries or in Spain, indicating that there is no such
transmission from the father’s side.
The empirical evidence in this paper suggests a new research agenda, especially in
regard to the intergenerational transmission from parents to children as much for other
countries and for different data sets and outcome variables of interest. It is of crucial
importance to determine the direction of such transmission since it may have relevant
policy implications, as for the Spanish case, aimed to develop measures that make it
easier for women to reconcile work and family life, what in the light of our findings
would ultimately lead to a reduction of the gender gap in the math score of children at
their teens through the break with the traditional gender role attitudes.

28
References
[1] Basu A. (2002). “Why Does Education Lead to Low Fertility? A Critical Review of
Some of the Possibilities”. World Development, 30, 1779-1790
[2] Baker, D. P.& Jones, D. P. (1993). “Creating gender equality: Cross national gender
stratification and mathematical performance”. Sociology of Education, (66) 91–103.
[3] Bertrand, Marianne (2010). “New Perspectives on Gender” Chapter 17 Handbook of
Labor Economics, Volume 4b.
[4] Bratti, M., Checchi, D. & Filippin, A. (2007). “Geographical differences in Italian
students’ mathematical competencies: evidence from PISA 2003”, Giornale degli
Economisti e Annali di Economia (66) 3: 299-333.
[5] Burt, K.B, & Scott, J. (2002). “Parent and Adolescent Gender Role Attitudes in 1990s
in Great Britain”, Sex Roles, 46, 239-45.
[6] Ciccone, A. & Garcia-Fontes, W. (2009). “The quality of the Catalan and Spanish
education systems: A perspective from PISA”, IESE Research Papers D/810, IESE
Business School.
[7] Corak, M. & Dauzon, L. (2010). “Differences in the Distribution of High School
Achievement: The Role of Class Size and Time-in-Term” IZA DP No. 4824.
[8] Doepke, M. & Tertilt, M. (2009). “Women’s Liberation: What Was in It for Men?”.
Working paper.
[9] Dollar, D. & Gatti, R. (1999). “Gender Inequality, Income and Growth: Are Good
Times Good for Women?”. Policy Research Report on Gender and Development
Working Paper Series No. 1, World Bank, Washington.
[10] Eagly, A. & Wood, W. (1999). “The origins of sex differences in human behavior:
Evolved dispositions versus social roles”. American Psychologist, 54, 408-423.
[11] Falch, T. & Fischer, J. (2008). “Public sector decentralization and school performance:
international evidence”. Research Paper No.38, Turgau Institute of Economics.
[12] Farré, L. & Vella, F. (2007). “The Intergenerational Transmission of Gender Role
Attitudes and Its Implications for Female Labor Force Participation”. IZA discussion
paper nº 2802.
[13] Fernandez, R. Flogi, A. & C.Olivetti (2004).“Mothers and Sons: Preference Formation
and Female Labor Force Dynamics”. Quarterly Journal of Economics, 119, 1249-99.
[14] Fortin, N. (2005). “Gender Role Attitudes and the Labour-Market outcomes of Women
across OECD countries”. Oxford Review of Economic Policy, vol. 21 nº 3.
[15] Fryer, R. & Levitt, S. (2009). “An Empirical Analysis of the Gender Gap in
Mathematics.” American Economic Journal: Applied Economics.

29
[16] Fuchs, T. & Woessmann, L. (2007). “What Accounts for International Differences in
Student Performance? A Re-Examination Using PISA Data”, Empirical Economics,
No. 32 (2), pp. 433-464.
[17] Goldin, C. (1994). “The U-Shaped Female Labor Force Function in Economic
Development and Economic History.” In T. P. Schultz, ed., Investment in Women's
Human Capital and Economic Development. Chicago, IL. University of Chicago
Press, pp. 61-90
[18] Guiso, L., Monte, F., Sapienza, P. & Zingales, L. (2008). “Culture, Gender and Math”.
Science, 320(5880): 1164-1165.
[19] Hausmann, R., Tyson, L. & Zahidi, S. (2009). “The Global Gender Gap Report 2009”.
Geneva, Switzerland: World Economic Forum.
[20] Klassen, S. (2002). “Low Schooling for Girls, Slower Growth for All? Cross Country
Evidence on the Effect of Gender Inequality in Education on Economic Development”.
World Bank Economic Review, 16, 345-373.
[21] Riegle-Crumb, C. (2005). “The cross-national context of the gender gap in math and
science”. In L. Hedges & B. Schneider (Eds.), The social organization of schooling pp.
227–243.
[22] Schultz, T.P. (2002). “Why Governments Should Invest More to Educate Girls”.
World Development, 30, 207-225.