Embed Size (px)
Citation preview
Kathmandu University School of Management Occasional Paper No. 2
Gender Differences in Risk Aversion A Study of Nepalese Banking Sector Employees
Binay Kumar Adhikari Virginia E. O’Leary
July, 2008

Gender differences in risk aversion …1
ABSTRACT
Women are generally considered more risk averse than men. Using a new graphic-based survey
instrument by Hanna and Lindamood (2004), this study examined whether women who are employed in
the Nepalese banking sector show more risk aversion than men. Consistent with the existing literature, the
findings suggest that women report the intention to take less risk than men. However, risk tolerance is
more strongly associated with level of investment knowledge than with sex. No significant interaction
effect of sex and marital status for risk tolerance was obtained. Analyses of sex, age, knowledge, risk
tolerance and wealth allocation indicated that women demonstrate more risk aversion and invest less of
their wealth in risky assets (stocks and direct investments) than men because they consider themselves to
be less knowledgeable about investment markets and products. These findings supplement existing
literature pointing to the need to educate women investors to increase their confidence in their abilities to
succeed in the world of finance.
Gender differences in risk aversion …2
Risk aversion is a concept in economics, finance, and psychology related to the behavior of
consumers and investors faced with uncertainty. Risk aversion refers to the reluctance of a person to
accept an outcome with an uncertain payoff rather than another outcome with a more certain, but possibly
lower, expected payoff. Thus, many individuals are willing to pay money (or settle for a low return) to
avoid playing a risky game, even when the expected value of winning is in their favor.
Considerable empirical evidence suggests that women are more risk averse than men. One study
conducted by Weber, Blais and Betz (2002) involved a survey to quantify five distinct risk domains:
financial risks, health and safety risks, recreational, ethical and social risks. Their results indicated that
women were more risk-averse in all domains except social risk. Hinz, McCarthy and Turner (1997),
Sunden and Surette (1998), and Olsen and Cox (2001) found that increased risk aversion affects the
investment choices of women. Similarly, Watson and Robinson (2003) reported less variability in profit
(risk) for ventures run by women than in those run by men. With respect to superannuation investments
specifically, SäveSöderbergh (2003) showed that the proportion of women selecting risky superannuation
funds in Sweden was smaller than the proportion of men selecting similarly risky funds. A wealth of
psychological literature, summarized in the review by Byrnes, Miller, and Schäfer (1999) of 150 studies
examining differences in risk taking between men and women, demonstrated that women, on average,
take less risk than men. For example, women tend to use seat belts more often than men and are more
likely to be nonsmokers (Hersch 1996).
Previous Tests of Male/Female Risk Aversion in Finance
Several studies have sought to determine whether the difference in risk preferences between men
and women found in the psychological literature translates into a difference in investment choices. Two of
the first studies to identify women as more risk averse than men when making investment choices were
conducted by Cohn et. al. (1975) and Riley and Chow (1992). Later studies by Hinz et al. (1997) and
Bajtelsmit and Vanderhei (1997) specifically examined the pension choices of U.S. investors and
concluded that, even after the authors had controlled for income and age, women generally chose less
risky pension fund options. Similarly, Sunden and Surette (1998) reported that after marital status was
added to their list of control variables, women still chose less risky pension funds. Other studies that have
found women to be more financially risk averse than men include Olsen and Cox (2001), Jianakoplos and
Bernasek (1998), and Bernasek and Shwiff (2001). Likewise, Powell and Ansic (1997) used
experimental methods to study financial decision-making and found that women were more risk averse
than men, regardless of “familiarity and framing, costs or ambiguity.”
Gender differences in risk aversion …3
Few studies on risk aversion have been conducted in Asian countries. One study by Mittal and
Dhade (2007) attempted to determine whether women prefer low risk assets compared to men. An
empirical investigation of 167 respondents from Indore, India was conducted. The results indicated that
women were less inclined to take risks than men and held less risky portfolios. The impact of the framing
effect was found to be more pronounced in the case of females than males.
Other Factors That Might Influence Risk Aversion
Previous research findings not only support the proposition that women are more averse to
financial risk than men but also suggest other factors that can influence risk aversion. Using three
different datasets, Hartog, Carbonell and Jonker (2000) found substantial empirical support for the claim
that risk aversion is higher for both women and civil servants. It is lower for the self-employed and
decreases as income, wealth and education increase.
Using the 1983 Survey of Consumer Finances, Hawley and Fujii (1993) employed ordered logit
models to investigate the effects of net worth and individual characteristics on risk tolerance. The study
included economically active respondents 25-62 years of age. Education, income and debt were positively
related to risk tolerance. Married couples and households headed by a single male were more risk tolerant
than otherwise similar households headed by a single female. Age was not statistically significant in the
analysis. The Hawley and Fujii (1993) results are consistent with results from Warner and Cramer (1995)
and Lee and Hanna (1995a). Using 1983 SCF data on risk tolerance, Lee and Hanna (1995a) derived a
distribution of dichotomous risk tolerance level by demographic groups. Of 2,691 respondents in the
sample, 60% were willing to take financial risks. Predicted risk tolerance was approximately the same for
all ages under 55, then decreased with age. Predicted risk tolerance increased with education. Using the
1983 SCF risk tolerance data, Sung and Hanna (1996) employed an ordered probit model of a 3-level
dependent variable to analyze the effects of income and demographic variables on risk tolerance. They
found that income and education were positively related to risk. Generally, risk tolerance decreased with
age after 45. Self-employed persons and farmers were significantly more willing to take financial risks
than their counterparts.
Similarly, Jaggia and Thosar (2000) noted an "inverse relationship between age ... and risk
taking"; De Bondt (1998) stated that an often cited rule of thumb used in the financial industry is to hold
100% minus the investor's age in equities. Therefore, age is controlled for in most analyses of risk
aversion.
Gender differences in risk aversion …4
However, Jianakoplos and Bernasek (1998) found no relationship between knowledge and risk
taking, and Sunden and Surette (1998) found that education had no effect on risk preferences.
A final factor that seems to influence risk aversion, although not necessarily in a predictable
manner, is an individual's marital status. Daly and Wilson (2001) suggested that the increased
responsibilities accompanying marriage and children will make a man less tolerant of risk. Supportive of
this theory is the finding by Sunden and Surette (1998) that marriage makes both men and women more
risk averse in their choice of pension plans. Säve-Söderbergh (2003) argued, however, that marriage
might encourage a couple to invest in riskier assets because each person now has a second income stream
insuring against the loss of his or her own income. Furthermore, Säve-Söderbergh suggested that marriage
has the potential to affect the risk preferences of men and women differently. For example, if the joint
utility of investment is thought of as a compromise between the risk preferences of the married man and
the married woman, the result could be investment outcomes for a couple that reflect greater risk aversion
for the man compensated by decreased risk aversion for the woman. Yet another potential outcome of
marriage might be that one of the pair takes charge of all investment decisions in the household, and thus
the other's investment decisions no longer reflect that individual's risk preferences. Jianakoplos and
Bernasek (1998) also found that the presence of children significantly increases the risk tolerance of
married couples in their investments but significantly decreases the risk tolerance of single women.
Therefore, the literature indicates that marriage may significantly affect the risk preferences of
individuals, even if there are potentially offsetting theories explaining the direction of such effects.
In summary, age, income, knowledge, and marital status are the four variables most commonly
controlled for in the literature concerned with the relative risk preferences of men and women. Other
variables, of course, may also be influencing the results. For example, race has been shown to influence
risk perceptions (Flynn et. al. 1994). Finucane et. al. (2000) found white men to be the most risk tolerant.
Moreover, Riley and Chow (1992) noted that the geographical location of an investor might influence risk
preferences, although they suggest that income is probably driving this result.
Around the globe women are an increasing presence in the financial world. Over time these well
educated professional women in Nepal will assume their rightful positions as independent players in the
world of work and finance alongside their sisters in the developed world. The fact that such changes have
begun is evidenced by the increasing number of women employed in the banking sector. These changes
will inevitably continue.
Gender differences in risk aversion …5
Research suggests that women, because they usually have lower working-life incomes than men
(Bajtelsmit & Bernasek 1996 as cited in Watson & McNaughton 2007), are likely to have less wealth than
men when they retire. The potential effect of this difference on the retirement benefits of men and women
are compounded by the fact that women typically have longer life spans over which their retirement
benefits must be allocated and they also tend to retire earlier than men (Blondal and Scarpetta 1998 as
cited in Watson and McNaughton 2007). If women are indeed more risk averse in their investment
choices, this characteristic will magnify the problems associated with their lower work-life incomes,
lower retirement ages, and longer life expectancies. Appropriate policy interventions must be effectively
designed. The issue is important to private and social pension policy makers and professionals who
provide investment information and services to clients.
If women are, or are believed to be, more risk-averse then men, the implications for the types of
jobs they are offered and salary they receive are profound. Women may not be offered jobs which require
risky decision making (eg. Investment Manager) or they may be compensated at lower rates than men
(Charness & Gneezy, 2004). Bliss and Potter (2001) evaluated the performances of 3200 single mangers
mutual funds and found that women manage only 11% of them. Female managers confront “glass
ceilings” on corporate promotion ladders more often than men because it is assumed that they cannot
make the risky decisions which result in high returns (Johnson & Powell, 1994).
Recently, the World Bank’s (2005) released “Engendering Development - Through Gender
Equality in Rights, Resources, and Voice", a policy research report focusing on gender issues and their
broad economic and social implications in developing and transitional countries. This report examines the
conceptual and empirical links among gender, public policy, and development outcomes. Among several
findings, it concludes that it is critically important to take gender into account in the field of social
protection and the design of public programs. The positive effect of increased household income on the
child welfare - their education, health, and nutrition - is stronger if that increase is controlled by - or
channeled through - the mother. There may be a case, from a development effectiveness perspective, for
targeting larger funds to women or, as is suggested in this report, designing investment products and
schemes targeted to the attitudes and values of women, who are likely to be more productive mobilizers
of their households’ resources than men.
The world wide literature has repeatedly found evidence for the greater financial conservatism of
women compared to men (Lewellen, Lease & Schlarbaum, 1977; Bruce & Johnson, 1994; Barber &
Odean, 1995; Barskey, Kimball & Shapiro, 1996; Bajtelsmit & VanDerhei, 1997; Hinz et al., 1997,
Gender differences in risk aversion …6
Jianakoplos & Barnesek, 1998). All other things equal, a conservative investment strategy results in less
income on average than a more aggressive strategy. Higher returns generally come at the cost of higher
risk. A consequence of the relationship between risks and returns is that women, who choose to bear
lower risk, will generally earn lower returns - in the long run. Life expectancy at birth has been increasing
for both males and females in Nepal. It has increased from 42 years for males and 40 years for females in
19711 to 62 years for both males and females in 2005. Women’s life expectancy is projected to exceed
that of the men in the near future (World Health Report, 2005 and population projection for Nepal 2001-
2021). Women’s greater longevity implies that, even with the same investment strategy and pension
accumulation, retirement wealth must support a longer period of retirement. Women have lower lifetime
earnings, less earnings growth, less wealth, less pension coverage and lower pension participation rates.
To date, no empirical study of gender differences in financial risk preference in Nepal has been
conducted. In fact research on risk aversion that includes Asian population is very limited (Yao, 2007).
This research was undertaken to provide baseline information of value to those working to establish
forward looking policies and procedures to accommodate the financial interests and needs of women and
men in the world of business and entrepreneurship.
It is hypothesized that after other factors (age, marital status, income, number of children,
knowledge of investment) known to influence an individual's risk preferences are controlled, Nepali
women will demonstrate, on average, more risk aversion than Nepali men.
METHOD
Hanna, Gutter and Fan (2001) observed that there are at least four methods of measuring risk
tolerance: asking about investment choices, asking a combination of investment and subjective questions,
assessing actual behavior, and asking questions based on hypothetical scenarios. They noted that inferring
risk aversion based on observing actual portfolio allocations has many limitations, including the fact that
many households have no portfolio to allocate so that nothing can be inferred about their risk aversion
from their allocation.
The methodology for this study employed hypothetical questions because it has been shown to be
the firmest link to the theoretical concept of risk aversion. If the respondent chooses to take an uncertain
risk that could result in a decrease in income (or a significant gain) instead of one that is certain although
1Source: http://www.searo.who.int/EN/Section313/Section1523_6868.htm
Gender differences in risk aversion …7
less advantageous, Barsky, Juster, Kimball and Shapiro (1997) show that the expected utility of the
income resulting from the riskier choice exceeds the expected utility of having the current income stream
with certainty.2
This study used a modified version of the Hanna et al. (2001) pension choice measure of risk
aversion that follows the expected utility model. The modified pension choice questions included
graphical illustrations to represent the quantity of the change in the pension to increase the respondents’
understanding of the consequences of the hypothetical alternative outcomes and thus more accurately
estimate their true risk level.
Instrument
A new, graphic-based survey instrument developed by Hanna and Lindamood (2004) was
employed.3 In addition to the series of pension choice questions, the survey also included the SCF
Investment Risk question 4 for comparison purposes.
2 Let U be the utility function and C be permanent consumption. An expected utility maximizer will choose the 50-
50 gamble of doubling lifetime income as opposed to having it fall by factor 1 - λ if:.5 U (2C) + .5 U (λ C) > U(C)
3 Illustrative of the questions contained in the questionnaire is the following:
Suppose that you are about to retire, and have two choices for a pension. Pension A gives you an income equal to
your pre-retirement income. Pension B has a 50% chance your income will be double your pre-retirement income,
and a 50% chance that your income will be 20% less than your pre-retirement income. You will have no other
source of income during retirement, no chance of employment, and no other family income ever in the future. All
incomes are after-tax. Which pension would you choose?
Subsequent questions pose different percentage reductions in income. There were six questions out of which the respondent is required to answer a maximum of four questions. The respondent who accepts the possibility of largest
cut in income for a possibility of doubling the income gets the higher possible point (on a scale of 1 to 7) indicating
an extremely high subjective risk tolerance (SRT).
4 The Survey of Consumer Finances (SCF) is used to gather data on assets, liabilities, financial attitudes, and
financial behaviors of individuals and families. The SCF questions ask:
Which of the following statements on this page comes closest to the amount of financial risk that you are willing to
take when you save or make investments?
1. Take substantial financial risk expecting to earn substantial returns
2. Take above average financial risks expecting to earn above average returns
3. Take average financial risks expecting to earn average returns
4. Not willing to take any financial risks The SCF risk assessment item has been widely used as a proxy for financial risk tolerance, although no published
documentation exists to substantiate the validity of this item. However, based on the use of the item in published
research (e.g., Chang, 1994; Grable and Lytton, 1998; Sung and Hanna, 1996; Yuh and DeVaney, 1996 as cited in
Grable & Lytton, 1999), one can assume at least a moderate degree of item validity. Also, scores on the item have
been very consistent over time, suggesting a high level of reliability.

Gender differences in risk aversion …8
Participants
Participants in the study were 206 employees of 12 banks and financial institutions in Nepal.
Convenience sampling was used to select the respondents. Only employees of the banking sector were
chosen in order to control the effects of differences in professions.
RESULTS AND DISCUSSION
Respondents’ risk aversion ranks were derived from Hanna and Lindamood’s (2004) risk
tolerance questions and assigned a numeric rank in ascending order; coded 1 (extremely low), 2 (very
low), 3 (moderately low), 4 (moderate), 5 (high), 6 (very high) and 7 (extremely high) risk tolerance. The
coded risk tolerance figures were regressed as the dependent variable against several relevant independent
variables.
SRT = β0 + β1(sex) + β2(age) + β3(marital) + β4(knowledge) + β5(income) + β6(kids)
SRT = respondent’s Subjective Risk Tolerance rank derived from Hanna and Lindamood’s risk
tolerance questions; coded from 1 for extremely low to 7 for extremely high risk tolerance
sex = dummy variable; coded 1 for women and 0 for men
age = respondent’s age range coded 1, 2, 3, 4, 5 etc. in ascending order.
marital = dummy variable; coded 1 for married and 0 for not married
income = respondent’s annual income range; coded 1, 2, 3, 4, 5 etc. in ascending order.
knowledge = respondent’s self-reported level of knowledge of investment market and products;
coded 1, 2, 3, 4, 5 etc. in ascending order.
kids = number of children (if married)
A regression equation was used employing backward elimination, which involves starting with all
candidate variables and testing them one by one for statistical significance, deleting any that are not
significant (variables with largest p-values were the first to be eliminated). Once the overall model was
Gender differences in risk aversion …9
statistically significant (p < .05), the remaining individual regressors were analyzed. A two-way ANOVA
was conducted to assess the interaction effects of marital status and sex.
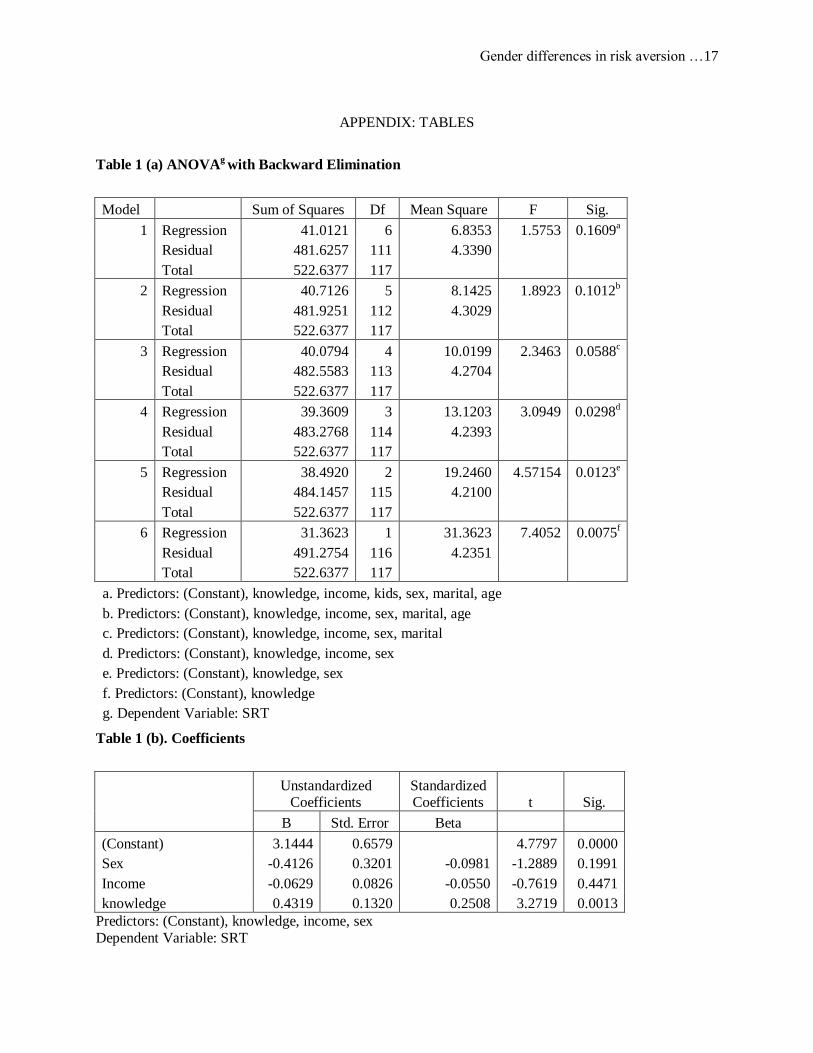
The results of the regression with backward elimination are shown in Table 1(a). The overall
model became statistically significant at .05 (F = 3.09; p<.05) when kids, age and marital are eliminated
as predictors. This indicates that these variables do have a significant impact on aversion. The regression
coefficients of the model with the remaining predictors - knowledge, sex and income - are presented in
Table 1(b). The results show that only knowledge had significant impact on SRT (p < .05). The impact of
sex and income were not statistically significant according to the regression analysis.
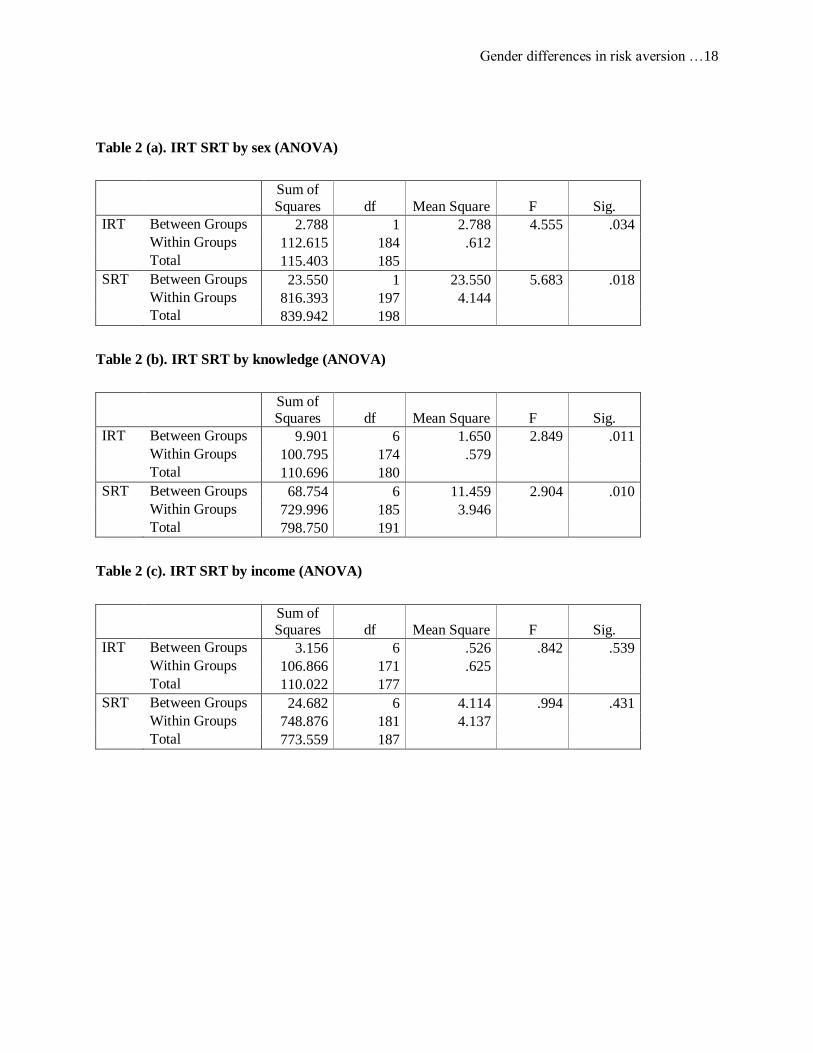
Further analyses were employed to determine whether Investment Risk Tolerance (IRT) derived
from the SCF questions and the Subjective Risk Tolerance (SRT) vary among sex, knowledge and
income. In interpreting these results it is important to note that the higher the score on the SRT the greater
the risk tolerance (or less risk aversion). The opposite is true with the IRT scores. The results of the
ANOVA in Table 2(a) indicate that both the IRT and the SRT varied significantly between men and
women (p <.05). As the negative sign of the coefficient of gender from the regression (Table 1b)
suggests, men exhibit greater risk tolerance than women. Likewise, the results of Table 2b indicate that
both IRT (p =.01) and SRT (p = .01) varied significantly with the level of knowledge one has or believes
he/she has about the investment market and financial products. As the positive sign of the regression
coefficients in Table 1 (b) indicates, risk tolerance increases with level of financial knowledge. Neither
the IRT nor the SRT varied significantly with the level of income.
Although results of the regression suggest that only knowledge had a significant impact on risk
tolerance, the ANOVA applied to individual predictors showed that sex also had an impact on risk
aversion. Thus, gender affected risk taking propensity although not in the magnitude hypothesized based
on the review of the literature. Directionality of the findings is suggested in the results shown in Table
1(b). Men tend to be more risk tolerant than women (the sex coefficient has a negative sign). Perceived
knowledge of the investment market and financial products has been shown to have a significant impact
on risk aversion. The positive sign of the regression coefficient suggests that risk tolerance increases with
the increase in perceived knowledge of investment related information.
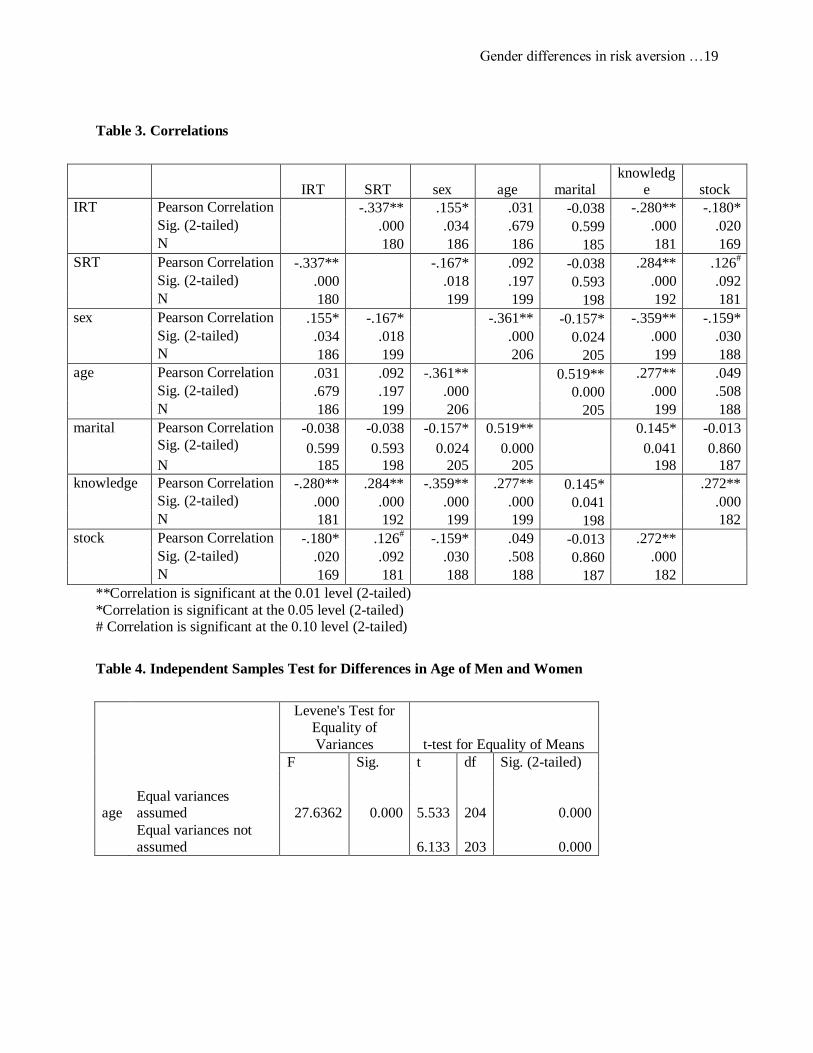
The significant positive relation between age and knowledge is shown in Table 3 (r = .28, p<.05)
indicating that older bank employees are more knowledgeable about financial matters than their younger
colleagues. Likewise, there is a positive relationship between knowledge and risk tolerance (r = .28, p <
Gender differences in risk aversion …10
.05) which suggests that people with more investment knowledge endorse more risky options.
Furthermore, both reported risk tolerance measures, the IRT (r = -.18, p <.05) and the SRT (r = .13, p
<.10), for the employees are inversely related to the proportion of wealth kept in risky assets i.e. stocks
and direct investment in business. Those who rate themselves as high risk takers invest a larger portion of
their wealth in risky assets (stocks and business) than those who rate themselves as more risk averse.
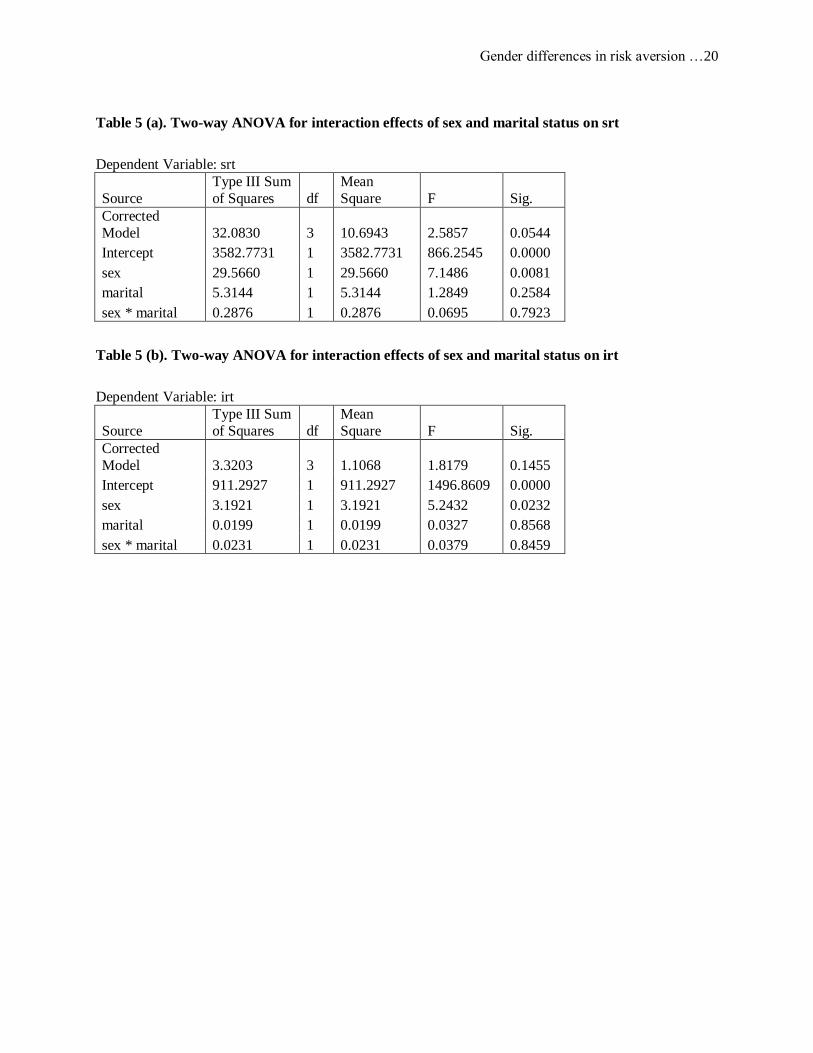
As indicated in Table 5 (a and b), sex by marital status interaction was not significant for either
the SRT or the IRT.
Women, who generally consider themselves less knowledgeable about finance than men exhibit
greater risk aversion. However, the relationship is stronger between knowledge and risk tolerance than
between gender and risk tolerance. It is therefore not surprising that in a review of a wide range of
literature Lyons et. al (2008) conclude that the research on risk tolerance indicating women are more risk
averse than men is far from clear.
Indeed, the current finding that knowledge plays an important role than sex in risk-taking
behavior has supported by a number of studies. For example, Hartog et al. (2000), Hawley and Fujii
(1993), Lee and Hanna (1995a), Sung and Hanna (1996) find that education and risk tolerance are
positively related. Similarly, Haliassos and Bertaut (1995) have found that people may invest too
conservatively due to a lack of financial experience or expertise.
In another study, using data from a national survey of nearly 2000 mutual fund investors, Dwyer,
Gilkeson and List (2002) investigated whether investor gender is related to risk taking as revealed in
mutual fund investment decisions. Consistent with much of the extant literature, they find that women
exhibit less risk-taking than men in their most recent, largest, and riskiest mutual fund investment
decisions. However, more importantly, the impact of gender on risk taking is significantly weakened
when investor knowledge of financial markets and investments is statistically controlled. This result
suggests that the greater level of risk aversion among women frequently documented in the literature is in
large part a function of knowledge disparities.
Only recently have women entered the job market in Nepal in large numbers. Therefore, women
employees of banks are, on average, much younger than their male counterparts. In the current study
women respondents were on an average some 10 years younger than the men. As can be seen in Table 4,
the difference between average age of men and women was significant (p =.00). The fact that women are
younger and have been in the job market for fewer years affects their perception of themselves as less
Gender differences in risk aversion …11
knowledgeable about investments rendering them less confident of financial decisions and thus more risk
adverse.
Knowledge has been found to be an important determinant of risk tolerance. Therefore,
knowledge, acquired through either experience or education, is an important factor that is commonly
controlled for in the literature to assess gender effects (Watson & McNaughton, 2007). An individual who
has learned that risky investments generally lead to higher returns than conservative investments is more
likely to make risky investments. Riley and Chow (1992) found that investors with relatively less
education invested conservatively even when income was controlled. Olsen and Cox (2001) found that
"experience and level of expertise reduce, but usually do not eliminate risk-taking differences by gender
(p. 30)".
In surveys of college students at a large state university, Goldsmith and Goldsmith (1997) and
Goldsmith, Goldsmith, and Heaney (1997) found that men reported higher levels of financial knowledge
than women. This supports the findings of Dwyer et al. (2002) reported earlier.
Some psychological research on this topic provides a different perspective. Studies using
simulations of risky situations like military decision problems (Hudgens & Fatkin, 1985) and gambling
(Levin, Synder, & Chapman, 1988) have shown that women are more cautious than men. However, there
is some debate about whether gender differences in task familiarity drive these results. Levin et al. (1988)
pointed out that differences in observed behavior may be the result of gender-specific exposure and
experience.
All in all, the findings of the literature on finance and economics provide evidence that
knowledge not gender is the key determinant of risk-taking propensity. A number of recent studies have
used the Health and Retirement Study (HRS) data to examine both the sources and consequences of
decision-making power (e.g., Elder & Rudolph, 2003; Friedberg & Webb, 2006; Lyons, Neelakantan,
Fava, & Scherpf, 2007). Elder and Rudolph (2003) employed the “final say” question in the HRS to
identify the sources of decision-making power within households. They found that decisions were more
likely to be made by the spouse with greater financial knowledge, more education, and a higher wage,
irrespective of gender. Experience and expertise count more than sex.
Only a main effect for sex and marital status was obtained on risk tolerance indicating that
women, whether married or single, exhibit less risk-tolerance than men. Traditonally, in Nepalese
households, husbands and/or fathers make most of the financial decisions so wives and daughters remain
Gender differences in risk aversion …12
less knowledgeable about finances, rendering women uncomfortable taking financial risks. Another
explanation is that as shown in Table 3, more men than women in our sample are married (r = -.16, p<.05)
so even sex and marital status are not entirely independent.
CONCLUSION
The major finding of the current study, that women exhibit less financial risk tolerance than men
is apparently occasioned by a disparity in perceived knowledge about investments. Deaux and Emswiller
(1994) and Beyer and Bowden (1997) have noted that women are less confident and more risk averse in
domains considered masculine, regardless of their (equal) ability to perform. Men are represented in
greater numbers in financial markets than women (Merrill Lynch, 1996). In addition, women are likely to
be perceived as more conservative investors and therefore offered less risky investments by brokers
(Wang, 1994).
As we have seen earlier, psychological research has shown that men tend to be more
overconfident than women in areas like finance. Theory predicts that overconfident people trade
excessively. Barber and Odean (2001) tested this prediction using account data from a discount brokerage
firm and found that men traded 45% more than women. Trading reduced men's (risky) net returns by 2.65
percentage points a year compared to 1.72 percentage points for women.
There is a need for more specific and targeted financial education to help men and women with
their investment decisions. Men may need to be cautioned about the pitfalls of trading excessively, while
women may need guidance on how to make investment choices that carry a certain amount of risk to
obtain adequate growth.
Future research on risk tolerance that involves observation and analysis of actual behavior can
complement the findings of this study well.
Gender differences in risk aversion …13
REFERENCES
Bajtelsmit, V.L., & Vanderhei, J.L. (1997). Risk aversion and pension investment choices in positioning
pensions for the twenty-first century. Edited by M.S. Gordon, O.S. Mitchell, & M. M. Twinney.
Philadelphia, PA: University of Pennsylvania Press.
Barber, B. & Odean, T. (1999). Boys will be boys: gender overconfidence and common stock investment
University of California at Davis, Davis, CA., Working paper.
Barskey, R., Kimball, M. & Shapiro, M. (1996). Preference parameters and behavorial heterogeneity: An
experimental approach in the health and retirement survey. Working Paper Series (5667).
Barsky, R.B., Juster, F.T., Kimball, M.S. & Shapiro, M.D. (1997). Preference parameters and behavioral
heterogeneity: An experimental approach in the health and retirement study. Quarterly Journal of
Economics, 112 (2), 537-579.
Bernasek, A., & Shwiff S. (2001). Gender, risk, and retirement. Journal of Economic Issues, 35(2), 345-
356.
Beyer, S & Bowden, E. (1997). Gender differences in self-perceptions: convergent evidence from three
measures of accuracy and bias. Personality and Social Psychology Bulletin, 23, 157-172.
Bruce, A. & Johnson, J. (1994). Male and female betting behavior: new perspectives. Journal of
Gambling Studies, 10, 183-98.
Byrnes, J.P., Miller, D.C. & Schäfer, W.D. (1999). Gender differences in risk taking: A meta- analysis.
Psychological Bulletin, 125(3), 367-383.
Charness, G. & Gneezy, U. (2004). Gender difference in financial risk – taking. Retrieved September 10,
2007 from Web site: www.SSRN_ID648735_code96638.pdf.
Cohn, R. A., Lewellen, W.G., Lease, R.C., and Schlarbaum, G.G. (1975). individual investor risk
aversion and investment portfolio composition. Journal of Finance, 30(2), 605-620.
Daly, M., & Wilson, M. (2001). Risk-taking, intra-sexual competition, and homicide. Nebraska
Symposium on Motivation, 47, 1-36.
Gender differences in risk aversion …14
De Bondt, W.F.M. (1998). A portrait of the individual investor. European Economic Review, 42(3-5),
831-844.
Deaux, K., & Emswiller, T. (1974). explanations of successful performance on sex-linked tasks: What is
skill for the male is luck for the female. Journal of Personality and Social Psychology, XXIX,
80–85.
Dwyer, P.D., Gilkeson, J.H., & List, J.A. (2002). Gender differences in revealed risk taking: Evidence
from mutual fund investors. Economics Letters, 76( 2), 151-158.
Finucane, M.L., Flynn, J., Mertz, C.K., Satterfield, T.A. & Slovic, P. (2000). Gender, race, and perceived
risk: the 'White Male' effect. Health Risk and Society, 2(2), 159-1 72.
Flynn, J., Slovic, P. & Mertz, C.K. (1994). Gender, race and perception of environmental health risks.
Risk Analysis, 14(6 ), 1101-1108.
Grable, J. E., & Lytton, R. H. (1999). Financial risk tolerance revisited: The development of a risk
assessment instrument. Financial Services Review, 8, 163-181
Hanna, S.D. & Lindamood, S. (2004). An improved measure of risk aversion. Association for Financial
Counseling and Planning Education.
Hanna, S.D., Gutter, M.S., & Fan, J. X. (2001). A measure of risk tolerance based on economic theory.
Financial Counseling and Planning, 12 (2), 53-60.
Hartog, J., Carbonell, A.F. & Jonker, N. (2000). On a simple measure of individual risk aversion.
Tinbergen Institute Discussion Paper.
Hawley, C.B. & Fujii, E.T. (1993). An empirical analysis of preferences for financial risk: further
evidence on the Friedman-Savage model. Journal of Post Keynesian Economics, 16(2). 197-204.
Hersch, J. (1996). Smoking, seat belts, and other risky consumer decisions: Differences by gender and
race. Managerial and Decision Economics, 17(5), 471-481.
Hinz, R.P., McCarthy, D.D. & Turner, J.A. (1997). Are women conservative investors? Gender
differences in participant directed pension investments. In positioning pensions for the twenty-
Gender differences in risk aversion …15
first century. Edited by M.S. Gordon, O.S. Mitchell, and M.M. Twinney. Philadelphia, PA:
University of Pennsylvania Press.
Jaggia, S., & Thosar, S. (2000). Risk aversion and the investment horizon: A new perspective on the time
diversification debate. Journal of Psychology and Financial Markets, 1(3-4), 211-215.
Jianakoplos, N.A., & Bernasek, A. (1998). Are women more risk averse? Economic Inquiry, 36(4), 620-
630.
Johnson, J. E.V. & Powell, P. L., (1994). Decision making, risk and gender: Are managers different?
British Journal of Management 5 (2), 123-38.
Lee, H. & Hanna, S. (1995a). Empirical patterns of risk tolerance. Proceedings: Academy of Financial
Services.
Levin, I. P., Synder, M. A., & Chapman, D. P. (1988). The interaction of experiential and situational
factors and gender in a simulated risky decision-making task. The Journal of Psychology, 122(2),
173-181.
Lewellen, W., Lease, R., Schlarbaum, G. (1977). Patterns of investment strategy and behavior among
individual investors, Journal of Business, 50(3), 296-333.
Lyons, A. C., Neelakantan, U. & Scherpf, E. (2008). Gender and marital differences in wealth and
investment decisions: Implications for researchers, financial professionals, and educators.
Networks Financial Institute Working Paper No. 2008-WP-02.
Merril Lynch (1996). You and your money. A financial handbook for women investors, New York.
Mittal M. & Dhade A. (2007). Gender difference in investment risk taking: An empirical study. Icfai
Journal of Behavioral Finance, 4(2), 32-42.
Olsen, R.A., & Cox, C.M. (2001). The influence of gender on the perception and response to investment
risk: The case of professional investors. Journal of Psychology and Financial Markets, 2(1), 29-
36.
Powell, M. & Ansic, D. (1997). Gender differences in risk behaviour in financial decision-making: An
experimental analysis. Journal of Economic Psychology. 18, 605 – 628.
Gender differences in risk aversion …16
Riley, W., & Chow, K.V. (1992). Asset allocation and individual risk aversion. Financial Analysts
Journal, 48(6), 32-37.
Säve-Söderbergh, J. (2003). Essays on gender differences in economic decision-making. PhD thesis,
Stockholm University.
Sunden, A.E., & Surette, B.J. (1998). Gender differences in the allocation of assets in retirement savings
plans. American Economic Review, 88(2), 207-211.
Sung, J. & Hanna, S. (1996). Factors related to household risk tolerance: An ordered probit analysis.
Proceedings of the 42nd Annual Conference of the American Council on Consumer Interests,
221-228.
Wang, P. (1994). Brokers still treat men better than women. Money, 23 (6), 108-10.
Warner, N. & Cramer, S. (1995). Saving behavior. Journal of Consumer Studies and Home Economics,
19, 57-67.
Watson, J., & McNaughton, M. (2007). Gender differences in risk aversion and expected retirement
benefits. Financial Analysts Journal. 63(4)
Watson, J., & Robinson, S. (2003). Adjusting for risk in comparing the performances of male- and
female-controlled SMEs. Journal of Business Venturing, 18(6), 773-788.
Weber, E.U., Blais, A.R. & Betz, N.E. (2002). A domain-specific risk-attitude scale: Measuring risk
perceptions and risk behaviors. Journal of Behavioral Decision Making, 15, 263–290
Yao, R. (2007). Financial issues of Asian Americans. In Xiao, J. (Eds.), Advances in Consumer Finance
Research, (pp. 303-316).
Gender differences in risk aversion …17
APPENDIX: TABLES
Table 1 (a) ANOVAg
with Backward Elimination
Model Sum of Squares Df Mean Square F Sig.
1 Regression 41.0121 6 6.8353 1.5753 0.1609a
Residual 481.6257 111 4.3390
Total 522.6377 117
2 Regression 40.7126 5 8.1425 1.8923 0.1012b
Residual 481.9251 112 4.3029
Total 522.6377 117
3 Regression 40.0794 4 10.0199 2.3463 0.0588c
Residual 482.5583 113 4.2704
Total 522.6377 117
4 Regression 39.3609 3 13.1203 3.0949 0.0298d
Residual 483.2768 114 4.2393
Total 522.6377 117
5 Regression 38.4920 2 19.2460 4.57154 0.0123e
Residual 484.1457 115 4.2100
Total 522.6377 117
6 Regression 31.3623 1 31.3623 7.4052 0.0075f
Residual 491.2754 116 4.2351
Total 522.6377 117
a. Predictors: (Constant), knowledge, income, kids, sex, marital, age
b. Predictors: (Constant), knowledge, income, sex, marital, age
c. Predictors: (Constant), knowledge, income, sex, marital
d. Predictors: (Constant), knowledge, income, sex
e. Predictors: (Constant), knowledge, sex
f. Predictors: (Constant), knowledge
g. Dependent Variable: SRT
Table 1 (b). Coefficients
Unstandardized
Coefficients Standardized Coefficients t Sig.
B Std. Error Beta
(Constant) 3.1444 0.6579 4.7797 0.0000
Sex -0.4126 0.3201 -0.0981 -1.2889 0.1991
Income -0.0629 0.0826 -0.0550 -0.7619 0.4471
knowledge 0.4319 0.1320 0.2508 3.2719 0.0013
Predictors: (Constant), knowledge, income, sex
Dependent Variable: SRT
Gender differences in risk aversion …18
Table 2 (a). IRT SRT by sex (ANOVA)
Sum of
Squares df Mean Square F Sig.
IRT Between Groups 2.788 1 2.788 4.555 .034
Within Groups 112.615 184 .612
Total 115.403 185
SRT Between Groups 23.550 1 23.550 5.683 .018
Within Groups 816.393 197 4.144
Total 839.942 198
Table 2 (b). IRT SRT by knowledge (ANOVA)
Sum of Squares df Mean Square F Sig.
IRT Between Groups 9.901 6 1.650 2.849 .011
Within Groups 100.795 174 .579
Total 110.696 180
SRT Between Groups 68.754 6 11.459 2.904 .010
Within Groups 729.996 185 3.946
Total 798.750 191
Table 2 (c). IRT SRT by income (ANOVA)
Sum of Squares df Mean Square F Sig.
IRT Between Groups 3.156 6 .526 .842 .539
Within Groups 106.866 171 .625
Total 110.022 177
SRT Between Groups 24.682 6 4.114 .994 .431
Within Groups 748.876 181 4.137
Total 773.559 187
Gender differences in risk aversion …19
Table 3. Correlations
IRT SRT sex age
marital knowledg
e stock
IRT Pearson Correlation -.337** .155* .031 -0.038 -.280** -.180*
Sig. (2-tailed) .000 .034 .679 0.599 .000 .020
N 180 186 186 185 181 169
SRT Pearson Correlation -.337** -.167* .092 -0.038 .284** .126#
Sig. (2-tailed) .000 .018 .197 0.593 .000 .092
N 180 199 199 198 192 181
sex Pearson Correlation .155* -.167* -.361** -0.157* -.359** -.159*
Sig. (2-tailed) .034 .018 .000 0.024 .000 .030
N 186 199 206 205 199 188
age Pearson Correlation .031 .092 -.361** 0.519** .277** .049
Sig. (2-tailed) .679 .197 .000 0.000 .000 .508
N 186 199 206 205 199 188
marital Pearson Correlation -0.038 -0.038 -0.157* 0.519** 0.145* -0.013 Sig. (2-tailed) 0.599 0.593 0.024 0.000 0.041 0.860
N 185 198 205 205 198 187
knowledge Pearson Correlation -.280** .284** -.359** .277** 0.145* .272**
Sig. (2-tailed) .000 .000 .000 .000 0.041 .000
N 181 192 199 199 198 182
stock Pearson Correlation -.180* .126# -.159* .049 -0.013 .272**
Sig. (2-tailed) .020 .092 .030 .508 0.860 .000
N 169 181 188 188 187 182
**Correlation is significant at the 0.01 level (2-tailed)
*Correlation is significant at the 0.05 level (2-tailed) # Correlation is significant at the 0.10 level (2-tailed)
Table 4. Independent Samples Test for Differences in Age of Men and Women
Levene's Test for
Equality of
Variances t-test for Equality of Means
F Sig. t df Sig. (2-tailed)
age Equal variances assumed 27.6362 0.000 5.533 204 0.000
Equal variances not
assumed 6.133 203 0.000
Gender differences in risk aversion …20
Table 5 (a). Two-way ANOVA for interaction effects of sex and marital status on srt
Dependent Variable: srt
Source
Type III Sum
of Squares df
Mean
Square F Sig.
Corrected
Model 32.0830 3 10.6943 2.5857 0.0544
Intercept 3582.7731 1 3582.7731 866.2545 0.0000
sex 29.5660 1 29.5660 7.1486 0.0081
marital 5.3144 1 5.3144 1.2849 0.2584
sex * marital 0.2876 1 0.2876 0.0695 0.7923
Table 5 (b). Two-way ANOVA for interaction effects of sex and marital status on irt
Dependent Variable: irt
Source
Type III Sum
of Squares df
Mean
Square F Sig.
Corrected
Model 3.3203 3 1.1068 1.8179 0.1455
Intercept 911.2927 1 911.2927 1496.8609 0.0000
sex 3.1921 1 3.1921 5.2432 0.0232
marital 0.0199 1 0.0199 0.0327 0.8568
sex * marital 0.0231 1 0.0231 0.0379 0.8459