Embed Size (px)
Citation preview

Gender Differences in Investment Behavior*
Milestone 3 Report August 31, 2006
Please direct inquiries to:Tahira HiraIowa State University, President’s Office1750 Beardshear HallAmes, Iowa 50011-2035Phone: 515-294-2042, Fax: 515-294-0565E-mail: [email protected]äzilia LoiblThe Ohio State University, Department of Consumer Sciences1787 Neil Avenue, 265N Campbell HallColumbus, Ohio 43210 Phone: 614-292-4226; E-Mail: [email protected]
Presented to the NASD Investor Education Foundation
* Funded by NASD Investor Education Foundation Grants Program

Gender Differences in Investment Behavior
Table of Contents Executive summary....................................................................................................................... 1 1. Study objectives..................................................................................................................... 7
Procedures and methods ............................................................................................................. 7 2. Demographic and economic characteristics ..................................................................... 10
Demographic characteristics..................................................................................................... 10 Age............................................................................................................................................ 12 Race........................................................................................................................................... 13 Marital status............................................................................................................................. 14 Family size ................................................................................................................................ 15 Education .................................................................................................................................. 16 Economic characteristics .......................................................................................................... 17 Employment status.................................................................................................................... 19 Occupation ................................................................................................................................ 19 Household income .................................................................................................................... 21 Household assets....................................................................................................................... 22 Financial obligations................................................................................................................. 23
3. Investor financial management behavior ......................................................................... 24 Saving behavior ........................................................................................................................ 24 Daily money management ........................................................................................................ 26 Savings behavior during the past six months............................................................................ 27 Ownership of various savings and retirement accounts............................................................ 28 Investment behavior.................................................................................................................. 29 Household investment decision-maker ..................................................................................... 31 Investment activities over the past twelve months ................................................................... 32 Investment activities planned for the future six months ........................................................... 34 Willingness to take investment risk .......................................................................................... 35 Ownership in investment accounts ........................................................................................... 36
4. Investor actions ................................................................................................................... 37 Sources of investment information and the use of technology ................................................. 37 Sources of financial information............................................................................................... 37 Use of technology and computer-related investment tools....................................................... 40 Reasons for not using the Internet for investment purposes ..................................................... 41 Reasons for not using investment software .............................................................................. 43 Investment decision-making processes..................................................................................... 44 Actions taken before making investment decisions.................................................................. 44 Actions taken when investment results were below expectations ............................................ 46 Change in involvement in saving and investing over the years................................................ 48 Change in level of involvement in saving and investing .......................................................... 49 Change in involvement as a result of specific life events ......................................................... 50 Specific life events causing change in saving and investing involvement ............................... 51
5. Investor socialization .......................................................................................................... 52 Parents’ influence on money management ............................................................................... 52 Parents’ conversations about money......................................................................................... 54 Feeling financially secure in one’s family ................................................................................ 55
ii

Gender Differences in Investment Behavior
Parents’ and teachers’ influence on investment learning.......................................................... 57 6. Predictors of investor intention ......................................................................................... 59
Investment learning preferences ............................................................................................... 59 Attitudes and beliefs about investing........................................................................................ 61 Investor attitudes....................................................................................................................... 65 Investor perceived behavioral control....................................................................................... 66 Opinions toward financial advisors .......................................................................................... 68
7. Conclusion and implications .............................................................................................. 71 8. References............................................................................................................................ 77 9. Appendix .............................................................................................................................. 78
Telephone interview questionnaire ........................................................................................... 78 Telephone interview screening questions ................................................................................. 93
Tables Table 1: Demographic characteristics........................................................................................... 11 Table 2: Respondents’ socio-economic characteristics ................................................................ 17 Table 3: Respondents’ socio-economic characteristics continued................................................ 18 Table 4: Savings behavior............................................................................................................. 25 Table 5: Investment behavior characteristics................................................................................ 30 Table 6: Sources of financial information .................................................................................... 39 Table 7: Use of computer-related investment tools ...................................................................... 41 Table 8: Reasons for not using Internet for investment purposes................................................. 42 Table 9: Reasons for not using investment software .................................................................... 44 Table 10: Actions taken before making investment decisions...................................................... 46 Table 11: Actions taken when investment results were below expectations ................................ 47 Table 12: Change in involvement in saving and investing over the years.................................... 48 Table 13: One’s parents’ influence on money management......................................................... 53 Table 14: Parents’ conversations about money ............................................................................ 55 Table 15: Feeling financially secure in one’s family.................................................................... 56 Table 16: Parents’/teachers’ influence on investment learning .................................................... 58 Table 17: Learning about investing .............................................................................................. 61 Table 18: Investor beliefs.............................................................................................................. 64 Table 19: Investor attitudes........................................................................................................... 66 Table 20: Respondents’ perceived investment control ................................................................. 68 Table 21: Respondents’ experience with financial advisors......................................................... 70
iii

Gender Differences in Investment Behavior
Figures Figure 1: Age groups (in percent)................................................................................................. 12 Figure 2: Race (in percent) ........................................................................................................... 13 Figure 3: Marital status (in percent).............................................................................................. 14 Figure 4: Family size (in percent)................................................................................................. 15 Figure 5: Education (in percent) ................................................................................................... 16 Figure 6: Employment status (in percent)..................................................................................... 19 Figure 7: Occupation (in percent) ................................................................................................. 20 Figure 8: Household income categories (in percent) .................................................................... 21 Figure 9: Household assets (in percent)........................................................................................ 22 Figure 10: Financial obligations (in percent)................................................................................ 23 Figure 11: Daily money management (in percent) ....................................................................... 26 Figure 12: Savings or investment deposits in past six months (in percent).................................. 27 Figure 13: Ownership in banking products (“yes” responses in percent)..................................... 28 Figure 14: Investment decision maker (in percent) ...................................................................... 31 Figure 15: Investment activities of the previous twelve months (in percent)............................... 33 Figure 16: Investment activities of the future six months (“yes” responses in percent)............... 34 Figure 17: Willingness to take investment risk (in percent) ......................................................... 35 Figure 18: Ownership in investment accounts (in percent) .......................................................... 36 Figure 19: Sources of financial information ................................................................................. 38 Figure 20: Use of computer-related investment tools................................................................... 40 Figure 21: Reasons for not using Internet for investment purposes ............................................. 42 Figure 22: Reasons for not using investment software (“yes” responses in percent) ................... 43 Figure 23: Actions taken before making investment decisions .................................................... 45 Figure 24: Actions taken when investment results were below expectations............................... 47 Figure 25: Change in involvement in saving and investing (in percent) ...................................... 49 Figure 26: Changes in involvement as a result of unfolding events or critical incidences........... 50 Figure 27: Specific life events causing change in involvement (in percent) ................................ 51 Figure 28: One’s parents’ influence on money management (in percent).................................... 53 Figure 29: Parents’ conversations about money (“often” responses in percent) .......................... 54 Figure 30: Feeling financially secure in one’s family .................................................................. 56 Figure 31: Parents’/teachers’ influence on investment learning................................................... 57 Figure 32: Learning about investing ............................................................................................. 60 Figure 33: Investor beliefs (“agree” and “strongly agree” responses in percent)......................... 62 Figure 34: Investor beliefs continued (“agree” and “strongly agree” responses in percent) ........ 63 Figure 35: Investor attitudes (“agree” and “strongly agree” responses in percent) ...................... 65 Figure 36: Perceived behavioral control ....................................................................................... 67 Figure 37: Experience with financial advisors.............................................................................. 69
iv

EXECUTIVE SU
MM
ARY
Gender Differences in Investment Behavior*
EXECUTIVE SUMMARY

Gender Differences in Investment Behavior
Executive summary Study objectives The overall purpose of this research project is to gain knowledge about key factors that influence investment behavior and ways these key factors impact investment decision-making processes among men and women. It further explores types of educational processes and materials that can transform investment behaviors among women. To this end, the proposed research project consists of two distinct parts: (1) collection of data on key variables using a national random sample, followed by analysis of these data to produce results that can be generalized to all Americans; and (2) development of guidelines and approaches to develop gender-specific investment education materials. Unique features of the study The unique features of this study are: (a) a randomly selected national data set; (b) generalizability of the results to American investors; (c) empirical evidence for the roles personal and environmental factors play in influencing the investment behavior; (d) application of the transformative learning concept to explain how key personal and environmental factors interact through socialization and acculturalization, resulting in a gender-related view about teachable moments and investing; (e) the development of gender-specific investment educational guidelines and materials; and (f) the development of a new approach to investment education for adult women. Procedures This study is based on the responses of a randomly selected national sample of 911 U.S. households with annual household incomes of $75,000 or higher. The data were collected through telephone interviews conducted from October 2005 to February 2006 by trained staff of the Center for Survey Statistics and Methodology (CSSM) at Iowa State University. The average interview length was twenty-two minutes. Information was collected on various aspects of respondents’ investment behaviors, attitudes, and beliefs. The overall adjusted response rate for this study was 22%. Key findings Investor profile The average participant was highly educated, male, forty-nine years old, white, married, and living in a three-member household. He was employed full-time in a professional field and had an average annual household income of $126,290, average total assets of $1,129,477, and average financial obligations of $231,791. Only one-third of the respondents in the study were
1
Gender Differences in Investment Behavior
women. On average the women of this sample were highly educated, employed in professional fields, and had good salaries and large asset bases. Compared to their male counterparts, however, they had lower annual incomes, owned fewer assets, and faced greater financial obligations. Financial management behavior More women than men indicated that they were responsible for daily money management tasks; however, most of them seemed to be doing so in partnership with a spouse or partner. On the other hand, men who were involved in taking care of these tasks mostly did it on their own. A majority of the participants reported that they saved regularly during the past six months and that they had savings accounts, retirement accounts, and life insurance policies. Equal proportions of men and women indicated saving money during six months prior to the interview, but women were more likely to have Certificates of Deposit whereas more men had IRA accounts. Investment behavior A majority of the respondents said that they made investment decisions jointly with their spouse or partner and invested in stocks or stock mutual funds. About half of them had invested in money market mutual funds, bonds, or bond mutual funds. Almost all of the respondents indicated that they had reviewed their investment performance over the twelve months prior to the interview. About half of them had either increased the amount invested, changed the asset allocation, or consulted with financial advisors. Similarly, almost all of them suggested that during the next six months they would pay attention to how their investments performed. Gender differences in these areas were not significant, but the willingness to take risk varied significantly between men and women. A majority of the women in the study preferred taking average or below-average risks, whereas about half of the men preferred taking above-average or substantial investment risks. Investment information Financial advisors and print media were the major sources of financial information for this sample. Less frequently, respondents used personal computer-based investment tools primarily for investment analysis or management. While reluctance to use personal computers and the Internet is described often in the literature, we also inquired about the little-known reasons for this behavior. We learned that security concerns and confusing websites were the most common deterrents. More than half of respondents, however, said that they are simply not interested in using investment software. It became clear that a majority of participants preferred to talk to a person when making an investment decision. More women than men indicated preferences to receive their information from personal sources such as friends or colleagues. Men were more likely to report preferences to get information on their own. Women and men also differed in their use of computer-based investment tools, particularly the Internet. More men than women reported the use of computers and the Internet.
2

Gender Differences in Investment Behavior
Investment decision-making processes Most participants said evaluating risk was important before making an investment decision. Other criteria, mentioned by relatively fewer respondents, included investment returns, market conditions, other investment options, and investment goals. It was interesting to note that most participants preferred to “wait it out” when their investments did not produce expected returns. Men were more likely than women to make investment changes when an investment did not produce an expected return. On the other hand, more women than men were willing to wait it out when an investment did not produce expected results. Similarly, women were more likely than men to consult with an advisor. Involvement in investing Over half of the respondents reported that their involvement in saving and investment had gradually increased over the years. For some, however, investment involvement increased as a result of a critical life incident such as marriage, divorce, or the birth of a child. Women were more likely than men to have experienced a change in their involvement in investing due to a change in marital status, the arrival of a child, or the death of a family member. Men were more likely to increase their involvement due to retirement or sudden financial gain. For women, divorce was an important factor in bringing about increased financial involvement; for men, on the other hand, divorce was the least likely event to change their investment involvement. Sources of financial influence About one-third of the respondents identified either both parents or their fathers as the most important influence on their understanding of money management. Most participants recalled their parents talking about managing money, financial concerns, and the importance of saving, and as children, most respondents felt that their families were financially secure. However, when specifically asked who taught them about investing, very few participants mentioned their parents and teachers as strong influences. Instead, a large percentage of the respondents indicated that they enjoyed learning about investing and were particularly interested in getting this information from a personal contact. When parental influence was a factor, it differed by gender. Women often said that their mothers had the most important influence on their money management strategies. On the other hand, more men than women said were influenced by their fathers. Men also reported that teachers and other adults had an impact on their money management and investment decisions more often than women did.
Investment beliefs and learning preferences A majority of respondents felt responsible for their own financial well-being and believed financial security improves their lives. And while a large percentage of the respondents indicated
3

Gender Differences in Investment Behavior
that they enjoyed learning about investing, a majority also indicated that they find investing a satisfying but time-consuming experience. However, a gender difference was visible here: Women were less likely than men to say that they find investing exciting or satisfying. They also found making investment decisions more stressful, difficult, and time-consuming than men did. Fewer women than men described themselves as being confident or knowledgeable about investing, and far more men reported that they regularly review and compare their investment performances with market benchmarks. The single-most preferred means of learning about investments for both men and women was to consult with a financial advisor. Most respondents characterized financial advisors as information providers and good listeners, but again, the gender differences were pronounced. While women were more likely to describe financial advisors as sources of information and careful listeners, men were more likely to describe financial advisors as exerting too much pressure and charging too much for their services. Implications of the study In general, this survey raises more questions than it produces answers. However, it is these questions that provide guidance in establishing a shared context for learning and a focus for exploring the underlying beliefs held by women about the management of money and investments. For instance:
Fewer women than men participated in this survey. Does this reflect women’s lack of access to financial information or lack of authority to share this information? Or is it due to a lack of confidence?
Among the white participants the majority of respondents was men, but among African-Americans the majority was women. Are women of color more likely to assume control of money matters in their family? Are they more confident than white women? Is this indicative of the predominance of women of color as the family head of household? The issue of racial difference could have curricular and instructional implications and would be important to explore in greater depth in the educational program.
More women are in charge of daily money management than men. Educationally, it would be important to explore why women see daily money management as their responsibility. Also, as discussed in a later finding, there is a need to understand why long-term money management (investments) is less of a focus or interest for women.
Women prefer less risk than men when it comes to money matters. Educationally, it would be important to explore what participants mean by risk. What does it mean to experience no risk, below average risk, or average risk when it comes to money matters and investments?
A majority of the women reviewed performance of their investments over the last twelve months. What does reviewing performance mean? This seems open to a wide range of interpretations. It would be important to explore this behavior, and participants’ definitions of this term, in greater depth.
The regularity and timing of conversations about money with children needs further exploration. Do most people only talk about money when it is a problem? Do they
4

Gender Differences in Investment Behavior
regularly share the financial challenges of daily living with children? More importantly, how do we make money worries (crises, debts, etc) learning opportunities for both women and their children?
Many respondents prefer waiting when investments do not produce results. Why? This needs to be explored in greater depth in a workshop on investment education. Is this due to women’s more conservative approach to investing or due to a lack of understanding of how to respond? Curricular implications should include assessment strategies for low-performance investments and appropriate, timely, and responsible responses to those investments.
Women are less confident than men about their financial futures, about their knowledge of their retirement needs, and about their present financial situations. Women are more dependent than men on their spouses for financial security. About what areas/issues concerning money and investments they are least confident? This issue needs to be further explored.
Women find investing more stressful and less exciting than men. Why? What do women find so stressful about investing? It is likely to be related to their perception of risk?
In view of the discussion above, some dominant themes that begin to emerge. These themes will provide the basis for the further analysis and development of recommendations about general financial education materials and an investment educational program for women. Such materials and programs would need to be grounded in the everyday realities of the lives of the female learner. In other words, they need to be relevant, realistic and of interest to the needs of women. An investment educational program for women also needs to provide investment strategies that are responsive to their concerns and appreciative of the high demands they experience in their everyday lives. The educational materials must prepare women to be both critical of the available financial investments instruments and aware of their surroundings’ roles (e.g., family, culture, and media) in shaping their confidence and influencing their decisions about money matters and investments. The overall objective of the fourth phase of this study is to conduct further analysis to explore significant relationships among sets of variables such as socio-economic characteristics, socialization, beliefs, financial behaviors, investment decision-making processes, etc. to develop dominant themes. These themes will provide basis for the development of financial and investment educational programs, materials, and educational approaches to learning for investors in general but for women in particular. Next steps During the next study period (September 2006 - February 2007) the work will focus on the development of research-based educational guidelines, materials, and strategies. Specifically, the objectives for the next phase of the study (Milestone 4) can be divided into two areas: research and education.
5

Gender Differences in Investment Behavior
Research Determine how personal characteristics, such as age, marital status, education,
employment status, occupation, job position, and environmental forces affect investment behavior and the investment decision-making process;
Provide empirical evidence to show that socialization and acculturalization play significant roles in one’s ability and comfort in making financial decisions, and show how socialization and acculturalization impact the level of knowledge, information, experience, and confidence necessary to make investment decisions;
Analyze whether, when, and to what extent women make long-term financial decisions independently;
Describe the roles that male partners play in investment decision-making; Determine the factors (such as socialization, investment information/knowledge,
experiences, and investor confidence) that may help explain why gender differences in financial and investment behaviors exist.
Education
Explain how research results can guide investment education to be effective in
influencing investment behavior among women and identify the learning environment that is conducive to enhance investment learning among female investors;
Identify teachable moments and appropriate strategies to use those moments to effectively teach key investment topics;
Use the concept of transformative pedagogy to propose a new approach to investment education;
Develop inquiry-based educational, instructional, and learning materials and strategies, particularly to meet the needs of women investors.
6
STUDY O
BJECTIVES
Gender Differences in Investment Behavior*
STUDY OBJECTIVES

Gender Differences in Investment Behavior
1. Study objectives Specific goals of this project are to: (1) identify significant personal and environmental factors that influence investment behavior and specify the investment decision-making process, particularly with respect to female investors; (2) explain how significant personal and environmental factors interact through socialization and acculturalization and, in turn, result in a gender-related view—a general frame of reference—about investing; (3) use the results of this research to identify teachable moments and the related key investment educational topics; and (4) use the results of this study and the concept of transformative pedagogy to propose a new approach to investment education. A discussion of preliminary results indicating differences between men’s and women’s financial and investment behaviors is the main focus of this report, which is part of the Milestone 3 progress reports. Procedures and methods Sample The project sample consisted of households with listed telephone numbers in targeted geographical areas with average household incomes of $100,000 per year. Eligible households consisted of primary residences with household incomes of $75,000 or more, as determined in the screening process. This strategy was based on the likelihood that there would be a greater percentage of investors found in households with higher annual incomes. In order to increase the probability of including minority households in the study, the sample also included areas with at least 30% African-American, Asian, or Hispanic populations. A national randomized sample of 7,500 telephone numbers was purchased from Survey Sampling International (see www.surveysampling.com). The first sample purchased included 6,000 numbers. Since natural disasters in Louisiana, Mississippi, and Florida (Hurricanes Katrina and Rita) coincided with the onset of data collection (October 17, 2005), the households selected in those areas were either deleted from the sample (Louisiana, Mississippi, and surrounding coastal areas) or were contacted later during the survey (Florida). Survey Instrument Particular emphasis was given to the development of the survey instrument. The analysis of the literature in the first project progress report (submitted on August 31, 2005) had already identified previously conducted research on investment behaviors. Particular consideration was given to the Self-Directed Learning Readiness Scale; the standard measures of the Transtheoretical Model of Change; the Market Knowledge Questions of the NASD Investor Literacy Research; the Jumpstart 2004 Personal Finance Survey; and the Merrill Lynch Investment Managers Survey.
7

Gender Differences in Investment Behavior
The greatest focus in this pre-data collection phase was the development of new survey items to specifically address research concerns. During the process, detailed attention was paid to the selection of survey items, word choices, and item ordering, which are major factors of a successful phone interview (Groves 2004, p. 227-235). The Iowa State University Center for Survey Statistics and Methodology (the Center) staff sought feedback from local investors and financial advisors and conducted fifteen pre-tests before the final survey draft was completed on September 27, 2005. The survey instrument included a total of thirty-eight questions, which addressed the following five guiding themes of our analysis: (a) demographic and economic characteristics; (b) financial management behavior; (c) sources of investment information and the investment decision-making process; (d) investor socialization/parents’ influence on respondents’ money management and investing; and (e) predictors of investor intentions including respondents’ investment-learning preferences, investor beliefs, attitudes, perceived behavioral control, and opinions about investment advisors. Telephone survey topics included items on the investors’ economic and socio-demographic characteristics, investment characteristics, information technology use, financial planning, investment behaviors, and attitudes. Once the final survey draft was developed, the questionnaire was programmed for computer-assisted-telephone-interviewing (CATI) using Blaise 4.6 software and tested for accuracy by the Center, which conducted the telephone survey using a targeted, randomly selected, national white pages phone directory sample. Once the survey procedure, instruments, and materials were finalized, the project was reviewed by the Iowa State University Institutional Review Board and approved for data collection on October 13, 2005. Resistance to participation due to the survey topic became a significant concern to the researchers during the survey pre-tests. In order to augment survey compliance, four significant adjustments were made to the original study design described in the grant proposal: (1) The national random-digit-dial sample design that was originally described in the grant proposal was replaced with a targeted white pages phone directory sample design. By using a white pages sample, researchers were able to contact potential participants with an advance letter prior to attempted telephone contacts and higher income households could be targeted to increase the probability of locating households with investors. (2) The survey length was reduced from the thirty-minute length originally proposed in the grant proposal. On average, the interview itself (not including screening items) took twenty-two minutes. (3) The participation incentive was increased from $10 to $20 to achieve a higher response rate. (4) Finally, as a practical matter, it was acknowledged that either the targeted goal of 1,000 completed interviews or the original timeline might need to be amended. This proved to be the case and the project timeline only allowed the completion of 911 interviews despite major efforts to achieve the goal. Data collection The Center was responsible for recruitment, training, and supervision of telephone interviewers. Center professional staff and the principal investigator collaborated in presenting training sessions for twenty-one telephone interviewers. Interviewers were trained in appropriate techniques for screening households, identifying selected respondents and for the interviewing process itself. Question-by-question specifications for each survey item were reviewed with staff as part of the training protocol. A manual with interviewing procedures and question-by-question
8

Gender Differences in Investment Behavior
specifications was developed and used both for training and for reference throughout the interviewing process. Project training was conducted on October 3, 2005 and interviewers then participated in practice sessions until the beginning of data collection on October 17, 2005. Advance letters were sent to each sampled household prior to telephone contact in order to explain the purpose and nature of the project and to encourage participation. Data collection ended on February 24, 2006.
Completed interviews were edited by project staff to check for consistency and were re-coded as needed. A data file was constructed and frequencies and cross tabulations were analyzed to identify and correct entry or coding errors.
9

DEMO
GRAPHICS AN
D ECON
OM
IC CHARACTERS
Gender Differences in Investment Behavior*
DEMOGRAPHICS AND ECONOMIC CHARACTERS
Gender Differences in Investment Behavior
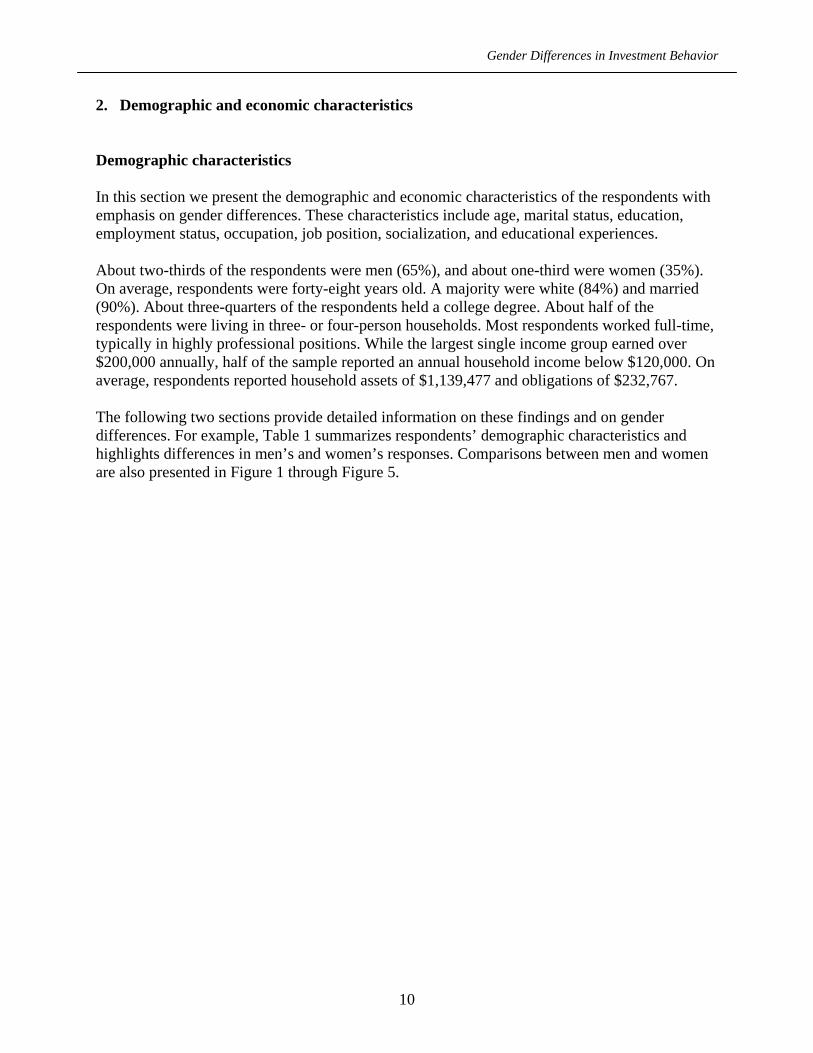
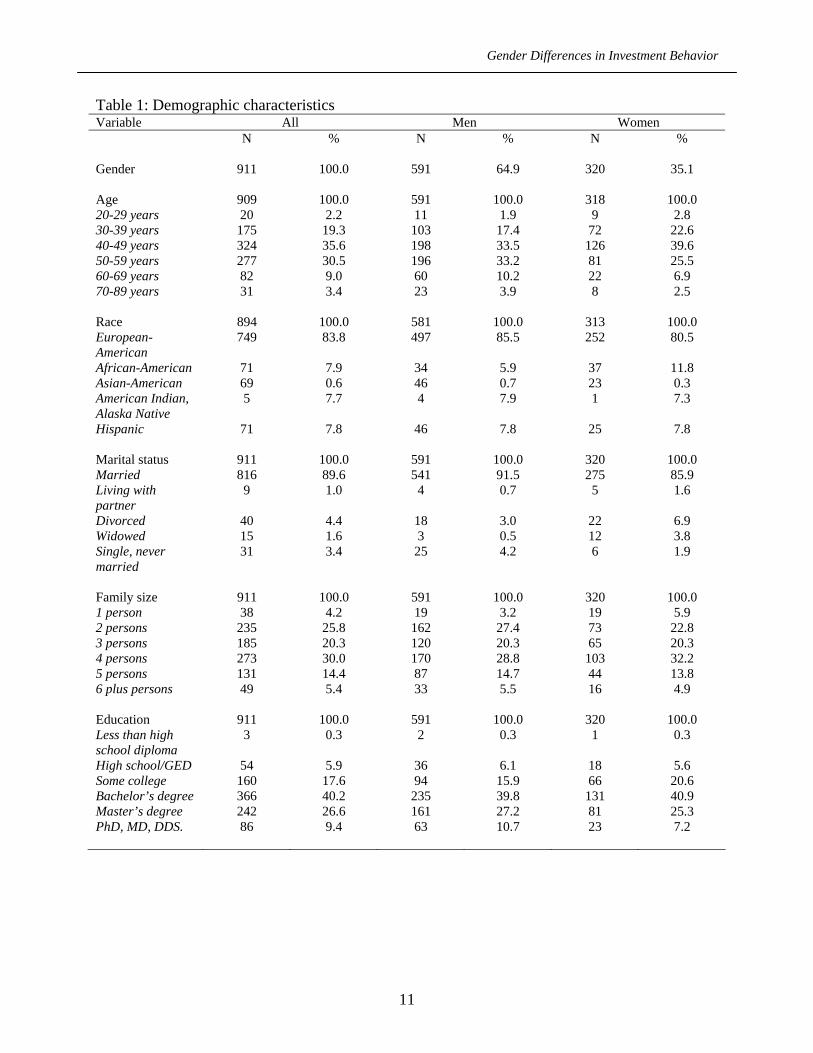
2. Demographic and economic characteristics Demographic characteristics In this section we present the demographic and economic characteristics of the respondents with emphasis on gender differences. These characteristics include age, marital status, education, employment status, occupation, job position, socialization, and educational experiences. About two-thirds of the respondents were men (65%), and about one-third were women (35%). On average, respondents were forty-eight years old. A majority were white (84%) and married (90%). About three-quarters of the respondents held a college degree. About half of the respondents were living in three- or four-person households. Most respondents worked full-time, typically in highly professional positions. While the largest single income group earned over $200,000 annually, half of the sample reported an annual household income below $120,000. On average, respondents reported household assets of $1,139,477 and obligations of $232,767. The following two sections provide detailed information on these findings and on gender differences. For example, Table 1 summarizes respondents’ demographic characteristics and highlights differences in men’s and women’s responses. Comparisons between men and women are also presented in Figure 1 through Figure 5.
10
Gender Differences in Investment Behavior
Table 1: Demographic characteristics Variable All Men Women N % N % N % Gender 911 100.0 591 64.9 320 35.1 Age 909 100.0 591 100.0 318 100.0 20-29 years 20 2.2 11 1.9 9 2.8 30-39 years 175 19.3 103 17.4 72 22.6 40-49 years 324 35.6 198 33.5 126 39.6 50-59 years 277 30.5 196 33.2 81 25.5 60-69 years 82 9.0 60 10.2 22 6.9 70-89 years 31 3.4 23 3.9 8 2.5 Race 894 100.0 581 100.0 313 100.0 European-American
749 83.8 497 85.5 252 80.5
African-American 71 7.9 34 5.9 37 11.8 Asian-American 69 0.6 46 0.7 23 0.3 American Indian, Alaska Native
5 7.7 4 7.9 1 7.3
Hispanic 71 7.8 46 7.8 25 7.8 Marital status 911 100.0 591 100.0 320 100.0 Married 816 89.6 541 91.5 275 85.9 Living with partner
9 1.0 4 0.7 5 1.6
Divorced 40 4.4 18 3.0 22 6.9 Widowed 15 1.6 3 0.5 12 3.8 Single, never married
31 3.4 25 4.2 6 1.9
Family size 911 100.0 591 100.0 320 100.0 1 person 38 4.2 19 3.2 19 5.9 2 persons 235 25.8 162 27.4 73 22.8 3 persons 185 20.3 120 20.3 65 20.3 4 persons 273 30.0 170 28.8 103 32.2 5 persons 131 14.4 87 14.7 44 13.8 6 plus persons 49 5.4 33 5.5 16 4.9 Education 911 100.0 591 100.0 320 100.0 Less than high school diploma
3 0.3 2 0.3 1 0.3
High school/GED 54 5.9 36 6.1 18 5.6 Some college 160 17.6 94 15.9 66 20.6 Bachelor’s degree 366 40.2 235 39.8 131 40.9 Master’s degree 242 26.6 161 27.2 81 25.3 PhD, MD, DDS. 86 9.4 63 10.7 23 7.2
11

Gender Differences in Investment Behavior
Age It is evident from the information presented in Table 1 and Figure 1 that a majority of the respondents (67%) were between forty and sixty years old. Almost two-thirds of the women (64%) were under the age of fifty, while just slightly over half of the men (52%) were under the age of fifty. The largest concentration of women (39%) was between forty and forty-nine years old, while the largest concentrations of men (33% for both) were between forty and forty-nine years old and fifty and fifty-nine years old respectively.
Figure 1: Age groups (in percent)
0
10
20
30
40
50
20-29 yrs. 30-39 yrs. 40-49 yrs. 50-59 yrs. 60-69 yrs. 70-89 yrs.
All Men Women
12

Gender Differences in Investment Behavior
Race Participants were asked to identify their race by selecting one of the following options: White; Black/African-American; American Indian, Alaskan Native; Asian; or another race. As can be seen in Figure 2, the majority of the respondents in this study were white (82.2%), with a slightly larger percentage of men (86%) than women (81%) being white. Figure 2 also shows that the percentage of Asian Americans (m: 8%; w: 7%) and Native Americans (m: 1%; w: 0.5%) were similar for both men and women. However, it is noteworthy that the number of African-American female respondents was twice as high as African-American male respondents (m: 6%; w: 12 %.).
Figure 2: Race (in percent)
0
10
20
30
40
50
60
70
80
90
100
European-American African-American Asian-American American Native
All Men Women
13

Gender Differences in Investment Behavior
Marital status To indicate their marital status, participants could choose among the following options: married; living as married; divorced; widowed; or single, never married. Overall, the majority of the respondents were married (89.6%). More men (92%) were married than women (86%). A slightly higher percentage of the men were also single (4%) when compared with the women (2%). A larger percentage of the female respondents reported being divorced (7%) or widowed (4%) compared with the males who reported being divorced (3%) or widowed (1%). Only 1% of the respondents reported living with a partner (presumably not married); of these, more were women (1.6%) than men (0.7%).
Figure 3: Marital status (in percent)
0
10
20
30
40
50
60
70
80
90
100
Married Living with apartner
Divorced Widowed Single, nevermarried
All Men Women
14

Gender Differences in Investment Behavior
Family size To capture information on the size of respondents’ households, each respondent was asked to provide the total number of people living in his or her household, including dependent children away at college. Information presented in Table 1 and Figure 4 shows that about one-third (30.0%) of the respondents lived in four-person households. The second largest group (25.8%) reported living in two-person households. A slightly lower percentage of the respondents lived in three-person households (20.3%). A smaller percentage (14.4%) lived in larger households of five, and a very small percentage of the respondents (5.4%) reported living in households with six or more members. It is evident from the information presented in Figure 4 that the size of households varied by gender of the respondent. The percentage of men who lived in households of five persons or more was slightly larger than women (m: 20.2%, w: 18.7%). On the other hand, a slightly larger percentage of women lived in four-person households (w: 32.2%; m: 28.8%), and twice as many women reported living in one-person households (w: 5.9%, m: 3.2%).
Figure 4: Family size (in percent)
0
10
20
30
40
50
1 person 2 persons 3 persons 4 persons 5 persons 6 plus persons
All Men Women
15

Gender Differences in Investment Behavior
Education The survey instrument requested information about the highest level of schooling that participants of this study had completed. Possible answers included less than high school diploma, high school diploma (includes GED), some college but no four-year degree, Bachelor’s degree, Master’s degree, and PhD, MD, DDS, etc. A majority (76.2%) of the participants in this sample had at least a Bachelor’s degree. A very small percentage of the total sample (6.2%) indicated that they had a high school degree (including GED) or less. Gender differences in levels of education for most categories were not that pronounced. The exception was noted amongst those who reported some college or a professional degree. A larger percentage of women (20.6%) than men (15.9%) reported having had some college without having graduated with a four-year degree. On the other hand, a higher percentage of men (10.7%) than women (7.2%) reported that they had a professional degree. Well over a quarter of the respondents had Masters’ degrees; however, a larger percentage of men (27.2%) than women (25.3%) were found in this category. Slightly more than 9% of the respondents had post-Masters’ degrees, and once again a slightly larger percentage of men (10.7%) than women (7.2%) held these higher education degrees.
Figure 5: Education (in percent)
0
10
20
30
40
50
Less than highschool
High school Some college Bachelor'sdegree
Master's degree Ph.D., M.D.,D.D.S., etc.
All Men Women
16

Gender Differences in Investment Behavior
Economic characteristics The survey instrument also included questions about respondents’ occupations, employment levels (full- or part-time), and their household incomes. The following sections provide detailed information on these findings, and also highlight the gender differences. Specifically, Table 2 provides detailed information about employment status and occupations, whereas Table 3 details information about respondents’ household incomes, total assets and total obligations. Figure 6 through Figure 10 illustrate the details regarding these variables for the total sample and for each gender. Table 2: Respondents’ socio-economic characteristics Variable All Men Women N % N % N % Employment status 911 100.0 591 100.0 320 100.0 Employed full-time 686 75.3 494 83.6 192 60.0 Employed part-time 82 9.0 25 4.2 57 17.8 Retired 89 9.8 64 10.8 25 7.8 Not currently employed 54 5.9 8 1.4 46 14.4 Occupation 910 100.0 590 100.0 320 100.0 Professional 372 40.9 227 38.5 145 45.3 Business and Finance Management
155 17.0 111 18.8 44 13.8
Other Management 84 9.2 59 10.0 25 7.8 Technical 114 12.5 95 16.1 19 5.9 Sales 79 8.7 48 8.1 31 9.7 Administrative Support 38 4.2 10 1.7 28 8.8 Construction and Maintenance
27 3.0 23 3.9 4 1.3
Operative 5 0.5 4 0.7 1 0.3 Service Occupations 20 2.2 12 2.0 8 2.5 Homemaker 16 1.8 1 0.2 15 4.7
17

Gender Differences in Investment Behavior
Table 3: Respondents’ socio-economic characteristics - continued Variable All Men Women N % N % N % Annual household income
843 100.0 550 100.0 293 100.0
$75k-$80k 84 10.0 51 9.3 33 11.3 $80k-$90k 113 13.4 72 13.1 41 14.0 $90k-$100k 104 12.3 66 12.0 38 13.0 $100k-$110k 63 7.5 45 8.2 18 6.1 $110k-$120k 76 9.0 52 9.5 24 8.2 $120k-$130k 64 7.6 43 7.8 21 7.2 $130k-$140k 51 6.0 36 6.5 15 5.1 $140k-$150k 63 7.5 35 6.4 28 9.6 $150k-$160k 27 3.2 21 3.8 6 2.0 $160k-$170k 18 2.1 11 2.0 7 2.4 $170k-$180k 31 3.7 24 4.4 7 2.4 $180k-$190k 10 1.2 7 1.3 3 1.0 $190k-$200k 23 2.7 13 2.4 10 3.4 $200k and higher 116 13.8 74 13.5 42 14.3 Total Assets 819 100.0 540 100.0 279 100.0 $125k or less 15 1.9 9 1.7 6 2.2 $125k-$250k 66 8.1 38 7.0 28 10.0 $250k-$500k 225 27.5 140 25.9 85 30.5 $500k-$1m 282 34.4 185 34.3 97 34.7 $1m-$2m 154 18.8 108 20.0 46 16.5 $2m and higher 77 9.4 60 11.1 17 6.1 Total Obligations 868 100.0 566 100.0 302 100.0 $100k or less 254 29.3 173 30.6 81 26.8 $100k-$200k 254 29.3 159 28.1 96 31.8 $200k-$300k 168 19.4 119 21.0 49 16.2 $300k-$400k 74 8.5 41 7.2 33 11.0 $400k-$500k 51 5.9 35 6.2 16 5.3 $500k and higher 66 7.6 39 6.9 27 8.9
18

Gender Differences in Investment Behavior
Employment status Respondents were asked to report their employment status at the time of their participation in the study. To provide their responses they could select one of the following options: employed full time; employed part-time; or not employed/retired. A majority of the respondents was employed full-time (75.3%). However, a much larger percentage of men than women were fully employed (m: 83.6%, w: 60%). On the other hand, a much larger percentage of women were employed part-time (w: 17.8%, m: 4.2%) or unemployed (w: 14.4%, m: 1.4%). And among the 10% retirees, more were men (10.8%) than women (7.8%).
Figure 6: Employment status (in percent)
0
10
20
30
40
50
60
70
80
90
100
Full time Part time Retired Not employed
All Men Women
Occupation Respondents were asked to provide information about their current occupations and, if retired or unemployed, their previous occupation. Information provided about their occupations was grouped in nine occupational categories that are recognized by the Department of Labor: professional, business and finance management, other management, technical, sales, administrative support, construction and maintenance, service occupations and homemaker. Detailed information on respondents’ occupations is presented in Table 2.
19

Gender Differences in Investment Behavior
As can be seen in Table 2, slightly less than half (40.9%) of the respondents were in professional occupations. They were engineers, physicians, attorneys, teachers, and architects. Slightly more than a quarter (26.2%) indicated that they held managerial positions such as financial analysts, accountants, executives, educational administrators, and managers. A small percentage of the respondents (12.5%) indicated that they held technical positions such as programmers, technicians, therapists or inspectors. As can be seen from the information presented in Figure 7 below, there were notable differences between the occupations of men and women in the study. The percentage of women employed in the professional occupational category (45.3%) was slightly higher than that of men (38.5%). On the other hand, more men (16.1%) than women (5.9%) were working in the technical fields. Information presented in Figure 7 (see Table 2) shows a few more occupational differences between genders. For example, more women than men worked in service occupations, administration, and sales. More men than women were employed in the fields of operation, construction, management, and business and finance.
Figure 7: Occupation (in percent)
0
10
20
30
40
50
Profess
ional
Busine
ss & Fina
nce
Technic
al
Other M
anag
emen
tSale
s
Admini
strati
on
Homem
aker
Constr
uctio
n
Service
Operat
ive
All Men Women
20

Gender Differences in Investment Behavior
Household income In order for people to qualify to participate in this survey they had to have a household income of $75,000 or higher. Household income was the sum of income from all sources including income employment, social security, investments, and interest for all members of the household. Respondents were able to provide income information by selecting one of fourteen income categories. Table 2 provides detailed information about these categories, which start with an income of $75,000 and build to more than $200,000 a year. Figure 8 represents information about the percentage of respondents who selected one of these fourteen income categories. As can be seen from Table 2, a majority of the respondents (73.3%) reported household incomes between $75,000 and $150,000. However, 14% of the respondents were in highest income category, more than $200,000 annually. Almost similar percentages of the respondents (13.4%) identified their household incomes as between $80,000 and $90,000. Gender differences were notable on both ends of the income scale. On the one hand, a slightly larger percentage of women (38.3%) than men (34.4%) reported an annual household income of $100,000 or less, but on the other hand, slightly more women (17.7%) than men (15.9%) also reported their household income to be $200,000 or higher. Finally, a larger percentage of men (49.7%) than women (44.0%) reported their household income to be between $100,000 and $200,000.
Figure 8: Household income categories (in percent)
0
5
10
15
20
25
$75k
-$80k
$80k
-$90k
$90k
-$100
K
$100
k-$11
0K
$110
k-$12
0K
$120
k-$13
0k
$130
k-$14
0k
$140
k-$15
0k
$150
k-$16
0k
$160
k-$17
0k
$170
k-$18
0k
$180
k-$19
0k
$190
k-$20
0k
more th
an $2
00k
All Men Women
21

Gender Differences in Investment Behavior
Household assets The survey instrument also included a question about respondents’ households’ total gross assets including financial assets as well as homes and other real estate. For the purpose of this study the term financial assets refers to assets such as savings accounts, Certificates of Deposit, stocks, bonds, cash-value life insurance, mutual funds, etc. Respondents were asked to estimate the total overall value of all assets in dollars. The information thus provided was grouped in six asset categories: $125,000 and less; $125,000 to $250,000; $250,000 to $500,000; $500,000 to $1 million; $1 million to $2 million; and $2 million and more. Figure 9 represents detailed information regarding the distribution of all respondents in these categories. Total value of assets varied from $5,000 to $20 million, representing a wide spread. About one-third of the respondents (34.4%) reported their household assets of $0.5 to $1 million. Gender differences in the total value of household assets are quite notable. The mean value of total assets is higher among men ($1,192,039) than women ($1,037,746). A significantly larger percentage of men (31.1%) than women (22.6%) reported total household assets over $1 million. An observation of the information presented in Table 2 and Figure 9 shows that a larger percentage of women than men were found in the asset categories ranging from less than $125,000 to $1 million. On the other hand, a larger percentage of men than women reported assets that fell into the higher asset categories, ranging from $1 to $2 million and over $2 million.
Figure 9: Household assets (in percent)
0
10
20
30
40
50
$.125 and less $.125m-$.25m $.25m-$.5m $.5m-$1m $1m-$2m $2m plus
All Men Women
22

Gender Differences in Investment Behavior
Financial obligations The final question in this section inquired about participants’ financial obligations. Respondents were asked to provide information about total household obligations including any mortgages, loans, and credit card debt. Information provided in response to this item was grouped in six categories ranging from less than $100,000 and to more than $500,000. Detailed information regarding households’ total debt is presented in Table 2 and Figure 10. The financial obligations for participants of this study ranged from a low of no debt at all to a high of $2.5 million. However, over half of the respondents were found in the two debt categories: less than $100,000 (29.3%) and between $100,000 and $200,000 (29.3%). The mean value of financial obligations was slightly higher for women ($245,872) than men ($224,278). Similarly, the percentage of women was higher than men in three of the six total obligations categories: $100,000 to $200,000; $300,000 to $400,000; and $500,000 and higher.
Figure 10: Financial obligations (in percent)
0
10
20
30
40
50
100k and less 100-200k 200-300k 300-400k 400-500k 500k plus
All Men Women
23
INVESTO
R FINAN
CIAL MAN
AGEM
ENT BEHAVIO
R
Gender Differences in Investment Behavior*
INVESTOR FINANCIAL MANAGEMENT BEHAVIOR

Gender Differences in Investment Behavior
3. Investor financial management behavior In this section, we describe respondents’ regular savings and investment behavior. Overall, we found that the majority of respondents were involved in daily money management, saved regularly, and were well-equipped with regular banking products, such as checking accounts, retirement accounts, and life insurance. In particular, we found that the women of our sample took on more responsibility for daily money management whereas the men were the investment decision-makers. Men were more active investors than the women in our sample with respect to changing sums invested, reviewing performances, and altering asset allocations. Likewise, the men of our sample reported a higher financial risk tolerance. Women said more often that they consult with an advisor. The ownership of savings and investment vehicles mirrors these differences between men and women. The following sections provide detailed information on investor financial management behavior as well as the specific results for men and women. Table 4 and Table 5 present the statistics of these measures for the full sample and break down the statistics for men and women, respectively. Figure 11 through Figure 18 illustrate the findings. Saving behavior The questions in this section inquired about respondents’ management of their personal finances, their savings regularity, and their asset holdings. Overall we found that 73.8% of respondents were responsible for daily money management, either on their own or in shared capacity with their spouses or partners. Likewise, 79.8% of respondents saved or invested money every month during the past six-month period and were well-equipped with banking products such as checking accounts, retirement accounts, and insurance products. The following sections provide detailed information on these findings as well as the specific results for men and women. Table 4 presents the saving behavior of the full sample as well as details for men and women, respectively. Figure 11 to Figure 13 illustrate the findings.
24

Gender Differences in Investment Behavior
Table 4: Saving behavior Variable All Men Women N % N % N % Daily money management 911 100.0 544 100.0 280 100.0 Respondent 393 47.7 226 41.5 167 59.6 Spouse or partner 216 26.2 169 31.1 47 16.8 Both of them 215 26.1 149 27.4 66 23.6 Past 6-month saving regularity
911 100.0 591 100.0 320 100.0
none 66 7.2 42 7.1 24 7.5 1 or 2 months 51 5.6 30 5.1 21 6.6 3 to 5 months 67 7.4 41 6.9 26 8.1 6 months 727 79.8 478 80.9 249 77.8 Asset types (“yes” responses)
Savings account 844 92.6 541 91.5 303 94.7 Certificates of deposit 309 34.1 181 30.7 128 40.4 Employer-provided retirement account
795 87.4 516 87.3 279 87.5
Personal IRA or Keogh account
649 71.4 436 74.0 213 66.6
Annuities 273 30.2 166 28.2 107 33.9 Cash-value life insurance 592 65.9 374 63.6 218 70.3 Other financial assets 67 7.4 43 7.3 24 7.5
25
Gender Differences in Investment Behavior
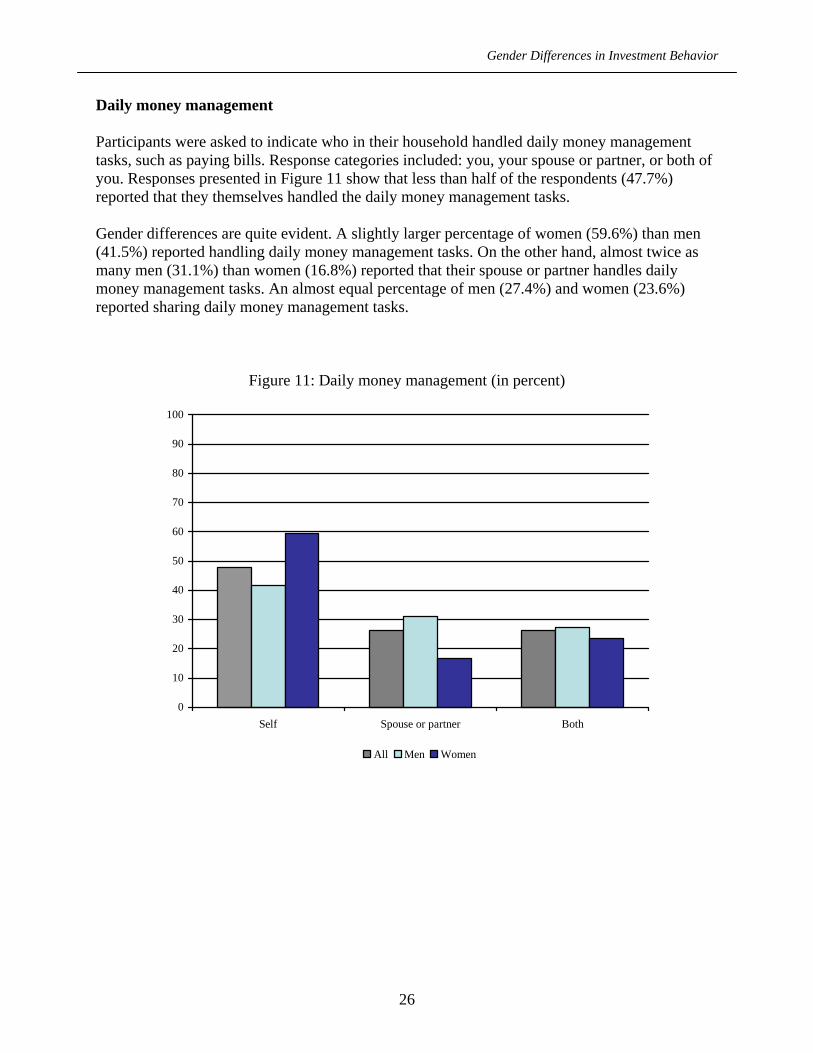
Daily money management Participants were asked to indicate who in their household handled daily money management tasks, such as paying bills. Response categories included: you, your spouse or partner, or both of you. Responses presented in Figure 11 show that less than half of the respondents (47.7%) reported that they themselves handled the daily money management tasks. Gender differences are quite evident. A slightly larger percentage of women (59.6%) than men (41.5%) reported handling daily money management tasks. On the other hand, almost twice as many men (31.1%) than women (16.8%) reported that their spouse or partner handles daily money management tasks. An almost equal percentage of men (27.4%) and women (23.6%) reported sharing daily money management tasks.
Figure 11: Daily money management (in percent)
0
10
20
30
40
50
60
70
80
90
100
Self Spouse or partner Both
All Men Women
26

Gender Differences in Investment Behavior
Savings behavior during the past six months Participants were asked to think about the past six months and respond to the question, “How many of those months did you put money into some type of investment or savings account?” Possible responses included: none, one or two months, three to five months, and all six months. Figure 12 shows that a majority of the respondents (79.8%) reported that they had saved or invested money in every one of the six months prior to the interview. However, a slightly higher percentage of men (80.9%) than women (77.8%) reported saving or investing in every month during the last six-month period. A very small percentage (7.2%) reported not having saved in any of the months, 5.6% of respondents reported saving for one or two months, and 7.4% reported saving for three to five months.
Figure 12: Savings or investment deposits in past six months (in percent)
0
10
20
30
40
50
60
70
80
90
100
None 1 or 2 months 3 to 5 months All 6 months
All Men Women
27

Gender Differences in Investment Behavior
Ownership of various savings and retirement accounts Respondents were also asked if they had any of the following accounts: savings accounts, certificates of deposit, employer-provided retirement accounts, IRA or Keogh accounts, annuities, or cash-value life insurance. Detailed information regarding savings and retirement accounts is presented in Table 4, and Figure 13 shows that a large majority of the respondents had savings accounts (92.6%) and employer-sponsored retirement accounts (87.4%). A much smaller percentage of respondents reported having CDs or annuities. It is evident from the information presented below that a larger percentage of women than men were likely to report having savings accounts (m: 91.5%; w: 94.7%), certificates of deposit (m: 30.7%; w: 40.4%), annuities (m: 28.2%; w: 33.9%), and life insurance with cash value (m: 63.6%; w: 70.3%). On the other hand, a much larger percentage of men reported having an IRA/Keogh plan (m: 74.0%; w: 66.6%).
Figure 13: Ownership in banking products (“yes” responses in percent)
0
10
20
30
40
50
60
70
80
90
100
Savingsaccount
CDs Retirementaccount at work
IRA or Keogh Annuities Cash value lifeinsurance
All Men Women
28

Gender Differences in Investment Behavior
Investment behavior An important objective of this study is to understand many aspects of respondents’ investment behavior. In this section we discuss many of those aspects, beginning with the question, “Who makes the investment decisions in your household?” The study also explores respondents’ involvement in making investment changes during the twelve months prior to the interviews and their plans to make investment changes during the next six months. This section also explores their attitudes toward risk, including their willingness to take risks when making investments. Finally, this section includes detailed information on the types of assets these respondents chose for their investments. From information gathered in response to the question, “Who makes the investment decisions in your household?”, we learned that slightly over half of the respondents (57.0%) made investment decisions with their spouse or partner and only 27.9% reported making these decisions by themselves. A large majority of the respondents (84.1%) reported that they are comfortable in taking average or above-average risk when making investments in stocks or stock mutual funds. A large majority of the respondents (93.4%) also reported reviewing performance of their investments, and many reported making changes in their investment allocations during the previous twelve months. Similarly, a large majority of the respondents indicated that they planned to review their assets’ performance in the upcoming six months. In addition, about half of them indicated that they plan to consult with a financial advisor. The following sections provide much more detail on various aspects of respondents’ investment behavior with specific attention to gender differences in these areas. Table 5 contains detailed statistics of these measures for the whole sample as well as for men and women respectively. Figure 14 to Figure 18 illustrate the key findings visually.
29

Gender Differences in Investment Behavior
Table 5: Investment behavior characteristics Variable All Men Women N % N % N % Investment decision maker 911 100.0 591 100.0 320 100.0 Respondent 254 27.9 207 35.0 47 14.7 Spouse (partner) 16 1.8 1 0.2 15 4.7 Both make decisions together 519 57.0 308 52.1 211 65.9 Respondent makes decisions with others
49 5.4 31 5.2 18 5.6
Spouse (partner) makes decisions with others
3 0.3 2 0.3 1 0.3
Household investment decisions are made in another way
70 7.7 42 7.1 28 8.8
Past 12-month changes (“yes” responses)
Increased the amount you invest 490 55.5 334 58.2 156 50.5 Reviewed your investment performance
825 93.4 541 94.3 284 91.9
Changed your investment mix 484 54.8 347 60.5 137 44.3 Consulted with a financial advisor 455 51.5 286 49.8 169 54.7 Future 6-month changes (“yes” responses)
Increase the amount you invest 390 44.2 256 44.6 134 43.4 Review your investment performance
819 92.9 539 93.9 280 90.9
Change your investment mix 285 32.4 206 36.1 79 25.6 Consult with a financial advisor 438 49.6 280 48.8 158 51.1 Investment risk taking 907 100.0 587 100.0 320 100.0 No financial risk 62 6.8 31 5.3 31 9.7 Below average risk 33 3.6 17 2.9 16 5.0 Average risk 413 45.5 240 40.9 173 54.1 Above average risk 350 38.6 261 44.5 89 27.8 Substantial risk 49 5.4 38 6.5 11 3.4 Investments types (“yes” responses)
Government savings bonds, bond mutual funds
460 50.7 296 50.1 164 51.734.5
Corporate bonds or bond mutual funds
282 31.2 203 34.5 79 25.2
Stocks or stock mutual funds 721 79.6 481 81.5 240 75.9 Money market mutual funds 436 48.5 285 48.5 151 48.6
30

Gender Differences in Investment Behavior
Household investment decision-maker The term investment decision-maker refers to the person in household who made all or most of the investment decisions. This could have been the respondent, the respondents’ spouse, both the respondent and the spouse, the respondent and another adult, the spouse with another adult, or another person. Overall, the majority of respondents told us that investment decisions were made together with their spouses (57.0%). However, the responses differed by gender. A much smaller percentage of women (14.7%) than men (35.0%) reported making investment decisions on their own. This is opposite to the earlier observation that women were more likely than men to take care of the daily money management tasks in the household (see Figure 11). A much larger percentage of women (65.9%) than men (52.1%) reported that they made investment decisions with their partners.
Figure 14: Investment decision maker (in percent)
0
10
20
30
40
50
60
70
80
90
100
Self Spouse orpartner alone
Self and spouseor partner
Self with others Spouse orpartner with
others
In another way
All Men Women
31

Gender Differences in Investment Behavior
Investment activities over the past twelve months Following the framework of the Transtheoretical Model of Change (Prochaska, Redding, and Evers 2002) to assess respondents’ level of investment sophistication, we inquired about investment action steps taken by participants over the twelve months prior to the interviews and planned for the next six months. Participants were asked to think about the past twelve months and then asked if, during these twelve months, they: (a) increased the amount they invested, (b) reviewed their investment performance, (c) changed their investment mix, (d) consulted with a financial advisor, or (e) learned about a new investment concept or product. They could give yes or no responses respond to these questions. Results presented in Table 5 show that during the twelve months prior to the survey, a very large majority of the survey participants (93.4%) had reviewed the performance of their investments, and made some changes in their investment mix. Over half of these participants also reported that during this period they had increased the amount they invested (55.5%), changed investment allocations (54.8%), or had also consulted with a financial advisor (51.5%). As can be seen from Figure 15, a large majority of both women and men reported that they reviewed investment performance over the previous twelve-month period. However, gender differences are clear in other aspects of investment behavior. Men seem to be more active or engaged investors than women. For example, a larger percentage of men (58.2%) than women (50.5%) indicated that they changed amounts they invested during this period. Similarly, a slightly larger percentage of men (60.5%) than women (44.3%) indicated that they altered asset allocations over the previous twelve months. However, a larger percentage of women (54.7%) than men (49.8%) said that they had consulted with financial advisors over the previous twelve months.
32

Gender Differences in Investment Behavior
Figure 15: Investment activities of the previous twelve months (in percent)
0
10
20
30
40
50
60
70
80
90
100
Increased amount Reviewed performance Changed mix Consulted with adviosor
All Men Women
33

Gender Differences in Investment Behavior
Investment activities planned for the future six months Continuing with the Transtheoretical Model of Change framework, we also asked participants to think about the next six months and tell us whether they planned to: (a) increase the amount they invest, (b) review their investment performance, (c) change their investment portfolio mix, (d) consult with a financial advisor, or (e) learn about a new investment concept or product. Regarding the upcoming six-month investment activity, about an equal number of respondents planned to review the performance and to consult with an advisor as did in the previous year. Fewer planned to reallocate funds (32.4%) or to increase the invested amount (44.2%). As can be seen from information presented in Table 5 and Figure 16, a large majority of both men and women indicated that they plan to review their investment performances during the next six months (m: 93.9%, w: 90.9%). A slightly larger percentage of women (51.5%) than men (49.8%) indicated that they plan to consult with a financial advisor. On the other hand, a larger percentage of men (44.6%) than women (43.4%) said that they will change the amount of sums they plan to invest during the next six months. Similarly, a larger percentage of men reported that they plan to change their asset allocation during the next six months (m: 36.1%; w: 25.6%). From these results one can conclude that overall, more men than women in our sample planned to be actively engaged in investment activities during the upcoming six months.
Figure 16: Investment activities of the future six months (“yes” responses in percent)
0
10
20
30
40
50
60
70
80
90
100
Plan to increase amount Plan to reviewperformance
Plan to change mix Plan to consult withadvisor
All Men Women
34

Gender Differences in Investment Behavior
Willingness to take investment risk A review of investment literature clearly shows that one of the significant determinants of investment behavior is risk tolerance level. In our effort to better understand the behavior of this sample we included a question to determine their risk tolerance level. The question presented to them was: “Generally speaking, are you willing to take: (a) substantial financial risks to earn substantial returns, (b) above-average risks for above average returns, (c) average risks for average returns, (d) below-average risks for below average returns, or (d) no financial risks at all.” The results presented in Table 5 and Figure 17 show that most respondents (45.5%) were willing to take average risk for average returns and a smaller percentage (38.6%) indicated that they were willing to take above average risk for an above average return. The willingness to take specific levels of risk in anticipation of specific levels of return varied significantly between men and women. A majority of the women (68.8%) indicated that they preferred to take no, below-average, or average risks with their investments. On the other hand, slightly over half of the men (51.0%), as opposed to less than one-third of the women (32.1%), indicated that they prefer to take above-average or substantial risk to make above-average and substantial returns on their investments.
Figure 17: Willingness to take investment risk (in percent)
0
10
20
30
40
50
60
70
80
90
100
None Below average Average Above average Substantial
All Men Women
35

Gender Differences in Investment Behavior
Ownership in investment accounts Next, participants were asked to respond by saying “yes” or “no” if they held any of the following investments: bonds, stocks, or bond and stock mutual funds. Detailed information is included in Table 5 and visually presented in Figure 18. A majority of the respondents (79.6%) owned stocks or stock mutual funds. About half of all respondents indicated that they had investments in government savings bonds (50.7%) and money market mutual funds (48.5%). Slightly less than one-third (31.2%) of the respondents reported that they have invested in corporate bonds or bond mutual funds. Slightly more women than men in our sample invested in the less volatile money market mutual funds (w: 48.6%; m: 48.5%) and government savings bonds/bond mutual funds (w: 51.7%; m: 50.1%), while the men more often invested in the more volatile stocks/stock mutual funds (m: 81.5%; w: 75.9%) or corporate bonds/bond mutual funds (m: 34.5%; w: 25.2%). It is evident from Figure 18 that gender differences were not very pronounced. Even though a large majority of both men and women invested in stocks or stock mutual funds, the percentage of women was slightly smaller than men. On the other hand, a much smaller percentage of women (25.2%) than men (34.5%) reported investing in bonds or bond mutual finds.
Figure 18: Ownership in investment accounts (in percent)
0
10
20
30
40
50
60
70
80
90
100
Stocks or stock mutualfunds
Corporate bonds orbond mutual funds
Money market mutualfunds
Govt. savings bond orbond mutual funds
All Men Women
36

INVESTO
R ACTION
S
Gender Differences in Investment Behavior*
INVESTOR ACTIONS

Gender Differences in Investment Behavior
4. Investor actions In this section we present information in the following three major aspects of investment behavior used by the participants of our study: (a) sources and tools used by participants to gather investment information, (b) steps in investment decision-making processes, and (c) involvement in investment decisions. Detailed information regarding these areas is presented in Table 6 to Table 12 and Figure 19 to Figure 27. The following sections discuss in detail various aspects of these three broad areas of investment behavior. Sources of investment information and the use of technology The questions presented in this section explored the participants’ sources for financial information and use of personal computers and the Internet to gather investment information or make investments. The survey instrument included a list of sources of financial information and the respondents were asked to indicate on a five-point scale how often they used any of these sources: 1=never, 2=seldom, 3=sometimes, 4=often and 5=very often. Results show that a large percentage of the respondents indicated using financial advisors, print media, and friends and colleagues as a source of financial information. A much smaller percentage of these participants indicated using personal computers and investment software to make investment decisions. It appears that the majority of these inventors preferred working with a person to make investment decisions. The following sections provide detailed information regarding these items and also show the differences between men and women in this regard. Detailed results are included in Table 6 to Table 9 and visually illustrated in Figure 14 to Figure 18. The tables in this section include two different statistics: the mean and the standard deviation from the mean to summarize multi-point response scales varying from never = 1 to very often = 5. Figure 19 and Figure 20 report sums of percentages of two responses, “often” and “very often,” to the various statements. On the other hand, Figure 21 and Figure 22 show the percentages of yes responses to lists of statements. Sources of financial information This question explored the various sources of financial information that respondents use. We asked how frequently they have obtained information about investing from a financial advisor; the Internet; TV programs; radio programs; classes or workshops; newspapers, magazines, newsletters, or books; investment clubs; friends or colleagues; their workplaces; or other sources.
37

Gender Differences in Investment Behavior
Possible responses were 1=never, 2=seldom, 3=sometimes, 4=often, and 5=very often. The percentages in Figure 19 represent how many respondents responded 4=often and 5=very often to using the different information sources. About 30% of the participants reported that they used financial advisors, followed by Internet and print media, which were each used by slightly fewer than one-fourth of the respondents. The workplace, social networks, broadcasts, classes, and investment clubs were used by fewer than 10% of the respondents as sources of financial information. About a quarter of the men in our sample made frequent use of financial advisors (29.9%), the Internet (27.3%), and print media (25.7%) to learn about personal finance. Although a higher rate of men than women reported making frequent use of financial advisors, when asked about their use of financial advisors within the previous twelve months, women were more likely than men to say that they had consulted with one. Similarly, when questioned about their plans to consult with a financial advisor within the next six months, women also reported a slightly higher rate. While women showed less interest in using the Internet (10%), they gathered financial information at the workplace or from friends and colleagues more often than men.
Figure 19: Sources of financial information (“often” and “very often” responses in percent)
0
10
20
30
40
50
Financ
ial ad
visor
Intern
et
Newspa
per &
mag
azine
s
Work
place
Friend
s and
colle
ague
s TVRad
io
Classes
Invest
ment c
lubs
Any pl
ace el
se
All Men Women
38

Gender Differences in Investment Behavior
Table 6 presents additional statistics (the means and standard deviations) to provide further insights into participants’ use of various sources of financial information. There are several common methods of selecting a “typical” value for data. The most common method is the average or mean. To obtain an average value, one adds up all the data values and divides by the number of data items. The most common way to describe the range of variation is standard deviation. The standard deviation is simply the square root of the variance. To obtain the variance one starts by subtracting the average from each data item, squares each deviation, and proceeds to find the average of the squared-deviations. However, in finding the average squared-deviation, one divides by N-1 rather than N. The result is the variance; its square root equals the standard deviation. The responses to the various sources of financial information were measured on a five-point scale ranging from 1=never, 2=seldom, 3=sometimes, 4=often, to 5=very often. More than half of the respondents reported that they used financial advisors and print media to gather financial information (mean greater than 2.50). All other information sources were used by fewer participants. This table also depicts the differences in information sources between men and women. Table 6: Sources of financial information Variable Range All Men Women Mean (SD) Mean (SD) Mean (SD) Sources of financial information (1=never to 5=very often)
Financial advisor 1-5 2.76 (1.183) 2.77 (1.209) 2.73 (1.136) Internet 1-5 2.38 (1.274) 2.57 (1.317) 2.03 (1.112) TV programs 1-5 1.59 (0.887) 1.65 (0.919) 1.48 (0.815) Radio programs 1-5 1.56 (0.860) 1.65 (0.920) 1.39 (0.709) Classes or workshops 1-5 1.68 (0.850) 1.65 (0.831) 1.73 (0.883) Newspapers, magazines, newsletters, books 1-5 2.69 (1.096) 2.76 (1.029) 2.54 (1.029) Investment clubs 1-5 1.25 (0.685) 1.21 (0.615) 1.32 (0.795) Friends or colleagues 1-5 2.32 (0.941) 2.29 (0.933) 2.38 (0.956) Workplace 1-5 2.08 (1.067) 2.05 (1.052) 2.15 (1.093) Have you obtained information about investing from anyplace else?
1-5 0.09 (0.291) 0.09 (0.284) 0.10 (0.305)
39

Gender Differences in Investment Behavior
Use of technology and computer-related investment tools Participants in this study were asked to identify what computer-based investment tools they used: (a) investment analysis or management software, (b) e-mail investment newsletters, (c) personalized market watch websites, (d) buy or sell investments over the Internet. Responses were recorded on five-point scale where 1=never, 2=seldom, 3=sometimes, 4=often, and 5=very often. Figure 20 shows percentages of those respondents who indicated that they make use of the technology and computer information to make investment decisions often and very often. Overall, the majority of the respondents said they never or seldom took advantage of computer-based investment tools, such as investment software (seldom and never responses: 66.5%), e-mail newsletters (74.1%), market-watch websites (71.8%), or Internet trading (76.0%). In general, the men in our sample were more comfortable using a computer and the Internet for investment purposes than were the women. Particularly large was the gender difference for Internet trading: men used this tool three times more often than women (m: 15.2%, w: 5.0%).
Figure 20: Use of computer-related investment tools (“often” and “very often” responses in percent)
0
10
20
30
40
50
Software Market-watch websites Internet trading E-mail newsletters
All Men Women
40

Gender Differences in Investment Behavior
Table 7 presents the means and standard deviations to provide further insights into the use of computer related investment tools. The responses to use of personal computer-based investment tools were measured on a five-point scale ranging from 1=never, 2=seldom, 3=sometimes, 4=often, to 5=very often. From the information presented below it is clear that most participants indicated that they never, or seldom, used computer/technology-based tools (mean less than 2.00). One exception to this is the use of investment analysis and management software. Table 7 also depicts the differences in information sources between men and women. It is very obvious that men in this sample were more likely than women to use the computer/technology-based tools to access information or make investment decisions. Mean statistics for women are much lower than men in every category in Table 7. Table 7: Use of computer-related investment tools Variable Range All Men Women Mean (SD) Mean (SD) Mean (SD) Use of computer-related investment tools (1=never to 5=very often)
Use investment analysis or management software
1-5 2.09 (1.240) 2.24 (1.265) 1.81 (1.143)
Read e-mail investment newsletters 1-5 1.90 (1.096) 1.96 (1.127) 1.78 (1.027) Use personalized market watch websites 1-5 1.95 (1.244) 2.06 (1.305) 1.75 (1.099) Buy or sell investments over the Internet 1-5 1.78 (1.147) 1.94 (1.239) 1.48 (0.885) Reasons for not using the Internet for investment purposes If the answer to the question, “How often do you use computer/technology-based investment tools?” was never or seldom, we asked a follow-up question to understand the reasoning behind this reply: “We are interested in the reasons why you don’t use the Internet for investment purposes (more often). Is it because (a) of security concerns, (b) investment websites are confusing, (c) you prefer working with people, or (d) something else?” The percentages in Figure 21 represent the percentages of people whose response was yes to each of these reasons. Results show that the majority of the respondents (82.4%) said that they did not use computer-related investment tools because they preferred working with people; a larger percentage of women than men felt this way. Other reasons, mentioned by less than half of the respondents, included security concerns (44.0%) and confusing websites (37.9%). In both of these cases, once again, a larger percentage of women than men expressed these concerns.
41

Gender Differences in Investment Behavior
Figure 21: Reasons for not using Internet for investment purposes (“yes” responses in percent)
0
10
20
30
40
50
60
70
80
90
100
Prefer working withpeople
Confusing websites Security concerns Other reasons
All Men Women
Table 8 presents the means and standard deviations for the above-discussed measures. The responses for hindrances that prevent respondents from using the Internet for investment purposes were measured on a yes/no scale. The majority of respondents reported to prefer working with people. From the data presented here (means and standard deviation), it is once again substantiated that more women than men prefer to work with people, find websites confusing, and have security concerns (in each case the means are higher for women than men). Table 8: Reasons for not using Internet for investment purposes Variable Range All Men Women Mean (SD) Mean (SD) Mean (SD) Hindrances for Internet use (0=no, 1=yes)
Security concerns 0-1 0.44 (0.497) 0.40 (0.491) 0.49 (0.501) Investment web sites are confusing or difficult to understand
0-1 0.38 (0.486) 0.33 (0.472) 0.44 (0.498)
Prefer working with people 0-1 0.82 (0.381) 0.81 (0.394) 0.84 (0.364) Something else 0-1 0.34 (0.473) 0.35 (0.479) 0.31 (0.464)
42

Gender Differences in Investment Behavior
Reasons for not using investment software Participants who indicated that they never or seldom used investment analysis or management software were asked a follow-up question: “Why don’t you use investment software more often?” They were given the following possible reasons, to which they could provide yes or no responses: (a) not interested in using it; (b) don’t know how to select or use it; (c) not involved in managing investments; (d) other reasons. Figure 22 presents data on yes responses. Results show that over half of the respondents (58.0%) indicated that they were not interested in software, and almost half of them (47.7%) told us that they did not know how to select or use investment software. In all instances, larger percentages of women than men were either not interested or did not know how to select or use the software. About one-third of these respondents did not use software because they did not manage their own investments.
Figure 22: Reasons for not using investment software (“yes” responses in percent)
0
10
20
30
40
50
60
70
80
90
100
Not interested insoftware
Don't know how to usesoftware
Not involved inmanaging investments
Other reasons to not usesoftware
All Men Women
Table 9 presents the means and standard deviations for the above-discussed measures. The responses for hindrances that prevent respondents from using investment software for investment purposes were again measured on a yes/no scale. The majority of respondents was simply not interested in using these tools (mean greater than 0.50), which was particularly true for women.
43

Gender Differences in Investment Behavior
Table 9: Reasons for not using investment software Variable Range All Men Women Mean (SD) Mean (SD) Mean (SD) Hindrances for investment software use (0=no, 1=yes)
Not interested in using it 0-1 0.58 (0.494) 0.56 (0.497) 0.61 (0.489) Don’t know how to select or use it 0-1 0.48 (0.500) 0.46 (0.499) 0.50 (0.501) Not involved in managing your investments 0-1 0.28 (0.449) 0.27 (0.447) 0.29 (0.453) Something else 0-1 0.38 (0.486) 0.38 (0.486) 0.38 (0.487) Investment decision-making processes One of our goals for this study was to understand the processes that investors follow both before making investments and after investments have been made and yielded less-than-hoped-for results. First, we asked participants what specific actions they took before making an investment decision; next, we asked a follow-up question to explore the specific actions they took when their investments did not produce the results that they had hoped for. The following sections provide detailed information on these findings as well as the specific results for men and women. Table 10 and Table 11 present the sample statistics of these two measures for the full sample and for male and female respondents, respectively. The statistical results are again presented using two statistics, the mean and the standard deviation from the mean to present multi-point response scale to one key result. Figure 23 and Figure 24 illustrate the findings. The percentages in these figures represent how many respondents responded 4=often and 5=always to the statements. Actions taken before making investment decisions This question explored the actions respondents take before making specific investment decisions. They were asked, “Before you make specific investment decisions, how often do you first: (a) review overall investment goals, (b) consider the level of risk you are willing to take, (c) determine what return you would like to get from the investment, (d) consider a variety of investment options, and (e) check the current financial market conditions?” Their responses were recorded on a five-point scale where 1= never, 2=seldom, 3=sometimes, 4=often, and 5=always. The percentages in Figure 23 represent those who responded often and always to all of the actions listed above. Two-thirds of respondents (77.9%) indicated that they considered the level of risk they are willing to take before making any specific investment decisions. As can be seen from Figure 23,
44

Gender Differences in Investment Behavior
the percentages of men and women who provided this response were very similar. Although both men and women held risk to be the most important factor to consider before making an investment decision, men reported a greater willingness to take above-average or substantial risks when making investments. A majority (63.2%) also indicated that before making investment decisions they determined what returns they would like to get, checked the current financial market conditions (62.1%), and considered a variety of investment options (59.0%). Differences between men and women in these areas were not very prominent. It is of some concern to note that about half of the respondents, slightly more men than women, said that they reviewed their overall investment goals before making a specific investment.
Figure 23: Actions taken before making investment decisions (“often” and “always” responses in percent)
0
10
20
30
40
50
60
70
80
90
100
Consider risk Determine return Check marketconditions
Variety of options Review goals
All Men Women
45

Gender Differences in Investment Behavior
Table 10 presents the means and standard deviations for the above discussed measures. The responses for the actions participants take before making investment decisions were measured on a five-point scale ranging from 1=never, 2=seldom, 3=sometimes, 4=often, to 5=always. The means are consistently between 3=sometimes and 4=often, indicating that these action steps are taken on a regular basis. From the review of the mean and standard deviations statistics presented in Table 10 below, it is clear that there are no significant differences in the behavior of men and women. Table 10: Actions taken before making investment decisions Variable Range All Men Women Mean (SD) Mean (SD) Mean (SD) Actions taken before making investment decisions (1=never to 5=always)
Consider the level of risk willing to take 1-5 4.09 (0.975) 4.08 (0.990) 4.10 (0.948) Determine what return to get 1-5 3.71 (1.145) 3.71 (1.163) 3.71 (1.112) Check the current financial market conditions 1-5 3.66 (1.209) 3.72 (1.184) 3.56 (1.251) Consider a variety of investment options 1-5 3.67 (1.085) 3.67 (1.099) 3.67 (1.060) Review overall investment goals 1-5 3.54 (1.083) 3.58 (1.086) 3.46 (1.076) Actions taken when investment results were below expectations In this next question we tried to gather information about the specific actions participants took when their investments did not produce the desired results. This question was asked only to those who had indicated that they had one of all of the following investment accounts: an employer-provided retirement account, personal IRA or Keogh account, government savings bonds or bond mutual funds, corporate bonds or bond mutual funds, stocks or stock mutual funds, money market mutual funds, or any other financial assets. They were asked specifically if they took any one of the actions: (a) make changes to try to improve investment performance; (b) wait it out, anticipating future improvements over the long run; and (c) consult with a financial advisor before taking any further action. Their responses were recorded on a five-point scale ranging from 1= never to 5= always. The results presented in Figure 24 represent the percentage of those who responded often or always to each action step listed above. About half of both men and women in this our study preferred to wait it out when investments failed to earn the expected returns; however, more women than men were willing to wait it out (w: 54.6%; m: 47.5%). A much smaller percentage of the respondents said that they would consult with a financial advisors, and once again women were more likely than men to consult with a financial advisor when their investment did not produce the desires results.(w: 36.1%; m: 28.1%). These findings are in line with the results in earlier sections, which found that more men
46
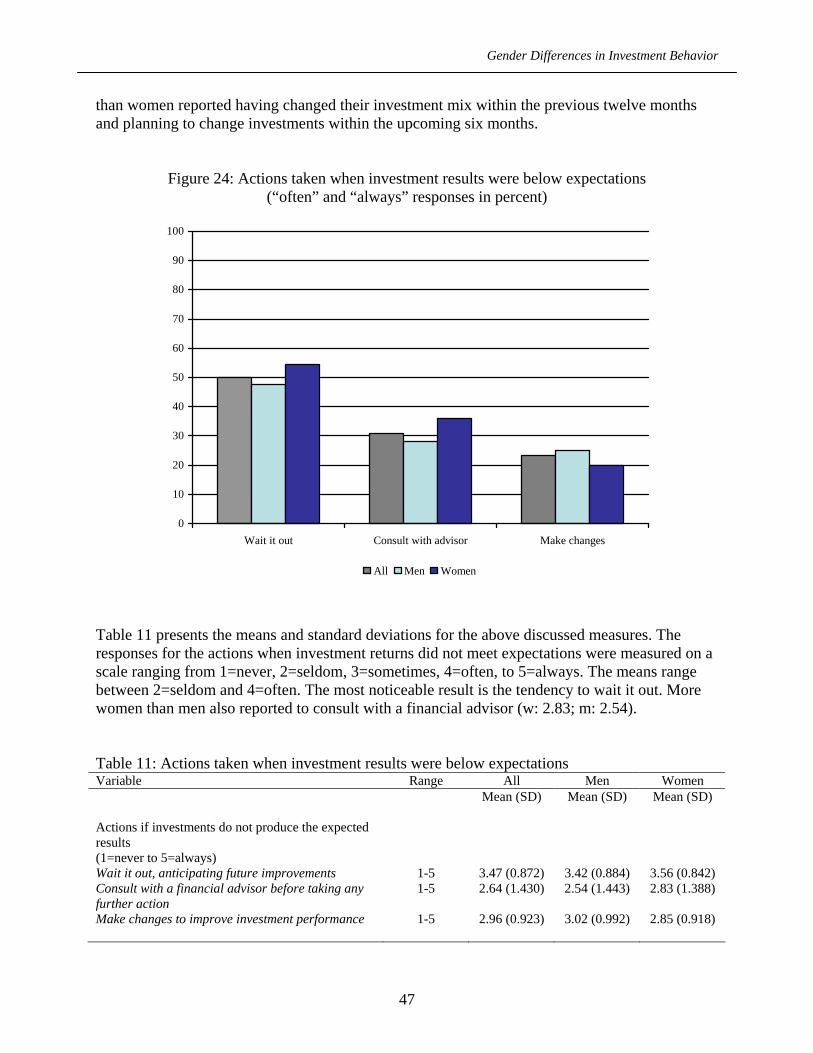
Gender Differences in Investment Behavior
than women reported having changed their investment mix within the previous twelve months and planning to change investments within the upcoming six months.
Figure 24: Actions taken when investment results were below expectations (“often” and “always” responses in percent)
0
10
20
30
40
50
60
70
80
90
100
Wait it out Consult with advisor Make changes
All Men Women
Table 11 presents the means and standard deviations for the above discussed measures. The responses for the actions when investment returns did not meet expectations were measured on a scale ranging from 1=never, 2=seldom, 3=sometimes, 4=often, to 5=always. The means range between 2=seldom and 4=often. The most noticeable result is the tendency to wait it out. More women than men also reported to consult with a financial advisor (w: 2.83; m: 2.54). Table 11: Actions taken when investment results were below expectations Variable Range All Men Women Mean (SD) Mean (SD) Mean (SD) Actions if investments do not produce the expected results (1=never to 5=always)
Wait it out, anticipating future improvements 1-5 3.47 (0.872) 3.42 (0.884) 3.56 (0.842) Consult with a financial advisor before taking any further action
1-5 2.64 (1.430) 2.54 (1.443) 2.83 (1.388)
Make changes to improve investment performance 1-5 2.96 (0.923) 3.02 (0.992) 2.85 (0.918)
47

Gender Differences in Investment Behavior
Change in involvement in saving and investing over the years In this study we inquired whether the involvement in saving and investing decisions had changed over the years and, if so, what specific events triggered that change in involvement. The participants were asked, “Over the years, would you say that your involvement in saving and investing has: (a) decreased, (b) remained fairly stable, (c) increased, (d) or varied (up and down)?” If the respondents replied that their involvement had decreased, increased, or varied, they were asked a follow-up question: “Have these changes been gradual over time, or have there been specific events in your life that caused these changes?” The following sections provide detailed information on these findings as well as the specific results for men and women. Table 12 shows the statistics of these measures for the full sample, and breaks down results for men and women, respectively. Figure 25 to Figure 27 illustrate the findings in percentages. Table 12: Change in involvement in saving and investing over the years Variable All Men Women N % N % N % Involvement in saving and investing 908 100.0 590 100.0 318 100.0 Decreased 75 8.3 44 7.5 31 9.7 Remained stable 291 32.0 177 30.0 114 35.8 Increased 542 59.7 369 62.5 173 54.4 Nature of changes 620 100.0 414 100.0 206 100.0 Gradual over time 398 64.2 275 66.4 123 59.7 Sudden events changed involvement 222 35.8 139 33.6 83 40.3 Types of life events (primary reason) 222 100.0 139 100.0 83 100.0 Marriage 45 20.3 28 20.1 17 20.5 Divorce 11 5.0 2 1.4 9 10.8 Children 32 14.4 17 12.2 15 18.1 Retirement 25 11.3 20 14.4 5 6.0 Death 13 5.9 4 2.9 9 10.8 Sudden financial gain 27 12.2 20 14.4 7 8.4 Something else 69 31.1 48 34.5 21 25.3
48

Gender Differences in Investment Behavior
Change in level of involvement in saving and investing This question explored the level of involvement in saving and investment decision tasks. Respondents were asked if, over the years, their involvement in saving and investing had 1=decreased, 2=remained fairly stable, 3=increased, or 4=varied up and down. Less than 10% of respondents reported that their involvement in saving and investing had decreased, while more than half of the respondents (59.7%) reported that their involvement in saving and investment decisions had increased over the years. Slightly less than a third reported that their involvement had remained the same. The women’s increase was slightly weaker than that of the men in our sample (w: 54.4%, m: 62.5%).
Figure 25: Change in involvement in saving and investing (in percent)
0
10
20
30
40
50
60
70
80
90
100
Decreased Fairly stable Increased
All Men Women
49

Gender Differences in Investment Behavior
Change in involvement as a result of specific life events Those respondents who reported that their involvement in saving and investing changed over time were asked if these changes have been gradual over time (=1), or if there have been specific events in one’s life that caused these changes (=2). Overall, more respondents described their involvement in saving and investing decision-making as a result of a gradual process over time (43.7%) rather than as a result of sudden events (24.4%). More men than women in our sample reported gradual change (m: 66.4%, w: 59.7%), while slightly more women indicated sudden events as causes for an increased involvement (m: 33.6%, w: 40.3%).
Figure 26: Changes in involvement as a result of unfolding events or critical incidences (in percent)
0
10
20
30
40
50
60
70
80
90
100
Gradual over time Sudden events
All Men Women
50

Gender Differences in Investment Behavior
Specific life events causing change in saving and investing involvement Participants who previously indicated that change in their involvement in saving and investing was caused by specific life events were asked to identify those specific life events from a list. Choices included marriage, divorce, having children, retirement, death, sudden financial gain, or something else. Figure 27 provides detailed information on their responses. Both men and women reported marriage as the largest single event that altered their involvement in saving and investing (m: 20.1%, w: 20.5%). However, a much larger percentage of women reported divorce as an event that brought significant change in their involvement in saving and investing (w: 10.8%, m: 1.4%). A larger percentage of women also reported changes in their investment behavior in response to the arrival of children (m: 12.2%, w: 18.1%) or the death of a family member (m: 2.9%, w: 10.8%). On the other hand, more men than women reported retirement (m: 14.4%, w: 6.0%) and sudden financial gain (m: 14.4%, w: 8.4%) as agents of change for their saving and investment behavior.
Figure 27: Specific life events causing change in involvement (in percent)
0
10
20
30
40
50
Marriage Divorce Children Retirement Death Sudden gain Somethingelse
All Men Women
51

INVESTO
R SOCIALIZATIO
N
Gender Differences in Investment Behavior*
INVESTOR SOCIALIZATION

Gender Differences in Investment Behavior
5. Investor socialization In this section we describe socialization processes that influence respondents’ financial beliefs and behavior in general and investment behavior in particular. Socialization processes refer to interaction with parents and teachers at an early age. In particular, the questionnaire explored childhood experiences related to personal finances. For example, we inquired about parental conversations about money, the persons who most influenced respondents’ financial behavior, how financially secure respondents’ felt during their childhood, and specific sources for investment learning they used when growing up. The following sections present detailed information on respondents’ socialization and highlights differences between men’s and women’s experiences. Table 13 to Table 16 present the sample statistics for these measures for the whole sample and for men and women respectively. Figure 29 to Figure 31 illustrate the findings visually. Parents’ influence on money management To determine what kind of influence parents have on money management, we asked, “When growing up, who influenced you the most in your understanding of how to handle money?” Possible responses were 1=your father, 2=your mother, 3=both of your parents equally, 4=or other adults. Overall, we found that a large percentage of respondents identified their fathers (30.5%) as the most influential figures, followed by both parents equally (29.3%) and their mothers (25.5%). Men and women answered this question differently. One-third of the men (30.5%) reported their fathers and one-fifth (25.5%) their mothers as major sources of influence. On the other hand, one-third of the women (33.9%) reported their mothers and one-fourth (26.0%) their fathers as the most influential persons on their money management. The percentages of men and women who reported being influenced by both parents equally (m: 29.3%; w: 29.5%) or by no one (m: 0.8% and w: 0.6%) were quite similar. More men than women, however, indicated that they were influenced in their understanding of how to handle money by other adults (m: 15.9%; w: 10.0%).
52

Gender Differences in Investment Behavior
Figure 28: One’s parents’ influence on money management (in percent)
0
10
20
30
40
50
Father Mother Both parents Other adults No one
All Men Women
Table 13: One’s parents’ influence on money management Variable All Men Women N % N % N % One’s parents’ influence on money management
910 100.0% 591 100.0% 319 100.0%
Father 278 33.0 195 30.5 83 26.0 Mother 232 21.0 124 25.5 108 33.9 Both parents equally 267 29.3 173 29.3 94 29.5 Other adults 126 15.9 94 18.3 32 10.0 No one 7 0.8 5 0.8 2 0.6
53

Gender Differences in Investment Behavior
Parents’ conversations about money In this question we explored the respondents’ early experiences with money. Respondents were asked how often they remembered parental conversations when growing up about (a) how to handle money, (b) the importance of saving money for the future, or (c) concern or worry about money matters. Their responses were recorded on a three-point scale where 1=never, 2=sometimes, and 3=often. Figure 29 shows the percentage of those who responded “often” to these items. Overall, the majority of participants responded that when they were growing up, their parents talked to them sometimes or often about handling money (78.0%), saving money (82.9%), and money concerns or worries (79.8%). There seemed to be little difference between men and women in how respondents identified the significance of parental conversations about saving money and money worries. However, a larger percentage of women than men reported that their parents talked to them about how to handle money. Probing the often responses further, we found that the differences between the men and women of our sample become more pronounced. More women than men remembered that their parents often talked to them about how to handle money (w: 30.9%, m: 21.8%) and about saving money (w: 42.9%, m: 35.0%). Differences among men and women were not too pronounced. It appears that when growing up, both women and men had similar experiences of talking to their parents about money.
Figure 29: Parents’ conversations about money (“often” responses in percent)
0
10
20
30
40
50
Parents talked about handlingmoney
… saving money … money worries
All Men Women
54

Gender Differences in Investment Behavior
Table 14 presents the means and standard deviations for the above discussed measures. The responses were measured on a scale ranging from 1=never, 2=sometimes, to 3=often. The means of the sample oscillate around 2=seldom. More women than men remembered these conversations about handling and saving money. There was little difference found between the men and women of this sample with respect to displays of concern or worry. Table 14: Parents’ conversations about money Variable Range All Men Women Mean (SD) Mean (SD) Mean (SD) Parents’ conversations about money (1=never to 3=often)
Parents talked about how to handle money 1-3 2.03 (0.685) 1.98 (0.674) 2.12 (0.698) Parents talked about the importance of saving money for the future
1-3 2.21 (0.712) 2.18 (0.700) 2.26 (0.733)
Parents displayed concern or worry about money matters
1-3 2.17 (0.736) 2.17 (0.735) 2.15 (0.737)
Feeling financially secure in one’s family The third question within this section inquired about how financially secure they felt the family was when they were growing up. Responses were recorded on a five-point scale ranging from 1=not at all secure to 5=very secure. For Figure 30 we combined the percentages of the sample that responded 4=secure and 5=very secure into one, single percentage score. Overall a majority of the respondents in this sample (58.1%) reported that while growing up they felt that their families were financially secure. More women than men in this study—almost two-thirds of the women (64.3%) but only a little more than half of the men (54.5%)—reported having this feeling when growing up.
55

Gender Differences in Investment Behavior
Figure 30: Feeling financially secure in one’s family (“secure” and “very secure” responses in percent)
0
10
20
30
40
50
60
70
80
90
100
Financial security in childhool
All Men Women
Table 15 presents the means and standard deviations for the above discussed measure for financial security. The responses were measured on a scale ranging from 1=not at all secure, 2=not secure, 3=neutral, 4=secure, to 5=very secure. The means range between 3=neutral and 4=secure. The most noticeable result is that women felt their families were more financially secure than the men of this sample (w: 3.83; m: 3.49). Table 15: Feeling financially secure in one’s family Variable Range All Men Women Mean (SD) Mean (SD) Mean (SD) Feeling financially secure in one’s family (1=not at all secure to 5=very secure)
1-5 3.61 (1.134) 3.49 (1.130) 3.83 (1.108)
56

Gender Differences in Investment Behavior
Parents’ and teachers’ influence on investment learning Finally, we inquired about the influence of parents and teachers with respect to learning about investing. Respondents were asked to respond to the following statements: (a) My parents advised me when I was young on how to invest; and (b) I had teachers in school who taught me how to invest. Responses were rated on a five-point scale ranging from 1=strongly disagree to 5=strongly agree. In Figure 31 we present the sum of responses for the respondents who selected agree and strongly agree in response to these questions. Overall, we found that the majority of respondents disagreed or strongly disagreed with these two statements; only about one-third of the respondents agreed or strongly agreed that their parents advised them how to invest (35.0%). A much smaller percentage (18.3%) agreed or strongly agreed that they had teachers in school who taught them how to invest. These results are consistent with previous findings where we saw that a higher percentage of men than women indicated that non-parental adults had most the influence on their understanding about handling money. More men than women also indicated that teachers were an important influence on their learning (m: 19.6%; w: 15.6%).
Figure 31: Parents’/teachers’ influence on investment learning (“agree” and “strongly agree” responses in percent)
0
10
20
30
40
50
Parents advised Teachers taught
All Men Women
57

Gender Differences in Investment Behavior
Table 16 presents the means and standard deviations for the above-discussed measure of investment learning. The responses for the actions when investment returns did not meet expectations were measured on a scale ranging from 1=strongly disagree, 2=disagree, 3=neutral, 4=agree, to 5=strongly agree. The means range between 2=disagree and 3=neutral. Most notably, women gained less investment knowledge from teachers than men (w: 2.01, m: 2.18) and slightly more from their parents (w: 2.60, m: 2.55). Table 16: Parents’/teachers’ influence on investment learning Variable Range All Men Women Mean (SD) Mean (SD) Mean (SD) Parents’/teachers’ influence on investment learning (1=strongly disagree to 5=strongly agree)
My parents advised me when I was young on how to invest.
1-5 2.57 (1.285) 2.55 (1.276) 2.60 (1.304)
Teachers in school taught me how to invest. 1-5 2.12 (1.076) 2.18 (1.116) 2.01 (0.992)
58

PREDICTORS O
F INVESTO
R INTEN
TION
Gender Differences in Investment Behavior*
PREDICTORS OF INVESTOR INTENTION
Gender Differences in Investment Behavior
6. Predictors of investor intention In this section we report about predictors of investors’ intentions: respondents’ investment learning preferences, investment beliefs, attitudes, and perceived behavioral control. In addition, this section also includes a discussion regarding investors’ opinions and experiences with financial advisors. The following sections provide detailed information about these five above mentioned areas. Results will specifically focus on showing if and how men and women differ in these various aspects of financial beliefs and behaviors. Table 17 to Table 21 present statistical measures for the whole sample and separately for men and women. Figure 32 to Figure 37 visually illustrate the findings. Investment learning preferences In this section we explore the learning modes identified by participants in this study as effective and desirable. In order to gather this information, the respondents were asked to respond to the following six statements: (a) I enjoy learning new things about investing; (b) Investment seminars are a useful learning tool; (c) I prefer to learn about investing by talking with knowledgeable people one-on-one; (d) I am not interested in learning more about investing; (e) When I need information about investing, I research it myself before talking with someone else; and (f) When I’m learning something new about investing, I want to know all the details in fine print. Their responses were recorded on a five-point scale ranging from 1=strongly disagree to 5=strongly agree. Table 17 contains statistical measures for these items for the whole sample and broken down by gender of the respondents. Figure 32 provides the visual illustration of these findings. The majority of participants in this study indicated that they enjoyed learning new things about investing (86.5%), preferably by talking with knowledgeable people one-on-one (87.1%) and by doing research to gather detailed information (74.9%). More women than men in the study described themselves as wanting to know all the details in fine print when learning something new about investing (w: 79.0%, m: 72.7%). Women were more likely than men to prefer instructor-based learning about investing (w: 63.9%, m: 53.2%). On the other hand, more men preferred self-directed learning (m: 78.7%, w: 69.1%).
59
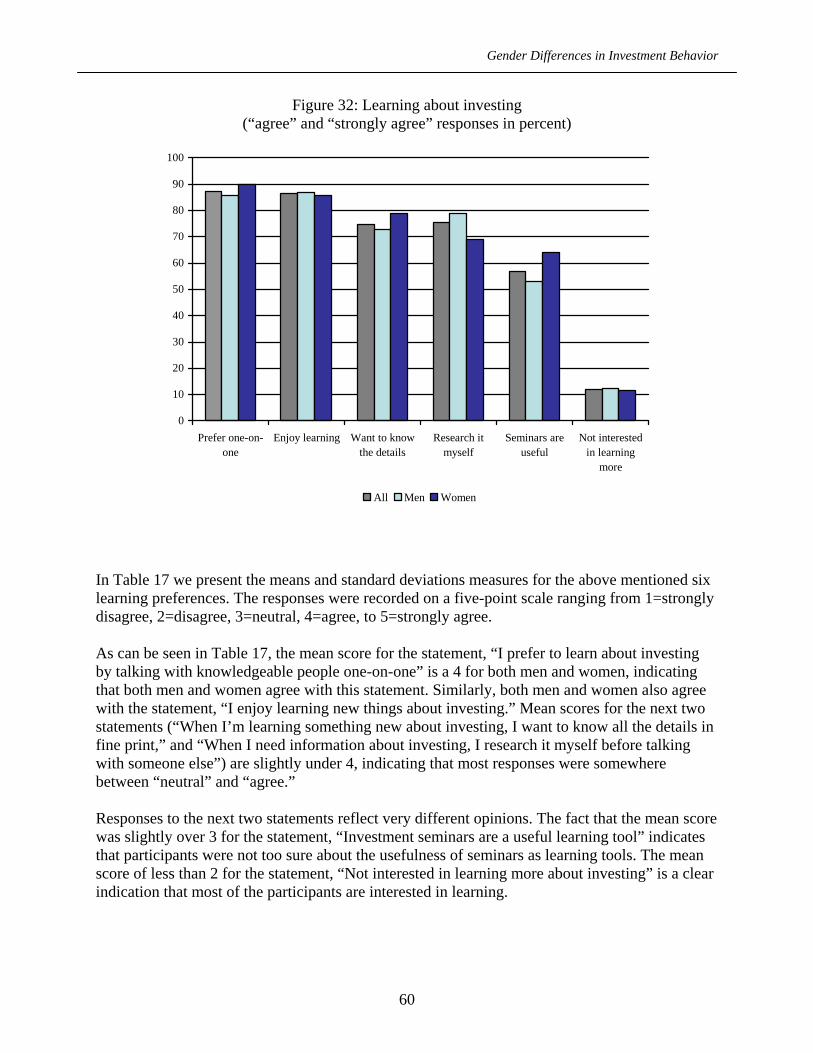
Gender Differences in Investment Behavior
Figure 32: Learning about investing (“agree” and “strongly agree” responses in percent)
0
10
20
30
40
50
60
70
80
90
100
Prefer one-on-one
Enjoy learning Want to knowthe details
Research itmyself
Seminars areuseful
Not interestedin learning
more
All Men Women
In Table 17 we present the means and standard deviations measures for the above mentioned six learning preferences. The responses were recorded on a five-point scale ranging from 1=strongly disagree, 2=disagree, 3=neutral, 4=agree, to 5=strongly agree. As can be seen in Table 17, the mean score for the statement, “I prefer to learn about investing by talking with knowledgeable people one-on-one” is a 4 for both men and women, indicating that both men and women agree with this statement. Similarly, both men and women also agree with the statement, “I enjoy learning new things about investing.” Mean scores for the next two statements (“When I’m learning something new about investing, I want to know all the details in fine print,” and “When I need information about investing, I research it myself before talking with someone else”) are slightly under 4, indicating that most responses were somewhere between “neutral” and “agree.” Responses to the next two statements reflect very different opinions. The fact that the mean score was slightly over 3 for the statement, “Investment seminars are a useful learning tool” indicates that participants were not too sure about the usefulness of seminars as learning tools. The mean score of less than 2 for the statement, “Not interested in learning more about investing” is a clear indication that most of the participants are interested in learning.
60

Gender Differences in Investment Behavior
Table 17: Learning about investing Variable Range All Men Women Mean (SD) Mean (SD) Mean (SD) Learning about investing (1=strongly disagree to 5=strongly agree)
Prefer to learn about investing by talking with knowledgeable people one-on-one
1-5 4.05 (0.900) 4.01 (0.942) 4.10 (0.814)
Enjoy learning new things about investing 1-5 3.97 (0.883) 4.01 (0.880) 3.89 (0.885) When I’m learning something new about investing, I want to know all the details in fine print
1-5 3.75 (1.088) 3.68 (1.098) 3.90 (1.057)
When I need information about investing, I research it myself before talking with someone else
1-5 3.70 (1.063) 3.81 (1.015) 3.51 (1.123)
Investment seminars are a useful learning tool 1-5 3.30 (1.023) 3.21 (1.056) 3.46 (0.940) Not interested in learning more about investing. 1-5 1.96 (0.941) 1.94 (0.960) 1.99 (0.904) Attitudes and beliefs about investing To gather rather extensive information about participants’ beliefs and attitudes about investing, they were provided with fourteen statements: (a) I am responsible for my own financial well-being; (b) I like to plan for my financial future; (c) It is important to set clear financial goals with timelines and dollar amounts; (d) It is important to set up automatic deposits to savings and investment accounts; (e) I get irritated with people who don’t plan ahead and save or invest for their own future; (f) I carefully review the financial information I receive in the mail; (g) I maximize contributions to my retirement accounts; (h) I wish I did not have to handle financial responsibilities; (i) I am satisfied with my current financial situation; (j) Feeling financially secure improves the quality of my life; (k) I depend on my spouse to provide for me financially (if respondent was married); (l) I am concerned that my financial situation is affecting my personal relationships; (m) I have a clear idea of what my financial needs will be during retirement; and (n) I am confident that I will have a financially secure future. Participants were asked to respond using a five-point scale where 1=strongly disagree, 2=disagree, 3=neutral, 4=agree, to 5=strongly agree. Table 18 contains the statistics of these measures for the full sample and for men and women, respectively. Figure 33 uses percentages to visually illustrates the results for respondents who agreed or strongly disagreed. A review of information presented in Figure 33 shows that over 90% of the respondents agreed or strongly agreed that they were responsible for their own financial well-being, that financial security improves the quality of their lives, and that they like to plan for their financial future (95.9%). Both men and women expressed similar opinions in this regard, although the
61

Gender Differences in Investment Behavior
percentage of men who agreed and strongly agreed with these statements was slightly higher than women in these categories. A majority of the respondents, and a slightly higher percentage of women than men, also agreed that they liked to set clear financial goals with timelines and dollar amounts (w: 90.3%, m: 85.6%). Similarly, more women than men said that they were less confident about their financial future (w: 79.4%, m: 84.2%) and were less sure of what they will need to live comfortably during retirement (m: 74.4%, w: 68.2%). More women than men reported that they wished they did not have to handle financial responsibilities (w: 40.0%, m: 25.3%) or to depend on their spouses (w: 39.7%, m: 21.3%). In this study, a larger percentage of men than women indicated that they were satisfied with their current financial situation (m: 70.7%, w: 65.6%).
Figure 33: Investor beliefs (“agree” and “strongly agree” responses in percent)
0102030405060708090
100
Financ
es aff
ect re
lation
ships
Depen
d on s
pouse
Wish
not to
hand
le res
ponsi
bility
Review
finan
cial in
formati
on in
Irrita
ted w
ith pe
ople
not p
lannin
g
Satisfi
ed w
ith cu
rrent
finan
ces
Clear id
ea of
need
s in re
tiremen
t
All Men Women
62

Gender Differences in Investment Behavior
Figure 34: Investor beliefs - continued (“agree” and “strongly agree” responses in percent)
0102030405060708090
100
Max co
ntribu
tions
Confid
ent o
n fina
ncial
ly sec
ure fu
ture
Automati
c dep
osits
Set cle
ar go
als
Like to
plan
for fu
ture
Financ
ial se
curity
impro
ves li
fe
Feel re
sponsi
ble fo
r well
-being
All Men Women
Table 18 presents the means and standard deviations for the above discussed measure for investor beliefs. Responses were rated on a five-point scale ranging from 1=strongly disagree, 2=disagree, 3=neutral, 4=agree, to 5=strongly agree. The means vary widely on this scale. The responses of women and men differed greatly on two statements: Women more often depended on their spouses financially (w: 2.80; m: 2.26) and wished they did not have to handle financial responsibilities (w: 2.83; m: 2.35).
63

Gender Differences in Investment Behavior
Table 18: Investor beliefs Variable Range All Men Women Mean (SD) Mean (SD) Mean (SD) General beliefs about finances (1=strongly disagree to 5=strongly agree)
Concerned that my financial situation is affecting my personal relationships
1-5 1.97 (0.904) 1.97 (0.916) 1.98 (0.883)
I depend on my spouse to provide for me financially 1-5 2.44 (1.170) 2.26 (1.103) 2.80 (1.218) Wish I did not have financial responsibilities 1-5 2.52 (1.234) 2.35 (1.173) 2.83 (1.284) Carefully review the financial information I receive in the mail
1-5 3.10 (1.134) 3.05 (1.149) 3.17 (1.105)
Irritated with people who don’t plan ahead and save or invest for their own future
1-5 3.27 (1.268) 3.27 (1.297) 3.28 (1.215)
Satisfied with my current financial situation 1-5 3.45 (1.114) 3.51 (1.089) 3.36 (1.155) Clear idea of what my financial needs will be during retirement
1-5 3.58 (1.078) 3.63 (1.043) 3.48 (1.133)
Maximize contributions to my retirement accounts 1-5 3.79 (1.136) 3.83 (1.127) 3.71 (1.151) Confident that I will have a financially secure future 1-5 3.84 (0.895) 3.89 (0.877) 3.74 (0.920) Important to set up automatic deposits to savings and investment accounts
1-5 4.08 (0.980) 4.06 (1.005) 4.13 (0.930)
Important to set clear financial goals with timelines and dollar amounts
1-5 4.02 (0.846) 3.99 (0.892) 4.08 (0.753)
Like to plan for my financial future 1-5 4.31 (0.692) 4.35 (0.694) 4.25 (0.687) Feeling financially secure improves the quality of my life
1-5 4.34 (0.658) 4.34 (0.650) 4.33 (0.674)
Responsible for my own financial well-being 1-5 4.48 (0.659) 4.56 (0.564) 4.33 (0.786)
64

Gender Differences in Investment Behavior
Investor attitudes This question explored investors’ attitudes toward investing. Participants responded to the following five statements: (a) Investing is exciting; (b) Investing is stressful; (c) Investing is satisfying; (d) Investing is difficult; and (e) Investing is time-consuming. Responses were rated on a five-point scale ranging from 1=strongly disagree, 2=disagree, 3=neutral, 4=agree, to 5=strongly agree. Table 19 shows the sample statistics of these measures for the full sample, and for men and women, respectively. Figure 35 illustrates the findings. The percentages in this figure represent how many respondents responded to 4=agree or 5=strongly agree to the five statements. Overall, we found that women find investing less exciting and satisfying than men. They also find investment decisions more stressful, difficult, and time-consuming than men. The majority of the men and women of our sample found investing a satisfying (80.0%) but time-consuming (74.2%) experience. More women than men in our sample stressed the time-related and mental efforts of investment decision-making. The men in our sample said more often than women did that they find investing exciting (m: 69.7%, w: 61.7%) or satisfying (m: 80.8%, w: 78.4%).
Figure 35: Investor attitudes (“agree” and “strongly agree” responses in percent)
0
10
20
30
40
50
60
70
80
90
100
Diffcult Exciting Time-consuming Stressful Satisfying
All Men Women
65
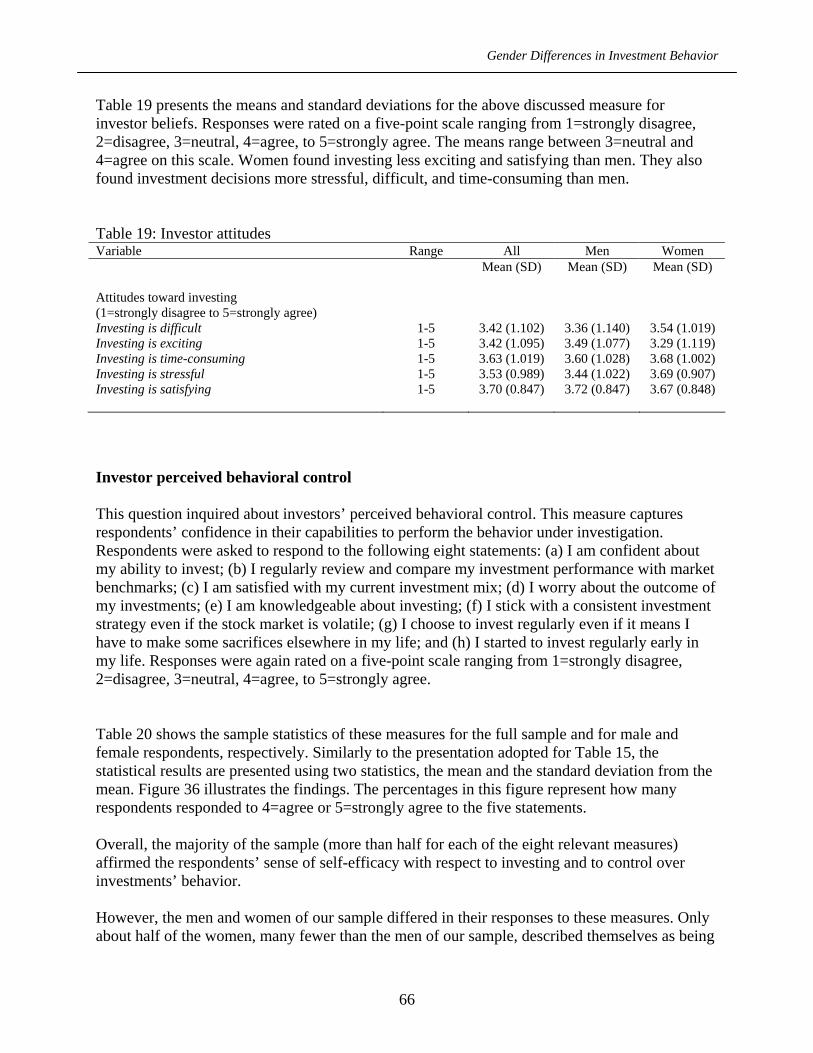
Gender Differences in Investment Behavior
Table 19 presents the means and standard deviations for the above discussed measure for investor beliefs. Responses were rated on a five-point scale ranging from 1=strongly disagree, 2=disagree, 3=neutral, 4=agree, to 5=strongly agree. The means range between 3=neutral and 4=agree on this scale. Women found investing less exciting and satisfying than men. They also found investment decisions more stressful, difficult, and time-consuming than men. Table 19: Investor attitudes Variable Range All Men Women Mean (SD) Mean (SD) Mean (SD) Attitudes toward investing (1=strongly disagree to 5=strongly agree)
Investing is difficult 1-5 3.42 (1.102) 3.36 (1.140) 3.54 (1.019) Investing is exciting 1-5 3.42 (1.095) 3.49 (1.077) 3.29 (1.119) Investing is time-consuming 1-5 3.63 (1.019) 3.60 (1.028) 3.68 (1.002) Investing is stressful 1-5 3.53 (0.989) 3.44 (1.022) 3.69 (0.907) Investing is satisfying 1-5 3.70 (0.847) 3.72 (0.847) 3.67 (0.848) Investor perceived behavioral control This question inquired about investors’ perceived behavioral control. This measure captures respondents’ confidence in their capabilities to perform the behavior under investigation. Respondents were asked to respond to the following eight statements: (a) I am confident about my ability to invest; (b) I regularly review and compare my investment performance with market benchmarks; (c) I am satisfied with my current investment mix; (d) I worry about the outcome of my investments; (e) I am knowledgeable about investing; (f) I stick with a consistent investment strategy even if the stock market is volatile; (g) I choose to invest regularly even if it means I have to make some sacrifices elsewhere in my life; and (h) I started to invest regularly early in my life. Responses were again rated on a five-point scale ranging from 1=strongly disagree, 2=disagree, 3=neutral, 4=agree, to 5=strongly agree. Table 20 shows the sample statistics of these measures for the full sample and for male and female respondents, respectively. Similarly to the presentation adopted for Table 15, the statistical results are presented using two statistics, the mean and the standard deviation from the mean. Figure 36 illustrates the findings. The percentages in this figure represent how many respondents responded to 4=agree or 5=strongly agree to the five statements. Overall, the majority of the sample (more than half for each of the eight relevant measures) affirmed the respondents’ sense of self-efficacy with respect to investing and to control over investments’ behavior. However, the men and women of our sample differed in their responses to these measures. Only about half of the women, many fewer than the men of our sample, described themselves as being
66

Gender Differences in Investment Behavior
confident (w: 49.8%, m: 70.4%) or knowledgeable about investing (w: 50.4%, m: 69.5%), or to review and compare regularly their investments’ performance with market benchmarks (w: 49.1%, m: 65.7%). While women perceived less investment control than men, the difference was less than 10 percentage points with respect to having a consistent investment strategy, being satisfied with current investment allocation, investing regularly, and having started investing early in life.
Figure 36: Perceived behavioral control (“agree” and “strongly agree” responses in percent)
0
10
20
30
40
50
60
70
80
90
100
Consis
tent st
rateg
y
Satisfi
ed w
ith m
ix
Confid
ent a
bout
abilit
y
Knowled
geab
le ab
out in
vesti
ng
Invest
regu
larly
Review
perfo
rman
ce
Worr
y abo
ut ou
tcomes
Started
early
in lif
e
All Men Women
Table 20 presents the means and standard deviations for the above discussed measure for investor beliefs. Responses were rated on a five-point scale ranging from 1=strongly disagree, 2=disagree, 3=neutral, 4=agree, to 5=strongly agree. The means range between 3=neutral and 4=agree on this scale. With respect to all measures, women had less confidence in their investor abilities.
67

Gender Differences in Investment Behavior
Table 20: Respondents’ perceived investment control Variable Range All Men Women Mean (SD) Mean (SD) Mean (SD) Perceived behavioral control (1=strongly disagree to 5=strongly agree) I stick with a consistent investment strategy even if the stock market is volatile
1-5 3.73 (0.962) 3.80 (0.959) 3.61 (0.958)
I am satisfied with my current investment mix 1-5 3.67 (0.940) 3.70 (0.941) 3.61 (0.938) I am confident about my ability to invest 1-5 3.32 (1.103) 3.50 (1.038) 2.98 (1.142) I am knowledgeable about investing 1-5 3.32 (1.059) 3.47 (1.019) 3.05 (1.080) I choose to invest regularly even if it means I have to make some sacrifices elsewhere in my life
1-5 3.43 (1.126) 3.47 (1.118) 3.37 (1.139)
I regularly review and compare my investment performance with market benchmarks
1-5 3.27 (1.196) 3.43 (1.166) 2.99 (1.200)
I worry about the outcome of my investments 1-5 3.15 (1.159) 3.22 (1.171) 3.01 (1.124) I started to invest regularly early in my life 1-5 3.18 (1.184) 3.20 (1.201) 3.16 (1.153) Opinions toward financial advisors To explore participants’ opinions towards financial advisors, they were presented with four statements: (a) Financial advisors provide the information people need to make informed decisions; (b) Financial advisors pressure people into making high risk investments; (c) Financial advisors listen carefully to concerns and questions; and (d) Financial advisors charge too much for their services. Their responses were measured on a five-point scale, ranging from 1=strongly disagree, 2=disagree, 3=neutral, 4=agree, to 5=strongly agree. Table 21 shows the sample statistics of these measures for the total sample and for men and women respectively. Figure 37 illustrates the findings visually; the percentages presented in this figure represent sum of two responses, agree and strongly agree, for each of the five statements. A large majority of the respondents agreed or strongly agreed that financial advisors provide information needed to make investment decisions. A slightly smaller percentage, but still a majority, also agreed that financial advisors listen carefully (76.0%). More men than women in our sample reported feeling pressured (m: 34.8%, w: 27.7%) from such advisors, whom they also felt charged too much (m: 51.2%, w: 46.3%).
68

Gender Differences in Investment Behavior
Figure 37: Experience with financial advisors (“agree” and “strongly agree” responses” in percent)
0
10
20
30
40
50
60
70
80
90
100
Provide information Listen carefully Charge too much Pressure people
All Men Women
In Table 21 we present statistical information that clearly shows the gender differences in opinions about financial advisors. This table contains four statements; two statements contain positive views about the financial advisors (they listen carefully and they provide information that people need), and two statements contain negative opinions about the financial planners (they charge too much and they pressure people into making high risk investments). From the review of mean and standard deviation statistics for all these statements it appears that more women than men hold favorable opinions about financial advisors. Mean statistics for the two positive statements are higher for women than men, and the mean statistics for two negative statements are lower for women than men.
69
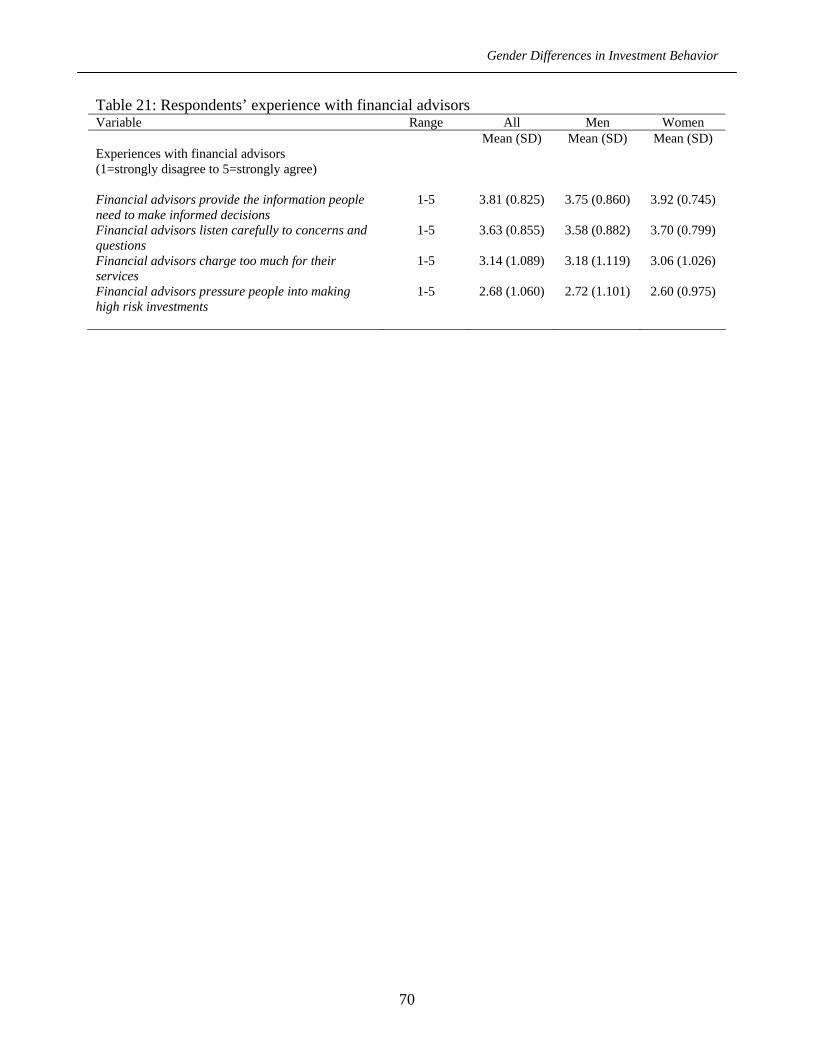
Gender Differences in Investment Behavior
Table 21: Respondents’ experience with financial advisors Variable Range All Men Women Mean (SD) Mean (SD) Mean (SD) Experiences with financial advisors (1=strongly disagree to 5=strongly agree) Financial advisors provide the information people need to make informed decisions
1-5 3.81 (0.825) 3.75 (0.860) 3.92 (0.745)
Financial advisors listen carefully to concerns and questions
1-5 3.63 (0.855) 3.58 (0.882) 3.70 (0.799)
Financial advisors charge too much for their services
1-5 3.14 (1.089) 3.18 (1.119) 3.06 (1.026)
Financial advisors pressure people into making high risk investments
1-5 2.68 (1.060) 2.72 (1.101) 2.60 (0.975)
70

CON
CLUSIO
N AN
D IMPLICATIO
NS
Gender Differences in Investment Behavior*
CONCLUSION AND IMPLICATIONS

Gender Differences in Investment Behavior
7. Conclusion and implications The average participant in this study was a forty-nine-year-old, highly educated, white, married, employed, professional man who lived in a three-member household. The participants in this study represented American investors with average annual household incomes of $126,290, average total assets of $1,129,477, and average debt of $231,791. However, female participants reported lower annual income, had fewer assets, and more obligations than men. These findings are consistent with findings reported by Anthes and Most (2000) and Bajtelsmit and Bernasek (1996). Investor financial management behavior While both women and men were involved in money management tasks, women more frequently reported being responsible for these tasks than men. While more women held responsibility for the daily money management tasks, men were more likely to be in charge of investment-related activities. Other studies have also reported similar findings (Lindamood and Hanna 2005; Meier, Kirchler, and Christian-Hubert 1999). Although the vast majority of participants reported reviewing their investments at least once during the twelve months prior to the interview, men and women varied in how they responded to this review. Men were more likely to make adjustments to their investments, either by increasing their amount or by altering their investment mix. Women, however, were more likely to seek the advice of a financial professional. Investor decision-making processes Sources of financial information Both men and women identified financial advisors and print media as their major sources for financial information. This finding is inconsistent with the information they provided on actual visits to financial planners within the past twelve months. Women were more likely than men to have visited a financial planner within this time frame. Similarly, women were more likely than men to plan a consultation with a financial planner within the upcoming six months. While women preferred to get investment information from financial advisors, they also reported consulting with friends and colleagues. Men were more likely than women to learn about investments on their own rather than from talking to other people. These results are consistent with what was reported in our study on financial learning at the workplace (Loibl and Hira 2006). Contrary to a recent study on sources of economic information (Blinder and Krueger 2004) where television was the number one source of information, television played a minor role for the information gathering in this study.
71

Gender Differences in Investment Behavior
Use of computer and Internet Women and men also differed in their use of computer-based investment tools, particularly the Internet. Men reported much more frequent use and greater comfort with computer-based tools. These findings are consistent with other studies addressing women’s reluctance in using computer technology (Bredin 1999). The results may point toward challenges of this medium, such as the experience needed for locating documents related to one’s interests by browsing the Internet with search engines, the difficulty in verifying the reliability of information resources (Ciccotello and Wood 2001), or the lack of personal computers or access to the Internet at home (U.S. Department of Commerce 2004). While reluctance to use personal computers and the Internet has been reported in the literature, our study is unique in exploring the reasons for these preferences. We learned that people do not use computers or the Internet because they have security concerns and find web sites confusing. In addition, some simply prefer working with people over working with machines. Investment decision-making process Following the framework of the Transtheoretical Model of Change (Prochaska, Redding, and Evers 2002), we inquired about investment action steps taken recently and planned for the near future. Both women and men said that evaluating risk was their foremost criterion used prior to making an investment decision. Other considerations mentioned by fewer respondents were investment returns, market conditions, other investment options, and investment goals. Men were willing to take more risks than women. (Yao and Hanna 2005) also found that men preferred above-average or substantial risk and women preferred average or below-average risk. When an investment did not produce expected returns, both women and men preferred to wait, giving the investment more time to perform. Men were more likely than women to make investment changes, which echoed the earlier finding that, in response to investment review, men were more likely than women to adjust their investments. These findings affirm the notion of male overconfidence in stock investments reported by (Barber and Odean 2001). Women tended to wait out a non-producing investment and also continued to display a preference for consulting with an advisor. Change in investment involvement More than half of the respondents reported that their involvement in saving and investment has increased over the years in a gradual process. Men and women differed, however, in the reasons this involvement had changed. Women were more likely than men to change investment involvement in response to a critical incident. When questioned about these incidents, both women and men reported marriage as the single largest event that changed their involvement. Apart from marriage, however, the financial significance accorded to critical life events began to vary decisively by gender. Women reported changing their investment involvement at higher rates than men in response to the arrival of children or the death of a family member, while men reported retirement and sudden gain as
72

Gender Differences in Investment Behavior
more common agents of change. The largest gap between women and men occurred in the financial significance of divorce. For women, divorce was second only to marriage and children as a cause of financial involvement. For men, it was the least likely event to change their investment involvement. Investor socialization Most participants, women as often as men, reported that their parents discussed money and money-related issues with them. This finding is supported by social learning theory (Bandura 1977), which asserts that an individual gains knowledge and develops behaviors through interaction within a social network. While women and men reported equal parental interactions regarding money management, they did not report equal parental influences. Women were more influenced by their mothers and men were more influenced by their fathers. Men also reported that teachers and other adults had an impact on their money management and investment decisions more often than women did. Attitudes and beliefs about investing Overwhelmingly, respondents enjoyed learning about investing and were interested in the details, particularly if the information was provided by a knowledgeable person. In accordance with the measures employed in the Theory of Planned Behavior (Ajzen 1985), a set of three questions inquired were asked about behaviors such as beliefs, attitudes, and perceived behavioral control. By measuring investors’ beliefs, we gained insight into the underlying mind set, i.e., we explored why people held certain investment attitudes, subjective norms, and perceptions of behavioral control. This information will prove invaluable for designing effective guidelines of educational intervention. Salient beliefs of the respondents included, for example, the feeling of being responsible for one’s well-being, beliefs that financial security improves their lives, and beliefs that financial matters needed to be planned with clear goals in mind. Investor attitudes expressed respondents’ evaluations of their own investment behavior. Men and women differed quite decisively in their evaluations. Women found investing less exciting and satisfying than men. They also found investment decisions more stressful, difficult, and time-consuming than men. The measures of perceived behavioral control captured people’s confidence that they would be capable of performing the behavior under investigation. The men and women of our sample differed in their responses to these measures. Only about half of the women, considerably less than the men of our sample, described themselves as being confident or knowledgeable about investing or regularly reviewing and comparing their investments’ performance with market benchmarks. This finding is in line with literature in the field stating that women investors exhibit, in general, lower investment confidence, and a rather conservative record of investment
73

Gender Differences in Investment Behavior
behaviors (Embrey and Fox 1997; Bernasek and Shwiff 2001; Jianakoplos and Bernasek 1998; Powell and Ansic 1997; Prince 1993) The styles in which men and women preferred to learn about investments also varied. Women preferred instructor-based learning and men preferred self-directed learning. The single most preferred means of learning about investment for both men and women was to consult with a knowledgeable person, such as a financial advisor. While both ranked consultation with a financial advisor as important, women and men varied in how they felt about them. Women were more likely to describe financial advisors as sources of information and careful listeners; men were more likely to describe financial advisors as exerting too much pressure and charging too much for their services. Implications In general, the results of this survey have raised some important questions; these questions provide guidance for developing the next set of analysis and for establishing a shared context for learning and a focus for exploring the underlying beliefs held by women about the management of money and investments. Some questions the survey results raise, for example, are: Fewer women than men participated in this survey. Does this mean women lack access to
this information or authority in their homes to share this information? Is the low level of participation due to a lack of confidence? Is there anyway to note how many men and women contacted for the study refused to participate?
Among the white participants the majority of respondents was male, but among African-Americans the majority was female. Are women of color more likely to assume control of money matters in their family? Are they more confident than white women? Is this indicative of the predominance of women of color as the family head of household? This issue of racial difference could have curricular and instructional implications and it would be important to explore the issue of race in greater depth in the educational program.
More women are in charge of daily money management than men. Educationally, it would be important to explore with women why they see daily money management as their responsibility. Also, as discussed in a later finding, there is a need to understand why women are less focused on or interested in long-term money management.
Women prefer less risk than men when it comes to money matters. Educationally, it would be important to explore what participants perceive as risk. What does it mean to experience no risk, below average risk, or average risk when it comes to money matters and investments?
A majority of the women reviewed performance of their investments over the previous twelve months. What does reviewing performance mean? This seems open to a wide range of interpretations. It would be important to explore this behavior, and respondents’ definitions of this term, in greater depth.
The frequency of parental conversations about money with children, and the triggers for those conversations, needs to be further explored. Is money only discussed when it is a problem? Are parents regularly sharing the financial challenges of daily living with their
74

Gender Differences in Investment Behavior
children? More importantly, how do we make “money worries” (crises, debts, etc.) learning opportunities for both the women and their children?
Many respondents prefer waiting when investments do not produce results. Why? This needs to be explored in greater depth in a workshop on investment education. For women in particular, is this due to their more conservative approach to investing, or to a lack of understanding of how to respond to poorly performing investments? Curricular implications should include assessment strategies for poorly performing and strategies for responding to these investments in a timely and responsible manner.
Women are less confident than men about their financial futures, about their knowledge of their retirement needs, and about their present financial situations. Women are more dependent than men on their spouses for financial security. What areas/issues concerning money and investments are they least confident about? This issue needs to be further explored.
Women find investing more stressful and less exciting than men. Why, and what do women find so stressful about investing? It is likely to be related to their perception of risk?
In view of the discussion above, we can see that there are some dominant themes that begin to emerge from this analysis. These dominant themes will provide the basis for further analysis and guidance in developing recommendations for general financial education materials and an investment educational program for women. It is clear that such materials and programs would have to be grounded in the everyday realities of the lives of the female learner. In other words, it needs to be relevant, realistic and of interest to the needs of women. An investment educational program for women also needs to provide investment strategies that are responsive to their concerns and appreciative of the high demands they experience in their everyday life. The educational materials must prepare women to be both critical of the available financial investments instruments and aware of their surroundings’ roles (e.g., family, culture, and media) in shaping their confidence and influencing their decisions about money matters and investments. The overall objective of the fourth phase of this study is to conduct further analysis to explore significant relationships among sets of variables such as socio-economic characteristics, socialization, beliefs, financial behaviors, investment decision-making processes, etc., to develop dominant themes. These themes will provide the basis for the development of financial and investment educational programs, materials, and educational approaches to learning for investors in general but for women in particular. Next steps in the grant project It is obvious from the preliminary results presented here that this study has generated in-depth and comprehensive information about the financial and investment behaviors of high-income households while highlighting the gender differences. The descriptive analysis presented in this report is the first step toward a better understanding of these behaviors. The next step is to explore the relationships among behavioral patterns and socio-economic and environmental factors to provide explanations and interpretations of the existing behaviors and
75

Gender Differences in Investment Behavior
beliefs. Results of this further analysis will be critical for the development of educational and informational strategies and products useful for educators (formal and informal settings) and the financial services professional. Objectives for the next phase of the study (Milestone 4) can be divided into two areas: research and education. Research Determine how personal characteristics, such as age, marital status, education, employment
status, occupation, job position, and environmental forces affect investment behavior and the investment decision-making process;
Provide empirical evidence to show that socialization and acculturalization play significant roles in the abilities and comfort of investors in making financial decisions, and explain how socialization and acculturalization impact the level of knowledge, information, experience, and confidence necessary to make investment decisions;.
Analyze whether, when, and to what extent women make long-term financial decisions independently;
Describe the role that male partners play in investment decision-making; Determine the factors (such as socialization, investment information/knowledge, experiences,
and investor confidence) that may help explain why gender differences in financial and investment behaviors exist.
Education Explain how research results can guide investment education to be effective in influencing
investment behavior among women and identify the learning environment that is conducive to enhance investment learning among female investors;
Identify “teachable moments” and appropriate strategies to use those moments to effectively teach key investment topics;
Use the concept of transformative pedagogy to propose a new approach to investment education;
Develop inquiry-based educational, instructional, and learning materials and strategies, particularly to meet the needs of female investors.
76

REFERENCES
Gender Differences in Investment Behavior*
REFERENCES
Gender Differences in Investment Behavior
8. References Ajzen, Icek. 1985. From intentions to actions: A theory of planned behavior. In Action control:
From cognition to behavior, edited by J. Kuhl and J. Beckmann. Berlin: Springer. Anthes, William L., and Bruce W. Most. 2000. Frozen in the headlights: The dynamics of
women and money. FPA Journal (September). Bajtelsmit, Vickie L., and Alexandra Bernasek. 1996. Why do women invest differently than
men? Financial Counseling and Planning 7:1-10. Bandura, Albert. 1977. Social learning theory. Englewood Cliffs: Prentice Hall. Barber, Brad, and Terrance Odean. 2001. Boys will be boys: Gender, overconfidence, and
common stock investment. The Quarterly Journal of Economics 116 (1):261-292. Bernasek, Alexandra, and Stephanie Shwiff. 2001. Gender, risk, and retirement. Journal of
Economic Issues 35 (2):345-356. Blinder, Alan S., and Alan B. Krueger. 2004. What does the public know about economic policy,
and how does it know it? Brookings Papers on Economic Activity (1):327-387. Bredin, Renae. 1999. Teaching gender and technology in the same room: A case study.
Transformations 10 (1):78 ff. Ciccotello, Conrad S., and Russell E. Wood. 2001. An investigation of the consistency of
financial advice offered by web-based sources. Financial Services Review 10 (1-4):5-18. Embrey, Lori C., and Jonathan J. Fox. 1997. Gender differences in the investment decision-
making process. Financial Counseling and Planning 8 (2):33-40. Groves, Robert M. 2004. Survey methodology, Wiley-Interscience. Hoboken: John Wiley &
Sons. Jianakoplos, Nancy A., and Alexandra Bernasek. 1998. Are women more risk averse? Economic
Inquiry 36:620-630. Lindamood, Suzanne , and Sherman D. Hanna. 2005. Determinants of the wife being the
financially knowledgeable spouse. Paper read at Academy of Financial Services Annual Conference, at Chicago.
Loibl, Cäzilia, and Tahira K. Hira. 2006. A workplace and gender-related perspective on financial planning information sources and knowledge outcomes. Financial Services Review 15 (1):21-42.
Meier, Katja, Erich Kirchler, and Angela Christian-Hubert. 1999. Savings and investment decisions within private households: Spouses' dominance in decisions on various forms of investment. Journal of Economic Psychology 20:499-519.
Powell, Melanie, and David Ansic. 1997. Gender differences in risk behaviour in financial decision-making: an experimental analysis. Journal of Economic Psychology 18:605-628.
Prince, Melvin. 1993. Women, men, and money styles. Journal of Economic Psychology 14 (1):175-182.
Prochaska, James O., Colleen A. Redding, and Kerry E. Evers. 2002. The transtheoretical model and stages of change. In Health behavior and health education, edited by K. Glanz, B. K. Rimer and F. M. Lewis. San Francisco: Jossey-Bass.
U.S. Department of Commerce. 2004. A Nation Online: Entering the Broadband Age Retrieved on September 22, 2005, from http://www.ntia.doc.gov/reports/anol/index.html.
Yao, R., and Sherman D. Hanna. 2005. The effect of gender and marital status on financial risk tolerance. Journal of Personal Finance 4 (1):66-85.
77

APPENDIX
Gender Differences in Investment Behavior*
APPENDIX

Gender Differences in Investment Behavior
9. Appendix The appendix includes the telephone interview questionnaire and the screening questions used to identify eligible households for the survey. Telephone interview questionnaire 1. First I’ll ask some background questions about you and your early experiences with money.
When you were growing up, how often . . . (Would you say never, sometimes or often?) Never Some-
times Often
a. did your parents talk with you about how to handle money? 1 2 3 b. did your parents talk with you about the importance of saving
money for the future? 1 2 3
c. did your parents display concern or worry about money matters? 1 2 3 2. When you were growing up, who influenced you the most in your understanding of how to
handle money? Would you say . . . 1 = your father, 2 = your mother, 3 = both of your parents equally, 4 = your brothers or sisters, 5 = your grandparents, 6 = or other adults?
3. When you were growing up, how financially secure did you feel that your family was? Using
a scale from 1 to 5, where 1 means not at all secure and 5 means very secure, which number would you choose?
1 = not at all secure 2 = not secure 3 = neither nor 4 = secure 5 = very secure
4a. Do you recall any specific learning events or experiences (from your early years / when you
were growing up) that shaped the way you think about money? 1 = Yes 2 = No GO TO Q5
78

Gender Differences in Investment Behavior
4b. IF YES TO Q4a, ASK: What were these events or experiences? OPEN-ENDED
4c. IF YES TO Q4a, ASK: What did you learn from this? OPEN-ENDED 5. Currently, are you …
1 = employed full-time, 2 = employed part-time, 3 = retired, 4 = or not currently employed?
6. IF Q5 = 1 or 2, ASK: Which of the following categories best describes your current
occupation? Would you say . . . IF Q5 = 3 or 4, ASK: What has been your occupation most of your adult life? Would you say
. . . 1 = Business and Finance Management (Financial advisor/analyst, Accountant, Budget
analyst, Loan officer) 2 = Other Management (Top executives, Educational administrators, Labor relations
managers, Sales managers) 3 = Professional occupations (Engineers, Physicians, Attorneys, Educators, Architects) 4 = Technical occupations (Computer programmers, Medical technicians, Physical
therapists, Quality inspectors) 5 = Sales (Real estate sales, Insurance agents, Travel agents, Retail sales workers) 6 = Administrative Support (Secretaries, Records clerks, Postal clerks, Payroll clerks) 7 = Construction and Maintenance (Electricians, Carpenters, Plumbers, Mechanics,
Maintenance) 8 = Operatives (Truck drivers, Machinists, Machine operators, Assemblers, Fabricators) 9 = Service Occupations (Fire & Police officers, Food service workers, Beauticians,
Child care workers, Dental assistants) 10 = Homemaker 11 = Or something else? (Specify: _____________)
7. What is the highest level of schooling that you completed?
1 = Less than high school diploma 2 = High school diploma (includes GED) 3 = Some college, but no 4-year degree 4 = Bachelors degree 5 = Masters degree 6 = PhD, MD, DDS, etc.
79

Gender Differences in Investment Behavior
8. What is your current age? _____ years old 9. What is your current marital status? Are you …
1 = married, 2 = living as married, 3 = divorced, 4 = widowed, or 5 = single, never married?
10. CODE GENDER; IF UNKNOWN, ASK: Are you …
1 = male, or 2 = female?
11. How many people live in your household, including children away at college?
______________ number of household members 12. Are you Hispanic?
1 = Yes, Hispanic 2 = No, not Hispanic
13. Do you consider yourself to be . . . [CHECK ALL THAT APPLY]
1 = White, 2 = Black or African-American 3 = American Indian, Alaskan Native, 4 = Asian, or 5 = Another race? (Specify:____________)
14a. Is your current annual household income . . .
1 = from $50,000 up to $100,000, GO TO Q14b 2 = from $100,000 up to $150,000, GO TO Q14c 3 = from $150,000 up to $200,000, or GO TO Q14d 4 = more than $200,000 a year? GO TO Q15
14b. Would you say it is …
1 = from $50,000 up to $60,000, 2 = from $60,000 up to $70,000, 3 = from $70,000 up to $80,000 SKIP TO Q14 4 = from $80,000 up to $90,000, or 5 = from $90,000 up to $100,000?
80

Gender Differences in Investment Behavior
14c. Would you say it is … 1 = from $100,000 up to $110,000, 2 = from $110,000 up to $120,000, 3 = from $120,000 up to $130,000 SKIP TO Q14 4 = from $130,000 up to $140,000, or 5 = from $140,000 up to $150,000?
14d. Would you say it is …
1 = from $150,000 up to $160,000, 2 = from $160,000 up to $170,000, 3 = from $170,000 up to $180,000 SKIP TO Q14 4 = from $180,000 up to $190,000, or 5 = from $190,000 up to $200,000?
15. During the past 6 months, how often did you put money into some type of savings or
investment account? Would you say . . . 1 = every month (6) 2 = 3 to 5 months 3 = 1 or 2 months 4 = or you didn’t set aside any money during the past 6 months? 5 = NO SAVINGS/INVESTMENT ACCOUNT OF ANY KIND
16. Next I’ll read a list of financial assets and please tell me if you (FILL or your spouse) own
any of these. Do you . . . Asset Yes No
a. have a savings account? 1 2 b. have any certificates of deposit (CD)? 1 2 c. have an employer-provided retirement account? 1 2 d. IF YES TO 16c, ASK: Do you have any input in how the money in
your (employer-provided) retirement account is handled? 1 2
e. have a personal IRA or Keogh account? 1 2 f. own any annuities? 1 2 g. have life insurance with a cash value? 1 2 h. own any government savings bonds? 1 2 i. own any corporate bonds? 1 2 j. own any stocks? 1 2 k. own any mutual funds? 1 2 l. have any other financial assets? (IF YES: Specify________) 1 2
81

Gender Differences in Investment Behavior
17. Thinking of all of your financial assets combined, what would you estimate their total value to be?
$_________________ 18. Now think about your financial obligations, including any mortgages, loans, or credit card
debt. Approximately what is the total amount that your household owes? $_________________
19. IF MARRIED/LAM, ASK: In your household, who handles the daily money management,
such as paying bills? Is it . . . 1 = you, 2 = your spouse or partner, 3 = or both of you?
This next section is about investing money. For this study, we define investing as putting your money into assets that have the potential to either increase or decrease in value. Investment assets often are financial, like stocks or money markets, but they can also include things like real estate. Investing is using money to make money. Simply saving money would not be considered an investment. 20. What does investing mean to you? OPEN-ENDED 21. What role does investing play in your life? OPEN-ENDED 22. Who makes the investment decisions in your household? Would you say …
1 = you make decisions by yourself, 2 = IF MARRIED/LAM: your spouse (partner) makes decisions alone, 3 = IF MARRIED/LAM: you and your spouse (partner) make decisions together, 4 = you make decisions with others, 5 = IF MARRIED/LAM: your spouse makes the decisions with others, 6 = or your household investment decisions are made in another way?
23. IF Q23 = 4, 5, or 6, ASK: Who else is involved in your household’s investment decisions? OPEN-ENDED
82

Gender Differences in Investment Behavior
24. Think about the past 12 months. During the past 12 months, did you . . . Yes No
a. increase the amount you invest? 1 2 b. review your investment performance? 1 2 c. change your investment mix? 1 2 d. consult with a financial advisor? 1 2 e. learn about a new investment concept or product? 1 2 25. Now think about the future, the next 3 months. During the next 3 months, do you plan to . . .
Yes No Maybe a. increase the amount you invest? 1 2 3 b. review your investment performance? 1 2 3 c. change your investment mix? 1 2 3 d. consult with a financial advisor? 1 2 3 e. learn about a new investment concept or product? 1 2 3 26. I’ll read some statements about people who might have advised you about saving or
investing. For each one please tell me if you strongly disagree, disagree, agree, or strongly agree.
Statements SD D N A SA a. My parents advised me when I was young on how to
invest. 1 2 3 4 5
b. I had teachers in school who taught me how to invest. 1 2 3 4 5 c. My friends have given me good investment advice. 1 2 3 4 5 d. My family members have given me good investment
advice. 1 2 3 4 5
83
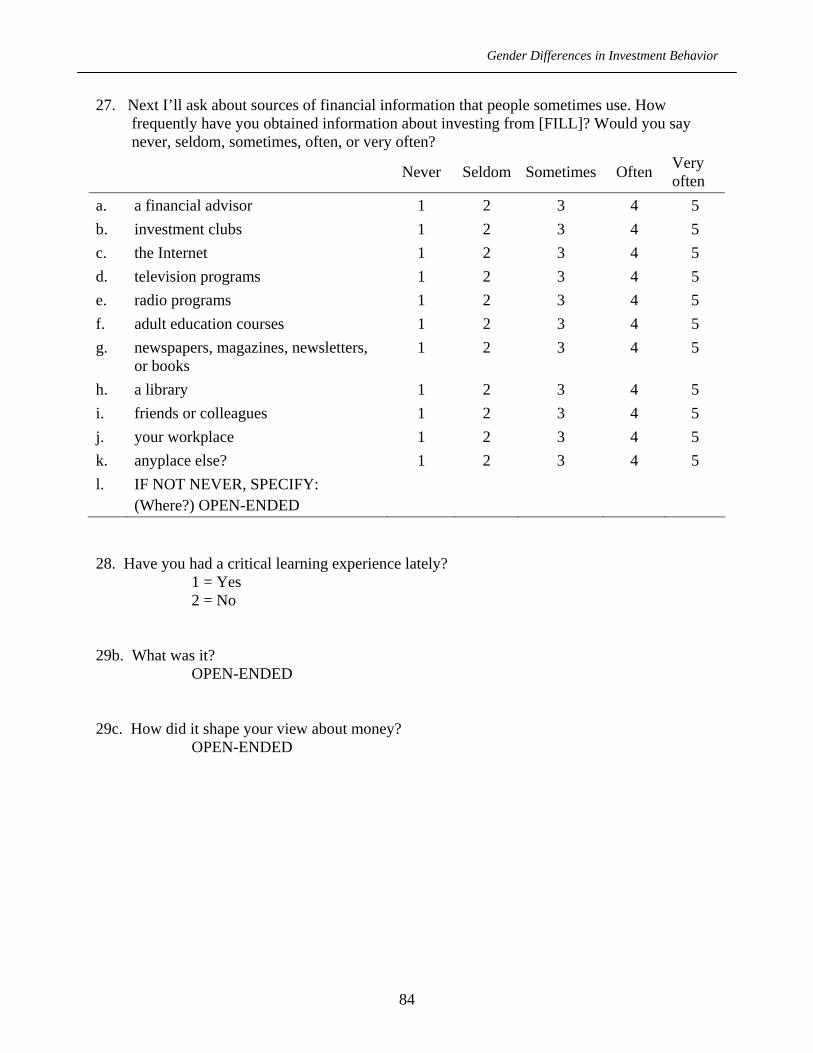
Gender Differences in Investment Behavior
27. Next I’ll ask about sources of financial information that people sometimes use. How frequently have you obtained information about investing from [FILL]? Would you say never, seldom, sometimes, often, or very often?
Never Seldom Sometimes Often Very often
a. a financial advisor 1 2 3 4 5 b. investment clubs 1 2 3 4 5 c. the Internet 1 2 3 4 5 d. television programs 1 2 3 4 5 e. radio programs 1 2 3 4 5 f. adult education courses 1 2 3 4 5 g. newspapers, magazines, newsletters,
or books 1 2 3 4 5
h. a library 1 2 3 4 5 i. friends or colleagues 1 2 3 4 5 j. your workplace 1 2 3 4 5 k. anyplace else? 1 2 3 4 5 l. IF NOT NEVER, SPECIFY:
(Where?) OPEN-ENDED 28. Have you had a critical learning experience lately?
1 = Yes 2 = No
29b. What was it? OPEN-ENDED 29c. How did it shape your view about money? OPEN-ENDED
84

Gender Differences in Investment Behavior
30. Now I’ll read some statements relating to your attitudes toward learning about investing. Again, please tell me if you strongly disagree, disagree, agree, or strongly agree with each one.
Statement SD D N A SA a. I enjoy learning new things about investing. 1 2 3 4 5 b. I like to attend investment seminars. 1 2 3 4 5 c. When I need investment information, I prefer to talk to a
person rather than read about it. 1 2 3 4 5
d. When I see something that I don’t understand about investments, I stay away from it. 1 2 3 4 5
e. I am not really interested in learning more about investing. 1 2 3 4 5 f. IF USES FINANCIAL ADVISOR (Q29a), ASK: If I am
looking for information on investing, I won’t talk to an advisor until I’ve thoroughly researched it myself.
1 2 3 4 5
g. When I’m learning something new about investing, I want to know just the main points and the bottom line. 1 2 3 4 5
h. When I’m learning something new about investing, I want to know all the details in fine print. 1 2 3 4 5
i. When I’m learning something new about investing, I would rather read about it myself, so I can take my time and process the information.
1 2 3 4 5
31. The next questions ask about the use of computer-related investment tools. First, how often
do you [FILL]? Would you say never, seldom, sometimes, often, or very often? Never Seldom Sometimes Often Very
often a. get investment information over the
Internet? 1 2 3 4 5
b. use personalized market watch websites? 1 2 3 4 5 c. buy or sell investments over the Internet?
(Internet trading) 1 2 3 4 5
d. read e-mail investment newsletters 1 2 3 4 5 e. use investment analysis software? 1 2 3 4 5 f. use investment management software? 1 2 3 4 5
85
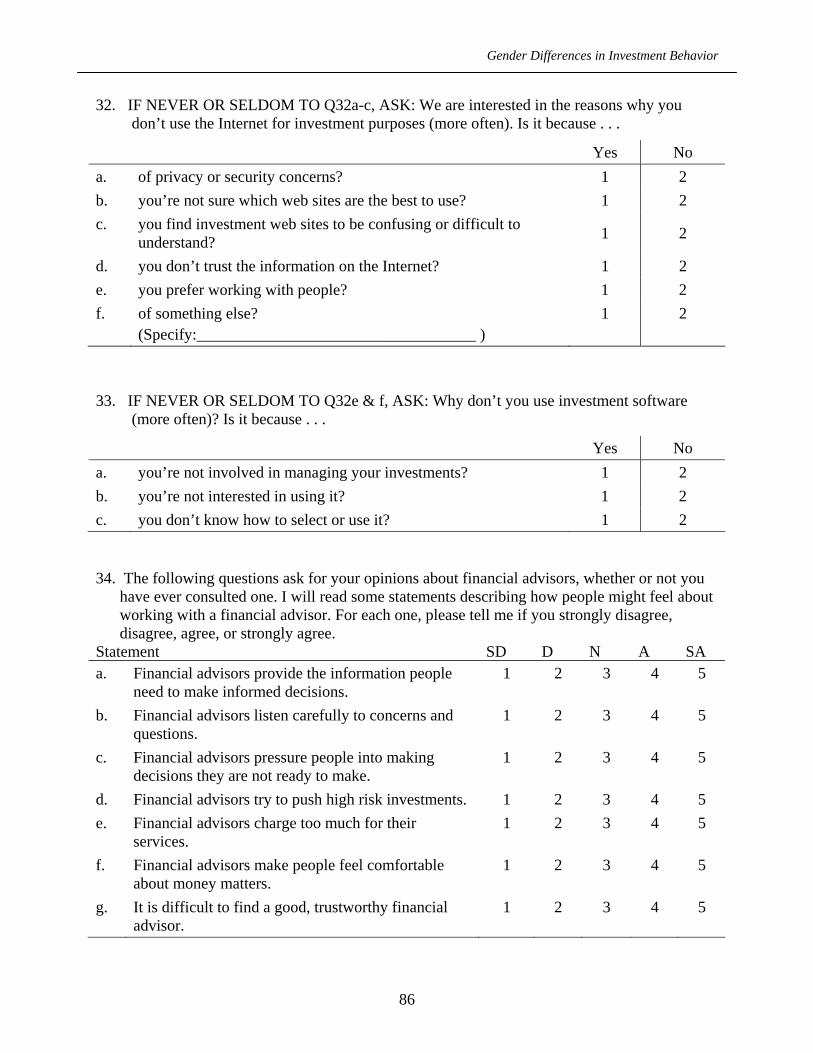
Gender Differences in Investment Behavior
32. IF NEVER OR SELDOM TO Q32a-c, ASK: We are interested in the reasons why you don’t use the Internet for investment purposes (more often). Is it because . . .
Yes No a. of privacy or security concerns? 1 2 b. you’re not sure which web sites are the best to use? 1 2 c. you find investment web sites to be confusing or difficult to
understand? 1 2
d. you don’t trust the information on the Internet? 1 2 e. you prefer working with people? 1 2 f. of something else?
(Specify:___________________________________ ) 1 2
33. IF NEVER OR SELDOM TO Q32e & f, ASK: Why don’t you use investment software (more often)? Is it because . . .
Yes No a. you’re not involved in managing your investments? 1 2 b. you’re not interested in using it? 1 2 c. you don’t know how to select or use it? 1 2 34. The following questions ask for your opinions about financial advisors, whether or not you
have ever consulted one. I will read some statements describing how people might feel about working with a financial advisor. For each one, please tell me if you strongly disagree, disagree, agree, or strongly agree.
Statement SD D N A SA a. Financial advisors provide the information people
need to make informed decisions. 1 2 3 4 5
b. Financial advisors listen carefully to concerns and questions.
1 2 3 4 5
c. Financial advisors pressure people into making decisions they are not ready to make.
1 2 3 4 5
d. Financial advisors try to push high risk investments. 1 2 3 4 5 e. Financial advisors charge too much for their
services. 1 2 3 4 5
f. Financial advisors make people feel comfortable about money matters.
1 2 3 4 5
g. It is difficult to find a good, trustworthy financial advisor.
1 2 3 4 5
86

Gender Differences in Investment Behavior
35. Generally speaking, are you willing to take … 1 = substantial financial risks to earn substantial returns, 2 = above average risks for above average returns, 3 = average risks for average returns, 4 = below average risks for below average returns, 5 = or no financial risks at all?
36. How would you rate your tolerance for the stress associated with making investment
decisions? Would you say your tolerance for stress like this is … 1 = very high, 2 = high, 3 = neither high nor low, 4 = low, or 5 = very low?
37. The following statements describe a variety of emotions that can be associated with
investing money. Please tell me whether you strongly disagree, disagree, agree, or strongly agree with each of these statements.
SD D N A SA a. Investing is exciting. 1 2 3 4 5 b. Investing is satisfying. 1 2 3 4 5 c. Investing is difficult. 1 2 3 4 5 d. Investing is scarey. 1 2 3 4 5 e. Investing is time-consuming. 1 2 3 4 5
87

Gender Differences in Investment Behavior
IF Q16d, e, h, i, j, k, or l = 1 (Yes), ASK: 38. Now I will read some other statements about investment activities and decisions. Please tell
me whether you strongly disagree, disagree, agree, or strongly agree with each of these statements.
SD D N A SA a. I am confident about my ability to invest. 1 2 3 4 5 b. I keep myself up-to-date on investment information. 1 2 3 4 5 c. I regularly review and compare my investment
performance with market benchmarks. 1 2 3 4 5
d. I make changes in my investments as needed. 1 2 3 4 5 e. I match my investments to my goals. 1 2 3 4 5 f. I am satisfied with my current investment mix. 1 2 3 4 5 g. I often worry about the outcome of my investments. 1 2 3 4 5 h. I feel proud when I make good investment decisions. 1 2 3 4 5 i. I am knowledgeable about investing. 1 2 3 4 5 j. I regularly make investment decisions on my own. 1 2 3 4 5 k. I stick with a consistent investment strategy even if the
stock market is volatile. 1 2 3 4 5
l. I choose to invest regularly even if it means I have to make some sacrifices elsewhere in my life. 1 2 3 4 5
m. I wish I had started to invest regularly much earlier in my life. 1 2 3 4 5
n. I would rather have someone else manage my investments than deal with it myself. 1 2 3 4 5
o. IF MARRIED, ASK: My spouse and I regularly discuss our investments. 1 2 3 4 5
88

Gender Differences in Investment Behavior
IF Q16d, e, h, i, j, k, or l = 1 (Yes), ASK: 39. Before you make specific investment decisions, how often do you first [FILL].
(Would you say never, seldom, sometimes, often, or always?) Never Seldom Some-
times Often Always
a. review your overall investment goals? 1 2 3 4 5 b. assess your risk tolerance level? 1 2 3 4 5 c. determine your return objective for the
investment? 1 2 3 4 5
d. consider a variety of investment options? 1 2 3 4 5 e. check the current financial market condition? 1 2 3 4 5 f. talk with family or friends who are
knowledgeable about investing? 1 2 3 4 5
g. consult with a financial advisor? 1 2 3 4 5 IF Q16d, e, h, i, j, k, or l = 1 (Yes), ASK: 40. When your investments do not produce the results that you hoped for, how often do you
[FILL]? (Would you say never, seldom, sometimes, often, or always?) Never Seldom Some-
times Often Always
a. make necessary changes to try to improve investment performance
1 2 3 4 5
b. wait it out, anticipating future improvements over the long run?
1 2 3 4 5
c. consult with a financial advisor before taking any further action?
1 2 3 4 5
89

Gender Differences in Investment Behavior
41. These next statements relate to general beliefs about finances. Please tell me whether you strongly disagree, disagree, agree, or strongly agree with each one.
Statements SD D N A SA a. I am responsible for my own financial well-being. 1 2 3 4 5 b. I like to plan for my financial future. 1 2 3 4 5 c. I have a fair amount of control over my financial well-
being. 1 2 3 4 5
d. It is important to set clear financial goals with timelines and dollar amounts. 1 2 3 4 5
e. I get irritated with people who don’t plan ahead and save or invest for their own future. 1 2 3 4 5
f. I wish I did not have to handle financial responsibilities. 1 2 3 4 5
42. How important do you think it is to [FILL]? (Would you say not important, somewhat
important, or very important?) Not
Important Somewhat Important
Very Important
a. set up automatic deposits to savings and investment accounts?
1 2 3
b. carefully review financial information received in the mail?
1 2 3
c. maximize contributions to retirement accounts? 1 2 3 43. These next statements relate to your financial situation, both now and in retirement. For each
one, please tell me whether you strongly disagree, disagree, agree, or strongly agree. Statements SD D N A SA a. I am satisfied with my current financial situation. 1 2 3 4 5 b. I can function better in my job when I feel financially
secure. 1 2 3 4 5
c. I can function better in society when I feel financially secure. 1 2 3 4 5
d. IF MARRIED, ASK: I depend on my spouse to provide for me financially. 1 2 3 4 5
e. I am concerned that my financial situation is affecting my personal relationships. 1 2 3 4 5
f. I am confident that I will have a financially secure future. 1 2 3 4 5 g. I have a clear idea of what my financial needs will be
during retirement. 1 2 3 4 5
90

Gender Differences in Investment Behavior
44. Over the years, would you say that your involvement in saving and investing has . . . 1 = decreased 2 = remained fairly stable 3 = or increased? 4 = VARIED, UP AND DOWN (if offered) 5 = NO INVOLVEMENT (if offered)
45. IF DECREASED, INCREASED, OR VARIED (Q44 = 1,3,4, or DK), ASK:
Have these changes been gradual over time, or have there been specific events in your life that caused these changes?
1 = Gradual over time 2 = Events changed involvement
46a. IF EVENTS (Q45 = 2), ASK: What types of life events were they? Would you say . . . CHECK ALL THAT APPLY.
1 = marriage 2 = having children 3 = divorce 4 = illness 5 = death 6 = employment changes 7 = sudden financial gain 8 = retirement 9 = or something else? (46b. Specify:______________________________ )
46c. IF Q46b INCLUDES 7 (“sudden financial gain”), ASK: You mentioned a sudden financial
gain. What type of situation was that? OPEN-ENDED 47. IF EVENTS (Q45 = 2), ASK: What did you learn from these experiences that influenced
how you think of saving or investing? OPEN-ENDED
91

Gender Differences in Investment Behavior
48. The following statements describe how people might feel about money and the role of money in their lives. Please tell me whether you strongly disagree, disagree, agree, or strongly agree with each of these statements.
Statements SD D N A SA a. Money is security for the future. 1 2 3 4 5 b. Money is living comfortably now. 1 2 3 4 5 c. Money is success. 1 2 3 4 5 d. Money is power. 1 2 3 4 5 e. Money is freedom. 1 2 3 4 5 f. Money is a reward for hard work. 1 2 3 4 5 g. Money causes conflict. 1 2 3 4 5 i. Money enables people to do good in the world. 1 2 3 4 5 49. That is all the information we need. Do you have any comments you would like to make
about money in general or saving and investing in particular? OPEN ENDED
Iowa State University thanks you for your time today.
92

Gender Differences in Investment Behavior
Telephone interview screening questions Introduction 1 Hello, this is [FILL IN NAME] calling for the “National Investment Survey” being conducted by researchers at Iowa State University. Adult First of all, are you an adult (age 18 or older) who lives in this household? 1 = Yes → GO TO Conf. 2 = No → Speak. May I speak with one of the adults please? IF NO ADULTS AVAILABLE, CLICK ON APPOINT TAB & ASK FOR CALLBACK TIME. 1 = Yes, Continue → GO TO Introduction 2 IF NON-HOUSEHOLD, CLICK ON NONHH TAB: Can I just verify this number so we don’t bother you again? Is this [FILL PH #]? 1 = Yes → Thanks for your help. RECORD AS NON-HOUSEHOLD, EXIT CASE. 2 = No → I’m sorry, I must have made a mistake. I’ll need to try dialing. Introduction 2 Hello, this is [FILL IN NAME] calling for the “National Investment Survey” being conducted by researchers at Iowa State University. Confidence Recently we sent a letter to your home describing this research study, which focuses on experiences and opinions related to saving and investing. Before I ask any questions, however, I want to assure you that any information you provide will be kept strictly confidential. Results will be reported in summary form only. Also, if you feel any questions are too personal, you have the right to refuse to answer them. Dial In order to determine if anyone in your household is eligible to be included in this important research study, I need to ask just a couple of questions. First, can you tell me if I have dialed correctly? Is this (telephone number)? 1 = Yes 2 = No → I’m sorry, I must have made a mistake. I’ll need to redial the number, and hopefully I won’t bother you again. Thank you. [REDIAL NUMBER. IF SAME NUMBER IS REACHED, RECORD AS NOT IN SERVICE.] Income For this research, we need to speak with people who live in households with an income of more than $50,000 per year. Would you say that your overall household income is below or above $50,000? 1 = Below $50,000
93

Gender Differences in Investment Behavior
IF BELOW $50,000: In that case, that’s all the information we need. Iowa State University thanks you very much for your time today. CLASSIFY AS NOT ELIGIBLE. 2 = Above $50,000 (CONTINUE TO Number of Adults) Number of Adults How many adults who are 18 years or older currently live there, including you? ______ IF 1 ADULT, GO TO OneAdult. IF 2-6 ADULTS, GO TO TwoAdult. IF 7+ ADULTS, PROBE FOR NON-RESIDENCE STATUS. RECORD GROUP HOMES AS NON-HOUSEHOLD. One Adult IF ONE ADULT IN HOUSEHOLD: I would like to interview you over the telephone for about 25 to 30 minutes. After the interview is completed, we will send you $20 to thank you for your time. Do you have time now, so we don’t have to bother you again with another call? IF NO, ASK FOR CALLBACK TIME & SET APPOINTMENT. IF REFUSE TO PARTICIPATE, CLICK ON NONRESPONSE TAB AND RECORD REFUSAL WITH EXPLANATION. 1 = Yes, continue GO TO QUESTIONNAIRE. Two Adults IF MORE THAN ONE ADULT: Because this study focuses on the process of saving and investing, we would like to speak with the adult in your household who is the most knowledgeable about saving and investing. Would that be you? 1 = Yes 2 = No One Name IF YES, ASK: What is your first name? → GO TO Two Adults 2. Two Adults 2. I would like to interview you over the telephone for about 25 to 30 minutes. After the interview is completed, we will send you $20 to thank you for your time. Do you have time now, so we don’t have to bother you again with another call? IF NO, SCHEDULE CALLBACK TIME. IF REFUSE TO PARTICIPATE, RECORD REFUSAL WITH EXPLANATION. 1 = Yes, Continue GO TO QUESTIONNAIRE. Other Name IF NO to Two Adults, ASK: What is the first name of the person who would be the most knowledgeable (about saving and investing)? ___________________ Speak To
94

Gender Differences in Investment Behavior
May I speak with [FILL Other Name] please? IF NO, SCHEDULE CALLBACK TIME. 1 = Yes, Continue → GO TO Introduction 3 Introduction 3 Hello, this is [FILL IN NAME] calling for the “National Investment Survey” being conducted by researchers at Iowa State University. Your household has been selected to be included, and I understand that you are the adult in your household who is most knowledgeable about saving and investing. We would like to interview you over the telephone for about 25 to 30 minutes. After the interview is completed, we will send you $20 to thank you for your time. Do you have time now, so we don’t have to bother you again with another call? IF NO, SCHEDULE CALLBACK TIME. IF REFUSE TO PARTICIPATE, CLICK ON NONRESPONSE TAB AND RECORD REFUSAL WITH EXPLANATION. 1 = Yes, Continue [GO TO Confidence 2.] Confidence 2 Before I ask any questions, I want to assure you that any information you provide will be kept strictly confidential. Results will be reported in summary form only. Also, if you feel any questions are too personal, you have the right to refuse to answer them. GO TO QUESTIONNAIRE.
95