Embed Size (px)
Citation preview

86
CHAPTER V
CONCLUSION, IMPLICATION, LIMITATION, AND SUGGESTION
5.1 Conclusion
Every people has spesific characteristics that differentiate he or she from
the biological, attitude in social to the risk attitude and investment perspective.
When talking about the investment decision making, people is often with gender
stereotype. There is a opinion that men are more risk taking than women. Others
believed that men are more confidence and trade more than women.
Then, there is new study from the previous research found other factors,
religion and ethnicity. Each religion has different va lue for daily life even in the
investment activities. Every religion teaches people to be more risk averse. But, if
people could not control his or her confidence, he or she could be a risk taker. In
ethnicity, there are also philosophy for daily life. For Javanese, they tend to be
more risk averse, because they believe that God already gives a destiny and they
could not reject it. It is different with Chinese people. They believe that they
should take a risk because they believe they would receive more ganis after they
take pains.
In this reserach, there are some evidences that gender influence both risk
taking level and confidence level, but religion and ethnicity do not influence both
risk taking level and confidence level. The conclusion of this study are derived
from the hypotheses testing in answering the problem statement:

87
a. First hypothesis (H.1) which states that gender, ethnicity, and religion
influence investors‟ risk taking level is not fully supported. In this research,
the author proved that gender influence investors‟ risk taking level. In
contrast, ethnicity and religion do not influence investors‟ risk taking level.
Thus, the first hypothesis (H.1) is not fully supported.
b. Second hypothesis (H.2) which states that gender, ethnicity, and religion
influence the individual investment behavior, which is different type of
confidence is not fully supported. It is the same with the first hypothesis
which the author proved that gender influence investors‟ risk taking level and
ethinicity and religion do not influence. Hence, this second hypothesis (H.2)
is not fully supported.
c. Third hypothesis (H.3) which states that men are more risk taking than
women is supported.
d. Fourth hypothesis (H.4) which states that men are more confidence than
women is supported.
5.2 Managerial Implication
The result of this reserach is expected to become a benefit for:
a. Financial advisors.
This research is expected to give broader knowledge when financial advisors
deal with their clients that has different gender with them. The financial
advisors may distinguish clients‟ need based on their gender, so the financial
advisor can give better advices to them.

88
b. Investors.
The author expects that the research can give suggestion and broader
knowledge when the investors deal with investment. They could choose the
type of investment and the period of the investment. If they are classified as
conservative and/or confidence persons, they could choose less risky
investment and longer period of investment. Investors may also reflect this
study to deal with their partner or their financial advisors when they have
different gender, ethnicity, and religion.
5.3 Research Limitation and Suggestion for Further Research
5.3.1 Research Limitation
a. The number of respondents is not as many as the author expected.
There is limited respondents in each Pojok Bursa, so the researcher
found difficulties while distributing the questionnaire to the
respondents.
b. Researcher did not put other factors in the questionnaire that might be
influence the investment decision, because she only focused on gender,
ethnicity, and religion. Age, education level, and even the monthly
cash of the respondents that might be related to investment decision.
5.3.2 Suggestion for Further Research
For further research, the author suggests that the researcher can add more
respondents to have better result of the research. Besides, researcher can put other
factors in the questionnaire that might be influence the investment decision. The

89
researcher can add additional factors, such as age, education level, monthly cash,
etc. The researcher alco can differentiate the return between men and women, as
well as examine the types of investment preferences made by each respondents,
both men and women.

90
SELECTED BIBLIOGRAPHY
20 Wanita Profesional dan Pengusaha Indonesia Paling Sukses Sepanjang Masa Versi Indoline. http://newindonesiaonline.wordpress.com/2013/09/14/20-
wanita-profesional-dan-pengusaha- indonesia-paling-sukses-sepanjang-masa-versi- indoline/.
Albaity, M. and Rahman, M., (2012), Gender, Ethnicity, and Religion and Investment Decision: Malaysian Evidence, Journal of Sociological Research,
Vol. 3 No. 2, pp. 502-519.
Antara News. www.antaranews.com.
An Experimental Analysis of The Risk Behaviour of Postgraduate Students.
edissertations.notthingham.ac.uk/2357/1/ShahinBhugaloo.pdf.
Atmadi, A.D., (2009), The Influence of Gender in Investment Decision, Thesis,
Atma Jaya Yogyakarta University, Yogyakarta.
Barnewal, M.M., (1987), Psychological Characteristics of The Individual Investor
in W. Dorms, Asset Allocation for The Individual Investor, Charlottsville. The Institute of Chartered Financial Analysis.
Bappeda Daerah Istimewa Yogyakarta. http://bapedda.jogjaprov.go.id/data/dokumen/ProfilDIY2010.pdf.
Barro, R. And Rachel, McCleary, (2003), Religion and Economic Growth,
Working Paper Series in Economic No. W9682.
Barsky, R.B., Juster, F.T., Kimball, M.S., Shapiro, M.D., (1997), Preference
Parameters and Behavioral Heteroginity: An Experimental Approach in The Health and Retirement Study, Quarterly Journal of Economics, Vol. 112 No. 2, pp. 537-579.
Behavioral Finance. www.investopedia.com/university/behavioral_finance/.
Bisnis UKM. http://bisnisukm.com/kesuksesan-bisnis-sepatu- lokal-di-mancanegara.html.
Bodie, Z.; Kane, A.; Marcus, A.J. (2009). Investment 9th edition. McGraw Hill.
BPS Provinsi D.I. Yogyakarta. http://yogyakarta.bps.go.id/.
Business Dictionary. www.businessdictionary.com.
Comparing Short-Term and Long-Term Investment.
www.finalsense.com/learning/investment/comparing-short-term.htm.
Economy Watch. www.economywatch.com/investment/.

91
Flynn, J., Slovic, P., Mertz, C.K., (1994), Gender, Race, and Perception of
Eviromental Health Risk, Risk Analysis, Vol. 14 No. 6, pp. 1101-1108.
Gibson, N., (2003). Essential Finance, The Economist, London: Profile Books.
Glaser, M. And Weber, M., (2009), Which Part Returns Affect Trading Volume,
The Journal of Financial Markets, Vol. 12 No. 19, pp. 1-31.
Graham, J.F., Stendardi, E.J., Myers, J.K., Graham, M.J., (2002), Gender
Differences in Investment Strategies An InformationProcessing Perspective, International Jornal of Bank Marketing, Vol. 22 No. 1, pp. 17-26.
Gutter, M.S., Fox, J.J., Montalto, C.P., (1999), Racial differences in investor decision making, Financial Services Review, Vol. 8, pp. 149-162.
Hanna, S.D., Waller, W., Finke, M., (2008), The Concept of Risk Tolerance in Personal Financial Planning, Journal of Personal Finance, Vol. 7 No. 1, pp.
96-108.
Hassan Al-Tamimi and Hussein, A., (2006), Factors Influencing Individual Investor Behavior: An Empirical study of the UAE Financial Markets, The Business Review, Cambridge, Vol. 5 No. 2, pp. 225-232.
Hassan Al-Tamimi and Hussein, A., (2009), Financial literacy and investment
decisions of UAE investors, The Journal of Risk Finance, Vol. 10 No. 2, pp.
500-516.
Investopedia. www.investopedia.com.
Investors‟ Behavior of Equity Investment: An Empirical Study of Individual Investors. Gfjmrgnu.ac.in/UserFiles/File/P1V5.pdf.
Is Financial Risk A Bucketful of Opportunities? arabiangazette.com/financial-risk-bucketful-opportunities.
Islamic Investment. http://www.kantakji.com/fiqh/Files/Economics/c129.pdf.
Jamaludin, N., (2013), Religion and Individual Investment Choice Decision: The Case of Malaysia, Journal of Business and Social Science, Vol. 4 No. 1, pp. 104-113.
Jaringan Berita Terluas Indonesia. www.jpnn.com.
Jianakoplos, N. and Bernasek, A., (1998), Are women more risk averse?,
Economic Inquiry, Vol. 36 No. 4, pp. 620-630.
Jones, C.P., (2010). Investment Principles and Concepts 11th edition. Wiley.
KabarIndonesia.
http://www.kabarindonesia.com/berita.php?pil=12&jd=Janda%2C+Stigma+dan+Budaya+Patriarki&dn=20110605083817.

92
Kompasiana. http://sejarah.kompasiana.com/2012/03/14/harmoni-kehidupan-cina-
di-kota-gudeg-446942.html#.
Mahmudi Fukumoto: A Javanese in Japan. http://www.thejakartapost.com/news/2013/09/20/mahmudi-fukumoto-a-
javanese-japan.html.
McClave et al., (2011), Statistik Untuk Bisnis dan Ekonomi, Erlangga, Jakarta.
Mittal, M. and Vyas, R. K., (2011), A Study of Psychological Reasons for Gender
Differences in Preferences for Risk and Investment Decision Making, IUP Journal of Behavioral Finance, Vol. 8 No. 3, pp. 45-60.
Muhamad, R., Devi, S.S., Ghani, A.M.A., (2006), Religiosity and The Malaysian Malay Muslim Investors: Some Aspects of Investment Decision, Advances in
Global Business Research, Vol. 3 No. 1, pp. 197-206.
Odean, T. and Barber, B.M., (2001), Boys will be Boys: Gender, Overconfidence,
and Common Stock Investment, Quarterly Journal of Economics.
Palsson, Anne-Marie., (1996), Does the degree of relative risk aversion vary with
household characteristics?, Journal of Economic Psychology, Vol. 17 No. 6, pp. 771-787.
Pan, C. H. and Statman, M., (2008), Questionnaires of Risk Tolerance, Regret, Overconfidence, and Other Investor Propensities.
Pecinan Yogyakarta. http://pecinanjogja.blogspot.com/p/home.html.
Penerapan Pañcabala Sebagai Landasan Berwirausaha. Larosberbagibersama.blogspot.com/2012/02/penerapan-pancabala-sebagai-
landasan.html?m=1. Pinandita Sanggraha Nusantara. Sanggrahanusantara.blogspot.com/2009/03/.
Pompian, M., (2006). Behavioral Finance and Wealth Management, Hoboken,
New Jersey: Wiley.
Psycology Glossary. www.psycology- lexicon.com/cms/glossary/glossary-u/681-
unrealistic-optimism.html.
Profil Merdeka Indonesia. http://profil.merdeka.com/indonesia/.
Renneboog, Luc and Spanjers, C., (2012), Religion, Economic Attitudes, and
Household Finance, SSRN Working Paper Series
Reuters.
http://www.reuters.com/finance/stocks/officerProfile?symbol=GAGR.SI&officerId=642285.
Riley, William B, Jr. and Chow, K.V., (1992), Asset allocation and individual risk aversion, Financial Analysts Journal, Vol. 48 No. 6, pp. 32

93
SAD RIPU: ENAM MUSUH DALAM DIRI MANUSIA.
katahindu.wordpress.com/2012/06/18/sad-ripu-enam-musuh-dalam-diri-manusia/.
Scubert, R., Gysler, M., Brown, M., Brachinger, H.W., (2000), Gender Spesific Attitudes Towards Risk and Ambiguity: An Experimental Investigation
Working Paper Center for Economic Research, Swiss Federal Institute Technology.
Sekaran, U., Roger, B., (2009). Research Methods for Business 5th edition. Wiley.
Surjaweni, W., (2007). Belajar Mudah SPSS untuk Penelitian Skripsi, Tesis, Disertasi & Umum. Global Media Informasi
THE HOFSTEDE CENTRE. http://geert-hofstede.com/national-culture.html.
The Three Types of Investors. www.threetypes.com/philosophy/investor-
types.shtml.
The Jakarta Post. http://www.thejakartapost.com/news/2013/09/20/mahmudi-fukumoto-a-javanese-japan.html.
Thomas, T.C. and Rajendran, G., (2012), BB&K Five-ways Model and Investment Behavior of Individual Investment: Evidence from India,
International Journal of Economics and Management , Vol. 6 No. 1, pp. 115-127.
Tjondrowidjojo, E.K., (2013), Behavioral Finance Study Toward Credit Card Holders, Thesis, Atma Jaya Yogyakarta University, Yogyakarta.
Trinugroho, I., (2011), Overconfidence and Excessive Trading Behavior: An Experimental Study, International Journal of Business Management, Vol. 6
No. 7, pp. 147-152.
Tversky, A., (1998), The Psycology of Decision Making.
Warren, W.E., Stevens, R.E., McConkey, C.W., (1990), Using Demographic and Lifestyle Analysis to Segment Individual Investors, Financial Analysts
Journal, Vol. 46 No. 2, pp. 74.
Weber, E.U., Blais, A.R., Betz, N.E., (2002), A Domain Spesific Risk Attitude
Scale: Measuring Risk Perceptions and Risk Behavior, Journal of Behavioral
Decision Making, No. 15, pp. 263-290.
What is Risk? People.stern.nyu.edu/adamodar/pdfiles/valrisk.ch1.pdf.
Women and Risk Tolerance in Aging World.
www.efmaefm.org/etma2006/papers/53861-full.pdf.
Women History. womenhistory.com.

94
Yasaswy, N.J., (2008). Personal Investment & Tax Planning Yearbook. Vision
Books.
Zinkhan, G.M. and Karande, K.W., (1991), Cultural and Gender Differences in
Risk Taking Behavior among American and Spanish Decision Makers, Journal
of Social Psychology, Vol. 131 No. 5, pp. 741-742.
95
Respondent’s Profile (Please circle the appropiate answer)
Sex : Men Women
Religion : Islam Chatolic Protestant Hindu Buddha
Race : Javanese Chinese Others
University Name :
a. UAJY e. UKDW h. UTY b. UPN f. UGM i. UNY c. STIE YKPN g. UII
Field of study :________________________________________________
Risk Taking Level
1. Do you smoke? a. No b. Sometimes c. Often
2. If there was an exam or quis, do you:
a. Prepare it well to get the best mark b. Sometimes prepare for it c. Never prepare it
3. If you drive a car or ride a motor cycle, do you:
a. Always obey the traffic rules and avoid dangerous situations b. React calmly when fined c. Likely to break the rules if you do not expect to be fined
4. If you were lost while driving a car or riding a motor cycle, do you:
a. Directly u-turn b. Follow the way, ask someone, then continue the way c. Follow the way, and travelling for a while
5. If there was a game of chance, do you:
a. Do not play b. If playing, gamble for low stakes c. Play for high stakes
96
6. If you got a lottery, do you: a. Prefer to choose Rp. 1.000,000,00 cash b. Buy a lottery again, with 50% of chance to get Rp. 5.000.000,00 c. Buy a lottery again, with 25% of chance to get Rp. 10.000.000,00
7. If you had a monthly cash, do you:
a. Put 60% into deposit account, 40% for shopping b. Put 40% into deposit account, 60% for shopping c. 100% for shopping
8. If you were in a shop, do you:
a. Only buy goods that you needed b. Buy goods that you needed, and buy one goods that you want c. Buy all of goods that you want, even you need them or not
9. If you unexpectedly received Rp. 200.000.000,00 to invest, what would you do?
a. Deposit it in a bank account, money market account b. Invest it in safe high quality bonds or mutual funds c. Invest it in stocks or stock mutual funds
10. If you deposit your money in a bank or buy a stock, do you:
a. Put them in more than one type of assets b. 50 % in one type of asset and 50% in different type of asset c. 100% in one type of asset
11. If you had to invest Rp. 200.000.000,00, which of the following investment choices
would you find most appealing? a. 60% in low-risk investments 30% in medium-risk investment 10% in high-risk
investment b. 30% in low-risk investments 40% in medium-risk investment 30% in high-
risk investment c. 10% in low-risk investments 40% in medium-risk investment 50% in high-risk
investment
12. Given the best- and worst-case returns of the investment choices below, which would you prefer?
a. Rp. 8.000.000,00 gain best case; Rp. 0 loss case b. Rp. 26.000.000,00 gain case; Rp. 8.000.000,00 loss case c. Rp. 48.000.000,00 gain case; Rp. 24.000.000,00 loss case
13. When you think of the word “risk” in investment, which of the following words comes to mind first?
a. Loss b. Opportunity to get more money c. Thrill or excited to get more money

97
14. Your trusted friend and neighbor, an experienced geologist, is putting together a group of investment to fund an exploratory gold mining venture. The venture could pay back 50 to 100 times the investment if successful. If the mine is a bust, the entire investment is worthless. Your friend estimates the chance of success is only 20%. If you had the money, how much would you invest?
a. Nothing b. 3 monthly cash c. 6 monthly cash

98
Choose ( ) the best answer where appropiate
SDA = Strongly Disagree
DA = Disagree
N = Neutral
A = Agree
SA = Strongly Agree
Confidence Level
No. Statement SDA DA N A SA 1 I am a very confidence person 2 I never feel nervous 3 I do not feel nervous while talking in public 4 My conversations always focus, and consistent
like I have prepared, eventhough all of the attentions are on me
5 I am very confidence while talking in public 6 I always have a eye contact with the audience 7 I have a realistic assessment of my strengths and
weaknesses
8 I will get high return in investing 9 I can choose a stock which will give me high
return
10 I do not seek information about the company while buying a stock
11 I do not get difficulty in investing 12 I will not get loss in investing 13 I am not afraid to invest 14 I can predict my investment’s value well 15 I always manage my financial matters by myself

99
Profil Responden (lingkari jawaban yang diperlukan)
Jenis Kelamin : Laki-laki Perempuan
Agama : Islam Katolik Protestan Hindu Buddha
Ras : Jawa Chinese Lainnya
Nama Universitas :
a. UAJY e. UKDW h. UTY b. UPN f. UGM i. UNY c. STIE YKPN g. UII
Bidang Studi :________________________________________________
Tingkat Pengambilan Resiko
1. Apakah Anda merokok? a. Tidak sama sekali b. Kadang-kadang saja c. Sering
2. Jika ada ujian atau kuis, apakah Anda:
a. Mempersiapkannya dengan baik untuk mendapatkan hasil yang baik pula b. Kadang-kadang saja c. Tidak pernah belajar
3. Jika Anda sedang menyetir atau mengendarai sepeda motor, apakah Anda:
a. Selalu menaati peraturan dan menghindari situasi berbahaya b. Bereaksi dengan tenang ketika didenda c. Cenderung melanggar pertauran jika Anda tidak berharap akan didenda
4. Jika Anda tersesat pada saat menyetir mobil atau mengendarai mobil, apakah Anda:
a. Langsung putar balik b. Mengikuti jalan dulu, lalu bertanya dan baru melanjutkan perjalanan kembali c. Mengikuti jalan saja, sekalian jalan-jalan
100
5. Saat ada “game of chance” atau permainan kesempatan, apakah Anda: a. Tidak bermain b. Jika bermain, memberikan taruhan yang rendah saja c. Bermain dengan taruhan tinggi
6. Jika Anda mendapatkan undian, apakah Anda:
a. Lebih senang menerima Rp. 1.000.000,00 tunai b. Mengikuti undian lagi, dengan 50% kesempatan menang Rp. 5.000.000,00 c. Mengikuti undian lagi, dengan 25% kesempatan menang Rp 10.000.000,00
7. Jika Anda mendapatkan uang bulanan, apakah Anda:
a. Menyisihkan 60% uang bulanan untuk ditabung, 40% untuk dibelanjakan b. Menyisihkan 40% uang bulanan untuk ditabung, 60% untuk dibelanjakan c. Membelanjakan semua uang bulanan
8. Jika Anda sedang berpergian ke toko, apakah Anda:
a. Hanya membeli barang yang dibutuhkan b. Membeli barang yang dibutuhkan, dan membeli satu barang yang diinginkan c. Membeli semua barang yang diinginkan, entah itu yang dibutuhkan atau tidak
9. Jika Anda mendapatkan uang Rp. 200.000.000,00 secara tidak terduga untuk
diinvestasikan, apa yang akan Anda lakukan? a. Mendepositokannya di bank, instrumen di pasar uang b. Menginvestasikannya dalam obligasi aman berkualitas tinggi atau reksadana
obligasi c. Menginvestasikannya di saham atau reksadana saham
10. Jika Anda mendepositokan uang Anda atau membeli saham, apakah Anda:
a. Menaruh uang Anda di lebih dari satu tipe aset b. 50% disatu tipe aset dan 50% ditipe aset yang berbeda c. 100% ditaruh disatu tipe aset saja
11. Jika Anda akan meninvestasikan uang sebesar Rp. 200.000.000,00, pilihan investasi
mana yang akan Anda pilih? a. 60% diinvestasikan dengan resiko yang kecil 30% resiko medium 10% di
resiko yang tinggi b. 30% diinvestasikan dengan resiko kecil 40% resiko medium 30% di resiko
yang tinggi c. 10% diinvestasikan dengan resiko kecil 40% resiko medium 50% di resiko
yang tinggi
12. Di bawah ini ada pilihan hasil terbaik dan terburuk dalam berinvestasi, pilihan mana yang akan Anda pilih?
a. Untung Rp. 8.000.000,00; rugi Rp. 0

101
b. Untung Rp. 26.000.000,00; rugi Rp. 8.000.000,00 c. Untung Rp. 48.000.000,00; rugi Rp. 24.000.000,00
13. Jika Anda berpikiran tentang resiko dalam berinvestasi, mana yang ada dalam pikiran
Anda pertama kali? a. Kerugian b. Kesempatan untuk mendapatkan uang lebih banyak lagi c. Excited untuk mendapatkan uang lebih banyak lagi
14. Anda memiliki teman dan teman tersebut terpercaya sekaligus tetangga Anda. Dia
adalah seorang geolog yang berpengalaman, dan membentuk sekelompok investor untuk mendanai usaha eksplorasi tambang emas. Jika berhasil, usaha ini bisa membayar kembali 50 sampai 100 kali investasi yang sudah diberikan. Jika usaha ini gagal, investasi ini tidak berharga. Teman Anda memperkirakan kemungkinan keberhasilan hanya 20%. Jika Anda mempunyai uang, berapa banyak Anda akan berinvestasi?
a. Tidak sama sekali b. 3 bulan uang bulanan c. 6 bulan uang bulanan
102
Pilih ( ) jawaban yang sesuai dengan Anda
STS = Sangat Tidak Setuju
TS = Tidak Setuju
N = Netral
S = Setuju
SS = Sangat Setuju
Tingkat Percaya Diri
No. Pernyataan STS TS N S SS 1 Saya adalah orang yang sangat percaya diri 2 Saya tidak pernah merasa tegang atau nervous 3 Saya tidak merasa cemas ketika harus berbicara di
depan umum
4 Pembicaraan saya selalu fokus, seperti yang sudah disiapkan, walaupun semua perhatian tertuju ke arah saya
5 Saya sangat percaya diri ketika berbicara di depan umum
6 Dalam berbicara, saya berani menatap lawan bicara saya
7 Saya mempunyai penilaian yang realistis tentang kelebihan dan kekurangan saya
8 Saya akan mendapatkan keuntungan yang besar dalam berinvestasi
9 Saya dapat memilih saham yang akan memberikan saya keuntungan yang besar
10 Saya tidak mencari informasi tentang perusahaan yang bersangkutan ketika membeli saham
11 Saya tidak mendapatkan kesulitan dalam berinvestasi
12 Saya tidak akan mendapatkan kerugian saat berinvestasi
13 Saya tidak takut untuk menginvestasikan uang saya
14 Saya dapat memprediksi nilai investasi saya dengan baik
15 Saya selalu mengatur sendiri keuangan saya
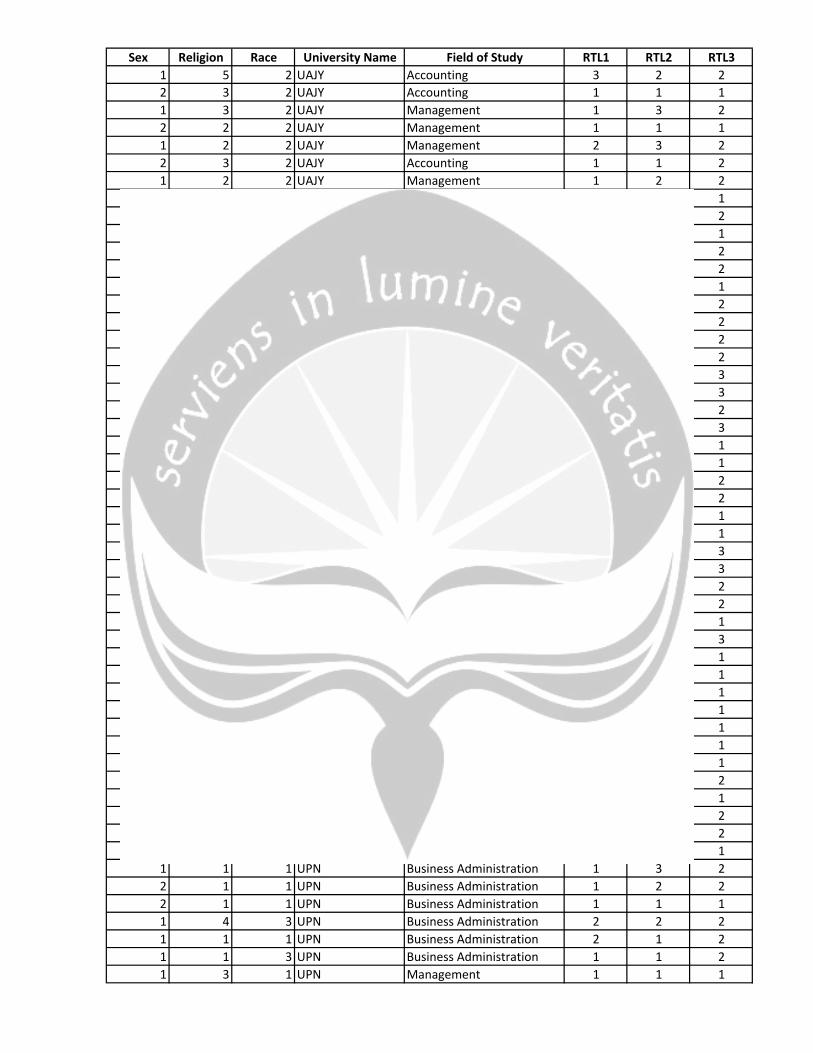
Sex Religion Race University Name Field of Study RTL1 RTL2 RTL31 5 2 UAJY Accounting 3 2 22 3 2 UAJY Accounting 1 1 11 3 2 UAJY Management 1 3 22 2 2 UAJY Management 1 1 11 2 2 UAJY Management 2 3 22 3 2 UAJY Accounting 1 1 21 2 2 UAJY Management 1 2 22 3 1 UAJY Accounting 1 2 12 1 1 UAJY Management 1 2 22 3 3 UAJY Accounting 1 1 12 3 2 UAJY Accounting 1 1 21 2 2 UAJY Accounting 1 1 21 3 3 UAJY Accounting 1 1 11 3 2 UAJY Management 1 1 21 3 1 UAJY Management 1 2 22 2 1 UAJY Industry 2 1 21 2 2 UAJY Management 1 1 22 2 1 UAJY Management 2 1 32 2 2 UAJY Management 1 2 32 2 1 UAJY Management 1 1 21 2 2 UAJY Management 1 2 32 2 1 UAJY Management 1 1 12 2 2 UAJY Accounting 1 1 11 3 3 UAJY Management 2 2 21 2 3 UAJY Management 1 2 22 2 1 UAJY Accounting 1 1 12 2 2 UAJY Management 1 1 11 2 1 UAJY Industry 2 2 31 2 2 UAJY Accounting 2 3 31 2 2 UAJY Management 2 1 21 1 1 UAJY IT 2 2 22 5 2 UAJY Management 1 2 11 2 3 UAJY Management 3 2 32 3 3 UAJY Accounting 1 1 11 2 2 UAJY Accounting 1 2 12 2 1 UAJY Management 1 2 12 2 2 UAJY Management 1 1 12 2 1 UAJY Management 1 2 11 2 1 UAJY Accounting 1 1 11 3 3 UAJY Management 1 2 12 3 3 UAJY Accounting 1 1 21 1 1 UPN Business Administration 2 1 12 1 1 UPN Business Administration 1 1 22 1 1 UPN Business Administration 1 2 22 1 3 UPN Business Administration 1 2 11 1 1 UPN Business Administration 1 3 22 1 1 UPN Business Administration 1 2 22 1 1 UPN Business Administration 1 1 11 4 3 UPN Business Administration 2 2 21 1 1 UPN Business Administration 2 1 21 1 3 UPN Business Administration 1 1 21 3 1 UPN Management 1 1 1
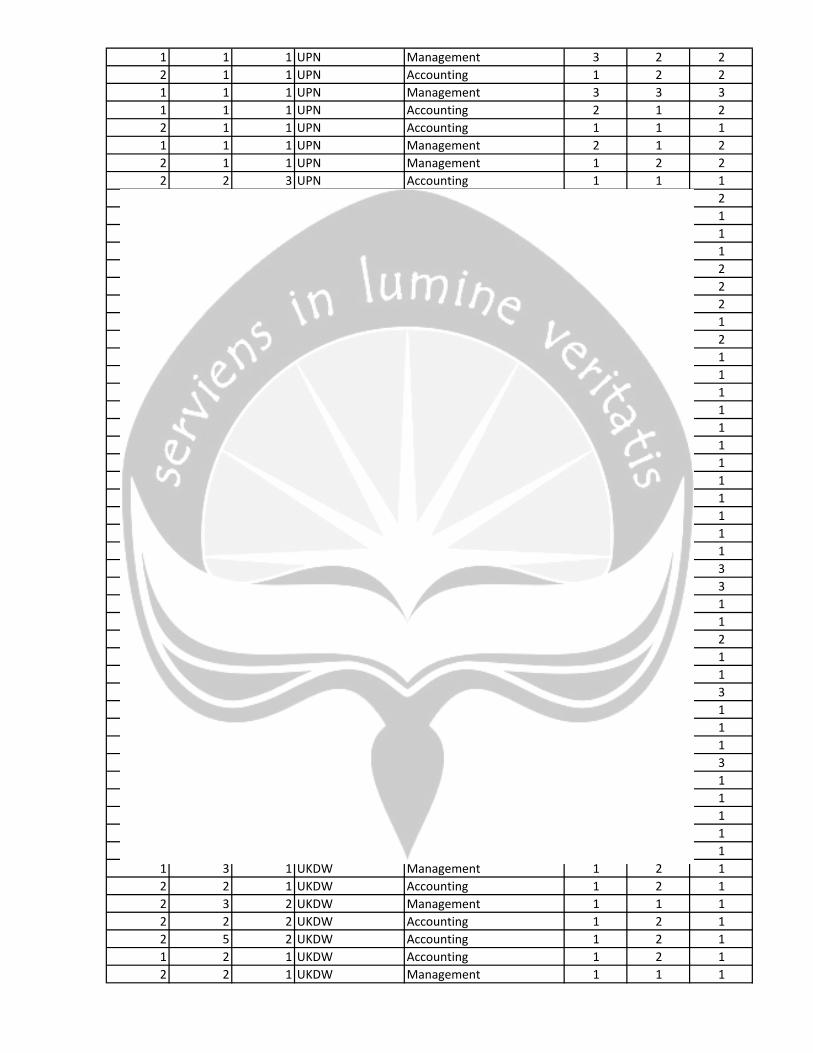
1 1 1 UPN Management 3 2 22 1 1 UPN Accounting 1 2 21 1 1 UPN Management 3 3 31 1 1 UPN Accounting 2 1 22 1 1 UPN Accounting 1 1 11 1 1 UPN Management 2 1 22 1 1 UPN Management 1 2 22 2 3 UPN Accounting 1 1 11 1 3 UPN Accounting 2 2 21 2 1 STIE YKPN Management 3 3 12 1 1 STIE YKPN Accounting 1 1 12 1 1 STIE YKPN Accounting 1 2 12 1 1 STIE YKPN Accounting 1 1 22 1 1 STIE YKPN Management 1 1 22 1 1 STIE YKPN Accounting 1 1 22 1 3 STIE YKPN Management 1 1 12 2 1 STIE YKPN Management 1 1 21 2 1 STIE YKPN Accounting 1 1 12 2 1 STIE YKPN Accounting 1 1 12 3 3 STIE YKPN Management 1 1 12 2 1 STIE YKPN Management 1 1 12 1 1 STIE YKPN Management 1 1 12 1 1 STIE YKPN Management 1 1 11 1 1 STIE YKPN Accounting 1 2 11 1 1 STIE YKPN Accounting 1 2 12 2 1 STIE YKPN Management 1 1 12 2 1 STIE YKPN Management 1 2 12 1 1 STIE YKPN Management 1 2 11 1 2 STIE YKPN Accounting 2 3 12 3 1 STIE YKPN Management 1 2 32 1 3 STIE YKPN Management 1 3 31 1 1 STIE YKPN Management 3 1 12 2 2 STIE YKPN Management 1 1 11 3 1 STIE YKPN Management 2 2 22 1 1 STIE YKPN Management 1 1 12 2 2 STIE YKPN Management 1 2 12 3 3 STIE YKPN Management 1 2 32 2 1 STIE YKPN Accounting 1 1 11 2 1 STIE YKPN Management 1 2 11 3 3 STIE YKPN Accounting 1 1 12 1 1 STIE YKPN Management 1 2 32 3 2 UKDW Management 1 2 12 5 2 UKDW Management 1 1 12 5 2 UKDW Accounting 1 1 11 3 2 UKDW IT 1 2 11 3 3 UKDW Accounting 1 1 11 3 1 UKDW Management 1 2 12 2 1 UKDW Accounting 1 2 12 3 2 UKDW Management 1 1 12 2 2 UKDW Accounting 1 2 12 5 2 UKDW Accounting 1 2 11 2 1 UKDW Accounting 1 2 12 2 1 UKDW Management 1 1 1
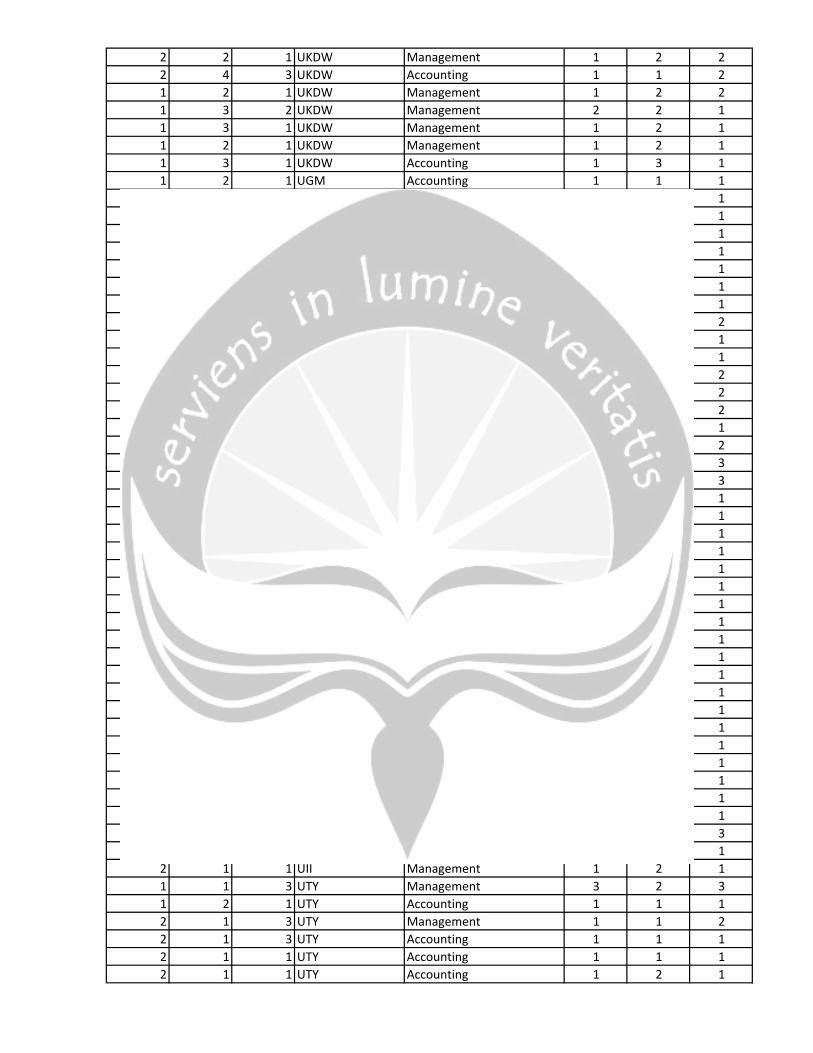
2 2 1 UKDW Management 1 2 22 4 3 UKDW Accounting 1 1 21 2 1 UKDW Management 1 2 21 3 2 UKDW Management 2 2 11 3 1 UKDW Management 1 2 11 2 1 UKDW Management 1 2 11 3 1 UKDW Accounting 1 3 11 2 1 UGM Accounting 1 1 12 1 1 UGM Medical Education 1 1 11 2 1 UGM Medical Education 1 2 12 2 2 UGM Accounting 1 1 12 3 2 UGM Accounting 1 2 11 2 1 UGM Accounting 3 1 11 3 2 UGM Management 3 2 11 1 1 UGM Accounting 3 1 11 2 2 UGM Management 2 3 21 2 2 UGM Management 1 2 11 1 3 UGM Management 2 2 11 2 1 UGM Management 2 2 22 1 3 UGM Management 1 2 21 3 2 UGM Accounting 1 1 22 1 1 UGM Accounting 1 2 11 1 2 UGM Accounting 2 2 21 5 2 UGM Management 3 2 31 4 3 UGM Accounting 1 2 31 1 3 UGM Management 3 2 12 2 3 UGM Accounting 1 1 12 2 2 UGM Management 1 1 12 5 2 UGM Economics 1 1 12 2 2 UGM Management 1 1 12 3 3 UGM Accounting 1 1 11 2 1 UGM Management 3 1 12 1 1 UII Management 1 2 12 1 3 UII Management 1 2 12 1 3 UII Management 1 2 11 1 1 UII Management 3 3 11 1 1 UII Economics 3 2 12 1 3 UII Management 1 1 12 1 1 UII Management 1 2 11 1 1 UII Accounting 3 2 11 1 1 UII Accounting 3 1 11 1 3 UII Management 3 2 11 1 1 UII Management 2 3 12 1 1 UII Accounting 1 1 11 1 3 UII Management 3 2 32 1 1 UII Management 1 2 12 1 1 UII Management 1 2 11 1 3 UTY Management 3 2 31 2 1 UTY Accounting 1 1 12 1 3 UTY Management 1 1 22 1 3 UTY Accounting 1 1 12 1 1 UTY Accounting 1 1 12 1 1 UTY Accounting 1 2 1
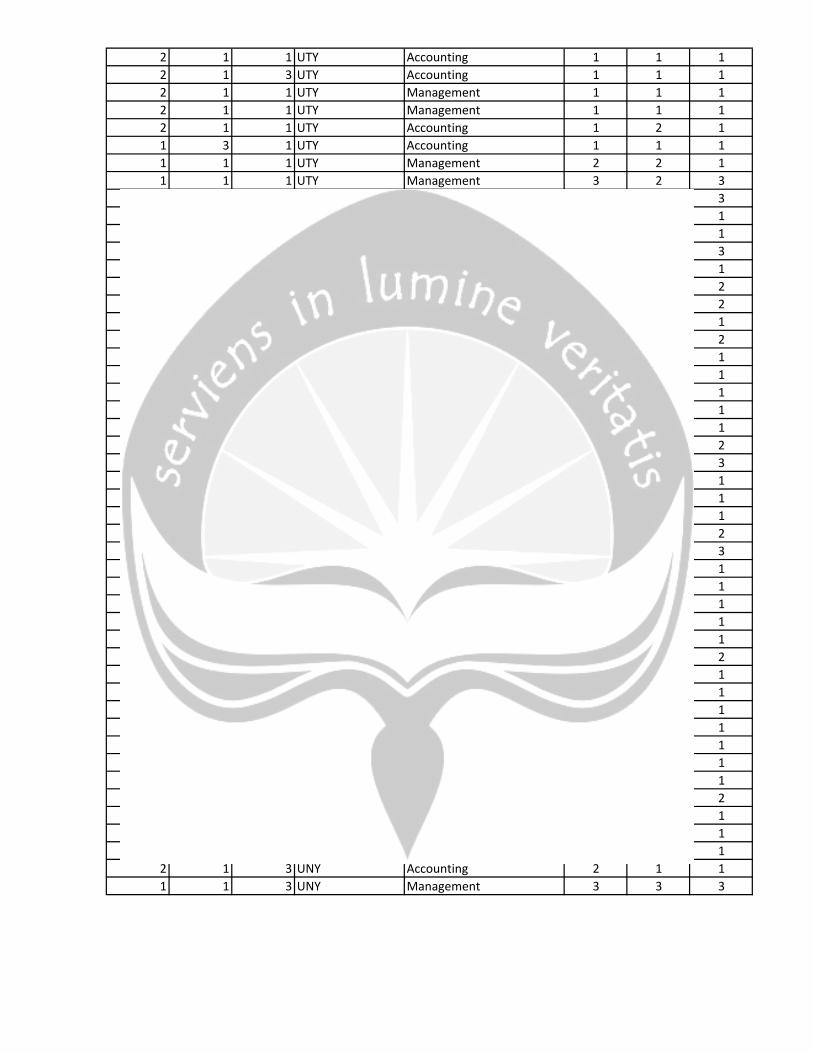
2 1 1 UTY Accounting 1 1 12 1 3 UTY Accounting 1 1 12 1 1 UTY Management 1 1 12 1 1 UTY Management 1 1 12 1 1 UTY Accounting 1 2 11 3 1 UTY Accounting 1 1 11 1 1 UTY Management 2 2 11 1 1 UTY Management 3 2 31 1 3 UTY Accounting 3 3 31 1 1 UTY Management 2 2 12 1 1 UTY Accounting 1 1 11 1 3 UTY Accounting 3 2 31 1 1 UTY Management 3 1 11 1 1 UTY Management 3 2 21 1 1 UTY Management 3 3 22 1 1 UTY Management 1 1 12 1 3 UTY Accounting 1 2 22 1 1 UTY Management 1 2 12 1 1 UTY Management 1 2 12 1 1 UTY Management 1 1 11 1 1 UTY Management 1 1 11 1 1 UTY Management 1 2 12 1 1 UTY Accounting 1 2 21 1 3 UTY Accounting 1 2 32 1 1 UTY Management 1 1 11 1 3 UTY Management 2 2 12 1 1 UTY Management 1 1 12 2 1 UTY Accounting 2 2 21 2 3 UTY Management 2 3 32 1 1 UTY Management 1 2 12 1 1 UTY Management 1 1 11 1 1 UTY Management 1 3 11 1 1 UTY Management 2 1 11 1 1 UNY Accounting 3 1 12 1 1 UNY Accounting 1 2 22 1 1 UNY Accounting 1 2 12 1 3 UNY Accounting 1 2 12 1 3 UNY Accounting 1 2 12 1 3 UNY Accounting 1 1 11 1 3 UNY Accounting 1 2 12 1 1 UNY Management 1 1 11 5 3 UNY Management 3 1 11 4 3 UNY Management 2 2 21 1 1 UNY Management 1 1 12 1 3 UNY Management 1 2 12 1 1 UNY Accounting 1 2 12 1 3 UNY Accounting 2 1 11 1 3 UNY Management 3 3 3

RTL4 RTL5 RTL6 RTL7 RTL8 RTL9 RTL10 RTL11 RTL12 RTL132 2 2 2 2 3 2 2 2 22 1 2 1 2 1 1 1 1 33 3 1 2 2 3 3 2 2 22 2 1 2 1 1 2 2 1 13 3 2 1 2 1 2 2 2 22 2 3 2 2 2 3 2 2 23 1 1 2 2 3 2 2 3 22 3 1 2 2 3 3 1 2 33 3 3 2 2 3 3 3 3 22 2 1 3 3 3 2 2 2 22 2 1 1 2 3 2 1 2 23 2 2 3 2 3 2 3 1 22 3 2 2 2 2 2 1 3 23 3 2 1 2 2 2 2 2 23 2 2 1 2 2 2 1 3 32 1 1 1 1 2 2 1 3 23 3 3 2 3 3 2 2 3 33 3 3 2 3 3 2 3 2 33 3 3 2 3 3 2 3 3 31 2 1 1 2 1 2 1 1 13 3 3 2 3 3 2 3 3 31 2 1 1 1 1 1 1 1 12 2 1 1 1 3 2 1 1 13 3 3 2 3 3 2 2 3 33 3 2 2 2 3 2 2 3 21 1 1 2 1 2 2 1 1 12 2 1 1 2 2 1 1 1 13 3 3 2 2 3 2 2 3 33 2 2 2 2 3 2 2 2 22 2 2 2 2 1 1 1 3 22 2 2 2 2 1 2 1 1 13 3 2 2 3 3 2 2 2 23 3 3 2 2 3 2 2 3 31 1 1 1 2 2 2 1 1 13 2 2 1 2 3 2 2 3 23 2 1 2 3 3 2 1 2 23 3 2 2 2 2 2 2 2 23 1 1 2 2 1 1 2 1 22 2 1 1 2 2 2 2 3 13 2 3 1 3 3 1 2 3 22 2 2 2 2 1 2 2 2 12 2 1 1 1 2 2 1 1 12 2 1 1 2 3 1 2 1 13 2 1 2 2 1 2 1 1 33 1 1 2 1 3 2 1 1 32 3 2 2 2 2 2 2 3 12 2 1 2 2 3 2 2 2 23 1 1 2 2 1 2 2 1 12 2 1 3 2 2 2 2 3 32 3 1 2 2 2 2 3 3 32 1 1 2 2 3 2 2 2 11 2 1 1 1 2 2 1 1 2

3 3 3 2 2 2 2 2 3 33 2 2 2 2 2 2 2 3 23 3 3 2 2 2 2 3 3 32 2 1 3 2 2 2 2 2 22 1 1 2 1 2 2 2 1 12 1 3 2 2 2 1 3 2 22 2 1 1 2 2 2 1 1 11 1 1 1 2 1 1 1 2 13 3 2 2 2 3 2 2 3 23 2 2 1 2 3 1 2 2 22 3 1 2 2 1 2 1 1 13 2 1 2 2 1 1 1 2 12 1 1 2 2 1 2 2 2 22 2 2 2 2 2 2 1 2 12 2 2 2 2 2 2 2 3 22 1 1 1 1 2 2 1 2 12 2 2 1 2 2 2 2 2 22 2 2 2 1 2 2 2 3 23 2 2 1 2 1 2 2 2 11 2 2 2 2 1 2 1 3 13 2 2 1 2 3 1 1 3 32 1 1 2 2 1 2 1 2 22 2 3 2 1 1 2 1 3 22 2 2 2 2 2 2 2 2 32 3 3 2 2 3 2 3 3 22 2 2 1 1 3 2 2 2 21 1 1 1 1 2 2 1 1 12 2 2 2 2 1 1 2 3 23 3 3 2 2 3 2 2 3 32 2 2 2 2 1 1 1 1 22 2 2 2 2 1 1 1 1 22 3 3 1 2 3 1 2 2 22 2 1 1 2 2 2 1 1 12 3 2 2 2 1 2 2 1 31 2 1 2 1 2 2 1 1 13 2 1 2 2 2 2 1 1 13 3 2 1 3 3 2 2 2 22 1 1 1 2 1 1 1 1 13 2 1 2 3 1 1 2 1 11 2 2 2 2 2 2 2 2 22 2 2 2 2 2 2 2 2 23 2 1 1 1 3 1 2 3 32 2 2 1 1 1 2 1 3 12 2 2 2 2 2 2 2 2 22 1 3 2 2 2 2 2 2 33 2 2 3 2 2 2 1 3 12 3 2 2 3 2 2 3 3 32 2 1 1 2 1 1 2 3 22 2 2 2 2 3 1 1 2 12 2 1 3 1 1 1 1 3 12 2 1 3 1 2 1 1 3 12 2 3 2 2 2 2 2 2 22 2 2 2 2 1 1 2 2 2

2 1 2 1 1 2 1 1 2 21 3 1 3 2 2 1 3 3 33 3 3 2 3 3 3 2 3 33 3 2 2 2 3 2 2 3 23 2 2 1 2 3 2 2 2 23 3 3 2 3 3 2 2 3 23 2 2 1 1 3 2 2 2 21 2 2 1 1 1 1 2 1 23 3 3 2 3 3 2 2 3 33 3 3 2 3 3 2 2 3 33 1 1 1 2 3 2 1 1 12 2 1 1 1 1 2 2 2 22 3 3 3 1 3 2 2 3 33 3 3 2 1 3 2 2 3 32 3 3 3 1 3 1 2 3 22 2 2 2 2 2 2 2 3 12 3 2 1 2 1 2 2 1 22 2 3 2 2 3 1 3 1 22 2 2 1 2 3 2 2 3 12 2 2 1 1 1 2 2 2 13 2 1 2 2 2 2 1 2 12 1 1 2 3 3 2 2 2 23 2 2 2 1 3 2 2 2 22 3 2 2 2 1 2 2 2 32 2 3 3 3 1 2 1 3 23 3 2 2 2 1 1 2 2 22 1 1 2 3 1 2 2 2 33 2 2 2 2 3 2 2 2 22 2 1 1 2 2 2 1 1 11 1 1 2 3 1 2 1 1 12 1 1 1 2 2 2 1 1 13 3 2 2 3 3 2 2 3 22 3 2 1 1 3 1 2 2 13 2 2 2 2 1 1 2 2 22 2 1 3 1 1 1 3 2 13 3 3 3 2 2 2 3 3 33 3 2 2 2 3 2 3 3 22 2 1 1 1 1 1 1 1 12 1 1 1 2 1 2 2 1 13 2 3 2 2 3 2 2 3 22 2 2 1 2 2 2 1 3 23 3 2 2 2 3 2 2 3 33 2 2 2 2 3 2 2 3 31 2 1 1 3 1 1 1 1 13 3 3 2 2 3 2 2 3 31 2 2 1 2 3 2 1 2 22 2 1 1 2 3 2 2 1 12 3 2 2 2 3 2 2 2 21 1 1 1 1 1 1 1 2 12 2 2 1 2 3 2 3 2 22 1 2 2 1 1 2 2 2 22 1 1 1 2 2 2 2 3 12 1 1 3 2 1 2 2 1 1

1 3 3 1 2 1 2 2 1 12 1 2 2 1 1 1 2 2 21 3 2 2 1 3 1 3 3 22 1 1 1 1 1 2 1 1 32 3 1 1 1 2 1 3 3 11 3 1 2 2 1 1 1 3 13 3 3 2 2 3 2 2 3 31 3 1 3 2 1 3 2 3 23 3 3 3 3 3 2 2 3 33 2 1 3 3 2 2 1 3 21 3 2 2 3 1 1 2 2 23 3 3 3 3 2 2 3 3 32 2 3 1 2 3 2 1 2 22 3 3 2 2 2 2 2 3 23 3 2 2 3 2 2 2 3 21 2 2 1 1 1 2 1 1 12 3 1 2 1 3 1 1 1 12 1 1 2 2 2 2 1 3 21 2 1 1 2 1 2 2 2 12 3 3 2 2 2 2 2 3 22 2 3 1 2 1 3 2 2 32 2 2 2 3 1 2 1 3 11 2 1 2 2 2 1 1 2 22 2 3 2 2 1 2 2 2 22 2 1 1 2 1 2 1 2 22 1 2 1 1 3 1 2 3 22 1 1 1 2 2 2 2 1 12 2 3 3 3 1 2 1 1 33 3 2 2 1 3 2 2 3 32 2 2 1 2 2 1 1 1 12 1 1 1 2 2 2 1 1 13 3 3 1 2 3 2 2 3 23 3 1 1 2 1 2 2 2 12 3 3 3 1 3 1 2 3 23 2 1 2 2 3 2 3 1 21 3 1 1 1 3 2 1 1 32 2 1 2 2 2 1 1 1 12 1 1 3 2 2 2 2 2 12 1 1 2 2 1 2 1 2 22 2 1 1 2 3 2 2 3 22 1 2 2 1 1 2 2 2 22 3 3 3 2 3 2 2 3 23 2 3 2 2 2 1 2 2 12 2 1 2 2 3 1 2 2 22 1 1 1 2 1 2 2 2 21 2 1 1 2 2 2 1 1 11 1 2 2 2 1 1 1 3 13 3 3 2 3 3 2 2 2 3
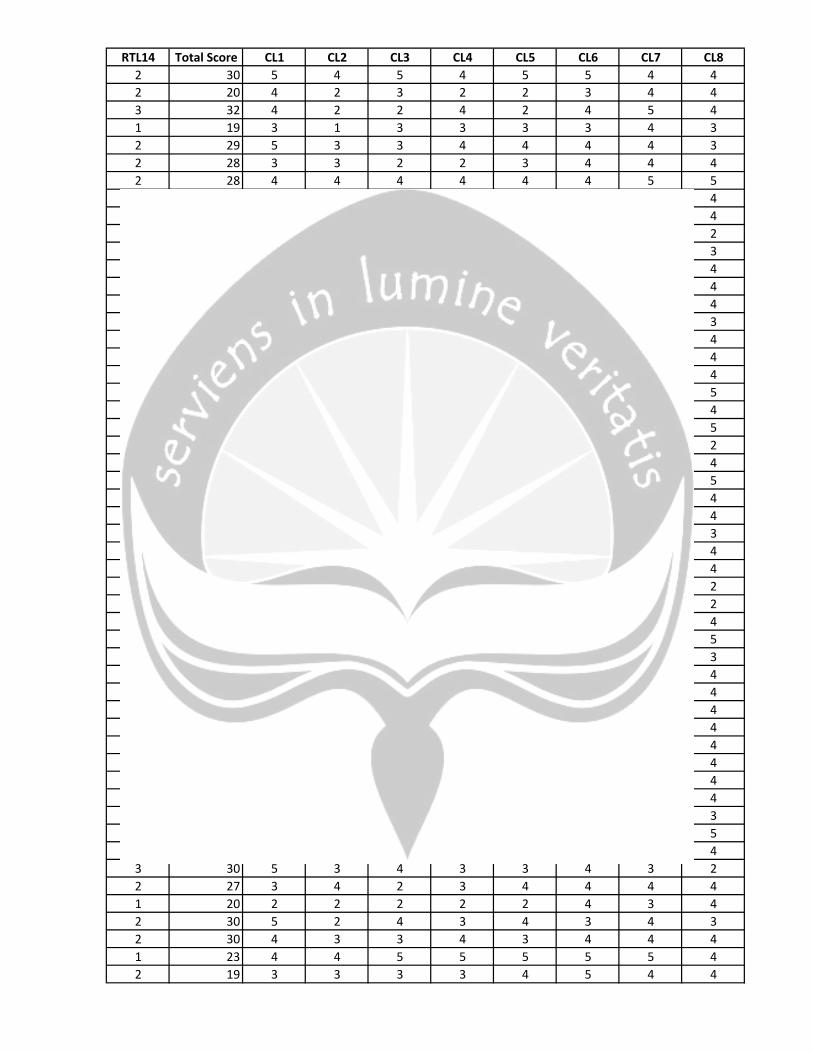
RTL14 Total Score CL1 CL2 CL3 CL4 CL5 CL6 CL7 CL82 30 5 4 5 4 5 5 4 42 20 4 2 3 2 2 3 4 43 32 4 2 2 4 2 4 5 41 19 3 1 3 3 3 3 4 32 29 5 3 3 4 4 4 4 32 28 3 3 2 2 3 4 4 42 28 4 4 4 4 4 4 5 53 29 4 3 3 3 3 4 4 42 34 4 3 4 2 4 2 4 42 27 2 2 2 2 2 4 4 22 24 2 1 3 2 2 3 3 32 29 3 2 3 3 3 5 5 42 26 3 2 3 4 3 4 5 43 28 4 4 5 3 3 4 5 42 28 4 3 4 2 4 5 5 31 22 3 2 2 4 3 5 4 42 33 5 4 5 4 5 5 5 42 35 5 2 4 4 5 5 4 41 35 4 2 4 4 4 4 4 51 18 2 1 1 2 2 3 4 42 36 4 2 4 4 4 5 5 51 15 2 1 2 2 2 3 4 21 19 4 2 4 2 4 4 4 42 35 4 3 4 4 4 5 4 52 31 4 2 4 4 4 4 4 41 17 4 1 2 2 2 4 4 42 19 4 2 2 2 3 3 4 32 35 4 4 4 4 4 5 5 42 32 4 2 2 2 4 5 4 41 24 4 4 4 4 4 4 5 21 23 4 2 2 4 3 4 4 22 30 4 4 4 4 4 5 5 43 37 4 4 4 4 4 5 5 51 17 2 1 2 2 2 3 4 32 28 4 4 4 4 4 4 4 42 27 2 1 2 2 2 2 4 42 27 4 2 2 2 3 4 4 42 22 2 1 2 2 3 3 4 42 23 4 3 4 4 4 5 5 42 29 4 1 4 4 4 5 5 42 24 2 2 2 2 2 4 3 42 20 4 2 4 4 2 4 5 42 22 3 4 3 3 3 3 4 31 24 4 2 3 3 3 4 3 53 25 3 3 3 3 3 3 3 43 30 5 3 4 3 3 4 3 22 27 3 4 2 3 4 4 4 41 20 2 2 2 2 2 4 3 42 30 5 2 4 3 4 3 4 32 30 4 3 3 4 3 4 4 41 23 4 4 5 5 5 5 5 42 19 3 3 3 3 4 5 4 4

2 34 5 3 4 3 4 5 3 41 28 3 3 4 4 3 5 4 42 37 5 4 4 4 4 5 5 41 26 4 2 3 4 4 4 4 42 20 2 2 2 2 2 2 4 42 27 3 4 4 2 4 4 3 41 21 4 2 3 3 3 3 3 11 16 2 2 2 2 2 4 4 22 32 4 2 4 4 4 4 4 42 29 4 4 4 4 4 5 5 41 20 2 2 2 2 2 3 5 41 21 4 1 2 4 4 4 4 41 22 3 2 2 4 3 4 3 42 24 2 2 3 3 4 4 4 31 26 3 2 2 3 2 4 4 31 18 4 3 3 4 4 4 4 21 24 5 4 4 4 4 5 4 42 25 4 3 4 4 3 5 4 42 23 4 2 3 4 3 4 4 41 21 4 1 2 2 4 4 4 42 26 4 2 2 4 3 4 4 52 21 3 2 2 3 2 3 4 42 24 2 2 2 2 2 2 4 22 27 4 3 2 4 4 4 4 43 32 4 4 4 4 4 5 4 42 24 4 2 2 2 2 4 4 42 18 3 3 2 2 2 4 4 42 25 2 2 2 4 4 4 4 22 34 5 4 5 4 5 5 5 42 24 2 1 1 2 2 2 2 22 25 4 2 4 2 4 4 4 42 28 5 4 4 5 5 5 4 51 19 4 2 2 2 2 4 4 41 27 4 4 4 4 4 4 2 31 18 4 1 2 2 2 4 4 21 22 5 4 4 4 4 5 4 42 31 4 4 4 4 4 5 5 51 16 3 2 2 2 2 4 4 42 23 4 2 4 4 4 5 4 42 24 4 2 4 4 4 4 4 32 28 4 2 2 4 4 4 4 42 26 3 2 4 3 4 5 5 43 22 4 1 4 2 4 4 4 42 25 4 2 4 4 4 4 4 22 27 4 2 4 4 4 4 4 42 26 5 3 4 4 4 5 5 53 32 5 2 5 4 4 5 4 41 22 3 2 2 4 4 4 4 41 22 2 1 2 3 2 4 4 51 21 3 4 4 4 3 4 4 41 22 2 1 3 2 3 5 4 42 27 4 2 2 3 4 4 4 41 22 4 2 2 2 2 5 5 4

2 22 1 1 2 2 1 4 4 42 28 5 4 4 4 5 5 4 43 36 3 2 2 3 2 5 4 42 31 4 2 2 2 3 5 5 42 27 3 2 4 4 3 4 5 42 32 4 2 4 4 4 4 5 42 27 3 1 2 2 2 3 4 41 18 2 2 2 4 2 4 4 32 32 4 4 4 4 4 4 5 42 33 5 4 4 4 4 5 5 42 21 4 1 4 4 4 4 4 42 22 2 1 2 2 2 4 4 22 32 5 4 4 3 4 5 5 52 33 5 4 5 4 5 5 5 52 30 4 4 4 4 4 5 5 42 29 4 4 4 4 4 4 4 12 24 4 4 4 4 4 4 4 42 28 4 2 2 4 2 4 4 52 28 4 2 4 4 4 4 4 41 22 4 2 4 4 4 4 4 41 23 4 2 3 4 3 5 5 43 27 4 2 5 2 5 5 4 42 29 4 4 4 4 4 5 5 53 32 3 2 4 3 4 4 4 42 30 4 2 2 4 2 4 4 42 28 4 2 2 2 2 2 4 42 24 4 3 4 4 4 5 5 52 27 4 4 4 4 4 4 5 21 19 4 1 2 4 2 4 4 21 18 4 2 2 2 2 4 5 41 18 4 2 2 2 3 4 5 42 32 4 4 4 4 4 4 5 51 23 2 2 2 4 2 4 5 52 25 3 2 2 2 2 4 4 41 22 4 2 4 4 2 4 4 41 35 4 2 4 4 4 5 4 43 34 5 4 4 4 4 5 5 41 16 2 1 2 2 2 2 4 42 20 4 2 2 3 2 3 4 22 32 5 4 5 5 4 5 5 42 26 4 2 2 4 2 4 4 52 33 5 4 4 4 4 5 5 42 32 5 2 4 4 4 5 5 41 17 3 1 2 2 2 3 4 22 36 4 4 4 4 4 5 4 42 24 2 1 1 2 2 4 5 41 22 2 2 2 2 2 4 5 42 32 5 2 4 5 4 4 5 31 15 2 2 2 2 2 4 4 22 27 4 2 2 4 4 4 4 42 22 4 1 2 2 4 4 5 51 21 4 2 4 4 4 4 2 22 22 2 2 2 2 2 4 4 4

2 22 3 1 2 2 2 3 4 41 20 4 2 2 2 2 4 4 42 26 5 4 4 4 4 5 5 42 19 4 4 4 4 4 4 3 41 23 4 1 2 2 4 4 4 41 20 2 1 2 2 2 4 4 42 33 5 4 4 4 4 4 3 43 32 4 5 4 5 4 3 4 42 39 5 5 5 5 5 5 5 52 29 4 4 4 4 4 4 4 42 24 4 2 2 4 4 4 4 42 38 4 5 4 4 5 4 3 42 27 4 4 2 2 2 2 2 42 32 5 4 4 4 4 4 5 52 34 4 4 4 4 4 4 4 41 17 4 1 2 2 2 3 4 41 22 2 2 2 2 2 1 1 12 24 4 1 2 2 2 4 4 52 21 2 2 2 3 2 2 4 22 28 4 2 3 4 3 4 4 52 26 5 3 4 4 4 4 4 41 24 4 1 4 4 4 4 4 41 22 4 2 3 4 4 4 5 42 28 4 2 4 4 4 4 4 42 21 4 2 3 4 4 4 4 23 26 4 2 4 4 5 4 4 41 19 4 2 4 4 4 4 5 22 29 4 4 4 4 4 4 4 32 34 3 2 2 2 2 3 5 42 21 4 1 2 3 2 4 5 21 18 4 2 2 2 3 4 4 42 31 3 2 2 2 2 4 5 42 24 4 4 4 3 4 4 5 22 30 5 4 4 3 4 5 5 52 28 3 1 1 2 2 4 4 42 23 4 3 2 3 3 3 3 42 21 2 2 2 2 2 2 4 22 24 4 2 2 4 4 4 4 41 20 2 1 2 2 2 2 5 21 25 4 2 2 3 3 4 5 42 22 4 1 2 4 2 4 4 42 32 4 2 5 5 5 5 5 41 27 3 2 2 2 2 4 5 42 24 3 2 2 2 2 4 3 42 22 2 2 2 2 2 2 4 41 19 2 2 2 2 2 4 4 31 20 4 2 2 2 3 4 4 32 37 4 2 2 4 4 5 4 2

CL9 CL10 CL11 CL12 CL13 CL14 CL15 Total Score4 4 2 2 4 4 4 604 2 2 2 2 2 4 423 3 2 2 4 3 5 493 4 3 2 3 3 4 453 3 2 2 2 4 4 503 4 3 2 4 4 4 494 3 2 2 4 3 5 574 4 3 2 3 3 5 525 2 2 2 4 4 4 504 4 2 2 4 4 4 444 3 2 2 2 2 4 383 4 2 2 3 3 5 502 4 2 2 3 3 5 495 4 3 2 4 3 5 584 3 1 3 4 4 5 543 4 2 3 4 4 4 514 4 4 2 5 4 5 654 4 2 2 5 4 5 595 4 2 2 5 5 5 592 3 2 2 4 4 4 404 4 2 2 5 4 5 592 2 1 2 4 2 5 364 4 3 1 5 4 4 534 3 4 2 5 4 5 604 4 4 2 5 4 5 582 2 2 1 5 2 4 413 2 2 1 2 2 4 394 3 2 2 5 4 5 592 4 2 2 5 4 4 502 4 3 2 4 3 5 542 4 2 2 4 2 4 454 4 2 2 5 5 5 614 4 2 2 5 4 5 612 2 2 2 2 2 4 354 4 2 4 2 5 5 583 2 2 1 4 4 5 402 2 2 1 2 2 4 402 2 2 1 4 4 4 402 3 1 1 2 4 4 503 2 2 2 5 4 4 532 2 2 2 4 3 4 402 2 2 2 4 4 4 492 2 2 2 4 2 4 443 3 2 2 4 4 4 492 2 3 2 2 2 4 423 2 4 2 4 4 2 484 2 2 2 4 4 4 504 2 2 2 4 3 5 434 2 4 2 4 4 5 534 3 4 2 4 4 4 544 4 4 2 5 4 5 655 4 2 2 5 5 5 57

5 3 2 2 5 4 4 564 3 2 1 4 4 4 524 3 4 2 4 4 5 614 2 4 2 4 4 4 534 2 2 2 4 2 2 384 2 2 2 4 4 4 502 3 2 1 4 2 4 402 4 2 2 2 2 4 382 4 1 4 2 4 4 514 4 2 1 5 4 4 584 2 2 1 4 4 4 432 2 1 2 2 2 4 424 3 1 1 4 2 4 444 2 2 2 4 2 4 454 2 2 1 4 4 5 452 2 2 2 4 2 4 464 2 2 2 4 4 5 574 3 3 2 5 4 4 562 3 2 1 4 4 5 494 2 2 2 4 2 4 455 3 2 2 5 4 5 542 2 2 1 4 4 4 422 2 2 1 4 2 4 354 2 4 2 5 2 4 524 4 2 2 5 4 5 594 2 2 2 4 2 5 452 2 2 1 4 4 5 442 2 2 1 4 2 5 424 2 4 2 5 4 4 622 2 3 2 2 4 4 334 2 2 1 4 4 4 495 2 4 2 5 4 5 642 2 2 2 4 2 4 423 3 3 2 4 3 5 522 2 2 1 4 2 4 382 2 2 1 4 4 4 534 2 2 1 5 4 5 582 2 2 1 2 2 4 382 2 2 2 4 4 4 514 2 2 2 4 4 5 524 2 2 2 2 4 4 484 2 4 2 4 4 4 544 2 2 2 2 4 4 474 2 2 2 2 4 4 484 2 3 2 5 4 5 555 2 2 2 4 4 5 595 2 5 4 5 5 5 644 2 1 1 4 4 4 474 2 2 2 4 4 4 454 2 2 1 2 4 4 494 2 2 2 2 2 4 424 1 2 1 5 4 5 494 1 2 1 5 4 5 48

4 2 2 2 2 2 4 374 1 2 1 5 4 5 574 1 2 2 4 4 5 474 2 2 2 5 4 4 503 2 2 1 4 4 4 494 2 2 2 5 4 5 554 2 2 1 4 4 4 424 2 2 2 2 4 4 434 1 2 1 5 4 5 554 2 2 2 5 2 5 574 1 2 1 5 2 4 482 1 2 1 4 2 5 365 2 4 5 5 4 4 645 2 4 2 5 4 5 654 2 4 2 5 4 4 592 2 1 1 4 2 5 462 2 2 2 5 4 4 534 1 4 2 4 4 4 502 2 2 1 5 4 5 515 5 3 2 4 2 4 554 1 4 1 5 4 4 534 2 2 2 2 4 4 514 4 5 2 5 5 5 654 2 1 2 4 2 4 474 2 4 2 4 4 4 502 2 2 2 4 4 5 434 1 1 1 4 4 4 532 1 2 1 4 2 5 482 2 1 2 2 4 4 404 2 2 1 2 2 4 424 2 2 2 2 4 4 464 2 2 2 4 4 5 575 1 4 1 4 4 5 502 1 2 1 2 2 4 372 1 2 1 4 4 5 474 1 2 2 5 4 5 544 2 4 2 5 4 5 612 1 2 1 2 4 4 352 2 2 1 2 2 4 374 2 4 2 5 4 5 635 2 2 2 4 4 5 514 2 2 2 5 4 5 592 2 2 1 5 4 4 532 1 2 1 4 4 4 374 2 2 2 5 2 4 542 1 2 1 2 4 5 383 2 2 2 2 4 4 424 2 2 2 4 4 4 542 2 2 2 2 4 4 384 2 2 2 4 4 4 504 1 2 1 4 4 4 475 2 1 1 4 4 5 482 1 2 1 2 2 4 36

4 1 1 1 4 4 5 414 2 2 2 4 2 4 444 1 3 1 4 4 5 572 1 2 1 5 4 4 504 1 4 1 5 4 5 492 1 2 1 5 2 4 384 5 5 4 5 4 5 644 2 4 2 5 2 4 565 4 4 2 5 4 5 694 2 3 2 5 4 5 572 1 2 4 4 2 4 474 2 3 4 5 4 5 604 4 4 2 5 4 4 494 2 4 2 4 4 4 595 4 1 4 5 4 4 592 1 2 1 2 4 4 382 1 2 1 2 1 2 245 1 2 2 4 4 4 462 1 2 2 2 4 4 364 2 2 2 4 3 3 494 4 4 4 3 3 4 582 1 4 1 5 2 5 492 1 1 1 4 2 4 454 2 2 2 4 4 4 522 1 2 2 2 2 4 424 2 4 2 4 4 4 552 1 2 1 2 2 4 433 4 2 2 4 3 5 544 2 2 2 5 4 5 472 1 2 1 5 4 5 432 1 1 1 4 4 4 424 2 2 1 5 4 5 472 1 1 1 2 4 4 455 2 4 5 5 4 4 644 2 2 1 2 2 4 384 1 2 1 2 4 4 432 1 2 2 4 2 4 354 1 2 1 4 4 5 492 1 2 1 2 2 4 324 1 1 2 4 2 4 454 2 2 2 2 4 4 454 1 4 2 4 4 5 594 4 2 1 2 2 4 434 2 2 2 4 4 4 444 1 2 1 2 4 4 382 1 2 1 2 4 4 372 3 2 2 3 2 5 432 4 2 2 2 4 4 47

111
Reliability and Validity Test for Risk Taking Level
Case Processing Summary
N %
Cases Valid 100 100.0
Excludeda 0 .0
Total 100 100.0
a. Listwise deletion based on all variables in the
procedure.
Reliability Statistics
Cronbach's Alpha N of Items
.844 14
Item Statistics
Mean Std. Deviation N
RTL1 1.28 .570 100
RTL2 1.56 .641 100
RTL3 1.58 .684 100
RTL4 2.29 .640 100
RTL5 2.10 .674 100
RTL6 1.75 .744 100
RTL7 1.72 .552 100
RTL8 1.95 .539 100
RTL9 2.08 .787 100
RTL10 1.84 .465 100
RTL11 1.72 .637 100
RTL12 2.07 .807 100
RTL13 1.91 .740 100
RTL14 1.79 .591 100

112
Item-Total Statistics
Scale Mean if Item
Deleted
Scale Variance if
Item Deleted
Corrected Item-
Total Correlation
Cronbach's Alpha
if Item Deleted
RTL1 24.36 25.465 .354 .842
RTL2 24.08 24.539 .454 .836
RTL3 24.06 24.259 .460 .836
RTL4 23.35 23.907 .561 .830
RTL5 23.54 23.362 .616 .826
RTL6 23.89 22.846 .623 .825
RTL7 23.92 25.852 .298 .844
RTL8 23.69 25.085 .455 .836
RTL9 23.56 23.623 .469 .836
RTL10 23.80 26.545 .222 .847
RTL11 23.92 23.650 .609 .827
RTL12 23.57 23.116 .523 .832
RTL13 23.73 22.805 .633 .824
RTL14 23.85 24.896 .438 .837
Scale Statistics
Mean Variance Std. Deviation N of Items
25.64 27.829 5.275 14

113
Reliability and Validity Test for Confidence Level
Case Processing Summary
N %
Cases Valid 100 100.0
Excludeda 0 .0
Total 100 100.0
a. Listwise deletion based on all variables in the
procedure.
Reliability Statistics
Cronbach's Alpha N of Items
.871 15
Item Statistics
Mean Std. Deviation N
CL1 3.64 .916 100
CL2 2.48 .990 100
CL3 3.13 1.031 100
CL4 3.21 .924 100
CL5 3.36 .916 100
CL6 4.07 .807 100
CL7 4.09 .637 100
CL8 3.71 .844 100
CL9 3.35 1.019 100
CL10 2.74 .860 100
CL11 2.33 .829 100
CL12 1.84 .598 100
CL13 3.88 .988 100
CL14 3.44 .925 100
CL15 4.36 .595 100

114
Item-Total Statistics
Scale Mean if Item
Deleted
Scale Variance if
Item Deleted
Corrected Item-
Total Correlation
Cronbach's Alpha
if Item Deleted
CL1 45.99 51.848 .615 .859
CL2 47.15 51.523 .584 .860
CL3 46.50 48.939 .748 .850
CL4 46.42 51.519 .635 .857
CL5 46.27 50.623 .717 .853
CL6 45.56 52.168 .684 .856
CL7 45.54 56.736 .381 .869
CL8 45.92 54.781 .425 .868
CL9 46.28 51.860 .539 .863
CL10 46.89 55.735 .337 .872
CL11 47.30 55.889 .341 .871
CL12 47.79 57.824 .288 .872
CL13 45.75 53.301 .453 .867
CL14 46.19 52.256 .575 .861
CL15 45.27 56.765 .411 .868
Scale Statistics
Mean Variance Std. Deviation N of Items
49.63 60.801 7.798 15

115
Chi-Square Test for Gender with Risk Taking Level and Confidence Level Score
Case Processing Summary
Cases
Valid Missing Total
N Percent N Percent N Percent
Sex * Total Score 206 100.0% 0 .0% 206 100.0%
Sex * Total Score 206 100.0% 0 .0% 206 100.0%

116
Total Score * Sex Crosstabulation
Sex
Total Men Women
Total Score 16 Count 0 1 1
Residual -.5 .5
Std. Residual -.7 .6
Adjusted Residual -.9 .9
17 Count 1 1 2
Residual .1 .0
Std. Residual .1 .0
Adjusted Residual .1 -.1
18 Count 0 3 3
Residual -1.4 1.4
Std. Residual -1.2 1.1
Adjusted Residual -1.6 1.6
19 Count 0 4 4
Residual -1.8 1.8
Std. Residual -1.4 1.3
Adjusted Residual -1.9 1.9

117
20 Count 1 8 9
Residual -3.2 3.2
Std. Residual -1.5 1.4
Adjusted Residual -2.2 2.2
21 Count 1 7 8
Residual -2.7 2.7
Std. Residual -1.4 1.3
Adjusted Residual -1.9 1.9
22 Count 1 8 9
Residual -3.2 3.2
Std. Residual -1.5 1.4
Adjusted Residual -2.2 2.2
23 Count 1 13 14
Residual -5.5 5.5
Std. Residual -2.1 2.0
Adjusted Residual -3.0 3.0
24 Count 0 24 24
Residual -11.1 11.1
Std. Residual -3.3 3.1
Adjusted Residual -4.8 4.8
25 Count 3 5 8

118
Residual -.7 .7
Std. Residual -.4 .3
Adjusted Residual -.5 .5
26 Count 10 8 18
Residual 1.7 -1.7
Std. Residual .6 -.5
Adjusted Residual .8 -.8
27 Count 4 5 9
Residual -.2 .2
Std. Residual .0 .1
Adjusted Residual -.1 .1
28 Count 5 5 10
Residual .4 -.4
Std. Residual .2 -.2
Adjusted Residual .3 -.3
29 Count 10 6 16
Residual 2.6 -2.6
Std. Residual 1.0 -.9
Adjusted Residual 1.4 -1.4
30 Count 7 4 11
Residual 1.9 -1.9

119
Std. Residual .9 -.8
Adjusted Residual 1.2 -1.2
31 Count 9 3 12
Residual 3.5 -3.5
Std. Residual 1.5 -1.4
Adjusted Residual 2.1 -2.1
32 Count 2 0 2
Residual 1.1 -1.1
Std. Residual 1.1 -1.0
Adjusted Residual 1.5 -1.5
33 Count 6 2 8
Residual 2.3 -2.3
Std. Residual 1.2 -1.1
Adjusted Residual 1.7 -1.7
34 Count 2 0 2
Residual 1.1 -1.1
Std. Residual 1.1 -1.0
Adjusted Residual 1.5 -1.5
35 Count 14 2 16
Residual 6.6 -6.6
Std. Residual 2.4 -2.3

120
Adjusted Residual 3.5 -3.5
36 Count 5 0 5
Residual 2.7 -2.7
Std. Residual 1.8 -1.6
Adjusted Residual 2.4 -2.4
37 Count 3 2 5
Residual .7 -.7
Std. Residual .5 -.4
Adjusted Residual .6 -.6
38 Count 4 0 4
Residual 2.2 -2.2
Std. Residual 1.6 -1.5
Adjusted Residual 2.2 -2.2
39 Count 5 0 5
Residual 2.7 -2.7
Std. Residual 1.8 -1.6
Adjusted Residual 2.4 -2.4

121
42 Count 1 0 1
Residual .5 -.5
Std. Residual .8 -.7
Adjusted Residual 1.1 -1.1
Total Count 95 111 206
Chi-Square Tests
Value df
Asymp. Sig. (2-
sided)
Pearson Chi-Square 92.843a 24 .000
Likelihood Ratio 117.354 24 .000
Linear-by-Linear Association 73.214 1 .000
N of Valid Cases 206
a. 35 cells (70,0%) have expected count less than 5. The minimum
expected count is ,46.

122
Total Score * Sex Crosstabulation
Sex
Total Men Women
Total Score 24 Count 0 1 1
Residual -.5 .5
Std. Residual -.7 .6
Adjusted Residual -.9 .9
32 Count 0 1 1
Residual -.5 .5
Std. Residual -.7 .6
Adjusted Residual -.9 .9
33 Count 0 1 1
Residual -.5 .5
Std. Residual -.7 .6
Adjusted Residual -.9 .9
35 Count 0 4 4
Residual -1.8 1.8
Std. Residual -1.4 1.3
Adjusted Residual -1.9 1.9
36 Count 0 4 4
Residual -1.8 1.8

123
Std. Residual -1.4 1.3
Adjusted Residual -1.9 1.9
37 Count 0 5 5
Residual -2.3 2.3
Std. Residual -1.5 1.4
Adjusted Residual -2.1 2.1
38 Count 2 9 11
Residual -3.1 3.1
Std. Residual -1.4 1.3
Adjusted Residual -1.9 1.9
39 Count 0 1 1
Residual -.5 .5
Std. Residual -.7 .6
Adjusted Residual -.9 .9
40 Count 0 7 7
Residual -3.2 3.2
Std. Residual -1.8 1.7
Adjusted Residual -2.5 2.5
41 Count 0 2 2
Residual -.9 .9
Std. Residual -1.0 .9

124
Adjusted Residual -1.3 1.3
42 Count 1 11 12
Residual -4.5 4.5
Std. Residual -1.9 1.8
Adjusted Residual -2.7 2.7
43 Count 3 6 9
Residual -1.2 1.2
Std. Residual -.6 .5
Adjusted Residual -.8 .8
44 Count 1 5 6
Residual -1.8 1.8
Std. Residual -1.1 1.0
Adjusted Residual -1.5 1.5
45 Count 3 8 11
Residual -2.1 2.1
Std. Residual -.9 .9
Adjusted Residual -1.3 1.3
46 Count 1 3 4
Residual -.8 .8
Std. Residual -.6 .6
Adjusted Residual -.9 .9

125
47 Count 5 5 10
Residual .4 -.4
Std. Residual .2 -.2
Adjusted Residual .3 -.3
48 Count 1 6 7
Residual -2.2 2.2
Std. Residual -1.2 1.1
Adjusted Residual -1.7 1.7
49 Count 7 8 15
Residual .1 .0
Std. Residual .0 .0
Adjusted Residual .0 .0
50 Count 8 5 13
Residual 2.0 -2.0
Std. Residual .8 -.8
Adjusted Residual 1.2 -1.2
51 Count 4 2 6
Residual 1.2 -1.2
Std. Residual .7 -.7
Adjusted Residual 1.0 -1.0
52 Count 4 2 6

126
Residual 1.2 -1.2
Std. Residual .7 -.7
Adjusted Residual 1.0 -1.0
53 Count 6 3 9
Residual 1.8 -1.8
Std. Residual .9 -.8
Adjusted Residual 1.3 -1.3
54 Count 6 3 9
Residual 1.8 -1.8
Std. Residual .9 -.8
Adjusted Residual 1.3 -1.3
55 Count 3 2 5
Residual .7 -.7
Std. Residual .5 -.4
Adjusted Residual .6 -.6
56 Count 3 0 3
Residual 1.6 -1.6
Std. Residual 1.4 -1.3
Adjusted Residual 1.9 -1.9
57 Count 5 3 8
Residual 1.3 -1.3

127
Std. Residual .7 -.6
Adjusted Residual .9 -.9
58 Count 5 1 6
Residual 2.2 -2.2
Std. Residual 1.3 -1.2
Adjusted Residual 1.9 -1.9
59 Count 9 2 11
Residual 3.9 -3.9
Std. Residual 1.7 -1.6
Adjusted Residual 2.4 -2.4
60 Count 3 0 3
Residual 1.6 -1.6
Std. Residual 1.4 -1.3
Adjusted Residual 1.9 -1.9
61 Count 3 1 4
Residual 1.2 -1.2
Std. Residual .9 -.8
Adjusted Residual 1.2 -1.2
62 Count 1 0 1
Residual .5 -.5
Std. Residual .8 -.7

128
Adjusted Residual 1.1 -1.1
63 Count 1 0 1
Residual .5 -.5
Std. Residual .8 -.7
Adjusted Residual 1.1 -1.1
64 Count 5 0 5
Residual 2.7 -2.7
Std. Residual 1.8 -1.6
Adjusted Residual 2.4 -2.4
65 Count 4 0 4
Residual 2.2 -2.2
Std. Residual 1.6 -1.5
Adjusted Residual 2.2 -2.2
69 Count 1 0 1
Residual .5 -.5
Std. Residual .8 -.7
Adjusted Residual 1.1 -1.1
Total Count 95 111 206
Chi-Square Tests
Value df
Asymp. Sig. (2-
sided)
Pearson Chi-Square 79.449a 34 .000
Likelihood Ratio 99.266 34 .000
Linear-by-Linear Association 68.417 1 .000
N of Valid Cases 206
a. 57 cells (81,4%) have expected count less than 5. The minimum
expected count is ,46.

129
Chi-Square Test for Religion with Risk Taking Level and Confidence Level Score
Case Processing Summary
Cases
Valid Missing Total
N Percent N Percent N Percent
Total Score * Religion 206 100.0% 0 .0% 206 100.0%
Total Score * Religion 206 100.0% 0 .0% 206 100.0%

130
Total Score * Religion Crosstabulation
Religion
Total Islam Chatolic Protestant Hindu Buddha
Total Score 16 Count 0 1 0 0 0 1
Residual -.5 .7 -.2 .0 .0
Std. Residual -.7 1.4 -.4 -.1 -.2
Adjusted Residual -1.0 1.6 -.4 -.1 -.2
17 Count 0 2 0 0 0 2
Residual -1.0 1.4 -.3 .0 .0
Std. Residual -1.0 1.9 -.6 -.2 -.3
Adjusted Residual -1.4 2.3 -.6 -.2 -.3
18 Count 1 2 0 0 0 3
Residual -.5 1.2 -.5 .0 -.1
Std. Residual -.4 1.3 -.7 -.2 -.3
Adjusted Residual -.6 1.5 -.7 -.2 -.4
19 Count 3 0 1 0 0 4
Residual 1.0 -1.1 .4 .0 -.2
Std. Residual .7 -1.1 .5 -.3 -.4
Adjusted Residual 1.0 -1.2 .5 -.3 -.4

131
20 Count 3 5 1 0 0 9
Residual -1.6 2.5 -.4 -.2 -.3
Std. Residual -.7 1.6 -.3 -.4 -.6
Adjusted Residual -1.1 1.9 -.4 -.4 -.6
21 Count 4 2 1 0 1 8
Residual .0 -.2 -.2 -.2 .7
Std. Residual .0 -.1 -.2 -.4 1.2
Adjusted Residual .0 -.2 -.2 -.4 1.3
22 Count 7 1 1 0 0 9
Residual 2.4 -1.5 -.4 -.2 -.3
Std. Residual 1.1 -.9 -.3 -.4 -.6
Adjusted Residual 1.6 -1.1 -.4 -.4 -.6
23 Count 9 3 2 0 0 14
Residual 1.9 -.9 -.2 -.3 -.5
Std. Residual .7 -.4 -.1 -.5 -.7
Adjusted Residual 1.0 -.5 -.1 -.5 -.8
24 Count 12 6 4 0 2 24
Residual -.2 -.6 .3 -.5 1.1
Std. Residual .0 -.2 .1 -.7 1.1
Adjusted Residual -.1 -.3 .2 -.7 1.2

132
25 Count 6 2 0 0 0 8
Residual 1.9 -.2 -1.2 -.2 -.3
Std. Residual 1.0 -.1 -1.1 -.4 -.6
Adjusted Residual 1.4 -.2 -1.2 -.4 -.6
26 Count 9 5 4 0 0 18
Residual -.2 .0 1.2 -.3 -.7
Std. Residual .0 .0 .7 -.6 -.8
Adjusted Residual .0 .0 .8 -.6 -.9
27 Count 4 2 2 0 1 9
Residual -.6 -.5 .6 -.2 .7
Std. Residual -.3 -.3 .5 -.4 1.1
Adjusted Residual -.4 -.4 .6 -.4 1.1
28 Count 7 0 3 0 0 10
Residual 1.9 -2.8 1.4 -.2 -.4
Std. Residual .8 -1.7 1.2 -.4 -.6
Adjusted Residual 1.2 -2.0 1.3 -.5 -.7
29 Count 7 4 4 1 0 16
Residual -1.2 -.4 1.5 .7 -.6
Std. Residual -.4 -.2 1.0 1.2 -.8
Adjusted Residual -.6 -.2 1.1 1.3 -.8

133
30 Count 7 3 1 0 0 11
Residual 1.4 .0 -.7 -.2 -.4
Std. Residual .6 .0 -.5 -.5 -.7
Adjusted Residual .9 .0 -.6 -.5 -.7
31 Count 2 5 2 2 1 12
Residual -4.1 1.7 .1 1.8 .5
Std. Residual -1.7 .9 .1 3.7 .8
Adjusted Residual -2.4 1.1 .1 3.8 .8
32 Count 1 0 0 1 0 2
Residual .0 -.6 -.3 1.0 .0
Std. Residual .0 -.7 -.6 4.9 -.3
Adjusted Residual .0 -.9 -.6 4.9 -.3
33 Count 3 1 3 0 1 8
Residual -1.1 -1.2 1.8 -.2 .7
Std. Residual -.5 -.8 1.6 -.4 1.2
Adjusted Residual -.8 -1.0 1.7 -.4 1.3
34 Count 1 1 0 0 0 2
Residual .0 .4 -.3 .0 .0
Std. Residual .0 .6 -.6 -.2 -.3
Adjusted Residual .0 .7 -.6 -.2 -.3

134
35 Count 9 4 1 0 2 16
Residual .8 -.4 -1.5 -.3 1.4
Std. Residual .3 -.2 -.9 -.6 1.7
Adjusted Residual .4 -.2 -1.1 -.6 1.9
36 Count 2 2 1 0 0 5
Residual -.5 .6 .2 .0 -.2
Std. Residual -.3 .5 .3 -.3 -.4
Adjusted Residual -.5 .6 .3 -.3 -.5
37 Count 2 3 0 0 0 5
Residual -.5 1.6 -.8 .0 -.2
Std. Residual -.3 1.4 -.9 -.3 -.4
Adjusted Residual -.5 1.6 -1.0 -.3 -.5
38 Count 2 1 1 0 0 4
Residual .0 -.1 .4 .0 -.2
Std. Residual .0 -.1 .5 -.3 -.4
Adjusted Residual .0 -.1 .5 -.3 -.4
39 Count 3 2 0 0 0 5
Residual .5 .6 -.8 .0 -.2
Std. Residual .3 .5 -.9 -.3 -.4
Adjusted Residual .4 .6 -1.0 -.3 -.5

135
42 Count 1 0 0 0 0 1
Residual .5 -.3 -.2 .0 .0
Std. Residual .7 -.5 -.4 -.1 -.2
Adjusted Residual 1.0 -.6 -.4 -.1 -.2
Total Count 105 57 32 4 8 206
Chi-Square Tests
Value df
Asymp. Sig. (2-
sided)
Pearson Chi-Square 99.235a 96 .390
Likelihood Ratio 83.094 96 .823
Linear-by-Linear
Association
.513 1 .474
N of Valid Cases 206
a. 116 cells (92,8%) have expected count less than 5. The minimum
expected count is ,02.

136
Total Score * Religion Crosstabulation
Religion
Total Islam Chatolic Protestant Hindu Buddha
Total Score 24 Count 1 0 0 0 0 1
Residual .5 -.3 -.2 .0 .0
Std. Residual .7 -.5 -.4 -.1 -.2
Adjusted Residual 1.0 -.6 -.4 -.1 -.2
32 Count 1 0 0 0 0 1
Residual .5 -.3 -.2 .0 .0
Std. Residual .7 -.5 -.4 -.1 -.2
Adjusted Residual 1.0 -.6 -.4 -.1 -.2
33 Count 0 0 1 0 0 1
Residual -.5 -.3 .8 .0 .0
Std. Residual -.7 -.5 2.1 -.1 -.2
Adjusted Residual -1.0 -.6 2.3 -.1 -.2
35 Count 3 0 1 0 0 4
Residual 1.0 -1.1 .4 .0 -.2
Std. Residual .7 -1.1 .5 -.3 -.4
Adjusted Residual 1.0 -1.2 .5 -.3 -.4
36 Count 2 1 1 0 0 4

137
Residual .0 -.1 .4 .0 -.2
Std. Residual .0 -.1 .5 -.3 -.4
Adjusted Residual .0 -.1 .5 -.3 -.4
37 Count 4 1 0 0 0 5
Residual 1.5 -.4 -.8 .0 -.2
Std. Residual .9 -.3 -.9 -.3 -.4
Adjusted Residual 1.3 -.4 -1.0 -.3 -.5
38 Count 6 3 2 0 0 11
Residual .4 .0 .3 -.2 -.4
Std. Residual .2 .0 .2 -.5 -.7
Adjusted Residual .2 .0 .2 -.5 -.7
39 Count 0 1 0 0 0 1
Residual -.5 .7 -.2 .0 .0
Std. Residual -.7 1.4 -.4 -.1 -.2
Adjusted Residual -1.0 1.6 -.4 -.1 -.2
40 Count 1 4 1 0 1 7
Residual -2.6 2.1 .0 -.1 .7
Std. Residual -1.4 1.5 .0 -.4 1.4
Adjusted Residual -2.0 1.8 .0 -.4 1.4
41 Count 1 1 0 0 0 2

138
Residual .0 .4 -.3 .0 .0
Std. Residual .0 .6 -.6 -.2 -.3
Adjusted Residual .0 .7 -.6 -.2 -.3
42 Count 7 2 2 0 1 12
Residual .9 -1.3 .1 -.2 .5
Std. Residual .4 -.7 .1 -.5 .8
Adjusted Residual .5 -.9 .1 -.5 .8
43 Count 7 1 0 1 0 9
Residual 2.4 -1.5 -1.4 .8 -.3
Std. Residual 1.1 -.9 -1.2 2.0 -.6
Adjusted Residual 1.6 -1.1 -1.3 2.0 -.6
44 Count 4 1 1 0 0 6
Residual .9 -.7 .1 -.1 -.2
Std. Residual .5 -.5 .1 -.3 -.5
Adjusted Residual .8 -.6 .1 -.3 -.5
45 Count 7 2 2 0 0 11
Residual 1.4 -1.0 .3 -.2 -.4
Std. Residual .6 -.6 .2 -.5 -.7
Adjusted Residual .9 -.7 .2 -.5 -.7
46 Count 2 1 1 0 0 4

139
Residual .0 -.1 .4 .0 -.2
Std. Residual .0 -.1 .5 -.3 -.4
Adjusted Residual .0 -.1 .5 -.3 -.4
47 Count 5 3 0 0 2 10
Residual .0 .2 -1.6 -.2 1.6
Std. Residual .0 .1 -1.2 -.4 2.6
Adjusted Residual .0 .2 -1.4 -.5 2.7
48 Count 3 3 0 0 1 7
Residual -.6 1.1 -1.1 -.1 .7
Std. Residual -.3 .8 -1.0 -.4 1.4
Adjusted Residual -.4 .9 -1.2 -.4 1.4
49 Count 8 3 4 0 0 15
Residual .4 -1.2 1.7 -.3 -.6
Std. Residual .1 -.6 1.1 -.5 -.8
Adjusted Residual .2 -.7 1.2 -.6 -.8
50 Count 7 4 1 1 0 13
Residual .4 .4 -1.0 .7 -.5
Std. Residual .1 .2 -.7 1.5 -.7
Adjusted Residual .2 .3 -.8 1.6 -.7
51 Count 3 3 0 0 0 6

140
Residual .0 1.3 -.9 -.1 -.2
Std. Residual .0 1.0 -1.0 -.3 -.5
Adjusted Residual .0 1.2 -1.1 -.3 -.5
52 Count 3 0 3 0 0 6
Residual .0 -1.7 2.1 -.1 -.2
Std. Residual .0 -1.3 2.1 -.3 -.5
Adjusted Residual .0 -1.5 2.4 -.3 -.5
53 Count 2 4 2 1 0 9
Residual -2.6 1.5 .6 .8 -.3
Std. Residual -1.2 1.0 .5 2.0 -.6
Adjusted Residual -1.8 1.2 .6 2.0 -.6
54 Count 4 3 2 0 0 9
Residual -.6 .5 .6 -.2 -.3
Std. Residual -.3 .3 .5 -.4 -.6
Adjusted Residual -.4 .4 .6 -.4 -.6
55 Count 3 1 1 0 0 5
Residual .5 -.4 .2 .0 -.2
Std. Residual .3 -.3 .3 -.3 -.4
Adjusted Residual .4 -.4 .3 -.3 -.5
56 Count 2 1 0 0 0 3

141
Residual .5 .2 -.5 .0 -.1
Std. Residual .4 .2 -.7 -.2 -.3
Adjusted Residual .5 .2 -.7 -.2 -.4
57 Count 2 4 1 1 0 8
Residual -2.1 1.8 -.2 .8 -.3
Std. Residual -1.0 1.2 -.2 2.1 -.6
Adjusted Residual -1.5 1.4 -.2 2.2 -.6
58 Count 1 3 2 0 0 6
Residual -2.1 1.3 1.1 -.1 -.2
Std. Residual -1.2 1.0 1.1 -.3 -.5
Adjusted Residual -1.7 1.2 1.2 -.3 -.5
59 Count 5 4 1 0 1 11
Residual -.6 1.0 -.7 -.2 .6
Std. Residual -.3 .5 -.5 -.5 .9
Adjusted Residual -.4 .7 -.6 -.5 .9
60 Count 1 0 1 0 1 3
Residual -.5 -.8 .5 .0 .9
Std. Residual -.4 -.9 .8 -.2 2.6
Adjusted Residual -.6 -1.1 .9 -.2 2.7
61 Count 2 1 0 0 1 4

142
Residual .0 -.1 -.6 .0 .8
Std. Residual .0 -.1 -.8 -.3 2.1
Adjusted Residual .0 -.1 -.9 -.3 2.2
62 Count 1 0 0 0 0 1
Residual .5 -.3 -.2 .0 .0
Std. Residual .7 -.5 -.4 -.1 -.2
Adjusted Residual 1.0 -.6 -.4 -.1 -.2
63 Count 1 0 0 0 0 1
Residual .5 -.3 -.2 .0 .0
Std. Residual .7 -.5 -.4 -.1 -.2
Adjusted Residual 1.0 -.6 -.4 -.1 -.2
64 Count 3 1 1 0 0 5
Residual .5 -.4 .2 .0 -.2
Std. Residual .3 -.3 .3 -.3 -.4
Adjusted Residual .4 -.4 .3 -.3 -.5
65 Count 2 1 1 0 0 4
Residual .0 -.1 .4 .0 -.2
Std. Residual .0 -.1 .5 -.3 -.4
Adjusted Residual .0 -.1 .5 -.3 -.4
69 Count 1 0 0 0 0 1

143
Residual .5 -.3 -.2 .0 .0
Std. Residual .7 -.5 -.4 -.1 -.2
Adjusted Residual 1.0 -.6 -.4 -.1 -.2
Total Count 105 57 32 4 8 206
Chi-Square Tests
Value df
Asymp. Sig. (2-
sided)
Pearson Chi-Square 101.110a 136 .989
Likelihood Ratio 99.084 136 .993
Linear-by-Linear Association 1.323 1 .250
N of Valid Cases 206
a. 168 cells (96,0%) have expected count less than 5. The minimum
expected count is ,02.

144
Chi-Square Test for Race with Risk Taking Level and Confidence Level Score
Case Processing Summary
Cases
Valid Missing Total
N Percent N Percent N Percent
Total Score * Race 206 100.0% 0 .0% 206 100.0%
Total Score * Race 206 100.0% 0 .0% 206 100.0%

145
Total Score * Race Crosstabulation
Race
Total Javanese Chinese Others
Total Score 16 Count 1 0 0 1
Residual .4 -.2 -.2
Std. Residual .6 -.5 -.5
Adjusted Residual .9 -.5 -.6
17 Count 1 0 1 2
Residual -.1 -.4 .5
Std. Residual -.1 -.6 .7
Adjusted Residual -.2 -.7 .9
18 Count 2 0 1 3
Residual .3 -.6 .3
Std. Residual .3 -.8 .3
Adjusted Residual .4 -.9 .4
19 Count 3 0 1 4
Residual .8 -.8 .0
Std. Residual .5 -.9 .0

146
Adjusted Residual .8 -1.0 .0
20 Count 6 2 1 9
Residual 1.0 .2 -1.2
Std. Residual .5 .1 -.8
Adjusted Residual .7 .1 -.9
21 Count 3 3 2 8
Residual -1.4 1.4 .1
Std. Residual -.7 1.1 .0
Adjusted Residual -1.0 1.2 .0
22 Count 5 2 2 9
Residual .0 .2 -.2
Std. Residual .0 .1 -.1
Adjusted Residual .0 .1 -.1
23 Count 8 2 4 14
Residual .3 -.9 .6
Std. Residual .1 -.5 .3
Adjusted Residual .1 -.6 .4
24 Count 16 5 3 24
Residual 2.7 .1 -2.8
Std. Residual .7 .0 -1.2

147
Adjusted Residual 1.2 .1 -1.4
25 Count 5 0 3 8
Residual .6 -1.6 1.1
Std. Residual .3 -1.3 .8
Adjusted Residual .4 -1.5 .9
26 Count 10 4 4 18
Residual .0 .3 -.4
Std. Residual .0 .2 -.2
Adjusted Residual .0 .2 -.2
27 Count 4 1 4 9
Residual -1.0 -.8 1.8
Std. Residual -.4 -.6 1.2
Adjusted Residual -.7 -.7 1.4
28 Count 5 2 3 10
Residual -.5 .0 .6
Std. Residual -.2 .0 .4
Adjusted Residual -.3 .0 .4
29 Count 11 3 2 16
Residual 2.1 -.3 -1.9
Std. Residual .7 -.1 -1.0

148
Adjusted Residual 1.1 -.2 -1.1
30 Count 7 2 2 11
Residual .9 -.2 -.7
Std. Residual .4 -.2 -.4
Adjusted Residual .6 -.2 -.5
31 Count 4 5 3 12
Residual -2.6 2.6 .1
Std. Residual -1.0 1.6 .1
Adjusted Residual -1.6 1.9 .1
32 Count 0 1 1 2
Residual -1.1 .6 .5
Std. Residual -1.1 .9 .7
Adjusted Residual -1.6 1.0 .9
33 Count 2 3 3 8
Residual -2.4 1.4 1.1
Std. Residual -1.2 1.1 .8
Adjusted Residual -1.8 1.2 .9
34 Count 1 0 1 2
Residual -.1 -.4 .5
Std. Residual -.1 -.6 .7

149
Adjusted Residual -.2 -.7 .9
35 Count 12 2 2 16
Residual 3.1 -1.3 -1.9
Std. Residual 1.1 -.7 -1.0
Adjusted Residual 1.6 -.8 -1.1
36 Count 2 2 1 5
Residual -.8 1.0 -.2
Std. Residual -.5 1.0 -.2
Adjusted Residual -.7 1.1 -.2
37 Count 3 2 0 5
Residual .2 1.0 -1.2
Std. Residual .1 1.0 -1.1
Adjusted Residual .2 1.1 -1.3
38 Count 2 0 2 4
Residual -.2 -.8 1.0
Std. Residual -.1 -.9 1.0
Adjusted Residual -.2 -1.0 1.2
39 Count 1 1 3 5
Residual -1.8 .0 1.8
Std. Residual -1.1 .0 1.6

150
Adjusted Residual -1.6 .0 1.9
42 Count 0 0 1 1
Residual -.6 -.2 .8
Std. Residual -.7 -.5 1.5
Adjusted Residual -1.1 -.5 1.8
Total Count 114 42 50 206
Chi-Square Tests
Value df
Asymp. Sig. (2-
sided)
Pearson Chi-Square 39.798a 48 .794
Likelihood Ratio 45.048 48 .595
Linear-by-Linear Association 1.780 1 .182
N of Valid Cases 206
a. 65 cells (86,7%) have expected count less than 5. The minimum
expected count is ,20.

151
Total Score * Race Crosstabulation
Race
Total Javanese Chinese Others
Total Score 24 Count 0 0 1 1
Residual -.6 -.2 .8
Std. Residual -.7 -.5 1.5
Adjusted Residual -1.1 -.5 1.8
32 Count 0 0 1 1
Residual -.6 -.2 .8
Std. Residual -.7 -.5 1.5
Adjusted Residual -1.1 -.5 1.8
33 Count 1 0 0 1
Residual .4 -.2 -.2
Std. Residual .6 -.5 -.5
Adjusted Residual .9 -.5 -.6
35 Count 1 0 3 4
Residual -1.2 -.8 2.0

152
Std. Residual -.8 -.9 2.1
Adjusted Residual -1.2 -1.0 2.4
36 Count 3 1 0 4
Residual .8 .2 -1.0
Std. Residual .5 .2 -1.0
Adjusted Residual .8 .2 -1.1
37 Count 4 0 1 5
Residual 1.2 -1.0 -.2
Std. Residual .7 -1.0 -.2
Adjusted Residual 1.1 -1.1 -.2
38 Count 8 1 2 11
Residual 1.9 -1.2 -.7
Std. Residual .8 -.8 -.4
Adjusted Residual 1.2 -1.0 -.5
39 Count 0 1 0 1
Residual -.6 .8 -.2
Std. Residual -.7 1.8 -.5
Adjusted Residual -1.1 2.0 -.6
40 Count 4 2 1 7
Residual .1 .6 -.7

153
Std. Residual .1 .5 -.5
Adjusted Residual .1 .5 -.6
41 Count 2 0 0 2
Residual .9 -.4 -.5
Std. Residual .8 -.6 -.7
Adjusted Residual 1.3 -.7 -.8
42 Count 7 4 1 12
Residual .4 1.6 -1.9
Std. Residual .1 1.0 -1.1
Adjusted Residual .2 1.1 -1.3
43 Count 6 0 3 9
Residual 1.0 -1.8 .8
Std. Residual .5 -1.4 .6
Adjusted Residual .7 -1.6 .6
44 Count 4 0 2 6
Residual .7 -1.2 .5
Std. Residual .4 -1.1 .5
Adjusted Residual .6 -1.3 .5
45 Count 7 2 2 11
Residual .9 -.2 -.7

154
Std. Residual .4 -.2 -.4
Adjusted Residual .6 -.2 -.5
46 Count 1 1 2 4
Residual -1.2 .2 1.0
Std. Residual -.8 .2 1.0
Adjusted Residual -1.2 .2 1.2
47 Count 4 2 4 10
Residual -1.5 .0 1.6
Std. Residual -.7 .0 1.0
Adjusted Residual -1.0 .0 1.2
48 Count 4 3 0 7
Residual .1 1.6 -1.7
Std. Residual .1 1.3 -1.3
Adjusted Residual .1 1.5 -1.5
49 Count 9 3 3 15
Residual .7 .0 -.6
Std. Residual .2 .0 -.3
Adjusted Residual .4 .0 -.4
50 Count 6 4 3 13
Residual -1.2 1.3 -.2

155
Std. Residual -.4 .8 .0
Adjusted Residual -.7 1.0 -.1
51 Count 5 0 1 6
Residual 1.7 -1.2 -.5
Std. Residual .9 -1.1 -.4
Adjusted Residual 1.4 -1.3 -.4
52 Count 4 0 2 6
Residual .7 -1.2 .5
Std. Residual .4 -1.1 .5
Adjusted Residual .6 -1.3 .5
53 Count 2 4 3 9
Residual -3.0 2.2 .8
Std. Residual -1.3 1.6 .6
Adjusted Residual -2.0 1.8 .6
54 Count 5 2 2 9
Residual .0 .2 -.2
Std. Residual .0 .1 -.1
Adjusted Residual .0 .1 -.1
55 Count 2 1 2 5
Residual -.8 .0 .8

156
Std. Residual -.5 .0 .7
Adjusted Residual -.7 .0 .8
56 Count 3 0 0 3
Residual 1.3 -.6 -.7
Std. Residual 1.0 -.8 -.9
Adjusted Residual 1.6 -.9 -1.0
57 Count 6 1 1 8
Residual 1.6 -.6 -.9
Std. Residual .7 -.5 -.7
Adjusted Residual 1.1 -.6 -.8
58 Count 2 2 2 6
Residual -1.3 .8 .5
Std. Residual -.7 .7 .5
Adjusted Residual -1.1 .8 .5
59 Count 6 2 3 11
Residual .0 -.2 .3
Std. Residual .0 -.2 .2
Adjusted Residual .0 -.2 .2
60 Count 0 1 2 3
Residual -1.7 .4 1.3

157
Std. Residual -1.3 .5 1.5
Adjusted Residual -1.9 .6 1.7
61 Count 2 1 1 4
Residual -.2 .2 .0
Std. Residual -.1 .2 .0
Adjusted Residual -.2 .2 .0
62 Count 0 1 0 1
Residual -.6 .8 -.2
Std. Residual -.7 1.8 -.5
Adjusted Residual -1.1 2.0 -.6
63 Count 1 0 0 1
Residual .4 -.2 -.2
Std. Residual .6 -.5 -.5
Adjusted Residual .9 -.5 -.6
64 Count 5 0 0 5
Residual 2.2 -1.0 -1.2
Std. Residual 1.3 -1.0 -1.1
Adjusted Residual 2.0 -1.1 -1.3
65 Count 0 3 1 4
Residual -2.2 2.2 .0

158
Std. Residual -1.5 2.4 .0
Adjusted Residual -2.2 2.7 .0
69 Count 0 0 1 1
Residual -.6 -.2 .8
Std. Residual -.7 -.5 1.5
Adjusted Residual -1.1 -.5 1.8
Total Count 114 42 50 206
Chi-Square Tests
Value df
Asymp. Sig. (2-
sided)
Pearson Chi-Square 75.688a 68 .244
Likelihood Ratio 86.540 68 .064
Linear-by-Linear Association .303 1 .582
N of Valid Cases 206
a. 98 cells (93,3%) have expected count less than 5. The minimum
expected count is ,20.

159
Independent t-test Risk Taking Level and Confidence Level Score
Group Statistics
Sex N Mean Std. Deviation Std. Error Mean
Total Score Men 95 31.21 4.849 .497
Women 111 24.56 4.120 .391
Total Score Men 95 53.98 6.557 .673
Women 111 44.59 6.725 .638
160
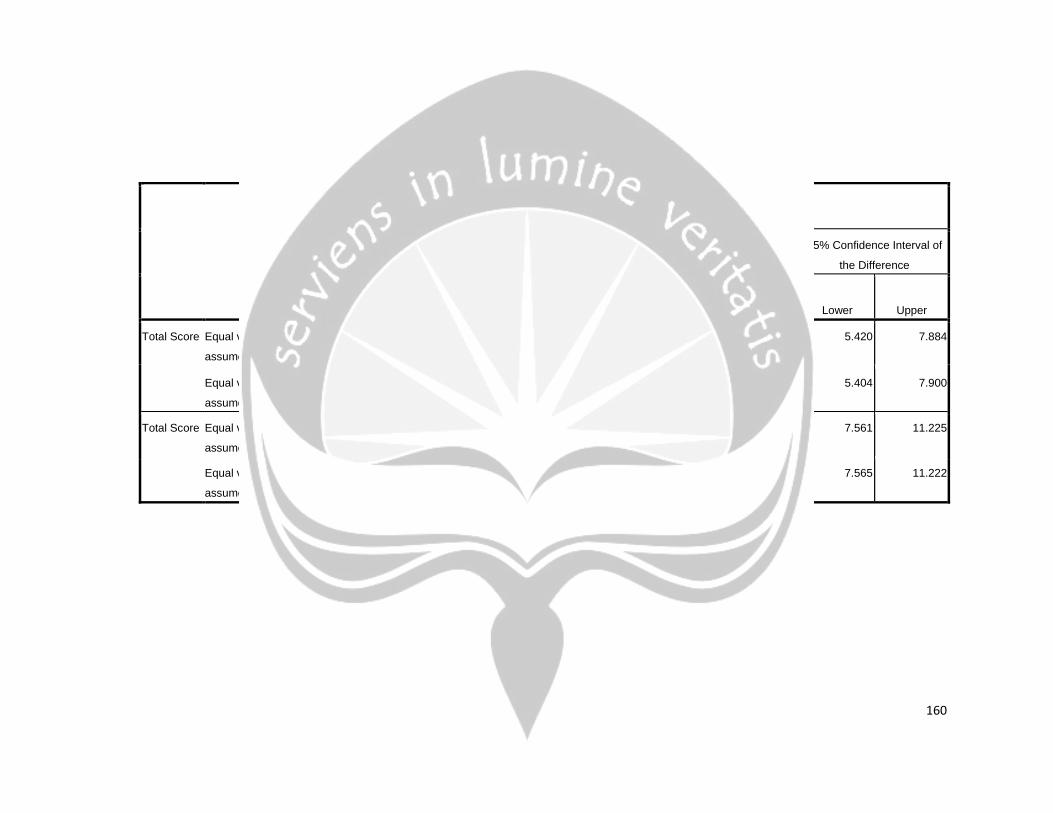
Independent Samples Test
Levene's Test for Equality of
Variances t-test for Equality of Means
95% Confidence Interval of
the Difference
F Sig. t df Sig. (2-tailed)
Mean
Difference
Std. Error
Difference Lower Upper
Total Score Equal variances
assumed
5.144 .024 10.646 204 .000 6.652 .625 5.420 7.884
Equal variances not
assumed 10.513 185.535 .000 6.652 .633 5.404 7.900
Total Score Equal variances
assumed
.006 .936 10.109 204 .000 9.393 .929 7.561 11.225
Equal variances not
assumed 10.129 200.539 .000 9.393 .927 7.565 11.222