Embed Size (px)
Citation preview
Gender, Culture, and Sex-Typed Cognitive Abilities
Author
Reilly, David
Published
2012
Journal Title
PloS One
DOI
https://doi.org/10.1371/journal.pone.0039904
Copyright Statement
© 2012 Reilly et al. This is an Open Access article distributed under the terms of the CreativeCommons Attribution License CCAL. (http://www.plos.org/journals/license.html)
Downloaded from
http://hdl.handle.net/10072/47728
Griffith Research Online
https://research-repository.griffith.edu.au
Gender, Culture, and Sex-Typed Cognitive AbilitiesDavid Reilly*
School of Applied Psychology, Griffith University, Southport, Queensland, Australia
Abstract
Although gender differences in cognitive abilities are frequently reported, the magnitude of these differences and whetherthey hold practical significance in the educational outcomes of boys and girls is highly debated. Furthermore, when gendergaps in reading, mathematics and science literacy are reported they are often attributed to innate, biological differencesrather than social and cultural factors. Cross-cultural evidence may contribute to this debate, and this study reports nationalgender differences in reading, mathematics and science literacy from 65 nations participating in the 2009 round of theProgramme for International Student Assessment (PISA). Consistently across all nations, girls outperform boys in readingliteracy, d = 2.44. Boys outperform girls in mathematics in the USA, d = .22 and across OECD nations, d = .13. For scienceliteracy, while the USA showed the largest gender difference across all OECD nations, d = .14, gender differences acrossOECD nations were non-significant, and a small female advantage was found for non-OECD nations, d = 2.09. Across allthree domains, these differences were more pronounced at both tails of the distribution for low- and high-achievers.Considerable cross-cultural variability was also observed, and national gender differences were correlated with genderequity measures, economic prosperity, and Hofstede’s cultural dimension of power distance. Educational and societalimplications of such gender gaps are addressed, as well as the mechanisms by which gender differences in cognitiveabilities are culturally mediated.
Citation: Reilly D (2012) Gender, Culture, and Sex-Typed Cognitive Abilities. PLoS ONE 7(7): e39904. doi:10.1371/journal.pone.0039904
Editor: Sonia Brucki, University Of Sao Paulo, Brazil
Received February 29, 2012; Accepted May 28, 2012; Published July 10, 2012
Copyright: � 2012 David Reilly. This is an open-access article distributed under the terms of the Creative Commons Attribution License, which permitsunrestricted use, distribution, and reproduction in any medium, provided the original author and source are credited.
Funding: This research was supported in part by a Griffith University Postgraduate Research Scholarship. The funders had no role in study design, data collectionand analysis, decision to publish, or preparation of the manuscript.
Competing Interests: The author has declared that no competing interests exist.
* E-mail: [email protected]
Introduction
Rightly or wrongly, the topic of gender differences in cognitive
abilities appears perennial, holding curiosity not only for social
scientists but also for the general public and media [1–4].
Intelligence is multifaceted [5–10], and comprises a range of
culturally-valued cognitive abilities. While there is almost unan-
imous consensus that men and women do not differ in general
intelligence [11–14], there are several domains where either males
or females as a group may show an advantage, such as visuospatial
[15–16] and verbal abilities [17–18] respectively. However, gender
differences in quantitative abilities [19], such as science and
mathematics, remain contentious. Researchers are divided be-
tween arguing for small but still influential differences in
quantitative reasoning [9–11], and claiming that any observed
differences in maths are so small, in fact, that they can be
categorised as ‘trivial’ [12–14].
A key limitation of research in this area is that it is largely US-
centric, and does not speak to gender differences between males
and females raised under different social and educational
environments in other cultures. Additional lines of evidence are
required, and one such source is international testing of students.
Secondly, research primarily focuses on mean gender differences,
and fails to address gender differences in the tails of distributions
which Hyde, et al. [20] argues may forecast the underrepresen-
tation of women in the science, technology, engineering and
mathematics (STEM) related professions.
To this aim, I present findings from the 2009 OECD
Programme for International Student Assessment (PISA), which
to my knowledge has not yet been widely discussed in psychology
journals. This information provides a snapshot of current gender
differences and similarities in reading, mathematics and science
across 65 nations. It also highlights the wide degree of cultural
variation between nations, and examines the role that social and
environmental factors play in the development of gender
differences. Before reviewing the PISA findings, I will briefly
discuss the advantages that national and cross-national testing
have to offer the debate on the nature of gender differences in
cognitive abilities.
Advantages of Nationally-representative Samples forAssessing Gender Differences
Large national and international samples can provide a
‘yardstick’ estimate of gender differences within a given region,
at a given point in time. By drawing from a broad population
of students, national and international testing provide us with
stronger evidence for gender similarities or differences than
could be found from smaller, more selective samples. It is
common practice for gender difference studies to use conve-
nience samples drawn from psychology student subject pools
[21], as well as from groups of high performing students such as
gifted and talented programmes [22] – conclusions drawn from
such samples may not be generalizable to wider populations.
There is evidence to suggest that the performance of males is
more widely distributed, with a greater numbers of high and
low achievers [23]. This has been termed the greater male
variability hypothesis [10,15–16], and presents a problem for
researchers recruiting from only high achievers – even though
mean differences between males and females may be equal, if
PLoS ONE | www.plosone.org 1 July 2012 | Volume 7 | Issue 7 | e39904
the distribution of male scores is wider than females, males will
be overrepresented as high-achievers in a selective sample. This
may lead to the erroneous conclusion that gender differences
exist in the population of males and females.
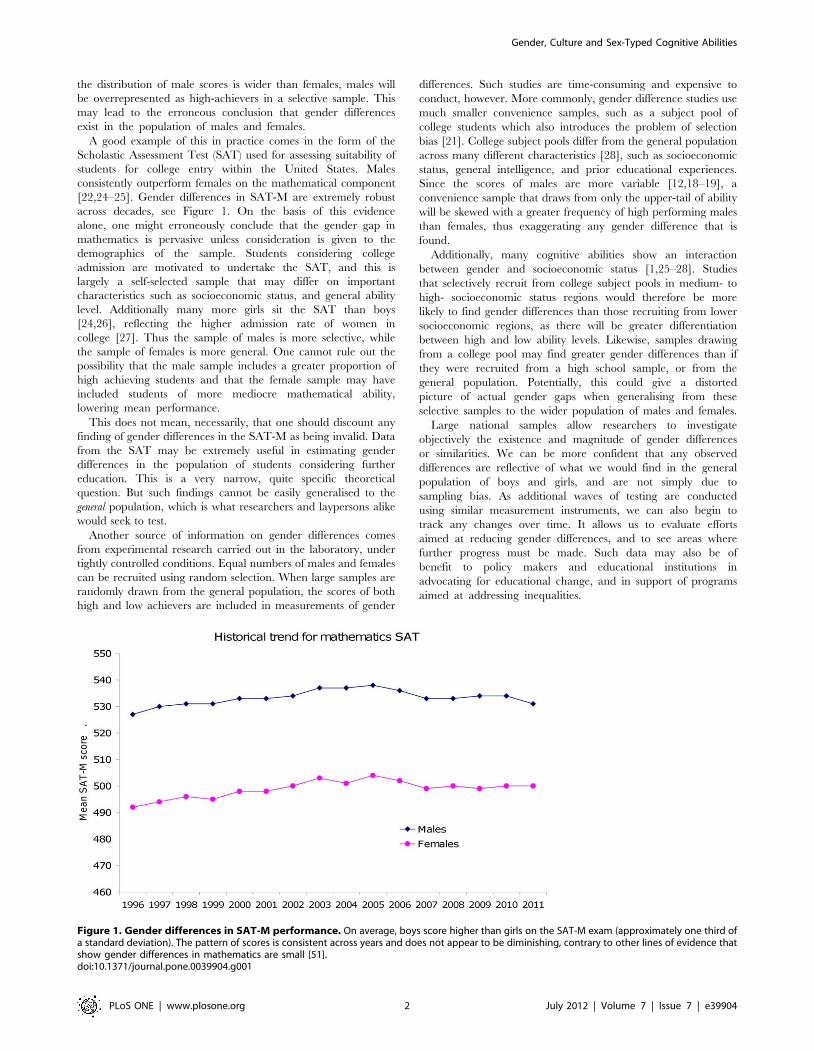
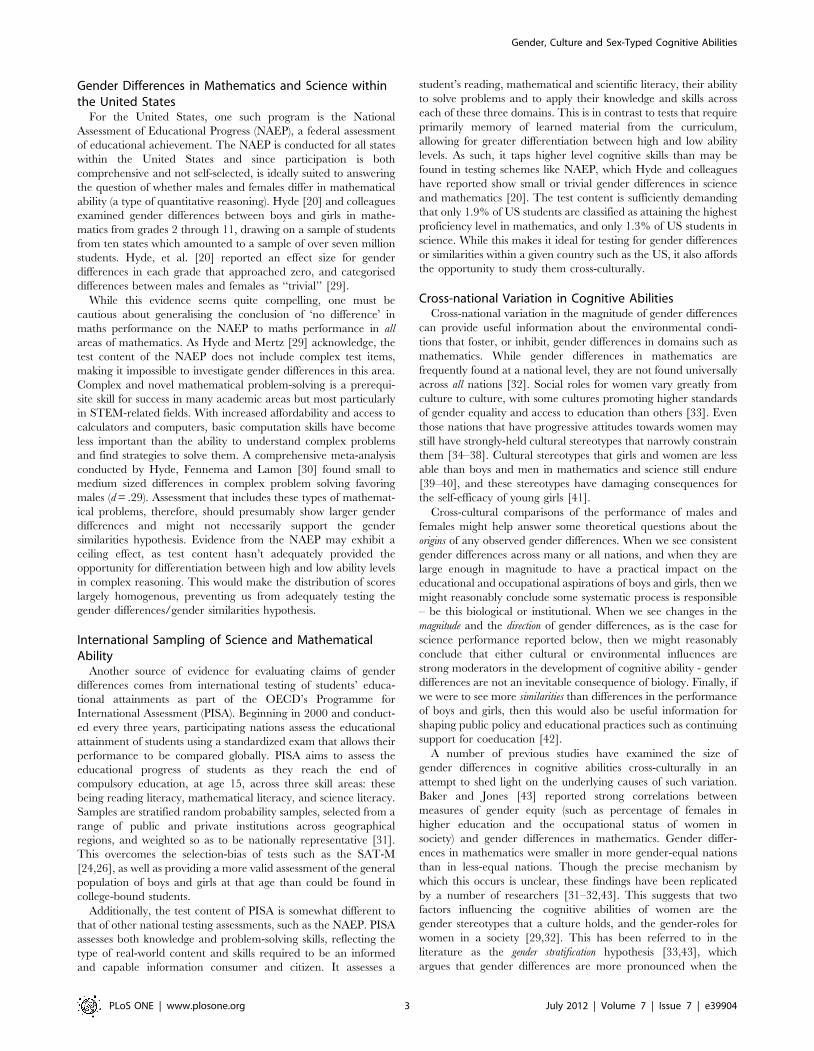
A good example of this in practice comes in the form of the
Scholastic Assessment Test (SAT) used for assessing suitability of
students for college entry within the United States. Males
consistently outperform females on the mathematical component
[22,24–25]. Gender differences in SAT-M are extremely robust
across decades, see Figure 1. On the basis of this evidence
alone, one might erroneously conclude that the gender gap in
mathematics is pervasive unless consideration is given to the
demographics of the sample. Students considering college
admission are motivated to undertake the SAT, and this is
largely a self-selected sample that may differ on important
characteristics such as socioeconomic status, and general ability
level. Additionally many more girls sit the SAT than boys
[24,26], reflecting the higher admission rate of women in
college [27]. Thus the sample of males is more selective, while
the sample of females is more general. One cannot rule out the
possibility that the male sample includes a greater proportion of
high achieving students and that the female sample may have
included students of more mediocre mathematical ability,
lowering mean performance.
This does not mean, necessarily, that one should discount any
finding of gender differences in the SAT-M as being invalid. Data
from the SAT may be extremely useful in estimating gender
differences in the population of students considering further
education. This is a very narrow, quite specific theoretical
question. But such findings cannot be easily generalised to the
general population, which is what researchers and laypersons alike
would seek to test.
Another source of information on gender differences comes
from experimental research carried out in the laboratory, under
tightly controlled conditions. Equal numbers of males and females
can be recruited using random selection. When large samples are
randomly drawn from the general population, the scores of both
high and low achievers are included in measurements of gender
differences. Such studies are time-consuming and expensive to
conduct, however. More commonly, gender difference studies use
much smaller convenience samples, such as a subject pool of
college students which also introduces the problem of selection
bias [21]. College subject pools differ from the general population
across many different characteristics [28], such as socioeconomic
status, general intelligence, and prior educational experiences.
Since the scores of males are more variable [12,18–19], a
convenience sample that draws from only the upper-tail of ability
will be skewed with a greater frequency of high performing males
than females, thus exaggerating any gender difference that is
found.
Additionally, many cognitive abilities show an interaction
between gender and socioeconomic status [1,25–28]. Studies
that selectively recruit from college subject pools in medium- to
high- socioeconomic status regions would therefore be more
likely to find gender differences than those recruiting from lower
socioeconomic regions, as there will be greater differentiation
between high and low ability levels. Likewise, samples drawing
from a college pool may find greater gender differences than if
they were recruited from a high school sample, or from the
general population. Potentially, this could give a distorted
picture of actual gender gaps when generalising from these
selective samples to the wider population of males and females.
Large national samples allow researchers to investigate
objectively the existence and magnitude of gender differences
or similarities. We can be more confident that any observed
differences are reflective of what we would find in the general
population of boys and girls, and are not simply due to
sampling bias. As additional waves of testing are conducted
using similar measurement instruments, we can also begin to
track any changes over time. It allows us to evaluate efforts
aimed at reducing gender differences, and to see areas where
further progress must be made. Such data may also be of
benefit to policy makers and educational institutions in
advocating for educational change, and in support of programs
aimed at addressing inequalities.
Figure 1. Gender differences in SAT-M performance. On average, boys score higher than girls on the SAT-M exam (approximately one third ofa standard deviation). The pattern of scores is consistent across years and does not appear to be diminishing, contrary to other lines of evidence thatshow gender differences in mathematics are small [51].doi:10.1371/journal.pone.0039904.g001
Gender, Culture and Sex-Typed Cognitive Abilities
PLoS ONE | www.plosone.org 2 July 2012 | Volume 7 | Issue 7 | e39904
Gender Differences in Mathematics and Science withinthe United States
For the United States, one such program is the National
Assessment of Educational Progress (NAEP), a federal assessment
of educational achievement. The NAEP is conducted for all states
within the United States and since participation is both
comprehensive and not self-selected, is ideally suited to answering
the question of whether males and females differ in mathematical
ability (a type of quantitative reasoning). Hyde [20] and colleagues
examined gender differences between boys and girls in mathe-
matics from grades 2 through 11, drawing on a sample of students
from ten states which amounted to a sample of over seven million
students. Hyde, et al. [20] reported an effect size for gender
differences in each grade that approached zero, and categorised
differences between males and females as ‘‘trivial’’ [29].
While this evidence seems quite compelling, one must be
cautious about generalising the conclusion of ‘no difference’ in
maths performance on the NAEP to maths performance in all
areas of mathematics. As Hyde and Mertz [29] acknowledge, the
test content of the NAEP does not include complex test items,
making it impossible to investigate gender differences in this area.
Complex and novel mathematical problem-solving is a prerequi-
site skill for success in many academic areas but most particularly
in STEM-related fields. With increased affordability and access to
calculators and computers, basic computation skills have become
less important than the ability to understand complex problems
and find strategies to solve them. A comprehensive meta-analysis
conducted by Hyde, Fennema and Lamon [30] found small to
medium sized differences in complex problem solving favoring
males (d = .29). Assessment that includes these types of mathemat-
ical problems, therefore, should presumably show larger gender
differences and might not necessarily support the gender
similarities hypothesis. Evidence from the NAEP may exhibit a
ceiling effect, as test content hasn’t adequately provided the
opportunity for differentiation between high and low ability levels
in complex reasoning. This would make the distribution of scores
largely homogenous, preventing us from adequately testing the
gender differences/gender similarities hypothesis.
International Sampling of Science and MathematicalAbility
Another source of evidence for evaluating claims of gender
differences comes from international testing of students’ educa-
tional attainments as part of the OECD’s Programme for
International Assessment (PISA). Beginning in 2000 and conduct-
ed every three years, participating nations assess the educational
attainment of students using a standardized exam that allows their
performance to be compared globally. PISA aims to assess the
educational progress of students as they reach the end of
compulsory education, at age 15, across three skill areas: these
being reading literacy, mathematical literacy, and science literacy.
Samples are stratified random probability samples, selected from a
range of public and private institutions across geographical
regions, and weighted so as to be nationally representative [31].
This overcomes the selection-bias of tests such as the SAT-M
[24,26], as well as providing a more valid assessment of the general
population of boys and girls at that age than could be found in
college-bound students.
Additionally, the test content of PISA is somewhat different to
that of other national testing assessments, such as the NAEP. PISA
assesses both knowledge and problem-solving skills, reflecting the
type of real-world content and skills required to be an informed
and capable information consumer and citizen. It assesses a
student’s reading, mathematical and scientific literacy, their ability
to solve problems and to apply their knowledge and skills across
each of these three domains. This is in contrast to tests that require
primarily memory of learned material from the curriculum,
allowing for greater differentiation between high and low ability
levels. As such, it taps higher level cognitive skills than may be
found in testing schemes like NAEP, which Hyde and colleagues
have reported show small or trivial gender differences in science
and mathematics [20]. The test content is sufficiently demanding
that only 1.9% of US students are classified as attaining the highest
proficiency level in mathematics, and only 1.3% of US students in
science. While this makes it ideal for testing for gender differences
or similarities within a given country such as the US, it also affords
the opportunity to study them cross-culturally.
Cross-national Variation in Cognitive AbilitiesCross-national variation in the magnitude of gender differences
can provide useful information about the environmental condi-
tions that foster, or inhibit, gender differences in domains such as
mathematics. While gender differences in mathematics are
frequently found at a national level, they are not found universally
across all nations [32]. Social roles for women vary greatly from
culture to culture, with some cultures promoting higher standards
of gender equality and access to education than others [33]. Even
those nations that have progressive attitudes towards women may
still have strongly-held cultural stereotypes that narrowly constrain
them [34–38]. Cultural stereotypes that girls and women are less
able than boys and men in mathematics and science still endure
[39–40], and these stereotypes have damaging consequences for
the self-efficacy of young girls [41].
Cross-cultural comparisons of the performance of males and
females might help answer some theoretical questions about the
origins of any observed gender differences. When we see consistent
gender differences across many or all nations, and when they are
large enough in magnitude to have a practical impact on the
educational and occupational aspirations of boys and girls, then we
might reasonably conclude some systematic process is responsible
– be this biological or institutional. When we see changes in the
magnitude and the direction of gender differences, as is the case for
science performance reported below, then we might reasonably
conclude that either cultural or environmental influences are
strong moderators in the development of cognitive ability - gender
differences are not an inevitable consequence of biology. Finally, if
we were to see more similarities than differences in the performance
of boys and girls, then this would also be useful information for
shaping public policy and educational practices such as continuing
support for coeducation [42].
A number of previous studies have examined the size of
gender differences in cognitive abilities cross-culturally in an
attempt to shed light on the underlying causes of such variation.
Baker and Jones [43] reported strong correlations between
measures of gender equity (such as percentage of females in
higher education and the occupational status of women in
society) and gender differences in mathematics. Gender differ-
ences in mathematics were smaller in more gender-equal nations
than in less-equal nations. Though the precise mechanism by
which this occurs is unclear, these findings have been replicated
by a number of researchers [31–32,43]. This suggests that two
factors influencing the cognitive abilities of women are the
gender stereotypes that a culture holds, and the gender-roles for
women in a society [29,32]. This has been referred to in the
literature as the gender stratification hypothesis [33,43], which
argues that gender differences are more pronounced when the
Gender, Culture and Sex-Typed Cognitive Abilities
PLoS ONE | www.plosone.org 3 July 2012 | Volume 7 | Issue 7 | e39904

roles of men and women are tightly controlled into separate
spheres and duties [35,37,44–45].
Mathematics is not the only cognitive domain where we see an
influence of gender-equality and gender stereotypes on cognitive
performance. The female advantage in reading and language,
while universal, also differs in magnitude between nations. Guiso,
et al. [32] examined data from the PISA 2003 round of testing,
replicating the finding of Baker and Jones for mathematics as well
as finding an association between gender equity and the gender
gap in reading. Although this might be expected given that
correlations between mathematics performance and reading
overlap, the direction of the association differed. Instead of finding
reduced gender differences in reading for countries fostering
greater gender-equality, the gender gap between boys and girls
actually increased. One possibility for this seemingly paradoxical
finding is that whatever natural advantage girls may have for
reading is suppressed in more restrictive countries, but that under
favorable conditions is allowed to flourish to its full potential.
However, further replication of these findings with subsequent
waves of testing is required to determine whether this association is
stable across time.
Programme for International Student Assessment (PISA)2009
Cross-cultural evidence of gender differences or similarities
provides a stronger foundation for understanding the role of social
and biological factors in the development of sex differences, as
noted above. The aim of this study was to explore sociocultural
factors that promote, or inhibit, the development of gender gaps in
highly sex-typed academic domains of reading, mathematics and
science [46]. It presents findings from international assessment of
student abilities as part of the Programme for International
Student Assessment (PISA), conducted by the Organisation for
Economic Co-operation and Development (OECD). The study
uses data from the most recent round of testing to calculate
national and international gender gaps in reading, mathematics,
and science literacy.
In addition to presenting data on national gender differences, it
uses meta-analytic techniques to calculate global gender differ-
ences to examine evidence for Hyde’s gender similarities hypothesis
[47], which posits there are no meaningful gender differences in
cognitive performance. The study also seeks to replicate the
findings of past researchers for the gender stratification hypothesis
[27,38,43–44], using several measures of gender equity and
occupational segregation. A number of other sociocultural
constructs are also examined to determine the extent to which
gender differences are culturally mediated by factors other than
biology.
One hypothesised influence is the economic prosperity of a
nation [39–41], which reflects two mechanisms. Firstly, greater
economic prosperity allows for a greater proportion of national
resources to be spent on education, resulting in a higher quality of
education and emphasis on skills such as mathematics and science.
Secondly, skills in these technical areas are in greater demand, and
represent a pathway to a higher standard of living. This may result
in greater competition for these occupations, and such competition
may not always be helpful to the career aspirations of women
wishing to enter male-dominated fields. While increases in gender
equity are strongly associated with economic prosperity (and hence
should be associated with smaller gender gaps), these may be
partially offset by increased occupational stratification and
stronger cultural stereotypes associating maths and science with
gender roles [27,32–33,44–45]. Thus increased gender differences
are not purely the result of increased spending on education and
also reflect social processes.
A second mechanism by which gender differences may be
culturally mediated is through the attitudes, values, and beliefs of a
nation. While beliefs about the role of women in society vary
considerably from nation to nation, there are few instruments
available that have wide global coverage of gender stereotypes and
attitudes towards women [38,48–49]. One of most widely used
cultural instruments is Hofestede’s [50] five cultural dimensions.
One of these is theoretically relevant to cultural mediation of
gender differences in cognitive ability, the dimension of power
distance.
The dimension power distance describes the ways in which
societies address the issue of human inequality, and the ways in
which social groups are segregated [50]. In a lower power distance
culture, there are reduced distinctions between social classes,
between employees and employers, between students and teachers,
and between genders. Higher power distance cultures have greater
social division, and a compensatory strategy for those who are
lower in power is to acquire culturally valued skills through
education. Girls may have increased motivation to learn maths
and science and pursue higher status occupations as a way of
overcoming social inequity.
HypothesesBased on prior research and theoretical perspectives, it was
hypothesised that:
1) Gender differences in the domains of mathematics, and
science would be found for the United States, and these
would be larger than those reported by Hyde [51]. These
would reflect gender stereotypes associating these domains
with masculinity and males [39]. However gender differ-
ences cross-culturally would be much smaller, in partial
support of a global gender similarities hypothesis.
2) Gender differences in reading performance in favor of girls
would be found in reading for the United States and cross-
culturally, reflecting an inherent biological disposition that is
only weakly influenced by cultural environment.
3) Measures of national gender equity would be associated with
smaller gender gaps in mathematics and science, in support
of the gender stratification hypothesis. Furthermore, in-
creased gender equity would be weakly associated with
wider reading gaps in favor of girls.
4) Economic prosperity would be associated with wider gender
gaps in mathematics and science than in less prosperous
nations, reflecting increased spending on education, in-
creased demand for these skills, and heightened competition
by males. Such competition may not be helpful to the career
aspirations of women, but will not influence reading
performance which is less malleable to social and cultural
influences.
5) Countries that score highly on Hofestede’s power distance
dimension have greater segregation and foster inequalities,
particularly for women. A compensatory strategy for women
is to acquire culturally-valued skills such as science and
mathematics. High power distance nations would be
associated with smaller gender gaps or a slight female
advantage in these domains. Boys may have increased
motivation to develop reading and writing proficiency in
high power distance cultures, resulting in smaller gender
gaps for reading literacy.
Gender, Culture and Sex-Typed Cognitive Abilities
PLoS ONE | www.plosone.org 4 July 2012 | Volume 7 | Issue 7 | e39904
Methods
ParticipantsPerformance data for students accessed under PISA is offered as
a publicly accessible archive for researchers. Additionally,
aggregate national performance profiles are published as separate
male and female subgroups [31], which were used for analysis.
PISA 2009 included 34 OECD countries, as well as 31 additional
partner nations. This amounts to a total participant size of 480,405
students (50.6% female) drawn from across 65 nations. This
represents the most recent round of testing, as well as providing
performance data for a broader range of nations than earlier PISA
assessments.
AnalysisNational performance profiles in reading, mathematics and
science literacy were obtained from OECD [31], which reports the
assessment of boys and girls separately. Because of the large
sample sizes involved in national testing, even slight or trivial
differences between boys and girls may be deemed statistically
significant, even though it may have no practical significance. For
this reason, an effect size is presented in the form of Cohen’s d, the
mean standardized difference. This allows the reader to draw his
or her own conclusions as to the practical significance of reported
gender differences.
The computation is calculated as the mean difference between
male and female scores, divided by the pooled within-gender
standard deviation. By convention, female scores are subtracted
from male scores, so that a positive d indicates higher scores for
males while a negative d reflects higher scores for females. This
convention is observed for readability reasons only, and the
interested reader may choose to rephrase the equations so that
male scores are subtracted from female scores simply by inverting
the sign of any effect size given.
Conventional criteria for labelling effect sizes as ‘‘small’’,
‘‘medium’’, or ‘‘large’’ have many limitations and should be used
with great caution [52–53]. Cohen [53] offered a rule of thumb
that an effect size of d #.20 could be considered a ‘‘small’’ effect
for the purpose of estimating statistical power, and that many
legitimate psychological phenomena studied are in fact small
effects. The label of small is perhaps an unfortunate one as some
researchers have mistakenly taken small to be of no practical
significance, a practice Rosenthal and Rubin [54] caution against.
However Hyde, et al. [20] have argued that effect sizes as small as
d = .04 should be regarded as trivial, a cut-off which seems sound
practice. Hyde [47] has also suggested that d #. 10 should be
actually be regarded ‘‘as close to zero’’ (p.581), a cut-off which is
overly conservative and dismisses what are legitimate, albeit very
small, between-group differences. Accordingly, Cohen’s conven-
tions for labelling are followed for reporting. Additionally, gender
differences are presented using Rosenthal and Rubin’s [54–55]
Binomial Effect Size Display (BESD) which presents results in a
metric that represents effect size in a format suitable for
interpretation by non-statisticians [56].
In order to test the gender similarities hypothesis, national
gender gaps in reading, mathematics, and science were combined
using meta-analysis. Comprehensive Meta Analysis (CMA) V2
software was used for the calculation of statistics [57]. A random-
effects model was chosen [58] due to the high degree of cross-
cultural variability, which would make a fixed-effects model
unsuitable [56,59]. Such a method is more conservative in
estimating error terms and produces wider confidence intervals,
giving us greater assurance that the true effect size falls within this
range.
Favreau [60] argues against the use of null hypothesis testing for
evaluating claims of gender difference because it may be overly
sensitive, and does not present a clear picture of how differences
are distributed across groups. Accordingly, data is presented
showing high and low-achievers, as well as effect sizes. Even when
a mean gender difference may be regarded as ‘small’ by Cohen’s
[53] conventions, or ‘trivial’ by Hyde [47], a more pronounced
difference may be found at the tails of a distribution in high and
low-achieving students, resulting in quite disparate educational
outcomes.
Moderation effects of sociocultural factors were examined to test
the gender stratification hypothesis for national gender gaps using
correlational analysis. Although past researchers [32,61] have
examined the gender stratification hypothesis for mathematics and
reading, exploration of the relationship with science has gone
largely untested. Multiple measures of gender equity were used, as
each instrument operationalises the construct of gender equity
differently, and prior research has shown that they vary in their
predictive validity for educational and social outcomes. Other
moderators tested include economic prosperity, as measured by
GDP, and Hofstede’s power distance dimension.
Gender gap index. For comparability with Guiso, et al.’s
findings, the Gender Gap Index (GGI) produced by the World
Economic Forum was selected as one measure of gender equity
[62]. Data for the calendar year of PISA testing was used. This
measure assesses four areas: economic participation, educational
attainment, political empowerment, and health and survival.
While the first three are theoretical relevant to the gender
stratification hypothesis, health and survival (which measures
differences in male and female life expectancy, as well as sex ratio)
may reflect other - largely biological – factors, thus lowering
predictive validity of this measure. An additional criticism of this
measure is that the economic participation component emphasises
male to female participation across various sectors, but gives less
emphasis to income disparities.
Relative status of women. As an alternative conceptualisa-
tion of gender equity, the Relative Status of Women (RSW)
measures gender differences across educational attainment, life
expectancy, and women’s share of income [63]. This reflects a
stronger economic and educational component in estimation of
gender stratification, with wage inequality playing a greater
weighting.
Women in research. Else-Quest, et al. [61] argued that
domain-specific indicators of gender equity may play an important
role in the development of gender differences, with those related to
gender stratification in educational outcomes showing strong
predictive validity. One such marker is the relative share of
research positions held by women. Data for this measure was
obtained from the UNESCO Institute for Statistics, and supple-
mented by data from the National Science Foundation and
Statistics Canada. Data was selected for the calendar year 2009
when possible, or earlier if not available. Women’s relative share of
research positions was available for forty one nations.
Gross domestic product (GDP). Economic data was
obtained from the World Economic Outlook database produces
by the International Monetary Fund. Archived information for the
calendar year 2009 was obtained for sixty-one nations.
Hofstede’s power distance index. National power distance
scores are published in Hofstede’s text ‘‘Culture’s consequences’’ [50],
which ranks nations across this dimension. Data was unavailable
however for many of the non-OECD partner nations, and several
European countries, and was supplemented by national profiles
published online (http://geert-hofstede.com). This provided
coverage of fifty two nations.
Gender, Culture and Sex-Typed Cognitive Abilities
PLoS ONE | www.plosone.org 5 July 2012 | Volume 7 | Issue 7 | e39904
Statistical PowerWhile the sample size represented by the PISA 2009 was
extremely large, when examining gender differences at the country
level (n = 65) for correlation analysis the sample size is relatively
small. Additionally, data for gender equity measures and for
Hofstede’s cultural dimension of power distance was unavailable
for many non-OECD nations reducing sample size even further.
With a reduced sample size, correlations may lack sufficient power
to detect relationships that are relatively weak in nature [53].
Given that hypotheses were directional (e.g. greater gender
equality would be associated with a reduced gender gap in
mathematics), a decision to make correlation tests one-tailed would
often have allowed such a correlation to be deemed statistically
significant (as probability values are halved). For this reason exact
probability values are given, along with the size of the correlation
coefficient, so that the reader can decide whether to make the
appropriate adjustment. All tests report two-tailed correlations
unless otherwise specified. Data for one nation, Colombia,
represented both a univariate and multivariate outlier, and was
excluded from all correlational analysis.
Results
Although assessing qualitatively different abilities, there was a
strong overlap between national gender differences in reading,
mathematics and science. The quantitative abilities of mathemat-
ics and science showed the greatest overlap. Table 1 presents
intercorrelations between national gender differences in these
domains, while Table 2 gives correlations between national
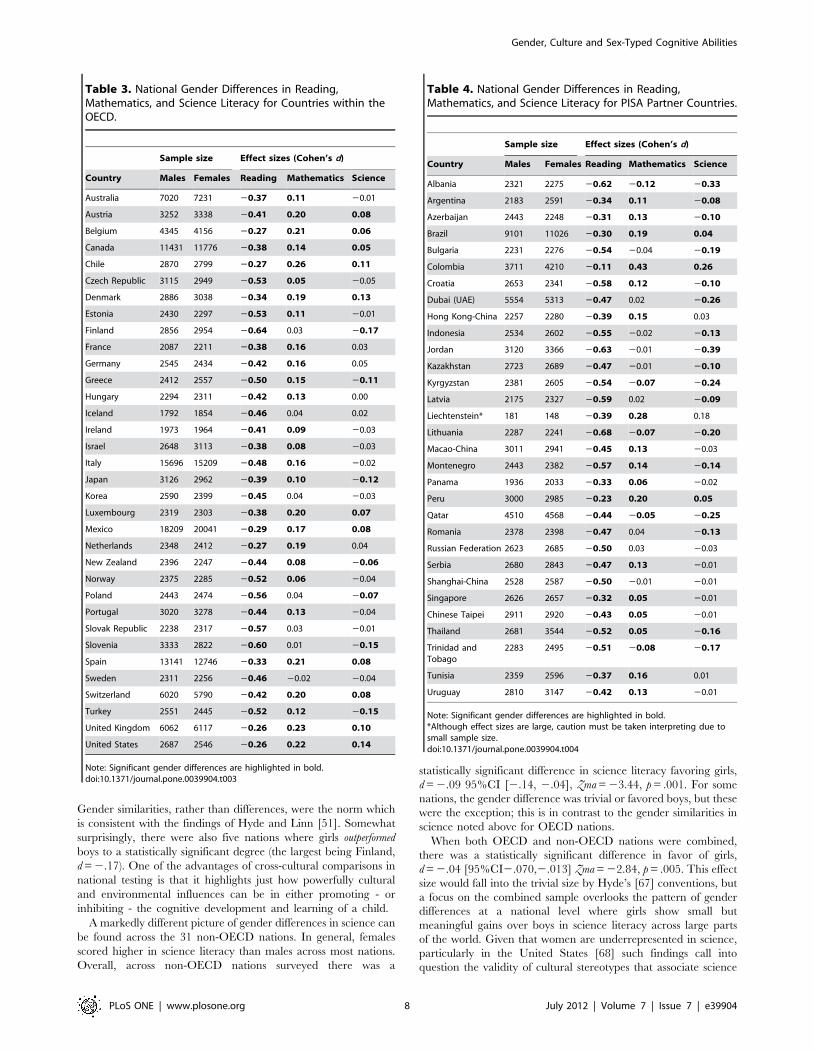
predictor variables. Tables 3 and 4 present national sample size
and calculated effect sizes across the three domains for OECD and
partner nations respectively.
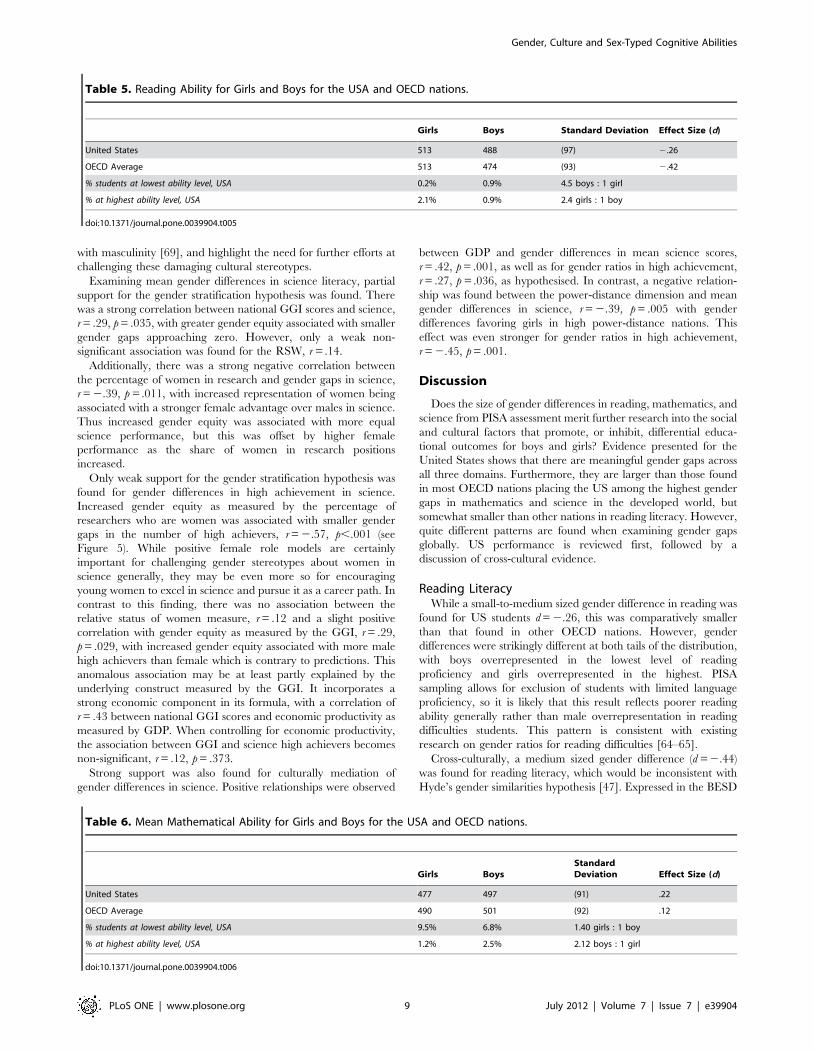
Reading LiteracyTable 5 presents summary statistics for reading achievement.
Within the United States, girls outperformed boys in overall
reading, Cohen’s d = 2.26 which is just over a quarter of a
standard deviation. By comparison, the OECD gender difference
in reading was larger, d = 2.42. Examining performance data for
the US sample further, boys were overrepresented at the lowest
level of reading proficiency, with approximately 4.5 boys to every
girl. When we consider the vocational and economic outcomes
associated with poor literacy, such a large disparity is alarming.
Such findings are consistent with previous findings on reading
literacy assessed by PISA [32] and gender differences in the
prevalence of reading difficulties [64–65]. When we look at
students attaining the highest level of reading proficiency (Level 6),
the trend is reversed with over twice the number of girls than boys
achieving the highest standard. Thus boys are overrepresented at
the lower end of the spectrum, while girls are overrepresented at
the highest end.
Overall, across all sixty-five nations the gender difference in
reading literacy favored girls, d = 2.44 [95%CI = 2.41, 2.46],
Zma = –31.04, p,.001, with a similar gender difference also being
found for OECD nations only as a group. Additionally, statistically
significant gender differences in reading favoring girls were found
in every nation surveyed, and have since the first assessment in 2000
[66]. These effect sizes ranged from 2.11 to 2.68, from a small- to
a medium- sized difference in reading literacy.
To investigate the gender stratification hypothesis, I examined
correlations between gender equity and the gender gap in reading.
Partial support was found for the gender stratification hypothesis.
National scores on the Relative Status of Women (RSW) measure
were negatively correlated with reading, r = 2.33, p = .018, such
that increased gender equality was associated with larger reading
gaps favoring females. Additionally, the educational measure of
women in research (WIR) was associated with larger reading gaps,
r = 2.38, p = .016. Surprisingly though, there was no association
between the gender gap index (GGI) and reading ability, r = 01.
Examination of the scatterplot showed no discernable pattern, and
the result was not driven by outliers.
Stronger support for the gender stratification hypothesis was
found when examining gender differences in the percentage of
students attaining the highest level of reading. Improvements in
national gender equity was associated with a wider gender gap in
high achieving girls, RSW, r = 2.32, p = .021; GGI, r = 2.41,
p = .002, which is consistent with the findings of Guiso, et al. [32].
Somewhat surprisingly, however, the educational measure of
gender equity showed a strong positive association, with increases
in the percentage of women in research associated with smaller
gender gaps, r = .57, p,.001. While the role of women in higher
education may make a contribution to the mean performance of
girls and boys in basic reading literacy, it may be the case that for
high-achieving reading comprehension skills, boys and girls benefit
equally from female role-models in higher learning.
No association between GDP and gender differences in reading
was found, r = .04, consistent with predictions. However, a strong
association with economic prosperity was found for reading high
achievers, r = 2.43, p,.001 with a greater ratio of female to male
high achievers as GDP increased. This suggests an interaction
between gender and GDP, with girls benefiting more from
economic prosperity than boys. Furthermore, while no association
was found between power distance and mean reading literacy
scores of boys and girls, a strong positive association with the
gender gap in high achievers was found as hypothesized, r = .40,
p = .003 with gender ratios approaching more equal representation
as power distance increased. Cultural mediation through econom-
ic prosperity and power distance was not found for mean male and
female performance, only for gender ratios in high achievement.
Mathematics LiteracyTable 6 presents summary statistics for mathematics literacy.
Within the United States, boys scored higher on mathematical
literacy than girls, d = .22 which is a small but non-trivial effect
size. Additionally, the size of the gender differences was almost
twice that of the OECD average. This is in contrast to previous
studies examining national mathematics performance by Hyde,
et al. [20] which had found a gender gap that approached zero. At
the lower end of ability level for the US sample, the difference in
prevalence between girls and boys was extremely slight; however
at the highest ability levels there were just over twice as many boys
than girls reaching this proficiency level.
Table 1. Correlations between National Gender Differencesfor PISA Reading, Mathematics, and Science Performance (AllNations).
Reading Mathematics Science
Reading 1.00 .75*** .78***
Mathematics 1.00 .81***
Science 1.00
*p,.05,**p,.01,***p,.001.doi:10.1371/journal.pone.0039904.t001
Gender, Culture and Sex-Typed Cognitive Abilities
PLoS ONE | www.plosone.org 6 July 2012 | Volume 7 | Issue 7 | e39904
As the distribution of gender differences differed somewhat
between OECD and partner nations, they are reported separately.
Overall, across all 34 OECD nations, there was a significant
gender difference favoring males on mathematical literacy,
Cohen’s d = .13 95%CI [.11,.15], Zma = 11.22, p,.001. While
this is a small effect size, it does exceed the criteria set forth by
Hyde and Linn [51] for trivial gender differences. Gender
differences across PISA partner nations also favored males,
Cohen’s d = .07 95%CI [.02,.11], Zma = 3.10, p = .001 although
this difference was somewhat smaller.
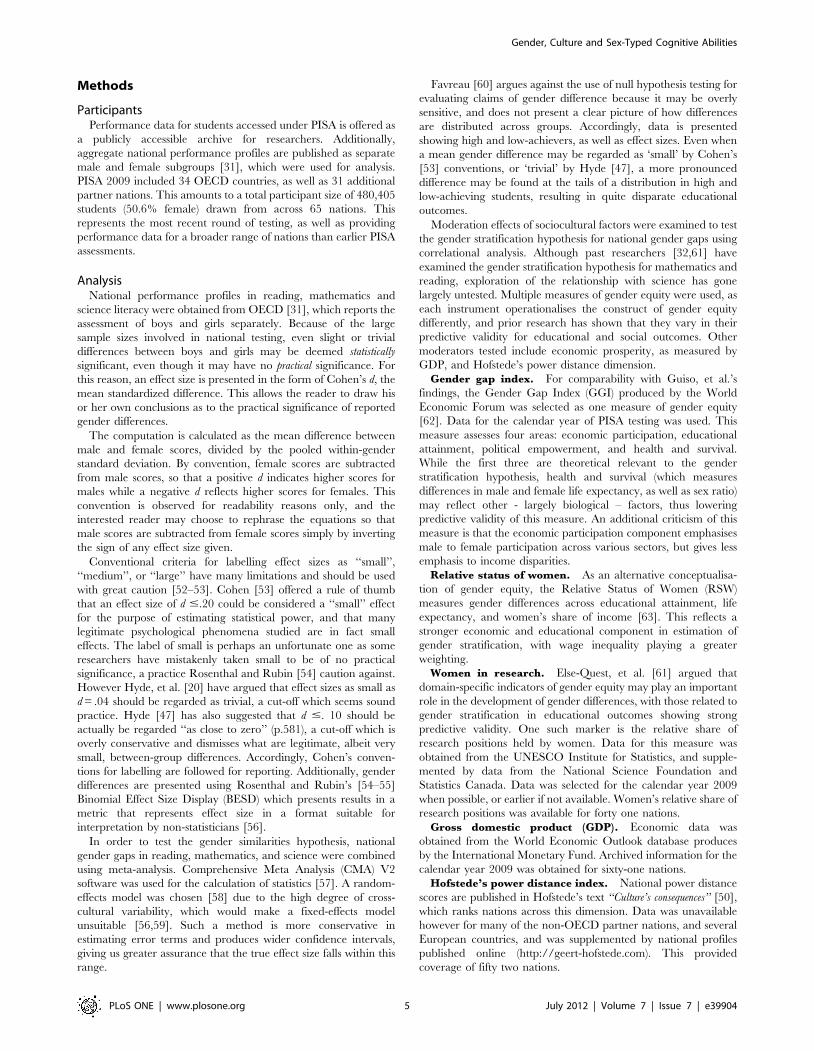
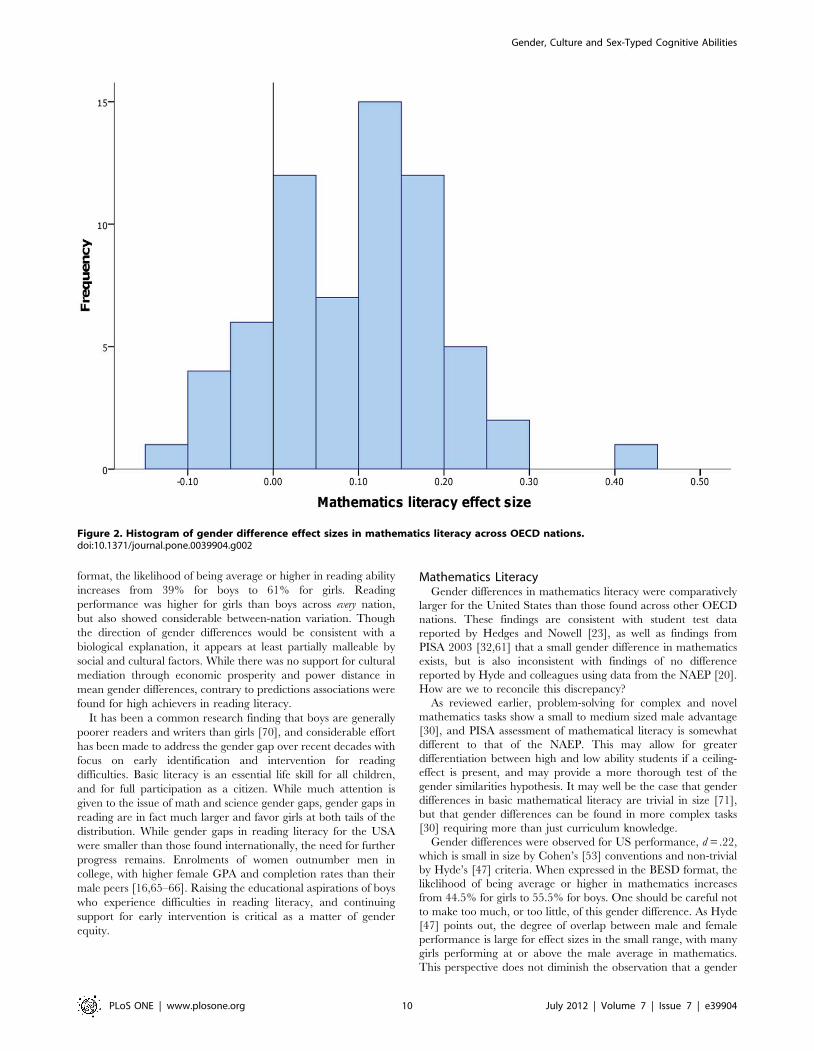
While statistically significant differences were found in most
countries, they showed considerable variability ranging from
d = 2.12 to d = .43 (see Figure 2). For many nations the gender gap
is negligible, while others show small to medium sized differences.
Additionally the direction of the gender gap was sometimes
reversed, with girls outperforming boys in many nations. Under
different social and educational environments, a gender advantage
supporting either males or females emerges. This would be
inconsistent with Hyde’s [47] gender similarities hypothesis; rather,
gender differences or similarities in mathematics are strongly
mediated by cultural factors.
To explore the gender stratification hypothesis, correlations
between gender equity measures and the gender gap in maths
were examined. As hypothesized there was a strong negative
relationship between the educational measure of women in
research and the gender gap in mathematics, r = 2.38, p = .014.
Greater representation of women in research was associated with
smaller gender gaps or a female advantage, consistent with the
findings of Else-Quest, et al. [61]. However, only a weak
association was found between gender equity measure of RSW,
r = 2.14, and no association was found between GGI and maths,
in contrast to the findings of Guiso, et al. [32].
Since the PISA 2009 dataset includes a much broader range of
partner nations than was examined by Guiso, et al. [32], the
strength of the gender equity association may have been obscured
by additional noise reflecting developed/developing nationhood.
When restricting analysis to OECD nations only, the hypothesized
gender equity association was found for the relative status of
women (RSW) measure, r = 2.42, p = .020, as well as a weak
association with GGI, r = 2.21 that fell short of statistical
significance. While gender equity plays an important role in the
development of gender differences in mathematical literacy for
developed nations, it may be the case that there are more
proximate needs for girls in developing nations (such as access to
schooling, parental support, freedom from work and home duties)
that these gender equity measures do not assess.
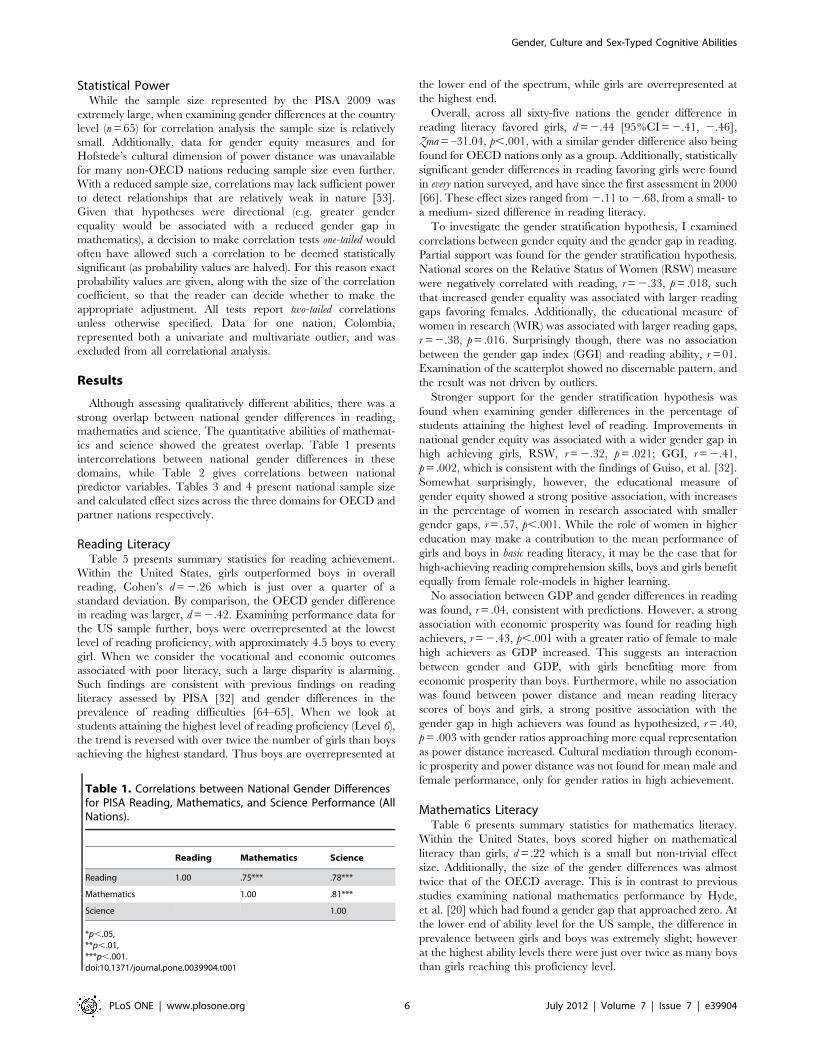
A similar pattern of associations was found for gender
differences in high achieving mathematics students across all
nations. There was a strong association between women in
research educational measure, r = 2.63, p,.001, with increased
representation of women in research positions associated with a
smaller gender difference in high achievers approaching zero (see
Figure 3). However no association was found between the gender
gap in high achievers and other gender equity measures, nor was
this found when restricting to OECD nations only.
Support was also found for the economic prosperity hypothesis.
Mean gender differences in mathematics literacy were larger in
more economically prosperous nations, r = .31, p = .015. This
relationship was stronger for high achievement, r = .53, p,.001
with a greater number of males attaining this level of proficiency.
Examining the relationship between Hofsetede’s power distance
cultural dimension and mathematics literacy, support was also
found for cultural mediation. There was a strong negative
relationship between power distance and mean gender differences
in mathematics, r = 2.28, p = .044, as well as for gender ratios in
high achievement, r = .233, p = .019. Gender differences were
smaller in nations with greater tolerance for inequality, suggesting
a compensatory strategy to acquire culturally and economically
valued skills in mathematics.
Science LiteracyTable 7 presents summary statistics for science literacy
achievement scores. For the United States, a gender difference
of d = .14 was found. Furthermore, the United States showed the
largest gender difference across all OECD countries. Although
statistically significant, the difference between the average boy and
girl is small, but neither is it of a trivial magnitude either. Boys in
the US scored higher than boys internationally, while girls scored
lower than their international peers. Additionally, at both ends of
the ability level spectrum, gender differences were more
pronounced – there are approximately 1.5 boys to every girl
achieving the highest level of science proficiency. Thus while the
mean difference between males and females may be ‘‘small’’ by
Cohen’s [53] effect size conventions, it may have more of an
impact than one might assume from that label.
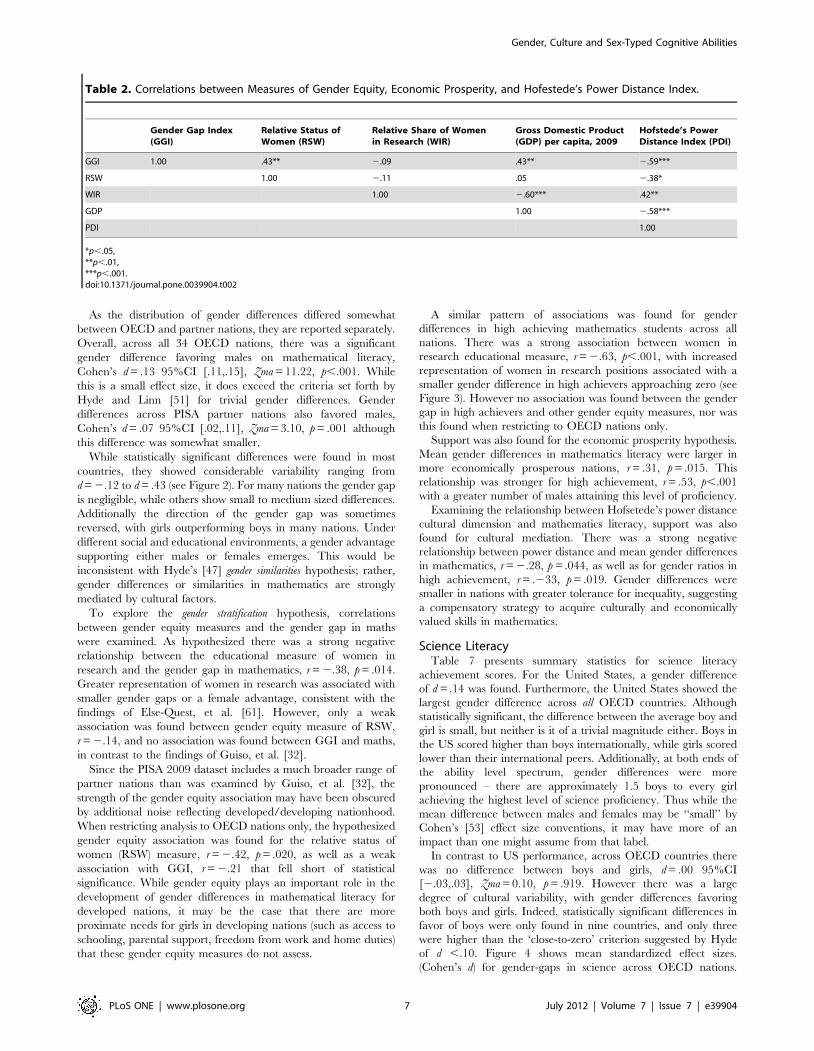
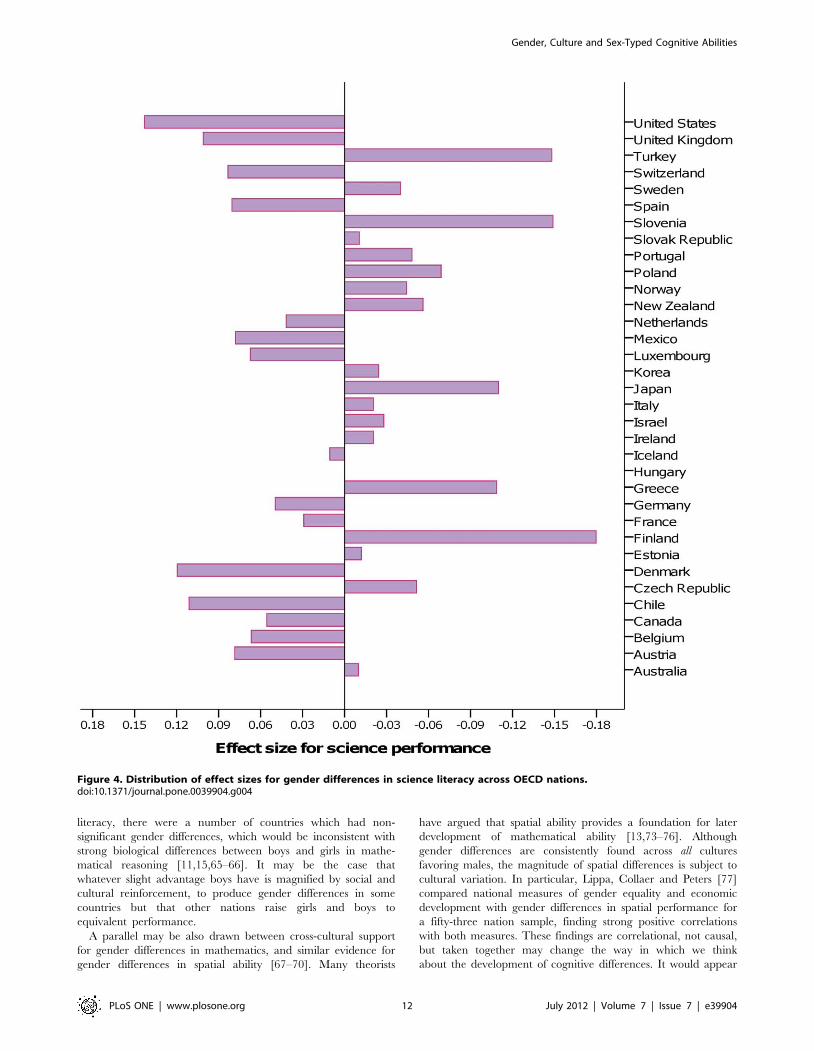
In contrast to US performance, across OECD countries there
was no difference between boys and girls, d = .00 95%CI
[2.03,.03], Zma = 0.10, p = .919. However there was a large
degree of cultural variability, with gender differences favoring
both boys and girls. Indeed, statistically significant differences in
favor of boys were only found in nine countries, and only three
were higher than the ‘close-to-zero’ criterion suggested by Hyde
of d ,.10. Figure 4 shows mean standardized effect sizes.
(Cohen’s d) for gender-gaps in science across OECD nations.
Table 2. Correlations between Measures of Gender Equity, Economic Prosperity, and Hofestede’s Power Distance Index.
Gender Gap Index(GGI)
Relative Status ofWomen (RSW)
Relative Share of Womenin Research (WIR)
Gross Domestic Product(GDP) per capita, 2009
Hofstede’s PowerDistance Index (PDI)
GGI 1.00 .43** 2.09 .43** 2.59***
RSW 1.00 2.11 .05 2.38*
WIR 1.00 2.60*** .42**
GDP 1.00 2.58***
PDI 1.00
*p,.05,**p,.01,***p,.001.doi:10.1371/journal.pone.0039904.t002
Gender, Culture and Sex-Typed Cognitive Abilities
PLoS ONE | www.plosone.org 7 July 2012 | Volume 7 | Issue 7 | e39904
Gender similarities, rather than differences, were the norm which
is consistent with the findings of Hyde and Linn [51]. Somewhat
surprisingly, there were also five nations where girls outperformed
boys to a statistically significant degree (the largest being Finland,
d = 2.17). One of the advantages of cross-cultural comparisons in
national testing is that it highlights just how powerfully cultural
and environmental influences can be in either promoting - or
inhibiting - the cognitive development and learning of a child.
A markedly different picture of gender differences in science can
be found across the 31 non-OECD nations. In general, females
scored higher in science literacy than males across most nations.
Overall, across non-OECD nations surveyed there was a
statistically significant difference in science literacy favoring girls,
d = 2.09 95%CI [2.14, 2.04], Zma = 23.44, p = .001. For some
nations, the gender difference was trivial or favored boys, but these
were the exception; this is in contrast to the gender similarities in
science noted above for OECD nations.
When both OECD and non-OECD nations were combined,
there was a statistically significant difference in favor of girls,
d = 2.04 [95%CI2.070,2.013] Zma = 22.84, p = .005. This effect
size would fall into the trivial size by Hyde’s [67] conventions, but
a focus on the combined sample overlooks the pattern of gender
differences at a national level where girls show small but
meaningful gains over boys in science literacy across large parts
of the world. Given that women are underrepresented in science,
particularly in the United States [68] such findings call into
question the validity of cultural stereotypes that associate science
Table 3. National Gender Differences in Reading,Mathematics, and Science Literacy for Countries within theOECD.
Sample size Effect sizes (Cohen’s d)
Country Males Females Reading Mathematics Science
Australia 7020 7231 20.37 0.11 20.01
Austria 3252 3338 20.41 0.20 0.08
Belgium 4345 4156 20.27 0.21 0.06
Canada 11431 11776 20.38 0.14 0.05
Chile 2870 2799 20.27 0.26 0.11
Czech Republic 3115 2949 20.53 0.05 20.05
Denmark 2886 3038 20.34 0.19 0.13
Estonia 2430 2297 20.53 0.11 20.01
Finland 2856 2954 20.64 0.03 20.17
France 2087 2211 20.38 0.16 0.03
Germany 2545 2434 20.42 0.16 0.05
Greece 2412 2557 20.50 0.15 20.11
Hungary 2294 2311 20.42 0.13 0.00
Iceland 1792 1854 20.46 0.04 0.02
Ireland 1973 1964 20.41 0.09 20.03
Israel 2648 3113 20.38 0.08 20.03
Italy 15696 15209 20.48 0.16 20.02
Japan 3126 2962 20.39 0.10 20.12
Korea 2590 2399 20.45 0.04 20.03
Luxembourg 2319 2303 20.38 0.20 0.07
Mexico 18209 20041 20.29 0.17 0.08
Netherlands 2348 2412 20.27 0.19 0.04
New Zealand 2396 2247 20.44 0.08 20.06
Norway 2375 2285 20.52 0.06 20.04
Poland 2443 2474 20.56 0.04 20.07
Portugal 3020 3278 20.44 0.13 20.04
Slovak Republic 2238 2317 20.57 0.03 20.01
Slovenia 3333 2822 20.60 0.01 20.15
Spain 13141 12746 20.33 0.21 0.08
Sweden 2311 2256 20.46 20.02 20.04
Switzerland 6020 5790 20.42 0.20 0.08
Turkey 2551 2445 20.52 0.12 20.15
United Kingdom 6062 6117 20.26 0.23 0.10
United States 2687 2546 20.26 0.22 0.14
Note: Significant gender differences are highlighted in bold.doi:10.1371/journal.pone.0039904.t003
Table 4. National Gender Differences in Reading,Mathematics, and Science Literacy for PISA Partner Countries.
Sample size Effect sizes (Cohen’s d)
Country Males Females Reading Mathematics Science
Albania 2321 2275 20.62 20.12 20.33
Argentina 2183 2591 20.34 0.11 20.08
Azerbaijan 2443 2248 20.31 0.13 20.10
Brazil 9101 11026 20.30 0.19 0.04
Bulgaria 2231 2276 20.54 20.04 20.19
Colombia 3711 4210 20.11 0.43 0.26
Croatia 2653 2341 20.58 0.12 20.10
Dubai (UAE) 5554 5313 20.47 0.02 20.26
Hong Kong-China 2257 2280 20.39 0.15 0.03
Indonesia 2534 2602 20.55 20.02 20.13
Jordan 3120 3366 20.63 20.01 20.39
Kazakhstan 2723 2689 20.47 20.01 20.10
Kyrgyzstan 2381 2605 20.54 20.07 20.24
Latvia 2175 2327 20.59 0.02 20.09
Liechtenstein* 181 148 20.39 0.28 0.18
Lithuania 2287 2241 20.68 20.07 20.20
Macao-China 3011 2941 20.45 0.13 20.03
Montenegro 2443 2382 20.57 0.14 20.14
Panama 1936 2033 20.33 0.06 20.02
Peru 3000 2985 20.23 0.20 0.05
Qatar 4510 4568 20.44 20.05 20.25
Romania 2378 2398 20.47 0.04 20.13
Russian Federation 2623 2685 20.50 0.03 20.03
Serbia 2680 2843 20.47 0.13 20.01
Shanghai-China 2528 2587 20.50 20.01 20.01
Singapore 2626 2657 20.32 0.05 20.01
Chinese Taipei 2911 2920 20.43 0.05 20.01
Thailand 2681 3544 20.52 0.05 20.16
Trinidad andTobago
2283 2495 20.51 20.08 20.17
Tunisia 2359 2596 20.37 0.16 0.01
Uruguay 2810 3147 20.42 0.13 20.01
Note: Significant gender differences are highlighted in bold.*Although effect sizes are large, caution must be taken interpreting due tosmall sample size.doi:10.1371/journal.pone.0039904.t004
Gender, Culture and Sex-Typed Cognitive Abilities
PLoS ONE | www.plosone.org 8 July 2012 | Volume 7 | Issue 7 | e39904
with masculinity [69], and highlight the need for further efforts at
challenging these damaging cultural stereotypes.
Examining mean gender differences in science literacy, partial
support for the gender stratification hypothesis was found. There
was a strong correlation between national GGI scores and science,
r = .29, p = .035, with greater gender equity associated with smaller
gender gaps approaching zero. However, only a weak non-
significant association was found for the RSW, r = .14.
Additionally, there was a strong negative correlation between
the percentage of women in research and gender gaps in science,
r = 2.39, p = .011, with increased representation of women being
associated with a stronger female advantage over males in science.
Thus increased gender equity was associated with more equal
science performance, but this was offset by higher female
performance as the share of women in research positions
increased.
Only weak support for the gender stratification hypothesis was
found for gender differences in high achievement in science.
Increased gender equity as measured by the percentage of
researchers who are women was associated with smaller gender
gaps in the number of high achievers, r = 2.57, p,.001 (see
Figure 5). While positive female role models are certainly
important for challenging gender stereotypes about women in
science generally, they may be even more so for encouraging
young women to excel in science and pursue it as a career path. In
contrast to this finding, there was no association between the
relative status of women measure, r = .12 and a slight positive
correlation with gender equity as measured by the GGI, r = .29,
p = .029, with increased gender equity associated with more male
high achievers than female which is contrary to predictions. This
anomalous association may be at least partly explained by the
underlying construct measured by the GGI. It incorporates a
strong economic component in its formula, with a correlation of
r = .43 between national GGI scores and economic productivity as
measured by GDP. When controlling for economic productivity,
the association between GGI and science high achievers becomes
non-significant, r = .12, p = .373.
Strong support was also found for culturally mediation of
gender differences in science. Positive relationships were observed
between GDP and gender differences in mean science scores,
r = .42, p = .001, as well as for gender ratios in high achievement,
r = .27, p = .036, as hypothesised. In contrast, a negative relation-
ship was found between the power-distance dimension and mean
gender differences in science, r = 2.39, p = .005 with gender
differences favoring girls in high power-distance nations. This
effect was even stronger for gender ratios in high achievement,
r = 2.45, p = .001.
Discussion
Does the size of gender differences in reading, mathematics, and
science from PISA assessment merit further research into the social
and cultural factors that promote, or inhibit, differential educa-
tional outcomes for boys and girls? Evidence presented for the
United States shows that there are meaningful gender gaps across
all three domains. Furthermore, they are larger than those found
in most OECD nations placing the US among the highest gender
gaps in mathematics and science in the developed world, but
somewhat smaller than other nations in reading literacy. However,
quite different patterns are found when examining gender gaps
globally. US performance is reviewed first, followed by a
discussion of cross-cultural evidence.
Reading LiteracyWhile a small-to-medium sized gender difference in reading was
found for US students d = 2.26, this was comparatively smaller
than that found in other OECD nations. However, gender
differences were strikingly different at both tails of the distribution,
with boys overrepresented in the lowest level of reading
proficiency and girls overrepresented in the highest. PISA
sampling allows for exclusion of students with limited language
proficiency, so it is likely that this result reflects poorer reading
ability generally rather than male overrepresentation in reading
difficulties students. This pattern is consistent with existing
research on gender ratios for reading difficulties [64–65].
Cross-culturally, a medium sized gender difference (d = 2.44)
was found for reading literacy, which would be inconsistent with
Hyde’s gender similarities hypothesis [47]. Expressed in the BESD
Table 5. Reading Ability for Girls and Boys for the USA and OECD nations.
Girls Boys Standard Deviation Effect Size (d)
United States 513 488 (97) 2.26
OECD Average 513 474 (93) 2.42
% students at lowest ability level, USA 0.2% 0.9% 4.5 boys : 1 girl
% at highest ability level, USA 2.1% 0.9% 2.4 girls : 1 boy
doi:10.1371/journal.pone.0039904.t005
Table 6. Mean Mathematical Ability for Girls and Boys for the USA and OECD nations.
Girls BoysStandardDeviation Effect Size (d)
United States 477 497 (91) .22
OECD Average 490 501 (92) .12
% students at lowest ability level, USA 9.5% 6.8% 1.40 girls : 1 boy
% at highest ability level, USA 1.2% 2.5% 2.12 boys : 1 girl
doi:10.1371/journal.pone.0039904.t006
Gender, Culture and Sex-Typed Cognitive Abilities
PLoS ONE | www.plosone.org 9 July 2012 | Volume 7 | Issue 7 | e39904
format, the likelihood of being average or higher in reading ability
increases from 39% for boys to 61% for girls. Reading
performance was higher for girls than boys across every nation,
but also showed considerable between-nation variation. Though
the direction of gender differences would be consistent with a
biological explanation, it appears at least partially malleable by
social and cultural factors. While there was no support for cultural
mediation through economic prosperity and power distance in
mean gender differences, contrary to predictions associations were
found for high achievers in reading literacy.
It has been a common research finding that boys are generally
poorer readers and writers than girls [70], and considerable effort
has been made to address the gender gap over recent decades with
focus on early identification and intervention for reading
difficulties. Basic literacy is an essential life skill for all children,
and for full participation as a citizen. While much attention is
given to the issue of math and science gender gaps, gender gaps in
reading are in fact much larger and favor girls at both tails of the
distribution. While gender gaps in reading literacy for the USA
were smaller than those found internationally, the need for further
progress remains. Enrolments of women outnumber men in
college, with higher female GPA and completion rates than their
male peers [16,65–66]. Raising the educational aspirations of boys
who experience difficulties in reading literacy, and continuing
support for early intervention is critical as a matter of gender
equity.
Mathematics LiteracyGender differences in mathematics literacy were comparatively
larger for the United States than those found across other OECD
nations. These findings are consistent with student test data
reported by Hedges and Nowell [23], as well as findings from
PISA 2003 [32,61] that a small gender difference in mathematics
exists, but is also inconsistent with findings of no difference
reported by Hyde and colleagues using data from the NAEP [20].
How are we to reconcile this discrepancy?
As reviewed earlier, problem-solving for complex and novel
mathematics tasks show a small to medium sized male advantage
[30], and PISA assessment of mathematical literacy is somewhat
different to that of the NAEP. This may allow for greater
differentiation between high and low ability students if a ceiling-
effect is present, and may provide a more thorough test of the
gender similarities hypothesis. It may well be the case that gender
differences in basic mathematical literacy are trivial in size [71],
but that gender differences can be found in more complex tasks
[30] requiring more than just curriculum knowledge.
Gender differences were observed for US performance, d = .22,
which is small in size by Cohen’s [53] conventions and non-trivial
by Hyde’s [47] criteria. When expressed in the BESD format, the
likelihood of being average or higher in mathematics increases
from 44.5% for girls to 55.5% for boys. One should be careful not
to make too much, or too little, of this gender difference. As Hyde
[47] points out, the degree of overlap between male and female
performance is large for effect sizes in the small range, with many
girls performing at or above the male average in mathematics.
This perspective does not diminish the observation that a gender
Figure 2. Histogram of gender difference effect sizes in mathematics literacy across OECD nations.doi:10.1371/journal.pone.0039904.g002
Gender, Culture and Sex-Typed Cognitive Abilities
PLoS ONE | www.plosone.org 10 July 2012 | Volume 7 | Issue 7 | e39904

gap exists. As can be seen from the cross-cultural evaluation of
mathematics, gender gaps in mathematics are not an inevitability,
with many countries in fact showing higher female performance.
This difference is most apparent when examining student
attainment of the highest proficiency level in mathematics, with
double the amount of boys than girls reaching this stage. Benbow
[22] argued that gender differences in high-achievement for
mathematics could be at least partially explained by greater male
variability and a combination of biological and environmental
factors. It is likely that greater male variability explains at least part
of the gender difference in high achievement, but that sociocul-
tural factors also play a role in the development of mathematics at
the extreme tails of the distribution. While general proficiency in
mathematics is an important life goal for all students, attainment of
an advanced level of mathematics is an important prerequisite for
pursuing more technical degrees in STEM-related fields [72]. A
growing body of research suggests that self-efficacy and confidence
in mathematics play an important part in the decision making
process of women to pursue STEM-related careers or direct their
talents elsewhere [23,62–64]. Increasing self-confidence in math-
ematics and instilling a sense of mastery may be a crucial
component any educational intervention, as well as challenging
negative cultural stereotypes about women’s ability in mathematics
[41,69]. At least for students within the USA, gender differences in
mean and high achievement for mathematics have not been
eliminated, and highlight the need for further progress.
While cross-culturally, gender differences favored males across
OECD and partner nations, the magnitude of this difference
(d = .13) was also small in size and subject to wide cultural
variation. The likelihood of being average or higher in
mathematical ability increases from 46.7% for girls to 53.2%
for boys, a small but non-trivial difference. Unlike reading
Figure 3. Relationship between women in research and gender ratios of high-achievers in mathematics literacy.doi:10.1371/journal.pone.0039904.g003
Table 7. US National Science performance for girls and boys, including high and low achievers.
Girls BoysStandardDeviation Effect Size (d)
United States 495 509 (98) .14
OECD Average 501 501 (94) .00
% students at lowest ability level, USA 4.6% 3.8% 1.20 girls : 1 boy
% at highest ability level, USA 1.0% 1.5% 1.52 boys : 1 girl
doi:10.1371/journal.pone.0039904.t007
Gender, Culture and Sex-Typed Cognitive Abilities
PLoS ONE | www.plosone.org 11 July 2012 | Volume 7 | Issue 7 | e39904
literacy, there were a number of countries which had non-
significant gender differences, which would be inconsistent with
strong biological differences between boys and girls in mathe-
matical reasoning [11,15,65–66]. It may be the case that
whatever slight advantage boys have is magnified by social and
cultural reinforcement, to produce gender differences in some
countries but that other nations raise girls and boys to
equivalent performance.
A parallel may be also drawn between cross-cultural support
for gender differences in mathematics, and similar evidence for
gender differences in spatial ability [67–70]. Many theorists
have argued that spatial ability provides a foundation for later
development of mathematical ability [13,73–76]. Although
gender differences are consistently found across all cultures
favoring males, the magnitude of spatial differences is subject to
cultural variation. In particular, Lippa, Collaer and Peters [77]
compared national measures of gender equality and economic
development with gender differences in spatial performance for
a fifty-three nation sample, finding strong positive correlations
with both measures. These findings are correlational, not causal,
but taken together may change the way in which we think
about the development of cognitive differences. It would appear
Figure 4. Distribution of effect sizes for gender differences in science literacy across OECD nations.doi:10.1371/journal.pone.0039904.g004
Gender, Culture and Sex-Typed Cognitive Abilities
PLoS ONE | www.plosone.org 12 July 2012 | Volume 7 | Issue 7 | e39904

that gender differences in number of cognitive abilities are at
least partially influenced by social and cultural influences such
as gender equality and the status of women [32,61]. While
parental, teacher and peer influences also play a part [78–83],
the influence of wider cultural influences at the macro-level may
be important considerations for any biopsychosocial models of
gender difference.
Science LiteracyWhile the effect size for gender differences in science literacy for
the USA was relatively small compared to that of reading and
mathematics, it stands out as the largest effect size across all
OECD nations, d = .14. This is a small effect size, but also not a
trivial one by Hyde’s [47] conventions. Represented in the BESD
format, the likelihood of being average or higher in science literacy
increases from 46.5% for girls to 53.5% for boys. Additionally,
boys were slightly overrepresented in attaining the highest level of
science proficiency, but not to the same degree as for mathematics.
Of all the domains assessed, science literacy appears to be the most
variable cross-culturally, with many countries showing no differ-
ence whatsoever, and many showing a female advantage. This is a
promising sign, and a benchmark to which the USA can aspire.
This pattern of results was consistent with the gender similarities
hypothesis.
Gender Stratification HypothesisIn order to test the gender stratification hypothesis, this study
examined the relationship between national measures of gender
equity and gender gaps in reading, mathematics and science
literacy. While some support for the gender stratification
hypothesis was found, the predictive validity of gender equity
measures varied across instruments and domains. In particular,
relationships between the Gender Gap Index instrument were
often weak, and in the case of science literacy high achievers in a
direction contrary to hypotheses. This failure to support the
gender stratification hypothesis using all gender equity measures
should not be interpreted as a refutation of the hypothesis, but
means that one should evaluate the hypothesis carefully. Each
instrument taps different aspects of the underlying gender equity
construct, and it is likely that some elements of equity have greater
bearing on educational outcomes than others. A consistent finding
across all three domains, and across both mean performance and
high achievers, was that the relative share of women in research
accurately predicted the presence or absence of gender differences.
Figure 5. Relationship between women in research and gender ratios of high-achievers in science literacy.doi:10.1371/journal.pone.0039904.g005
Gender, Culture and Sex-Typed Cognitive Abilities
PLoS ONE | www.plosone.org 13 July 2012 | Volume 7 | Issue 7 | e39904
However, composite measures of gender equity showed weaker or
inconsistent associations.
It may be the case that measures more closely related to
education, such as gender differences in relative share of research
and science positions, may more accurately measure the under-
lying social and cultural conditions that foster or inhibit the
development of gender differences in reading, mathematics and
science literacy. None of the instruments directly measure attitudes
towards women in STEM-related fields, or gender stereotypes
about the relative abilities of males and females [69,84]. Instead,
the composite measures relate to the role of women in society in
general, which may lack the specificity required to consistently
predict gender differences in learning outcomes. Although
increased gender equity generally may be associated with the
presence or absence of gender gaps in reading, mathematics and
science, it may not be the direct cause.
The relative share of women employed in scientific research
may be more directly related to societal attitudes about the role of
women in technical fields, and to gender stereotypes about the
capabilities of males and females in sex-typed achievement
domains. Girls growing up in a society that praises the scientific
and technical achievements of men but lacks equivalent female
role models may perceive that women are less capable in this area,
or that their skills are not culturally valued. They may instead be
motivated to develop other talents, such as high proficiency in
language, and to pursue careers in less-segregated professions.
Conversely, if girls grow up in a social environment where they see
progression into further education and specialisation in STEM-
related fields is not only possible but also commonplace, they may
be more motivated to acquire and master mathematics and science
skills. In such a culture, encouragement from parents and teachers
may be higher, and they may show greater confidence and
improved self-efficacy in these domains than children from other
cultures. While mean gender differences are smaller (or favor
females) in such nations, this also translates to increased female
representation in high achievers as well. This provides for stronger
support of the gender stratification hypothesis.
Economic ProsperityMean gender differences were larger for mathematics and
science in economically prosperous nations as hypothesised but
were largely unrelated to reading literacy. This likely reflects both
increased educational spending for economically prosperous
nations, as well as increased emphasis being placed on mathe-
matics and science skills. Student achievement in less prosperous
nations may be more homogenous with smaller gender differences,
and there may be a reduced focus on teaching of these skills. It
may also be the case that there is greater competition by males to
achieve in these masculine sex-typed domains. These associations
were also found for gender ratios in high achievement. Addition-
ally, gender ratios for high achievers in reading literacy were also
related to economic prosperity, which was unexpected.
Power DistanceHofstede [50] argued that cultures differed in their tolerance for
inequality, with some cultures observing social class distinctions
more strongly than others. Such cultures may place greater
emphasis on social roles and stratification, but one way of
overcoming inequity is the pursuit of culturally valued skills and
traits. As a compensatory strategy, girls may seek out higher social
status positions by obtaining education in mathematics and
science, and this may help to explain the female advantage for
science observed for non-OECD nations. As hypothesised, these
associations were found for mean gender differences in mathe-
matics and science as well as for gender ratios of high achievers.
Lesser support was found for cultural mediation in reading
literacy, with no association for mean gender differences but a
positive association for gender ratios in high achievement.
Social ImplicationsThe question of whether gender differences exist in cognitive
abilities has important implications for parents, educators, and
policy-makers [20,47,72,82–83]. Yet great caution must be taken
when interpreting empirical evidence - Hyde [47] raises a
legitimate concern that inflated claims of wide gender difference
might contribute to increased gender segregation in education and
the workforce, and that the potential of girls may be overlooked by
parents and teachers [78–82]. This study finds evidence of gender
similarities rather than differences cross-culturally but also that
meaningful gender gaps in maths and science remain and are
related to cultural factors.
Society as a whole also has a vested interest in this question,
both directly and indirectly. We as citizens rely on the services and
advancements that a highly skilled science and technology
workforce provide, with direct benefits for our health and lifestyle,
and for an economy that depends on the brightest and most
innovative of minds entering these fields to sustain an interna-
tionally competitive advantage. There are also indirect benefits
from having a society that is at least partially scientifically literate –
making decisions through the political process and personal
choices about issues such as the use of stem-cell technologies,
vaccination of children against disease, or evidence of climate
change. When students, particularly girls, disengage with science
learning there are costs to the individual, in the form of reduced
security and income, but also to the wider society. While not every
child may have the ability or interest to pursue a scientific career, a
basic scientific literacy is required for full participation in society.
The underrepresentation of women in science is a serious social
issue, and considerable resources are being expended to address
this problem [72,83–84]. Recognising that a gender gap exists is
the first step towards changing it, while cross-cultural evidence of
gender similarities provides strong evidence that the gender gaps
in maths and science are not inevitable. STEM-related careers can
be a pathway to a higher standard of living and job security, and
girls deserve the same encouragement as boys to pursue these
professions as a matter of social justice. Newcombe et al. [85]
argues that psychology can make a positive contribution to
changing the social and educational environments that curtail the
potential of all students in mathematics and science.
Strengths and LimitationsThe broader coverage of nations included in the PISA 2009
round of assessment makes for a stronger test of research
hypotheses than was previously possible. Additionally, many of
the partner nations would be categorised as lower in human
development, with reduced access to the educational advantages
found in other nations. While researching educational outcomes
for large and economically prosperous nations like the United
States is important, debate about gender differences is often
shaped by evidence from relatively affluent samples. In less
advantaged nations, provided girls and boys are still afforded the
same access to education, performance in maths and science
literacy is more homogenous giving greater support to the gender
similarities hypothesis. However, there is still substantial cultural
variability in gender differences, and much of this is driven by
cultural variation in gender equality. For a large portion of the
world, the strongest predictor of gender differences in educational
outcomes is equivalent access to education, occupational segrega-
Gender, Culture and Sex-Typed Cognitive Abilities
PLoS ONE | www.plosone.org 14 July 2012 | Volume 7 | Issue 7 | e39904
tion, and representation of women in technical and research
professions. If priority were to be given to improving these
globally, substantial improvements in female literacy in maths and
science could be realised.
While support for research hypotheses were generally observed,
availability of data for cross-cultural correlations meant reduced
statistical power to detect relatively weak correlations. It may well
be the case that the hypothesised associations with mean gender
differences across reading, maths, and science could have been
detected with expanded coverage of Hofstede’s cultural dimen-
sions [50]. There are likely many other cross-cultural correlates of
gender differences that remain unexplored, such as gender
stereotypes about cognitive abilities, and cultural variations in
attitudes towards women in society. Such research is limited by the
need to obtain wide coverage of these constructs across nations.
SummaryEvidence from national testing for the United States shows that
there are meaningful gender gaps to be addressed in academic
achievement across reading, mathematical and science literacy.
Furthermore, these are larger than that found cross-culturally,
where evidence for the gender similarities hypothesis is stronger.
Globally, there is a small gender difference in mathematics literacy
favoring males, and a small difference in science literacy favoring
girls in non-OECD nations. However, a consistent finding for
reading literacy is that girls outperform boys both in mean
differences overall and gender ratios in attaining high reading
achievement. Correlational analyses show that economic prosper-
ity, gender equity, and the dimension of power distance are good
predictors of global gender differences in cognitive abilities.
Author Contributions
Analyzed the data: DR. Wrote the paper: DR.
References
1. Eagly AH (1995) The science and politics of comparing women and men.
American Psychologist 50: 145–158.
2. Halpern DF, Lamay M (2000) The smarter sex: A critical review of sex
differences in intelligence. Educational Psychology Review 12: 229–246.
3. Caplan PJ, Caplan JB (1997) Do sex-related cognitive differences exist, and why
do people seek them out? In: Caplan PJ, Crawford M, Hyde JS, Richardson
JTE, editors. Gender differences in human cognition. New York: Oxford
University Press. 52–80.
4. Reilly D (2012) Exploring the science behind sex and gender differences in
cognitive abilities. Sex Roles. doi: 10.1007/s11199-012-0134-6.
5. Gardner H (1985) Frames of mind: The theory of multiple intelligences: Basic
books.
6. Horn J (1994) Theory of fluid and crystallized intelligence. In: Sternberg RJ,
editor. Encyclopedia of human intelligence. New York: Macmillan. 443–451.
7. Gardner H (1999) Intelligence reframed: Multiple intelligences for the 21st
century: Basic Books (AZ).
8. Neisser U (1967) Cognitive psychology. New York: Appleton-Century-Crofts.
9. Carroll JB (1997) The three-stratum theory of cognitive abilities. In: Flanagan
DP, Harrison PL, editors. Contemporary intellectual assessment: Theories, tests
and issues. New York: Guilford. 69–76.
10. Sternberg RJ (1994) Encyclopedia of human intelligence. New York:
MacMillan.
11. Neisser UC, Boodoo G, Bouchard TJ Jr, Boykin AW, Brody N, et al. (1996)
Intelligence: Knowns and unknowns. American Psychologist 51: 77–101.
12. Hyde JS, Lindberg SM (2007) Facts and assumptions about the nature of gender
differences and the implications for gender equity. In: Klein SS, editor.
Handbook for achieving gender equity through education. 2nd ed. Mahwah, NJ:
Lawrence Erlbaum Associates. 19–32.
13. Halpern DF (2007) Science, sex, and good sense: why women are
underrepresented in some areas of science and math. In: Ceci SJ, editor. Why
aren’t more women in science?: Top researchers debate the evidence.
Washington, D.C.: American Psychological Association. 121–130.
14. Jensen AR (1998) The g factor: the science of mental ability. London: Praeger.
15. Voyer D, Voyer S, Bryden MP (1995) Magnitude of sex differences in spatial
abilities: A meta-analysis and consideration of critical variables. Psychological
Bulletin 117: 250–270.
16. Linn MC, Petersen AC (1985) Emergence and characterization of sex differences
in spatial ability: A meta-analysis. Child Development 56: 1479–1498.
17. Hyde JS, Linn MC (1988) Gender differences in verbal ability: A meta-analysis.
Psychological Bulletin 104: 53–69.
18. Halpern DF (2000) Sex differences in cognitive abilities. Mahwah, NJ: Erlbaum.
19. Maccoby EE, Jacklin CN (1974) The psychology of sex differences. Stanford:
Stanford University Press.
20. Hyde JS, Lindberg SM, Linn MC, Ellis AB, Williams CC (2008) Gender
similarities characterize math performance. Science 321: 494–495.
21. Sears DO (1986) College sophomores in the laboratory: Influences of a narrow
data base on social psychology’s view of human nature. Journal of Personality
and Social Psychology 51: 515–530.
22. Benbow CP (1988) Sex differences in mathematical reasoning ability in
intellectually talented preadolescents: Their nature, effects, and possible causes.
Behavioral and Brain Sciences 11: 169–232.
23. Hedges LV, Nowell A (1995) Sex differences in mental test scores, variability,
and numbers of high-scoring individuals. Science 269: 41–45.
24. Halpern DF (2011) Sex differences in cognitive abilities. Mahwah, NJ: Erlbaum.
25. Gallagher AM, Kaufman JC, editors (2005) Gender differences in mathematics.
New York: Cambridge University Press.
26. Spelke ES (2005) Sex differences in intrinsic aptitude for mathematics andscience?: a critical review. American Psychologist 60: 950–958.
27. Alon S, Gelbgiser D (2011) The female advantage in college academic
achievements and horizontal sex segregation. Social Science Research 40:
107–119.
28. Henry PJ (2008) College sophomores in the laboratory redux: Influences of a
narrow data base on social psychology’s view of the nature of prejudice.
Psychological Inquiry 19: 49–71.
29. Hyde JS, Mertz JE (2009) Gender, culture, and mathematics performance.Proceedings of the National Academy of Sciences 106: 8801–8807.
30. Hyde JS, Fennema E, Lamon SJ (1990) Gender differences in mathematics
performance: A meta-analysis. Psychological Bulletin 107: 139–155.
31. OECD (2010) PISA 2009 Results: What students know and can do - Studentperformance in reading, mathematics and science (Volume I).
32. Guiso L, Monte F, Sapienza P, Zingales L (2008) Culture, gender, and math.
Science 320: 1164–1165.
33. Riegle-Crumb C (2005) The cross-national context of the gender gap in mathand science. In: Hedges LV, Schneider B, editors. The scoial organization of
schooling. New York, NY: Russell Sage Foundation. 227–243.
34. Eccles JS (1987) Gender roles and women’s achievement-related decisions.Psychology of Women Quarterly 11: 135–172.
35. Eagly AH (1987) Sex differences in social behavior: A social-role interpretation.
Hillsdale: Erlbaum.
36. Eagly AH (1987) The interpretation of sex differences in social behavior. In:Eagly AH, editor. Sex differences in social behavior: A social-role interpretation.
London: Lawrence Erlbaum Associates.
37. Eagly AH, Mitchell AA (2004) Social role theory of sex differences andsimilarities: Implications for the sociopolitical attitudes of men and women. In:
Paludi MA, editor. Praeger guide to the psychology of gender. Westport, Conn.:Praeger Publishers. 183–206.
38. Best DL, Williams JE (1997) Sex, gender, and culture. In: Berry JW, Segall MH,
Kagitcibasi C, editors. Handbook of cross-cultural psychology Volume 3: Social
behavior and applications. 2nd ed. Needleham Heights, MA: Allyn and Bacon.163–212.
39. Halpern DF, Straight CA, Stephenson CL (2011) Beliefs about cognitive gender
differences: Accurate for direction, underestimated for size. Sex Roles 64: 336–347.
40. Eccles JS, Jacobs JE, Harold RD (1990) Gender role stereotypes, expectancy
effects, and parents’ socialization of gender differences. Journal of Social Issues46: 183–201.
41. Steele CM (1997) A threat in the air: How stereotypes shape intellectual identity
and performance. American Psychologist 52: 613–629.
42. Halpern DF, Eliot L, Bigler RS, Fabes RA, Hanish LD, et al. (2011) Thepseudoscience of single-sex schooling. Science 333: 1706–1707.
43. Baker DP, Jones DP (1993) Creating gender equality: Cross-national gender
stratification and mathematical performance. Sociology of Education 66: 91–103.
44. Eagly AH, Wood W (1999) The origins of sex differences in human behavior:
Evolved dispositions versus social roles. American Psychologist 54: 408–423.
45. Eagly AH, Wood W, Diekman AB (2000) Social role theory of sex differencesand similarities: A current appraisal. The developmental social psychology of
gender: 123–174.
46. Nash SC (1979) Sex role as mediator of intellectual functioning. In: Wittig MA,Petersen AC, editors. Sex-related differences in cognitive functioning: Develop-
mental issues. New York: Academic Press. 263–302.
47. Hyde JS (2005) The gender similarities hypothesis. American Psychologist 60:
581–592.
Gender, Culture and Sex-Typed Cognitive Abilities
PLoS ONE | www.plosone.org 15 July 2012 | Volume 7 | Issue 7 | e39904
48. Williams JE, Best DL (1990) Measuring sex stereotypes : a multination study.
Newbury Park: Sage Publications.49. Triandis HC (2004) The many dimensions of culture. The Academy of
Management Executive (1993–2005) 18: 88–93.
50. Hofstede GH (2001) Culture’s consequences : Comparing values, behaviors,institutions, and organizations across nations. Thousand Oaks, Calif.: Sage
Publications.51. Hyde JS, Linn MC (2006) Gender similarities in mathematics and science.
Science 314: 599–600.
52. Hedges LV (2008) What are effect sizes and why do we need them? ChildDevelopment Perspectives 2: 167–171.
53. Cohen J (1988) Statistical power analysis for the behavioral sciences. Hillsdale,NJ: Lawrence Earlbaum Associates.
54. Rosenthal R, Rubin DB (1982) A simple, general purpose display of magnitudeof experimental effect. Journal of Educational Psychology 74: 166–169.
55. Rosenthal R, Rubin DB (1982) Further meta-analytic procedures for assessing
cognitive gender differences. Journal of Educational Psychology 74: 708–712.56. Rosenthal R, DiMatteo MR (2001) Meta-analysis: Recent developments in
quantitative methods for literature reviews. Annual Review of Psychology 52:59–82.
57. Borenstein M, Rothstein HR (1999) Comprehensive meta-analysis: A computer
program for research synthesis. Englewood, NJ: BioStat.58. Borenstein M, Hedges LV, Higgins JPT, Rothstein HR (2009) Introduction to
Meta-Analysis. West Sussex. UK: John Wiley & Sons, Ltd.59. Field AP (2001) Meta-analysis of correlation coefficients: A Monte Carlo
comparison of fixed-and random-effects methods. Psychological methods 6:161–180.
60. Favreau OE (1997) Sex and gender comparisons: Does null hypothesis testing
create a false dichotomy? Feminism & Psychology 7: 63–81.61. Else-Quest NM, Hyde JS, Linn MC (2010) Cross-national patterns of gender
differences in mathematics: A meta-analysis. Psychological Bulletin 136: 103–127.
62. World Economic Forum (2009) The Global Gender Gap Report 2009.
63. Dijkstra AG, Hanmer LC (2000) Measuring socio-economic gender inequality:Toward an alternative to the UNDP Gender-Related Development Index.
Feminist Economics 6: 41–75.64. Hawke JL, Olson RK, Willcut EG, Wadsworth SJ, DeFries JC (2009) Gender
ratios for reading difficulties. Dyslexia 15: 239–242.65. Shaywitz SE, Escobar MD, Shaywitz BA, Fletcher JM, Makuch R (1992)
Evidence that dyslexia may represent the lower tail of a normal distribution of
reading ability. New England Journal of Medicine 326: 145–150.66. OECD (2010) PISA 2009 Results: Learning trends: Changes in student
performance since 2000 (Volume V).67. Hyde JS (2007) New directions in the study of gender similarities and differences.
Current Directions in Psychological Science 16: 259–263.
68. National Science Foundation (2011) Women, minorities, and persons withdisabilities in science and engineering: 2011. Arlington, VA: National Science
Foundation.69. Nosek BA, Banaji MR, Greenwald AG (2002) Math = male, me = female,
therefore math? me. Journal of Personality and Social Psychology 83: 44–59.
70. Dwyer CA (1973) Sex differences in reading: An evaluation and a critique of
current theories. Review of Educational Research 43: 455–467.71. Hyde JS, Fennema E, Ryan M, Frost LA, Hopp C (1990) Gender comparisons
of mathematics attitudes and affect. Psychology of Women Quarterly 14: 299–
324.72. Hanson SL, Schaub M, Baker DP (1996) Gender stratification in the science
pipeline: A comparative analysis of seven countries. Gender and Society 10:271–290.
73. Wai J, Lubinski D, Benbow CP (2009) Spatial ability for STEM domains:
Aligning over 50 years of cumulative psychological knowledge solidifies itsimportance. Journal of Educational Psychology 101: 817–835.
74. Nuttall RL, Casey MB, Pezaris E (2005) Spatial ability as a mediator of genderdifferences on mathematics tests: A biological-environmental framework. In:
Gallagher AM, Kaufman JC, editors. Gender differences in mathematics: Anintegrative psychological approach. Cambridge, UK: Cambridge University
Pres. 121–142.
75. Casey MB, Nuttall R, Pezaris E, Benbow CP (1995) The influence of spatialability on gender differences in mathematics college entrance test scores across
diverse samples. Developmental Psychology 31: 697–705.76. Geary DC, Saults SJ, Liu F, Hoard MK (2000) Sex differences in spatial
cognition, computational fluency, and arithmetical reasoning. Journal of
Experimental Child Psychology 77: 337–353.77. Lippa R, Collaer M, Peters M (2010) Sex differences in mental rotation and line-
angle judgments are positively associated with gender equality and economicdevelopment across 53 nations. Archives of Sexual Behavior 39: 990–997.
78. Eccles JS, Blumenfeld P (1985) Classroom experiences and student gender: Arethere differences and do they matter? In: Wilkinson L, Marrett CB, editors.
Gender influences in classroom interaction. Orlando, FL: Academic Press. 79–
114.79. Eccles JS, Wigfield A, Harold RD, Blumenfeld P (1993) Age and gender
differences in children’s self- and task perceptions during elementary school.Child Development 64: 830–847.
80. Frome PM, Eccles JS (1998) Parents’ influence on children’s achievement-
related perceptions. Journal of Personality and Social Psychology 74: 435.81. Furnham A, Hosoe T, Tang T (2001) Male hubris and female humility? A cross-
cultural study of ratings of self, parental, and sibling multiple intelligence inAmerica, Britain, and Japan. Intelligence 30: 101–115.
82. Furnham A, Petrides K (2004) Parental estimates of five types of intelligence.Australian Journal of Psychology 56: 10–17.
83. Furnham A, Reeves E, Budhani S (2002) Parents think their sons are brighter
than their daughters: Sex differences in parental self-estimations and estimationsof their children’s multiple intelligences. The Journal of Genetic Psychology 163:
24–39.84. Nosek BA, Smyth FL, Sriram N, Lindner NM, Devos T, et al. (2009) National
differences in gender–science stereotypes predict national sex differences in
science and math achievement. Proceedings of the National Academy ofSciences 106: 10593–10597.
85. Newcombe NS, Ambady N, Eccles JS, Gomez L, Klahr D, et al. (2009)Psychology’s role in mathematics and science education. American Psychologist
64: 538.
Gender, Culture and Sex-Typed Cognitive Abilities
PLoS ONE | www.plosone.org 16 July 2012 | Volume 7 | Issue 7 | e39904