Embed Size (px)
Citation preview
Consistencies in Sex Differences 1
Running Head: SEX DIFFERENCES ON THE COGNITIVE ABILITIES TEST
Consistencies in Sex Differences on the Cognitive Abilities Test across
Countries, Grades, and Cohorts
David F. Lohman
Joni Lakin
The University of Iowa
Draft submitted April 21, 2008
Consistencies in Sex Differences 2
Abstract
Recently, Strand, Deary, and Smith (2006) reported sex differences for over 320,000 students
11-12 years old on the Cognitive Abilities Test. Although mean differences were small, score
distributions for males were more variable. Males were also overrepresented at the upper and
lower extremes of the score distributions on the Quantitative and Nonverbal batteries and at the
lower extreme of the Verbal Battery. However, it is unclear whether these results are unique to
the U.K. or whether they would be seen at other grades, cohorts, or forms of the same test. To
investigate this, we replicated and expanded their results by comparing the distributions of scores
for males and females from three standardizations of the U.S. version of the test. Changes in the
proportions of males and females at each score level were examined across countries (U.K.
versus U.S.), grades (3-11) and cohorts/test forms (1984, 1992, and 2000). The results showed an
astonishing consistency in sex differences across countries, age cohorts, and test forms.
Implications for the current debate about sex differences in the quantitative reasoning abilities of
males and females are discussed.

Consistencies in Sex Differences 3
Consistencies in Sex Differences on the Cognitive Abilities Test across
Countries, Grades, and Cohorts
Controversy about the existence and interpretation of sex differences in abilities extends
from some of the earliest empirical research on individual differences (e.g., Thorndike, 1914) to
the present (e.g., Ceci & Williams, 2006; Feingold, 1992; Halpern et al., 2007; Hedges &
Nowell, 1995; Lubinski & Benbow, 1992; Spelke, 2005). It is a topic in which few people are
disinterested (Chipman, 1988) and in which many have personal beliefs that can make unbiased
interpretation and calm discussion difficult (Eagly, 1995).
Statistical and psychometric issues further complicate the issue. Because relatively few
observations are needed to estimate a mean, most studies have examined sex differences in
means and ignored differences in the variability and shape of score distributions. When score
distributions differ in variability, however, differences between group means do not generalize to
group differences at the tails of the distributions. Indeed, even with a zero mean difference
between the sexes, greater male variability would result in more males being represented in the
highest and lowest ability ranges (Stanley & Benbow, 1982).
The focus on mean scores can explain some of apparent contradictions in the research on
sex differences. For example, on the one hand, males and females show small mean differences
in mathematics achievement (Braswell, Dion, Daane, & Yin, 2005; Feingold, 1988; Hyde,
Fennema, & Lamon, 1990). On the other hand, women are substantially underrepresented in the
most selective math and science fields (Lubinski & Benbow, 1992). Examination of score
distributions rather than means can help resolve this paradox. Distributions of scores on
mathematics achievement tests are commonly more variable for males than for females
(Feingold, 1992; Hedges & Nowell, 1995). When a selection cutoff is applied, say for a top math
Consistencies in Sex Differences 4
Ph.D. program, greater male variability in scores on the achievement test would result in
overrepresentation of males in that program despite negligible mean differences between males
and females. Of course, scores on admissions tests are only a small part of the picture. Personal
choices about academic careers reflect many other factors such as interests, social expectations,
and self-perceptions of ability (Lubinski, Benbow, Shea, Eftekhari-Sanjani, & Halvorson, 2001).
Many observations are required to estimate the shape of two distributions with sufficient
power to compare the proportions of individuals in each group who obtain extreme scores.
Although surveys of academic achievement are often administered to samples sufficiently large
to investigate group differences in variability, relatively few ability tests are administered to
large samples that are representative of the population. For example, regional talent searches and
college admissions programs administer tests to large samples, but these samples are not
representative of the larger population. The standardization samples for individually-
administered ability tests—although representative of the population—often include no more
than 100 students in each age group. Group ability tests, on the other hand, are generally normed
on very large samples that are representative of the student population. Large samples allow
comparisons of the relative proportions of each group within any range of scores without making
assumptions about the shapes of the score distributions. This can be especially helpful when
scores are not distributed normally for one or both groups, or when score distributions for groups
differ both in central tendency and variability.
Recently, Strand, Deary, and Smith (2006) examined sex differences for over 320,000
students 11-12 years old on one such group-administered ability test: the third edition of the U.K.
version of the Cognitive Abilities Test (CAT-3; Lohman, Thorndike, Hagen, Smith, Fernandes,
& Strand, 2001).1 Students were tested between September 2001 and August 2003. With the

Consistencies in Sex Differences 5
exception of the top 10% in verbal reasoning, boys were overrepresented at both extremes on
score distributions for all three batteries—Verbal, Quantitative, and Nonverbal. The
discrepancies were particularly large for the quantitative reasoning battery. However, scores on
all ability tests are affected by in-school and out-of-school experiences. Therefore, it is unclear
whether these results are unique to this sample of 11- and 12-year-old students in the U.K. or if
they would be seen in the U.S. as well, at other ages, in other cohorts, and in parallel versions of
the same tests. The purpose of this study was to test each of these hypotheses using the data from
three standardizations of the U.S. version of the Cognitive Abilities Test (CogAT). The
proportions of males and females at each score level were compared in the U.K. sample of 11-12
year olds and in a comparable cohort of U.S. students who took the same level of the test, then
across grades 3 to 11 within the U.S. sample, across three U.S. cohorts (1984, 1992, and 2000)
and three different forms (4, 5, and 6) of the U.S. version of the test. By using different forms of
the same tests that were administered to large, nationally representative samples, we were able to
control some of the variables that can easily confound interpretation of change.
Generalization from the U.S. to the U.K. cannot be assumed. In a comparison of score
distributions across different cultures, Feingold (1994) found no consistent differences in ratios
of male/female variances across heterogeneous collections of tests in the separate domains of
vocabulary, reading comprehension, mathematics achievement, and spatial ability. In an analysis
of data from the Second International Mathematics Study, Barker and Jones (1993) found
considerable variability in the difference between average performance of male and female
eighth-grade students in 19 countries. Seven countries showed a significant male advantage, four
showed a significant female advantage, and 10 (including the U.S. and England-Wales) showed
no difference. The more recent Third International Mathematics Study found a small male
Consistencies in Sex Differences 6
advantage at Grade 8 in only eight of the 39 participating countries. By 12th grade, however, the
male advantage had increased, especially in advanced mathematics and in the top quarter of the
score distribution (Mullis, Martin, Fierros, & Goldberg, 2000).
Generalization across age groups within a cohort or across cohorts also cannot be
assumed. For example, sex differences in average mathematics achievement during high-school
declined during the 1970s as more girls enrolled in advanced mathematics classes in high school
(Feingold, 1988; Finn, 1999). Changes in the pattern of sex differences across cohorts tested in
different decades can also be influenced by changes in the content of tests or the cognitive
processes required to solve items on them. This is especially the case for measures of academic
achievement (Martin & Hoover, 1987). For example, the knowledge and skills that are
considered representative of a domain differ importantly across school grades and across cohorts
as the educational community alters its definition of that domain or the task formats used in the
test.
The construct measured by an ability test can also change across ages, especially when
new subtests or item types are administered at different ages. Further, although sex differences in
some abilities are observed as early as we can measure them, differences between males and
females tend to increase through adolescence (Johnson & Meade, 1987; Linn & Petersen, 1985).
Finally, differences in the procedures used to screen items for bias can alter observed
patterns of sex differences. On the one hand, not examining items for sex differences can lead to
a biased test that inadvertently favors one sex. On the other hand, discarding items that show
significant sex differences can also bias the scores if the differences hold in the domain as well
as in the sample of items that make up the test. A better procedure is to screen items for the
presence of differential item functioning (DIF; Dorans & Holland, 1993). Essentially, these
Consistencies in Sex Differences 7
procedures test whether items vary in difficulty for individuals from two groups of the same
level of ability. Items that show significant sex differences need not show significant DIF if the
distribution of ability differs in the two groups. Put differently, screening for DIF does not mean
that group differences in either means or variances will be eliminated. It helps insure that any
differences that are observed—either at the means or in the relative proportions of individuals at
different levels in the common score distribution—are not inadvertently caused by the inclusion
of items that differentially favor one group. This is particularly important at the extremes of the
distribution of scale scores. The selection of the easiest and most difficult test items can
substantially influence group differences in these scores.
Methods
Participants
We used the national standardization data from the 1984 (Form 4), 1992 (Form 5), and
2000 (Form 6) editions of the Cognitive Abilities Test (CogAT; Lohman & Hagen, 2001;
Thorndike & Hagen, 1984, 1992). For simplicity, we refer to the three forms as CogAT4,
CogAT5, and CogAT6. We included only the data for levels A-G of the test that are
administered to students in grades 3-11. We excluded the primary battery (grades K-2) because it
uses a different set of tests that measure somewhat different abilities. We also excluded Level H
(grade 12) because of the comparatively small sample size.
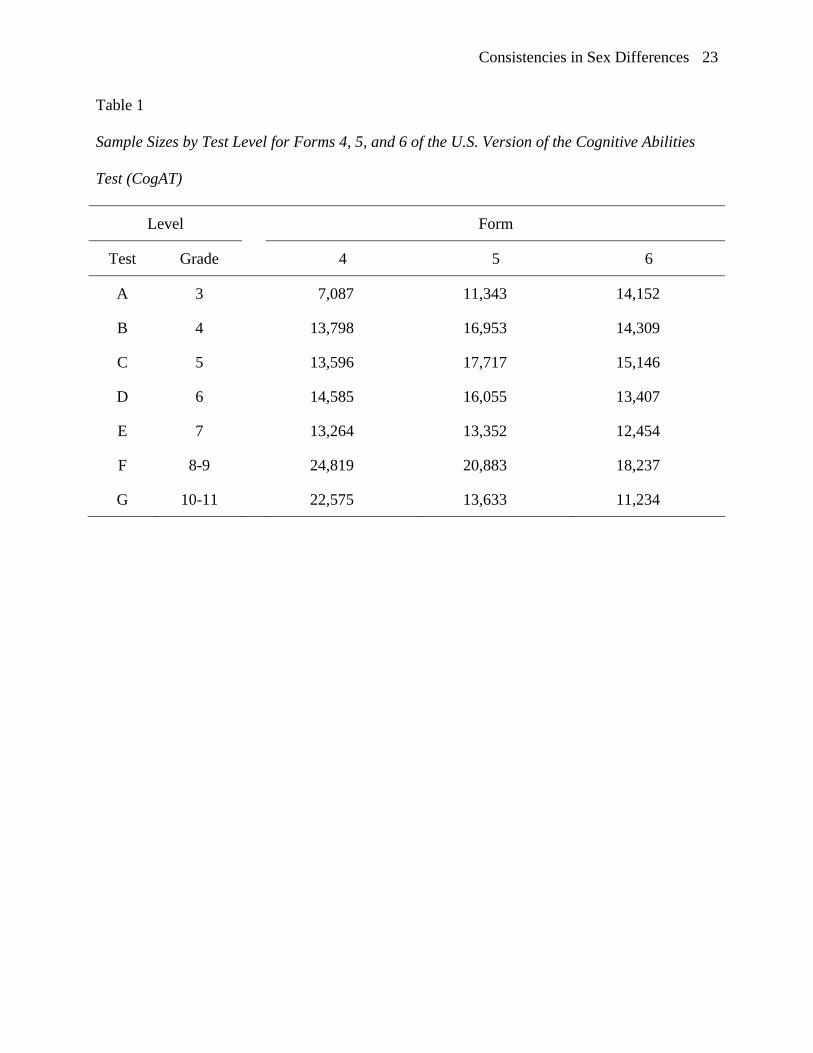
Numbers of students at each test level in the CogAT4, CogAT5, and CogAT6
standardization samples are shown in Table 1. Cases were weighted better to represent the U.S.
national census in terms of region of the country, school-district size, and school socioeconomic
status. Ethnic composition of the populations varied across the three samples. As shown in Table

Consistencies in Sex Differences 8
2, the proportion of White, non-Hispanic students in the sample declined from 80.6% in 1984 to
68.1% in 1992 and then to 65.0% in 2000.
Instruments
The Cognitive Abilities Test was designed to measure the full range of reasoning abilities
that define general fluid reasoning (Gf). Carroll (1993) has shown that the Gf factor is defined by
three reasoning abilities: (a) sequential reasoning—verbal, logical, or deductive reasoning;
(b) quantitative reasoning—inductive or deductive reasoning with quantitative concepts; and
(c) inductive reasoning—typically measured with figural tasks. These correspond roughly with
the three CogAT batteries: verbal reasoning, quantitative reasoning, and figural/nonverbal
reasoning.
Forms 4, 5, and 6 of CogAT all use the same item formats in each of nine subtests. Three
subtests measure verbal reasoning (Verbal Classification, Verbal Analogies, Sentence
Completion); three measure quantitative reasoning (Quantitative Relations, Number Series, and
Equation Building), and three measure figural/nonverbal reasoning (Figure Classification, Figure
Analogies, Figure Analysis). Items on each test form were developed through an extensive tryout
process that included screening for difficulty, discrimination, and DIF. Items within each battery
were then independently scaled to create a unidimensional, cross-grade scale for each battery.
For the Verbal, Quantitative, and Nonverbal scores, K-R 20 reliabilities range from .94 to .95
(Lohman & Hagen, 2002; Thorndike & Hagen, 1987, 1997).
Evidence on the validity is presented in the technical documentation for each test (see
especially Lohman & Hagen, 2002). For example, the Composite score on CogAT correlates
with IQ scores from individually administered ability tests as well as the IQ scores from different
individually administered tests correlate with each other. The means and variances of CogAT
Consistencies in Sex Differences 9
and individually administered ability tests are also comparable, at least until high school. For
example, mean CogAT6 scores for children in Grade 6 did not differ from mean scores on either
the WISC-III or the Woodcock-Johnson III (Lohman, 2003a, b).
Strand et al. (2006) used the third form of the U.K. adaptation of the CogAT in their
study of sex differences in variability. The U.K. CAT-3 and the U.S. CogAT6 differ in several
respects. Approximately 55-65%of the items on CAT-3 were adapted or taken directly from
forms 5 or 6 of CogAT. On the Quantitative Battery, the CogAT Quantitative Relations subtest
was replaced with a Number Analogies test on the CAT-3. Thus, in comparing scores on the
CogAT6 and the CAT-3, generalization is not only across cohorts (U.K. versus U.S. sixth-grade
students), but also across forms of the test.
Data Analysis
Using the weighted standardization data from each form of the CogAT, we compared the
means of the standard score distributions for each battery using Cohen’s (1988) d statistic and
the variances by the ratio of male score variance to female score variance. Finally, we divided
each distribution into stanines and calculated the proportions of males and females at each
stanine.
The student samples used in the standardizations of forms 4, 5, and 6 of the CogAT were
drawn using a stratified random sampling plan. First-stage sampling units (school buildings)
were defined by region of the country (four levels), school-district size (five levels), and school
socioeconomic status (five levels). Randomly selected schools within each stratification group
were asked to participate. Because students within school buildings are more alike than a random
sample of all U.S. students, the amount of sampling error would be underestimated by standard
error estimates that were calculated as if students were a simple random sample (Gonzalez &

Consistencies in Sex Differences 10
Foy, 1997; Williams, Rosa, McLeod, Thissen, & Sandford, 1998). Therefore, we estimated
standard errors using a two-level bootstrapping procedure that incorporated the stratification
procedure. The bootstrap was implemented as follows:
Step 1. From the n schools in the data set (e.g., the CogAT6 standardization sample had
633 schools), n schools were randomly selected with replacement so that some schools were
selected once, some were selected multiple times, and some were not selected at all for the
sample. Schools with case weights of zero or with fewer than 10 students were excluded from
sampling.
Step 2. From each school selected in Step 1 (with a student population of mi), mi students
were randomly selected (between 10 and 1,168 depending on the size of the school). Again,
selection was with replacement, with students being selected once, several times, or not at all. If
a school had beenselected more than once in Step 1, the Step 2 sampling was performed anew for
each time that the school had been selected. All students were weighted by their case weight,
which was based on the school-level stratification variables. This makes each sample of students
more representative of the population than the initial unweighted sample of students.
Step 3. Using the sample created in Step 2, the proportion of males or females in each
stanine for a particular test battery (e.g., Verbal) was calculated.
Step 4. Steps 1 through 3 were repeated a total of 500 times, resulting in 500 estimates of
stanine proportions.
Step 5. The entire bootstrap procedure was repeated for each of the other two batteries
(e.g., Quantitative and Nonverbal) and for each form of the test (forms 4, 5, and 6).
In each iteration, the bootstrap procedure estimates the proportion of males and females
at each stanine. However, the result of interest is not the estimated proportion but rather the
Consistencies in Sex Differences 11
variability of these estimates across 500 bootstrap samples. The standard deviation of this
distribution is used as the standard error for the proportions, and the estimates themselves are not
used. Table 4 reports the observed stanine percentages of males and females in the sample along
with the bootstrapped estimates of their standard errors.
Results
Generalization from U.K. to U.S.
The first question we addressed was whether the findings of Strand et al. (2006)
generalize to a similar cohort of students who had taken the U.S. version of the Cognitive
Abilities Test (i.e., the 13,407 U.S. sixth-graders who took Level D of the CogAT6 in the spring
of 2000). We addressed this question in three analyses: (a) a comparison of effect sizes for the
male-female difference in mean scores on each battery, (b) a comparison of the male/female
variance ratios on each battery, and (c) a comparison of the proportion of male and female
students at each of the nine stanines of the score distributions on each battery. For ease of
comparison, we present these results graphically. Although the emphasis here is on a comparison
of CAT-3 and CogAT6 at Level D, data for other test levels and test forms are also included in
the plots for effect sizes and variance ratios. Additional supporting data may be requested from
the authors.
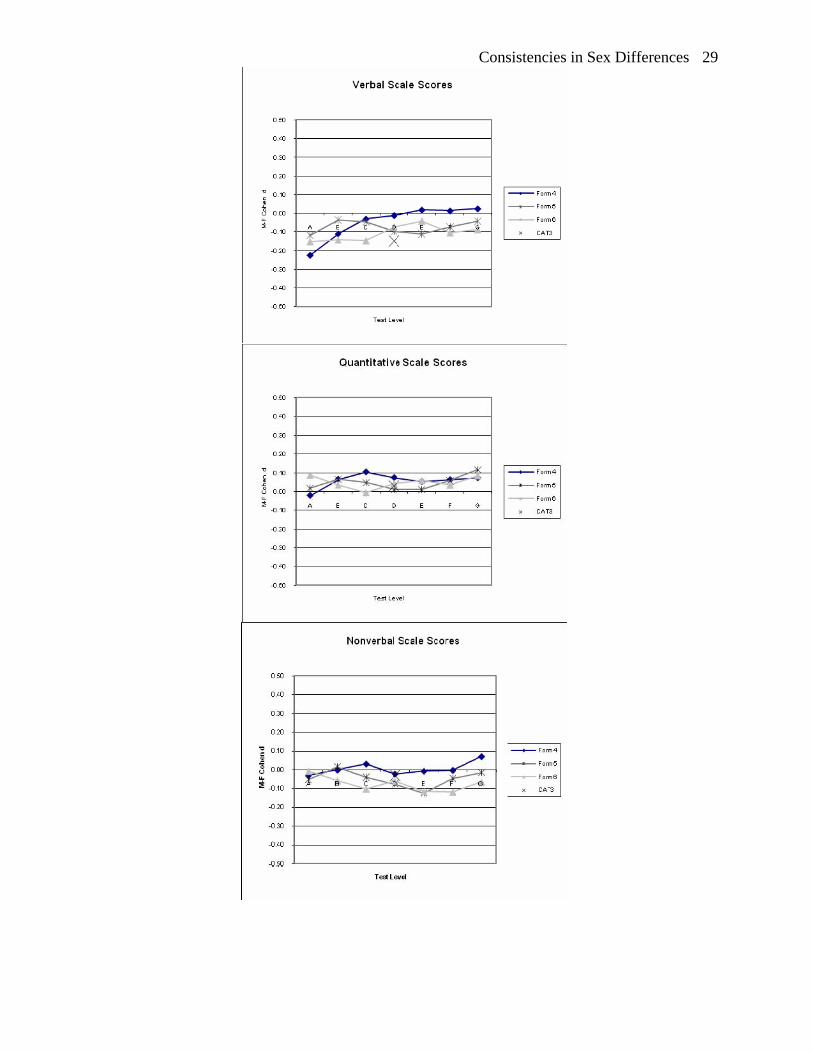
Effect sizes. Male minus female effect sizes for the Verbal, Quantitative, and Nonverbal
batteries by test level and test form are reported in Table 3 and shown graphically in Figure 1.
The effect size for Level D of the CAT-3 (Strand et al., 2006) appears as an X in each plot. It is
coincident with the CogAT6 effect sizes at Level D for the Quantitative and Nonverbal batteries
and somewhat larger than the CogAT6 effect size at Level D for the Verbal Battery. However,
this larger female advantage in the U.K. sample for verbal reasoning was also observed in the

Consistencies in Sex Differences 12
U.S. sample at Level C of CogAT6. Note, too, that effect sizes were generally quite small. If the
analysis focused only on mean differences, we would erroneously conclude that there is little
evidence for sex differences in reasoning abilities on any of the test batteries.
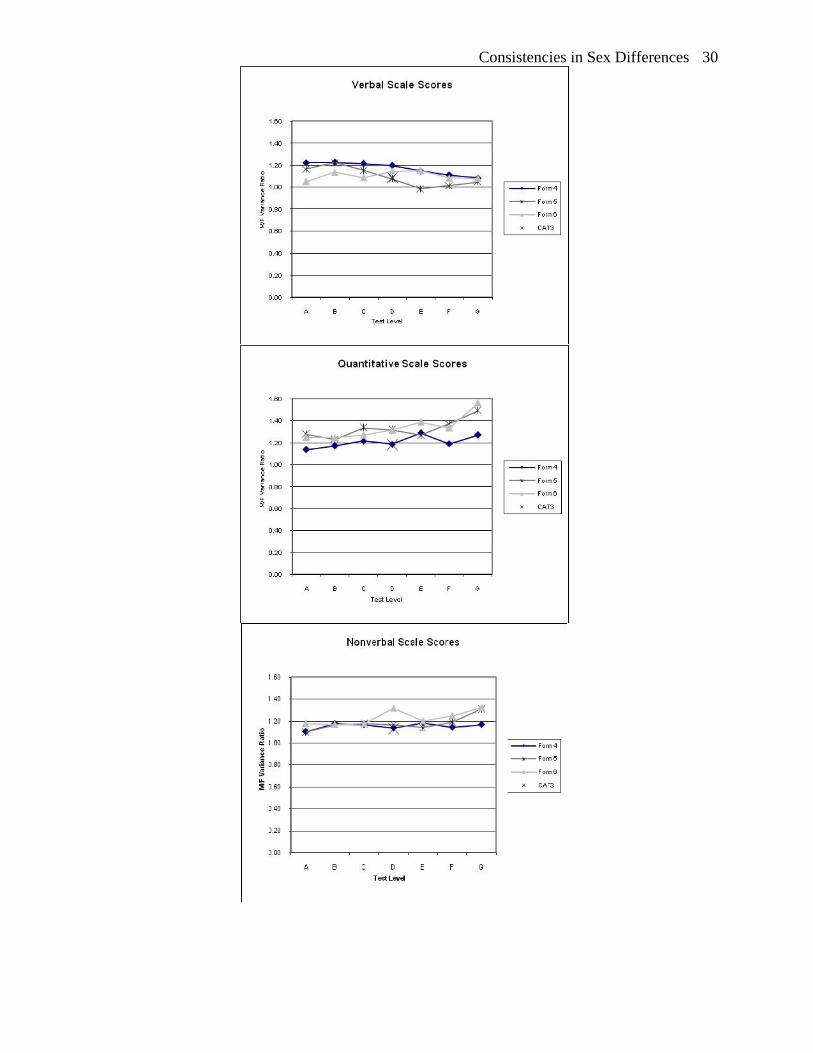
Variance ratios. The male-female variance ratios plotted in the three panels of Figure 2
tell a different story. A variance ratio greater than 1.0 indicates that the score distribution for
males was more variable than the score distribution for females. Feingold (1992) suggested that a
variance ratio of 1.10 or greater would be of practical importance on these types of tests. With
one exception (CogAT5 Verbal, Level E, which was 0.98), all variance ratios were greater than
1.0. As shown in Figure 2, the CAT-3 variance ratios were all somewhat smaller than the
corresponding CogAT6 ratios. However, none were outside the range of variance ratios observed
on CogAT4, CogAT5, or CogAT6 at Level D. Greater male variability was most pronounced at
levels F and G of the CogAT5 and CogAT6 Quantitative batteries. These variance ratios ranged
from 1.34 to 1.56 which indicates that males had variances up to 56% larger than the female
variance. This undoubtedly would result in substantial differences in the proportion of males and
females with extreme scores.
Proportion at each stanine. Figure 3 shows the proportion of males and females at each
stanine for Level D on each of the three test batteries, separately for the CAT-3 and CogAT6
samples. The plots for all three batteries are remarkably similar, given the considerably smaller
sample size for CogAT6 (13,407 versus over 320,000 for CAT-3). The most notable difference
was a somewhat greater disparity between the proportion of males and females who obtained
stanine scores of 1 or 9 on the Nonverbal and Quantitative batteries in the U.S. sample. This
comports with the larger variance ratios observed in the U.S. sample in Table 3. Overall, for
CogAT 6, there were significantly more males than females at the lower extreme (Stanine 1) on
Consistencies in Sex Differences 13
all three batteries (Verbal, Quantitative, and Nonverbal). However, only on the Quantitative
Battery were there significantly more males at the upper extreme (Stanine 9). Percentages of
males and females in each stanine with the corresponding bootstrapped standard errors are
reported in Table 4.2
Generalization across Age Cohorts
The second question we sought to answer was whether the results would generalize
across age cohorts. Specifically, do the relative proportions of males and females differ across
grades? In addition to the substantive question about the potential effects of education and/or
maturation, this also addresses concerns about whether differences were due to performance on a
few items. Even though items were screened for DIF, it is possible that, for example, males
might have a small advantage on one or more of the most difficult items on the Level D
quantitative tests. Small differences in raw scores typically translate into larger differences in
scale scores at the extremes of the distribution. However, the overlapping structure of the CogAT
ensures that successive levels of the test include different, but overlapping portions of a common
set of items. For example, the three to five most difficult items on each subtest at Level A (Grade
3) reappear at levels B through E. By Level E, they are the easiest block of items on each subtest.
If sex differences in proportion of high-scoring students at Level D were caused by a few of the
most difficult items, then we would expect the differences to disappear as we moved to higher or
lower levels of the test where new items define the most difficult block of items.
One again, we used only the data from the 2000 cohort, but this time examined changes
across levels of the test. Since the proportion of females is always one minus the proportion of
males, we plotted only the proportion of males who received stanine scores of 1 or 9 on each of
the seven levels of the test. Although there was some movement across levels, the overall picture

Consistencies in Sex Differences 14
is one of consistency. Overlapping standard errors (see Table 4) confirmed this apparent
consistency.
Generalization across 1984, 1992, and 2000 Cohorts
The third question we addressed was whether the relative proportions of U.S. males and
females who obtained extreme scores changed between 1984 and 2000. Data were provided by
the national standardizations of forms 4, 5, and 6 of the CogAT in 1984, 1992, and 2000
respectively. Generalization is not only across time periods and test forms, but also across
changes in racial/ethnic composition of the U.S. population. (See Table 2.)
We first plotted the proportion of males who received stanine scores of 1 or 9 on each of
the three CogAT batteries on forms 4, 5, and 6. Plots for stanine scores of 1 are shown in the
upper row and for stanine scores of 9 in the lower row. A consistent trend would show the Form
5 scores between the forms 4 and 6 scores, but this was not found on any of the batteries.
The plots show that there was somewhat greater consistency across forms in the
proportion of males at Stanine 1 than at Stanine 9. Changes at Stanine 9 were largest on the
Verbal Battery with a slight reduction in the proportion of high-scoring males across forms,
although these differences were not significant. Notably, the proportion of high-scoring males
was relatively constant across levels and forms on the Quantitative Battery. The proportion of
males increased from .61 to .70 between Form 4 and forms 5 and 6 at Level G of the test, but
again this difference was not significant
Developmental Trends
Since the patterns of extreme scores were generally consistent across forms 4, 5, and 6,
we once again addressed the question of stability of the relative proportions of each sex at
different levels of the test. If there were strong developmental trends, then we would expect to

Consistencies in Sex Differences 15
see significant fluctuations in the proportions of males at each stanine across the seven levels of
the test.
We examined this by plotting the median proportion of males at each stanine across the
three forms of the test. We found relatively little systematic change across test levels. Given the
consistency across test levels, we aggregated the data once more, this time taking the median
proportion of males (and females) at each stanine. These plots (Figure 4) show a substantially
greater proportion of low-scoring males on the Verbal Battery, but only small differences
thereafter. For the Quantitative Battery, there was once again a substantially greater proportion
of low-scoring males (stanines 1 and 2), but an equally large proportion of high-scoring males
(stanines 8 and 9). The pattern of scores for the Nonverbal Battery was intermediate: an
overrepresentation of low-scoring males, but only a slightly greater proportion at Stanine 9. With
the exception of the greater proportion of males at Stanine 1 on the Nonverbal Battery, the plots
in Figure 4 are remarkably similar to the U.K. data.
Discussion
Although much has been written about sex differences in abilities, most studies have focused on
differences in average performance. Even in these studies, however, generalizations are
problematic because of differences in tests, the representativeness of the samples, and the
potential impact of changes in the course-taking patterns of males and females. Measuring
change is at best difficult and at worst misleading when the measures themselves also change.
Differences in the content and factor structures of tests are particularly troublesome when
inferences about ability are made from heterogeneous collections of ability or achievement tests.
Even when the name of the test (e.g., NAEP Mathematics) is the same, content can considerably
differ across assessments. By using carefully constructed, alternate forms of the same battery of
Consistencies in Sex Differences 16
reasoning tests, we observed considerably greater consistency in the proportions of male and
female students at different points in the score distributions for students of different ages (grade
3 to grade 11), cohorts (1984, 1992, 2000), forms of the test, and countries (U.S. and U.K.) than
is commonly observed. Although there were some notable differences across all these
dimensions, consistencies overshadowed changes. This indicates that the differences that we
observed—for example, in the overrepresentation of males at the extremes of the distributions
for quantitative reasoning—are not caused by factors that are specific to a particular collection of
test items, age cohort, or educational system.
The analyses reported here do not address the question of improvements (or decrements)
in scores over time—either across the age-cohorts within standardization or across the three
standardizations. Rather, they address the issue of the relative proportions of males and females
at different points in the distribution of scores. What these analyses show is that growth in
abilities, although substantial, proceeds at approximately the same rate for both girls and boys
from grades 3 to 11. If this were not the case, then there would be greater and more systematic
variation in the relative proportions of each sex who obtain the same stanine scores. Reasoning
tests such as those used on the CogAT measure abilities that are less influenced by schooling
than those that are measured by achievement tests. Indeed, the more closely a measure is tied to
instruction, the better girls tend to perform. On some tests, this increases their advantage over
boys; on others, it reduces the male advantage. For example, girls commonly obtain higher
grades and course marks than boys, although boys perform as well as girls or even excel when
tests present content and problems that are less firmly tied to the curriculum (Willingham &
Cole, 1997). This could be interpreted in different ways. For girls, their best performance is
observed on tasks that educators value sufficiently to include in the curriculum; for boys, their
Consistencies in Sex Differences 17
best performance is observed on tasks that require solving less-familiar problems for which they
do not have practiced routines. Which is better depends on the criterion task or situation.
In summary, the primary question addressed in this study was as follows: Do the patterns
of sex differences in reasoning abilities reported by Strand et al. (2006) generalize to other age
groups, cohorts, or national samples? In all three cases, the answer was a resounding yes. With
minor caveats, replication showed that the findings are robust. How the results are interpreted,
however, will depend on the larger story one hopes to tell about sex differences in abilities.
Simple summary statements easily mislead. The magnitude of differences between the sexes
depends on the kind of task (e.g., males excel on some spatial tasks, females on some verbal
tasks; females excel in writing essays, males in chemistry and physics on Advanced Placement
exams), the age of the participants (differences are typically larger for adults than for young
children), and the location in the score distribution (males more commonly have extremely low
scores on verbal reasoning, but differ minimally from females at the mean).
Regardless of the interpretation of these differences, this study shows that there is
considerably greater consistency in the presence (and absence) of sex differences in reasoning
abilities than might be inferred from analyses of score distributions on achievement tests, even
when these tests are carefully constructed and are administered to large representative samples
(e.g., Braswell et al. 2005). While the results have implications for selection policies, these
results probably have even greater implications for understanding students’ self-perceptions of
their abilities and the vocational choices that they make on the basis of those perceptions
(Lubinski et al., 2001). Students make inferences about ability not only on the basis of their
success in a domain, but also on the basis of their judgments of how much effort that they had
expended to achieve that success relative to others with similar or even lesser accomplishments.

Consistencies in Sex Differences 18
Whether scores on ability tests better comport with those judgments than achievement test scores
is a topic that warrants further investigation.

Consistencies in Sex Differences 19
References
Barker, D. P., & Jones, D. P. (1993). Creating gender equality: Cross-national gender
stratification and mathematical performance. Sociology of Education, 66, 91-103.
Braswell, J. S., Dion, G. S., Daane, M. C., & Yin, Y. (2005). The nation’s report card:
mathematics, 2003. Washington, D.C.: National Center for Education Statistics.
Carroll, J. B. (1993). Human cognitive abilities: A survey of factor-analytic studies. New York:
Cambridge University Press.
Ceci, S. J., & Williams, W. M., (Eds.). (2006). Why aren’t more women in science? Top
researchers debate the evidence. Washington, DC: American Psychological Association.
Chipman, S. F. (1988). Far too sexy a topic. [Review of J. S. Hyde and M. C. Linn. (Eds.) The
psychology of gender: Advances through meta-analysis. Baltimore MD: John Hopkins
University Press.], Educational Researcher, 17, 46-49. **
Cohen, J. (1988). Statistical power analysis for the behavioral sciences. Hillsdale, NJ: Erlbaum.
Dorans, N. J., & Holland, P. W. (1993). DIF detection and description: Mantel-Haenszel and
standardization. In P. W. Holland & H. Wainer (Eds.), Differential item functioning
(pp. 35-66). Hillsdale, NJ: Erlbaum.
Eagly, A. H. (1995). The science and politics of comparing women and men. American
Psychologist, 50, 145-158.
Feingold, A. (1988). Cognitive gender differences are disappearing. American Psychologist, 43,
95-103.
Feingold, A. (1992). Sex differences in variability in intellectual abilities: A new look at an old
controversy. Review of Educational Research, 62, 61-84.
Consistencies in Sex Differences 20
Feingold, A. (1994). Gender differences in variability in intellectual abilities: A cross-cultural
perspective. Sex Roles: A Journal of Research, 30, 81-92.
Finn, J. D. (1999, Spring). Opportunity offered—opportunity taken: Course-taking in American
high schools. ETS Policy Notes, 9 (1). Princeton, NJ: Educational Testing Service.
Retrieved July 4, 2007, from http://www.ets.org/Media/Research/pdf/ PICPNV9N1.pdf
Gonzalez, E. J., & Foy, P. (1997). Estimation of sampling variability, design effects, and
effective sample sizes. In M. O. Martin & D. L. Kelley (Eds.), Third International
Mathematics and Science Study (TIMSS) technical report: Volume 2. Implementation and
analysis-primary and middle school years (pp. 81-100). Boston: Boston College, Center
for the Study of Testing, Evaluation, and Educational Policy. Retrieved February 28,
2008, from http://timss.bc.edu/timss1995i/TIMSSPDF/TR2chap5.pdf
Halpern, D. F,, Benbow, C. P., Geary, D. C., Gur, R. C., Hyde, J. S., & Gernsbache, M. A.
(2007). The science of sex differences in science and mathematics. Psychological Science
in the Public Interest. 8, 1-51.
Hedges, L. V., & Nowell, A. (1995). Sex differences in mental test scores, variability, and
numbers of high-scoring individuals. Science, 269, 41-45.
Hyde, J. S., Fennema, E., & Lamon, S. J. (1990). Gender differences in mathematics
performance: A meta-analysis. Psychological Bulletin, 107, 139-155.
Johnson, E. S., & Meade, A. C. (1987). Developmental patterns of spatial ability: An early sex
difference. Child Development, 58, 725-740.
Linn, M. C., & Petersen, A. C. (1985). Emergence and characterization of sex differences in
spatial ability: A meta-analysis. Child Development, 56, 1479-1498.
Consistencies in Sex Differences 21
Lohman, D. F. (2003a). The Wechsler Intelligence Scale for Children III and the Cognitive
Abilities Test (Form 6): Are the general factors the same? Retrieved July 4, 2007, from
http://faculty.education.uiowa.edu/dlohman
Lohman, D. F. (2003b). The Woodcock-Johnson III and the Cognitive Abilities Test (Form 6):
A concurrent validity study. Retrieved July 4, 2007, from
http://faculty.education.uiowa.edu/dlohman.
Lohman, D.F., & Hagen, E. (2001). Cognitive Abilities Test (Form 6). Itasca, IL: Riverside.
Lohman, D. F., & Hagen, E. (2002). Cognitive Abilities Test (Form 6) research handbook.
Itasca, IL: Riverside.
Lohman, D. F., Thorndike, R. L., Hagen, E., Smith, P., Fernandes, C., & Strand, S. (2001).
Cognitive Abilities Test (3rd ed.). London: nferNelson.**
Lubinski, D., & Benbow, C. P. (1992). Gender differences in abilities and preferences among the
gifted: Implications for the math and science pipeline. Current Directions in
Psychological Science, 1, 61-66.
Lubinski, D., Benbow, C. P., Shea, D. L., Eftekhari-Sanjani, H., & Halvorson, M. (2001). Men
and women at promise for scientific excellence: Similarity not dissimilarity.
Psychological Science, 12, 309-317.
Martin, D. J., & Hoover, H. D. (1987). Sex differences in educational achievement: A
longitudinal study. Journal of Early Adolescence, 7(1), 65-83.
Mullis, I. V. S., Martin, M. O., Fierros, E. G., & Goldberg, A. L. (2000). Gender differences in
achievement, IEA’s Third International Mathematics and Science Study. Boston College:
International Study Center.
Consistencies in Sex Differences 22
Spelke, E. S. (2005). Sex differences in intrinsic aptitude for mathematics and science? A critical
review. American Psychologist, 60, 950-958.
Stanley, J. C., & Benbow, C. P. (1982). Huge sex ratios at upper end. American Psychologist, 27,
972.
Strand, S., Deary, I. J., & Smith, P. (2006). Sex differences in Cognitive Abilities Test scores: A
UK national picture. British Journal of Educational Psychology, 76, 463-480.**
Thorndike, E. L. (1914). Educational psychology. New York: Columbia University, Teachers
College.
Thorndike, R. L., & Hagen, E. P. (1984). Cognitive Abilities Test (Form 4). Itasca, IL: Riverside.
Thorndike, R. L., & Hagen, E. P. (1987). Cognitive Abilities Test (Form 4) technical manual.
Chicago, IL: Riverside.
Thorndike, R. L., & Hagen, E. P. (1992). Cognitive Abilities Test (Form 5). Itasca, IL: Riverside.
Thorndike, R. L., & Hagen, E. P. (1997). Cognitive Abilities Test (Form 5) research handbook.
Itasca, IL: Riverside.
Williams, V. S. L., Rosa, K. R., McLeod, L. D., Thissen, D., & Sanford, E. E. (1998). Projecting
the NAEP Scale: Results from the North Carolina End-of-Grade Testing program.
Journal of Educational Measurement, 35, 277-96.
Willingham, W. W., & Cole, N. S. (1997). Gender and fair assessment. Mahwah, NJ: Erlbaum.
Consistencies in Sex Differences 23
Table 1
Sample Sizes by Test Level for Forms 4, 5, and 6 of the U.S. Version of the Cognitive Abilities
Test (CogAT)
Level Form
Test Grade 4 5 6
A 3 7,087 11,343 14,152
B 4 13,798 16,953 14,309
C 5 13,596 17,717 15,146
D 6 14,585 16,055 13,407
E 7 13,264 13,352 12,454
F 8-9 24,819 20,883 18,237
G 10-11 22,575 13,633 11,234

Consistencies in Sex Differences 24
Table 2
Ethnic Breakdown for Forms 4, 5, and 6 of the U.S. Version of the Cognitive Abilities Test
(CogAT)
Ethnicity Form (Year)
CogAT4 (1984) CogAT5 (1992) CogAT6 (2000)
White (not Hispanic) 80.6 68.1 65.0
Black 11.6 15.4 16.3
Hispanic 6.4 7.5 11.5
Asian/Pacific Islander 1.0 4.2 3.6
Native American 0.5 1.6 2.5
Note. CogAT4 = CogAT Form 4; CogAT5 = CogAT Form 5; CogAT6 = CogAT Form 6.

Consistencies in Sex Differences 25 Table 3
Cohen’s Measure of Effect Sizes (d) and Variance Ratios (VR) of Males and Females by Battery, Test Form, and Level of the U.S. Version of the
Cognitive Abilities Test (CogAT)
Verbal Quantitative Nonverbal
Form 4 Form 5 Form 6 Form 4 Form 5 Form 6 Form 4 Form 5 Form 6
Lvl d VR d d VR VR d VR d VR d VR d VR d VR d VR
A -0.23 1.22 -0.12 1.16 -0.15 1.05 -0.02 1.14 0.02 1.28 0.09 1.25 -0.03 1.10 -0.05 1.10 -0.01 1.18
B -0.11 1.23 -0.04 1.22 -0.14 1.14 0.06 1.17 0.07 1.23 0.04 1.25 0.00 1.18 0.01 1.17 -0.06 1.17
C -0.03 1.21 -0.05 1.15 -0.15 1.09 0.10 1.22 0.05 1.34 -0.01 1.27 0.03 1.17 -0.04 1.18 -0.10 1.18
D -0.01 1.20 -0.10 1.08 -0.07 1.15 0.07 1.19 0.01 1.32 0.04 1.31 -0.02 1.14 -0.08 1.17 -0.06 1.32
E 0.02 1.15 -0.11 0.98 -0.04 1.15 0.05 1.29 0.01 1.27 0.06 1.39 -0.01 1.18 -0.12 1.14 -0.11 1.20
F 0.01 1.11 -0.07 1.01 -0.10 1.08 0.06 1.19 0.06 1.37 0.03 1.34 0.00 1.14 -0.05 1.19 -0.12 1.25
G 0.02 1.08 -0.04 1.04 -0.09 1.08 0.07 1.27 0.12 1.49 0.08 1.56 0.07 1.17 -0.01 1.31 -0.07 1.32
Note. A negative d value (in bold) indicates females scored higher than males; a variance ratio greater than 1 (VR > 1) means females are less
variable (males less variable is underlined). Lvl = Level.

Consistencies in Sex Differences 26 Table 4
Percent of Females and Males with Bootstrapped Standard Errors for each Stanine by Test Form and Battery
of the U.S. Version of the Cognitive Abilities Test (CogAT)
Form
6 5 4
F M F M F M
Battery and Stanine % SE % SE % SE % SE % SE % SE
Verbal
1 3.17 0.3 4.98 0.45 2.23 0.62 4.18 0.42 3.07 0.38 5.05 0.43
2 6.16 0.48 7.52 0.53 4.98 0.91 6.45 0.53 6.3 0.48 7.82 0.5
3 11.85 0.66 13.27 0.64 10.26 1.25 11.22 0.66 11.84 0.59 12.08 0.53
4 17.89 0.56 17.86 0.45 16.84 0.98 16.27 0.45 16.56 0.42 15.75 0.4
5 17.98 0.43 17.12 0.44 20.56 0.31 19.3 0.42 18.82 0.37 17.89 0.37
6 18.92 0.58 16.9 0.57 18.34 1.04 17.62 0.57 18.18 0.5 16.72 0.47
7 12.97 0.6 12.21 0.55 13.89 1.48 13.08 0.53 13.77 0.52 12.5 0.52
8 6.93 0.44 6.35 0.37 8.09 0.94 7.49 0.38 7.11 0.35 7.18 0.38
9 4.13 0.36 3.79 0.29 4.82 0.59 4.39 0.29 4.35 0.31 5.01 0.36
Quantitative
1 3.18 0.23 4.75 0.38 2.05 0.26 3.53 0.37 4.24 0.39 5.66 0.42
2 5.93 0.39 7.42 0.45 4.48 0.39 5.88 0.44 5.84 0.38 7.31 0.39
3 12.57 0.58 12.93 0.53 10.33 0.59 11.44 0.55 11.3 0.49 11.66 0.47
4 19.09 0.51 16.87 0.41 17.15 0.52 15.51 0.42 17.93 0.48 16.35 0.41
5 18.77 0.36 16.51 0.35 21.45 0.36 18.24 0.34 20.82 0.36 18.42 0.31
6 18.84 0.57 16.88 0.49 19.89 0.57 17.56 0.48 18.47 0.55 16.34 0.43
7 12.41 0.54 12.51 0.49 13.79 0.57 13.44 0.52 12.1 0.5 12.22 0.45
8 6.06 0.35 7.26 0.43 7.24 0.36 8.35 0.42 6.02 0.35 6.92 0.37
9 3.14 0.25 4.88 0.34 3.64 0.26 6.06 0.36 3.29 0.28 5.12 0.38

Consistencies in Sex Differences 27 Nonverbal
1 3.04 0.24 5.14 0.43 2.27 0.26 3.80 0.38 2.43 0.26 3.52 0.33
2 5.94 0.41 8.02 0.5 4.87 0.43 6.47 0.50 6.02 0.42 7.40 0.45
3 11.76 0.55 13.45 0.48 10.54 0.57 12.15 0.48 11.74 0.47 12.73 0.44
4 18.22 0.46 17.36 0.39 16.83 0.45 16.55 0.40 18.16 0.45 16.83 0.35
5 18.98 0.32 16.68 0.34 20.68 0.33 18.64 0.36 22.41 0.35 20.21 0.34
6 19.3 0.52 16.65 0.45 19.57 0.53 16.89 0.42 18.04 0.49 16.48 0.43
7 12.6 0.51 11.68 0.45 13.83 0.51 12.97 0.45 12.04 0.47 11.99 0.42
8 6.53 0.37 6.84 0.36 7.21 0.39 7.50 0.35 6.14 0.33 6.64 0.33
9 3.64 0.28 4.17 0.27 4.20 0.29 5.04 0.28 3.02 0.21 4.22 0.29

Consistencies in Sex Differences 28 Figure Captions
Figure 1. Male minus female effect sizes (d) for all test forms.
Figure 2. Male-female variance ratios for all test forms.
Figure 3. Proportions of Males and Females at each stanine on Level D of CAT-3 (Strand et
al. 2006) and CogAT6
Figure 4. Median proportion of males and females across test forms (4-6) and test levels
(A-G) at each stanine on the CogAT Verbal (left panel), Quantitative (center panel), and
Nonverbal (right panel) batteries.
Consistencies in Sex Differences 29
Consistencies in Sex Differences 30

Consistencies in Sex Differences 31

Consistencies in Sex Differences 32

Consistencies in Sex Differences 33

Consistencies in Sex Differences 34
Consistencies in Sex Differences 35
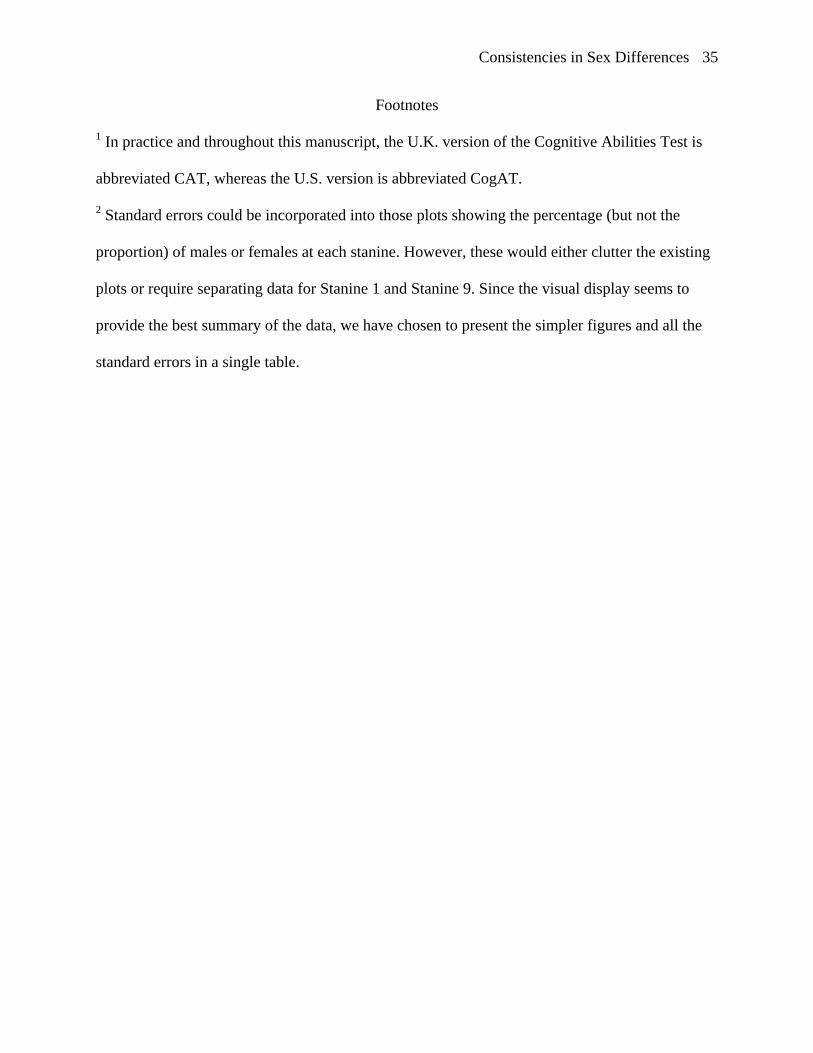
Footnotes
1 In practice and throughout this manuscript, the U.K. version of the Cognitive Abilities Test is
abbreviated CAT, whereas the U.S. version is abbreviated CogAT.
2 Standard errors could be incorporated into those plots showing the percentage (but not the
proportion) of males or females at each stanine. However, these would either clutter the existing
plots or require separating data for Stanine 1 and Stanine 9. Since the visual display seems to
provide the best summary of the data, we have chosen to present the simpler figures and all the
standard errors in a single table.