Embed Size (px)
Citation preview
AUTHORSCaroline DanielsMike HerringtonPenny Kew
Global Entrepreneurship Monitor
2 GEM – Global Entrepreneurship Monitor 2016
DISCLAIMERS
Although GEM data was used in the preparation of this report, their interpretation and use are the sole responsibility of the authors. The usual disclaimer applies.
Suggested citation: Caroline Daniels, Mike Herrington and Penny Kew. Global Entrepreneurship Monitor 2015/2016: Special Report on Entrepreneurial Finance. Global Entrepreneurship Research Association, 2016. www.gemconsortium.org
ACKNOWLEDGEMENTS
The authors would like to express their gratitude to all participating GEM 2015 national teams for their crucial role in conducting the GEM survey in their respective economies.
The authors would like to extend their thanks to the GERA data team for their contribution to the data collection procedures. Special and heartfelt thanks goes to Francis Carmona for his invaluable assistance with the data analysis, as well as the production of tables and fi gures, for this report.
Special thanks also goes to Forrest Wright for his insightful contribution to the literature review; and Abdul Ali and Donna Kelley for their expert guidance and input into the statistical analyses.
Thanks go to Rothko International for the design and layout of this report.
FOUNDING AND SPONSORING INSTITUTIONS
Babson College, Babson Park, MA, United StatesLead Sponsoring Institution and Founding Institution
Universidad del Desarrollo, Santiago, ChileSponsoring Institution
Universiti Tun Abdul Razak, MalaysiaSponsoring Institution
Tecnológico de Monterrey, MexicoSponsoring Institution
London Business School, London, United KingdomFounding Institution
International Council for Small Business
SPECIAL TOPIC : FINANCE 1
Caroline Daniels, MBA, Ph.D, is Senior Lecturer in Entrepreneurship at Babson College. Her research covers future trends, and entrepreneurial and innovation strategy. She has worked on the development of global business, technology strategies, and organisational change for numerous start-ups and corporations in the technology, energy, financial, consumer goods, pharmaceutical, publishing, safety, fashion and services industries. She has facilitated multi-client studies for The Economist Group and several corporations on the future of business. She is the recipient of the Deans’ Award for Teaching Excellence for undergraduate, graduate, and executive education programmes. Her work appears in leading publications, including The Economist, Economist Intelligence Unit, Financial Times, Wall Street Journal, and Forbes. She has published several books on globalisation and information technology with McGraw-Hill and the Pearson Group (Addison-Wesley). She is a frequent speaker at conferences on the future of business.
Dr Mike Herrington is the Executive Director of the Global Entrepreneurship Research Association (GERA) and is currently based at the Development Unit for New Enterprise (DUNE), Faculty of Commerce, University of Cape Town, South Africa. He has been involved with GEM South Africa since 2001. Mike was involved in the establishment and development of a number of Southern African companies before he moved to New Zealand, where he started his own cosmetic company, which he later sold. He returned to South Africa in 1989 and started a ladies’ hosiery company that he and a partner built up to one employing several thousand people and dominating over 85% of the South African market. They eventually sold it to the American company Sara-Lee Corporation, after which Mike remained with the company for several years before ‘retiring’ in 1999. He was asked to join the Graduate School of Business in 2001, where he started the Centre for Innovation and Entrepreneurship. Mike obtained an MBA from Cape Town University and a PhD from the University of London. He is involved in a number of SMME initiatives and has undertaken research on SMMEs in South Africa and sub-Saharan Africa, as well as in other developing economies such as in South America and South East Asia.
Penny Kew has an MSc in Comparative and International Education from Oxford University. She has been involved in education and training since 1997. Penny has been involved in a number of the more recent GEM reports, and was principal researcher and author on the 2008, 2009 and 2010 reports. Penny has also co-authored a number of GEM Special Topic reports including the 2015 South East Asia Report, the 2015 Future Potential: a GEM Perspective on Youth Entrepreneurship, the 2015 Women’s Entrepreneurship Report and the 2016 Report on Social Entrepreneurship.
ABOUT THE AUTHORS
2 GEM – Global Entrepreneurship Monitor 2016
EXECUTIVE SUMMARY
CHAPTER 1: INTRODUCTION AND BACKGROUND 8
1.1 An overview of research findings on current models of financing entrepreneurship 9
1.2 Key trends affecting entrepreneurial ecosystems 15 1.2.1 Globalisation and technology 1.2.2 Social influences 1.2.3 Changes to financial instruments and the economic environment
POLICY BRIEF: MALAYSIA - How the state can promote better access to finance 18
CHAPTER 2: A GLOBAL PERSPECTIVE ON ENTREPRENEURIAL FINANCE 20
2.1 How much money do early-stage (TEA) entrepreneurs need to start a business 21
2.2 Sources of entrepreneurial finance 25
2.3 Entrepreneurial finance: informal investors 27
2.4 Funding requirements: gender 29
2.5 Funding requirements: age 31
2.6 How entrepreneurs use their funding 32 2.6.1 Funding needs of necessity and opportunity entrepreneurs 2.6.2 Funding needs according to industry sector 2.6.3 Funding needs according to job creation aspirations 2.6.4 Funding needs according to level of innovation 2.6.5 Funding requirements according to degree of international orientation
POLICY BRIEF: ISRAEL - How the state can promote a local venture capital sector 42
CHAPTER 3: CONCLUSIONS AND RECOMMENDATIONS 44
REFERENCES 46
CONTENTS
SPECIAL TOPIC : FINANCE 3
APPENDIX 1: DATA TABLES 48
APPENDIX 2: THE GEM MODEL AND METHODOLOGY 72
LIST OF TABLES
Table 1: GEM economies by geographic region and economic development level, 2015 Table 2: Average amount of money provided by informal investors, by gender and region, GEM 2015
LIST OF FIGURES
Figure 1: Average amount of money required to start a business (US$), by geographical region, GEM 2015 Figure 2: Average amount of money required to start a business (US$), by phase of economic development, GEM 2015 Figure 3: Percentage of entrepreneurs using own money to fund their business venture, GEM 2015 Figure 4: Percentage of the total amount of money required to fund a venture that comes from entrepreneurs’ own money, GEM 2015 Figure 5: Average percentage of entrepreneurs using own money to fund their ventures, by region, GEM 2015 Figure 6: Sources of finance for early-stage entrepreneurs, by region, GEM 2015 Figure 7: Sources of finance for early-stage entrepreneurs, by phase of economic development, GEM 2015 Figure 8: Percentage of early-stage (TEA) entrepreneurs receiving finance from informal investors, by region, GEM 2015 Figure 9: Average amount of money provided by informal investors (US$), by region, GEM 2015 Figure 10: Recipients of informal investor funding, by region, GEM 2105 Figure 11: Average amount of money required to start a business (US$), by gender, GEM 2015 Figure 12: Average amount of money required to start a business (US$), by age and phase of economic development, GEM 2015 Figure 13: Average amount of money required to start a business (US$), by entrepreneurial motivation, GEM 2015 Figure 14: Average amount of money required to start a business (US$) in African economies, by entrepreneurial motivation, GEM 2015 Figure 15: Average amount of money required to start a business (US$) in Asia and Oceania economies, by entrepreneurial motivation, GEM 2015 Figure 16: Average amount of money required to start a business (US$) in European economies, by entrepreneurial motivation, GEM 2015Figure 17: Average amount of money required to start a business (US$) in Latin American and the Caribbean economies, by entrepreneurial motivation, GEM 2015Figure 18: Average amount of money required to start a business (US$) in North American economies, by entrepreneurial motivation, GEM 2015Figure 19: Average amount of money required (US$), by industry sector and phase of economic development, GEM 2015Figure 20: Average amount of money required (US$), by job creation aspirations and phase of economic development, GEM 2015Figure 21: Average amount of money required (US$), by job creation aspirations and region, GEM 2015Figure 22: Average amount of money required (US$), by innovation level and phase of economic development, GEM 2015Figure 23: Average amount of money required (US$), by innovation level and region, GEM 2015Figure 24: Average amount of money required (US$), by degree of international orientation and phase of economic development, GEM 2015Figure 25: Average amount of money required (US$), by degree of international orientation and region, GEM 2015
4 GEM – Global Entrepreneurship Monitor 2016
lack of access to finance as one of the most serious problems for businesses in many economies. Obtaining finance is particularly difficult for small and medium-sized enterprises.
Entrepreneurial financing has also evolved considerably over the past decade. Many of the previous models of entrepreneurial finance remain relevant today, including informal investment through the founders themselves, as well as borrowing from friends, family and colleagues. Venture capital (VC) investments in promising entrepreneurial firms remain important, particularly in developed economies. However, newer financing models, including business angels, microfinance, and small business accelerators, have matured considerably over the past 10 years, while a brand new model, crowdfunding, has emerged as a popular alternative for financing.
The decade since the Global Entrepreneurship Monitor (GEM) last focused on the topic of entrepreneurial
financing has seen a number of significant changes. The two previous reports, of 2004 and of 2006, contained data from 34 and 42 nations respectively, whereas the number of reporting economies has increased in this report to 60. The earlier reports also predated the US financial crisis of 2007/2008, which was followed by a significant global downturn (2008 to 2012). This recent financial crisis, the worst and longest-lasting of the last 80 years, has had a profound effect on the economic, as well as the entrepreneurial landscape. The Global Competitiveness Report 2015/16, for example, notes that one of the most striking ways in which the global financial crisis has created new obstacles for doing business is the increased citing of
EXECUTIVE SUMMARY
SPECIAL TOPIC : FINANCE 5
KEY FINDINGS
Amount of money needed by early-stage entrepreneurs
● The median initial funding requirements varied considerably across countries – from modest amounts in the Philippines (221 US$), Uruguay (257 US$) and Indonesia (369 US$) to substantial amounts in Switzerland (54,351 US$), Italy (55,511 US$) and Korea (88,500 US$).
● As with the individual countries, the average initial funding requirements vary considerably from a regional perspective. North American and European entrepreneurs required the highest amount of capital to start businesses on average and Latin American and the Caribbean the lowest, although there were wide discrepancies within each region.
● The amount of funding needed is generally lowest in efficiency-driven economies and highest in innovation-driven economies. In factor-driven economies, entrepreneurs required 24% more money to start, compared to efficiency-driven economies, indicating that they were starting businesses in commodities that required substantial upfront investment.
● For all the GEM nations combined, the average amount needed to start a business was 54,000 US$ in 2004 and 65,000 US$ in 2006. In 2015, the median was 13,000 US$ – indicating a willingness to start a business with fewer resources and the capability to do so, thanks to the influence of the internet.
Sources of funding for early-stage entrepreneurs
● From a global perspective, 95% of entrepreneurs use personal funds when starting a business. Israel and Spain, at 79%, report the lowest percentage of entrepreneurs using own money as a source of entrepreneurial finance.
● The average rate of own investment (expected own investment as a share of total required investment) ranges widely. The share of own investment ranges from a low of 47% in Burkina Faso and Senegal to highs of more than 90% in China (91%), Panama (93%), Vietnam (95%) and Indonesia (98%).
● Entrepreneurs themselves provided 66% of the start-up capital for their new ventures in 2004, 62% in 2006 and 72% in 2015, indicating a stronger sense of self-reliance in the present economic climate.
● In Latin America and the Caribbean, personal savings are an important source of financing for three-quarters of entrepreneurs, while Africa as a region reports the lowest use of own funds (59%). Half of the entrepreneurs in Asia and Oceania obtain finance from family. Africa and Asia and Oceania are the regions most likely to rely on friends for entrepreneurial finance (with around a fifth of entrepreneurs relying on this source).
● Banks are an important source of fi nance in all regions – their funding contributions range from a quarter of entrepreneurs in Africa and Asia and Oceania, up to providing fi nancing for a third of entrepreneurs in North America. The healthy levels of government funding support in North America and Europe, as well as a growing support in Africa are likely to be as a result of politicians become increasingly cognisant that entrepreneurship plays a vital role in the growth of economies.
● Entrepreneurs in North America are substantially more likely to have access to more sophisticated sources of entrepreneurial funding, such as VC and crowdfunding. Fourteen percent of North American entrepreneurs are fi nanced through crowdfunding. By contrast, Africa and Asia and Oceania, both at 2%, lag signifi cantly in terms of access to this form of funding.
●
●
●
EXECUTIVE SUMMARY
6 GEM – Global Entrepreneurship Monitor 2016
Informal investor activity
● The average prevalence rate of informal investors among the adult population of the GEM nations reached 3.6% in 2004 and 4.0% in 2006, whereas the median in 2015 reached 4.2%.
● The percentage of early-stage entrepreneurs who received funds from informal investors is highest in Africa (12%) and North America (11%).
● The average amount of funds provided by informal investors shows marked variation across the regions. In Latin America and the Caribbean and Africa, the average amounts provided by informal investors are small (1,510 US$ and 1,520 US$ respectively). Although Europe has the lowest percentage of early-stage entrepreneurs receiving funds from informal investors (6%), these informal investors provide the highest average amounts of funding (12,583 US$).
● In all regions, the majority of informal investors provide funds to close family members, while a substantial percentage provide funds to friends and neighbours. Latin America and the Caribbean leads in both these categories, with 45% of informal investors providing fi nance to close family member and 30% supporting friends/neighbours.
● Informal investors in Asia and Oceania, and Latin America and the Caribbean show the highest tendency to provide fi nance to other relatives – double the percentage in the other three regions, while North Americans are the most likely
to fund work colleagues. North Americans are also the group most likely to fund strangers – a fi fth of informal investors in North America fall into this category.
● Africa, as a region, has the biggest discrepancy between the average amounts of funding provided by female and male informal investors. Male African informal investors provide 20 times more money than their female counterparts. In Asia and Oceania and Europe, on the other hand, female informal investors provide, on average, more funding than their male counterparts. In Europe, female informal investors provide almost double the amount of money, compared to male investors.
Demographic factors and funding requirements
● Women stated that they needed fewer funds to start a business than men in all economies except Malaysia and Luxembourg. The largest discrepancy between the amounts women and men needed for funding was in Canada – an 8.5 times difference.
● Male entrepreneurs in factor-driven economies stated that they needed 2.8 times, on average, more than women to start a business. For effi ciency- and innovation-driven economies, the multiple was 2.4 times.
● In factor-driven economies, there is a marked spike in the amount needed by 55 to 64 year olds (at almost 17,000 US$, it is about four times more than the average amount needed
EXECUTIVE SUMMARY
SPECIAL TOPIC : FINANCE 7
by entrepreneurs in the other age cohorts). ● Compared to the other two development phases,
entrepreneurs in the innovation-driven economies required substantially more funding to start their businesses across all age groups. The 35 to 44 year olds had the highest funding requirements.
How entrepreneurs use their funding
● Within most of the geographical regions, the economies showed dramatic variation in terms of the amount of finance required for both necessity- and opportunity-driven ventures. North America showed markedly less variation than the other regions, reflecting the strong economic similarities between Canada and the United States.
● On the whole, opportunity-driven entrepreneurs stated that they needed more funds to start their businesses. The highest funding requirements were reported by improvement-driven opportunity (IDO) entrepreneurs (i.e. those seeking to improve their situation, either through increased independence or through increased income, versus maintaining their income).
● Innovation economies lead the way in terms of average amount spent in both agriculture and mining, indicating that they invest in technology and equipment to carry most of the workload. Although factor-driven economies have high levels of activity in agriculture and mining, production is labour-intensive, with a significantly lower spend for both these industry sectors.
● Factor-driven economies do less manufacturing than both efficiency- and innovation-driven economies and entrepreneurs spend, on average, 3,600 US$ to start a business in this sector, compared to an average of just over 11,000 US$ for efficiency-driven economies and an average of 350,000 US$ for innovation-driven entrepreneurs.
● Entrepreneurs in innovation-driven economies spend the most, on average, on transportation, ICT and finance services, since demand is high for the strong infrastructural support that other industries need to function optimally.
● Factor-driven economies’ wholesale and retail distribution systems are rudimentary but active, and entrepreneurs spend 4,600 US$ to start businesses in this sector. Start-ups in administrative services (17,650 US$) and services (15,875 US$) are considerably more costly.
● A consistent finding in this report, as well as the 2004 and 2006 reports on entrepreneurial finance, was that the amount needed to start a business with the intent to grow was the largest amount. The median in 2015 was 35,000
US$, with 22% of the entrepreneurs predicting that they would increase employment by more than five jobs within the next five years.
● The funding requirements of high-growth entrepreneurs in innovation-driven economies are substantially higher than for high-growth entrepreneurs in efficiency- and factor-driven economies. The average amount of funding required by entrepreneurs in innovation-driven economies who anticipate creating six or more jobs are 76,876 US$, compared to 11,854 US$ for efficiency and 7,767 US$ for factor-driven economies.
● High-growth entrepreneurs in innovation-driven economies require almost four times more funding than those who anticipate creating zero to five jobs. The differential is 2.5 and 2.3 in efficiency and factor-driven economies, respectively.
● Latin America and the Caribbean shows the smallest difference in funding requirements between medium to high-growth and low growth entrepreneurs, while North America shows the biggest difference. In North America, entrepreneurs projecting six-plus jobs require seven times more money, on average, than those projecting zero to five jobs, compared to a differential of 2.5 in Latin America and the Caribbean.
● The difference in funding requirements between innovative and non-innovative entrepreneurs in factor- and efficiency-driven economies is minimal. The biggest difference in average amount of money needed is in innovation- driven economies, where innovative entrepreneurs need about 1.5 times more funds to start their businesses than non-innovative entrepreneurs.
● From a regional perspective, innovation levels are highest in North America and lowest in Africa. In Africa, there is no difference in the amount of money required for start-up by innovative compared to non-innovative entrepreneurs, while in North America, innovative entrepreneurs need 1.6 times more funding than non-innovative entrepreneurs.
● For all three phases of economic development, entrepreneurs with 25% or more international revenue require around twice as much money as entrepreneurs with the less than 25% international revenue.
● European entrepreneurs with strong international orientation have the highest funding requirements, followed by North America. Africa is the region with the largest difference in funding needs with respect to degree of internationalisation. Entrepreneurs in Africa with 25% or more international revenue need almost 4.5 times more money, on average, than those with less than 25% international sales.
EXECUTIVE SUMMARY
8 GEM – Global Entrepreneurship Monitor 2016
It is fitting that GEM is revisiting the topic of entrepreneurial financing in 2016 – 10 years after its
previous report on this topic. Not only does 10 years mark an appropriate time for reflection, but the earlier report predated the U.S. financial crisis of 2007/2008, which was followed by a significant global downturn (2008 to 2012). The two previous reports, of 2004 and of 2006, contained data from 34 and 42 nations respectively, whereas the number of reporting countries has increased in this report to 60. The average prevalence rate of informal investors among the adult population of the GEM nations reached 3.6% in 2004 and 4.0% in 2006, whereas the median in 2015 reached 4.2%. Entrepreneurs themselves provided 66% of the start-up capital for their new ventures in 2004, 62% in 2006 and 72% in 2015, indicating a stronger sense
of self-reliance in the present economic climate. For all the GEM nations combined, the average amount needed to start a business was $54 000 in 2004 and $65 000 in 2006. In 2015, the median amount was $13 000. Although the fact that medians were used in 2015, as opposed to average amounts in the previous two reports means that a straight comparison is not possible, this does indicate a willingness among current entrepreneurs to start a business with fewer resources and the capability to do so, thanks to the influence of the internet. A consistent finding in all three reports was that the amount needed to start a business with the intent to grow was the largest amount. The median in 2015 was $35 000, with 22% of the entrepreneurs predicting that they would increase employment by more than five jobs within the next five years.
CHAPTER 1:
INTRODUCTION AND BACKGROUND
SPECIAL TOPIC : FINANCE 9
This recent financial crisis, the worst and longest-lasting of the last 80 years, has had a profound effect on the economic, as well as the entrepreneurial landscape. The recovery has been less robust, more uncertain, and taken longer than many expected. The International Labour Organisation’s World Employment and Social Outlook (WESO) Report 2016 warns that sluggish economic growth has complicated the task of bringing unemployment and underemployment even back to pre-crisis levels in most economies. If current policy responses are maintained, it argues, the outlook is for continued economic weakening – the world economy is projected to grow by only around 3%, significantly less than before the advent of the global crisis, posing significant challenges to enterprises and workers.1 The Global Competitiveness Report 2015/16 notes that one of the most striking ways in which the global financial crisis has created new obstacles for doing business is the increased citing of lack of access to finance as one of the most serious problems for businesses in many economies. Obtaining finance is particularly difficult for small and medium-sized enterprises. The Global Competitiveness Report indicates that in 2015, access to finance was the fourth most pressing concern in advanced economies (up from the seventh ranked problematic factor for doing business in 2007). In developing economies as a group, it was the number one concern in 2015 (up from third in 2007)2.
Entrepreneurial financing has also evolved considerably over the past decade. Many of the previous models of entrepreneurial finance remain relevant today, including informal investment through the founders themselves, as well as borrowing from friends, family, and colleagues. Venture capital (VC) continues to make headlines for hefty investments in promising entrepreneurial firms – but the lion’s share of VC invested is still largely in developed economies with the United States (52%), Europe (11%), Israel (2%) and Canada (1%) claiming a total of 66% of the total VC invested in 2014. An encouraging trend is that China (16%), and India (5%) are claiming more than ever before.3 However, newer financing models, including business
1 International Labour Organisation. World Employment and Social Outlook: Trends
2016/International Labour Office. Geneva: ILO, 2016
2 Schwab, K. and Sala-i-Martín, X. 2015. World Economic Forum: The Global
Competitiveness Report 2015 to 2016. http://www.weforum.org/reports/global-
competitiveness-report-2015-2016
3 Vanham, Peter. (2015). World Economic Forum: Which countries have the most
venture capital investments? https://www.weforum.org/agenda/2015/07/which-
countries-have-the-most-venture-capital-investments/
angels, microfinance, and small business accelerators, have matured considerably over the past 10 years while a brand new model, crowdfunding, has emerged as a popular alternative for financing. This report, therefore, examines the current entrepreneurial financing ecosystem as experienced by GEM’s diverse set of members, who together represent every region of the world and all stages of economic development.
1.1 AN OVERVIEW OF RESEARCH FINDINGS ON CURRENT MODELS OF FINANCING ENTREPRENEURSHIP
Bootstrapping
The term ‘bootstrapping’ is a relatively recent way of describing the oldest model of entrepreneurial finance: self-funding. This means dipping into entrepreneurs’ personal finances and other resources to fund their new business. According to Geoffrey Gregson, Director of the Centre for Entrepreneurship Research at the University of Edinburgh Business School, bootstrapping activities typically include using personal savings and credit cards to access cash, as well as working from home, seeking free advice, using credit from business partners such as customers and suppliers, and leveraging personal networks to save on start-up costs (Gregson, 2014).
Entrepreneurs use the bootstrapping model for various reasons either by choice or by necessity. Some entrepreneurs pursue this model by choice, because by self-funding they do not need to give up ownership stakes or equity if their business succeeds. Other entrepreneurs favour this model because it reduces the risk of securing a large loan from outside funders. This approach has been popularised in books such as The $100 Startup, by Chris Guillebeau, which argues that advances in technology have reduced the cost of starting up a business so that many entrepreneurial projects can now be bootstrapped by choice.
But more often, bootstrapping is born out of necessity when entrepreneurs cannot secure outside funding and have no other choice than to use their own resources. This is especially true for women entrepreneurs who may face unequal treatment from traditional lenders, both in developed and developing countries (World Bank, 2015). These entrepreneurs are forced to use bootstrapping to launch and sustain their businesses, since lending can create stress on cash flows necessary to keep the ventures operating.
INTRODUCTION AND BACKGROUND
10 GEM – Global Entrepreneurship Monitor 2016
Friends, family and colleagues
The impact of informal investment – through friends, family members and colleagues – on entrepreneurship is immense. Since 2012, an average of 6% of GEM member economies’ adult population (i.e. aged 18 to 64) have provided informal investment to an entrepreneur per year, totaling over 1 trillion US$ a year over the period 2012 to 2015. This represents an increase since the 2006 GEM report on financing, which calculated that 4% of GEM member economies’ adult population had provided informal investment, totaling 600 billion US$. (It should be noted that only 42 countries participated in the 2006 GEM year, compared to an average of 66 countries from 2012 to 2015).
Entrepreneurs often use informal funding from friends, family members and colleagues, because they cannot secure formal investment through VC or other outside funding. Unlike bootstrapping, however, entrepreneurs may owe their friends or family members some form of equity or controlling stake in return. With this in mind, Gregson warns that this type of financing can put the entrepreneur in the awkward position of family members or friends expecting to play a major role in the company in return for their investment (Gregson, 2014).
The role of informal investment through friends, family, and colleagues has already started evolving into new forms with the onset of online crowdfunding. In the era of massive social networks that can be tapped by entrepreneurs, it is likely that crowdfunding will increasingly take the place of asking close relations for funding directly. (The crowdfunding model will be discussed in detail later).
Institutionally-support financing
Public funding
Entrepreneurs may occasionally receive “seed” capital through a grant or loan from a government or non-profit organisation such as a university or NGOs. The institution providing the grant or loan may want to spur entrepreneurship generally, or have an interest in promoting a promising new sector. Some sectors, such as cutting-edge medicine, information technology or energy production, have high start-up costs or are exceptionally risky, which make them unattractive to private funders. Enterprises in these sectors can therefore only get off the ground through this form of public or academic financing. Often, in exchange for seed capital, entrepreneurs will agree to either surrender or share in the rights to any commercialised intellectual property with the funding institution (Bussgang, 2014).
It is also increasingly common for government entities to combine with private venture capitalists to fund entrepreneurs. There has been skepticism in the literature and in policy discussions as to whether this helps or hinders entrepreneurship. However, in a study of combined financing in 20 developed and developing countries, Brander, Du, and Hellman (2014) found that markets with more government financing tend to also have more private financing per firm as well as more successful entrepreneurial ‘exits’ via an initial public offering or acquisition.
INTRODUCTION AND BACKGROUND
SPECIAL TOPIC : FINANCE 11
Accelerators
The accelerator model of entrepreneurial finance has become very popular in the United States and is beginning to spread to the rest of the world. Though it is a relatively recent phenomenon, the model borrows from the more established ‘incubator’ model, where an organisation (private or public) typically provides entrepreneurs with funding, business mentorship and office space for a duration of one to five years. Accelerator programmes, by comparison, ‘accelerate’ this process to three to six months, with more emphasis placed on networking with venture capitalists and other successful companies during the programme. Additionally, accelerators feature a ‘Demo Day’ at the end of the programme where entrepreneurs pitch to qualified investors in the hopes of securing more financing for their business. In exchange for this opportunity, entrepreneurs usually give up a small amount of equity, in the range of 6% to 10%, to the sponsoring accelerator (Brookings, 2016).
Despite their fairly recent advent, accelerators have spread rapidly throughout developed and developing countries and have demonstrated success over other forms of financing. It is estimated that there are over 700 accelerator programmes in the United States alone (Brookings, 2016), with the most popular programmes being Y Combinator (founded in 2005) and TechStars (2006). There are hundreds of programmes worldwide as well, including such ambitious programmes as the Vietnam Silicon Valley project, which offers a four-month ‘intensive start-up accelerator’ (VSV, 2016).
Scholars have begun studying the accelerator model, with qualified positive results. Feher and Hochberg (2015) determined that U.S. metropolitan areas containing an accelerator programme experience an overall increase in entrepreneurial investment. Winston-Smith and Hanningan (2015) found that graduates from top accelerators received their next round of financing more quickly and were more likely to be acquired than a comparable set of entrepreneurs financed by angel investors. However, the choice of accelerator programme seems to have a considerable impact on the success of the entrepreneur. A 2012 study from Aziz Gilani, director of venture capital firm DFJ Mercury, found that 45% of a set of 29 North American accelerator programmes that he studied failed to raise funding for any of their graduates. In 2014, Hallen, Bingham, and Cohen found positive benefits (quick financing, high levels of acquisition) for entrepreneurs in top accelerator programmes, but these results dissipated when their sample of accelerators was broadened.
Venture capital
Venture capital (VC) is the term most often associated with financing risky entrepreneurial ventures with potentially high returns. This is in large part due to the attention garnered when entrepreneurs secure sizeable VC investment – especially when that investment pays off. Venture capital firms tend to specialise in areas in which the partners have experience – either industry-specific, or location-based. Although venture capitalists may keep an eye on early stage start-ups, most VC investment comes at a later stage when ventures are positioned for growth (i.e. they tend to be second round financiers). The high visibility of VC in business news, however, may mislead people with respect to the role and relative size of VC within the entrepreneurial ecosystem as a whole. For example, only about 0.16% of small businesses started in the United States receive VC (Gregson, 2014). Additionally, the average age of a business receiving this type of funding is four years (Small Business Association, 2013); start-ups rarely receive VC.
The term venture capital can broadly apply to several entrepreneurial financing models. However, the term is most often used to refer to when a VC fund, managed by an individual or set of decision-makers, uses wealthy investors’ money to identify and finance high-growth new companies. VC funds often make substantial investments in these new companies, ranging from $250,000 to upwards of $100 million, and generally seek a return of 10 times their investment via the company going public or being bought out (Gregson, 2014). In exchange for their investment, VC funds usually expect a 20 to 30% (or higher) share of equity ownership in any funded company (Bussgang, 2014).
Despite the difficulty of accessing VC, the model is seen by many scholars and policy-makers as an essential factor for spurring high-value, innovative companies in their countries. Indeed, VC has financed some of the fastest growing companies in the world, such as Skype, Zappos, Facebook, and Alibaba. The numbers also demonstrate that VC can foster tremendous business opportunity. In 2014, the most recent data available, over 80 billion US$ were invested globally through VC, and made a number of initial public offerings (IPOs) possible for companies in China, India, and Israel, among many others (Ernst & Young, 2015). This explains why many countries are attempting to expand the model. Venture Capital for Africa (VC4A), for example, connects African entrepreneurs to VC funds. In 2015, 24 Nigerian and 19 Kenyan start-ups received VC, among dozens of other start-ups from other African nations (according to VC4A).
INTRODUCTION AND BACKGROUND
12 GEM – Global Entrepreneurship Monitor 2016
Angel investors
Angel investors are high net worth individuals who identify and invest in high quality entrepreneurs in exchange for equity. Angel investors are individuals who may act individually or in groups. Their activity is project by project-area focused. Often, angels are high-worth individuals who have successfully started and operated their own businesses and have skills they may share with entrepreneurs. In a low interest rate environment, angel investing offers an alternative investment strategy for individuals who want to participate because of interest in a particular industry or venture area and have the knowledge to add value.
On the surface, angels may sound similar to VC funds; however, the essential difference is that they do not act on behalf of a group of investors. This frees angels to invest in a broader range of companies that may take longer to grow or may not deliver the high rates of return expected by VC investors. This characteristic of angel investors augments their popular image as investors who may fund an entrepreneur out of personal interest or a sense of social responsibility. Angel investors sometimes fund an entrepreneurial project through its entire growth stage, while others invest just in the early
stages as a bridge to formal venture capital at a later stage. Angels also may group together in a business angel network (BAN) to share resources with other investors.
Determining the size and impact of angel investors is diffi cult, as they are not required to publicly report their activities. However, it is estimated that US angels invested over 24 billion US$ in 73 400 companies in 2014 (Small Business Association, 2014). In Europe, angels are estimated to have invested 5.5 billion euros in almost 3 000 companies in 2013 (EBAN, 2014). Beyond these raw numbers, though, it is diffi culty to calculate the economic impact of angel investing. Research from Mason, Harrison and Botelho (2015) indicates that angel investors have diffi culties obtaining successful exits (IPO or buyout) in their invested company, though they posit that this is because many angels do not adopt an exit-centric investment strategy. Deffains-Crapsky and Klein (2016) note that angels in the United States and Europe play a crucial role as an ‘indispensable’ intermediary between entrepreneurs and formal VC. The authors admit, however, that the role of angels in the development of innovative entrepreneurship is understudied and poorly understood. Clearly, additional research on the impact of angel investors is needed, perhaps in addition to a more robust defi nition on successful funding of entrepreneurship.
INTRODUCTION AND BACKGROUND
SPECIAL TOPIC : FINANCE 13
Microfinance
Microfinance as a model for entrepreneurial finance is a few decades old. Initially, this model involved non-profit and government entities offering uncollateralised loans to impoverished people who would otherwise have no access to finance. As one of the first microfinance organisations, Grameen Bank was founded in Bangladesh by Muhammed Yunus in 1983 as a solution to providing funding opportunities to entrepreneurs in countries where lenders were reluctant to provide funds to entrepreneurs without collateral. The Grameen Foundation, founded in 1997, extended this work to provide microloans to “the poorest of the poor, paving new paths to prosperity.”4 Entrepreneurs are required to repay loans with interest. The foundation has supported entrepreneurial efforts in agriculture, retail trade, and health. Frequently, the focus of the Grameen Foundation is to provide access to funds and a financial network through mobile technology to the underserved entrepreneurs, often women who otherwise would not have access to any financial systems. Working with the Bill and Melinda Gates Foundation and the MTN Group, a leading telecommunications in Africa, the Grameen Foundation is actively working on developing an effective, mobile financial payments system in Uganda. In a project in the Philippines, the foundation is working with CARD Bank to create a mobile banking service.5 The Grameen Foundation is active in 40 countries and has extended operations to include healthcare communication technologies.
Over time, and with advances in technology, individuals (not just governments and non-profits) have also been able to participate in microfinance. This has dramatically increased the size and scope of microfinance, and it is estimated that more than 3 500 institutions now serve over 200 million clients worldwide (Sabin, 2016). New financial products have emerged under the umbrella of microfinance, including microsaving and microinsurance. Today, the term microfinance encompasses several entrepreneurial finance activities that have evolved from its original intent.
The majority of microfinance recipients reside in Asia and the Pacific, where almost 120 million families access
4 Grameen Foundation Annual Report 2014-2015 When Micro Goes Mobile. http://
www.grameenfoundation.org/sites/default/files/Grameen_Foundation_2014-2015_
Annual_Report.pdf
5 http://www.grameenfoundation.org/what-we-do/financial-services/mobile-financial-
services
microfinance. In Africa and the Middle East, on the other hand, fewer than 10 million families access microfinance. Three types of institutions provide the vast majority (almost 90%) of microfinance loans (Sabin, 2016):
● Traditional, state-run banks. ● Non-bank financial institutions, which operate similarly
to a bank, but often have lower capital requirements and restricted service offerings.
● NGOs, which include non-profits and charities, and are not regulated like a banking service.
Kiva is an example of a popular non-profit that allows individuals to provide microfinance loans to low-income individuals and entrepreneurs – often residing in developing countries. Each microfinance institution has its own criteria for evaluating loans. However, the most common criteria include whether the loan is for an individual or group (a group spreads the risk and increases the likelihood of repayment), how often the loan will be repaid (in installments or a lump sum), and if the loan will be a one-time payment or a gradual, ‘dynamic’ loan over time.
The increase in the aggregate of loan dollars and clients served has for years been heralded as success stories; however, recently scholars have begun to adopt a more nuanced view of the topic. Murdoch (2011) found that while microfinance programmes haven’t revolutionised the lives of impoverished people, they have helped to ease cash flow issues in poor households, helping them manage risk and stabilising their finances. In a major study conducted in six developing economies by Banerjee et al. (2015), microfinance was used in conjunction with skill training, home visits and counseling; access to a savings account; and health education to evaluate the efficacy of a major poverty intervention. The results of the randomised controlled tests found that subjects who received this holistic treatment, include: microfinance, experienced significant positive results in the areas of income, food security, living conditions, and mental health.
The capacity of microfinance to achieve broader social goals beyond monetary aspects is also an important consideration. Women, who often face steep if not impossible barriers to obtaining finance in developing countries, now have the ability to fund their business, thanks to microfinance. This does not just benefit the women themselves. Evidence shows that microfinance institutions favour lending to women in countries where overall trust is low. The institutions see women as more trustworthy and as having greater social impact (Aggrarwal, Goodell, and Selleck, 2015).
INTRODUCTION AND BACKGROUND
14 GEM – Global Entrepreneurship Monitor 2016
Peer-to-peer lending
Peer-to-peer (P2P) lending is a recent fi nancing model akin to microfi nance. The model offers individuals with limited access to traditional fi nance the opportunity to get uncollateralised loans directly from their peers. Where they differ is that P2P loans are focused almost entirely on profi t, and involve a more rigorous screening process based on the recipient’s credit history and other relevant criteria. Loans are expected to be repaid with interest relatively quickly; equity or other ownership arrangements are not considered. Because this model favours individuals with a strong credit history, it is more established in developed countries, although it is gradually spreading to developing countries as well (Xusheng, 2014). It should also be noted that P2P lending is effectively ‘purpose-agnostic’ – entrepreneurs may use a P2P loan to fi nance their business, though evidence suggests that P2P networks are more often used to underwrite consumer debt or for other purposes (Bruton et al., 2015).
The current market of P2P lending is relatively small in the entrepreneurial finance ecosystem, compared to other models. LendingClub and Prosper, by far the two largest P2P networks in the United States, together created about 10 billion US$ in loans in 2015, of which only a fraction applied to entrepreneurs (NSRInvest, 2016). However, since 2010 the volume of loans has almost doubled every year, and traditional banks are starting to debate how they can either compete with or join these networks (PWC, 2015). Data is scant on the relative success of P2P lending for entrepreneurship; however, there are likely to be further studies as the model grows in volume and importance as an alternative form of entrepreneurial financing.
Crowdfunding
Crowdfunding is the newest viable model for entrepreneurial financing. It is broadly similar to microfinance or P2P lending in the use of peer financing; however, it is almost entirely focused on entrepreneurial projects, while offering alternative repayment and equity arrangements. In this model, entrepreneurs pitch their projects to prospective lenders through an online platform, such as Kickstarter or Indiegogo, with a specific goal for how much funding they need to achieve their project. There is also considerable flexibility within the crowdfunding model with respect to how entrepreneurs can finance their projects, as well as compensate their investors.
Entrepreneurs often choose between an ‘all or nothing’ or ‘keep what you get’ model for financing their projects. The ‘all or nothing’ model means the entrepreneur will return the investors’ money unless they receive all the money needed for their goal; while the ‘keep what you get’ model means the entrepreneurs keep all the money they get, regardless of whether they meet their goal. Perhaps not surprisingly, the ‘all or nothing’ model has been found to attract more investors and more capital (Wash and Solomon, 2014). Entrepreneurs also must decide how they will compensate their investors: through rewards or equity. Rewards are tokens of appreciation given to investors, usually in the form of a personalised product. There are innumerable types of rewards, but they could range from a piece of clothing from a funded designer, a personalised song, or a fancy colouring book. Equity stakes are rare among crowdfunded projects. Currently, the major online platforms, Kickstarter and Indiegogo, do not offer any projects with equity stakes. In fact, in many countries, including the entire European Union, issuing shares through crowdfunding is illegal (Moritz and Block, 2014). In the United States, however, Title III of the 2012 Jumpstart Our Business Startups (JOBS) Act, approved in late 2015, allows lower income investors (under 100,000 US$ in annual income) to invest up to 2 000 US$ or 5% of their income in a small business in exchange for equity. Investors making over 100,000 US$ in income can invest up to 10% of their income.
Studies indicate that entrepreneurs like the crowdfunding model for three reasons. First and foremost, it provides a viable alternative for collecting funds. It also offers entrepreneurs public attention for themselves and their products. Finally, it allows entrepreneurs to gain immediate feedback on their products, which can be incorporated into future iterations (Belleflamme et al. 2014). Similarly, Mollick and Kuppuswany (2014) found that crowdfunding facilitates more direct interaction with customers and more press coverage.
Crowdfunding also holds promise for addressing the gender inequities of traditional fi nance. Women entrepreneurs, in both the developed and developing world, are highly underserved by traditional fi nance, often for reasons of societal barriers or a lack of business connections in male-dominated industries. However, a recent study from Marom, Robb, and Sade (2016) found that 35% of founders on Kickstarter were women, as were 44% of investors on that platform.
INTRODUCTION AND BACKGROUND
SPECIAL TOPIC : FINANCE 15
1.2 KEY TRENDS AFFECTING ENTREPRENEURIAL ECOSYSTEMS
1.2.1 Globalisation and technology
Business is increasingly global. As the awareness of who has access to resources is growing, stakeholders are exploring ways to increase the types of fi nancing available in all economies. While traditional forms of entrepreneurial fi nance such as self-funding and borrowing from friends and family continue, other fi nancing sources such as peer-to-peer lending, including crowdfunding, microfi nance, and community co-operatives’ lending practices, have increased. There is an increasing
acknowledgement that there are a number of ways to create economic and social value in the entrepreneurial ecosystem – for example investing, lending, connecting, and sharing skills.
Positive developments such as the rapid diffusion of information and communication technologies (ICTs), giving rise to new business models and revolutionising industries, bear great promise for a future wave of innovations that could drive longer-term growth. In particular, technology enables the digital and mobile economy. The concept of the ‘marketplace’ is being redefi ned by mobile technology, creating online access to goods and services. Entrepreneurs are building platforms to enable trade, such as totally-online businesses, auction sites, and digital meeting places designed to match buyers and sellers for employment opportunities, real estate, fi nancing, etc. The Internet of Things (IoT) has had an immense impact on entrepreneurial ecosystems, facilitating access to entrepreneurial education, understanding of business opportunities and markets, awareness of economic and social value creating activities, communication with customers and business partners, links to resources, and fi nancing methods.
A key infl uence is the increasing migration of ideas and people – through mobile communication and searches, individuals can readily reference and make comparisons about the opportunities and resources available in other economies. Ideas for ventures that work well in one economy can be transplanted to another economy, while individuals with skills and ability move to areas which they perceive as rewarding entrepreneurial behaviour. There has been a change in mindset from the concept of ‘you live where you were born’ to a desire to live where the opportunities for a better life are more prevalent. High-impact and innovative entrepreneurs, in particular, are likely to be highly mobile.
1.2.2 Social influences
A number of social and demographic factors are having an impact on the entrepreneurial ecosystem.
Millennials have come of age and are looking for employment at a time when the persistent impact of the global economic crisis has exacerbated the diffi culty that new entrants into the labour market have in fi nding a job, and youth unemployment has become a signifi cant concern worldwide. The ILO World Employment and Social Outlook (WESO) Report 2015 noted that the youth unemployment rate reached 13.0%, which is almost three times higher than the unemployment rate for adults. To make matters worse, the ILO predicted that between 2014 and 2019, youth unemployment will rise by up to 8%
buyers and sellers for employment opportunities, real estate, fi nancing, etc. The Internet of Things (IoT) has had an immense impact on entrepreneurial ecosystems, facilitating access to entrepreneurial education, understanding of business opportunities and markets, awareness of economic and social value creating activities, communication with customers and business partners, links to resources, and fi nancing methods.
A key infl uence is the increasing migration of ideas and people – through mobile communication and searches, individuals can readily reference and make comparisons about the opportunities and resources available in other economies. Ideas for ventures that work well in one economy can be transplanted to another economy, while individuals with skills and ability move to areas which they perceive as rewarding entrepreneurial behaviour. There has been a change in mindset from the concept of ‘you live where you were born’ to a desire to live where the opportunities for a better life are more prevalent. High-impact and innovative entrepreneurs, in particular, are likely to be highly mobile.
1.2.2 Social influences
A number of social and demographic factors are having an impact on the entrepreneurial ecosystem.
Millennials have come of age and are looking for employment at a time when the persistent impact of the global economic crisis has exacerbated the diffi culty that new entrants into the labour market have in fi nding a job, and youth unemployment has become a signifi cant concern worldwide. The ILO Employment and Social Outlook (WESO) Report 2015 that the youth unemployment rate reached 13.0%, which is almost three times higher than the unemployment rate for adults. To make matters worse, the ILO predicted that between 2014 and 2019, youth unemployment will rise by up to 8%
INTRODUCTION AND BACKGROUND
16 GEM – Global Entrepreneurship Monitor 2016
in parts of Europe, South America and Africa6. Many young people are, therefore, likely to turn to creating ventures as a means of employment. At the same time, an increasing number of people in the 60+ age group expect a long life and longer active working career. They either want or need income, and are remaining part of the workforce well past offi cial retirement age. These senior members of the workforce have skills gained from a lifetime of career experience which they employ as entrepreneurs and/or mentors.
Worldwide, more people are actively engaged in both social as well as economic interests through entrepreneurship (entrepreneurs and other stakeholders including investors, customers, and business partners – suppliers and designers). In the wake of the global fi nancial crisis, it has become increasingly important for policy-makers, business and civil
6 International Labour Organisation. World Employment and Social Outlook: Trends
2015/International Labour Office. Geneva: ILO, 2015
society leaders to work together and to focus on inclusive and sustainable growth – the creation of enabling environments that foster innovation, facilitate more productive economies and, critically, open up new and better job opportunities for all segments of the population. This is refl ected in the increased infl uence of governments, educational institutions and corporations on the activities of the innovation community, through policy changes, online tools, accelerators and incubators. Groups of angels, venture capitalists, and serial entrepreneurs are becoming more willing to invest in entrepreneurial ventures, including providing seed capital for early-stage entrepreneurial ventures.
Of increasing significance is the link between global violence and entrepreneurial opportunities. There is strong evidence to suggest a correlation between violence, instability, and a lack of economic opportunities. Failure to make available economic opportunities to disenfranchised youth in economies where governments have faulty infrastructure, including corruption, offers little incentive to youth to work
INTRODUCTION AND BACKGROUND
SPECIAL TOPIC : FINANCE 17
within the economic system to better their lives. High un- and underemployment rates make societies more vulnerable to civil disorder and political upheaval. The ILO’s World Economic and Social Outlook Report 2015 estimates that social unrest has increased as joblessness persists and, worldwide, currently sits at 10% higher than before the financial crisis. Economies facing high or rapidly rising youth unemployment (particularly among the male youth) are especially vulnerable to social unrest. This is compounded where educated young people cannot find satisfactory employment opportunities – as is the case in many Middle Eastern and North African countries7. In those economies where the median age is low and the economic uncertainty is high, little good can result from continuing this situation. Rather, as globalisation increases and economies are more connected, the well-being and hopes for the future of the youth become critically important. All young people want to see a future for themselves. Entrepreneurial opportunities are a significant part of the constructive path to economic health for youth all over the world, but in particular in developing economies. It may fall to the world to find ways to foster entrepreneurial efforts in these economies as a means to support global peace by offering every youth a path to a bright economic future.
1.2.3 Changes to financial instruments and the economic environment
In the wake of the global economic crisis, many economies have acknowledged the need for a shift in economic and employment policies, noting that a policy focus on quantity and quality of jobs and tackling income inequality is paramount. As a result, more governments are recognising and extolling the virtues of entrepreneurship as a growth engine of the economy and creator of jobs. Many people who experienced the recession also feel an increased need for independence. This results in necessity entrepreneurs gearing up their efforts to create work, while innovation entrepreneurs seek control over their own destiny. As economies start to shrug off the effects of the global recession, customers are becoming more active in buying leading to increasing demand. Low interest rates are affecting entrepreneurs’ borrowing capability, but also affecting the investment activities of stakeholders such as investors and corporations.
7 Ibid
A number of key trends affect the sources and usage of entrepreneurial funding. Special programmes linked to financial institutions have been developed, for example the Small Business Administration (SBA) in the United States, that foster entrepreneurial efforts through education and special or targeted financial programmes (veterans, women, diversity candidates). There has been continued growth of the microfinance industry, while new and developing peer-to-peer lending efforts through crowdfunding have evolved.
An exciting development is mobile payments, which provide momentum for both local and global economic activity. These allow for more secure transfer of funds – although we hear about the exceptions to security, the amount of funds being transferred for investing or transacting globally has steadily increased. As described above, the Grameen Foundation is active in the mobile payments infrastructure in many countries such as Uganda and the Philippines. Another example of mobile payments is M-Pesa8. A payments system built on the mobile communications (phone) infrastructure, enabling more entrepreneurs to enter the entrepreneurial ecosystem, M-Pesa is currently available in Kenya, Tanzania, Afghanistan, Mozambique, Egypt, Democratic Republic of Congo, India, Lesotho, Romania, Albania and Ghana. Active customers of M-Pesa increased by 27.1% to 25.3 million in the year ended 31 March 2016, boosted by market launches in Albania and Ghana and supported by a network of more than 261 000 agents in 11 M-Pesa countries.9
M-Pesa supports a financial system for depositing, withdrawing and transferring funds, and making payments for products and services.10 It allows entrepreneurs to take the travel time that they once spent to get to a physical payment system (local post office, bank, etc.) out of their work day, so they can focus more on building their business models. The key impact is a much more robust infrastructure in which entrepreneurs can transact with customers, pay suppliers, and save currency for future growth. Mobile payments systems are more effective in economies where banking operations are minimal (the South African launch of M-Pesa, for example, has been reduced by the presence of a banking system that offers other options for payments systems)11.
8 ‘M-Pesa’ comes from M for Mobile and Pesa, the Swahili word for money
9 http://www.vodafone.com/content/index/media/vodafone-group-releases/2016/
mpesa-25million.html
10 http://www.mit.edu/~tavneet/M-PESA.pdf
11 http://www.cgap.org/blog/10-things-you-thought-you-knew-about-m-pesa
INTRODUCTION AND BACKGROUND
18 GEM – Global Entrepreneurship Monitor 2016
By crafting several interventions aimed at both the banking and the non-banking systems, the Malaysian
government has been able to ensure that SMMEs have relatively good access to finance.
As a share of loans, SMME financing increased from 30% to over 41% of total outstanding business financing between 1999 and 2011.1 Today, the country is ranked by the World Bank and others as one of the world’s leading countries when it comes to access to finance.2
1 SMME Masterplan 2012 to 2020: (http://www.smecorp.gov.my/vn2/node/190)
2 Malaysia was ranked second by the World Economic Forum for ‘Ease of Access to
Loans’ and second for venture capital availability (Global Competitiveness Reports
2014 and 2015) and ranked at 23 by the World Bank on ‘Getting Credit’ (Doing
Business 2015) .
Population: 30.3 million (2014)
GDP: 326,9 billion US$ (PPP 2014)
GDP per capita: 10,804 US$ (PPP 2014)
GEM TEA rate: 5.9% (2014)2.9% (2015)
SMME contribution to GDP:33% (2013)
A number of changes – such as increased support for venture capital, angel investing and the expansion of credit guarantees – followed the introduction of the Financial Sector Master Plan3 in 2001, which aimed to develop a resilient, diversified and efficient financial sector. Some of the changes implemented also helped to reduce the impact the 2008 Global Financial Crisis had on Malaysia and ensured that SMME financing expanded by 6% from 2007 to September 2009.4
Over the years, the Malaysian government has carried out several initiatives to improve SMMEs’ access to credit.
3 Bank Negara Malaysia, 2001 Financial Sector Masterplan. (http://www.bnm.gov.my/
index.php?ch=en_publication_catalogue&pg=en_publication_blueprint&ac=19&lang=
en&eId=box1)
4 Bin Ibrahim, M, 2011. The impact of the global crisis on Malaysia’s financial system.
http://www.bis.org/publ/bppdf/bispap54p.pdf
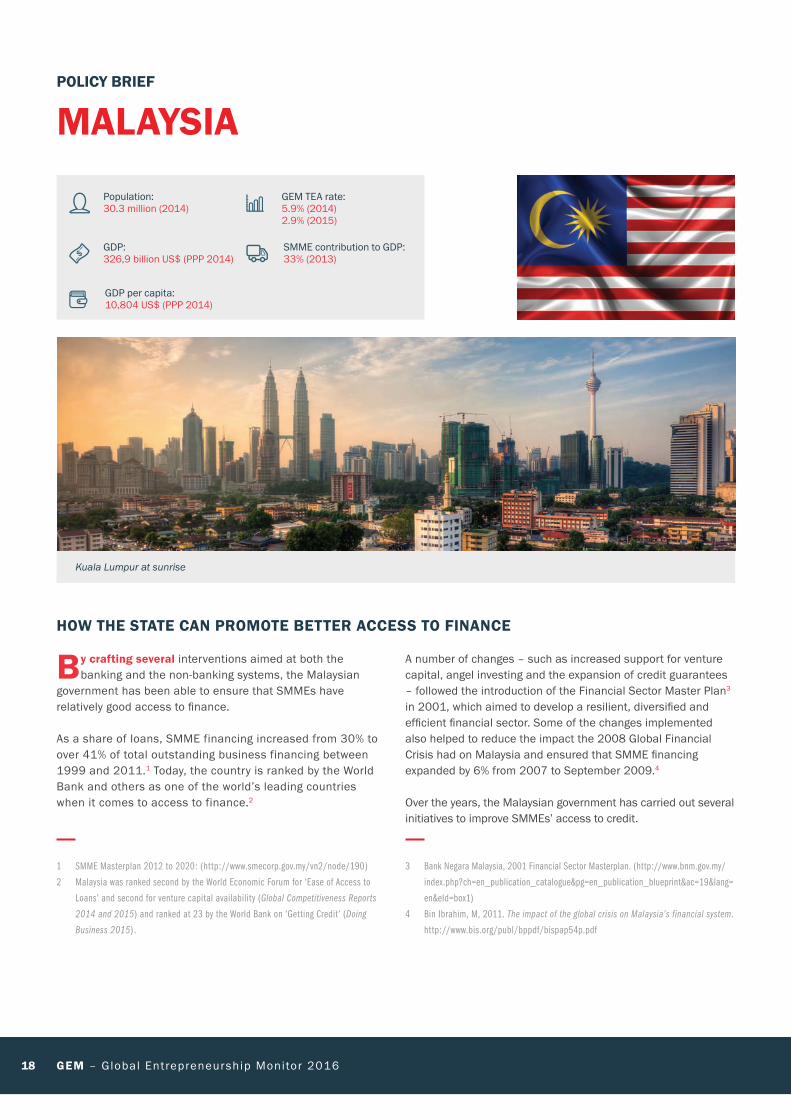
Kuala Lumpur at sunrise
POLICY BRIEF
MALAYSIA
HOW THE STATE CAN PROMOTE BETTER ACCESS TO FINANCE
SPECIAL TOPIC : FINANCE 19
These include: ● The setting up of a credit guarantee scheme (CGC) by the
Reserve Bank in which banks were initially mandated via legislation to meet minimum targets of net credit lent to SMMEs (between 3% and 12% of net lending). Between its inception in 1972 and 2012, CGC guaranteed more than 420 000 loans worth 51 billion ringgits (11,7 billion US$). The scheme has been successful in that 100 000 of the 450 000 borrowers who have used the scheme since its inception no longer have to depend on guarantee finance when they want to access finance.5
● The introduction in 2001 of the Central Credit Reference Information System (CCRIS), a credit reporting system. Subsequent to its introduction, loans to SMMEs grew by almost 9% to 2012, while impairments had fallen from 16% to 2%.6
● The establishment of the SMME Credit Bureau by CGC in 2008 to assist SMMEs to enhance their credit standing, in order to facilitate easier access to financing. By the end of 2012 the bureau had issued over 800 000 credit reports and rated over 400 000 SMMEs.7
● Partnering with the private sector to promote venture capital (VC) investments. Between 2001 and 2012 the state, through Malaysia Venture Capital Management (one of five state VC funds), contributed 450 million ringgits to 11 private sector venture capital funds. These funds have sourced a further 205.5 million ringgits.8
● Promoting angel investing through an angel tax incentive (which offers high net worth individuals that invest in Malaysia tech start-ups a tax deduction of up to 500,000 ringgits9), setting up a government seed fund run by Cradle Fund to help commercialise new ideas (which has helped fund 700 firms since 20031010) and through the state helping to set up angel investment networks (beginning in 2008).
5 Small Business Insight. 23 April 2015. Get banks to take a share in guarantee fund.
http://www.smallbusinessinsight.org/blog/get-banks-to-take-a-share-in-guarantee-
fund
6 Bernama, 9 November 2012, BNM. Credit info sharing has spurred loan growth, The
Malaysian Insider. http://www.themalaysianinsider.com/business/article/bnm-
credit-info-sharing-has-spurred-loan-growth
7 Small Business Insight, Get banks to take a share in guarantee fund, 23 April 2015.
http://www.smallbusinessinsight.org/blog/get-banks-to-take-a-share-in-guarantee-fund
8 Timm, S. 2012. Trade and Industrial Policy Strategies.
9 For more details on the incentive see www.mban.com.my
10 Cradle Fund news release. http://www.cradle.com.my/news/cradle-doubles-co-
investment-value-to-hit-rm56-7mil-mark/
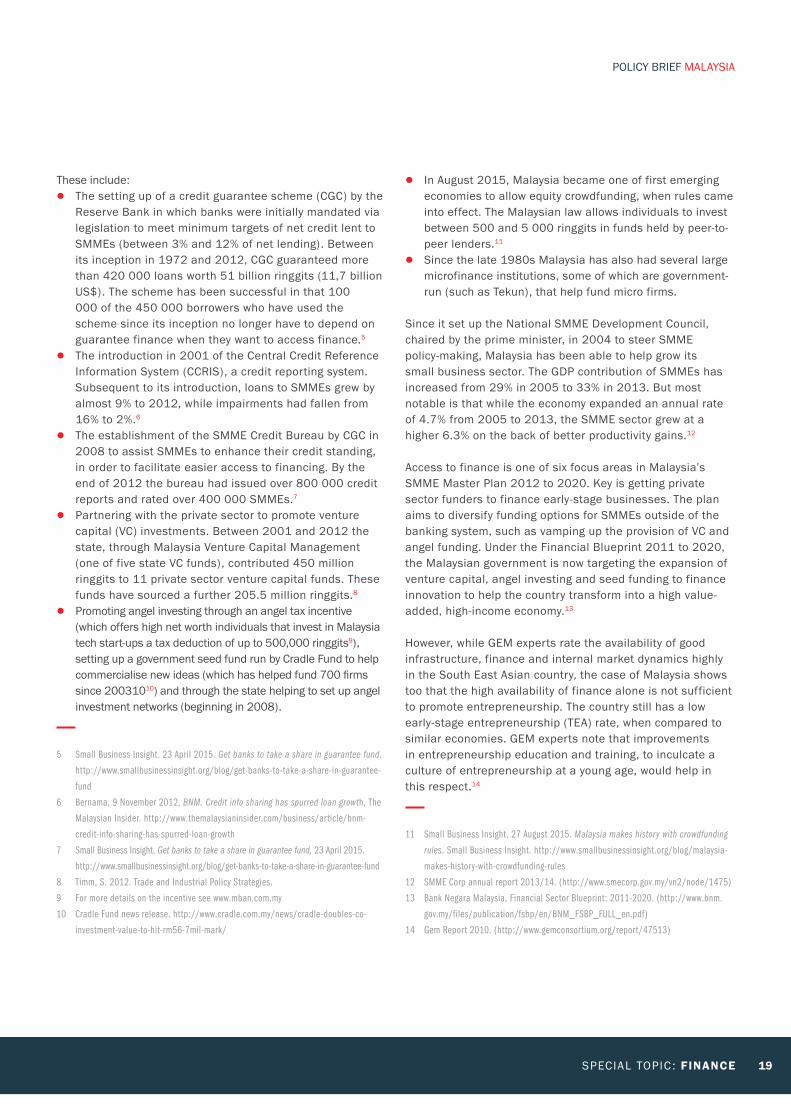
● In August 2015, Malaysia became one of first emerging economies to allow equity crowdfunding, when rules came into effect. The Malaysian law allows individuals to invest between 500 and 5 000 ringgits in funds held by peer-to-peer lenders.11
● Since the late 1980s Malaysia has also had several large microfinance institutions, some of which are government-run (such as Tekun), that help fund micro firms.
Since it set up the National SMME Development Council, chaired by the prime minister, in 2004 to steer SMME policy-making, Malaysia has been able to help grow its small business sector. The GDP contribution of SMMEs has increased from 29% in 2005 to 33% in 2013. But most notable is that while the economy expanded an annual rate of 4.7% from 2005 to 2013, the SMME sector grew at a higher 6.3% on the back of better productivity gains.12
Access to finance is one of six focus areas in Malaysia’s SMME Master Plan 2012 to 2020. Key is getting private sector funders to finance early-stage businesses. The plan aims to diversify funding options for SMMEs outside of the banking system, such as vamping up the provision of VC and angel funding. Under the Financial Blueprint 2011 to 2020, the Malaysian government is now targeting the expansion of venture capital, angel investing and seed funding to finance innovation to help the country transform into a high value-added, high-income economy.13
However, while GEM experts rate the availability of good infrastructure, finance and internal market dynamics highly in the South East Asian country, the case of Malaysia shows too that the high availability of finance alone is not sufficient to promote entrepreneurship. The country still has a low early-stage entrepreneurship (TEA) rate, when compared to similar economies. GEM experts note that improvements in entrepreneurship education and training, to inculcate a culture of entrepreneurship at a young age, would help in this respect.14
11 Small Business Insight. 27 August 2015. Malaysia makes history with crowdfunding
rules. Small Business Insight. http://www.smallbusinessinsight.org/blog/malaysia-
makes-history-with-crowdfunding-rules
12 SMME Corp annual report 2013/14. (http://www.smecorp.gov.my/vn2/node/1475)
13 Bank Negara Malaysia, Financial Sector Blueprint: 2011-2020. (http://www.bnm.
gov.my/files/publication/fsbp/en/BNM_FSBP_FULL_en.pdf)
14 Gem Report 2010. (http://www.gemconsortium.org/report/47513)
POLICY BRIEF MALAYSIA
20 GEM – Global Entrepreneurship Monitor 2016
This chapter analyses the GEM 2015 findings on entrepreneurial finance. A key focus is to develop an
understanding of the current entrepreneurial financing ecosystem as experienced by GEM’s diverse set of economy members, and to highlight regional, as well as economic development phase trends in terms of sources and usage of entrepreneurial finance. Data tables on the indicators for all the economies in this report, arranged by geographical region, are included in Appendix 1.
In the seventeen years since its inception, GEM has measured entrepreneurship in over 100 countries, covering all geographic regions and all economic levels, and has gained widespread recognition as the most informative and authoritative longitudinal study of entrepreneurship in the world. In 2015, 60 economies participated in the GEM Adult Population Survey (APS),
comprising approximately 75% of the world’s population and 90% of the world’s total GDP. The economies that participated in the 2015 GEM cycle are shown in Table 1, grouped according to geographic region and economic development level. Classification of economies by economic development level is adapted from the World Economic Forum (WEF). According to WEF’s classification, the factor-driven phase is dominated by subsistence agriculture and extraction businesses, with a heavy reliance on (unskilled) labour and natural resources. In the efficiency-driven phase, an economy has become more competitive with further development accompanied by industrialisation and an increased reliance on economies of scale, with capital-intensive large organisations more dominant. As development advances into the innovation-driven phase, businesses are more knowledge-intensive, and the service sector expands (http://weforum.org).
CHAPTER 2:
A GLOBAL PERSPECTIVE ON ENTREPRENEURIAL FINANCE
SPECIAL TOPIC : FINANCE 21
2.1 HOW MUCH MONEY DO EARLY-STAGE (TEA) ENTREPRENEURS1 NEED TO START A BUSINESS
Securing sufficient funding is an important resource for every business, especially for start-ups and for growing firms. New entrepreneurs generally rely on personal funding, as well as funding from family and friends, and pursue bank and investor funding at more advanced stages of the start-up process.
Entrepreneurs were asked to indicate how much money, in total, they required to start their businesses. There are stages of entrepreneurial development as the entrepreneurial ecosystems become established. Entrepreneurs and policy-makers go up a learning curve with respect to how most effectively and efficiently to invest in entrepreneurial efforts.
In looking at the wide distribution of amounts in figure one ‘How much money to start’, we see a low average of 869 US$ in the Philippines and a high of 15,410 893 US$ in Switzerland, with
1 A primary measure of entrepreneurship used by GEM is the Total Early-Stage
Entrepreneurial Activity (TEA) rate. TEA indicates the prevalence of individuals
engaged in nascent entrepreneurship and new firm ownership in the adult (18 to 64
years of age) population. Nascent entrepreneurs are those who have taken steps to
start a new business, but have not yet paid salaries or wages for more than three
months. New entrepreneurs are running new businesses that have been in operation
for between three and 42 months (i.e. 3.5 years) .
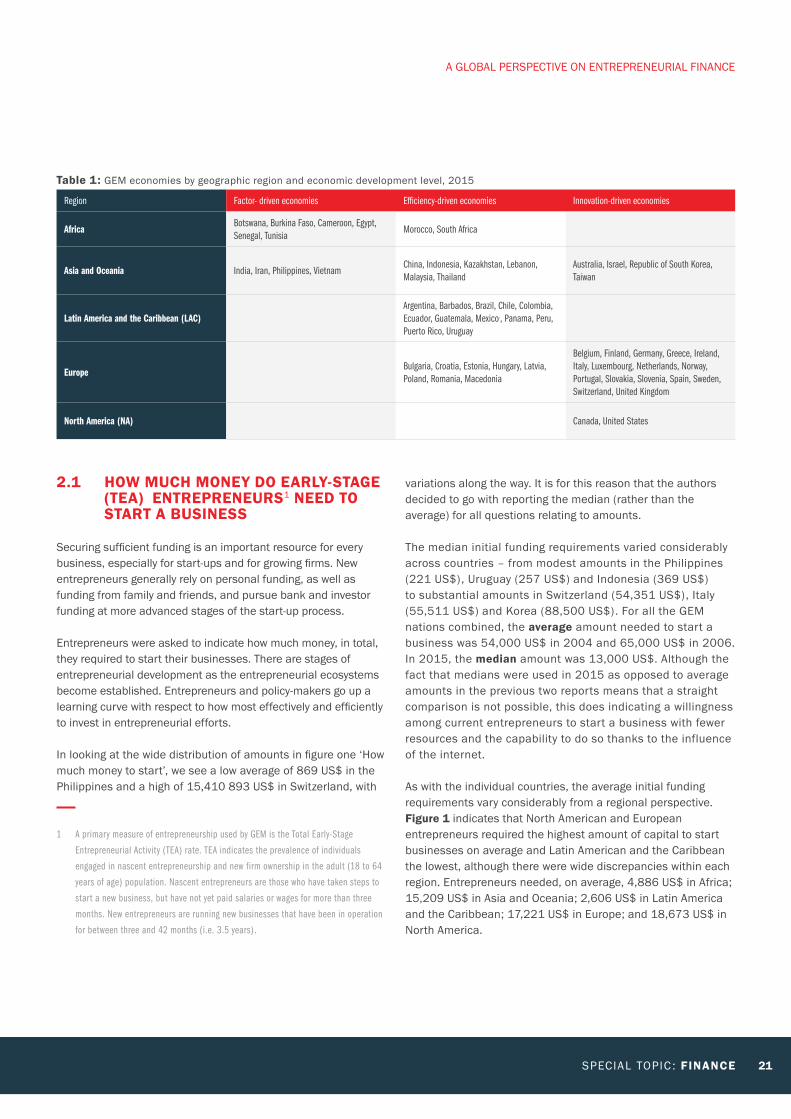
Table 1: GEM economies by geographic region and economic development level, 2015
Region Factor- driven economies Efficiency-driven economies Innovation-driven economies
AfricaBotswana, Burkina Faso, Cameroon, Egypt, Senegal, Tunisia
Morocco, South Africa
Asia and Oceania India, Iran, Philippines, Vietnam China, Indonesia, Kazakhstan, Lebanon, Malaysia, Thailand
Australia, Israel, Republic of South Korea, Taiwan
Latin America and the Caribbean (LAC)Argentina, Barbados, Brazil, Chile, Colombia, Ecuador, Guatemala, Mexico., Panama, Peru, Puerto Rico, Uruguay
Europe Bulgaria, Croatia, Estonia, Hungary, Latvia, Poland, Romania, Macedonia
Belgium, Finland, Germany, Greece, Ireland, Italy, Luxembourg, Netherlands, Norway, Portugal, Slovakia, Slovenia, Spain, Sweden, Switzerland, United Kingdom
North America (NA) Canada, United States
variations along the way. It is for this reason that the authors decided to go with reporting the median (rather than the average) for all questions relating to amounts.
The median initial funding requirements varied considerably across countries – from modest amounts in the Philippines (221 US$), Uruguay (257 US$) and Indonesia (369 US$) to substantial amounts in Switzerland (54,351 US$), Italy (55,511 US$) and Korea (88,500 US$). For all the GEM nations combined, the average amount needed to start a business was 54,000 US$ in 2004 and 65,000 US$ in 2006. In 2015, the median amount was 13,000 US$. Although the fact that medians were used in 2015 as opposed to average amounts in the previous two reports means that a straight comparison is not possible, this does indicating a willingness among current entrepreneurs to start a business with fewer resources and the capability to do so thanks to the influence of the internet.
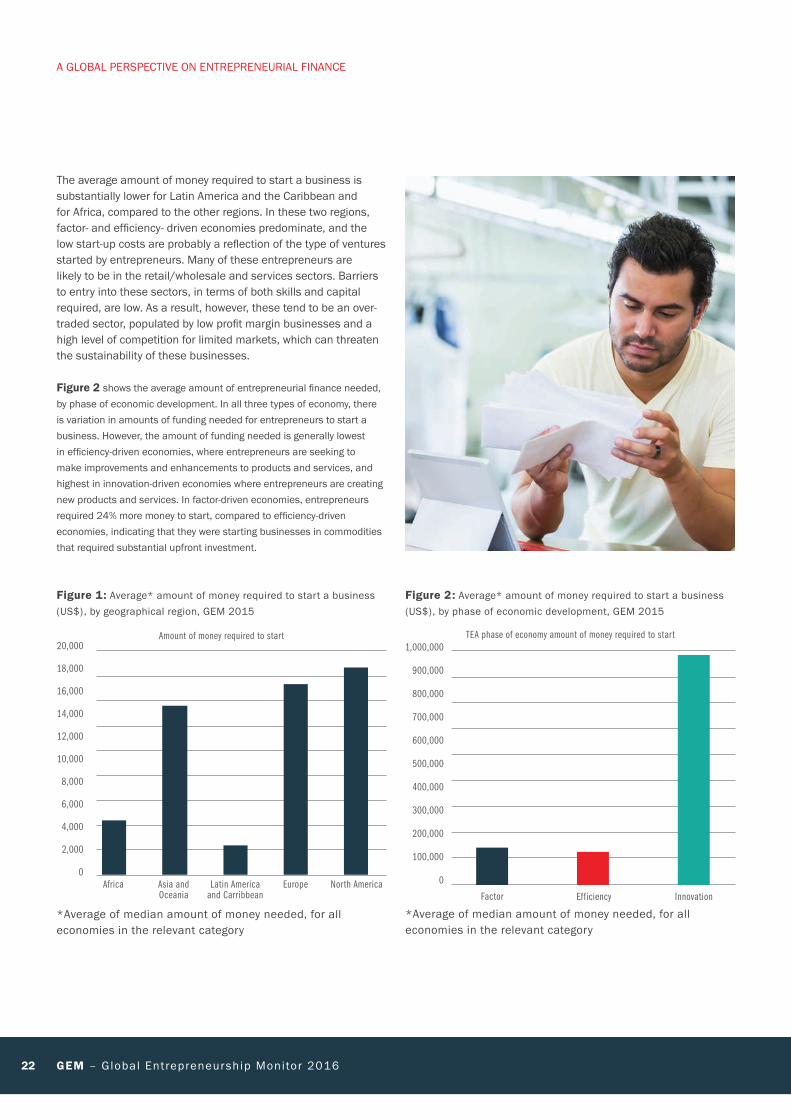
As with the individual countries, the average initial funding requirements vary considerably from a regional perspective. Figure 1 indicates that North American and European entrepreneurs required the highest amount of capital to start businesses on average and Latin American and the Caribbean the lowest, although there were wide discrepancies within each region. Entrepreneurs needed, on average, 4,886 US$ in Africa; 15,209 US$ in Asia and Oceania; 2,606 US$ in Latin America and the Caribbean; 17,221 US$ in Europe; and 18,673 US$ in North America.
A GLOBAL PERSPECTIVE ON ENTREPRENEURIAL FINANCE
22 GEM – Global Entrepreneurship Monitor 2016
The average amount of money required to start a business is substantially lower for Latin America and the Caribbean and for Africa, compared to the other regions. In these two regions, factor- and efficiency- driven economies predominate, and the low start-up costs are probably a reflection of the type of ventures started by entrepreneurs. Many of these entrepreneurs are likely to be in the retail/wholesale and services sectors. Barriers to entry into these sectors, in terms of both skills and capital required, are low. As a result, however, these tend to be an over-traded sector, populated by low profit margin businesses and a high level of competition for limited markets, which can threaten the sustainability of these businesses.
Figure 2 shows the average amount of entrepreneurial finance needed, by phase of economic development. In all three types of economy, there is variation in amounts of funding needed for entrepreneurs to start a business. However, the amount of funding needed is generally lowest in efficiency-driven economies, where entrepreneurs are seeking to make improvements and enhancements to products and services, and highest in innovation-driven economies where entrepreneurs are creating new products and services. In factor-driven economies, entrepreneurs required 24% more money to start, compared to efficiency-driven economies, indicating that they were starting businesses in commodities that required substantial upfront investment.
Factor Efficiency Innovation
1,000,000
900,000
800,000
700,000
600,000
500,000
400,000
300,000
200,000
100,000
0
TEA phase of economy amount of money required to start
Figure 2: Average* amount of money required to start a business (US$), by phase of economic development, GEM 2015
*Average of median amount of money needed, for all economies in the relevant category
20,000
18,000
16,000
14,000
12,000
10,000
8,000
6,000
4,000
2,000
0Africa Asia and
OceaniaEuropeLatin America
and CarribbeanNorth America
Amount of money required to start
Figure 1: Average* amount of money required to start a business (US$), by geographical region, GEM 2015
*Average of median amount of money needed, for all economies in the relevant category
A GLOBAL PERSPECTIVE ON ENTREPRENEURIAL FINANCE

SPECIAL TOPIC : FINANCE 23
100%
90%
80%
70%
60%
50%
40%
30%
20%
10%
0%
100%
90%
80%
70%
60%
50%
40%
30%
20%
10%
0%
Bots
wana
Africa Asia and Oceania
Latin America and Caribbean NA
Europe
Europe
Burk
ina
Faso
Cam
eroo
n
Eqyp
t
Mor
occo
Sene
gal
Sout
h Af
rica
Tuni
sia
Aust
ralia
Chin
a
Indi
a
Indo
nesi
a
Iran
Isra
el
Kore
a
Leba
non
Mal
aysi
a
Phili
ppin
es
Taiw
an
Thai
land
Viet
nam
Belg
ium
Bulg
aria
Croa
tia
Esto
nia
Finl
and
Germ
any
Gree
ce
Hung
ary
Irela
nd
Italy
Kaza
khst
an
Latv
ia
Luxe
mbo
urg
Mac
edon
ia
The
Neth
erla
nds
Norw
ay
Pola
nd
Port
ugal
Rom
ania
Slov
enia
Slov
akia
Spai
n
Swed
en
Switz
erla
nd
Unite
d Ki
ngdo
m
Arge
ntin
a
Barb
ados
Braz
il
Chile
Colo
mbi
a
Ecua
dor
Guat
emal
a
Mex
ico
Pana
ma
Peru
Puer
to R
ico
Urug
uay
Cana
da USA
Figure 3: Percentage of entrepreneurs using own money to fund their business venture, GEM 2015
A GLOBAL PERSPECTIVE ON ENTREPRENEURIAL FINANCE
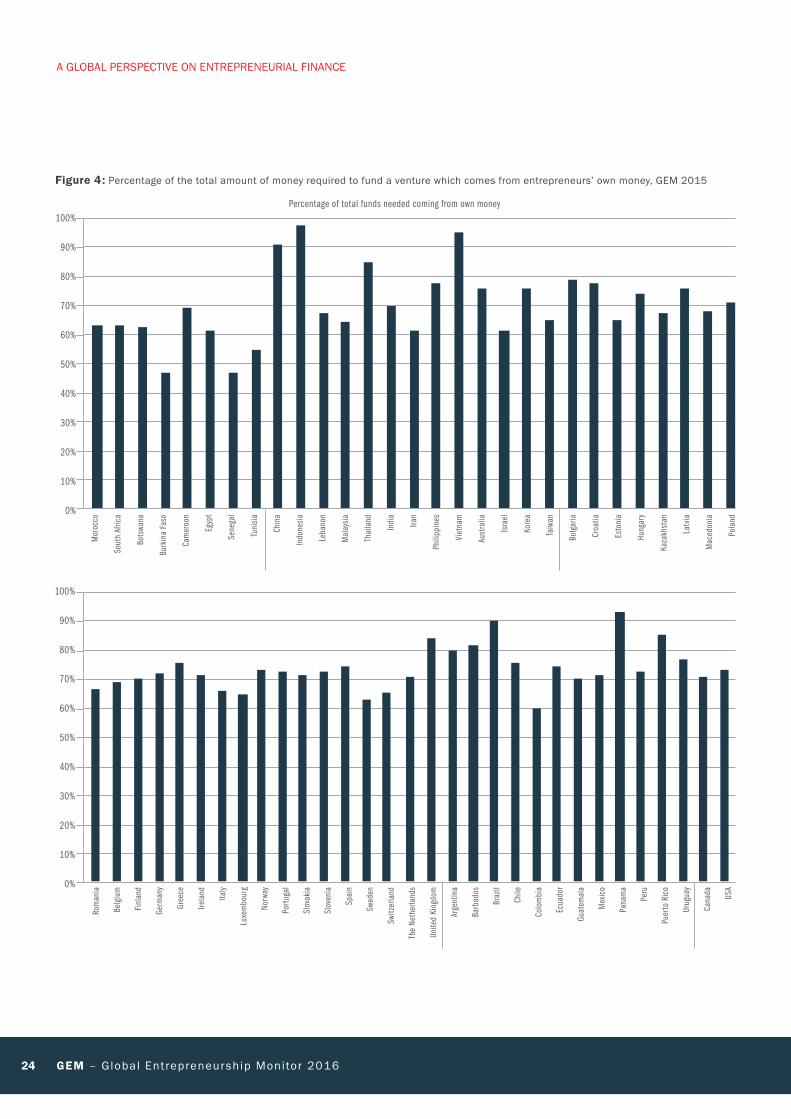
24 GEM – Global Entrepreneurship Monitor 2016
Mor
occo
Sout
h Af
rica
Bots
wana
Burk
ina
Faso
Cam
eroo
n
Egyp
t
Sene
gal
Tuni
sia
Chin
a
Indo
nesi
a
Leba
non
Mal
aysi
a
Thai
land
Indi
a
Iran
Phili
ppin
es
Viet
nam
Aust
ralia
Isra
el
Kore
a
Taiw
an
Bulg
aria
Croa
tia
Esto
nia
Hung
ary
Kaza
khst
an
Latv
ia
Mac
edon
ia
Pola
nd
Rom
ania
Belg
ium
Finl
and
Germ
any
Gree
ce
Irela
nd
Italy
Luxe
mbo
urg
Norw
ay
Port
ugal
Slov
akia
Slov
enia
Spai
n
Swed
en
Switz
erla
nd
The
Neth
erla
nds
Unite
d Ki
ngdo
m
Arge
ntin
a
Barb
ados
Braz
il
Chile
Colo
mbi
a
Ecua
dor
Guat
emal
a
Mex
ico
Pana
ma
Peru
Puer
to R
ico
Urug
uay
Cana
da
USA
100%
90%
80%
70%
60%
50%
40%
30%
20%
10%
0%
100%
90%
80%
70%
60%
50%
40%
30%
20%
10%
0%
Percentage of total funds needed coming from own money
Figure 4: Percentage of the total amount of money required to fund a venture which comes from entrepreneurs’ own money, GEM 2015
A GLOBAL PERSPECTIVE ON ENTREPRENEURIAL FINANCE
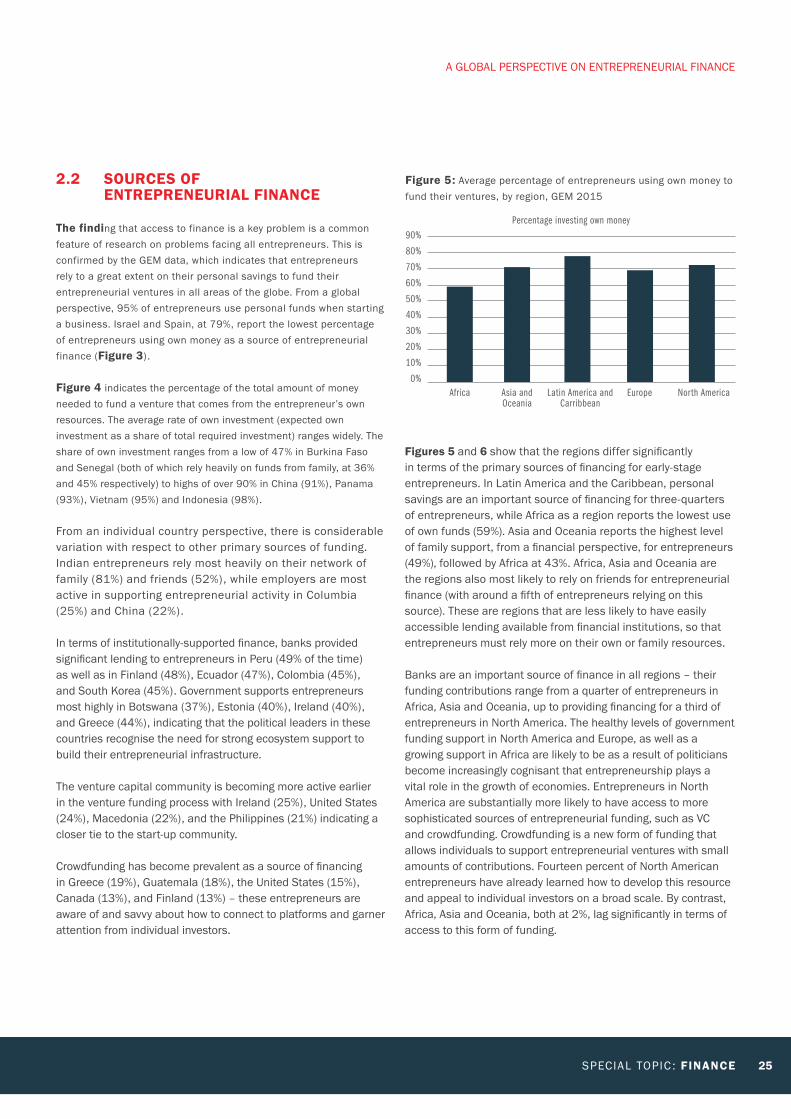
SPECIAL TOPIC : FINANCE 25
2.2 SOURCES OF ENTREPRENEURIAL FINANCE
The finding that access to finance is a key problem is a common feature of research on problems facing all entrepreneurs. This is confirmed by the GEM data, which indicates that entrepreneurs rely to a great extent on their personal savings to fund their entrepreneurial ventures in all areas of the globe. From a global perspective, 95% of entrepreneurs use personal funds when starting a business. Israel and Spain, at 79%, report the lowest percentage of entrepreneurs using own money as a source of entrepreneurial finance (Figure 3).
Figure 4 indicates the percentage of the total amount of money needed to fund a venture that comes from the entrepreneur’s own resources. The average rate of own investment (expected own investment as a share of total required investment) ranges widely. The share of own investment ranges from a low of 47% in Burkina Faso and Senegal (both of which rely heavily on funds from family, at 36% and 45% respectively) to highs of over 90% in China (91%), Panama (93%), Vietnam (95%) and Indonesia (98%).
From an individual country perspective, there is considerable variation with respect to other primary sources of funding. Indian entrepreneurs rely most heavily on their network of family (81%) and friends (52%), while employers are most active in supporting entrepreneurial activity in Columbia (25%) and China (22%).
In terms of institutionally-supported finance, banks provided significant lending to entrepreneurs in Peru (49% of the time) as well as in Finland (48%), Ecuador (47%), Colombia (45%), and South Korea (45%). Government supports entrepreneurs most highly in Botswana (37%), Estonia (40%), Ireland (40%), and Greece (44%), indicating that the political leaders in these countries recognise the need for strong ecosystem support to build their entrepreneurial infrastructure.
The venture capital community is becoming more active earlier in the venture funding process with Ireland (25%), United States (24%), Macedonia (22%), and the Philippines (21%) indicating a closer tie to the start-up community.
Crowdfunding has become prevalent as a source of financing in Greece (19%), Guatemala (18%), the United States (15%), Canada (13%), and Finland (13%) – these entrepreneurs are aware of and savvy about how to connect to platforms and garner attention from individual investors.
90%
80%
70%
60%
50%
40%
30%
20%
10%
0%Africa Asia and
OceaniaEuropeLatin America and
CarribbeanNorth America
Percentage investing own money
Figure 5: Average percentage of entrepreneurs using own money to fund their ventures, by region, GEM 2015
Figures 5 and 6 show that the regions differ significantly in terms of the primary sources of financing for early-stage entrepreneurs. In Latin America and the Caribbean, personal savings are an important source of financing for three-quarters of entrepreneurs, while Africa as a region reports the lowest use of own funds (59%). Asia and Oceania reports the highest level of family support, from a financial perspective, for entrepreneurs (49%), followed by Africa at 43%. Africa, Asia and Oceania are the regions also most likely to rely on friends for entrepreneurial finance (with around a fifth of entrepreneurs relying on this source). These are regions that are less likely to have easily accessible lending available from financial institutions, so that entrepreneurs must rely more on their own or family resources.
Banks are an important source of finance in all regions – their funding contributions range from a quarter of entrepreneurs in Africa, Asia and Oceania, up to providing financing for a third of entrepreneurs in North America. The healthy levels of government funding support in North America and Europe, as well as a growing support in Africa are likely to be as a result of politicians become increasingly cognisant that entrepreneurship plays a vital role in the growth of economies. Entrepreneurs in North America are substantially more likely to have access to more sophisticated sources of entrepreneurial funding, such as VC and crowdfunding. Crowdfunding is a new form of funding that allows individuals to support entrepreneurial ventures with small amounts of contributions. Fourteen percent of North American entrepreneurs have already learned how to develop this resource and appeal to individual investors on a broad scale. By contrast, Africa, Asia and Oceania, both at 2%, lag significantly in terms of access to this form of funding.
A GLOBAL PERSPECTIVE ON ENTREPRENEURIAL FINANCE
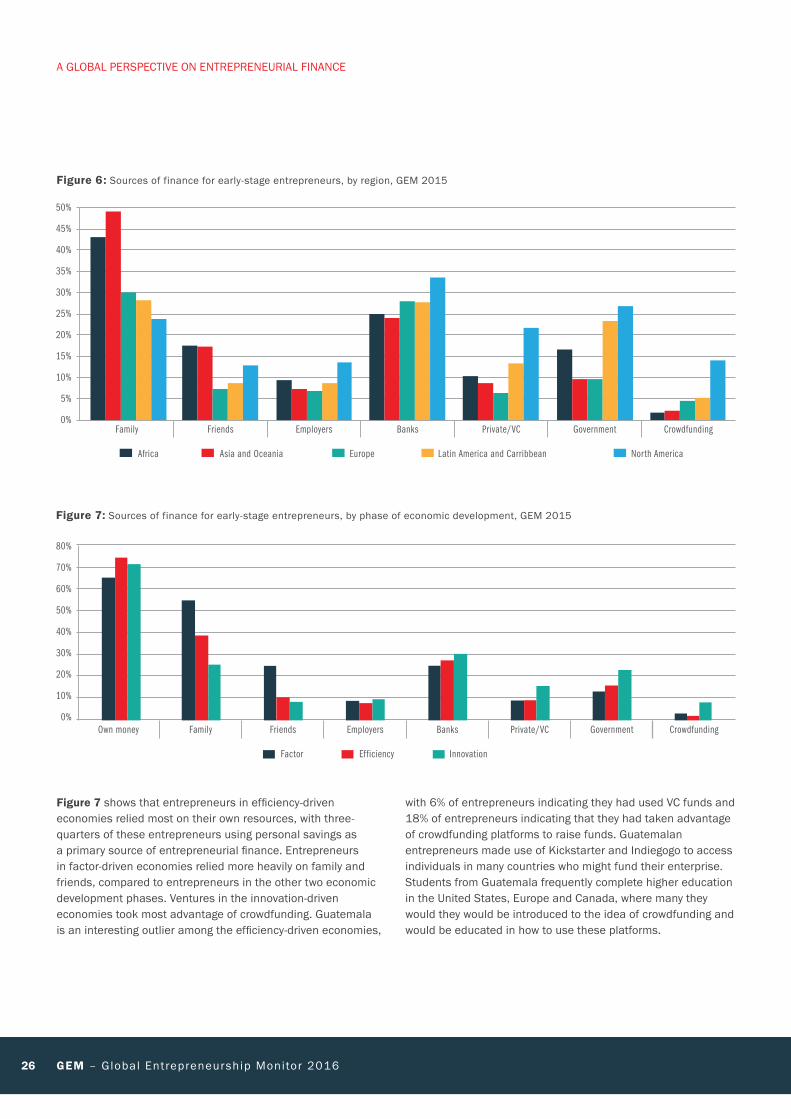
26 GEM – Global Entrepreneurship Monitor 2016
50%
45%
40%
35%
30%
25%
20%
15%
10%
5%
0%Family Friends Employers Banks Private/VC Government Crowdfunding
Africa Asia and Oceania Europe Latin America and Carribbean North America
Figure 6: Sources of finance for early-stage entrepreneurs, by region, GEM 2015
80%
70%
60%
50%
40%
30%
20%
10%
0%Own money Family Friends Employers Banks Private/VC Government Crowdfunding
Factor Efficiency Innovation
Figure 7: Sources of finance for early-stage entrepreneurs, by phase of economic development, GEM 2015
Figure 7 shows that entrepreneurs in efficiency-driven economies relied most on their own resources, with three-quarters of these entrepreneurs using personal savings as a primary source of entrepreneurial finance. Entrepreneurs in factor-driven economies relied more heavily on family and friends, compared to entrepreneurs in the other two economic development phases. Ventures in the innovation-driven economies took most advantage of crowdfunding. Guatemala is an interesting outlier among the efficiency-driven economies,
with 6% of entrepreneurs indicating they had used VC funds and 18% of entrepreneurs indicating that they had taken advantage of crowdfunding platforms to raise funds. Guatemalan entrepreneurs made use of Kickstarter and Indiegogo to access individuals in many countries who might fund their enterprise. Students from Guatemala frequently complete higher education in the United States, Europe and Canada, where many they would they would be introduced to the idea of crowdfunding and would be educated in how to use these platforms.
A GLOBAL PERSPECTIVE ON ENTREPRENEURIAL FINANCE
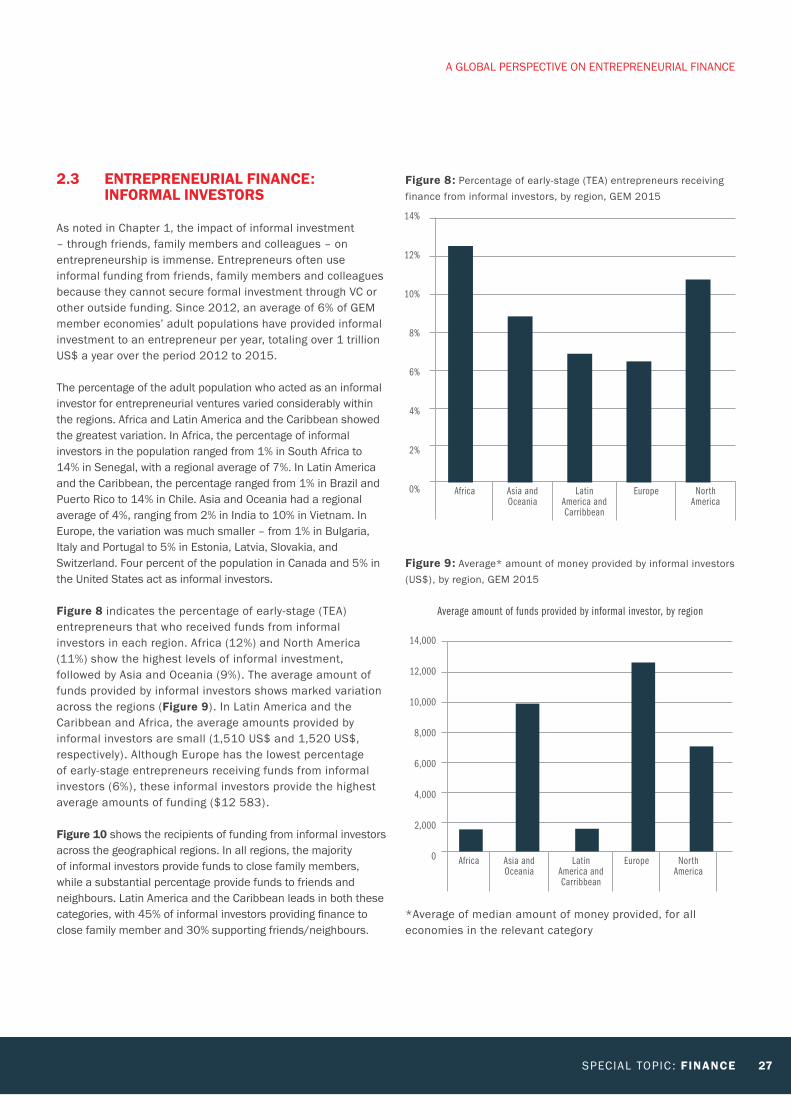
SPECIAL TOPIC : FINANCE 27
14%
12%
10%
8%
6%
4%
2%
0% Africa Asia and Oceania
Latin America and Carribbean
Europe North America
Figure 8: Percentage of early-stage (TEA) entrepreneurs receiving finance from informal investors, by region, GEM 2015
Figure 9: Average* amount of money provided by informal investors (US$), by region, GEM 2015
14,000
12,000
10,000
8,000
6,000
4,000
2,000
0 Africa Asia and Oceania
Latin America and Carribbean
Europe North America
Average amount of funds provided by informal investor, by region
*Average of median amount of money provided, for all economies in the relevant category
2.3 ENTREPRENEURIAL FINANCE: INFORMAL INVESTORS
As noted in Chapter 1, the impact of informal investment – through friends, family members and colleagues – on entrepreneurship is immense. Entrepreneurs often use informal funding from friends, family members and colleagues because they cannot secure formal investment through VC or other outside funding. Since 2012, an average of 6% of GEM member economies’ adult populations have provided informal investment to an entrepreneur per year, totaling over 1 trillion US$ a year over the period 2012 to 2015.
The percentage of the adult population who acted as an informal investor for entrepreneurial ventures varied considerably within the regions. Africa and Latin America and the Caribbean showed the greatest variation. In Africa, the percentage of informal investors in the population ranged from 1% in South Africa to 14% in Senegal, with a regional average of 7%. In Latin America and the Caribbean, the percentage ranged from 1% in Brazil and Puerto Rico to 14% in Chile. Asia and Oceania had a regional average of 4%, ranging from 2% in India to 10% in Vietnam. In Europe, the variation was much smaller – from 1% in Bulgaria, Italy and Portugal to 5% in Estonia, Latvia, Slovakia, and Switzerland. Four percent of the population in Canada and 5% in the United States act as informal investors.
Figure 8 indicates the percentage of early-stage (TEA) entrepreneurs that who received funds from informal investors in each region. Africa (12%) and North America (11%) show the highest levels of informal investment, followed by Asia and Oceania (9%). The average amount of funds provided by informal investors shows marked variation across the regions (Figure 9). In Latin America and the Caribbean and Africa, the average amounts provided by informal investors are small (1,510 US$ and 1,520 US$, respectively). Although Europe has the lowest percentage of early-stage entrepreneurs receiving funds from informal investors (6%), these informal investors provide the highest average amounts of funding ($12 583).
Figure 10 shows the recipients of funding from informal investors across the geographical regions. In all regions, the majority of informal investors provide funds to close family members, while a substantial percentage provide funds to friends and neighbours. Latin America and the Caribbean leads in both these categories, with 45% of informal investors providing finance to close family member and 30% supporting friends/neighbours.
A GLOBAL PERSPECTIVE ON ENTREPRENEURIAL FINANCE
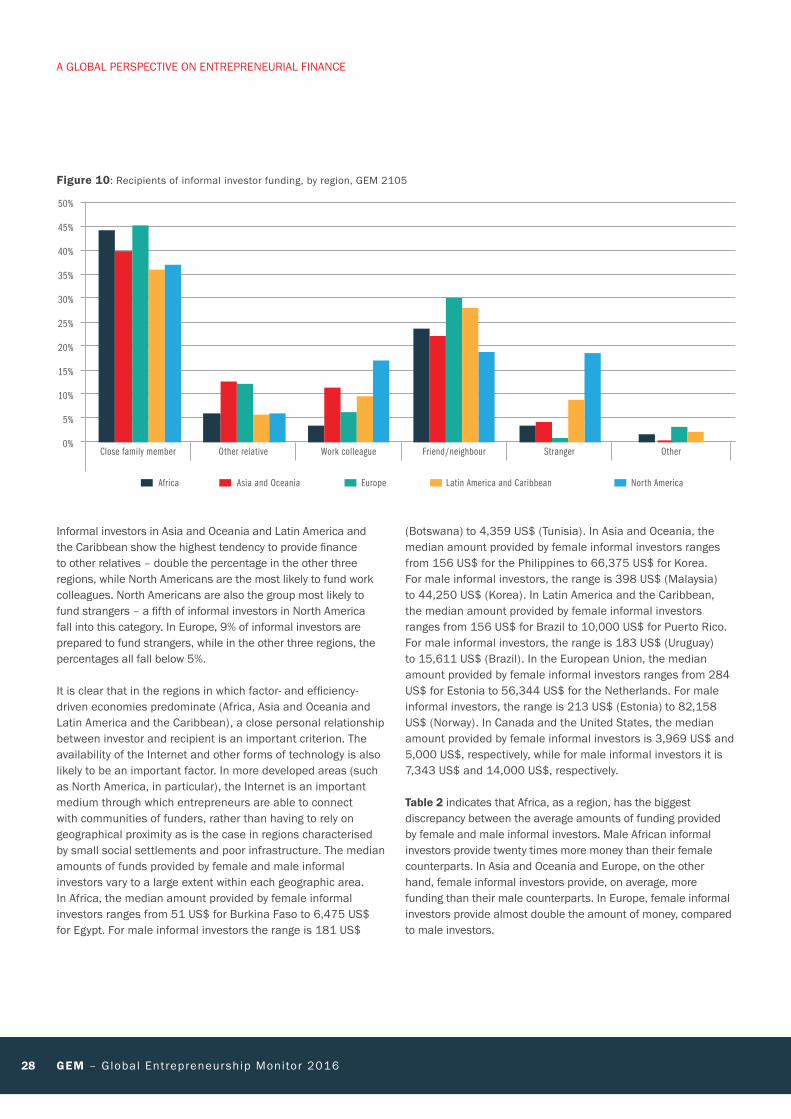
28 GEM – Global Entrepreneurship Monitor 2016
Africa Asia and Oceania Europe Latin America and Caribbean North America
Close family member Other relative Work colleague Friend/neighbour Stranger Other
50%
45%
40%
35%
30%
25%
20%
15%
10%
5%
0%
Figure 10: Recipients of informal investor funding, by region, GEM 2105
Informal investors in Asia and Oceania and Latin America and the Caribbean show the highest tendency to provide finance to other relatives – double the percentage in the other three regions, while North Americans are the most likely to fund work colleagues. North Americans are also the group most likely to fund strangers – a fifth of informal investors in North America fall into this category. In Europe, 9% of informal investors are prepared to fund strangers, while in the other three regions, the percentages all fall below 5%.
It is clear that in the regions in which factor- and efficiency-driven economies predominate (Africa, Asia and Oceania and Latin America and the Caribbean), a close personal relationship between investor and recipient is an important criterion. The availability of the Internet and other forms of technology is also likely to be an important factor. In more developed areas (such as North America, in particular), the Internet is an important medium through which entrepreneurs are able to connect with communities of funders, rather than having to rely on geographical proximity as is the case in regions characterised by small social settlements and poor infrastructure. The median amounts of funds provided by female and male informal investors vary to a large extent within each geographic area. In Africa, the median amount provided by female informal investors ranges from 51 US$ for Burkina Faso to 6,475 US$ for Egypt. For male informal investors the range is 181 US$
(Botswana) to 4,359 US$ (Tunisia). In Asia and Oceania, the median amount provided by female informal investors ranges from 156 US$ for the Philippines to 66,375 US$ for Korea. For male informal investors, the range is 398 US$ (Malaysia) to 44,250 US$ (Korea). In Latin America and the Caribbean, the median amount provided by female informal investors ranges from 156 US$ for Brazil to 10,000 US$ for Puerto Rico. For male informal investors, the range is 183 US$ (Uruguay) to 15,611 US$ (Brazil). In the European Union, the median amount provided by female informal investors ranges from 284 US$ for Estonia to 56,344 US$ for the Netherlands. For male informal investors, the range is 213 US$ (Estonia) to 82,158 US$ (Norway). In Canada and the United States, the median amount provided by female informal investors is 3,969 US$ and 5,000 US$, respectively, while for male informal investors it is 7,343 US$ and 14,000 US$, respectively.
Table 2 indicates that Africa, as a region, has the biggest discrepancy between the average amounts of funding provided by female and male informal investors. Male African informal investors provide twenty times more money than their female counterparts. In Asia and Oceania and Europe, on the other hand, female informal investors provide, on average, more funding than their male counterparts. In Europe, female informal investors provide almost double the amount of money, compared to male investors.
A GLOBAL PERSPECTIVE ON ENTREPRENEURIAL FINANCE
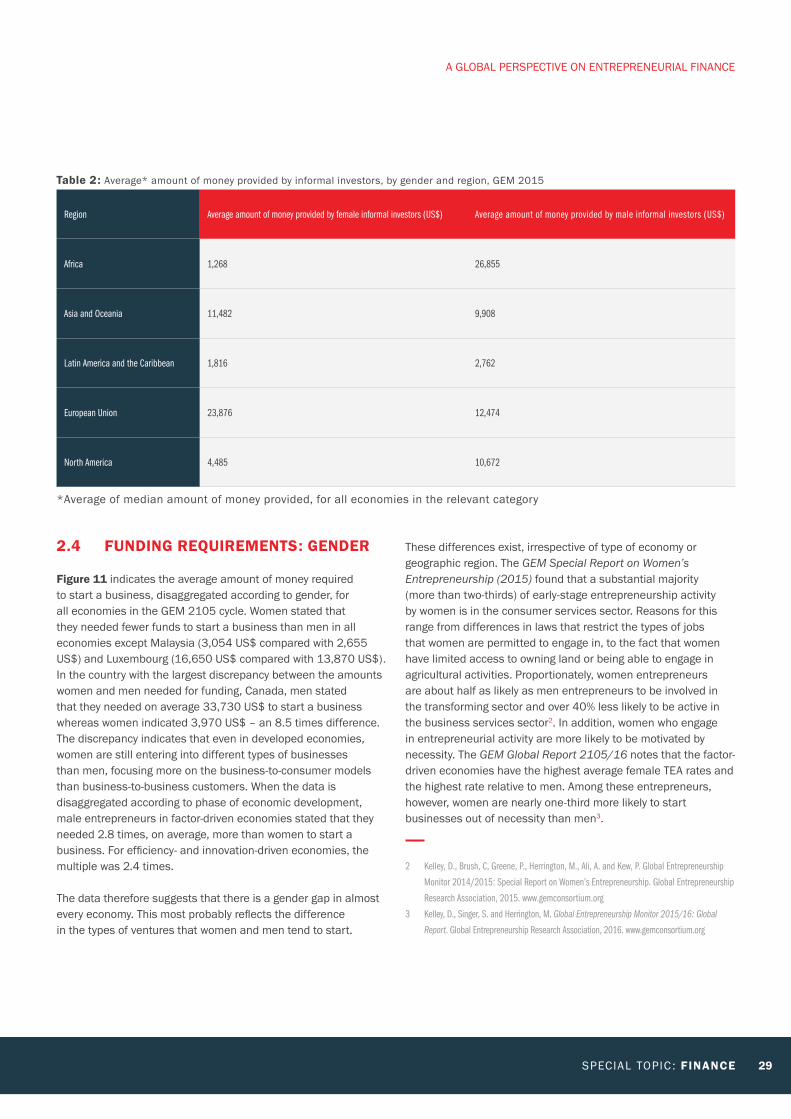
SPECIAL TOPIC : FINANCE 29
Table 2: Average* amount of money provided by informal investors, by gender and region, GEM 2015
Region Average amount of money provided by female informal investors (US$) Average amount of money provided by male informal investors (US$)
Africa 1,268 26,855
Asia and Oceania 11,482 9,908
Latin America and the Caribbean 1,816 2,762
European Union 23,876 12,474
North America 4,485 10,672
*Average of median amount of money provided, for all economies in the relevant category
2.4 FUNDING REQUIREMENTS: GENDER
Figure 11 indicates the average amount of money required to start a business, disaggregated according to gender, for all economies in the GEM 2105 cycle. Women stated that they needed fewer funds to start a business than men in all economies except Malaysia (3,054 US$ compared with 2,655 US$) and Luxembourg (16,650 US$ compared with 13,870 US$). In the country with the largest discrepancy between the amounts women and men needed for funding, Canada, men stated that they needed on average 33,730 US$ to start a business whereas women indicated 3,970 US$ – an 8.5 times difference. The discrepancy indicates that even in developed economies, women are still entering into different types of businesses than men, focusing more on the business-to-consumer models than business-to-business customers. When the data is disaggregated according to phase of economic development, male entrepreneurs in factor-driven economies stated that they needed 2.8 times, on average, more than women to start a business. For efficiency- and innovation-driven economies, the multiple was 2.4 times.
The data therefore suggests that there is a gender gap in almost every economy. This most probably reflects the difference in the types of ventures that women and men tend to start.
These differences exist, irrespective of type of economy or geographic region. The GEM Special Report on Women’s Entrepreneurship (2015) found that a substantial majority (more than two-thirds) of early-stage entrepreneurship activity by women is in the consumer services sector. Reasons for this range from differences in laws that restrict the types of jobs that women are permitted to engage in, to the fact that women have limited access to owning land or being able to engage in agricultural activities. Proportionately, women entrepreneurs are about half as likely as men entrepreneurs to be involved in the transforming sector and over 40% less likely to be active in the business services sector2. In addition, women who engage in entrepreneurial activity are more likely to be motivated by necessity. The GEM Global Report 2105/16 notes that the factor-driven economies have the highest average female TEA rates and the highest rate relative to men. Among these entrepreneurs, however, women are nearly one-third more likely to start businesses out of necessity than men3.
2 Kelley, D., Brush, C, Greene, P., Herrington, M., Ali, A. and Kew, P. Global Entrepreneurship
Monitor 2014/2015: Special Report on Women’s Entrepreneurship. Global Entrepreneurship
Research Association, 2015. www.gemconsortium.org
3 Kelley, D., Singer, S. and Herrington, M. Global Entrepreneurship Monitor 2015/16: Global
Report. Global Entrepreneurship Research Association, 2016. www.gemconsortium.org
A GLOBAL PERSPECTIVE ON ENTREPRENEURIAL FINANCE
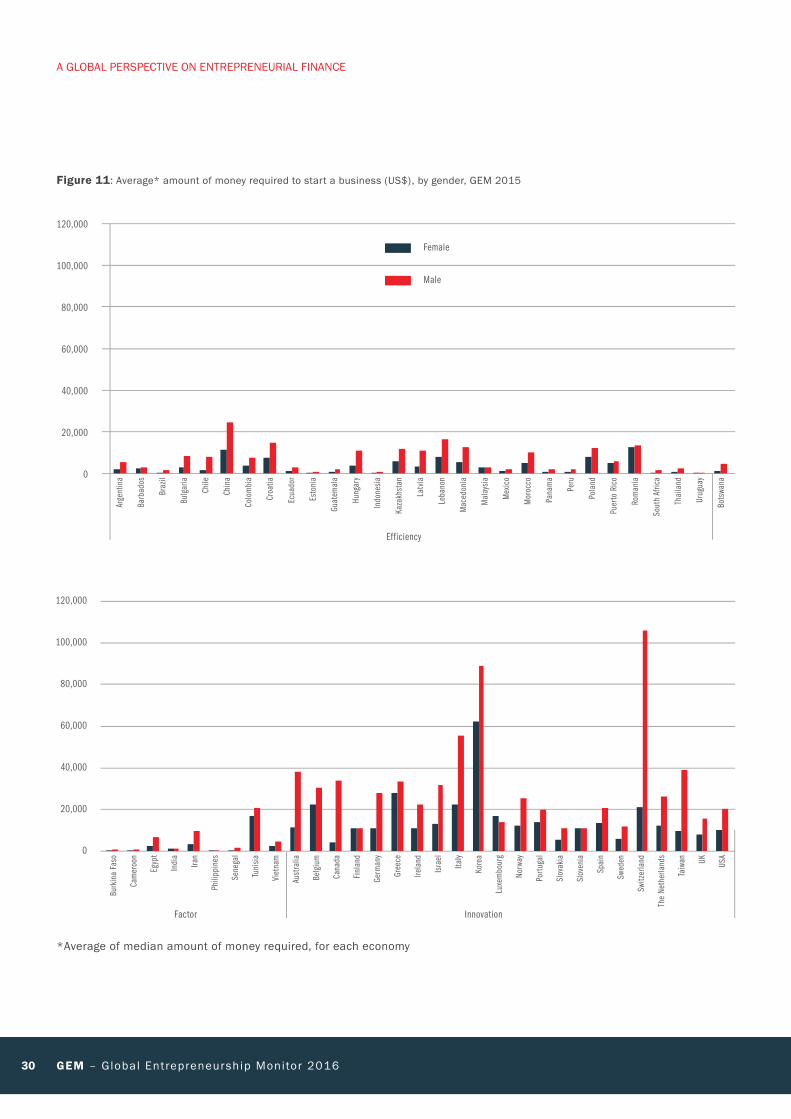
30 GEM – Global Entrepreneurship Monitor 2016
120,000
100,000
80,000
60,000
40,000
20,000
0
120,000
100,000
80,000
60,000
40,000
20,000
0
Arge
ntin
a
Barb
ados
Braz
il
Bulg
aria
Chile
Chin
a
Colo
mbi
a
Croa
tia
Ecua
dor
Esto
nia
Guat
emal
a
Hung
ary
Indo
nesi
a
Kaza
khst
an
Latv
ia
Leba
non
Mac
edon
ia
Mal
aysi
a
Mex
ico
Mor
occo
Pana
ma
Peru
Pola
nd
Puer
to R
ico
Rom
ania
Sout
h Af
rica
Thai
land
Urug
uay
Bots
wana
Ef ficiency
Female
Male
Figure 11: Average* amount of money required to start a business (US$), by gender, GEM 2015
Burk
ina
Faso
Cam
eroo
n
Egyp
t
Indi
a
Iran
Phili
ppin
es
Sene
gal
Tuni
sia
Viet
nam
Aust
ralia
Belg
ium
Cana
da
Finl
and
Germ
any
Gree
ce
Irela
nd
Isra
el
Italy
Kore
a
Luxe
mbo
urg
Norw
ay
Port
ugal
Slov
akia
Slov
enia
Spai
n
Swed
en
Switz
erla
nd
The
Neth
erla
nds
Taiw
an UK USA
*Average of median amount of money required, for each economy
Factor Innovation
A GLOBAL PERSPECTIVE ON ENTREPRENEURIAL FINANCE
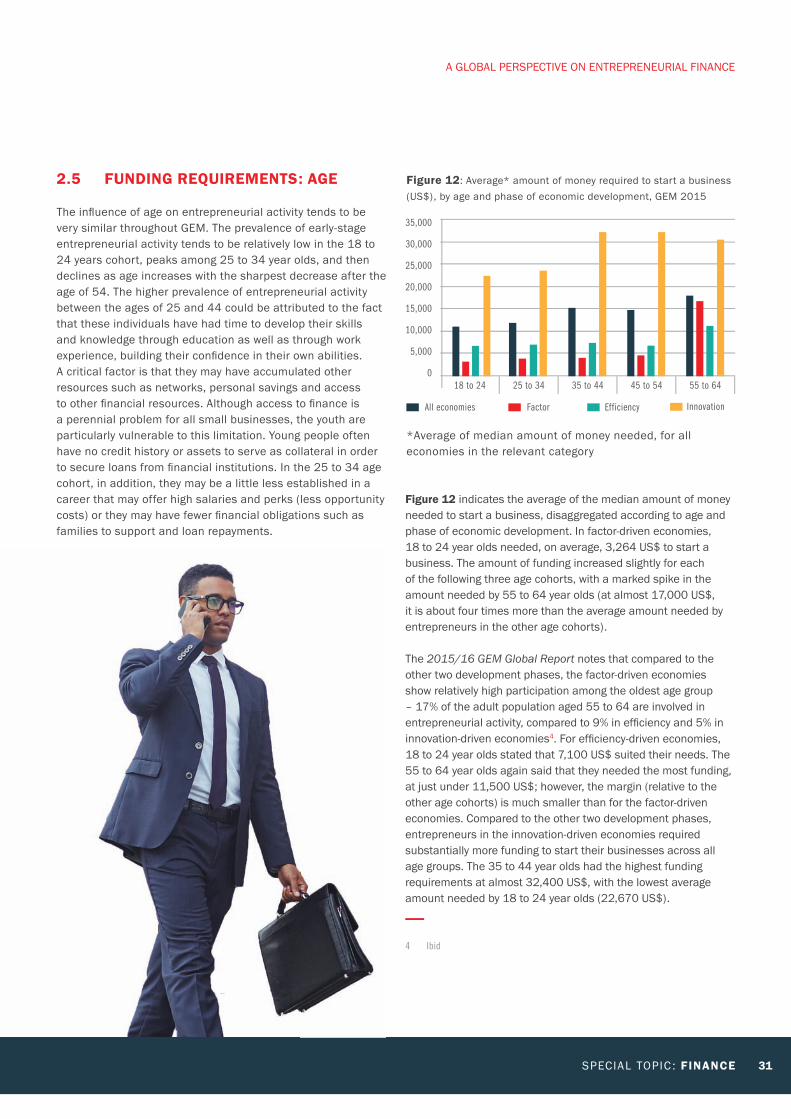
SPECIAL TOPIC : FINANCE 31
*Average of median amount of money needed, for all economies in the relevant category
35,000
30,000
25,000
20,000
15,000
10,000
5,000
018 to 24 25 to 34 35 to 44 45 to 54 55 to 64
All economies Factor Efficiency Innovation
Figure 12: Average* amount of money required to start a business (US$), by age and phase of economic development, GEM 2015
2.5 FUNDING REQUIREMENTS: AGE
The infl uence of age on entrepreneurial activity tends to be very similar throughout GEM. The prevalence of early-stage entrepreneurial activity tends to be relatively low in the 18 to 24 years cohort, peaks among 25 to 34 year olds, and then declines as age increases with the sharpest decrease after the age of 54. The higher prevalence of entrepreneurial activity between the ages of 25 and 44 could be attributed to the fact that these individuals have had time to develop their skills and knowledge through education as well as through work experience, building their confi dence in their own abilities. A critical factor is that they may have accumulated other resources such as networks, personal savings and access to other fi nancial resources. Although access to fi nance is a perennial problem for all small businesses, the youth are particularly vulnerable to this limitation. Young people often have no credit history or assets to serve as collateral in order to secure loans from fi nancial institutions. In the 25 to 34 age cohort, in addition, they may be a little less established in a career that may offer high salaries and perks (less opportunity costs) or they may have fewer fi nancial obligations such as families to support and loan repayments.
Figure 12 indicates the average of the median amount of money needed to start a business, disaggregated according to age and phase of economic development. In factor-driven economies, 18 to 24 year olds needed, on average, 3,264 US$ to start a business. The amount of funding increased slightly for each of the following three age cohorts, with a marked spike in the amount needed by 55 to 64 year olds (at almost 17,000 US$, it is about four times more than the average amount needed by entrepreneurs in the other age cohorts).
The 2015/16 GEM Global Report notes that compared to the other two development phases, the factor-driven economies show relatively high participation among the oldest age group – 17% of the adult population aged 55 to 64 are involved in entrepreneurial activity, compared to 9% in effi ciency and 5% in innovation-driven economies4. For effi ciency-driven economies, 18 to 24 year olds stated that 7,100 US$ suited their needs. The 55 to 64 year olds again said that they needed the most funding, at just under 11,500 US$; however, the margin (relative to the other age cohorts) is much smaller than for the factor-driven economies. Compared to the other two development phases, entrepreneurs in the innovation-driven economies required substantially more funding to start their businesses across all age groups. The 35 to 44 year olds had the highest funding requirements at almost 32,400 US$, with the lowest average amount needed by 18 to 24 year olds (22,670 US$).
4 Ibid
A GLOBAL PERSPECTIVE ON ENTREPRENEURIAL FINANCE
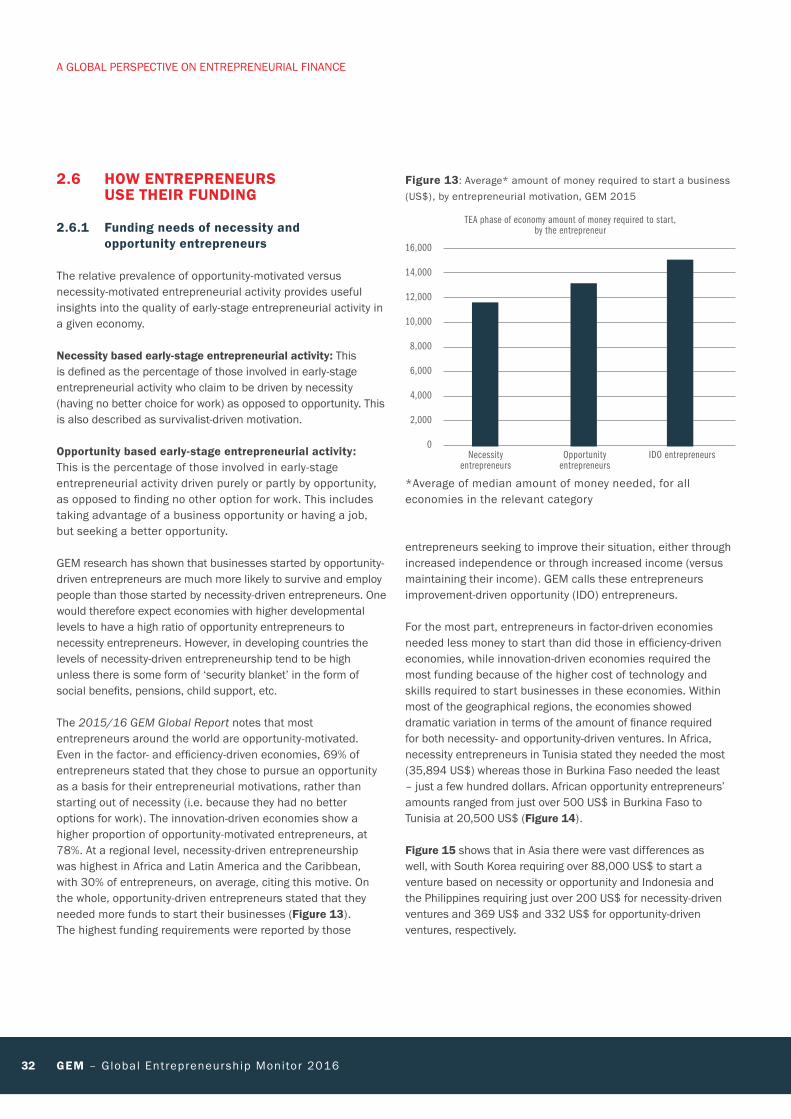
32 GEM – Global Entrepreneurship Monitor 2016
2.6 HOW ENTREPRENEURS USE THEIR FUNDING
2.6.1 Funding needs of necessity and opportunity entrepreneurs
The relative prevalence of opportunity-motivated versus necessity-motivated entrepreneurial activity provides useful insights into the quality of early-stage entrepreneurial activity in a given economy.
Necessity based early-stage entrepreneurial activity: This is defined as the percentage of those involved in early-stage entrepreneurial activity who claim to be driven by necessity (having no better choice for work) as opposed to opportunity. This is also described as survivalist-driven motivation.
Opportunity based early-stage entrepreneurial activity: This is the percentage of those involved in early-stage entrepreneurial activity driven purely or partly by opportunity, as opposed to finding no other option for work. This includes taking advantage of a business opportunity or having a job, but seeking a better opportunity.
GEM research has shown that businesses started by opportunity-driven entrepreneurs are much more likely to survive and employ people than those started by necessity-driven entrepreneurs. One would therefore expect economies with higher developmental levels to have a high ratio of opportunity entrepreneurs to necessity entrepreneurs. However, in developing countries the levels of necessity-driven entrepreneurship tend to be high unless there is some form of ‘security blanket’ in the form of social benefits, pensions, child support, etc.
The 2015/16 GEM Global Report notes that most entrepreneurs around the world are opportunity-motivated. Even in the factor- and efficiency-driven economies, 69% of entrepreneurs stated that they chose to pursue an opportunity as a basis for their entrepreneurial motivations, rather than starting out of necessity (i.e. because they had no better options for work). The innovation-driven economies show a higher proportion of opportunity-motivated entrepreneurs, at 78%. At a regional level, necessity-driven entrepreneurship was highest in Africa and Latin America and the Caribbean, with 30% of entrepreneurs, on average, citing this motive. On the whole, opportunity-driven entrepreneurs stated that they needed more funds to start their businesses (Figure 13). The highest funding requirements were reported by those
entrepreneurs seeking to improve their situation, either through increased independence or through increased income (versus maintaining their income). GEM calls these entrepreneurs improvement-driven opportunity (IDO) entrepreneurs.
For the most part, entrepreneurs in factor-driven economies needed less money to start than did those in efficiency-driven economies, while innovation-driven economies required the most funding because of the higher cost of technology and skills required to start businesses in these economies. Within most of the geographical regions, the economies showed dramatic variation in terms of the amount of finance required for both necessity- and opportunity-driven ventures. In Africa, necessity entrepreneurs in Tunisia stated they needed the most (35,894 US$) whereas those in Burkina Faso needed the least – just a few hundred dollars. African opportunity entrepreneurs’ amounts ranged from just over 500 US$ in Burkina Faso to Tunisia at 20,500 US$ (Figure 14).
Figure 15 shows that in Asia there were vast differences as well, with South Korea requiring over 88,000 US$ to start a venture based on necessity or opportunity and Indonesia and the Philippines requiring just over 200 US$ for necessity-driven ventures and 369 US$ and 332 US$ for opportunity-driven ventures, respectively.
16,000
14,000
12,000
10,000
8,000
6,000
4,000
2,000
0Necessity
entrepreneursOpportunity
entrepreneursIDO entrepreneurs
TEA phase of economy amount of money required to start, by the entrepreneur
Figure 13: Average* amount of money required to start a business (US$), by entrepreneurial motivation, GEM 2015
*Average of median amount of money needed, for all economies in the relevant category
A GLOBAL PERSPECTIVE ON ENTREPRENEURIAL FINANCE
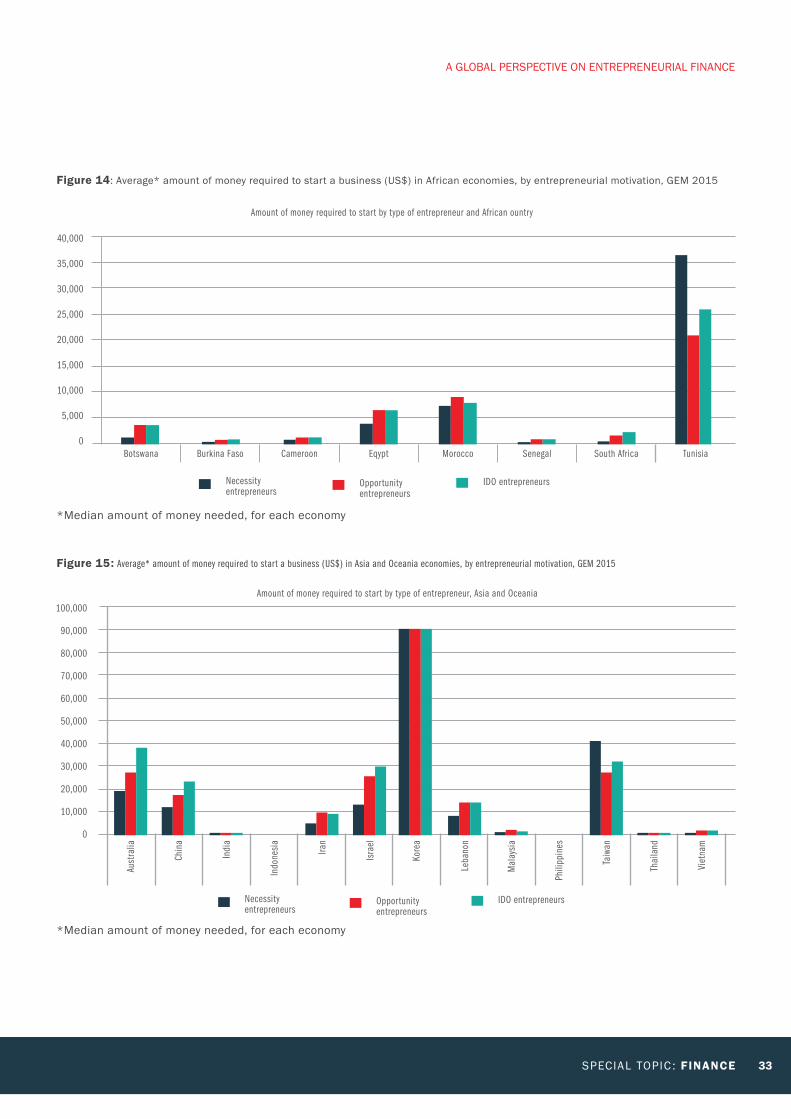
SPECIAL TOPIC : FINANCE 33
Figure 14: Average* amount of money required to start a business (US$) in African economies, by entrepreneurial motivation, GEM 2015
*Median amount of money needed, for each economy
40,000
35,000
30,000
25,000
20,000
15,000
10,000
5,000
0Botswana Burkina Faso Cameroon Eqypt Morocco Senegal South Africa Tunisia
Necessity entrepreneurs
Opportunity entrepreneurs
IDO entrepreneurs
Amount of money required to start by type of entrepreneur and African ountry
Figure 15: Average* amount of money required to start a business (US$) in Asia and Oceania economies, by entrepreneurial motivation, GEM 2015
*Median amount of money needed, for each economy
Aust
ralia
Chin
a
Indi
a
Indo
nesi
a
Iran
Isra
el
Kore
a
Leba
non
Mal
aysi
a
Phili
ppin
es
Taiw
an
Thai
land
Viet
nam
100,000
90,000
80,000
70,000
60,000
50,000
40,000
30,000
20,000
10,000
0
Necessity entrepreneurs
Opportunity entrepreneurs
IDO entrepreneurs
Amount of money required to start by type of entrepreneur, Asia and Oceania
A GLOBAL PERSPECTIVE ON ENTREPRENEURIAL FINANCE
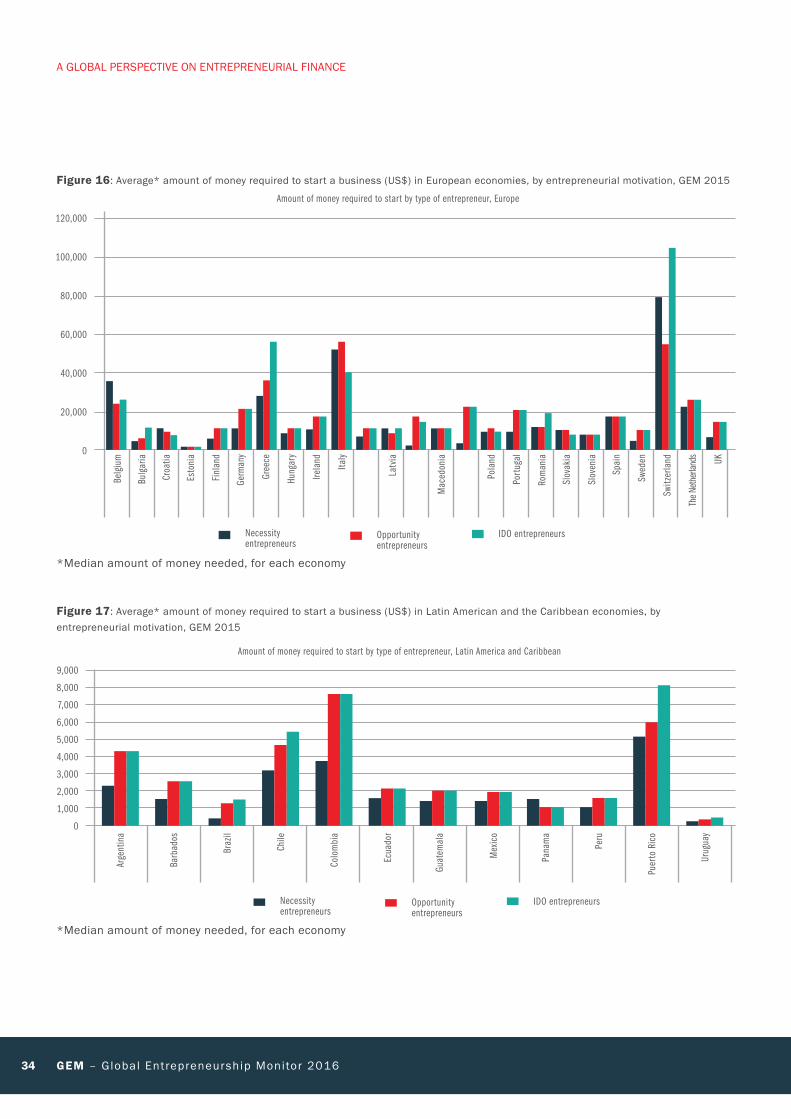
34 GEM – Global Entrepreneurship Monitor 2016
Necessity entrepreneurs
Opportunity entrepreneurs
IDO entrepreneurs
Belg
ium
Bulg
aria
Croa
tia
Esto
nia
Finl
and
Germ
any
Gree
ce
Hung
ary
Irela
nd
Italy
Latv
ia
Mac
edon
ia
Pola
nd
Port
ugal
Rom
ania
Slov
akia
Slov
enia
Spai
n
Swed
en
Switz
erla
nd
The N
ethe
rland
s
UK
120,000
100,000
80,000
60,000
40,000
20,000
0
Amount of money required to start by type of entrepreneur, Europe
Figure 16: Average* amount of money required to start a business (US$) in European economies, by entrepreneurial motivation, GEM 2015
*Median amount of money needed, for each economy
Arge
ntin
a
Barb
ados
Braz
il
Chile
Colo
mbi
a
Ecua
dor
Guat
emal
a
Mex
ico
Pana
ma
Peru
Puer
to R
ico
Urug
uay
9,000
8,000
7,000
6,000
5,000
4,000
3,000
2,000
1,000
0
Necessity entrepreneurs
Opportunity entrepreneurs
IDO entrepreneurs
Amount of money required to start by type of entrepreneur, Latin America and Caribbean
Figure 17: Average* amount of money required to start a business (US$) in Latin American and the Caribbean economies, by entrepreneurial motivation, GEM 2015
*Median amount of money needed, for each economy
A GLOBAL PERSPECTIVE ON ENTREPRENEURIAL FINANCE
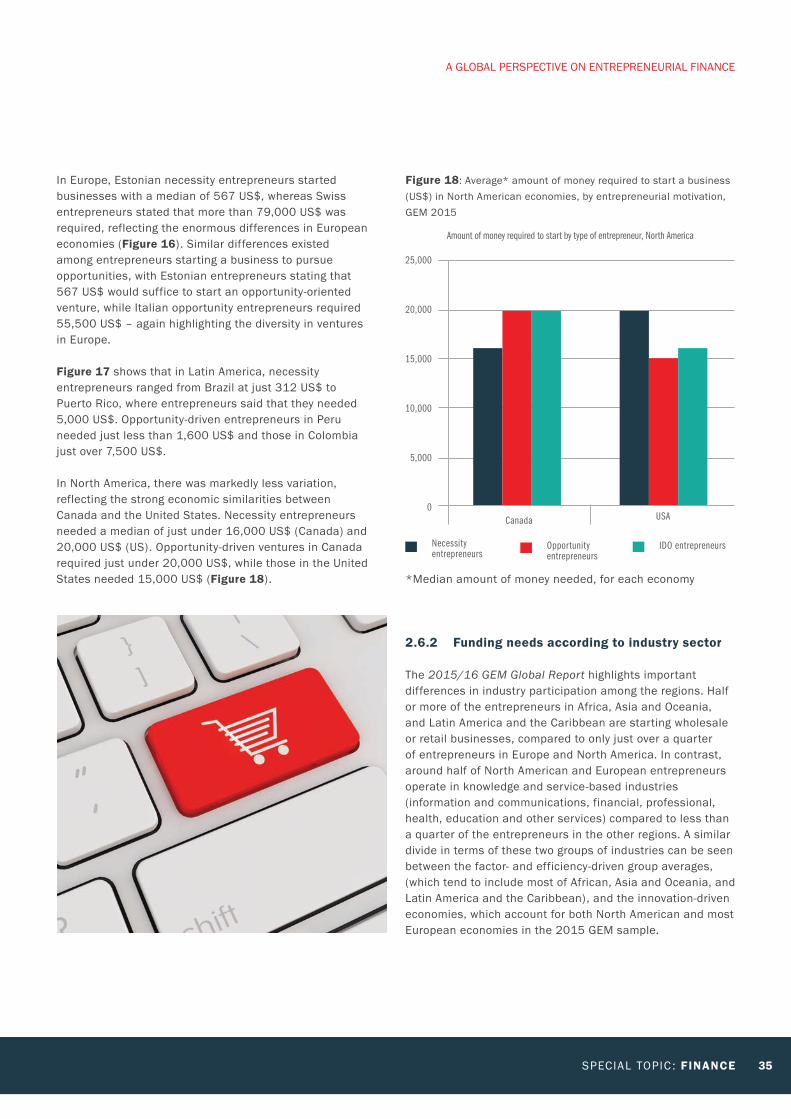
SPECIAL TOPIC : FINANCE 35
In Europe, Estonian necessity entrepreneurs started businesses with a median of 567 US$, whereas Swiss entrepreneurs stated that more than 79,000 US$ was required, reflecting the enormous differences in European economies (Figure 16). Similar differences existed among entrepreneurs starting a business to pursue opportunities, with Estonian entrepreneurs stating that 567 US$ would suffice to start an opportunity-oriented venture, while Italian opportunity entrepreneurs required 55,500 US$ – again highlighting the diversity in ventures in Europe.
Figure 17 shows that in Latin America, necessity entrepreneurs ranged from Brazil at just 312 US$ to Puerto Rico, where entrepreneurs said that they needed 5,000 US$. Opportunity-driven entrepreneurs in Peru needed just less than 1,600 US$ and those in Colombia just over 7,500 US$.
In North America, there was markedly less variation, reflecting the strong economic similarities between Canada and the United States. Necessity entrepreneurs needed a median of just under 16,000 US$ (Canada) and 20,000 US$ (US). Opportunity-driven ventures in Canada required just under 20,000 US$, while those in the United States needed 15,000 US$ (Figure 18).
2.6.2 Funding needs according to industry sector
The 2015/16 GEM Global Report highlights important differences in industry participation among the regions. Half or more of the entrepreneurs in Africa, Asia and Oceania, and Latin America and the Caribbean are starting wholesale or retail businesses, compared to only just over a quarter of entrepreneurs in Europe and North America. In contrast, around half of North American and European entrepreneurs operate in knowledge and service-based industries (information and communications, financial, professional, health, education and other services) compared to less than a quarter of the entrepreneurs in the other regions. A similar divide in terms of these two groups of industries can be seen between the factor- and efficiency-driven group averages, (which tend to include most of African, Asia and Oceania, and Latin America and the Caribbean), and the innovation-driven economies, which account for both North American and most European economies in the 2015 GEM sample.
Figure 18: Average* amount of money required to start a business (US$) in North American economies, by entrepreneurial motivation, GEM 2015
*Median amount of money needed, for each economy
25,000
20,000
15,000
10,000
5,000
0Canada USA
Amount of money required to start by type of entrepreneur, North America
Necessity entrepreneurs
Opportunity entrepreneurs
IDO entrepreneurs
A GLOBAL PERSPECTIVE ON ENTREPRENEURIAL FINANCE
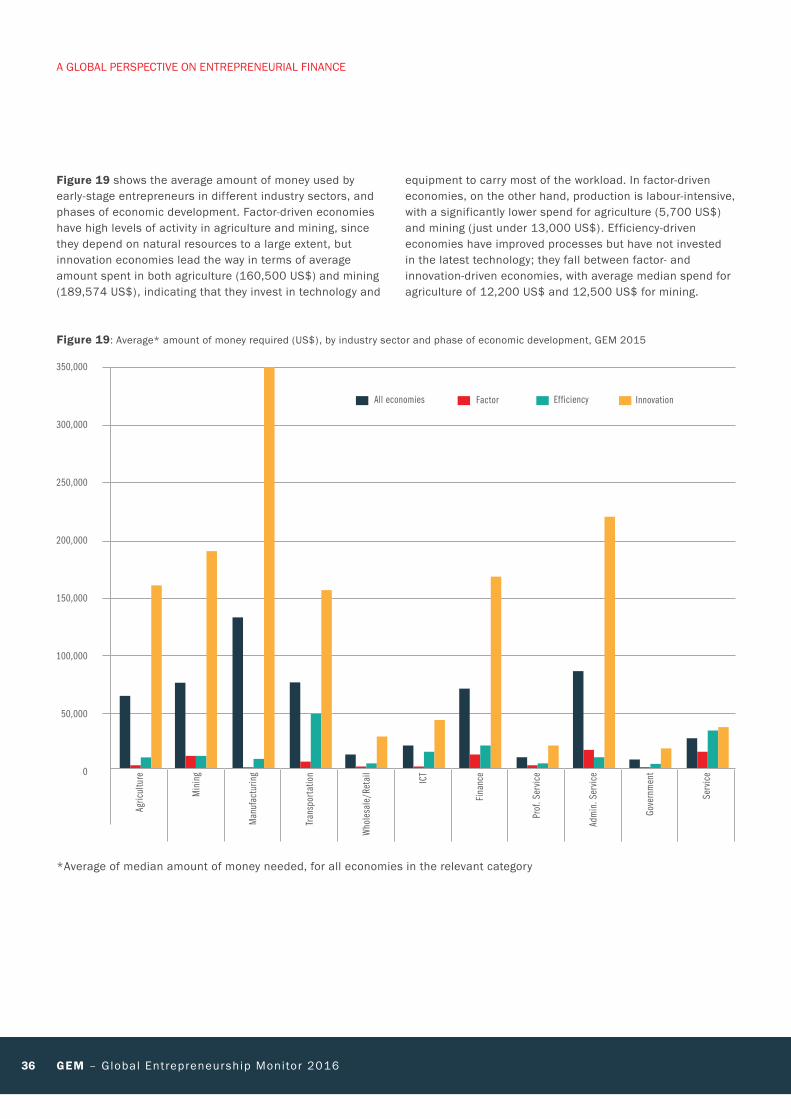
36 GEM – Global Entrepreneurship Monitor 2016
Figure 19 shows the average amount of money used by early-stage entrepreneurs in different industry sectors, and phases of economic development. Factor-driven economies have high levels of activity in agriculture and mining, since they depend on natural resources to a large extent, but innovation economies lead the way in terms of average amount spent in both agriculture (160,500 US$) and mining (189,574 US$), indicating that they invest in technology and
*Average of median amount of money needed, for all economies in the relevant category
Figure 19: Average* amount of money required (US$), by industry sector and phase of economic development, GEM 2015
350,000
300,000
250,000
200,000
150,000
100,000
50,000
0
All economies Factor Efficiency Innovation
equipment to carry most of the workload. In factor-driven economies, on the other hand, production is labour-intensive, with a significantly lower spend for agriculture (5,700 US$) and mining (just under 13,000 US$). Efficiency-driven economies have improved processes but have not invested in the latest technology; they fall between factor- and innovation-driven economies, with average median spend for agriculture of 12,200 US$ and 12,500 US$ for mining.
Agric
ultu
re
Min
ing
Man
ufac
turin
g
Tran
spor
tatio
n
Who
lesa
le/R
etai
l
ICT
Fina
nce
Prof
. Ser
vice
Adm
in. S
ervic
e
Gove
rnm
ent
Serv
ice
A GLOBAL PERSPECTIVE ON ENTREPRENEURIAL FINANCE
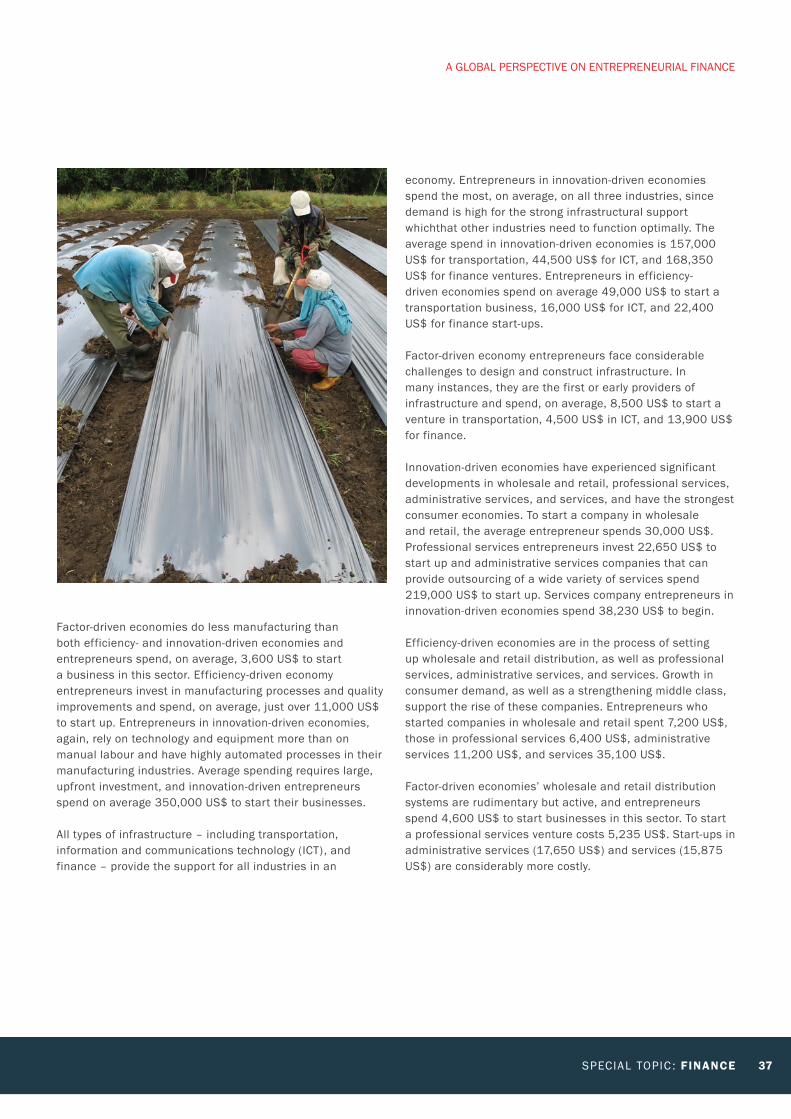
SPECIAL TOPIC : FINANCE 37
Factor-driven economies do less manufacturing than both efficiency- and innovation-driven economies and entrepreneurs spend, on average, 3,600 US$ to start a business in this sector. Efficiency-driven economy entrepreneurs invest in manufacturing processes and quality improvements and spend, on average, just over 11,000 US$ to start up. Entrepreneurs in innovation-driven economies, again, rely on technology and equipment more than on manual labour and have highly automated processes in their manufacturing industries. Average spending requires large, upfront investment, and innovation-driven entrepreneurs spend on average 350,000 US$ to start their businesses.
All types of infrastructure – including transportation, information and communications technology (ICT), and finance – provide the support for all industries in an
economy. Entrepreneurs in innovation-driven economies spend the most, on average, on all three industries, since demand is high for the strong infrastructural support whichthat other industries need to function optimally. The average spend in innovation-driven economies is 157,000 US$ for transportation, 44,500 US$ for ICT, and 168,350 US$ for finance ventures. Entrepreneurs in efficiency-driven economies spend on average 49,000 US$ to start a transportation business, 16,000 US$ for ICT, and 22,400 US$ for finance start-ups.
Factor-driven economy entrepreneurs face considerable challenges to design and construct infrastructure. In many instances, they are the first or early providers of infrastructure and spend, on average, 8,500 US$ to start a venture in transportation, 4,500 US$ in ICT, and 13,900 US$ for finance.
Innovation-driven economies have experienced significant developments in wholesale and retail, professional services, administrative services, and services, and have the strongest consumer economies. To start a company in wholesale and retail, the average entrepreneur spends 30,000 US$. Professional services entrepreneurs invest 22,650 US$ to start up and administrative services companies that can provide outsourcing of a wide variety of services spend 219,000 US$ to start up. Services company entrepreneurs in innovation-driven economies spend 38,230 US$ to begin.
Efficiency-driven economies are in the process of setting up wholesale and retail distribution, as well as professional services, administrative services, and services. Growth in consumer demand, as well as a strengthening middle class, support the rise of these companies. Entrepreneurs who started companies in wholesale and retail spent 7,200 US$, those in professional services 6,400 US$, administrative services 11,200 US$, and services 35,100 US$.
Factor-driven economies’ wholesale and retail distribution systems are rudimentary but active, and entrepreneurs spend 4,600 US$ to start businesses in this sector. To start a professional services venture costs 5,235 US$. Start-ups in administrative services (17,650 US$) and services (15,875 US$) are considerably more costly.
A GLOBAL PERSPECTIVE ON ENTREPRENEURIAL FINANCE
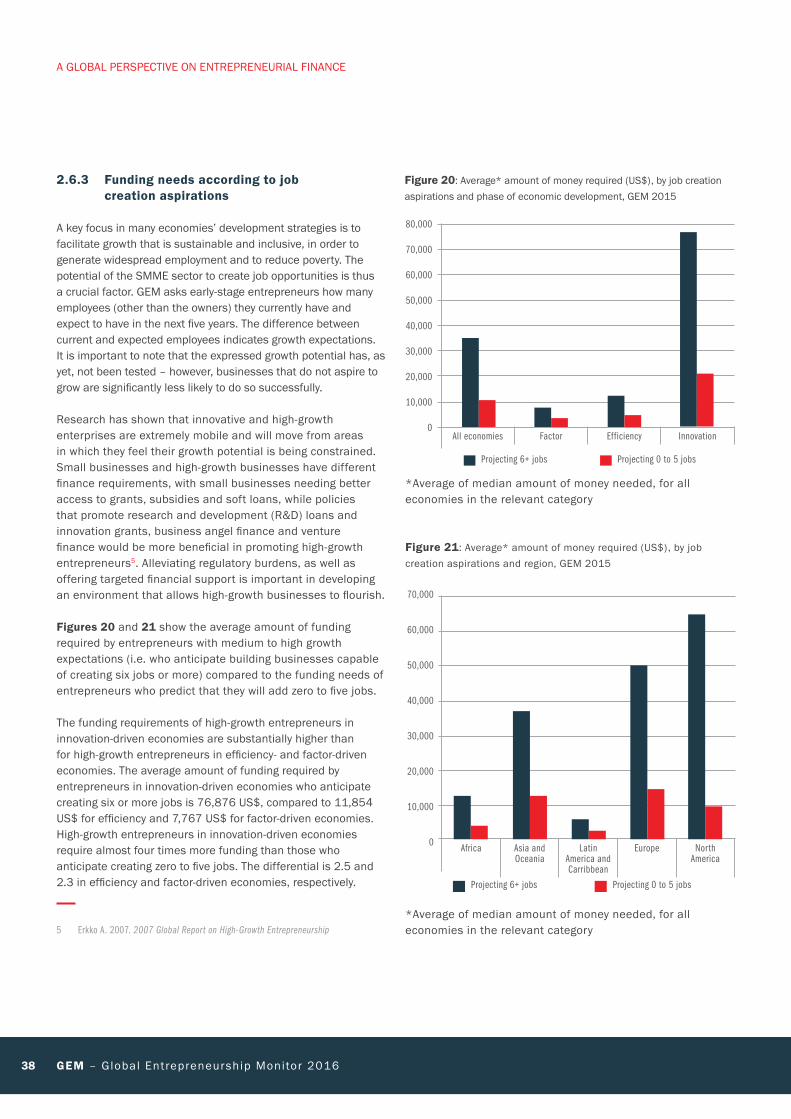
38 GEM – Global Entrepreneurship Monitor 2016
2.6.3 Funding needs according to job creation aspirations
A key focus in many economies’ development strategies is to facilitate growth that is sustainable and inclusive, in order to generate widespread employment and to reduce poverty. The potential of the SMME sector to create job opportunities is thus a crucial factor. GEM asks early-stage entrepreneurs how many employees (other than the owners) they currently have and expect to have in the next five years. The difference between current and expected employees indicates growth expectations. It is important to note that the expressed growth potential has, as yet, not been tested – however, businesses that do not aspire to grow are significantly less likely to do so successfully.
Research has shown that innovative and high-growth enterprises are extremely mobile and will move from areas in which they feel their growth potential is being constrained. Small businesses and high-growth businesses have different finance requirements, with small businesses needing better access to grants, subsidies and soft loans, while policies that promote research and development (R&D) loans and innovation grants, business angel finance and venture finance would be more beneficial in promoting high-growth entrepreneurs5. Alleviating regulatory burdens, as well as offering targeted financial support is important in developing an environment that allows high-growth businesses to flourish.
Figures 20 and 21 show the average amount of funding required by entrepreneurs with medium to high growth expectations (i.e. who anticipate building businesses capable of creating six jobs or more) compared to the funding needs of entrepreneurs who predict that they will add zero to five jobs.
The funding requirements of high-growth entrepreneurs in innovation-driven economies are substantially higher than for high-growth entrepreneurs in efficiency- and factor-driven economies. The average amount of funding required by entrepreneurs in innovation-driven economies who anticipate creating six or more jobs is 76,876 US$, compared to 11,854 US$ for efficiency and 7,767 US$ for factor-driven economies. High-growth entrepreneurs in innovation-driven economies require almost four times more funding than those who anticipate creating zero to five jobs. The differential is 2.5 and 2.3 in efficiency and factor-driven economies, respectively.
5 Erkko A. 2007. 2007 Global Report on High-Growth Entrepreneurship
Figure 20: Average* amount of money required (US$), by job creation aspirations and phase of economic development, GEM 2015
*Average of median amount of money needed, for all economies in the relevant category
80,000
70,000
60,000
50,000
40,000
30,000
20,000
10,000
0All economies Factor Efficiency Innovation
Projecting 0 to 5 jobsProjecting 6+ jobs
Figure 21: Average* amount of money required (US$), by job creation aspirations and region, GEM 2015
*Average of median amount of money needed, for all economies in the relevant category
Africa Asia and Oceania
Latin America and Carribbean
Europe North America
70,000
60,000
50,000
40,000
30,000
20,000
10,000
0
Projecting 0 to 5 jobsProjecting 6+ jobs
A GLOBAL PERSPECTIVE ON ENTREPRENEURIAL FINANCE
SPECIAL TOPIC : FINANCE 39
The average amount of funding needed by entrepreneurs who predict they will add zero to five jobs in factor-driven economies is 3,350 US$, while in efficiency- and innovation-driven economies it is 4,569 US$ and 20,864 US$, respectively.
From a regional perspective, the Latin America and the Caribbean region shows the smallest difference in funding requirements between medium to high-growth and low growth entrepreneurs, while North America shows the greatest difference. In North America, entrepreneurs projecting six-plus jobs require seven times more money, on average, than those projecting zero to five jobs, compared to a differential of 2.5 in Latin America and the Caribbean. The average amount of funding needed by entrepreneurs who anticipate building businesses capable of creating six jobs or more is Africa 11,994 US$; Asia and Oceania 36,721 US$; Latin America and the Caribbean 5,391 US$; European Union 49,959 US$; and North America 64,693 US$. By contrast, the average amount of funding needed by entrepreneurs who predict they will add zero to five jobs
is Africa 3,844 US$; Asia and Oceania 12,295 US$; Latin America and the Caribbean 2,125 US$; European Union 14,389 US$; and North America 8,969 US$.
2.6.4 Funding needs according to level of innovation
Innovation and entrepreneurship are closely connected concepts. It is argued that entrepreneurs disrupt market equilibrium by introducing new product-market combinations into a market, teaching customers to want new things and driving out less productive firms as their innovations advance the production frontier. Innovation goes beyond just creating novel products and services. To commercialise their innovations, entrepreneurs need to identify new market niches and develop creative ways to offer, deliver and promote their products. All of this requires an awareness of competitive offerings, and the ability to incorporate this knowledge into distinct products and services. Innovation capabilities are thus important to economies’ ability to become competitive, particularly in higher-productivity sectors.
A GLOBAL PERSPECTIVE ON ENTREPRENEURIAL FINANCE
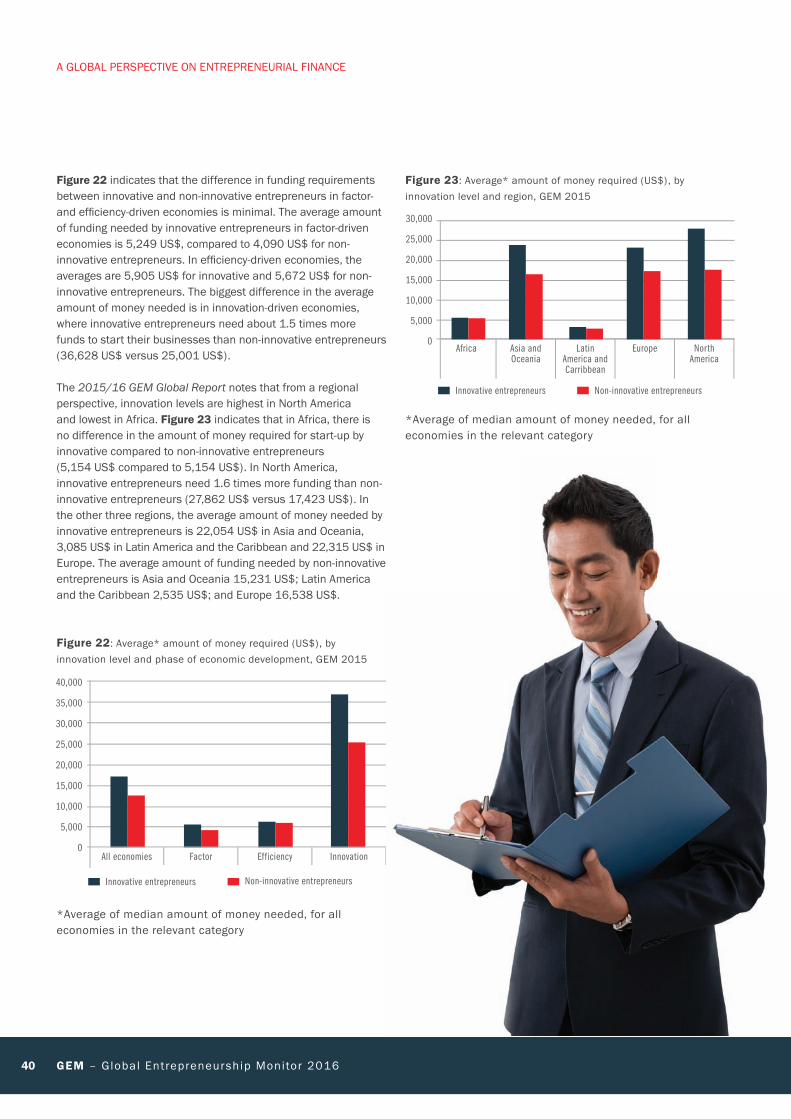
40 GEM – Global Entrepreneurship Monitor 2016
Figure 22 indicates that the difference in funding requirements between innovative and non-innovative entrepreneurs in factor- and effi ciency-driven economies is minimal. The average amount of funding needed by innovative entrepreneurs in factor-driven economies is 5,249 US$, compared to 4,090 US$ for non-innovative entrepreneurs. In effi ciency-driven economies, the averages are 5,905 US$ for innovative and 5,672 US$ for non-innovative entrepreneurs. The biggest difference in the average amount of money needed is in innovation-driven economies, where innovative entrepreneurs need about 1.5 times more funds to start their businesses than non-innovative entrepreneurs (36,628 US$ versus 25,001 US$).
The 2015/16 GEM Global Report notes that from a regional perspective, innovation levels are highest in North America and lowest in Africa. Figure 23 indicates that in Africa, there is no difference in the amount of money required for start-up by innovative compared to non-innovative entrepreneurs (5,154 US$ compared to 5,154 US$). In North America, innovative entrepreneurs need 1.6 times more funding than non-innovative entrepreneurs (27,862 US$ versus 17,423 US$). In the other three regions, the average amount of money needed by innovative entrepreneurs is 22,054 US$ in Asia and Oceania, 3,085 US$ in Latin America and the Caribbean and 22,315 US$ in Europe. The average amount of funding needed by non-innovative entrepreneurs is Asia and Oceania 15,231 US$; Latin America and the Caribbean 2,535 US$; and Europe 16,538 US$.
Figure 22: Average* amount of money required (US$), by innovation level and phase of economic development, GEM 2015
*Average of median amount of money needed, for all economies in the relevant category
Non-innovative entrepreneurs Innovative entrepreneurs
40,000
35,000
30,000
25,000
20,000
15,000
10,000
5,000
0All economies Factor Efficiency Innovation
30,000
25,000
20,000
15,000
10,000
5,000
0Africa Asia and
OceaniaLatin
America and Carribbean
Europe North America
Non-innovative entrepreneursInnovative entrepreneurs
Figure 23: Average* amount of money required (US$), by innovation level and region, GEM 2015
*Average of median amount of money needed, for all economies in the relevant category
A GLOBAL PERSPECTIVE ON ENTREPRENEURIAL FINANCE
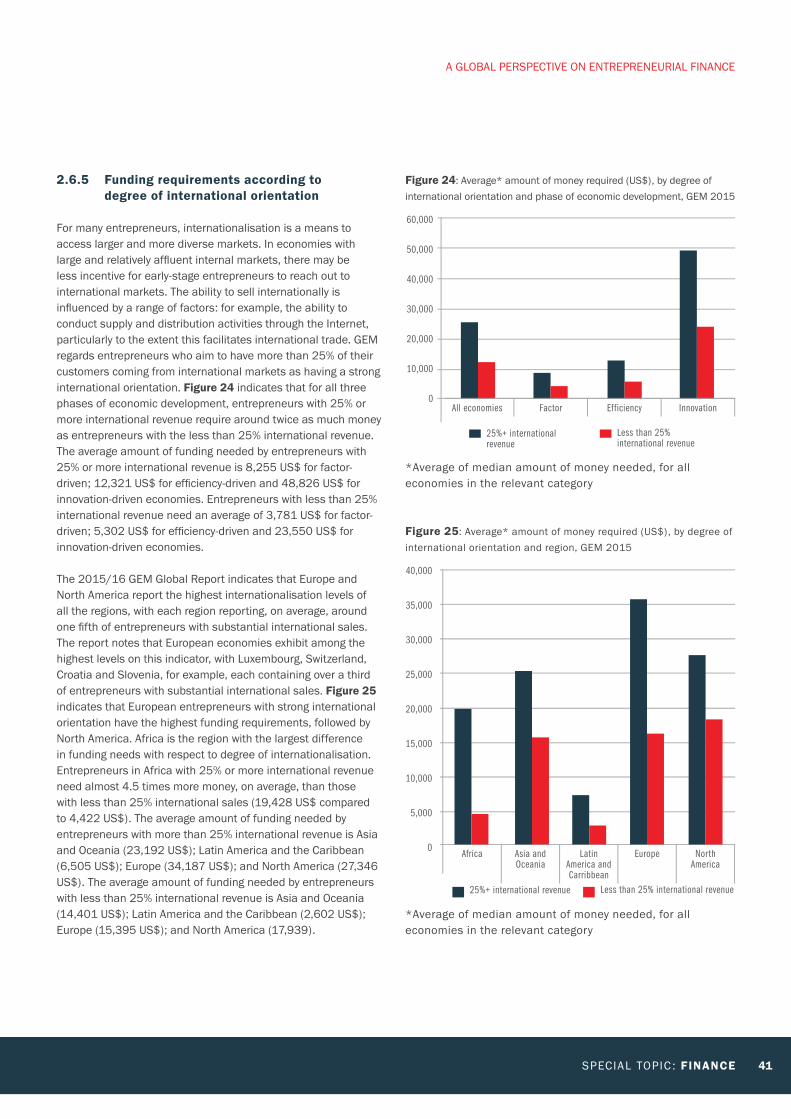
SPECIAL TOPIC : FINANCE 41
Figure 24: Average* amount of money required (US$), by degree of international orientation and phase of economic development, GEM 2015
*Average of median amount of money needed, for all economies in the relevant category
Less than 25% international revenue
25%+ international revenue
60,000
50,000
40,000
30,000
20,000
10,000
0All economies Factor Efficiency Innovation
Figure 25: Average* amount of money required (US$), by degree of international orientation and region, GEM 2015
*Average of median amount of money needed, for all economies in the relevant category
Africa Asia and Oceania
Latin America and Carribbean
Europe North America
40,000
35,000
30,000
25,000
20,000
15,000
10,000
5,000
0
Less than 25% international revenue25%+ international revenue
2.6.5 Funding requirements according to degree of international orientation
For many entrepreneurs, internationalisation is a means to access larger and more diverse markets. In economies with large and relatively affl uent internal markets, there may be less incentive for early-stage entrepreneurs to reach out to international markets. The ability to sell internationally is infl uenced by a range of factors: for example, the ability to conduct supply and distribution activities through the Internet, particularly to the extent this facilitates international trade. GEM regards entrepreneurs who aim to have more than 25% of their customers coming from international markets as having a strong international orientation. Figure 24 indicates that for all three phases of economic development, entrepreneurs with 25% or more international revenue require around twice as much money as entrepreneurs with the less than 25% international revenue. The average amount of funding needed by entrepreneurs with 25% or more international revenue is 8,255 US$ for factor-driven; 12,321 US$ for effi ciency-driven and 48,826 US$ for innovation-driven economies. Entrepreneurs with less than 25% international revenue need an average of 3,781 US$ for factor-driven; 5,302 US$ for effi ciency-driven and 23,550 US$ for innovation-driven economies.
The 2015/16 GEM Global Report indicates that Europe and North America report the highest internationalisation levels of all the regions, with each region reporting, on average, around one fi fth of entrepreneurs with substantial international sales. The report notes that European economies exhibit among the highest levels on this indicator, with Luxembourg, Switzerland, Croatia and Slovenia, for example, each containing over a third of entrepreneurs with substantial international sales. Figure 25 indicates that European entrepreneurs with strong international orientation have the highest funding requirements, followed by North America. Africa is the region with the largest difference in funding needs with respect to degree of internationalisation. Entrepreneurs in Africa with 25% or more international revenue need almost 4.5 times more money, on average, than those with less than 25% international sales (19,428 US$ compared to 4,422 US$). The average amount of funding needed by entrepreneurs with more than 25% international revenue is Asia and Oceania (23,192 US$); Latin America and the Caribbean (6,505 US$); Europe (34,187 US$); and North America (27,346 US$). The average amount of funding needed by entrepreneurs with less than 25% international revenue is Asia and Oceania (14,401 US$); Latin America and the Caribbean (2,602 US$); Europe (15,395 US$); and North America (17,939).
A GLOBAL PERSPECTIVE ON ENTREPRENEURIAL FINANCE
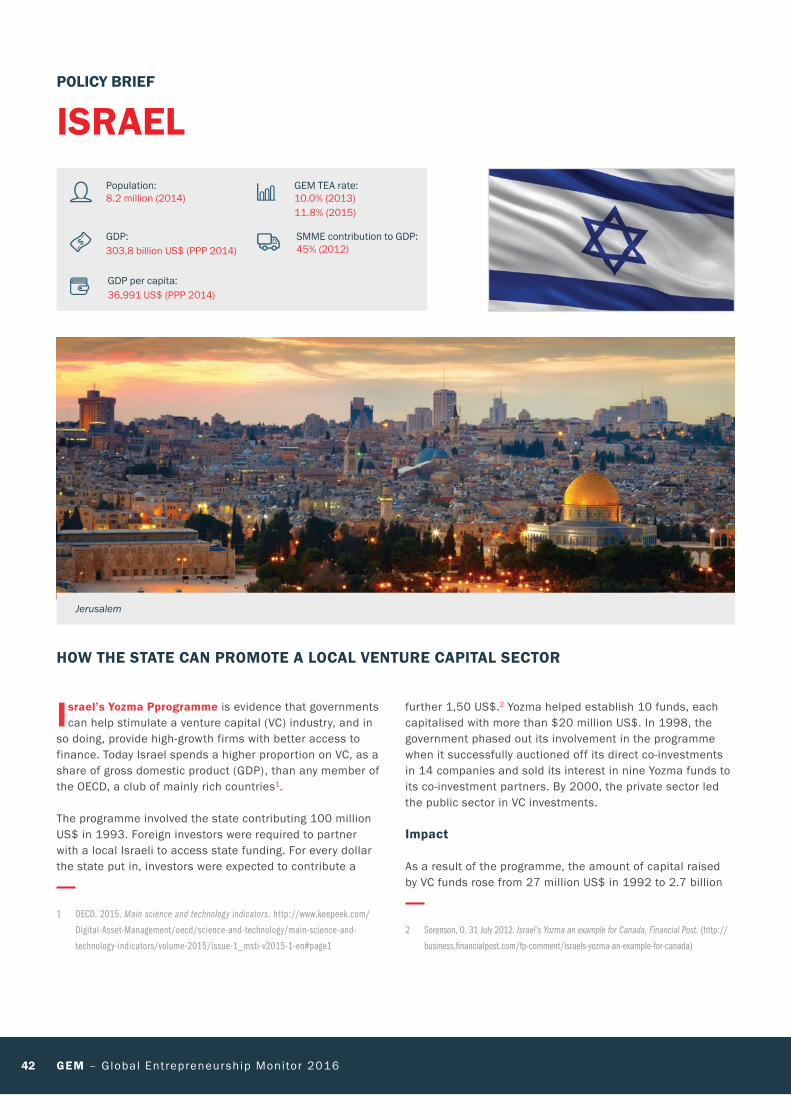
42 GEM – Global Entrepreneurship Monitor 2016
Israel’s Yozma Pprogramme is evidence that governments can help stimulate a venture capital (VC) industry, and in
so doing, provide high-growth firms with better access to finance. Today Israel spends a higher proportion on VC, as a share of gross domestic product (GDP), than any member of the OECD, a club of mainly rich countries1.
The programme involved the state contributing 100 million US$ in 1993. Foreign investors were required to partner with a local Israeli to access state funding. For every dollar the state put in, investors were expected to contribute a
1 OECD. 2015. Main science and technology indicators. http://www.keepeek.com/
Digital-Asset-Management/oecd/science-and-technology/main-science-and-
technology-indicators/volume-2015/issue-1_msti-v2015-1-en#page1
Population: 8.2 million (2014)
GDP: 303,8 billion US$ (PPP 2014)
GDP per capita: 36,991 US$ (PPP 2014)
GEM TEA rate: 10.0% (2013)11.8% (2015)
SMME contribution to GDP:45% (2012)
Jerusalem
further 1,50 US$.2 Yozma helped establish 10 funds, each capitalised with more than $20 million US$. In 1998, the government phased out its involvement in the programme when it successfully auctioned off its direct co-investments in 14 companies and sold its interest in nine Yozma funds to its co-investment partners. By 2000, the private sector led the public sector in VC investments.
Impact
As a result of the programme, the amount of capital raised by VC funds rose from 27 million US$ in 1992 to 2.7 billion
2 Sorenson, O. 31 July 2012. Israel’s Yozma an example for Canada, Financial Post. (http://
business.financialpost.com/fp-comment/israels-yozma-an-example-for-canada)
POLICY BRIEF
ISRAEL
HOW THE STATE CAN PROMOTE A LOCAL VENTURE CAPITAL SECTOR
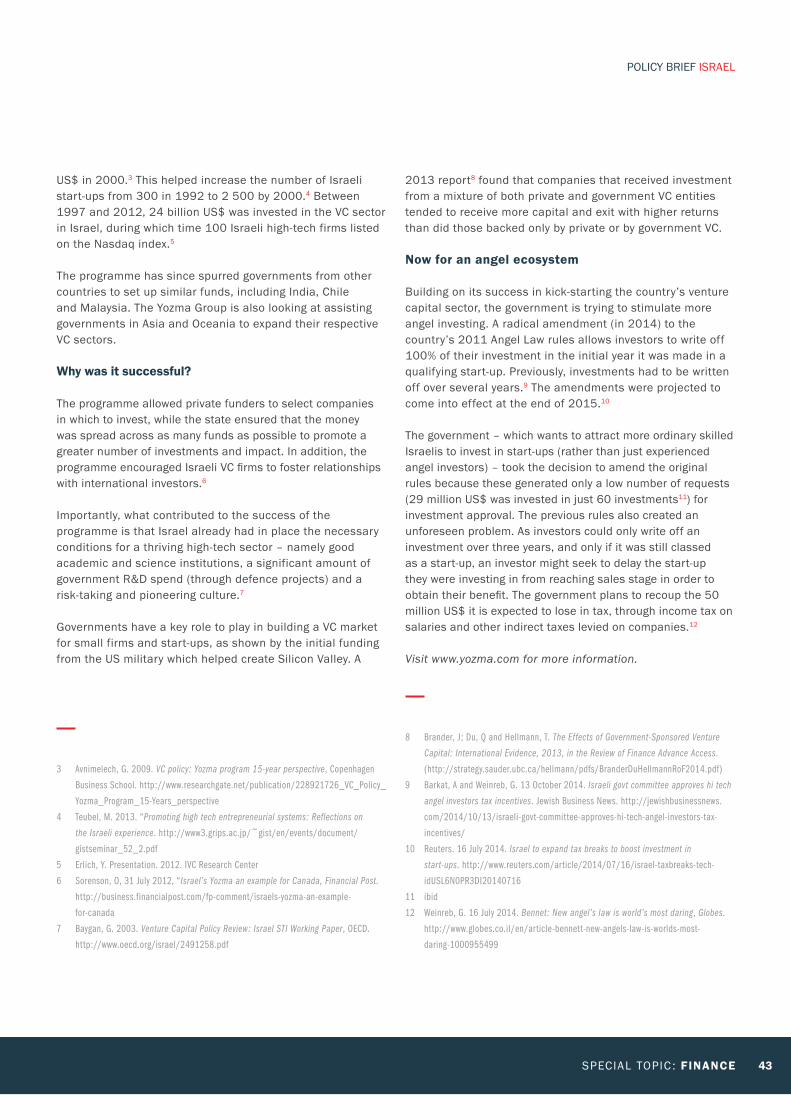
SPECIAL TOPIC : FINANCE 43
US$ in 2000.3 This helped increase the number of Israeli start-ups from 300 in 1992 to 2 500 by 2000.4 Between 1997 and 2012, 24 billion US$ was invested in the VC sector in Israel, during which time 100 Israeli high-tech firms listed on the Nasdaq index.5
The programme has since spurred governments from other countries to set up similar funds, including India, Chile and Malaysia. The Yozma Group is also looking at assisting governments in Asia and Oceania to expand their respective VC sectors.
Why was it successful?
The programme allowed private funders to select companies in which to invest, while the state ensured that the money was spread across as many funds as possible to promote a greater number of investments and impact. In addition, the programme encouraged Israeli VC firms to foster relationships with international investors.6
Importantly, what contributed to the success of the programme is that Israel already had in place the necessary conditions for a thriving high-tech sector – namely good academic and science institutions, a significant amount of government R&D spend (through defence projects) and a risk-taking and pioneering culture.7
Governments have a key role to play in building a VC market for small firms and start-ups, as shown by the initial funding from the US military which helped create Silicon Valley. A
3 Avnimelech, G. 2009. VC policy: Yozma program 15-year perspective, Copenhagen
Business School. http://www.researchgate.net/publication/228921726_VC_Policy_
Yozma_Program_15-Years_perspective
4 Teubel, M. 2013. “Promoting high tech entrepreneurial systems: Reflections on
the Israeli experience. http://www3.grips.ac.jp/~gist/en/events/document/
gistseminar_52_2.pdf
5 Erlich, Y. Presentation. 2012. IVC Research Center
6 Sorenson, O, 31 July 2012, “Israel’s Yozma an example for Canada, Financial Post.
http://business.financialpost.com/fp-comment/israels-yozma-an-example-
for-canada
7 Baygan, G. 2003. Venture Capital Policy Review: Israel STI Working Paper, OECD.
http://www.oecd.org/israel/2491258.pdf
2013 report8 found that companies that received investment from a mixture of both private and government VC entities tended to receive more capital and exit with higher returns than did those backed only by private or by government VC.
Now for an angel ecosystem
Building on its success in kick-starting the country’s venture capital sector, the government is trying to stimulate more angel investing. A radical amendment (in 2014) to the country’s 2011 Angel Law rules allows investors to write off 100% of their investment in the initial year it was made in a qualifying start-up. Previously, investments had to be written off over several years.9 The amendments were projected to come into effect at the end of 2015.10
The government – which wants to attract more ordinary skilled Israelis to invest in start-ups (rather than just experienced angel investors) – took the decision to amend the original rules because these generated only a low number of requests (29 million US$ was invested in just 60 investments11) for investment approval. The previous rules also created an unforeseen problem. As investors could only write off an investment over three years, and only if it was still classed as a start-up, an investor might seek to delay the start-up they were investing in from reaching sales stage in order to obtain their benefit. The government plans to recoup the 50 million US$ it is expected to lose in tax, through income tax on salaries and other indirect taxes levied on companies.12
Visit www.yozma.com for more information.
8 Brander, J ; Du, Q and Hellmann, T. The Effects of Government-Sponsored Venture
Capital: International Evidence, 2013, in the Review of Finance Advance Access.
(http://strategy.sauder.ubc.ca/hellmann/pdfs/BranderDuHellmannRoF2014.pdf)
9 Barkat, A and Weinreb, G. 13 October 2014. Israeli govt committee approves hi tech
angel investors tax incentives. Jewish Business News. http://jewishbusinessnews.
com/2014/10/13/israeli-govt-committee-approves-hi-tech-angel-investors-tax-
incentives/
10 Reuters. 16 July 2014. Israel to expand tax breaks to boost investment in
start-ups. http://www.reuters.com/article/2014/07/16/israel-taxbreaks-tech-
idUSL6N0PR3DI20140716
11 ibid
12 Weinreb, G. 16 July 2014. Bennet: New angel’s law is world’s most daring, Globes.
http://www.globes.co.il/en/article-bennett-new-angels-law-is-worlds-most-
daring-1000955499
POLICY BRIEF ISRAEL

44 GEM – Global Entrepreneurship Monitor 2016
BUILDING THE ENTREPRENEURIAL COMMUNITY
The world is a set of differing economic and financial systems operating as one, global business network. It is a puzzle that
is moving towards forming a single coherent picture, but today the shapes of the independent pieces do not quite fit. Technology and social innovation are spurring changes in access to financial infrastructure through the Internet of Things (IoT), mobile access, and the sharing of knowledge. Differences in infrastructure, although still vast, are becoming less so. Entrepreneurs of today and tomorrow are recognising that economic opportunity relies on not only on access to finance and communication, as parts of the entrepreneurial ecosystem, but also their own efforts.
Governments and investors are supporting entrepreneurial efforts in more ways than ever before, recognising that economic growth through trade and job opportunities relies on entrepreneurship. In the 60 countries that participated in
CHAPTER 3:
CONCLUSIONS AND RECOMMENDATIONS
the 2015 Global Entrepreneurship Monitor Special Finance Report, we are seeing change occur with positive strides. There are more entrepreneurs, more sources of finance, and more opportunities for individuals and communities to build their economic future. The digital age is making innovation possible at an unprecedented level. However, with global, mobile communications comes the realisation in the most distant regions that inequality and access to resources varies considerably across the globe.
The challenge going forward in the global economy is to develop an entrepreneurial capability and infrastructure in every economy to enable economic success. As the worst effects of the recession are left behind, managing opportunities will rely on the development of entrepreneurial ecosystems through education, government support, and financial resources, as well as the management of how these ecosystems interrelate with the overall global environment and economy.
SPECIAL TOPIC : FINANCE 45
RECOMMENDATIONS
● Encourage education about self-financing and informal investing. Since these are the two forms of finance most often accessed by entrepreneurs, it is important to develop an understanding about grass-roots financing from entrepreneurs and informal investors. Informal investment has an enormous impact on overall entrepreneurial activity. This type of financing is particularly important in developing economies where there are no or few highly structured and sophisticated forms of financing, such as VCs and angel investors. Crowdfunding is very new and not know to the majority of entrepreneurs in these economies.
● Develop entrepreneurial ecosystems in terms of government policy and action, financial infrastructure, education, and access to markets. It is critical to recognise the importance of developing an overall approach to building synergies in entrepreneurial efforts and infrastructures.
● As the world becomes more interconnected, building an understanding of how financial and other resources and requirements for independent states, as well as regional and global trading partners contribute to collaborative efforts will become increasingly key to establishing effective short and long-range programmes.
● Develop government programmes to understand funding requirements in factor-driven, efficiency-driven and innovation-driven economies and to support entrepreneurial finance education with banks and other financial institutions. Whereas grass-roots funding is prevalent among entrepreneurial ventures, VC supports high growth, scalable opportunities. Healthy financial ecosystems need to have an array of financial resources and an understanding of which funding is most effective for varying stages of a venture’s activity.
● Build partnerships among entrepreneurs and innovation community members – including investors, corporations, and universities – through structures such as accelerators, incubators and clusters to enable experimentation and learning. Opportunities for entrepreneurs to experiment and learn create a more successful set of entrepreneurial ventures.
● Encourage and support the efforts of women in entrepreneurship, in order to address the gender gap. Women more often return the fruits of labour to the community. Building programmes to support women entrepreneurs contributes to a healthy community economy. Governments, in conjunction with the private sector, should initiate funds that are accessible to women
without requiring the normal forms of security such as collateral. Funding criteria should be based upon risk rather than assets.
● Encourage and regulate the development of mobile payments and market systems for goods and services in economies with less robust financial infrastructures, in order to build entrepreneurial capabilities to connect entrepreneurial ventures to markets and financial resources. This is particularly important in developing economies, where traditional forms of banking are not readily available.
● Develop effective crowdfunding and other peer-to-peer platforms and regulations to efficiently allow individuals to informally invest, cognisant of the risk and rewards available. Allowing the entrepreneurial community to see which ventures gain support and thrive or fail builds knowledge currency about essential entrepreneurial skills.
● Develop and support microfinance in factor-driven economies and in geographic areas of efficiency-driven economies and innovation economies that are underserved. Microfinance has the capacity to achieve broad social goals.
● Understand skill gaps and develop an educational infrastructure to address these gaps – particularly in economies with lower median ages and high unemployment. Building an assessment of entrepreneurial skills, resources and markets creates a map of opportunity development.
● Encourage partnerships between countries with aging populations and high employment and countries with younger median ages and high unemployment. Diverse partnerships with complementary interests can foster new opportunities for development.
● Build digital infrastructure capabilities in areas beyond cities that make use of climate positive energy resources when possible and ‘off the grid’ energy sources where necessary, in order to connect remote entrepreneurs with markets.
● Co-ordinate business partnerships among industries and entrepreneurs to create a pipeline of innovation and investment and a dialogue between new and existing businesses.
● Encourage government and financial institutions to build a data-base of potential funders that who are easily accessible and do not require long and complicated Internet searches.
● Offer tax breaks to potential investors that incentivise them to invest in relatively high-risk ventures, as has been done in Israel and Chile. Institutional funding should also be channelled into establishing VC funds.
● New funding models need to be explored that encourage development of the informal sector and encourage ventures in this sector to grow and move into the formal economy.
CONCLUSIONS AND RECOMMENDATIONS
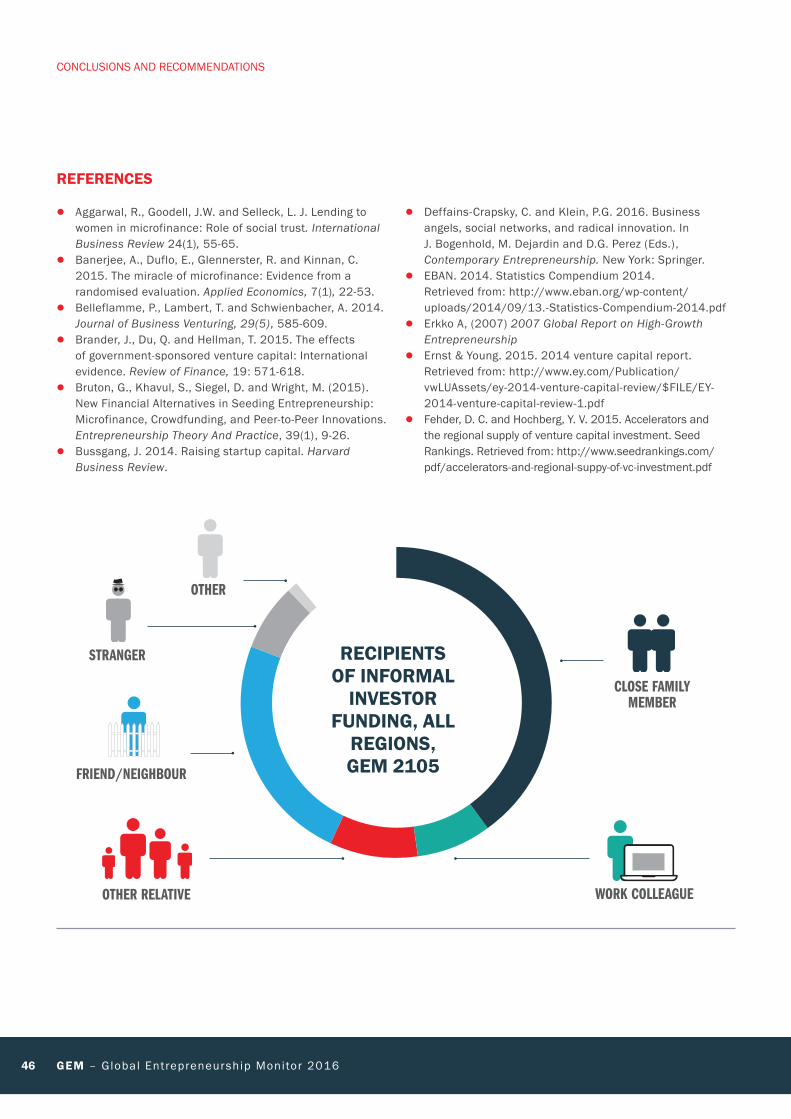
46 GEM – Global Entrepreneurship Monitor 2016
REFERENCES
● Aggarwal, R., Goodell, J.W. and Selleck, L. J. Lending to women in microfinance: Role of social trust. International Business Review 24(1), 55-65.
● Banerjee, A., Duflo, E., Glennerster, R. and Kinnan, C. 2015. The miracle of microfinance: Evidence from a randomised evaluation. Applied Economics, 7(1), 22-53.
● Belleflamme, P., Lambert, T. and Schwienbacher, A. 2014. Journal of Business Venturing, 29(5), 585-609.
● Brander, J., Du, Q. and Hellman, T. 2015. The effects of government-sponsored venture capital: International evidence. Review of Finance, 19: 571-618.
● Bruton, G., Khavul, S., Siegel, D. and Wright, M. (2015). New Financial Alternatives in Seeding Entrepreneurship: Microfinance, Crowdfunding, and Peer-to-Peer Innovations. Entrepreneurship Theory And Practice, 39(1), 9-26.
● Bussgang, J. 2014. Raising startup capital. Harvard Business Review.
● Deffains-Crapsky, C. and Klein, P.G. 2016. Business angels, social networks, and radical innovation. In J. Bogenhold, M. Dejardin and D.G. Perez (Eds.), Contemporary Entrepreneurship. New York: Springer.
● EBAN. 2014. Statistics Compendium 2014. Retrieved from: http://www.eban.org/wp-content/uploads/2014/09/13.-Statistics-Compendium-2014.pdf
● Erkko A, (2007) 2007 Global Report on High-Growth Entrepreneurship
● Ernst & Young. 2015. 2014 venture capital report. Retrieved from: http://www.ey.com/Publication/vwLUAssets/ey-2014-venture-capital-review/$FILE/EY-2014-venture-capital-review-1.pdf
● Fehder, D. C. and Hochberg, Y. V. 2015. Accelerators and the regional supply of venture capital investment. Seed Rankings. Retrieved from: http://www.seedrankings.com/pdf/accelerators-and-regional-suppy-of-vc-investment.pdf
CONCLUSIONS AND RECOMMENDATIONS
OTHER
STRANGER
FRIEND/NEIGHBOUR
OTHER RELATIVE WORK COLLEAGUE
CLOSE FAMILY MEMBER
RECIPIENTS OF INFORMAL
INVESTOR FUNDING, ALL
REGIONS, GEM 2105
SPECIAL TOPIC : FINANCE 47
● Grameen Foundation Annual Report 2014-2015 When Micro Goes Mobile. http://www.grameenfoundation.org/sites/default/files/ Grameen_Foundation_2014-2015_Annual_Report.pdf
● Gregson, G. 2014. Financing new ventures: An entrepreneur’s guide to business angel investment. Business Expert Press.
● Hallen, B. L., Bingham, C.B. and Cohen, S. (2014 January). Do accelerators accelerate? A study of venture accelerators as a path to success? Paper presented at the Academy of Management. doi: 10.5465/AMBPP.2014.185
● Hathaway, I. 2016. Accelerating growth: Startup accelerator programmes in the United States. Brookings Institute. Retrieved from: http://www.brookings.edu/research/papers/2016/02/17-startup-accelerator-programs-hathaway
● International Labour Organisation. World Employment and Social Outlook: Trends 2015/International Labour Office. Geneva: ILO, 2015.
● International Labour Organisation. World Employment and Social Outlook: Trends 2016/International Labour Office. Geneva: ILO, 2016
● Kelley, D., Brush, C., Greene, P., Herrington, M., Ali, A. and Kew, P. Global Entrepreneurship Monitor 2014/15: Special Report on Women’s Entrepreneurship. Global Entrepreneurship Research Association, 2015. www.gemconsortium.org
● Kelley, D., Singer, S. and Herrington, M. Global Entrepreneurship Monitor 2015/16: Global Report. Global
● Entrepreneurship Research Association, 2016. ● www.gemconsortium.org ● Marom, D., Robb, A. and Orly, S. 2016. Gender dynamics
in crowdfunding (Kickstarter): Evidence on entrepreneurs, investors, deals and taste-based discrimination (working paper). Retrieved from: http://papers.ssrn.com/sol3/papers.cfm?abstract_id=2442954
● Mason, C.M., Harrison, R. and Botelho, T. 2016. Business angel exits: Strategies and processes. In J. G. Hussain and J. M. Scott (Eds.), International research handbook on entrepreneurial finance. Cheltenham: Edward Elgar.
● Mollick, E.R. and Kuppuswamy, V. 2014. After the campaign: outcomes of crowdfunding (UNC Kenan-Flagler Research Paper No. 2376997). Retrieved from: http://papers.ssrn.com/sol3/papers.cfm?abstract_id=2376997
● Moritz, A. and Block J.H. 2014. Crowdfunding: A literature review and research directions. Zeitschrift für KMU und Entrepreneurship, 62(1), 57-89.
● PWC. 2015. Peer pressure: How peer-to-peer platforms are transforming the consumer lending industry. Retrieved from: http://www.pwc.com/us/en/consumer-finance/publications/assets/peer-to-peer-lending.pdf
● Rao, D. 22 July 2013. Why 99.5% of entrepreneurs should stop wasting time seeking venture capital. Forbes. Retrieved from: http://www.forbes.com/sites/dileeprao/2013/07/22/why-99-95-of-entrepreneurs-should-stop-wasting-time-seeking-venture-capital/#7946a70b296d
● Sabin, N. 2016. Microfinance: A field in flux. In A. Nicholls, R. Paton and J. Emerson (Eds.), Social Finance. Oxford: Oxford University Press.
● Schwab, K. and Sala-i-Martín, X. 2015. World Economic Forum: The Global Competitiveness Report 2015/16. http://www.weforum.org/reports/global-competitiveness-report-2015-2016
● Smith, S.W. and Hannigan, T.J. 15 June 2015. Swinging for the fences: How to top accelerators impact the trajectories of new ventures? Paper presented at Druid Society 15, Rome. Retrieved from: http://druid8.sit.aau.dk/acc_papers/5ntuo6s1r5dvrpf032x24x5on5lq.pdf
● Vanham, Peter. 2015. World Economic Forum: Which countries have the most venture capital investments? https://www.weforum.org/agenda/2015/07/which-countries-have-the-most-venture-capital-investments/
● Wash, R. and Soloman, J. 2014. Co-ordinating donors on crowdfunding websites. Paper presented at Proceedings of the 17th ACM conference on Computer supported cooperative work and social computing. doi: 10.1145/2531602.2531678
● World Bank. 16 November 2015. SMMEs financing: Women entrepreneurs in Ethiopia. The World Bank. Retrieved from: http://www.worldbank.org/en/news/feature/2015/11/16/financing-women-entrepreneurs-in-ethiopia
● Xusheng, Y. 2014. Inside China: Reining in P2P lending. International Financial Law Review, 33(6), 224.
CONCLUSIONS AND RECOMMENDATIONS
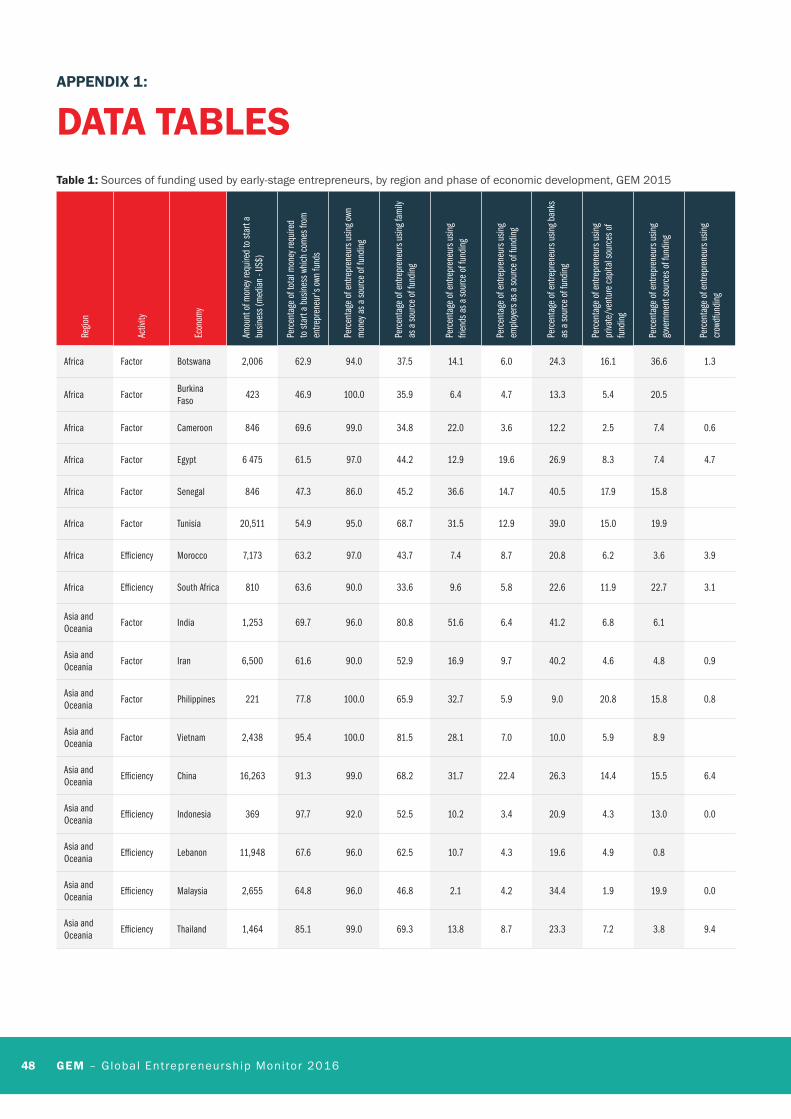
48 GEM – Global Entrepreneurship Monitor 2016
APPENDIX 1:
DATA TABLESTable 1: Sources of funding used by early-stage entrepreneurs, by region and phase of economic development, GEM 2015
Regio
n
Activ
ity
Econ
omy
Amou
nt o
f mon
ey re
quire
d to
star
t a
busin
ess (
med
ian
- US$
)
Perc
enta
ge o
f tot
al m
oney
requ
ired
to st
art a
bus
ines
s whi
ch c
omes
from
en
trepr
eneu
r's o
wn fu
nds
Perc
enta
ge o
f ent
repr
eneu
rs u
sing o
wn
mon
ey a
s a so
urce
of f
undi
ng
Perc
enta
ge o
f ent
repr
eneu
rs u
sing f
amily
as
a so
urce
of f
undi
ng
Perc
enta
ge o
f ent
repr
eneu
rs u
sing
frien
ds a
s a so
urce
of f
undi
ng
Perc
enta
ge o
f ent
repr
eneu
rs u
sing
empl
oyer
s as a
sour
ce o
f fun
ding
Perc
enta
ge o
f ent
repr
eneu
rs u
sing b
anks
as
a so
urce
of f
undi
ng
Perc
enta
ge o
f ent
repr
eneu
rs u
sing
priva
te/v
entu
re c
apita
l sou
rces
of
fund
ing
Perc
enta
ge o
f ent
repr
eneu
rs u
sing
gove
rnm
ent s
ourc
es o
f fun
ding
Perc
enta
ge o
f ent
repr
eneu
rs u
sing
crow
dfun
ding
Africa Factor Botswana 2,006 62.9 94.0 37.5 14.1 6.0 24.3 16.1 36.6 1.3
Africa FactorBurkina Faso
423 46.9 100.0 35.9 6.4 4.7 13.3 5.4 20.5
Africa Factor Cameroon 846 69.6 99.0 34.8 22.0 3.6 12.2 2.5 7.4 0.6
Africa Factor Egypt 6 475 61.5 97.0 44.2 12.9 19.6 26.9 8.3 7.4 4.7
Africa Factor Senegal 846 47.3 86.0 45.2 36.6 14.7 40.5 17.9 15.8
Africa Factor Tunisia 20,511 54.9 95.0 68.7 31.5 12.9 39.0 15.0 19.9
Africa Efficiency Morocco 7,173 63.2 97.0 43.7 7.4 8.7 20.8 6.2 3.6 3.9
Africa Efficiency South Africa 810 63.6 90.0 33.6 9.6 5.8 22.6 11.9 22.7 3.1
Asia and Oceania
Factor India 1,253 69.7 96.0 80.8 51.6 6.4 41.2 6.8 6.1
Asia and Oceania
Factor Iran 6,500 61.6 90.0 52.9 16.9 9.7 40.2 4.6 4.8 0.9
Asia and Oceania
Factor Philippines 221 77.8 100.0 65.9 32.7 5.9 9.0 20.8 15.8 0.8
Asia and Oceania
Factor Vietnam 2,438 95.4 100.0 81.5 28.1 7.0 10.0 5.9 8.9
Asia and Oceania
Efficiency China 16,263 91.3 99.0 68.2 31.7 22.4 26.3 14.4 15.5 6.4
Asia and Oceania
Efficiency Indonesia 369 97.7 92.0 52.5 10.2 3.4 20.9 4.3 13.0 0.0
Asia and Oceania
Efficiency Lebanon 11,948 67.6 96.0 62.5 10.7 4.3 19.6 4.9 0.8
Asia and Oceania
Efficiency Malaysia 2,655 64.8 96.0 46.8 2.1 4.2 34.4 1.9 19.9 0.0
Asia and Oceania
Efficiency Thailand 1,464 85.1 99.0 69.3 13.8 8.7 23.3 7.2 3.8 9.4
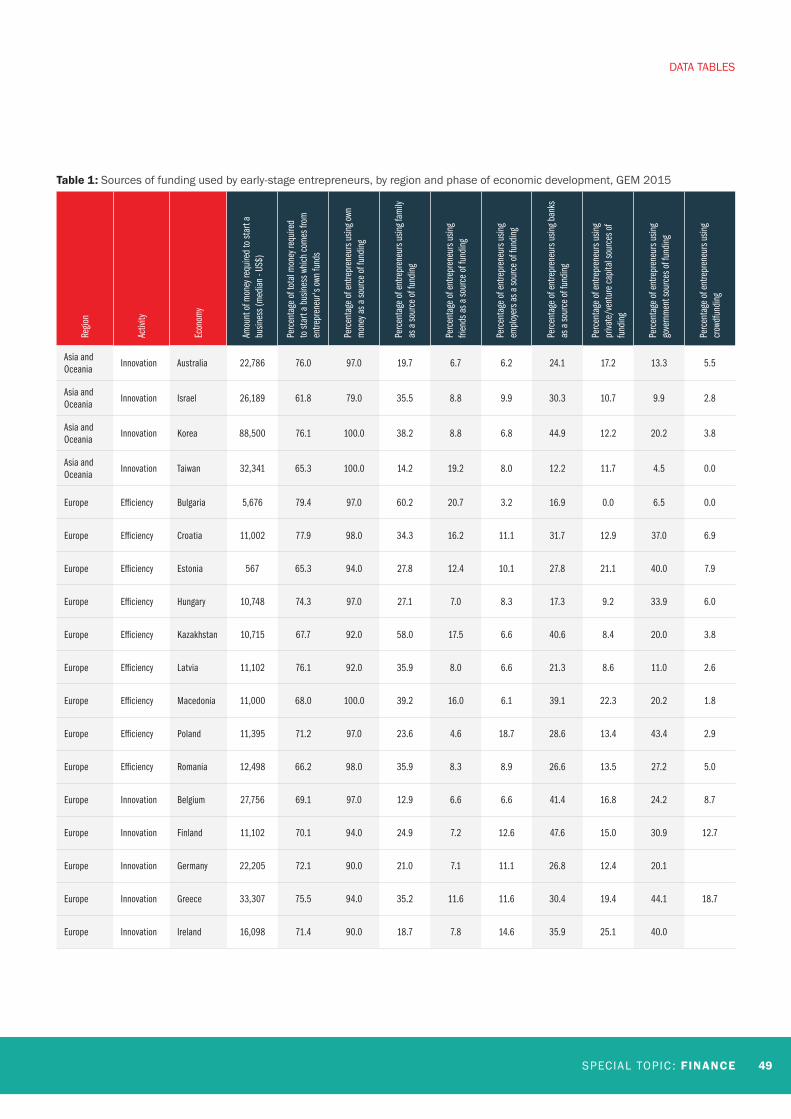
SPECIAL TOPIC : FINANCE 49
Table 1: Sources of funding used by early-stage entrepreneurs, by region and phase of economic development, GEM 2015
Regio
n
Activ
ity
Econ
omy
Amou
nt o
f mon
ey re
quire
d to
star
t a
busin
ess (
med
ian
- US$
)
Perc
enta
ge o
f tot
al m
oney
requ
ired
to st
art a
bus
ines
s whi
ch c
omes
from
en
trepr
eneu
r's o
wn fu
nds
Perc
enta
ge o
f ent
repr
eneu
rs u
sing o
wn
mon
ey a
s a so
urce
of f
undi
ng
Perc
enta
ge o
f ent
repr
eneu
rs u
sing f
amily
as
a so
urce
of f
undi
ng
Perc
enta
ge o
f ent
repr
eneu
rs u
sing
frien
ds a
s a so
urce
of f
undi
ng
Perc
enta
ge o
f ent
repr
eneu
rs u
sing
empl
oyer
s as a
sour
ce o
f fun
ding
Perc
enta
ge o
f ent
repr
eneu
rs u
sing b
anks
as
a so
urce
of f
undi
ng
Perc
enta
ge o
f ent
repr
eneu
rs u
sing
priva
te/v
entu
re c
apita
l sou
rces
of
fund
ing
Perc
enta
ge o
f ent
repr
eneu
rs u
sing
gove
rnm
ent s
ourc
es o
f fun
ding
Perc
enta
ge o
f ent
repr
eneu
rs u
sing
crow
dfun
ding
Asia and Oceania
Innovation Australia 22,786 76.0 97.0 19.7 6.7 6.2 24.1 17.2 13.3 5.5
Asia and Oceania
Innovation Israel 26,189 61.8 79.0 35.5 8.8 9.9 30.3 10.7 9.9 2.8
Asia and Oceania
Innovation Korea 88,500 76.1 100.0 38.2 8.8 6.8 44.9 12.2 20.2 3.8
Asia and Oceania
Innovation Taiwan 32,341 65.3 100.0 14.2 19.2 8.0 12.2 11.7 4.5 0.0
Europe Efficiency Bulgaria 5,676 79.4 97.0 60.2 20.7 3.2 16.9 0.0 6.5 0.0
Europe Efficiency Croatia 11,002 77.9 98.0 34.3 16.2 11.1 31.7 12.9 37.0 6.9
Europe Efficiency Estonia 567 65.3 94.0 27.8 12.4 10.1 27.8 21.1 40.0 7.9
Europe Efficiency Hungary 10,748 74.3 97.0 27.1 7.0 8.3 17.3 9.2 33.9 6.0
Europe Efficiency Kazakhstan 10,715 67.7 92.0 58.0 17.5 6.6 40.6 8.4 20.0 3.8
Europe Efficiency Latvia 11,102 76.1 92.0 35.9 8.0 6.6 21.3 8.6 11.0 2.6
Europe Efficiency Macedonia 11,000 68.0 100.0 39.2 16.0 6.1 39.1 22.3 20.2 1.8
Europe Efficiency Poland 11,395 71.2 97.0 23.6 4.6 18.7 28.6 13.4 43.4 2.9
Europe Efficiency Romania 12,498 66.2 98.0 35.9 8.3 8.9 26.6 13.5 27.2 5.0
Europe Innovation Belgium 27,756 69.1 97.0 12.9 6.6 6.6 41.4 16.8 24.2 8.7
Europe Innovation Finland 11,102 70.1 94.0 24.9 7.2 12.6 47.6 15.0 30.9 12.7
Europe Innovation Germany 22,205 72.1 90.0 21.0 7.1 11.1 26.8 12.4 20.1
Europe Innovation Greece 33,307 75.5 94.0 35.2 11.6 11.6 30.4 19.4 44.1 18.7
Europe Innovation Ireland 16,098 71.4 90.0 18.7 7.8 14.6 35.9 25.1 40.0
DATA TABLES
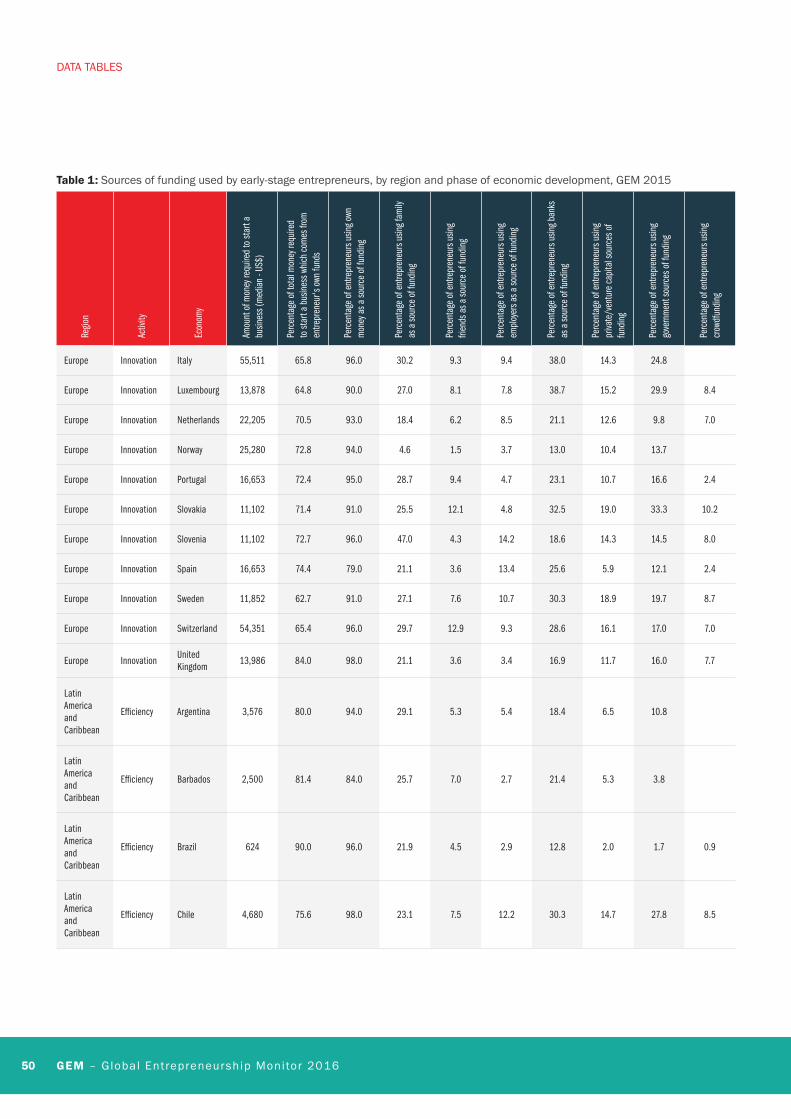
50 GEM – Global Entrepreneurship Monitor 2016
Table 1: Sources of funding used by early-stage entrepreneurs, by region and phase of economic development, GEM 2015
Regio
n
Activ
ity
Econ
omy
Amou
nt o
f mon
ey re
quire
d to
star
t a
busin
ess (
med
ian
- US$
)
Perc
enta
ge o
f tot
al m
oney
requ
ired
to st
art a
bus
ines
s whi
ch c
omes
from
en
trepr
eneu
r's o
wn fu
nds
Perc
enta
ge o
f ent
repr
eneu
rs u
sing o
wn
mon
ey a
s a so
urce
of f
undi
ng
Perc
enta
ge o
f ent
repr
eneu
rs u
sing f
amily
as
a so
urce
of f
undi
ng
Perc
enta
ge o
f ent
repr
eneu
rs u
sing
frien
ds a
s a so
urce
of f
undi
ng
Perc
enta
ge o
f ent
repr
eneu
rs u
sing
empl
oyer
s as a
sour
ce o
f fun
ding
Perc
enta
ge o
f ent
repr
eneu
rs u
sing b
anks
as
a so
urce
of f
undi
ng
Perc
enta
ge o
f ent
repr
eneu
rs u
sing
priva
te/v
entu
re c
apita
l sou
rces
of
fund
ing
Perc
enta
ge o
f ent
repr
eneu
rs u
sing
gove
rnm
ent s
ourc
es o
f fun
ding
Perc
enta
ge o
f ent
repr
eneu
rs u
sing
crow
dfun
ding
Europe Innovation Italy 55,511 65.8 96.0 30.2 9.3 9.4 38.0 14.3 24.8
Europe Innovation Luxembourg 13,878 64.8 90.0 27.0 8.1 7.8 38.7 15.2 29.9 8.4
Europe Innovation Netherlands 22,205 70.5 93.0 18.4 6.2 8.5 21.1 12.6 9.8 7.0
Europe Innovation Norway 25,280 72.8 94.0 4.6 1.5 3.7 13.0 10.4 13.7
Europe Innovation Portugal 16,653 72.4 95.0 28.7 9.4 4.7 23.1 10.7 16.6 2.4
Europe Innovation Slovakia 11,102 71.4 91.0 25.5 12.1 4.8 32.5 19.0 33.3 10.2
Europe Innovation Slovenia 11,102 72.7 96.0 47.0 4.3 14.2 18.6 14.3 14.5 8.0
Europe Innovation Spain 16,653 74.4 79.0 21.1 3.6 13.4 25.6 5.9 12.1 2.4
Europe Innovation Sweden 11,852 62.7 91.0 27.1 7.6 10.7 30.3 18.9 19.7 8.7
Europe Innovation Switzerland 54,351 65.4 96.0 29.7 12.9 9.3 28.6 16.1 17.0 7.0
Europe InnovationUnited Kingdom
13,986 84.0 98.0 21.1 3.6 3.4 16.9 11.7 16.0 7.7
Latin America and Caribbean
Efficiency Argentina 3,576 80.0 94.0 29.1 5.3 5.4 18.4 6.5 10.8
Latin America and Caribbean
Efficiency Barbados 2,500 81.4 84.0 25.7 7.0 2.7 21.4 5.3 3.8
Latin America and Caribbean
Efficiency Brazil 624 90.0 96.0 21.9 4.5 2.9 12.8 2.0 1.7 0.9
Latin America and Caribbean
Efficiency Chile 4,680 75.6 98.0 23.1 7.5 12.2 30.3 14.7 27.8 8.5
DATA TABLES
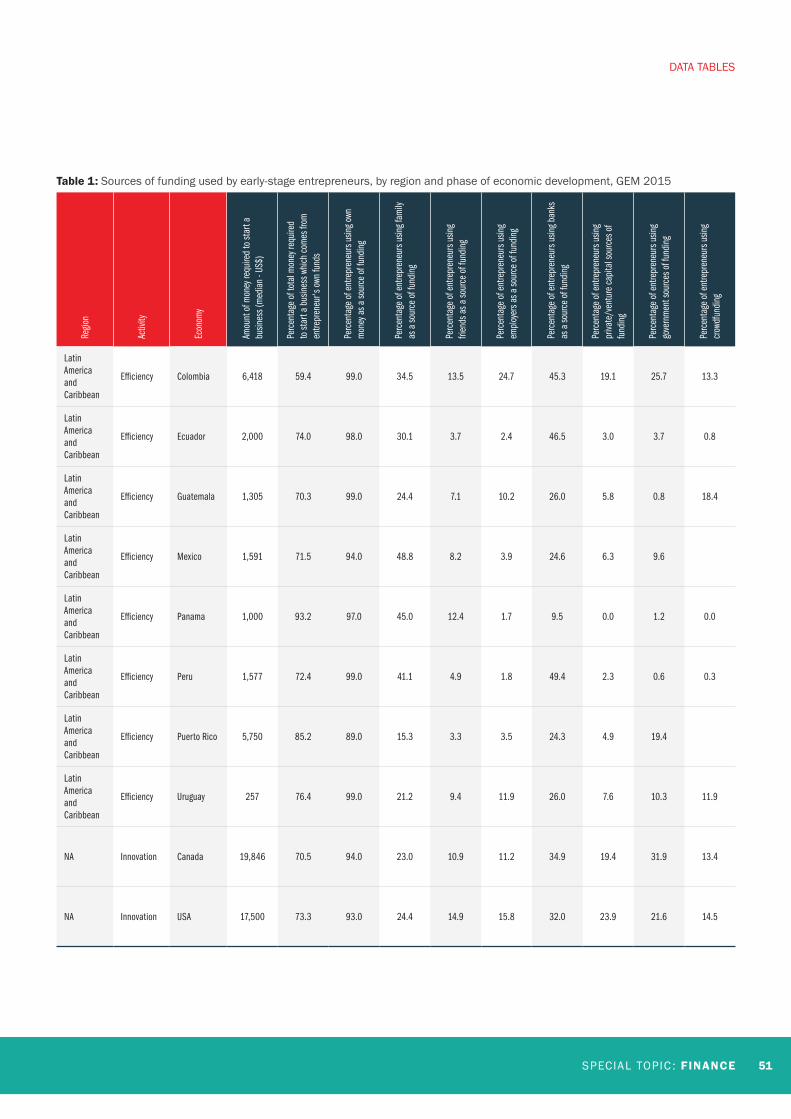
SPECIAL TOPIC : FINANCE 51
Table 1: Sources of funding used by early-stage entrepreneurs, by region and phase of economic development, GEM 2015
Regio
n
Activ
ity
Econ
omy
Amou
nt o
f mon
ey re
quire
d to
star
t a
busin
ess (
med
ian
- US$
)
Perc
enta
ge o
f tot
al m
oney
requ
ired
to st
art a
bus
ines
s whi
ch c
omes
from
en
trepr
eneu
r's o
wn fu
nds
Perc
enta
ge o
f ent
repr
eneu
rs u
sing o
wn
mon
ey a
s a so
urce
of f
undi
ng
Perc
enta
ge o
f ent
repr
eneu
rs u
sing f
amily
as
a so
urce
of f
undi
ng
Perc
enta
ge o
f ent
repr
eneu
rs u
sing
frien
ds a
s a so
urce
of f
undi
ng
Perc
enta
ge o
f ent
repr
eneu
rs u
sing
empl
oyer
s as a
sour
ce o
f fun
ding
Perc
enta
ge o
f ent
repr
eneu
rs u
sing b
anks
as
a so
urce
of f
undi
ng
Perc
enta
ge o
f ent
repr
eneu
rs u
sing
priva
te/v
entu
re c
apita
l sou
rces
of
fund
ing
Perc
enta
ge o
f ent
repr
eneu
rs u
sing
gove
rnm
ent s
ourc
es o
f fun
ding
Perc
enta
ge o
f ent
repr
eneu
rs u
sing
crow
dfun
ding
Latin America and Caribbean
Efficiency Colombia 6,418 59.4 99.0 34.5 13.5 24.7 45.3 19.1 25.7 13.3
Latin America and Caribbean
Efficiency Ecuador 2,000 74.0 98.0 30.1 3.7 2.4 46.5 3.0 3.7 0.8
Latin America and Caribbean
Efficiency Guatemala 1,305 70.3 99.0 24.4 7.1 10.2 26.0 5.8 0.8 18.4
Latin America and Caribbean
Efficiency Mexico 1,591 71.5 94.0 48.8 8.2 3.9 24.6 6.3 9.6
Latin America and Caribbean
Efficiency Panama 1,000 93.2 97.0 45.0 12.4 1.7 9.5 0.0 1.2 0.0
Latin America and Caribbean
Efficiency Peru 1,577 72.4 99.0 41.1 4.9 1.8 49.4 2.3 0.6 0.3
Latin America and Caribbean
Efficiency Puerto Rico 5,750 85.2 89.0 15.3 3.3 3.5 24.3 4.9 19.4
Latin America and Caribbean
Efficiency Uruguay 257 76.4 99.0 21.2 9.4 11.9 26.0 7.6 10.3 11.9
NA Innovation Canada 19,846 70.5 94.0 23.0 10.9 11.2 34.9 19.4 31.9 13.4
NA Innovation USA 17,500 73.3 93.0 24.4 14.9 15.8 32.0 23.9 21.6 14.5
DATA TABLES
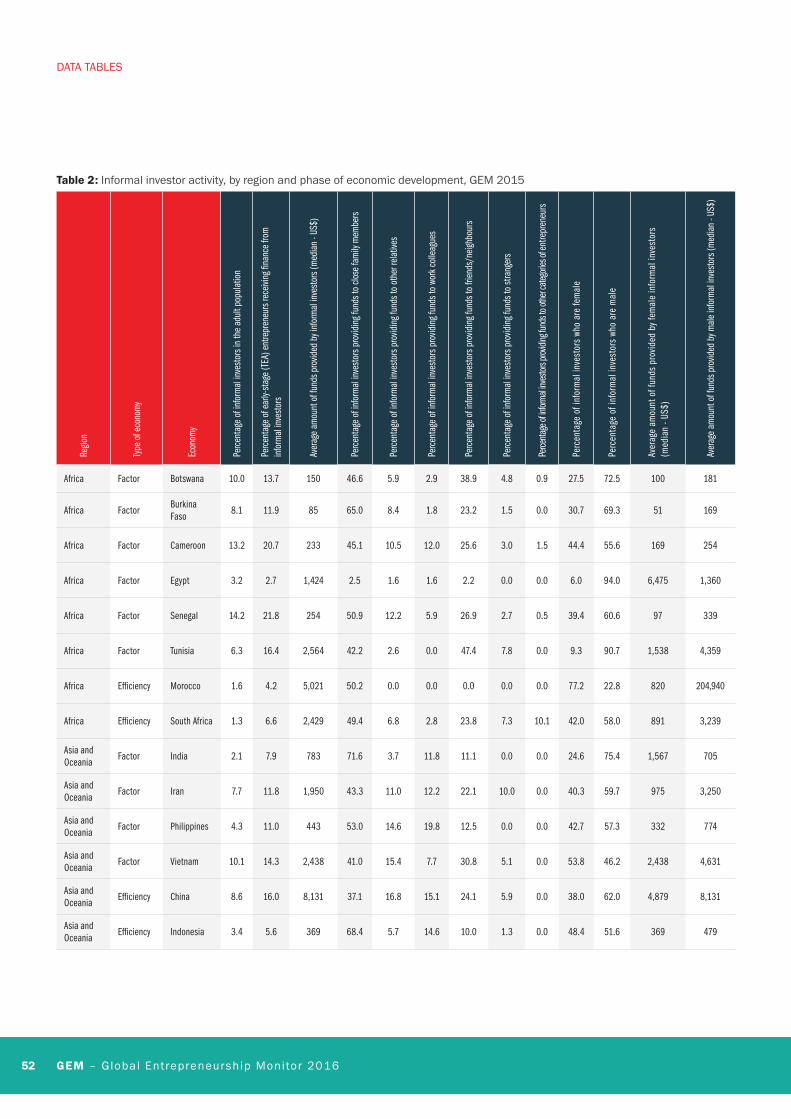
52 GEM – Global Entrepreneurship Monitor 2016
Table 2: Informal investor activity, by region and phase of economic development, GEM 2015
Regio
n
Type
of e
cono
my
Econ
omy
Perc
enta
ge o
f inf
orm
al in
vest
ors i
n th
e ad
ult p
opul
atio
n
Perc
enta
ge o
f ear
ly-st
age
(TEA
) ent
repr
eneu
rs re
ceivi
ng fi
nanc
e fro
m
info
rmal
inve
stor
s
Aver
age
amou
nt o
f fun
ds p
rovid
ed b
y inf
orm
al in
vest
ors (
med
ian
- US$
)
Perc
enta
ge o
f inf
orm
al in
vest
ors p
rovid
ing f
unds
to cl
ose
fam
ily m
embe
rs
Perc
enta
ge o
f inf
orm
al in
vest
ors p
rovid
ing f
unds
to o
ther
rela
tives
Perc
enta
ge o
f inf
orm
al in
vest
ors p
rovid
ing f
unds
to w
ork c
olle
ague
s
Perc
enta
ge o
f inf
orm
al in
vest
ors p
rovid
ing f
unds
to fr
iends
/neig
hbou
rs
Perc
enta
ge o
f inf
orm
al in
vest
ors p
rovid
ing f
unds
to st
rang
ers
Perce
ntage
of in
forma
l inve
stors
prov
iding
fund
s to o
ther c
atego
ries o
f ent
repr
eneu
rs
Perc
enta
ge o
f inf
orm
al in
vest
ors
who
are
fem
ale
Perc
enta
ge o
f inf
orm
al in
vest
ors
who
are
mal
e
Aver
age
amou
nt o
f fun
ds p
rovid
ed b
y fem
ale
info
rmal
inve
stor
s (m
edia
n - U
S$)
Aver
age
amou
nt o
f fun
ds p
rovid
ed b
y mal
e in
form
al in
vest
ors (
med
ian
- US$
)
Africa Factor Botswana 10.0 13.7 150 46.6 5.9 2.9 38.9 4.8 0.9 27.5 72.5 100 181
Africa FactorBurkina Faso
8.1 11.9 85 65.0 8.4 1.8 23.2 1.5 0.0 30.7 69.3 51 169
Africa Factor Cameroon 13.2 20.7 233 45.1 10.5 12.0 25.6 3.0 1.5 44.4 55.6 169 254
Africa Factor Egypt 3.2 2.7 1,424 2.5 1.6 1.6 2.2 0.0 0.0 6.0 94.0 6,475 1,360
Africa Factor Senegal 14.2 21.8 254 50.9 12.2 5.9 26.9 2.7 0.5 39.4 60.6 97 339
Africa Factor Tunisia 6.3 16.4 2,564 42.2 2.6 0.0 47.4 7.8 0.0 9.3 90.7 1,538 4,359
Africa Efficiency Morocco 1.6 4.2 5,021 50.2 0.0 0.0 0.0 0.0 0.0 77.2 22.8 820 204,940
Africa Efficiency South Africa 1.3 6.6 2,429 49.4 6.8 2.8 23.8 7.3 10.1 42.0 58.0 891 3,239
Asia and Oceania
Factor India 2.1 7.9 783 71.6 3.7 11.8 11.1 0.0 0.0 24.6 75.4 1,567 705
Asia and Oceania
Factor Iran 7.7 11.8 1,950 43.3 11.0 12.2 22.1 10.0 0.0 40.3 59.7 975 3,250
Asia and Oceania
Factor Philippines 4.3 11.0 443 53.0 14.6 19.8 12.5 0.0 0.0 42.7 57.3 332 774
Asia and Oceania
Factor Vietnam 10.1 14.3 2,438 41.0 15.4 7.7 30.8 5.1 0.0 53.8 46.2 2,438 4,631
Asia and Oceania
Efficiency China 8.6 16.0 8,131 37.1 16.8 15.1 24.1 5.9 0.0 38.0 62.0 4,879 8,131
Asia and Oceania
Efficiency Indonesia 3.4 5.6 369 68.4 5.7 14.6 10.0 1.3 0.0 48.4 51.6 369 479
DATA TABLES
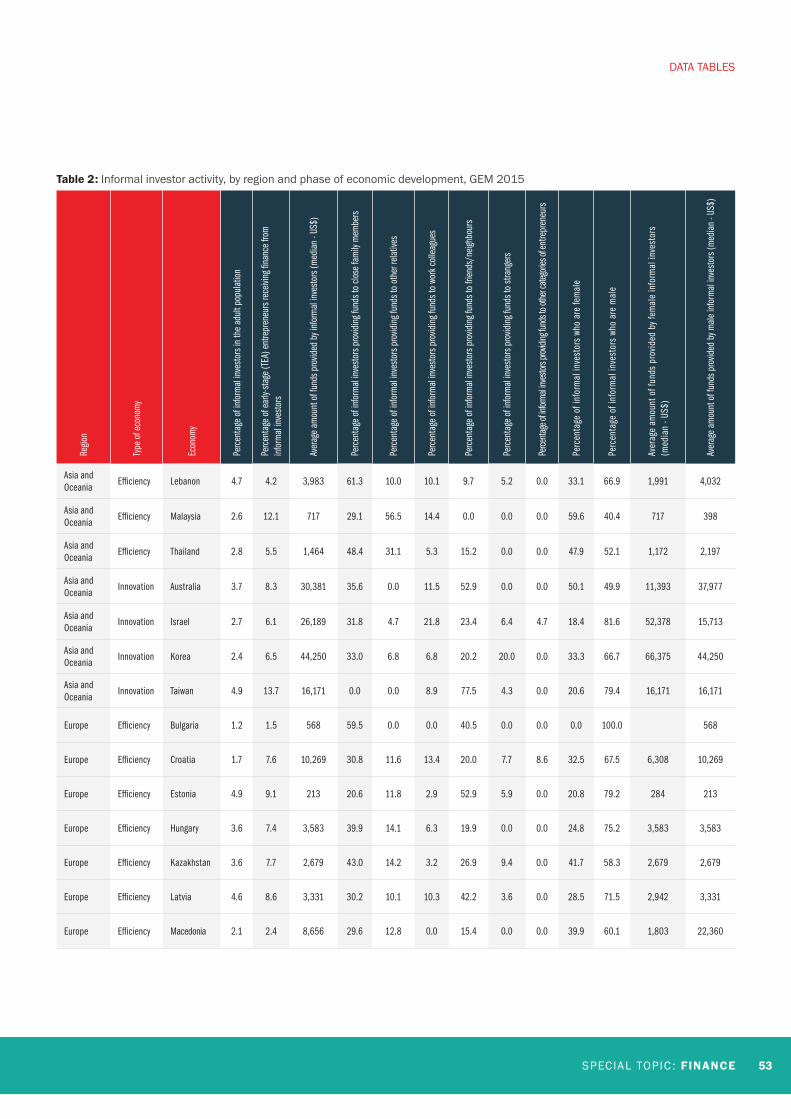
SPECIAL TOPIC : FINANCE 53
Table 2: Informal investor activity, by region and phase of economic development, GEM 2015
Regio
n
Type
of e
cono
my
Econ
omy
Perc
enta
ge o
f inf
orm
al in
vest
ors i
n th
e ad
ult p
opul
atio
n
Perc
enta
ge o
f ear
ly-st
age
(TEA
) ent
repr
eneu
rs re
ceivi
ng fi
nanc
e fro
m
info
rmal
inve
stor
s
Aver
age
amou
nt o
f fun
ds p
rovid
ed b
y inf
orm
al in
vest
ors (
med
ian
- US$
)
Perc
enta
ge o
f inf
orm
al in
vest
ors p
rovid
ing f
unds
to cl
ose
fam
ily m
embe
rs
Perc
enta
ge o
f inf
orm
al in
vest
ors p
rovid
ing f
unds
to o
ther
rela
tives
Perc
enta
ge o
f inf
orm
al in
vest
ors p
rovid
ing f
unds
to w
ork c
olle
ague
s
Perc
enta
ge o
f inf
orm
al in
vest
ors p
rovid
ing f
unds
to fr
iends
/neig
hbou
rs
Perc
enta
ge o
f inf
orm
al in
vest
ors p
rovid
ing f
unds
to st
rang
ers
Perce
ntage
of in
forma
l inve
stors
prov
iding
fund
s to o
ther c
atego
ries o
f ent
repr
eneu
rs
Perc
enta
ge o
f inf
orm
al in
vest
ors
who
are
fem
ale
Perc
enta
ge o
f inf
orm
al in
vest
ors
who
are
mal
e
Aver
age
amou
nt o
f fun
ds p
rovid
ed b
y fem
ale
info
rmal
inve
stor
s (m
edia
n - U
S$)
Aver
age
amou
nt o
f fun
ds p
rovid
ed b
y mal
e in
form
al in
vest
ors (
med
ian
- US$
)
Asia and Oceania
Efficiency Lebanon 4.7 4.2 3,983 61.3 10.0 10.1 9.7 5.2 0.0 33.1 66.9 1,991 4,032
Asia and Oceania
Efficiency Malaysia 2.6 12.1 717 29.1 56.5 14.4 0.0 0.0 0.0 59.6 40.4 717 398
Asia and Oceania
Efficiency Thailand 2.8 5.5 1,464 48.4 31.1 5.3 15.2 0.0 0.0 47.9 52.1 1,172 2,197
Asia and Oceania
Innovation Australia 3.7 8.3 30,381 35.6 0.0 11.5 52.9 0.0 0.0 50.1 49.9 11,393 37,977
Asia and Oceania
Innovation Israel 2.7 6.1 26,189 31.8 4.7 21.8 23.4 6.4 4.7 18.4 81.6 52,378 15,713
Asia and Oceania
Innovation Korea 2.4 6.5 44,250 33.0 6.8 6.8 20.2 20.0 0.0 33.3 66.7 66,375 44,250
Asia and Oceania
Innovation Taiwan 4.9 13.7 16,171 0.0 0.0 8.9 77.5 4.3 0.0 20.6 79.4 16,171 16,171
Europe Efficiency Bulgaria 1.2 1.5 568 59.5 0.0 0.0 40.5 0.0 0.0 0.0 100.0 568
Europe Efficiency Croatia 1.7 7.6 10,269 30.8 11.6 13.4 20.0 7.7 8.6 32.5 67.5 6,308 10,269
Europe Efficiency Estonia 4.9 9.1 213 20.6 11.8 2.9 52.9 5.9 0.0 20.8 79.2 284 213
Europe Efficiency Hungary 3.6 7.4 3,583 39.9 14.1 6.3 19.9 0.0 0.0 24.8 75.2 3,583 3,583
Europe Efficiency Kazakhstan 3.6 7.7 2,679 43.0 14.2 3.2 26.9 9.4 0.0 41.7 58.3 2,679 2,679
Europe Efficiency Latvia 4.6 8.6 3,331 30.2 10.1 10.3 42.2 3.6 0.0 28.5 71.5 2,942 3,331
Europe Efficiency Macedonia 2.1 2.4 8,656 29.6 12.8 0.0 15.4 0.0 0.0 39.9 60.1 1,803 22,360
DATA TABLES
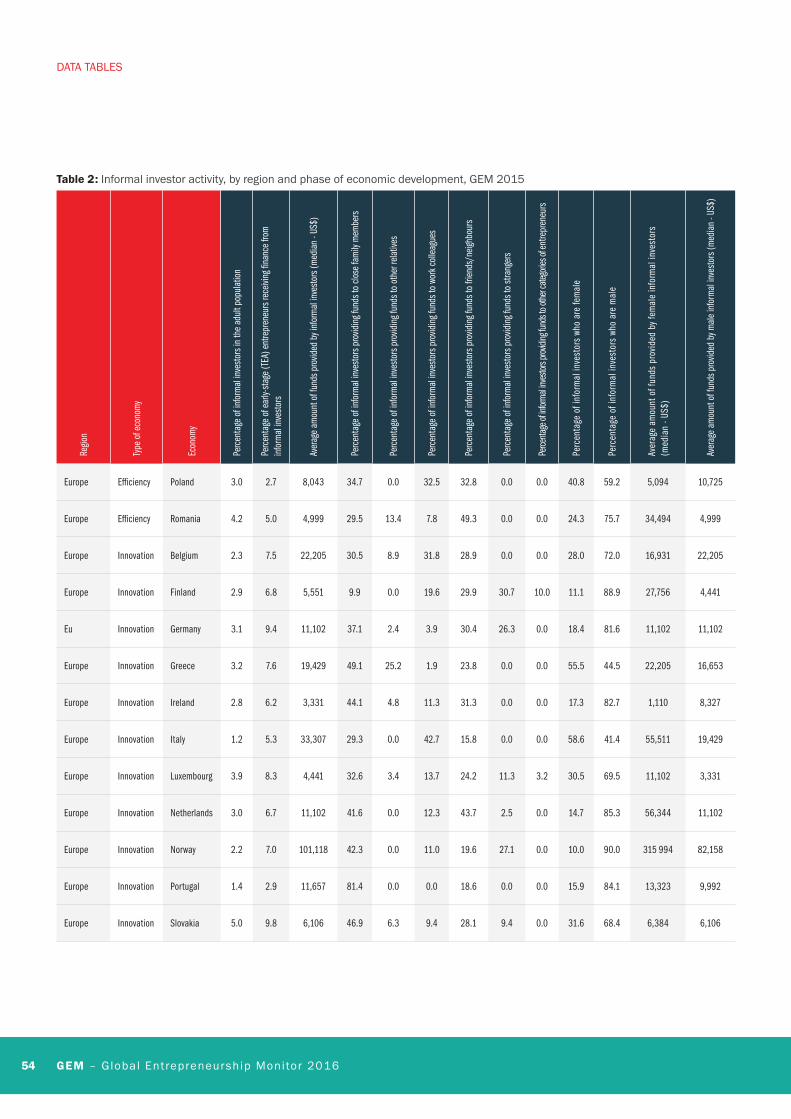
54 GEM – Global Entrepreneurship Monitor 2016
Table 2: Informal investor activity, by region and phase of economic development, GEM 2015
Regio
n
Type
of e
cono
my
Econ
omy
Perc
enta
ge o
f inf
orm
al in
vest
ors i
n th
e ad
ult p
opul
atio
n
Perc
enta
ge o
f ear
ly-st
age
(TEA
) ent
repr
eneu
rs re
ceivi
ng fi
nanc
e fro
m
info
rmal
inve
stor
s
Aver
age
amou
nt o
f fun
ds p
rovid
ed b
y inf
orm
al in
vest
ors (
med
ian
- US$
)
Perc
enta
ge o
f inf
orm
al in
vest
ors p
rovid
ing f
unds
to cl
ose
fam
ily m
embe
rs
Perc
enta
ge o
f inf
orm
al in
vest
ors p
rovid
ing f
unds
to o
ther
rela
tives
Perc
enta
ge o
f inf
orm
al in
vest
ors p
rovid
ing f
unds
to w
ork c
olle
ague
s
Perc
enta
ge o
f inf
orm
al in
vest
ors p
rovid
ing f
unds
to fr
iends
/neig
hbou
rs
Perc
enta
ge o
f inf
orm
al in
vest
ors p
rovid
ing f
unds
to st
rang
ers
Perce
ntage
of in
forma
l inve
stors
prov
iding
fund
s to o
ther c
atego
ries o
f ent
repr
eneu
rs
Perc
enta
ge o
f inf
orm
al in
vest
ors
who
are
fem
ale
Perc
enta
ge o
f inf
orm
al in
vest
ors
who
are
mal
e
Aver
age
amou
nt o
f fun
ds p
rovid
ed b
y fem
ale
info
rmal
inve
stor
s (m
edia
n - U
S$)
Aver
age
amou
nt o
f fun
ds p
rovid
ed b
y mal
e in
form
al in
vest
ors (
med
ian
- US$
)
Europe Efficiency Poland 3.0 2.7 8,043 34.7 0.0 32.5 32.8 0.0 0.0 40.8 59.2 5,094 10,725
Europe Efficiency Romania 4.2 5.0 4,999 29.5 13.4 7.8 49.3 0.0 0.0 24.3 75.7 34,494 4,999
Europe Innovation Belgium 2.3 7.5 22,205 30.5 8.9 31.8 28.9 0.0 0.0 28.0 72.0 16,931 22,205
Europe Innovation Finland 2.9 6.8 5,551 9.9 0.0 19.6 29.9 30.7 10.0 11.1 88.9 27,756 4,441
Eu Innovation Germany 3.1 9.4 11,102 37.1 2.4 3.9 30.4 26.3 0.0 18.4 81.6 11,102 11,102
Europe Innovation Greece 3.2 7.6 19,429 49.1 25.2 1.9 23.8 0.0 0.0 55.5 44.5 22,205 16,653
Europe Innovation Ireland 2.8 6.2 3,331 44.1 4.8 11.3 31.3 0.0 0.0 17.3 82.7 1,110 8,327
Europe Innovation Italy 1.2 5.3 33,307 29.3 0.0 42.7 15.8 0.0 0.0 58.6 41.4 55,511 19,429
Europe Innovation Luxembourg 3.9 8.3 4,441 32.6 3.4 13.7 24.2 11.3 3.2 30.5 69.5 11,102 3,331
Europe Innovation Netherlands 3.0 6.7 11,102 41.6 0.0 12.3 43.7 2.5 0.0 14.7 85.3 56,344 11,102
Europe Innovation Norway 2.2 7.0 101,118 42.3 0.0 11.0 19.6 27.1 0.0 10.0 90.0 315 994 82,158
Europe Innovation Portugal 1.4 2.9 11,657 81.4 0.0 0.0 18.6 0.0 0.0 15.9 84.1 13,323 9,992
Europe Innovation Slovakia 5.0 9.8 6,106 46.9 6.3 9.4 28.1 9.4 0.0 31.6 68.4 6,384 6,106
DATA TABLES
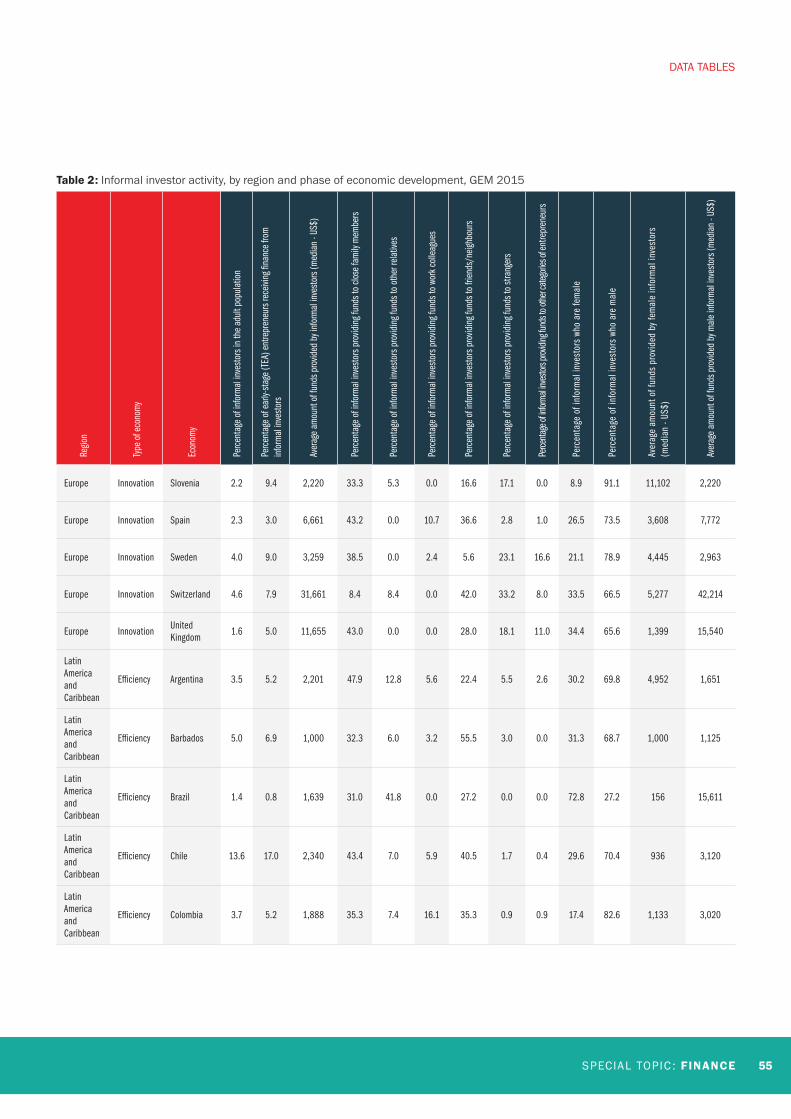
SPECIAL TOPIC : FINANCE 55
Table 2: Informal investor activity, by region and phase of economic development, GEM 2015
Regio
n
Type
of e
cono
my
Econ
omy
Perc
enta
ge o
f inf
orm
al in
vest
ors i
n th
e ad
ult p
opul
atio
n
Perc
enta
ge o
f ear
ly-st
age
(TEA
) ent
repr
eneu
rs re
ceivi
ng fi
nanc
e fro
m
info
rmal
inve
stor
s
Aver
age
amou
nt o
f fun
ds p
rovid
ed b
y inf
orm
al in
vest
ors (
med
ian
- US$
)
Perc
enta
ge o
f inf
orm
al in
vest
ors p
rovid
ing f
unds
to cl
ose
fam
ily m
embe
rs
Perc
enta
ge o
f inf
orm
al in
vest
ors p
rovid
ing f
unds
to o
ther
rela
tives
Perc
enta
ge o
f inf
orm
al in
vest
ors p
rovid
ing f
unds
to w
ork c
olle
ague
s
Perc
enta
ge o
f inf
orm
al in
vest
ors p
rovid
ing f
unds
to fr
iends
/neig
hbou
rs
Perc
enta
ge o
f inf
orm
al in
vest
ors p
rovid
ing f
unds
to st
rang
ers
Perce
ntage
of in
forma
l inve
stors
prov
iding
fund
s to o
ther c
atego
ries o
f ent
repr
eneu
rs
Perc
enta
ge o
f inf
orm
al in
vest
ors
who
are
fem
ale
Perc
enta
ge o
f inf
orm
al in
vest
ors
who
are
mal
e
Aver
age
amou
nt o
f fun
ds p
rovid
ed b
y fem
ale
info
rmal
inve
stor
s (m
edia
n - U
S$)
Aver
age
amou
nt o
f fun
ds p
rovid
ed b
y mal
e in
form
al in
vest
ors (
med
ian
- US$
)
Europe Innovation Slovenia 2.2 9.4 2,220 33.3 5.3 0.0 16.6 17.1 0.0 8.9 91.1 11,102 2,220
Europe Innovation Spain 2.3 3.0 6,661 43.2 0.0 10.7 36.6 2.8 1.0 26.5 73.5 3,608 7,772
Europe Innovation Sweden 4.0 9.0 3,259 38.5 0.0 2.4 5.6 23.1 16.6 21.1 78.9 4,445 2,963
Europe Innovation Switzerland 4.6 7.9 31,661 8.4 8.4 0.0 42.0 33.2 8.0 33.5 66.5 5,277 42,214
Europe InnovationUnited Kingdom
1.6 5.0 11,655 43.0 0.0 0.0 28.0 18.1 11.0 34.4 65.6 1,399 15,540
Latin America and Caribbean
Efficiency Argentina 3.5 5.2 2,201 47.9 12.8 5.6 22.4 5.5 2.6 30.2 69.8 4,952 1,651
Latin America and Caribbean
Efficiency Barbados 5.0 6.9 1,000 32.3 6.0 3.2 55.5 3.0 0.0 31.3 68.7 1,000 1,125
Latin America and Caribbean
Efficiency Brazil 1.4 0.8 1,639 31.0 41.8 0.0 27.2 0.0 0.0 72.8 27.2 156 15,611
Latin America and Caribbean
Efficiency Chile 13.6 17.0 2,340 43.4 7.0 5.9 40.5 1.7 0.4 29.6 70.4 936 3,120
Latin America and Caribbean
Efficiency Colombia 3.7 5.2 1,888 35.3 7.4 16.1 35.3 0.9 0.9 17.4 82.6 1,133 3,020
DATA TABLES
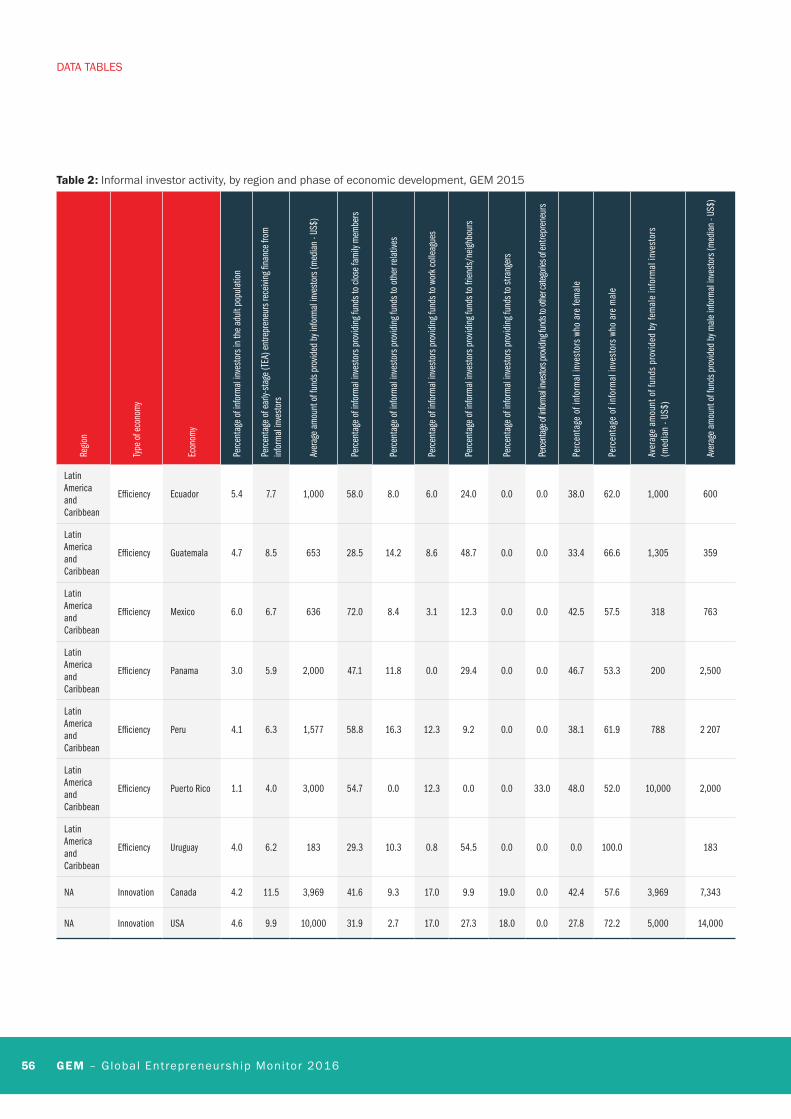
56 GEM – Global Entrepreneurship Monitor 2016
Table 2: Informal investor activity, by region and phase of economic development, GEM 2015
Regio
n
Type
of e
cono
my
Econ
omy
Perc
enta
ge o
f inf
orm
al in
vest
ors i
n th
e ad
ult p
opul
atio
n
Perc
enta
ge o
f ear
ly-st
age
(TEA
) ent
repr
eneu
rs re
ceivi
ng fi
nanc
e fro
m
info
rmal
inve
stor
s
Aver
age
amou
nt o
f fun
ds p
rovid
ed b
y inf
orm
al in
vest
ors (
med
ian
- US$
)
Perc
enta
ge o
f inf
orm
al in
vest
ors p
rovid
ing f
unds
to cl
ose
fam
ily m
embe
rs
Perc
enta
ge o
f inf
orm
al in
vest
ors p
rovid
ing f
unds
to o
ther
rela
tives
Perc
enta
ge o
f inf
orm
al in
vest
ors p
rovid
ing f
unds
to w
ork c
olle
ague
s
Perc
enta
ge o
f inf
orm
al in
vest
ors p
rovid
ing f
unds
to fr
iends
/neig
hbou
rs
Perc
enta
ge o
f inf
orm
al in
vest
ors p
rovid
ing f
unds
to st
rang
ers
Perce
ntage
of in
forma
l inve
stors
prov
iding
fund
s to o
ther c
atego
ries o
f ent
repr
eneu
rs
Perc
enta
ge o
f inf
orm
al in
vest
ors
who
are
fem
ale
Perc
enta
ge o
f inf
orm
al in
vest
ors
who
are
mal
e
Aver
age
amou
nt o
f fun
ds p
rovid
ed b
y fem
ale
info
rmal
inve
stor
s (m
edia
n - U
S$)
Aver
age
amou
nt o
f fun
ds p
rovid
ed b
y mal
e in
form
al in
vest
ors (
med
ian
- US$
)
Latin America and Caribbean
Efficiency Ecuador 5.4 7.7 1,000 58.0 8.0 6.0 24.0 0.0 0.0 38.0 62.0 1,000 600
Latin America and Caribbean
Efficiency Guatemala 4.7 8.5 653 28.5 14.2 8.6 48.7 0.0 0.0 33.4 66.6 1,305 359
Latin America and Caribbean
Efficiency Mexico 6.0 6.7 636 72.0 8.4 3.1 12.3 0.0 0.0 42.5 57.5 318 763
Latin America and Caribbean
Efficiency Panama 3.0 5.9 2,000 47.1 11.8 0.0 29.4 0.0 0.0 46.7 53.3 200 2,500
Latin America and Caribbean
Efficiency Peru 4.1 6.3 1,577 58.8 16.3 12.3 9.2 0.0 0.0 38.1 61.9 788 2 207
Latin America and Caribbean
Efficiency Puerto Rico 1.1 4.0 3,000 54.7 0.0 12.3 0.0 0.0 33.0 48.0 52.0 10,000 2,000
Latin America and Caribbean
Efficiency Uruguay 4.0 6.2 183 29.3 10.3 0.8 54.5 0.0 0.0 0.0 100.0 183
NA Innovation Canada 4.2 11.5 3,969 41.6 9.3 17.0 9.9 19.0 0.0 42.4 57.6 3,969 7,343
NA Innovation USA 4.6 9.9 10,000 31.9 2.7 17.0 27.3 18.0 0.0 27.8 72.2 5,000 14,000
DATA TABLES
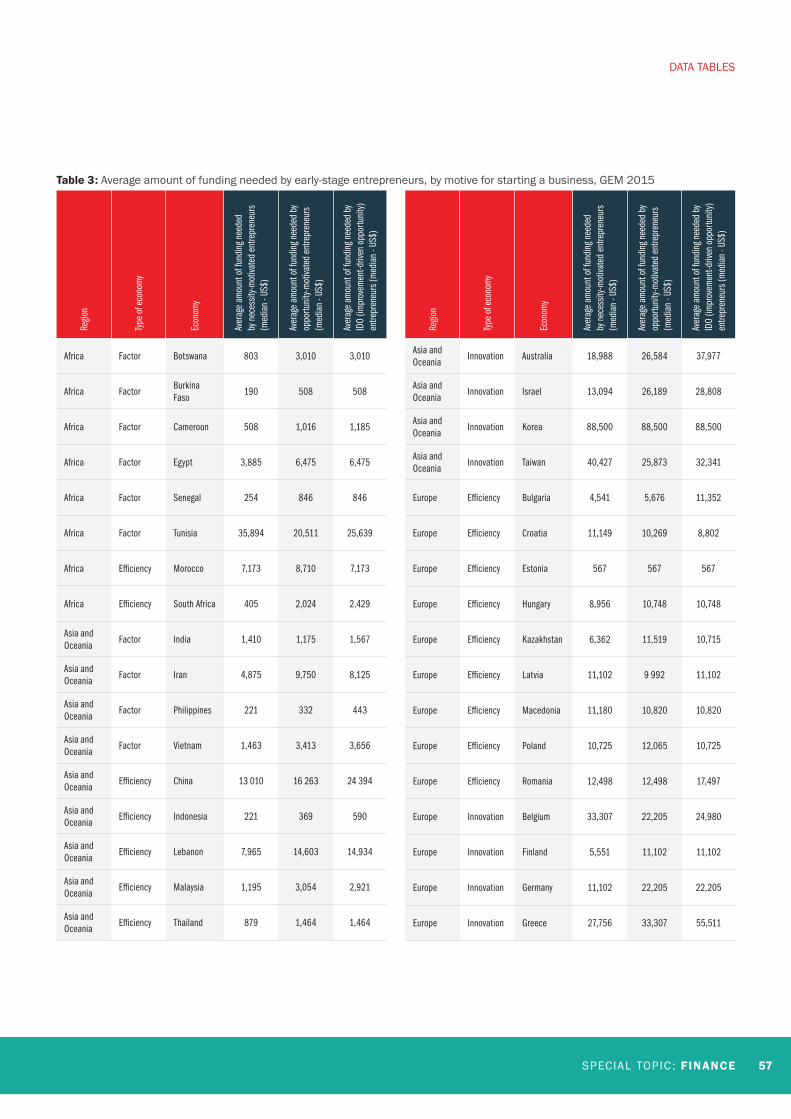
SPECIAL TOPIC : FINANCE 57
Table 3: Average amount of funding needed by early-stage entrepreneurs, by motive for starting a business, GEM 2015
Regio
n
Type
of e
cono
my
Econ
omy
Aver
age
amou
nt o
f fun
ding
nee
ded
by n
eces
sity-m
otiva
ted
entre
pren
eurs
(m
edia
n - U
S$)
Aver
age
amou
nt o
f fun
ding
nee
ded
by
oppo
rtuni
ty-m
otiva
ted
entre
pren
eurs
(m
edia
n - U
S$)
Aver
age
amou
nt o
f fun
ding
nee
ded
by
IDO
(impr
ovem
ent-d
riven
opp
ortu
nity
) en
trepr
eneu
rs (m
edia
n - U
S$)
Africa Factor Botswana 803 3,010 3,010
Africa FactorBurkina Faso
190 508 508
Africa Factor Cameroon 508 1,016 1,185
Africa Factor Egypt 3,885 6,475 6,475
Africa Factor Senegal 254 846 846
Africa Factor Tunisia 35,894 20,511 25,639
Africa Efficiency Morocco 7,173 8,710 7,173
Africa Efficiency South Africa 405 2,024 2,429
Asia and Oceania
Factor India 1,410 1,175 1,567
Asia and Oceania
Factor Iran 4,875 9,750 8,125
Asia and Oceania
Factor Philippines 221 332 443
Asia and Oceania
Factor Vietnam 1,463 3,413 3,656
Asia and Oceania
Efficiency China 13 010 16 263 24 394
Asia and Oceania
Efficiency Indonesia 221 369 590
Asia and Oceania
Efficiency Lebanon 7,965 14,603 14,934
Asia and Oceania
Efficiency Malaysia 1,195 3,054 2,921
Asia and Oceania
Efficiency Thailand 879 1,464 1,464
Regio
n
Type
of e
cono
my
Econ
omy
Aver
age
amou
nt o
f fun
ding
nee
ded
by n
eces
sity-m
otiva
ted
entre
pren
eurs
(m
edia
n - U
S$)
Aver
age
amou
nt o
f fun
ding
nee
ded
by
oppo
rtuni
ty-m
otiva
ted
entre
pren
eurs
(m
edia
n - U
S$)
Aver
age
amou
nt o
f fun
ding
nee
ded
by
IDO
(impr
ovem
ent-d
riven
opp
ortu
nity
) en
trepr
eneu
rs (m
edia
n - U
S$)
Asia and Oceania
Innovation Australia 18,988 26,584 37,977
Asia and Oceania
Innovation Israel 13,094 26,189 28,808
Asia and Oceania
Innovation Korea 88,500 88,500 88,500
Asia and Oceania
Innovation Taiwan 40,427 25,873 32,341
Europe Efficiency Bulgaria 4,541 5,676 11,352
Europe Efficiency Croatia 11,149 10,269 8,802
Europe Efficiency Estonia 567 567 567
Europe Efficiency Hungary 8,956 10,748 10,748
Europe Efficiency Kazakhstan 6,362 11,519 10,715
Europe Efficiency Latvia 11,102 9 992 11,102
Europe Efficiency Macedonia 11,180 10,820 10,820
Europe Efficiency Poland 10,725 12,065 10,725
Europe Efficiency Romania 12,498 12,498 17,497
Europe Innovation Belgium 33,307 22,205 24,980
Europe Innovation Finland 5,551 11,102 11,102
Europe Innovation Germany 11,102 22,205 22,205
Europe Innovation Greece 27,756 33,307 55,511
DATA TABLES
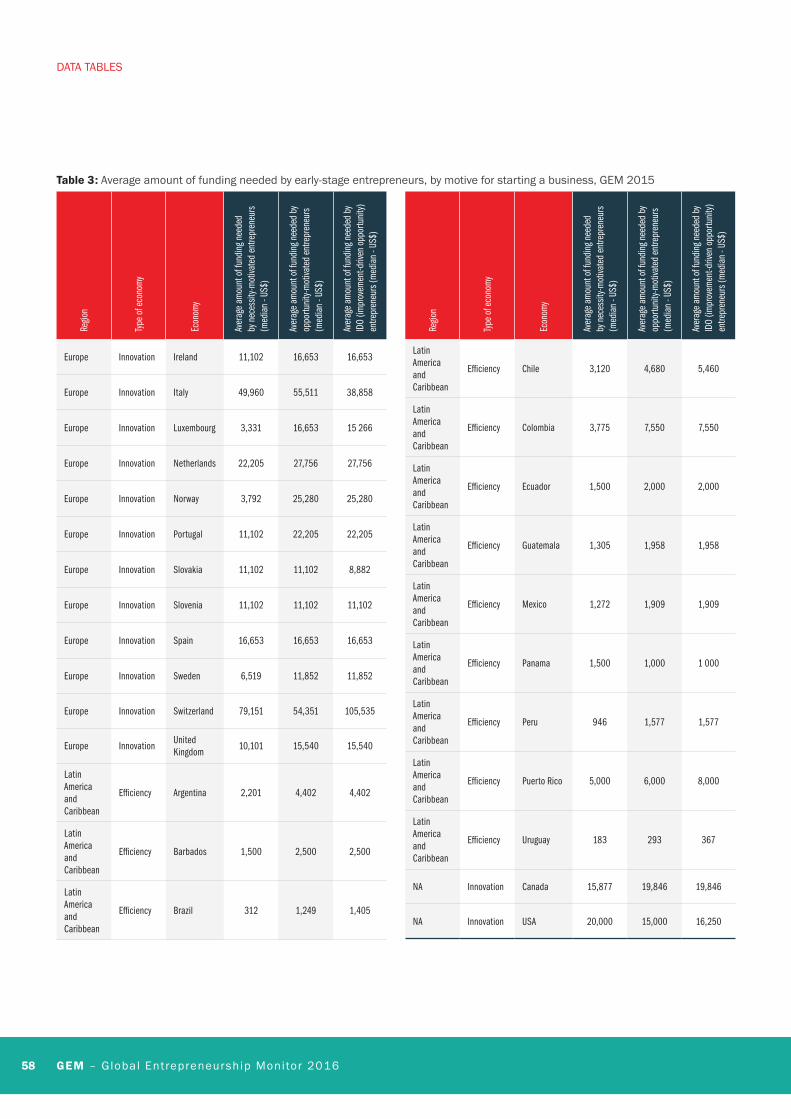
58 GEM – Global Entrepreneurship Monitor 2016
Table 3: Average amount of funding needed by early-stage entrepreneurs, by motive for starting a business, GEM 2015
Regio
n
Type
of e
cono
my
Econ
omy
Aver
age
amou
nt o
f fun
ding
nee
ded
by n
eces
sity-m
otiva
ted
entre
pren
eurs
(m
edia
n - U
S$)
Aver
age
amou
nt o
f fun
ding
nee
ded
by
oppo
rtuni
ty-m
otiva
ted
entre
pren
eurs
(m
edia
n - U
S$)
Aver
age
amou
nt o
f fun
ding
nee
ded
by
IDO
(impr
ovem
ent-d
riven
opp
ortu
nity
) en
trepr
eneu
rs (m
edia
n - U
S$)
Europe Innovation Ireland 11,102 16,653 16,653
Europe Innovation Italy 49,960 55,511 38,858
Europe Innovation Luxembourg 3,331 16,653 15 266
Europe Innovation Netherlands 22,205 27,756 27,756
Europe Innovation Norway 3,792 25,280 25,280
Europe Innovation Portugal 11,102 22,205 22,205
Europe Innovation Slovakia 11,102 11,102 8,882
Europe Innovation Slovenia 11,102 11,102 11,102
Europe Innovation Spain 16,653 16,653 16,653
Europe Innovation Sweden 6,519 11,852 11,852
Europe Innovation Switzerland 79,151 54,351 105,535
Europe InnovationUnited Kingdom
10,101 15,540 15,540
Latin America and Caribbean
Efficiency Argentina 2,201 4,402 4,402
Latin America and Caribbean
Efficiency Barbados 1,500 2,500 2,500
Latin America and Caribbean
Efficiency Brazil 312 1,249 1,405
Regio
n
Type
of e
cono
my
Econ
omy
Aver
age
amou
nt o
f fun
ding
nee
ded
by n
eces
sity-m
otiva
ted
entre
pren
eurs
(m
edia
n - U
S$)
Aver
age
amou
nt o
f fun
ding
nee
ded
by
oppo
rtuni
ty-m
otiva
ted
entre
pren
eurs
(m
edia
n - U
S$)
Aver
age
amou
nt o
f fun
ding
nee
ded
by
IDO
(impr
ovem
ent-d
riven
opp
ortu
nity
) en
trepr
eneu
rs (m
edia
n - U
S$)
Latin America and Caribbean
Efficiency Chile 3,120 4,680 5,460
Latin America and Caribbean
Efficiency Colombia 3,775 7,550 7,550
Latin America and Caribbean
Efficiency Ecuador 1,500 2,000 2,000
Latin America and Caribbean
Efficiency Guatemala 1,305 1,958 1,958
Latin America and Caribbean
Efficiency Mexico 1,272 1,909 1,909
Latin America and Caribbean
Efficiency Panama 1,500 1,000 1 000
Latin America and Caribbean
Efficiency Peru 946 1,577 1,577
Latin America and Caribbean
Efficiency Puerto Rico 5,000 6,000 8,000
Latin America and Caribbean
Efficiency Uruguay 183 293 367
NA Innovation Canada 15,877 19,846 19,846
NA Innovation USA 20,000 15,000 16,250
DATA TABLES
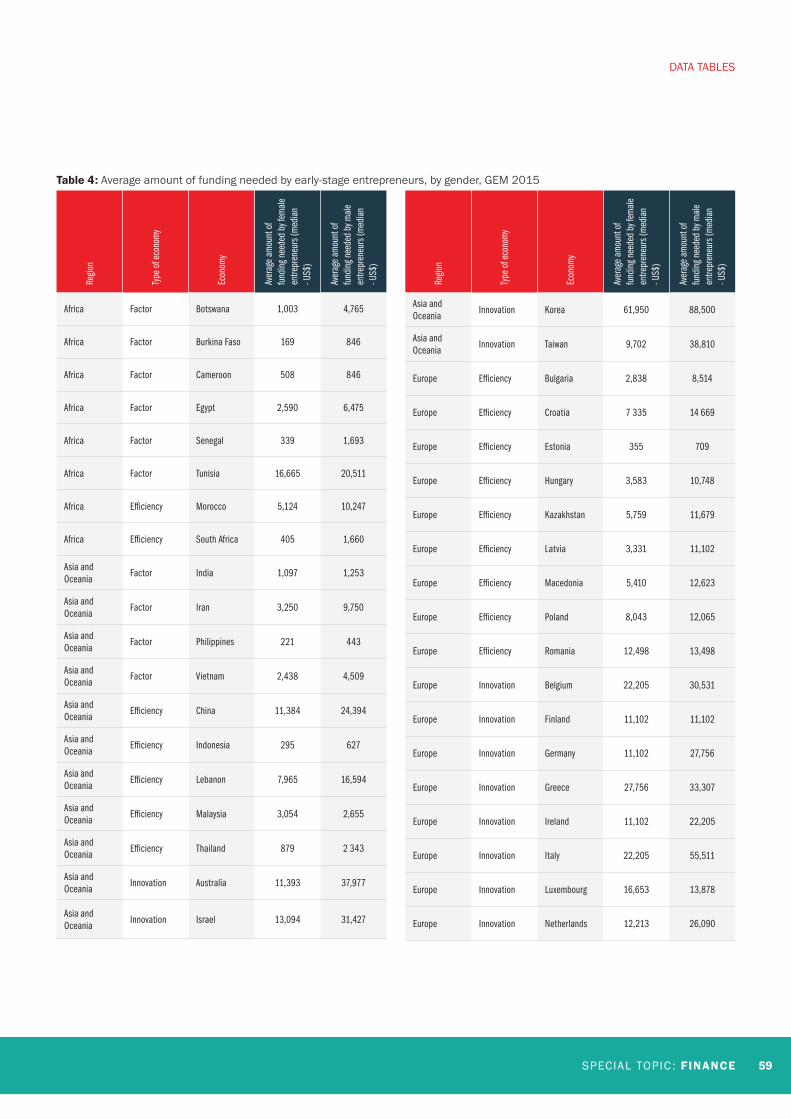
SPECIAL TOPIC : FINANCE 59
Table 4: Average amount of funding needed by early-stage entrepreneurs, by gender, GEM 2015
Regio
n
Type
of e
cono
my
Econ
omy
Aver
age
amou
nt o
f fu
ndin
g nee
ded
by fe
mal
e en
trepr
eneu
rs (m
edia
n - U
S$)
Aver
age
amou
nt o
f fu
ndin
g nee
ded
by m
ale
entre
pren
eurs
(med
ian
- US$
)
Africa Factor Botswana 1,003 4,765
Africa Factor Burkina Faso 169 846
Africa Factor Cameroon 508 846
Africa Factor Egypt 2,590 6,475
Africa Factor Senegal 339 1,693
Africa Factor Tunisia 16,665 20,511
Africa Efficiency Morocco 5,124 10,247
Africa Efficiency South Africa 405 1,660
Asia and Oceania
Factor India 1,097 1,253
Asia and Oceania
Factor Iran 3,250 9,750
Asia and Oceania
Factor Philippines 221 443
Asia and Oceania
Factor Vietnam 2,438 4,509
Asia and Oceania
Efficiency China 11,384 24,394
Asia and Oceania
Efficiency Indonesia 295 627
Asia and Oceania
Efficiency Lebanon 7,965 16,594
Asia and Oceania
Efficiency Malaysia 3,054 2,655
Asia and Oceania
Efficiency Thailand 879 2 343
Asia and Oceania
Innovation Australia 11,393 37,977
Asia and Oceania
Innovation Israel 13,094 31,427
Regio
n
Type
of e
cono
my
Econ
omy
Aver
age
amou
nt o
f fu
ndin
g nee
ded
by fe
mal
e en
trepr
eneu
rs (m
edia
n - U
S$)
Aver
age
amou
nt o
f fu
ndin
g nee
ded
by m
ale
entre
pren
eurs
(med
ian
- US$
)
Asia and Oceania
Innovation Korea 61,950 88,500
Asia and Oceania
Innovation Taiwan 9,702 38,810
Europe Efficiency Bulgaria 2,838 8,514
Europe Efficiency Croatia 7 335 14 669
Europe Efficiency Estonia 355 709
Europe Efficiency Hungary 3,583 10,748
Europe Efficiency Kazakhstan 5,759 11,679
Europe Efficiency Latvia 3,331 11,102
Europe Efficiency Macedonia 5,410 12,623
Europe Efficiency Poland 8,043 12,065
Europe Efficiency Romania 12,498 13,498
Europe Innovation Belgium 22,205 30,531
Europe Innovation Finland 11,102 11,102
Europe Innovation Germany 11,102 27,756
Europe Innovation Greece 27,756 33,307
Europe Innovation Ireland 11,102 22,205
Europe Innovation Italy 22,205 55,511
Europe Innovation Luxembourg 16,653 13,878
Europe Innovation Netherlands 12,213 26,090
DATA TABLES
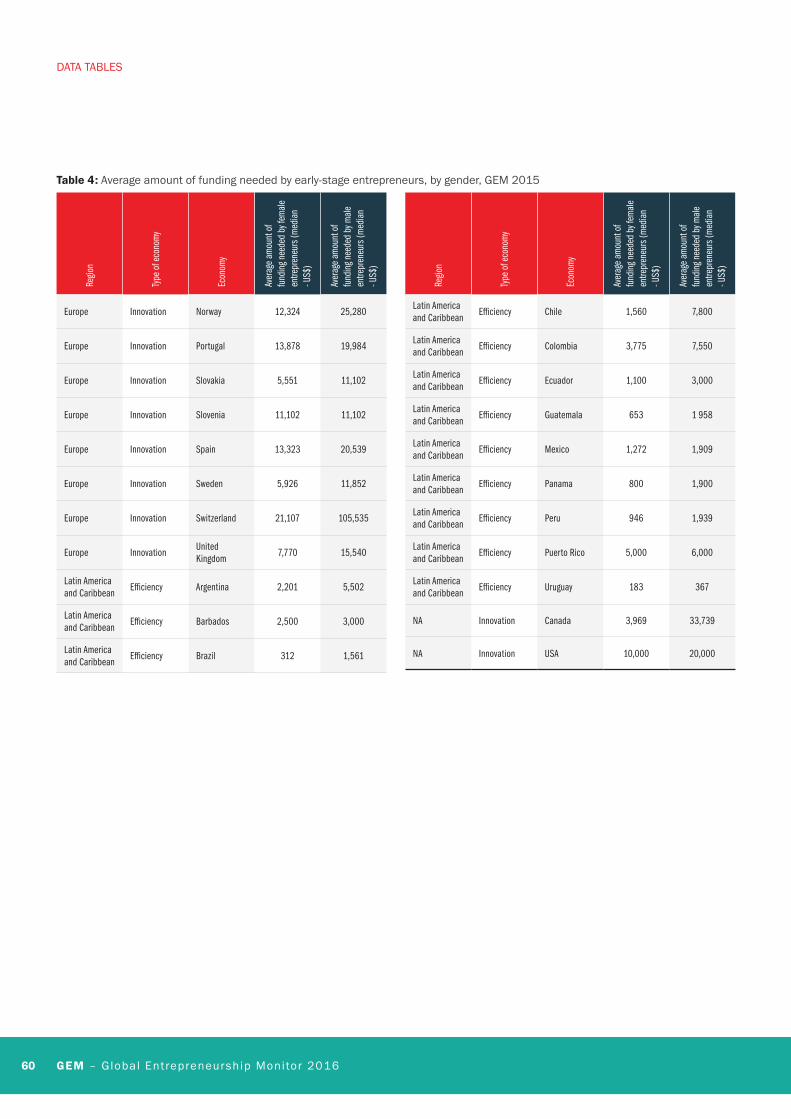
60 GEM – Global Entrepreneurship Monitor 2016
Table 4: Average amount of funding needed by early-stage entrepreneurs, by gender, GEM 2015
Regio
n
Type
of e
cono
my
Econ
omy
Aver
age
amou
nt o
f fu
ndin
g nee
ded
by fe
mal
e en
trepr
eneu
rs (m
edia
n - U
S$)
Aver
age
amou
nt o
f fu
ndin
g nee
ded
by m
ale
entre
pren
eurs
(med
ian
- US$
)
Europe Innovation Norway 12,324 25,280
Europe Innovation Portugal 13,878 19,984
Europe Innovation Slovakia 5,551 11,102
Europe Innovation Slovenia 11,102 11,102
Europe Innovation Spain 13,323 20,539
Europe Innovation Sweden 5,926 11,852
Europe Innovation Switzerland 21,107 105,535
Europe InnovationUnited Kingdom
7,770 15,540
Latin America and Caribbean
Efficiency Argentina 2,201 5,502
Latin America and Caribbean
Efficiency Barbados 2,500 3,000
Latin America and Caribbean
Efficiency Brazil 312 1,561
Regio
n
Type
of e
cono
my
Econ
omy
Aver
age
amou
nt o
f fu
ndin
g nee
ded
by fe
mal
e en
trepr
eneu
rs (m
edia
n - U
S$)
Aver
age
amou
nt o
f fu
ndin
g nee
ded
by m
ale
entre
pren
eurs
(med
ian
- US$
)
Latin America and Caribbean
Efficiency Chile 1,560 7,800
Latin America and Caribbean
Efficiency Colombia 3,775 7,550
Latin America and Caribbean
Efficiency Ecuador 1,100 3,000
Latin America and Caribbean
Efficiency Guatemala 653 1 958
Latin America and Caribbean
Efficiency Mexico 1,272 1,909
Latin America and Caribbean
Efficiency Panama 800 1,900
Latin America and Caribbean
Efficiency Peru 946 1,939
Latin America and Caribbean
Efficiency Puerto Rico 5,000 6,000
Latin America and Caribbean
Efficiency Uruguay 183 367
NA Innovation Canada 3,969 33,739
NA Innovation USA 10,000 20,000
DATA TABLES
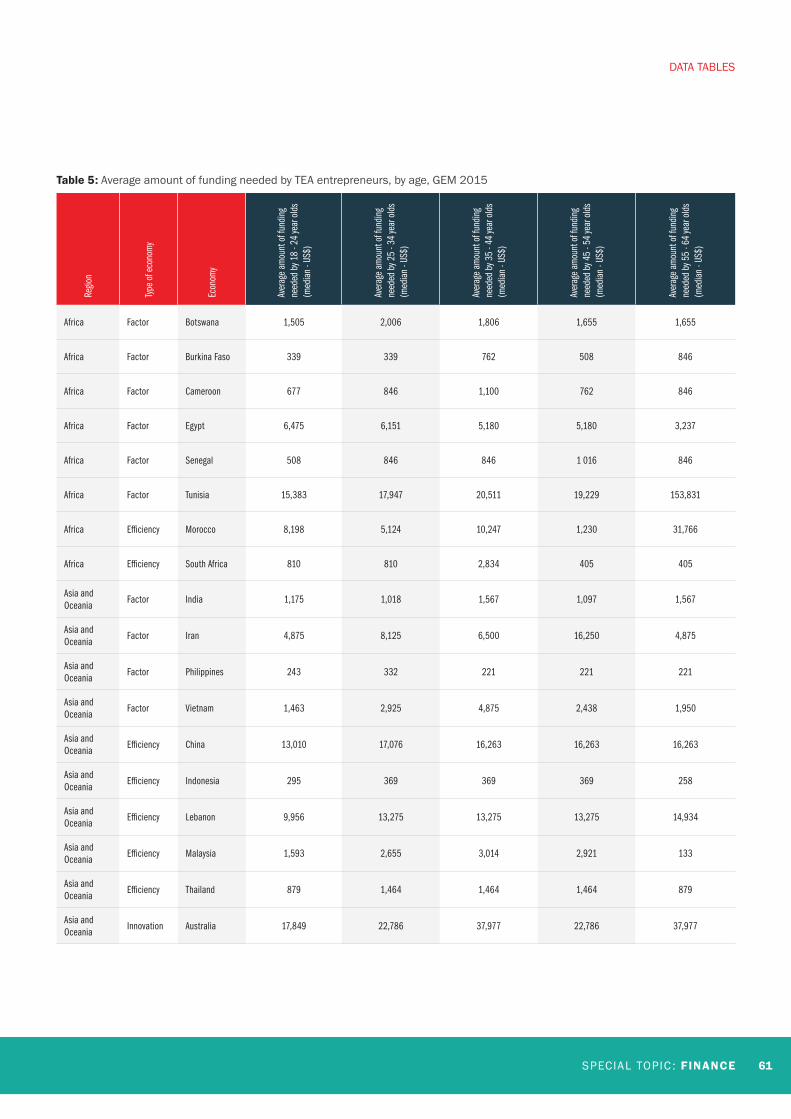
SPECIAL TOPIC : FINANCE 61
Table 5: Average amount of funding needed by TEA entrepreneurs, by age, GEM 2015
Regio
n
Type
of e
cono
my
Econ
omy
Aver
age
amou
nt o
f fun
ding
ne
eded
by 1
8 - 2
4 ye
ar o
lds
(med
ian
- US$
)
Aver
age
amou
nt o
f fun
ding
ne
eded
by 2
5 - 3
4 ye
ar o
lds
(med
ian
- US$
)
Aver
age
amou
nt o
f fun
ding
ne
eded
by 3
5 - 4
4 ye
ar o
lds
(med
ian
- US$
)
Aver
age
amou
nt o
f fun
ding
ne
eded
by 4
5 - 5
4 ye
ar o
lds
(med
ian
- US$
)
Aver
age
amou
nt o
f fun
ding
ne
eded
by 5
5 - 6
4 ye
ar o
lds
(med
ian
- US$
)
Africa Factor Botswana 1,505 2,006 1,806 1,655 1,655
Africa Factor Burkina Faso 339 339 762 508 846
Africa Factor Cameroon 677 846 1,100 762 846
Africa Factor Egypt 6,475 6,151 5,180 5,180 3,237
Africa Factor Senegal 508 846 846 1 016 846
Africa Factor Tunisia 15,383 17,947 20,511 19,229 153,831
Africa Efficiency Morocco 8,198 5,124 10,247 1,230 31,766
Africa Efficiency South Africa 810 810 2,834 405 405
Asia and Oceania
Factor India 1,175 1,018 1,567 1,097 1,567
Asia and Oceania
Factor Iran 4,875 8,125 6,500 16,250 4,875
Asia and Oceania
Factor Philippines 243 332 221 221 221
Asia and Oceania
Factor Vietnam 1,463 2,925 4,875 2,438 1,950
Asia and Oceania
Efficiency China 13,010 17,076 16,263 16,263 16,263
Asia and Oceania
Efficiency Indonesia 295 369 369 369 258
Asia and Oceania
Efficiency Lebanon 9,956 13,275 13,275 13,275 14,934
Asia and Oceania
Efficiency Malaysia 1,593 2,655 3,014 2,921 133
Asia and Oceania
Efficiency Thailand 879 1,464 1,464 1,464 879
Asia and Oceania
Innovation Australia 17,849 22,786 37,977 22,786 37,977
DATA TABLES
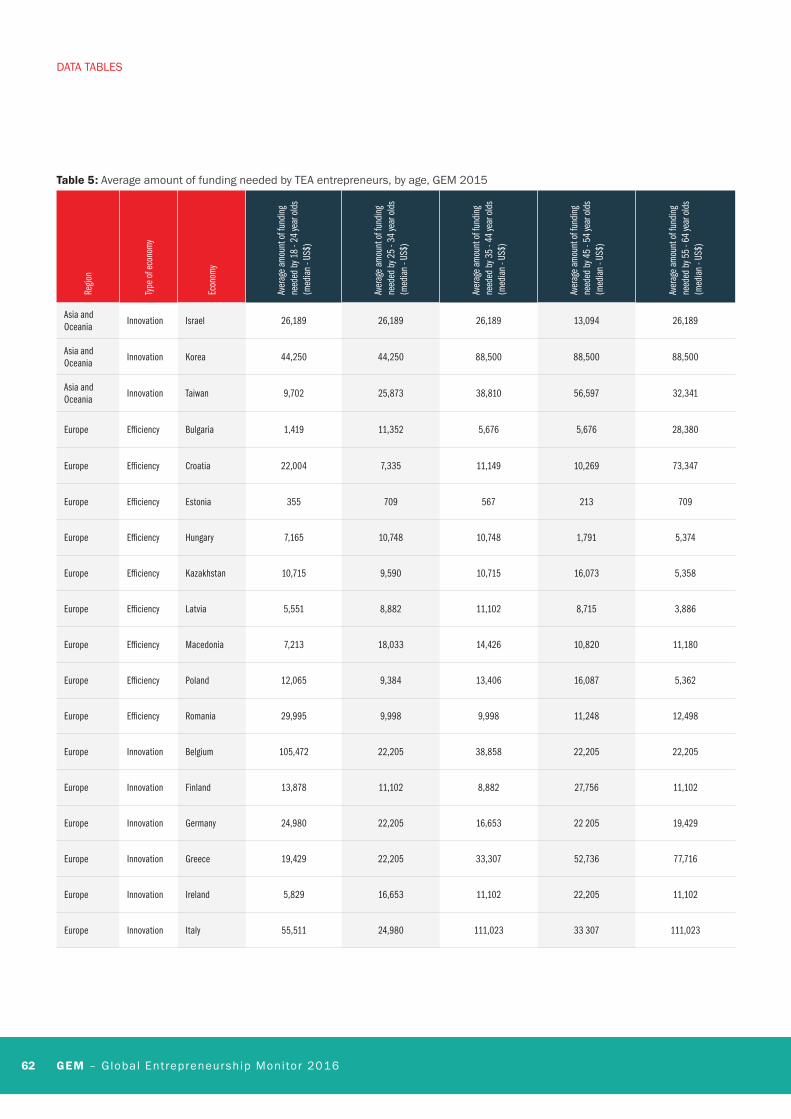
62 GEM – Global Entrepreneurship Monitor 2016
Regio
n
Type
of e
cono
my
Econ
omy
Aver
age
amou
nt o
f fun
ding
ne
eded
by 1
8 - 2
4 ye
ar o
lds
(med
ian
- US$
)
Aver
age
amou
nt o
f fun
ding
ne
eded
by 2
5 - 3
4 ye
ar o
lds
(med
ian
- US$
)
Aver
age
amou
nt o
f fun
ding
ne
eded
by 3
5 - 4
4 ye
ar o
lds
(med
ian
- US$
)
Aver
age
amou
nt o
f fun
ding
ne
eded
by 4
5 - 5
4 ye
ar o
lds
(med
ian
- US$
)
Aver
age
amou
nt o
f fun
ding
ne
eded
by 5
5 - 6
4 ye
ar o
lds
(med
ian
- US$
)
Asia and Oceania
Innovation Israel 26,189 26,189 26,189 13,094 26,189
Asia and Oceania
Innovation Korea 44,250 44,250 88,500 88,500 88,500
Asia and Oceania
Innovation Taiwan 9,702 25,873 38,810 56,597 32,341
Europe Efficiency Bulgaria 1,419 11,352 5,676 5,676 28,380
Europe Efficiency Croatia 22,004 7,335 11,149 10,269 73,347
Europe Efficiency Estonia 355 709 567 213 709
Europe Efficiency Hungary 7,165 10,748 10,748 1,791 5,374
Europe Efficiency Kazakhstan 10,715 9,590 10,715 16,073 5,358
Europe Efficiency Latvia 5,551 8,882 11,102 8,715 3,886
Europe Efficiency Macedonia 7,213 18,033 14,426 10,820 11,180
Europe Efficiency Poland 12,065 9,384 13,406 16,087 5,362
Europe Efficiency Romania 29,995 9,998 9,998 11,248 12,498
Europe Innovation Belgium 105,472 22,205 38,858 22,205 22,205
Europe Innovation Finland 13,878 11,102 8,882 27,756 11,102
Europe Innovation Germany 24,980 22,205 16,653 22 205 19,429
Europe Innovation Greece 19,429 22,205 33,307 52,736 77,716
Europe Innovation Ireland 5,829 16,653 11,102 22,205 11,102
Europe Innovation Italy 55,511 24,980 111,023 33 307 111,023
Table 5: Average amount of funding needed by TEA entrepreneurs, by age, GEM 2015
DATA TABLES
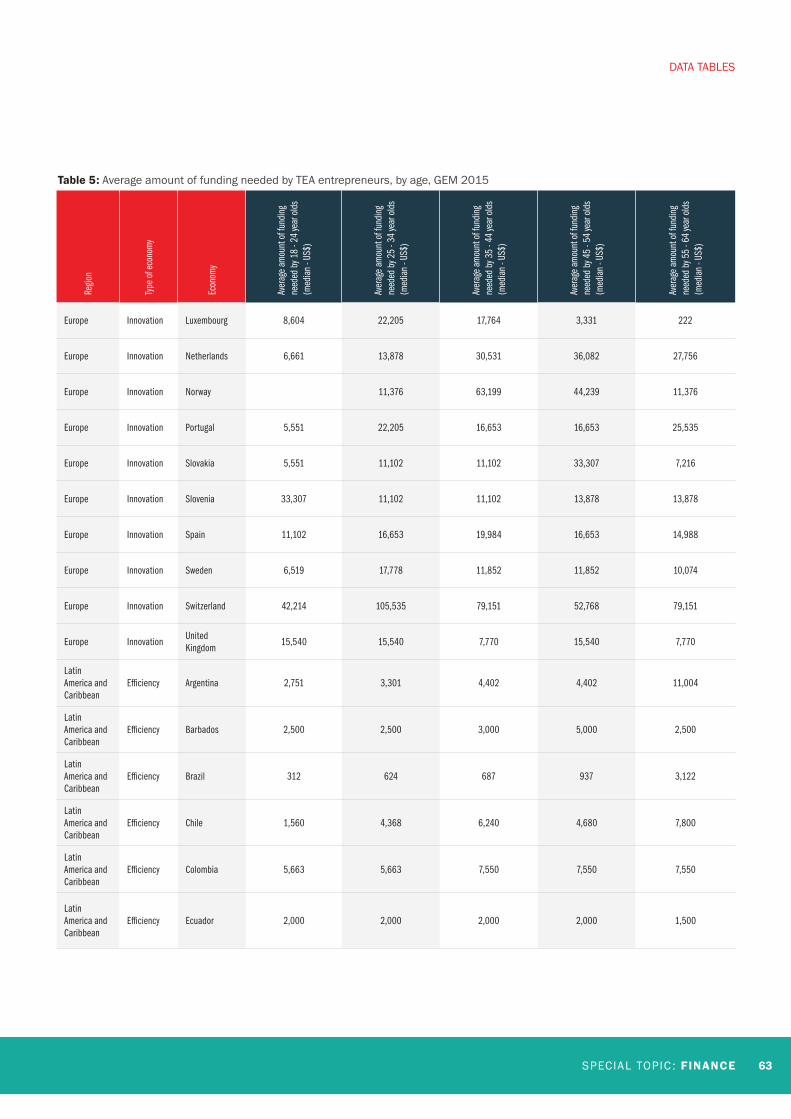
SPECIAL TOPIC : FINANCE 63
Regio
n
Type
of e
cono
my
Econ
omy
Aver
age
amou
nt o
f fun
ding
ne
eded
by 1
8 - 2
4 ye
ar o
lds
(med
ian
- US$
)
Aver
age
amou
nt o
f fun
ding
ne
eded
by 2
5 - 3
4 ye
ar o
lds
(med
ian
- US$
)
Aver
age
amou
nt o
f fun
ding
ne
eded
by 3
5 - 4
4 ye
ar o
lds
(med
ian
- US$
)
Aver
age
amou
nt o
f fun
ding
ne
eded
by 4
5 - 5
4 ye
ar o
lds
(med
ian
- US$
)
Aver
age
amou
nt o
f fun
ding
ne
eded
by 5
5 - 6
4 ye
ar o
lds
(med
ian
- US$
)
Europe Innovation Luxembourg 8,604 22,205 17,764 3,331 222
Europe Innovation Netherlands 6,661 13,878 30,531 36,082 27,756
Europe Innovation Norway 11,376 63,199 44,239 11,376
Europe Innovation Portugal 5,551 22,205 16,653 16,653 25,535
Europe Innovation Slovakia 5,551 11,102 11,102 33,307 7,216
Europe Innovation Slovenia 33,307 11,102 11,102 13,878 13,878
Europe Innovation Spain 11,102 16,653 19,984 16,653 14,988
Europe Innovation Sweden 6,519 17,778 11,852 11,852 10,074
Europe Innovation Switzerland 42,214 105,535 79,151 52,768 79,151
Europe InnovationUnited Kingdom
15,540 15,540 7,770 15,540 7,770
Latin America and Caribbean
Efficiency Argentina 2,751 3,301 4,402 4,402 11,004
Latin America and Caribbean
Efficiency Barbados 2,500 2,500 3,000 5,000 2,500
Latin America and Caribbean
Efficiency Brazil 312 624 687 937 3,122
Latin America and Caribbean
Efficiency Chile 1,560 4,368 6,240 4,680 7,800
Latin America and Caribbean
Efficiency Colombia 5,663 5,663 7,550 7,550 7,550
Latin America and Caribbean
Efficiency Ecuador 2,000 2,000 2,000 2,000 1,500
Table 5: Average amount of funding needed by TEA entrepreneurs, by age, GEM 2015
DATA TABLES
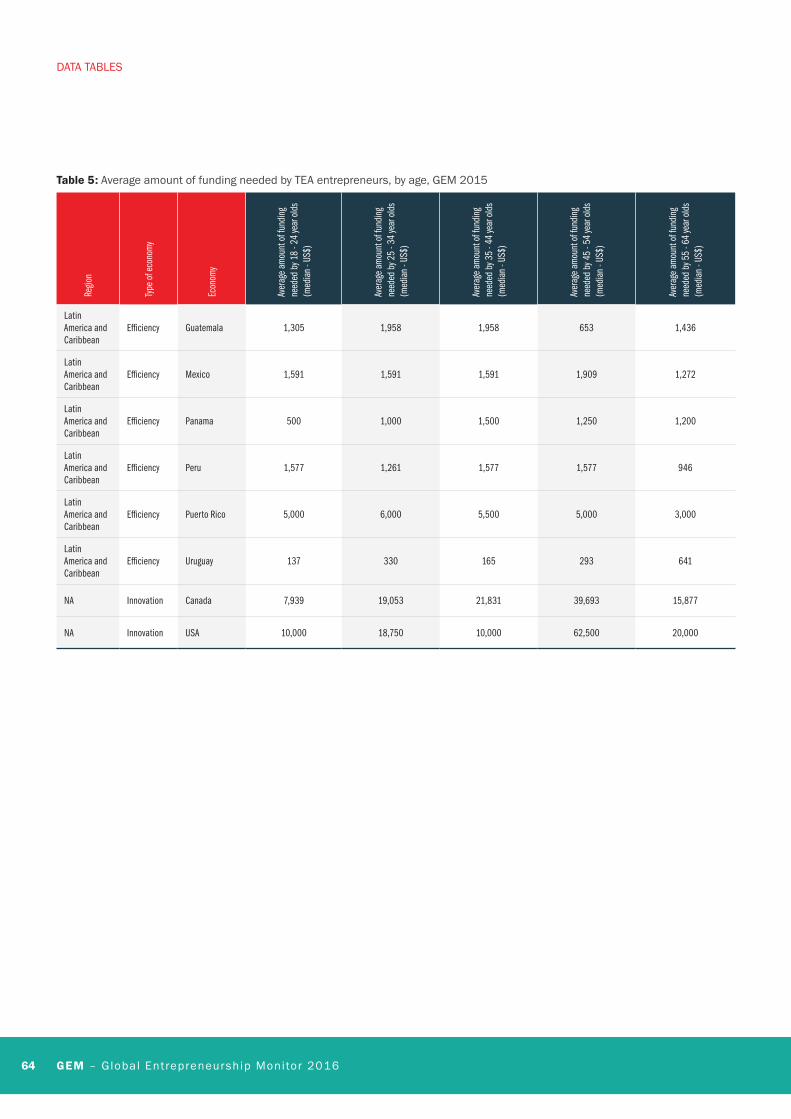
64 GEM – Global Entrepreneurship Monitor 2016
Regio
n
Type
of e
cono
my
Econ
omy
Aver
age
amou
nt o
f fun
ding
ne
eded
by 1
8 - 2
4 ye
ar o
lds
(med
ian
- US$
)
Aver
age
amou
nt o
f fun
ding
ne
eded
by 2
5 - 3
4 ye
ar o
lds
(med
ian
- US$
)
Aver
age
amou
nt o
f fun
ding
ne
eded
by 3
5 - 4
4 ye
ar o
lds
(med
ian
- US$
)
Aver
age
amou
nt o
f fun
ding
ne
eded
by 4
5 - 5
4 ye
ar o
lds
(med
ian
- US$
)
Aver
age
amou
nt o
f fun
ding
ne
eded
by 5
5 - 6
4 ye
ar o
lds
(med
ian
- US$
)
Latin America and Caribbean
Efficiency Guatemala 1,305 1,958 1,958 653 1,436
Latin America and Caribbean
Efficiency Mexico 1,591 1,591 1,591 1,909 1,272
Latin America and Caribbean
Efficiency Panama 500 1,000 1,500 1,250 1,200
Latin America and Caribbean
Efficiency Peru 1,577 1,261 1,577 1,577 946
Latin America and Caribbean
Efficiency Puerto Rico 5,000 6,000 5,500 5,000 3,000
Latin America and Caribbean
Efficiency Uruguay 137 330 165 293 641
NA Innovation Canada 7,939 19,053 21,831 39,693 15,877
NA Innovation USA 10,000 18,750 10,000 62,500 20,000
Table 5: Average amount of funding needed by TEA entrepreneurs, by age, GEM 2015
DATA TABLES
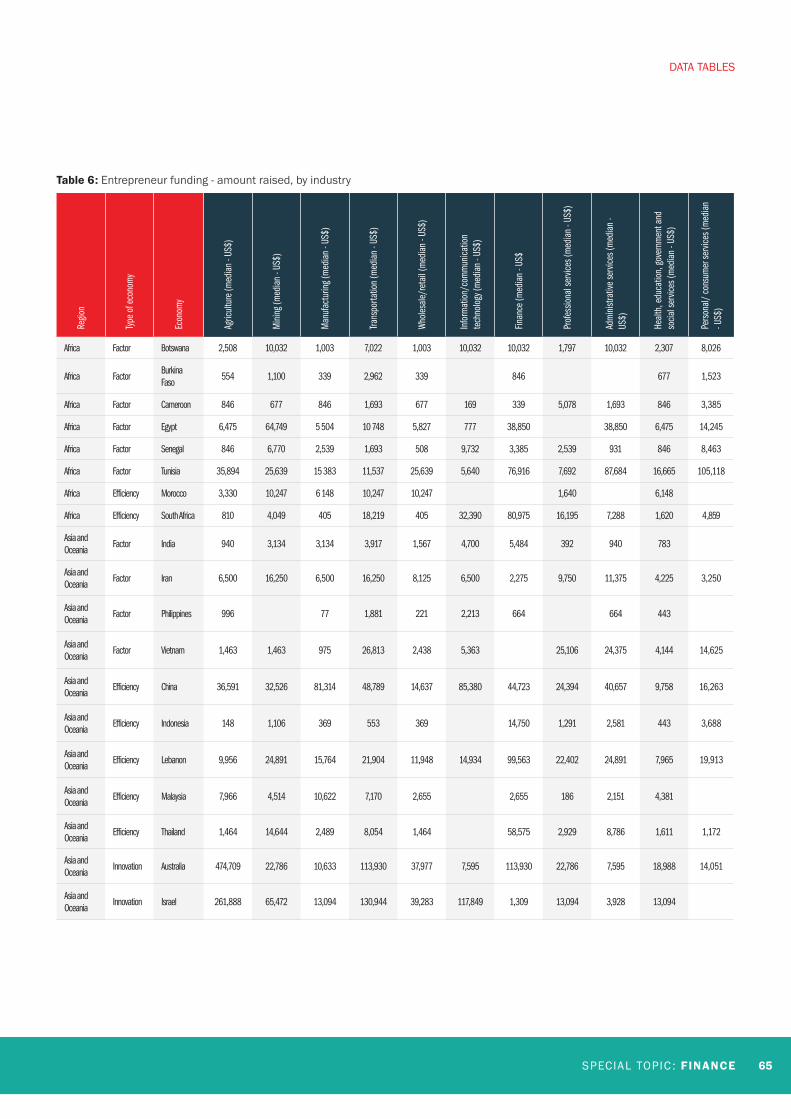
SPECIAL TOPIC : FINANCE 65
Table 6: Entrepreneur funding - amount raised, by industry
Regio
n
Type
of e
cono
my
Econ
omy
Agric
ultu
re (m
edia
n - U
S$)
Min
ing (
med
ian
- US$
)
Man
ufac
turin
g (m
edia
n - U
S$)
Trans
porta
tion
(med
ian
- US$
)
Who
lesa
le/re
tail
(med
ian
- US$
)
Info
rmat
ion/
com
mun
icatio
n te
chno
logy
(med
ian
- US$
)
Finan
ce (m
edia
n - U
S$
Prof
essio
nal s
ervic
es (m
edia
n - U
S$)
Adm
inist
rativ
e se
rvice
s (m
edia
n -
US$)
Heal
th, e
duca
tion,
gove
rnm
ent a
nd
socia
l ser
vices
(med
ian
- US$
)
Pers
onal
/ co
nsum
er se
rvice
s (m
edia
n - U
S$)
Africa Factor Botswana 2,508 10,032 1,003 7,022 1,003 10,032 10,032 1,797 10,032 2,307 8,026
Africa FactorBurkina Faso
554 1,100 339 2,962 339 846 677 1,523
Africa Factor Cameroon 846 677 846 1,693 677 169 339 5,078 1,693 846 3,385
Africa Factor Egypt 6,475 64,749 5 504 10 748 5,827 777 38,850 38,850 6,475 14,245
Africa Factor Senegal 846 6,770 2,539 1,693 508 9,732 3,385 2,539 931 846 8,463
Africa Factor Tunisia 35,894 25,639 15 383 11,537 25,639 5,640 76,916 7,692 87,684 16,665 105,118
Africa Efficiency Morocco 3,330 10,247 6 148 10,247 10,247 1,640 6,148
Africa Efficiency South Africa 810 4,049 405 18,219 405 32,390 80,975 16,195 7,288 1,620 4 ,859
Asia and Oceania
Factor India 940 3,134 3,134 3,917 1,567 4,700 5,484 392 940 783
Asia and Oceania
Factor Iran 6,500 16,250 6,500 16,250 8,125 6,500 2,275 9,750 11,375 4,225 3,250
Asia and Oceania
Factor Philippines 996 77 1,881 221 2,213 664 664 443
Asia and Oceania
Factor Vietnam 1,463 1,463 975 26,813 2,438 5,363 25,106 24,375 4,144 14,625
Asia and Oceania
Efficiency China 36,591 32,526 81,314 48,789 14,637 85,380 44,723 24,394 40,657 9,758 16,263
Asia and Oceania
Efficiency Indonesia 148 1,106 369 553 369 14,750 1,291 2,581 443 3,688
Asia and Oceania
Efficiency Lebanon 9,956 24,891 15,764 21,904 11,948 14,934 99,563 22,402 24,891 7,965 19,913
Asia and Oceania
Efficiency Malaysia 7,966 4,514 10,622 7,170 2,655 2,655 186 2,151 4,381
Asia and Oceania
Efficiency Thailand 1,464 14,644 2,489 8,054 1,464 58,575 2,929 8,786 1,611 1,172
Asia and Oceania
Innovation Australia 474,709 22,786 10,633 113,930 37,977 7,595 113,930 22,786 7,595 18,988 14,051
Asia and Oceania
Innovation Israel 261,888 65,472 13,094 130,944 39,283 117,849 1,309 13,094 3,928 13,094
DATA TABLES
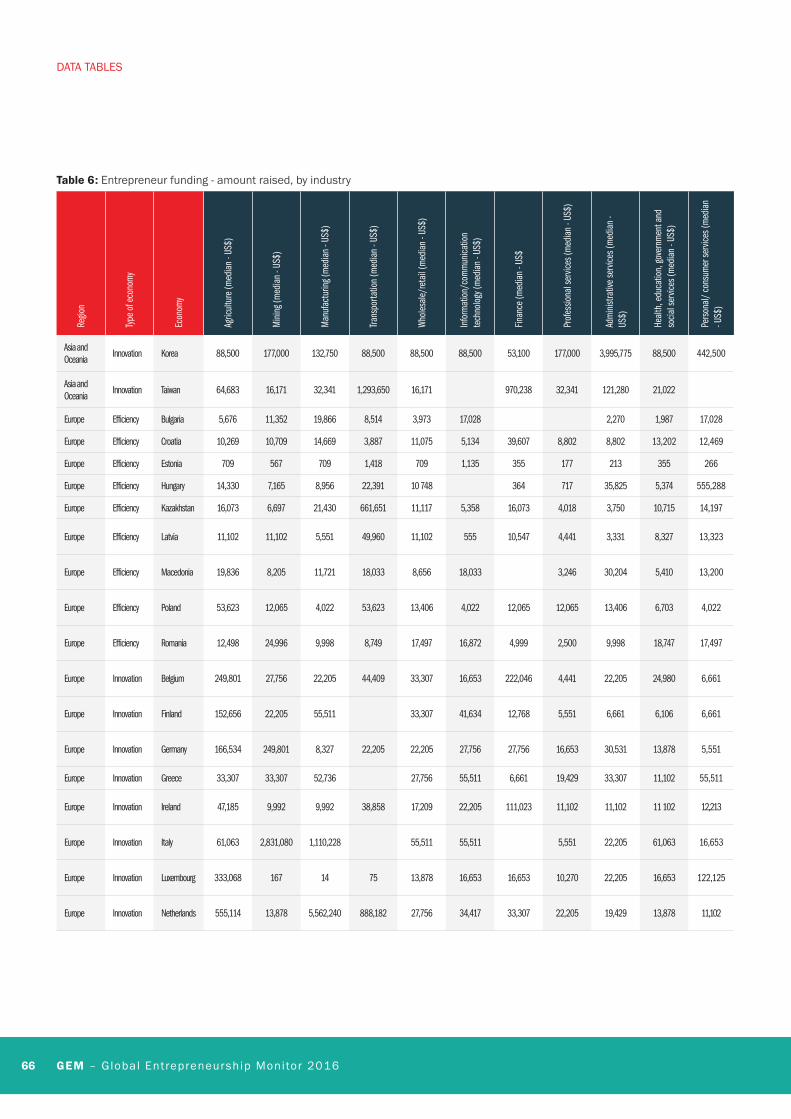
66 GEM – Global Entrepreneurship Monitor 2016
Regio
n
Type
of e
cono
my
Econ
omy
Agric
ultu
re (m
edia
n - U
S$)
Min
ing (
med
ian
- US$
)
Man
ufac
turin
g (m
edia
n - U
S$)
Trans
porta
tion
(med
ian
- US$
)
Who
lesa
le/re
tail
(med
ian
- US$
)
Info
rmat
ion/
com
mun
icatio
n te
chno
logy
(med
ian
- US$
)
Finan
ce (m
edia
n - U
S$
Prof
essio
nal s
ervic
es (m
edia
n - U
S$)
Adm
inist
rativ
e se
rvice
s (m
edia
n -
US$)
Heal
th, e
duca
tion,
gove
rnm
ent a
nd
socia
l ser
vices
(med
ian
- US$
)
Pers
onal
/ co
nsum
er se
rvice
s (m
edia
n - U
S$)
Asia and Oceania
Innovation Korea 88,500 177,000 132,750 88,500 88,500 88,500 53,100 177,000 3,995,775 88,500 442,500
Asia and Oceania
Innovation Taiwan 64,683 16,171 32,341 1,293,650 16,171 970,238 32,341 121,280 21,022
Europe Efficiency Bulgaria 5,676 11,352 19,866 8,514 3,973 17,028 2,270 1,987 17,028
Europe Efficiency Croatia 10,269 10,709 14,669 3,887 11,075 5,134 39,607 8,802 8,802 13,202 12,469
Europe Efficiency Estonia 709 567 709 1,418 709 1,135 355 177 213 355 266
Europe Efficiency Hungary 14,330 7,165 8,956 22,391 10 748 364 717 35,825 5,374 555,288
Europe Efficiency Kazakhstan 16,073 6,697 21,430 661,651 11,117 5,358 16,073 4,018 3,750 10,715 14,197
Europe Efficiency Latvia 11,102 11,102 5,551 49,960 11,102 555 10,547 4,441 3,331 8,327 13,323
Europe Efficiency Macedonia 19,836 8,205 11,721 18,033 8,656 18,033 3,246 30,204 5,410 13,200
Europe Efficiency Poland 53,623 12,065 4,022 53,623 13,406 4,022 12,065 12,065 13,406 6,703 4,022
Europe Efficiency Romania 12,498 24,996 9,998 8,749 17,497 16,872 4,999 2,500 9,998 18,747 17,497
Europe Innovation Belgium 249,801 27,756 22,205 44,409 33,307 16,653 222,046 4,441 22,205 24,980 6,661
Europe Innovation Finland 152,656 22,205 55,511 33,307 41,634 12,768 5,551 6,661 6,106 6,661
Europe Innovation Germany 166,534 249,801 8,327 22,205 22,205 27,756 27,756 16,653 30,531 13,878 5,551
Europe Innovation Greece 33,307 33,307 52,736 27,756 55,511 6,661 19,429 33,307 11,102 55,511
Europe Innovation Ireland 47,185 9,992 9,992 38,858 17,209 22,205 111,023 11,102 11,102 11 102 12,213
Europe Innovation Italy 61,063 2,831,080 1,110,228 55,511 55,511 5,551 22,205 61,063 16,653
Europe Innovation Luxembourg 333,068 167 14 75 13,878 16,653 16,653 10,270 22,205 16,653 122,125
Europe Innovation Netherlands 555,114 13,878 5,562,240 888,182 27,756 34,417 33,307 22,205 19,429 13,878 11,102
Table 6: Entrepreneur funding - amount raised, by industry
DATA TABLES
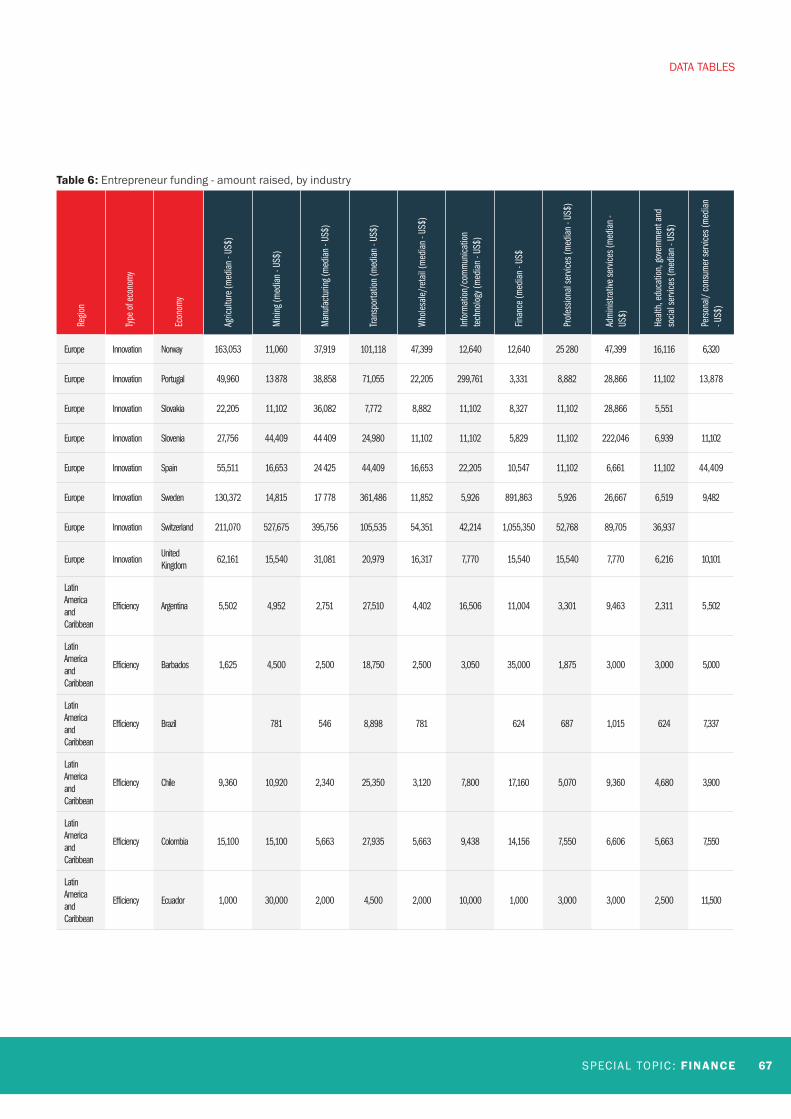
SPECIAL TOPIC : FINANCE 67
Regio
n
Type
of e
cono
my
Econ
omy
Agric
ultu
re (m
edia
n - U
S$)
Min
ing (
med
ian
- US$
)
Man
ufac
turin
g (m
edia
n - U
S$)
Trans
porta
tion
(med
ian
- US$
)
Who
lesa
le/re
tail
(med
ian
- US$
)
Info
rmat
ion/
com
mun
icatio
n te
chno
logy
(med
ian
- US$
)
Finan
ce (m
edia
n - U
S$
Prof
essio
nal s
ervic
es (m
edia
n - U
S$)
Adm
inist
rativ
e se
rvice
s (m
edia
n -
US$)
Heal
th, e
duca
tion,
gove
rnm
ent a
nd
socia
l ser
vices
(med
ian
- US$
)
Pers
onal
/ co
nsum
er se
rvice
s (m
edia
n - U
S$)
Europe Innovation Norway 163,053 11,060 37,919 101,118 47,399 12,640 12,640 25 280 47,399 16,116 6,320
Europe Innovation Portugal 49,960 13 878 38,858 71,055 22,205 299,761 3,331 8,882 28,866 11,102 13,878
Europe Innovation Slovakia 22,205 11,102 36,082 7,772 8,882 11,102 8,327 11,102 28,866 5,551
Europe Innovation Slovenia 27,756 44,409 44 409 24,980 11,102 11,102 5,829 11,102 222,046 6,939 11,102
Europe Innovation Spain 55,511 16,653 24 425 44,409 16,653 22,205 10,547 11,102 6,661 11,102 44,409
Europe Innovation Sweden 130,372 14,815 17 778 361,486 11,852 5,926 891,863 5,926 26,667 6,519 9,482
Europe Innovation Switzerland 211,070 527,675 395,756 105,535 54,351 42,214 1,055,350 52,768 89,705 36,937
Europe InnovationUnited Kingdom
62,161 15,540 31,081 20,979 16,317 7,770 15,540 15,540 7,770 6,216 10,101
Latin America and Caribbean
Efficiency Argentina 5,502 4,952 2,751 27,510 4,402 16,506 11,004 3,301 9,463 2,311 5 ,502
Latin America and Caribbean
Efficiency Barbados 1,625 4,500 2,500 18,750 2,500 3,050 35,000 1,875 3,000 3,000 5,000
Latin America and Caribbean
Efficiency Brazil 781 546 8,898 781 624 687 1,015 624 7,337
Latin America and Caribbean
Efficiency Chile 9,360 10,920 2,340 25,350 3,120 7,800 17,160 5,070 9,360 4,680 3,900
Latin America and Caribbean
Efficiency Colombia 15,100 15,100 5,663 27,935 5,663 9,438 14,156 7,550 6,606 5,663 7,550
Latin America and Caribbean
Efficiency Ecuador 1,000 30,000 2,000 4,500 2,000 10,000 1,000 3,000 3,000 2,500 11,500
Table 6: Entrepreneur funding - amount raised, by industry
DATA TABLES
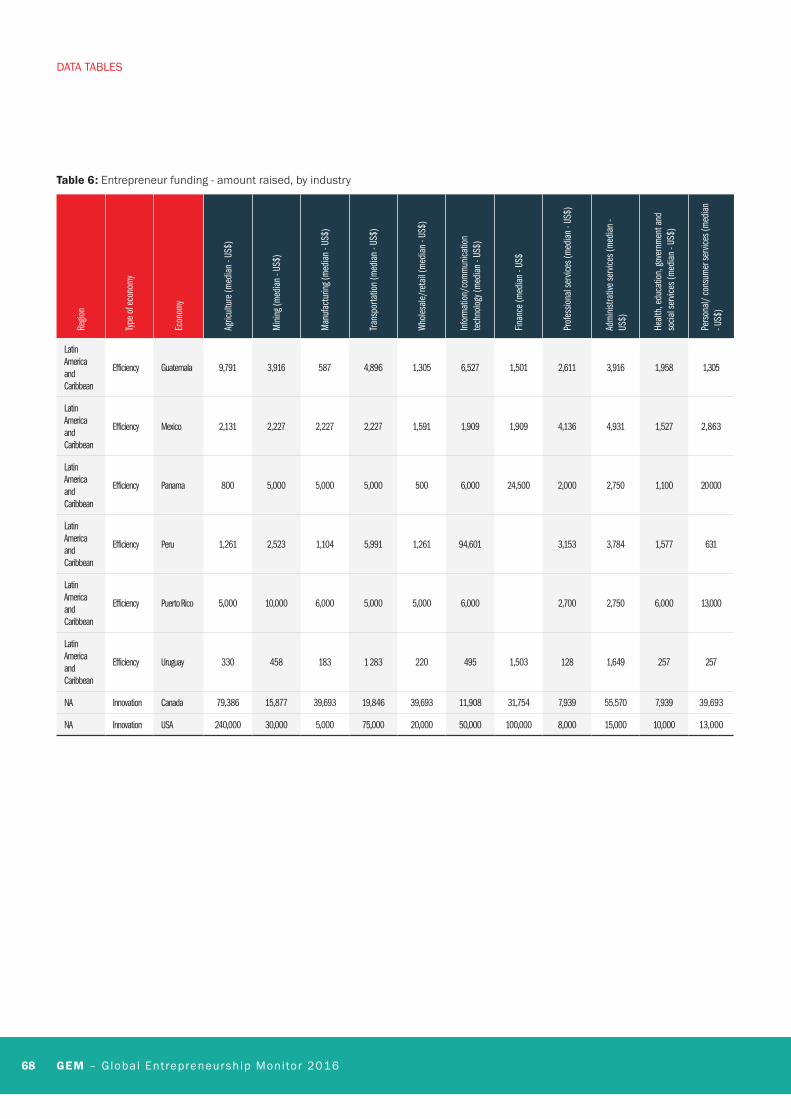
68 GEM – Global Entrepreneurship Monitor 2016
Regio
n
Type
of e
cono
my
Econ
omy
Agric
ultu
re (m
edia
n - U
S$)
Min
ing (
med
ian
- US$
)
Man
ufac
turin
g (m
edia
n - U
S$)
Trans
porta
tion
(med
ian
- US$
)
Who
lesa
le/re
tail
(med
ian
- US$
)
Info
rmat
ion/
com
mun
icatio
n te
chno
logy
(med
ian
- US$
)
Finan
ce (m
edia
n - U
S$
Prof
essio
nal s
ervic
es (m
edia
n - U
S$)
Adm
inist
rativ
e se
rvice
s (m
edia
n -
US$)
Heal
th, e
duca
tion,
gove
rnm
ent a
nd
socia
l ser
vices
(med
ian
- US$
)
Pers
onal
/ co
nsum
er se
rvice
s (m
edia
n - U
S$)
Latin America and Caribbean
Efficiency Guatemala 9,791 3,916 587 4,896 1,305 6,527 1,501 2,611 3,916 1,958 1,305
Latin America and Caribbean
Efficiency Mexico 2,131 2,227 2,227 2,227 1,591 1,909 1,909 4,136 4,931 1,527 2,863
Latin America and Caribbean
Efficiency Panama 800 5,000 5,000 5,000 500 6,000 24,500 2,000 2,750 1,100 20 000
Latin America and Caribbean
Efficiency Peru 1,261 2,523 1,104 5,991 1,261 94,601 3,153 3,784 1,577 631
Latin America and Caribbean
Efficiency Puerto Rico 5,000 10,000 6,000 5,000 5,000 6,000 2,700 2,750 6,000 13,000
Latin America and Caribbean
Efficiency Uruguay 330 458 183 1 283 220 495 1,503 128 1,649 257 257
NA Innovation Canada 79,386 15,877 39,693 19,846 39,693 11,908 31,754 7,939 55,570 7,939 39,693
NA Innovation USA 240,000 30,000 5,000 75,000 20,000 50,000 100,000 8,000 15,000 10,000 13,000
Table 6: Entrepreneur funding - amount raised, by industry
DATA TABLES
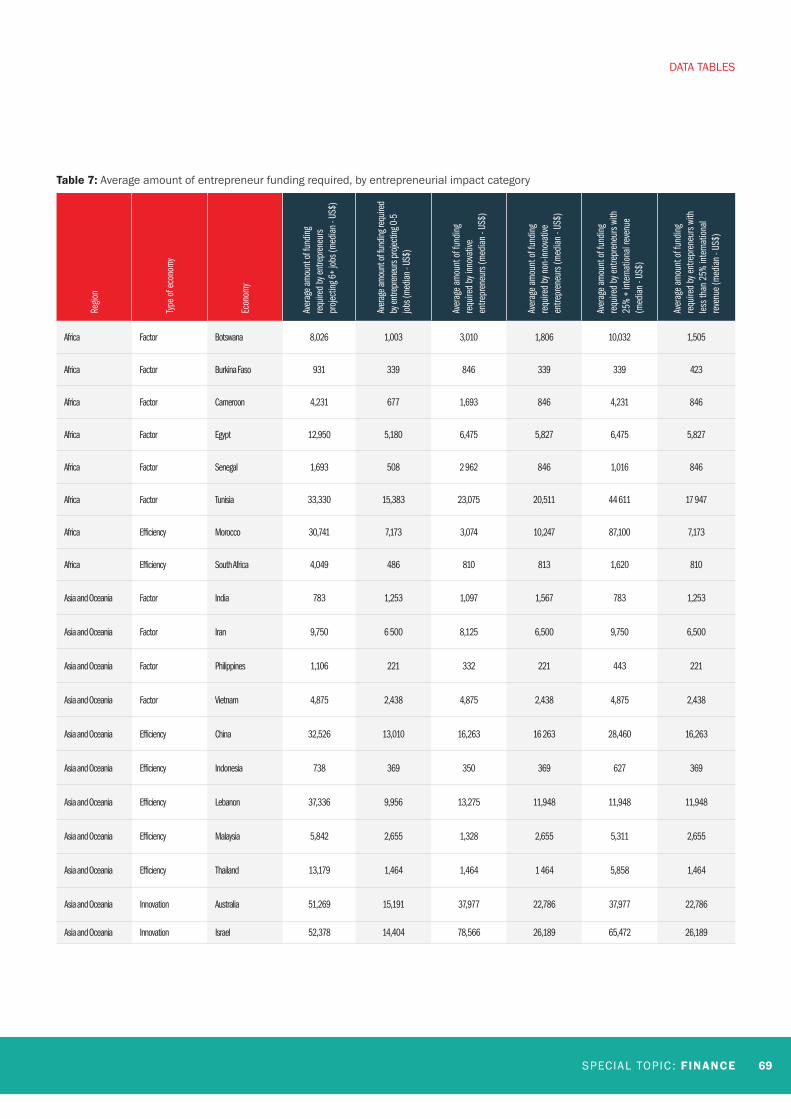
SPECIAL TOPIC : FINANCE 69
Table 7: Average amount of entrepreneur funding required, by entrepreneurial impact category
Regio
n
Type
of e
cono
my
Econ
omy
Aver
age a
mou
nt o
f fun
ding
re
quire
d by
entre
pren
eurs
pr
oject
ing 6
+ job
s (m
edian
- US
$)
Aver
age a
mou
nt of
fund
ing re
quire
d by
entre
pren
eurs
proje
cting
0-5
job
s (m
edian
- US
$)
Aver
age
amou
nt o
f fun
ding
re
quire
d by
inno
vativ
e en
trepr
eneu
rs (m
edia
n - U
S$)
Aver
age
amou
nt o
f fun
ding
re
quire
d by
non
-inno
vativ
e en
trepr
eneu
rs (m
edia
n - U
S$)
Aver
age
amou
nt o
f fun
ding
re
quire
d by
ent
repr
eneu
rs w
ith
25%
+ in
tern
atio
nal r
even
ue
(med
ian
- US$
)
Aver
age
amou
nt o
f fun
ding
re
quire
d by
ent
repr
eneu
rs w
ith
less
than
25%
inte
rnat
iona
l re
venu
e (m
edia
n - U
S$)
Africa Factor Botswana 8,026 1,003 3,010 1,806 10,032 1,505
Africa Factor Burkina Faso 931 339 846 339 339 423
Africa Factor Cameroon 4,231 677 1,693 846 4,231 846
Africa Factor Egypt 12,950 5,180 6,475 5,827 6,475 5,827
Africa Factor Senegal 1,693 508 2 962 846 1,016 846
Africa Factor Tunisia 33,330 15,383 23,075 20,511 44 611 17 947
Africa Efficiency Morocco 30,741 7,173 3,074 10,247 87,100 7,173
Africa Efficiency South Africa 4,049 486 810 813 1,620 810
Asia and Oceania Factor India 783 1,253 1,097 1,567 783 1,253
Asia and Oceania Factor Iran 9,750 6 500 8,125 6,500 9,750 6,500
Asia and Oceania Factor Philippines 1,106 221 332 221 443 221
Asia and Oceania Factor Vietnam 4,875 2,438 4,875 2,438 4,875 2,438
Asia and Oceania Efficiency China 32,526 13,010 16,263 16 263 28,460 16,263
Asia and Oceania Efficiency Indonesia 738 369 350 369 627 369
Asia and Oceania Efficiency Lebanon 37,336 9,956 13,275 11,948 11,948 11,948
Asia and Oceania Efficiency Malaysia 5,842 2,655 1,328 2,655 5,311 2,655
Asia and Oceania Efficiency Thailand 13,179 1,464 1,464 1 464 5,858 1,464
Asia and Oceania Innovation Australia 51,269 15,191 37,977 22,786 37,977 22,786
Asia and Oceania Innovation Israel 52,378 14,404 78,566 26,189 65,472 26,189
DATA TABLES
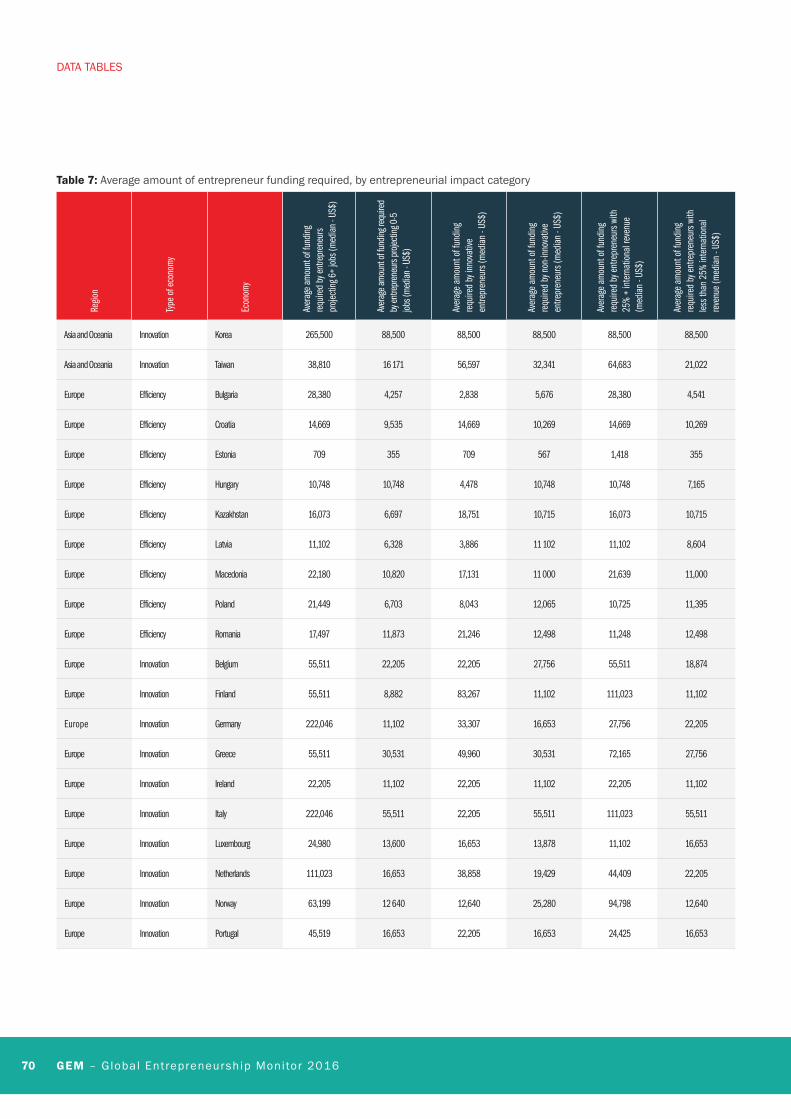
70 GEM – Global Entrepreneurship Monitor 2016
Regio
n
Type
of e
cono
my
Econ
omy
Aver
age a
mou
nt o
f fun
ding
re
quire
d by
entre
pren
eurs
pr
oject
ing 6
+ job
s (m
edian
- US
$)
Aver
age a
mou
nt of
fund
ing re
quire
d by
entre
pren
eurs
proje
cting
0-5
job
s (m
edian
- US
$)
Aver
age
amou
nt o
f fun
ding
re
quire
d by
inno
vativ
e en
trepr
eneu
rs (m
edia
n - U
S$)
Aver
age
amou
nt o
f fun
ding
re
quire
d by
non
-inno
vativ
e en
trepr
eneu
rs (m
edia
n - U
S$)
Aver
age
amou
nt o
f fun
ding
re
quire
d by
ent
repr
eneu
rs w
ith
25%
+ in
tern
atio
nal r
even
ue
(med
ian
- US$
)
Aver
age
amou
nt o
f fun
ding
re
quire
d by
ent
repr
eneu
rs w
ith
less
than
25%
inte
rnat
iona
l re
venu
e (m
edia
n - U
S$)
Asia and Oceania Innovation Korea 265,500 88,500 88,500 88,500 88,500 88,500
Asia and Oceania Innovation Taiwan 38,810 16 171 56,597 32,341 64,683 21,022
Europe Efficiency Bulgaria 28,380 4,257 2,838 5,676 28,380 4,541
Europe Efficiency Croatia 14,669 9,535 14,669 10,269 14,669 10,269
Europe Efficiency Estonia 709 355 709 567 1,418 355
Europe Efficiency Hungary 10,748 10,748 4,478 10,748 10,748 7,165
Europe Efficiency Kazakhstan 16,073 6,697 18,751 10,715 16,073 10,715
Europe Efficiency Latvia 11,102 6,328 3,886 11 102 11,102 8,604
Europe Efficiency Macedonia 22,180 10,820 17,131 11 000 21,639 11,000
Europe Efficiency Poland 21,449 6,703 8,043 12,065 10,725 11,395
Europe Efficiency Romania 17,497 11,873 21,246 12,498 11,248 12,498
Europe Innovation Belgium 55,511 22,205 22,205 27,756 55,511 18,874
Europe Innovation Finland 55,511 8,882 83,267 11,102 111,023 11,102
Europe Innovation Germany 222,046 11,102 33,307 16,653 27,756 22,205
Europe Innovation Greece 55,511 30,531 49,960 30,531 72,165 27,756
Europe Innovation Ireland 22,205 11,102 22,205 11,102 22,205 11,102
Europe Innovation Italy 222,046 55,511 22,205 55,511 111,023 55,511
Europe Innovation Luxembourg 24,980 13,600 16,653 13,878 11,102 16,653
Europe Innovation Netherlands 111,023 16,653 38,858 19,429 44,409 22,205
Europe Innovation Norway 63,199 12 640 12,640 25,280 94,798 12,640
Europe Innovation Portugal 45,519 16,653 22,205 16,653 24,425 16,653
Table 7: Average amount of entrepreneur funding required, by entrepreneurial impact category
DATA TABLES
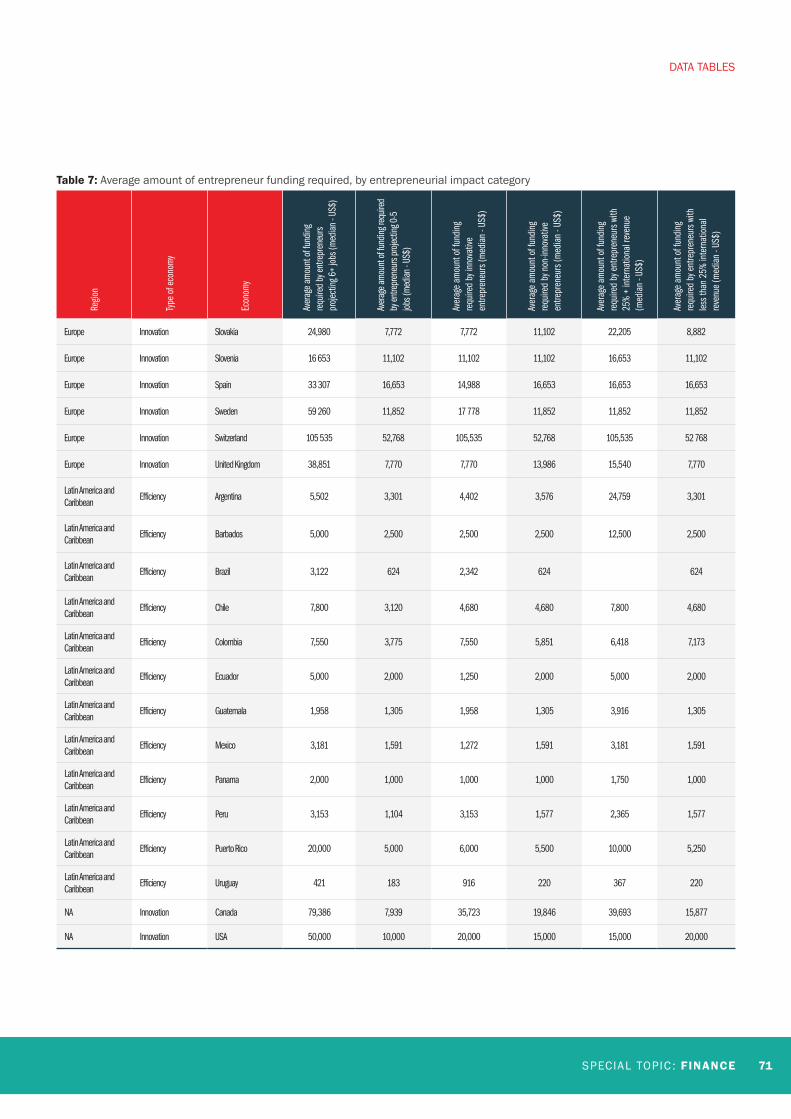
SPECIAL TOPIC : FINANCE 71
Regio
n
Type
of e
cono
my
Econ
omy
Aver
age a
mou
nt o
f fun
ding
re
quire
d by
entre
pren
eurs
pr
oject
ing 6
+ job
s (m
edian
- US
$)
Aver
age a
mou
nt of
fund
ing re
quire
d by
entre
pren
eurs
proje
cting
0-5
job
s (m
edian
- US
$)
Aver
age
amou
nt o
f fun
ding
re
quire
d by
inno
vativ
e en
trepr
eneu
rs (m
edia
n - U
S$)
Aver
age
amou
nt o
f fun
ding
re
quire
d by
non
-inno
vativ
e en
trepr
eneu
rs (m
edia
n - U
S$)
Aver
age
amou
nt o
f fun
ding
re
quire
d by
ent
repr
eneu
rs w
ith
25%
+ in
tern
atio
nal r
even
ue
(med
ian
- US$
)
Aver
age
amou
nt o
f fun
ding
re
quire
d by
ent
repr
eneu
rs w
ith
less
than
25%
inte
rnat
iona
l re
venu
e (m
edia
n - U
S$)
Europe Innovation Slovakia 24,980 7,772 7,772 11,102 22,205 8,882
Europe Innovation Slovenia 16 653 11,102 11,102 11,102 16,653 11,102
Europe Innovation Spain 33 307 16,653 14,988 16,653 16,653 16,653
Europe Innovation Sweden 59 260 11,852 17 778 11,852 11,852 11,852
Europe Innovation Switzerland 105 535 52,768 105,535 52,768 105,535 52 768
Europe Innovation United Kingdom 38,851 7,770 7,770 13,986 15,540 7,770
Latin America and Caribbean
Efficiency Argentina 5,502 3,301 4,402 3,576 24,759 3,301
Latin America and Caribbean
Efficiency Barbados 5,000 2,500 2,500 2,500 12,500 2,500
Latin America and Caribbean
Efficiency Brazil 3,122 624 2,342 624 624
Latin America and Caribbean
Efficiency Chile 7,800 3,120 4,680 4,680 7,800 4,680
Latin America and Caribbean
Efficiency Colombia 7,550 3,775 7,550 5,851 6,418 7,173
Latin America and Caribbean
Efficiency Ecuador 5,000 2,000 1,250 2,000 5,000 2,000
Latin America and Caribbean
Efficiency Guatemala 1,958 1,305 1,958 1,305 3,916 1,305
Latin America and Caribbean
Efficiency Mexico 3,181 1,591 1,272 1,591 3,181 1,591
Latin America and Caribbean
Efficiency Panama 2,000 1,000 1,000 1,000 1,750 1,000
Latin America and Caribbean
Efficiency Peru 3,153 1,104 3,153 1,577 2,365 1,577
Latin America and Caribbean
Efficiency Puerto Rico 20,000 5,000 6,000 5,500 10,000 5,250
Latin America and Caribbean
Efficiency Uruguay 421 183 916 220 367 220
NA Innovation Canada 79,386 7,939 35,723 19,846 39,693 15,877
NA Innovation USA 50,000 10,000 20,000 15,000 15,000 20,000
Table 7: Average amount of entrepreneur funding required, by entrepreneurial impact category
DATA TABLES
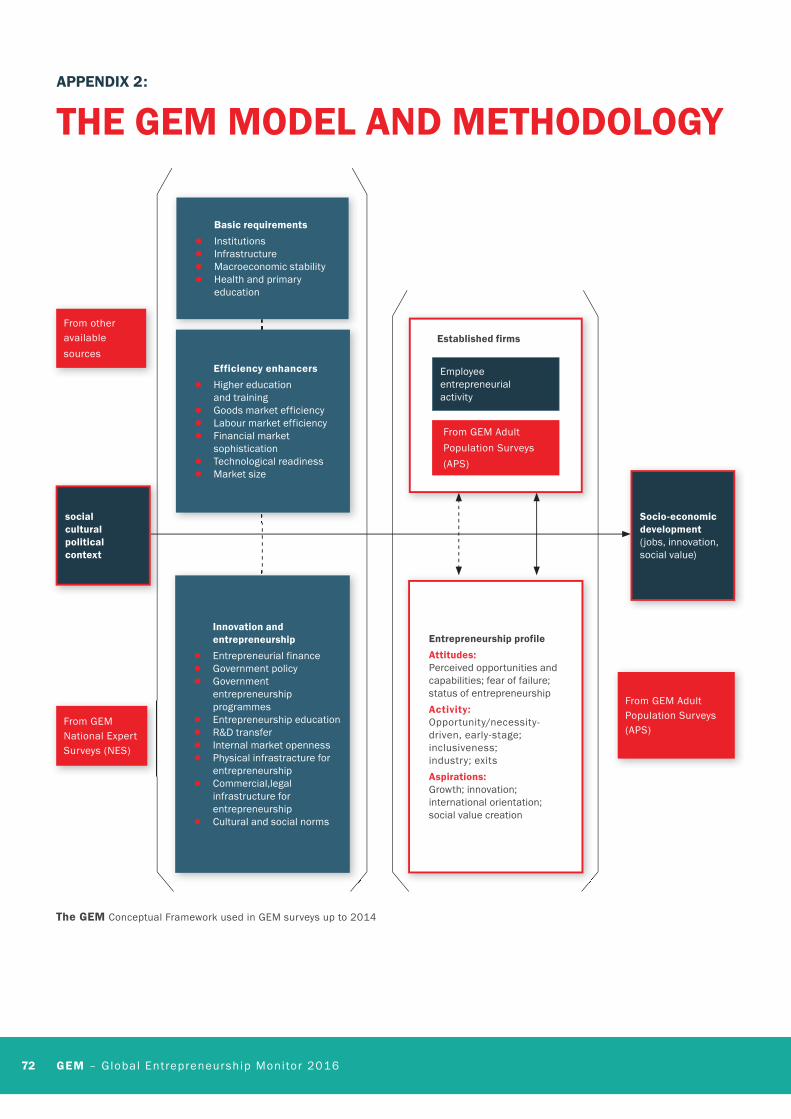
72 GEM – Global Entrepreneurship Monitor 2016
APPENDIX 2:
THE GEM MODEL AND METHODOLOGY
socialculturalpoliticalcontext
From other available sources
From GEM National Expert Surveys (NES)
Established firms
Employeeentrepreneurialactivity
From GEM Adult Population Surveys (APS)
Entrepreneurship profile
Attitudes:Perceived opportunities and capabilities; fear of failure; status of entrepreneurship
Activity:Opportunity/necessity-driven, early-stage; inclusiveness; industry; exits
Aspirations:Growth; innovation;international orientation;social value creation
From GEM Adult Population Surveys (APS)
Socio-economic development(jobs, innovation, social value)
Basic requirements
● Institutions ● Infrastructure ● Macroeconomic stability ● Health and primary
education
Efficiency enhancers
● Higher education and training
● Goods market efficiency ● Labour market efficiency ● Financial market
sophistication ● Technological readiness ● Market size
Innovation and entrepreneurship
● Entrepreneurial finance ● Government policy ● Government
entrepreneurship programmes
● Entrepreneurship education ● R&D transfer ● Internal market openness ● Physical infrastracture for
entrepreneurship ● Commercial,legal
infrastructure for entrepreneurship
● Cultural and social norms
The GEM Conceptual Framework used in GEM surveys up to 2014
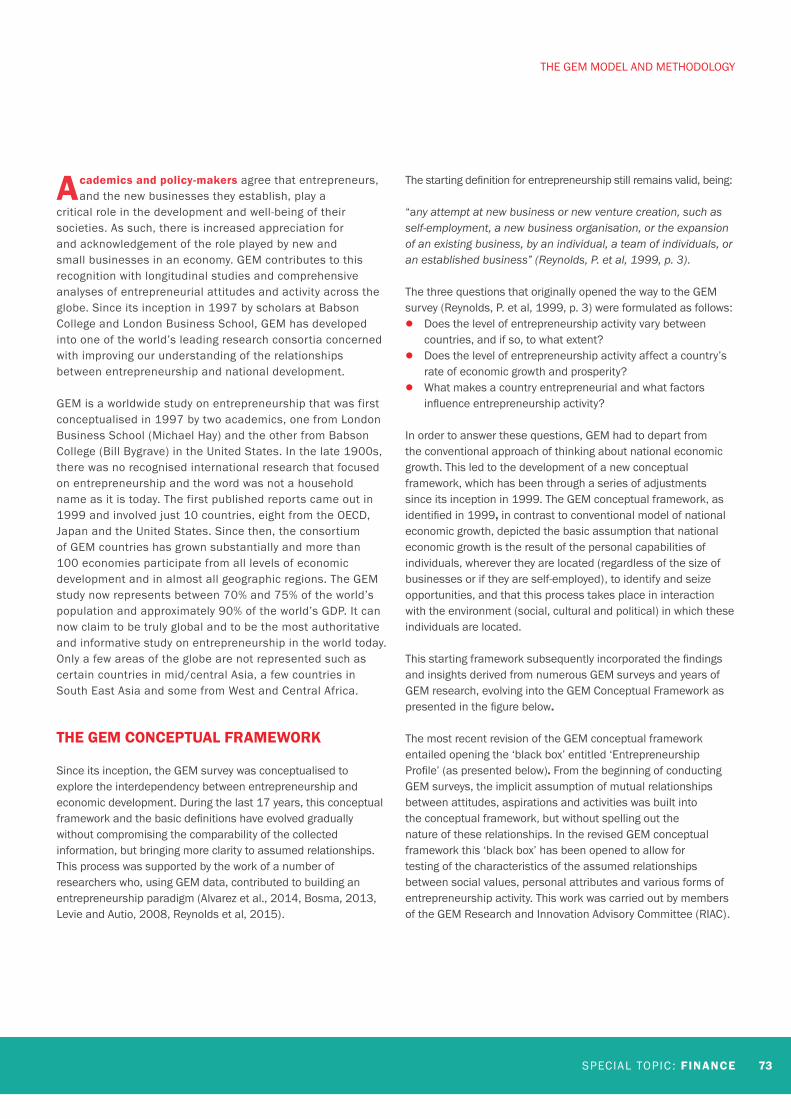
SPECIAL TOPIC : FINANCE 73
Academics and policy-makers agree that entrepreneurs, and the new businesses they establish, play a
critical role in the development and well-being of their societies. As such, there is increased appreciation for and acknowledgement of the role played by new and small businesses in an economy. GEM contributes to this recognition with longitudinal studies and comprehensive analyses of entrepreneurial attitudes and activity across the globe. Since its inception in 1997 by scholars at Babson College and London Business School, GEM has developed into one of the world’s leading research consortia concerned with improving our understanding of the relationships between entrepreneurship and national development.
GEM is a worldwide study on entrepreneurship that was first conceptualised in 1997 by two academics, one from London Business School (Michael Hay) and the other from Babson College (Bill Bygrave) in the United States. In the late 1900s, there was no recognised international research that focused on entrepreneurship and the word was not a household name as it is today. The first published reports came out in 1999 and involved just 10 countries, eight from the OECD, Japan and the United States. Since then, the consortium of GEM countries has grown substantially and more than 100 economies participate from all levels of economic development and in almost all geographic regions. The GEM study now represents between 70% and 75% of the world’s population and approximately 90% of the world’s GDP. It can now claim to be truly global and to be the most authoritative and informative study on entrepreneurship in the world today. Only a few areas of the globe are not represented such as certain countries in mid/central Asia, a few countries in South East Asia and some from West and Central Africa.
THE GEM CONCEPTUAL FRAMEWORK
Since its inception, the GEM survey was conceptualised to explore the interdependency between entrepreneurship and economic development. During the last 17 years, this conceptual framework and the basic definitions have evolved gradually without compromising the comparability of the collected information, but bringing more clarity to assumed relationships. This process was supported by the work of a number of researchers who, using GEM data, contributed to building an entrepreneurship paradigm (Alvarez et al., 2014, Bosma, 2013, Levie and Autio, 2008, Reynolds et al, 2015).
The starting definition for entrepreneurship still remains valid, being:
“any attempt at new business or new venture creation, such as self-employment, a new business organisation, or the expansion of an existing business, by an individual, a team of individuals, or an established business” (Reynolds, P. et al, 1999, p. 3).
The three questions that originally opened the way to the GEM survey (Reynolds, P. et al, 1999, p. 3) were formulated as follows:
● Does the level of entrepreneurship activity vary between countries, and if so, to what extent?
● Does the level of entrepreneurship activity affect a country’s rate of economic growth and prosperity?
● What makes a country entrepreneurial and what factors influence entrepreneurship activity?
In order to answer these questions, GEM had to depart from the conventional approach of thinking about national economic growth. This led to the development of a new conceptual framework, which has been through a series of adjustments since its inception in 1999. The GEM conceptual framework, as identified in 1999, in contrast to conventional model of national economic growth, depicted the basic assumption that national economic growth is the result of the personal capabilities of individuals, wherever they are located (regardless of the size of businesses or if they are self-employed), to identify and seize opportunities, and that this process takes place in interaction with the environment (social, cultural and political) in which these individuals are located.
This starting framework subsequently incorporated the findings and insights derived from numerous GEM surveys and years of GEM research, evolving into the GEM Conceptual Framework as presented in the figure below.
The most recent revision of the GEM conceptual framework entailed opening the ‘black box’ entitled ‘Entrepreneurship Profile’ (as presented below). From the beginning of conducting GEM surveys, the implicit assumption of mutual relationships between attitudes, aspirations and activities was built into the conceptual framework, but without spelling out the nature of these relationships. In the revised GEM conceptual framework this ‘black box’ has been opened to allow for testing of the characteristics of the assumed relationships between social values, personal attributes and various forms of entrepreneurship activity. This work was carried out by members of the GEM Research and Innovation Advisory Committee (RIAC).
THE GEM MODEL AND METHODOLOGY
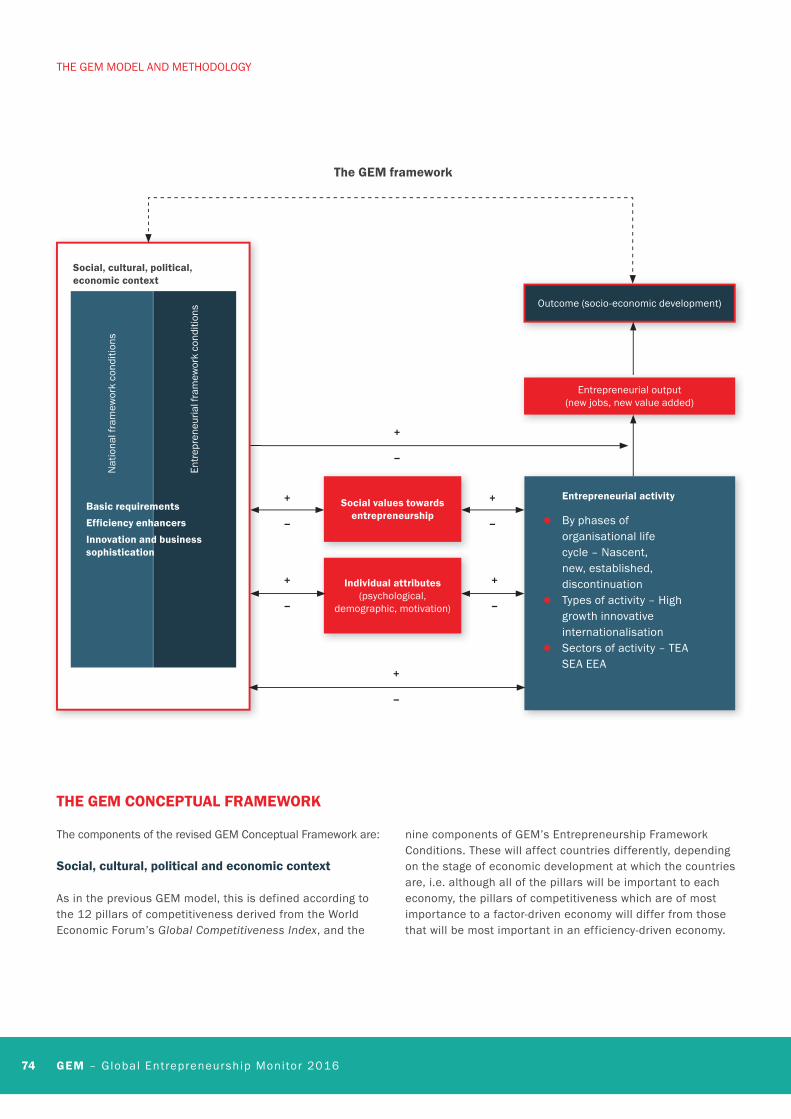
74 GEM – Global Entrepreneurship Monitor 2016
Social, cultural, political, economic context
Outcome (socio-economic development)
Entrepreneurial output(new jobs, new value added)
Social values towards entrepreneurship
Individual attributes (psychological,
demographic, motivation)
Entrepreneurial activity
● By phases of organisational life cycle – Nascent, new, established, discontinuation
● Types of activity – High growth innovative internationalisation
● Sectors of activity – TEA SEA EEA
Basic requirements
Efficiency enhancers
Innovation and business sophistication
+
_
+
_
+
_
+
_
+
_
+
_
The GEM framework
Nat
iona
l fra
mew
ork
cond
ition
s
Entr
epre
neur
ial f
ram
ewor
k co
nditi
ons
THE GEM CONCEPTUAL FRAMEWORK
The components of the revised GEM Conceptual Framework are:
Social, cultural, political and economic context
As in the previous GEM model, this is defined according to the 12 pillars of competitiveness derived from the World Economic Forum’s Global Competitiveness Index, and the
nine components of GEM’s Entrepreneurship Framework Conditions. These will affect countries differently, depending on the stage of economic development at which the countries are, i.e. although all of the pillars will be important to each economy, the pillars of competitiveness which are of most importance to a factor-driven economy will differ from those that will be most important in an efficiency-driven economy.
THE GEM MODEL AND METHODOLOGY
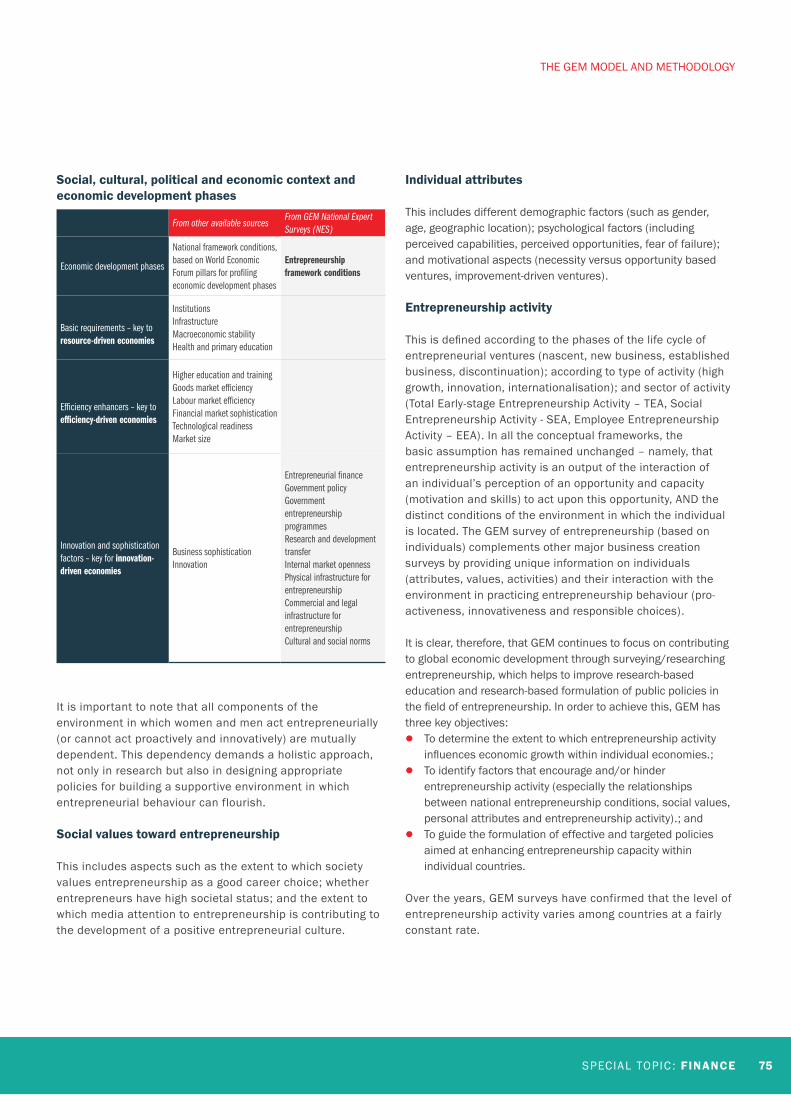
SPECIAL TOPIC : FINANCE 75
Social, cultural, political and economic context and economic development phases
From other available sources From GEM National Expert Surveys (NES)
Economic development phases
National framework conditions, based on World Economic Forum pillars for profiling economic development phases
Entrepreneurship framework conditions
Basic requirements – key to resource-driven economies
InstitutionsInfrastructureMacroeconomic stabilityHealth and primary education
Efficiency enhancers – key to efficiency-driven economies
Higher education and trainingGoods market efficiencyLabour market efficiencyFinancial market sophisticationTechnological readinessMarket size
Innovation and sophistication factors – key for innovation-driven economies
Business sophisticationInnovation
Entrepreneurial financeGovernment policyGovernment entrepreneurship programmesResearch and development transferInternal market opennessPhysical infrastructure for entrepreneurshipCommercial and legal infrastructure for entrepreneurshipCultural and social norms
It is important to note that all components of the environment in which women and men act entrepreneurially (or cannot act proactively and innovatively) are mutually dependent. This dependency demands a holistic approach, not only in research but also in designing appropriate policies for building a supportive environment in which entrepreneurial behaviour can flourish.
Social values toward entrepreneurship
This includes aspects such as the extent to which society values entrepreneurship as a good career choice; whether entrepreneurs have high societal status; and the extent to which media attention to entrepreneurship is contributing to the development of a positive entrepreneurial culture.
Individual attributes
This includes different demographic factors (such as gender, age, geographic location); psychological factors (including perceived capabilities, perceived opportunities, fear of failure); and motivational aspects (necessity versus opportunity based ventures, improvement-driven ventures).
Entrepreneurship activity
This is defined according to the phases of the life cycle of entrepreneurial ventures (nascent, new business, established business, discontinuation); according to type of activity (high growth, innovation, internationalisation); and sector of activity (Total Early-stage Entrepreneurship Activity – TEA, Social Entrepreneurship Activity - SEA, Employee Entrepreneurship Activity – EEA). In all the conceptual frameworks, the basic assumption has remained unchanged – namely, that entrepreneurship activity is an output of the interaction of an individual’s perception of an opportunity and capacity (motivation and skills) to act upon this opportunity, AND the distinct conditions of the environment in which the individual is located. The GEM survey of entrepreneurship (based on individuals) complements other major business creation surveys by providing unique information on individuals (attributes, values, activities) and their interaction with the environment in practicing entrepreneurship behaviour (pro-activeness, innovativeness and responsible choices).
It is clear, therefore, that GEM continues to focus on contributing to global economic development through surveying/researching entrepreneurship, which helps to improve research-based education and research-based formulation of public policies in the field of entrepreneurship. In order to achieve this, GEM has three key objectives:
● To determine the extent to which entrepreneurship activity influences economic growth within individual economies.;
● To identify factors that encourage and/or hinder entrepreneurship activity (especially the relationships between national entrepreneurship conditions, social values, personal attributes and entrepreneurship activity).; and
● To guide the formulation of effective and targeted policies aimed at enhancing entrepreneurship capacity within individual countries.
Over the years, GEM surveys have confirmed that the level of entrepreneurship activity varies among countries at a fairly constant rate.
THE GEM MODEL AND METHODOLOGY
76 GEM – Global Entrepreneurship Monitor 2016
Total Early-stage Entrepreneurial Activity (TEA)
Individual attributes
● Gender ● Age ● Motivation (opportunity, necessity)
Industry
● Sector
Impact
● Business growth ● Innovation ● Internationalisation
Total Early-stage Entrepreneurial Activity (TEA)
Nascent entrepreneur:
involved in setting up a business
Owner-manager of a new business
(less than 3.5 years old)
Owner-manager of an established business
(more than 3.5 years old)
Early-stage entrepreneurship profi le
Potential entrepreneur:
opportunities, knowledge and skills
Conception Firm birth Persistence
Discontinuation of business
The entrepreneurship process and GEM operational defi nitionsSource: GEM Global Report 2014
A crucial point confi rmed by GEM research is that it takes time and consistency in policy interventions in order to enhance and develop the factors that contribute to entrepreneurship activity. Surveys also confi rmed that entrepreneurship activity, in different forms (nascent, start-up, employee entrepreneurship), is positively correlated with economic growth, but that this relationship differs according to phases of economic development (Acs and Amorós, 2008; Van Stel et al., 2005; Wennekers et al., 2010).
GEM’s role as one of the world’s leading research consortia concerned with improving the understanding of the relationships between entrepreneurship and national development is confi rmed by recent policy interventions around the world. These are focused on components of the GEM conceptual framework: environment (entrepreneurship framework conditions), individual capacity for identifying and exploiting opportunities, and society’s capacity to develop an entrepreneurial culture. A recent report on entrepreneurial ambition and innovation (WEF-GEM, 2015) highlights the cases of Colombia and Chile, economies that have put in place several public and private initiatives to enhance their entrepreneurship ecosystems (Drexler and Amorós, 2015).
How GEM measures entrepreneurship
GEM measures individual participation across multiple phases of the entrepreneurship process, providing insights into the level of engagement in each stage. This is important because societies may have varying levels of participation at different points in this process; however, a healthy entrepreneurial society needs people active in all phases. For example, in order to have start-ups in a society, there must be potential entrepreneurs. Later in the process, people that have started businesses must have the ability and the support to enable them to sustain their businesses into maturity.
GEM’s multiphase measures of entrepreneurship are given below:
Potential entrepreneurs – those who see opportunities in their environments, have the capabilities to start businesses and are undeterred by fear of failure.
Intentional entrepreneurs – those who intend to start a business in the future (in the next three years).
THE GEM MODEL AND METHODOLOGY
SPECIAL TOPIC : FINANCE 77
Nascent entrepreneurs – those who have taken steps to start a new business, but have not yet paid salaries or wages for more than three months.
New entrepreneurs – those who are running new businesses that have been in operation for between three and 42 months.
Established business owners – those who are running a mature business, in operation for more than 42 months.
Discontinued entrepreneurs – those who, for whatever reason, have exited from running a business in the past year.
GEM’s individual-level focus enables a more comprehensive account of business activity than firm-level measures of formally registered businesses. In other words, GEM captures both informal and formal activity. This is important because in many societies, the majority of entrepreneurs operate in the informal sphere. In addition, GEM’s emphasis on individuals provides an insight into who these entrepreneurs are: for example, their demographic profiles, their motivations for starting ventures, and the ambitions they have for their businesses.
GEM also assesses broader societal attitudes about entrepreneurship, which can indicate the extent to which people are engaged in or willing to participate in entrepreneurship activity, and the level of societal support for their efforts. The GEM database allows for the exploration of individual or business characteristics, as well as the causes and consequences of new business creation.
In order to provide for reliable comparisons across countries, GEM data is obtained using a research design that is harmonised over all participating countries. The data is gathered on an annual basis from two main sources:
1. Adult Population Survey (APS)
The key entrepreneurship indicators are measured in the Adult Population Survey (APS). Academic teams in each participating economy administer and oversee this survey, which is conducted using a random representative sample of at least 2 000 adults between the ages of 18 and 64. The surveys are conducted at the same time every year (between May and July) using a standardised questionnaire provided by the GEM Global Data Team. The questionnaire is
translated into local languages, and back-translated for a validity check.
The individual countries only gain access to the data once the raw data has been analysed by experts for quality assurance, checking and uniform statistical calculations. As the GEM research design harmonises the data, it is possible to conduct reliable cross national and intra-country comparisons over time.
2. National Experts Survey (NES)
The National Expert Survey (NES) provides information on the local environment faced by start-up entrepreneurs. Information is gathered about the nine entrepreneurship framework conditions: financing for entrepreneurs, government policies, governmental programmes, entrepreneurship education and training, research and development transfer, commercial and professional infrastructure, internal market openness, physical and services infrastructure and social and cultural norms.
The GEM global data set is open source after three years and it can be may be be accessed at (www.gemconsortium.org.) .
Besides the annual surveys based on collecting data through Adult Population Survey and National Expert Survey instruments, GEM conducts in-depth surveys on special topics, by adding specific questions to the standard APS questionnaire. This rich seam of GEM data has been analysed and presented in a number of separate publications (www.gemconsortium.org):
● On financing, in 2004 and 2006 ● On women and entrepreneurship, in 2005, 2006,
2007, 2009, 2010, 2012, 2015 ● On high expectation entrepreneurship, on high-
growth entrepreneurship, on high impact entrepreneurship, in 2005, 2007, 2011
● On the innovation confidence index – European Union funded project, in 2007, 2008, 2009
● On social entrepreneurship, in 2009 and 2016 ● On education and training, in 2010 ● On youth, in 2013, 2015 ● On entrepreneurial employee activity, in 2013 ● On sub-Saharan Africa, in 2013, 2014 (on youth) ● On entrepreneurship, competitiveness and
development, 2015 ● On South East Asia, 2015
THE GEM MODEL AND METHODOLOGY
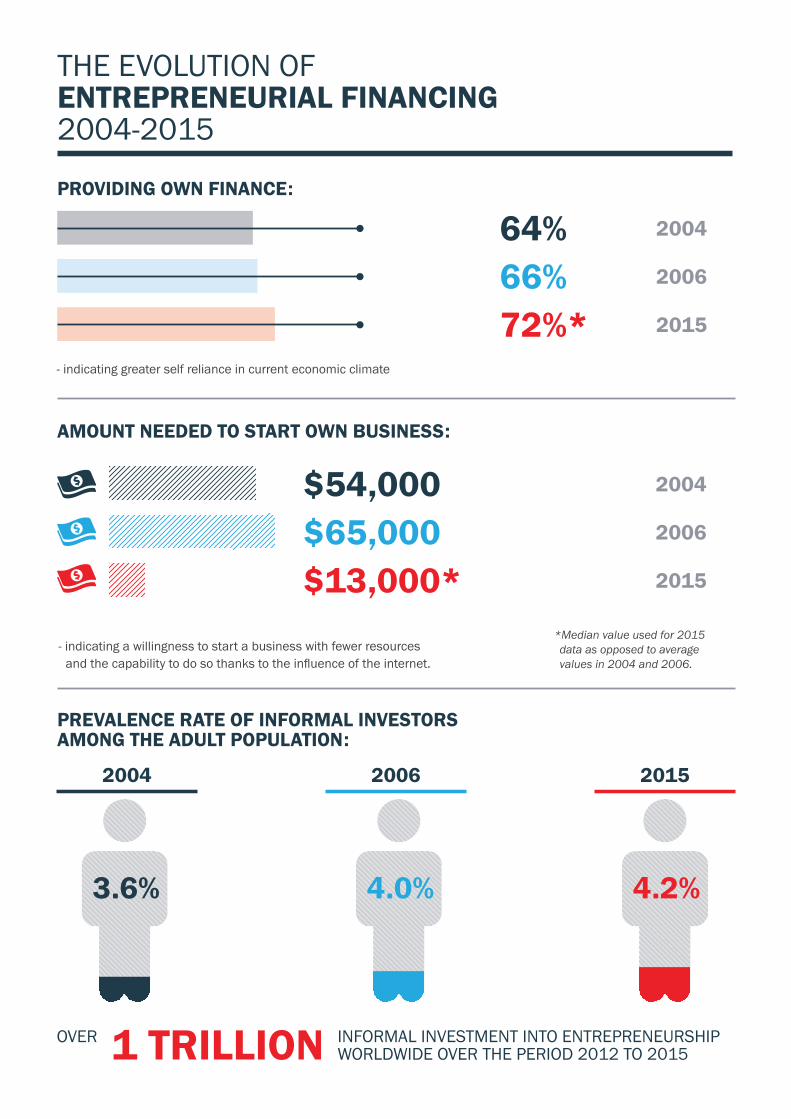
THE EVOLUTION OF ENTREPRENEURIAL FINANCING 2004-2015
PROVIDING OWN FINANCE:
64% 2004
66% 2006
72%* 2015
- indicating greater self reliance in current economic climate
AMOUNT NEEDED TO START OWN BUSINESS:
PREVALENCE RATE OF INFORMAL INVESTORS AMONG THE ADULT POPULATION:
$54,000 2004
$65,000 2006
$13,000*
1 TRILLION
2015
- indicating a willingness to start a business with fewer resources and the capability to do so thanks to the influence of the internet.
4.2%
2004 2006 2015
3.6% 4.0%
*Median value used for 2015 data as opposed to average values in 2004 and 2006.
OVER INFORMAL INVESTMENT INTO ENTREPRENEURSHIP WORLDWIDE OVER THE PERIOD 2012 TO 2015
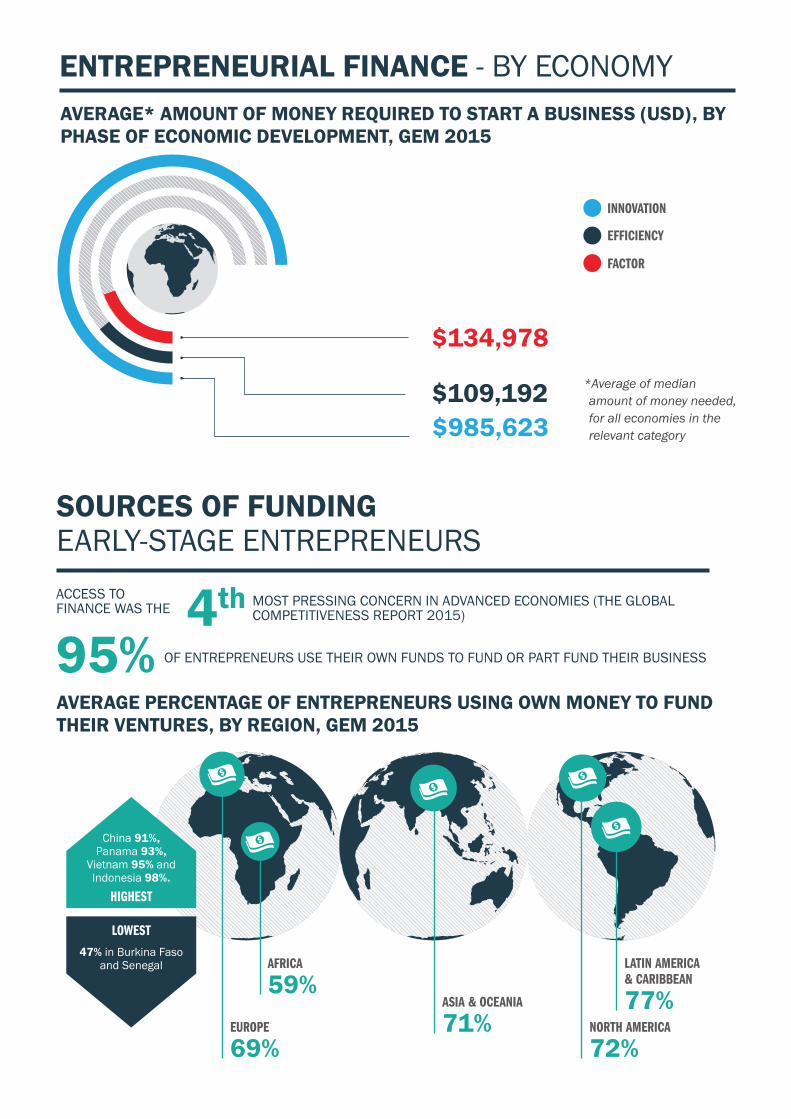
SOURCES OF FUNDINGEARLY-STAGE ENTREPRENEURS
95% OF ENTREPRENEURS USE THEIR OWN FUNDS TO FUND OR PART FUND THEIR BUSINESS
4th MOST PRESSING CONCERN IN ADVANCED ECONOMIES (THE GLOBAL COMPETITIVENESS REPORT 2015)
ACCESS TO FINANCE WAS THE
EUROPE
69%NORTH AMERICA
72%
ASIA & OCEANIA
71%
AFRICA
59%LATIN AMERICA & CARIBBEAN
77%
LOWEST
HIGHEST
47% in Burkina Faso and Senegal
China 91%, Panama 93%,
Vietnam 95% and Indonesia 98%.
*Average of median amount of money needed, for all economies in the relevant category
AVERAGE* AMOUNT OF MONEY REQUIRED TO START A BUSINESS (USD), BY PHASE OF ECONOMIC DEVELOPMENT, GEM 2015
ENTREPRENEURIAL FINANCE - BY ECONOMY
$985,623$109,192
$134,978
INNOVATION
EFFICIENCY
FACTOR
AVERAGE PERCENTAGE OF ENTREPRENEURS USING OWN MONEY TO FUND THEIR VENTURES, BY REGION, GEM 2015
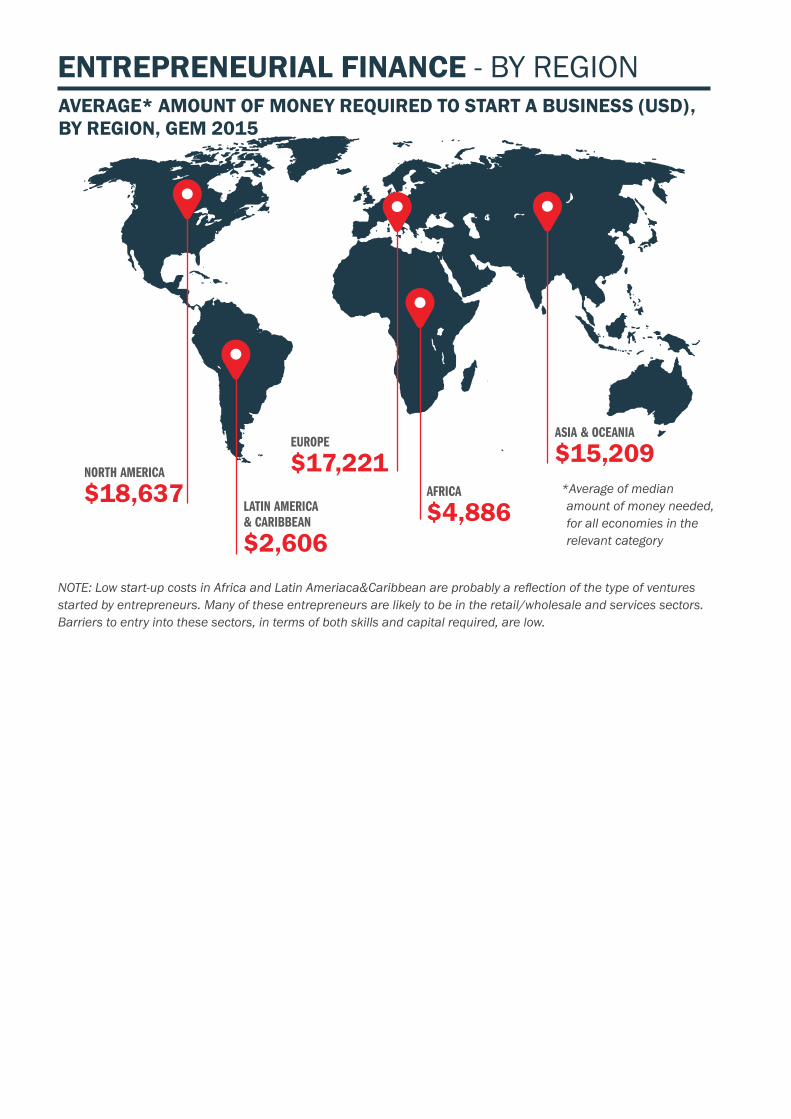
*Average of median amount of money needed, for all economies in the relevant category
AVERAGE* AMOUNT OF MONEY REQUIRED TO START A BUSINESS (USD), BY REGION, GEM 2015
ENTREPRENEURIAL FINANCE - BY REGION
NOTE: Low start-up costs in Africa and Latin Ameriaca&Caribbean are probably a reflection of the type of ventures started by entrepreneurs. Many of these entrepreneurs are likely to be in the retail/wholesale and services sectors. Barriers to entry into these sectors, in terms of both skills and capital required, are low.
AFRICA
$4,886
EUROPE
$17,221ASIA & OCEANIA
$15,209NORTH AMERICA
$18,637LATIN AMERICA & CARIBBEAN
$2,606
SPECIAL TOPIC : FINANCE 81
All rights of this publication are reserved and therefore cannot be reproduced in its totality, its part, recorded or transmitted by any information retrieval system in any way, by any means mechancial, photochemical, electronic, magnetis, electro-optical, digital, photcopying or otherwise, without prior permission in writing by the authors.
www.rothko.co.za