Embed Size (px)
Citation preview

Chapter 9
VALUING EARLY-STAGE VENTURES
1
ENTREPRENEURIAL FINANCE
Business Valuation
2
The process of determining the economic value of a business or company.
Common approaches to business valuation include review of financial statements, discounting cash flow models, and similar company comparisons.

What is a Venture Theoretically Worth?
Present value (PV): value today of all future cash flows discounted to the present at the investor’s required rate of return
3
Basic Mechanics Of Valuation
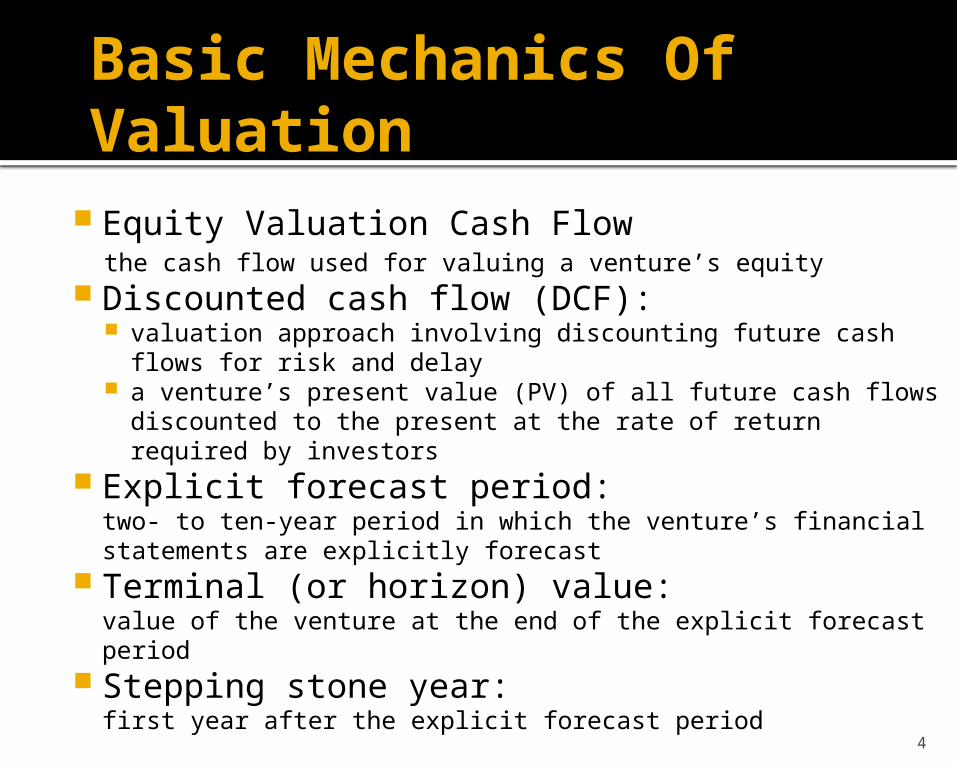
Equity Valuation Cash Flowthe cash flow used for valuing a venture’s equity
Discounted cash flow (DCF): valuation approach involving discounting future cash flows
for risk and delay a venture’s present value (PV) of all future cash flows
discounted to the present at the rate of return required by investors
Explicit forecast period:two- to ten-year period in which the venture’s financial statements are explicitly forecast
Terminal (or horizon) value:value of the venture at the end of the explicit forecast period
Stepping stone year:first year after the explicit forecast period
4
Terminal Value
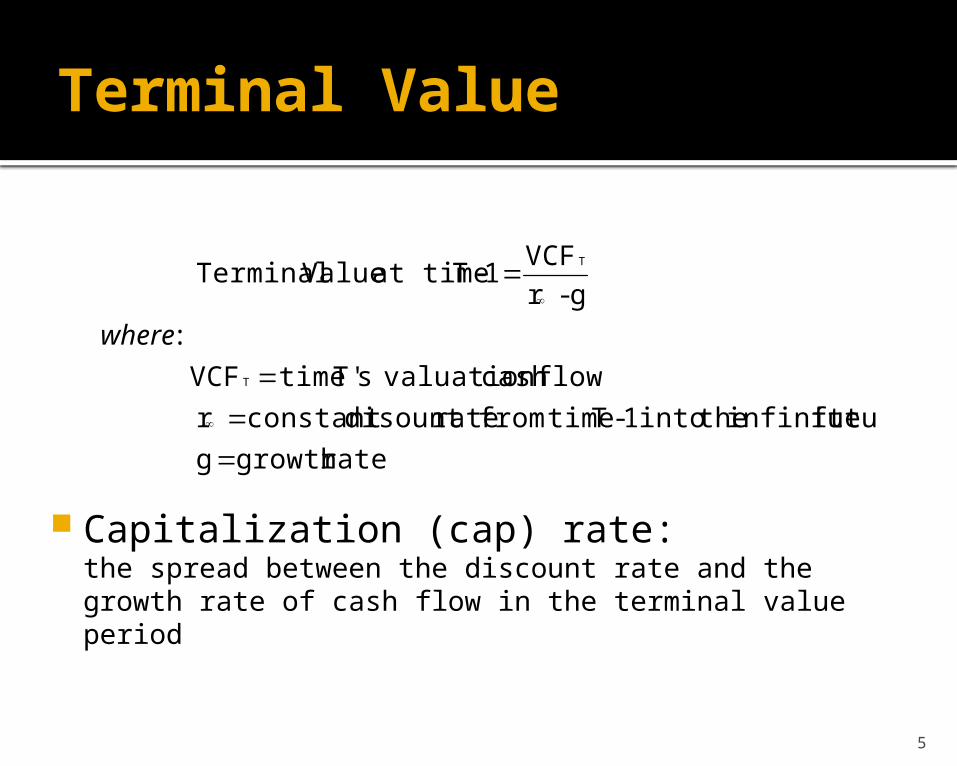
rategrowth g
future infinite theinto 1-T timefrom ratedisount constant r
flowcash valuationsT' timeVCF
:
g- r
VCF1-T at time Value Terminal
T
T
where
5
Capitalization (cap) rate:the spread between the discount rate and the growth rate of cash flow in the terminal value period
Discounted Cash Flow
6
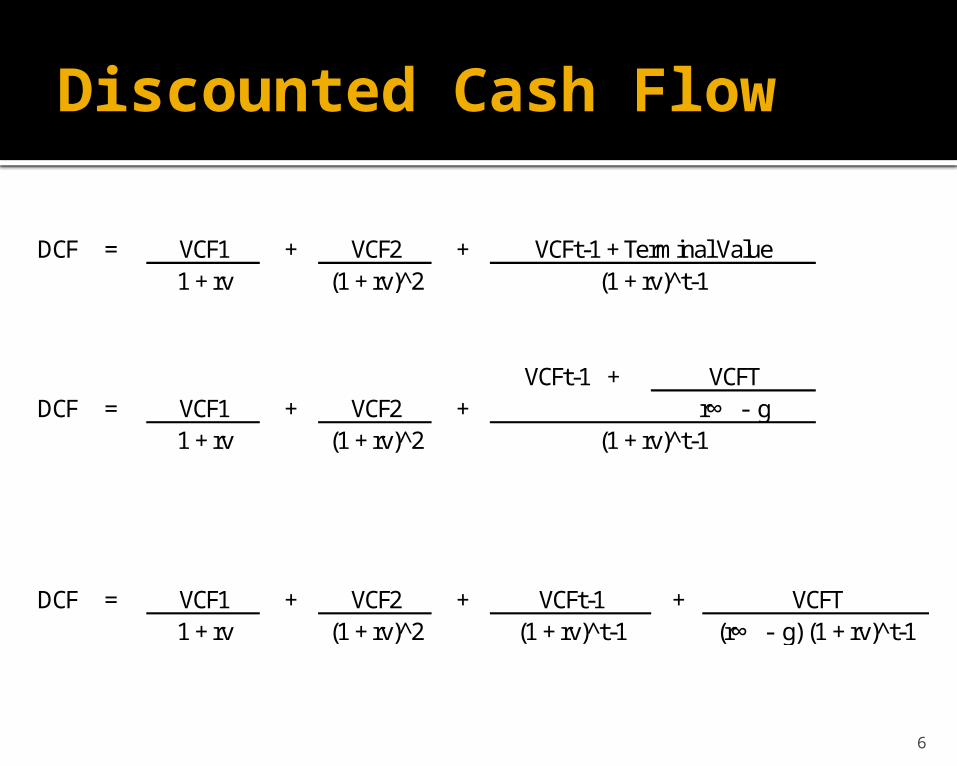
DCF = VCF1 + VCF2 +1 + rv (1 + rv)^2
VCFt-1 +DCF = VCF1 + VCF2 +
1 + rv (1 + rv)^2
DCF = VCF1 + VCF2 + VCFt-1 +1 + rv (1 + rv)^2 (1 + rv)^t-1 (r∞ - g) (1 + rv)^t-1
VCFt-1 + Terminal Value(1 + rv)^t-1
VCFTr∞ - g
(1 + rv)^t-1
VCFT
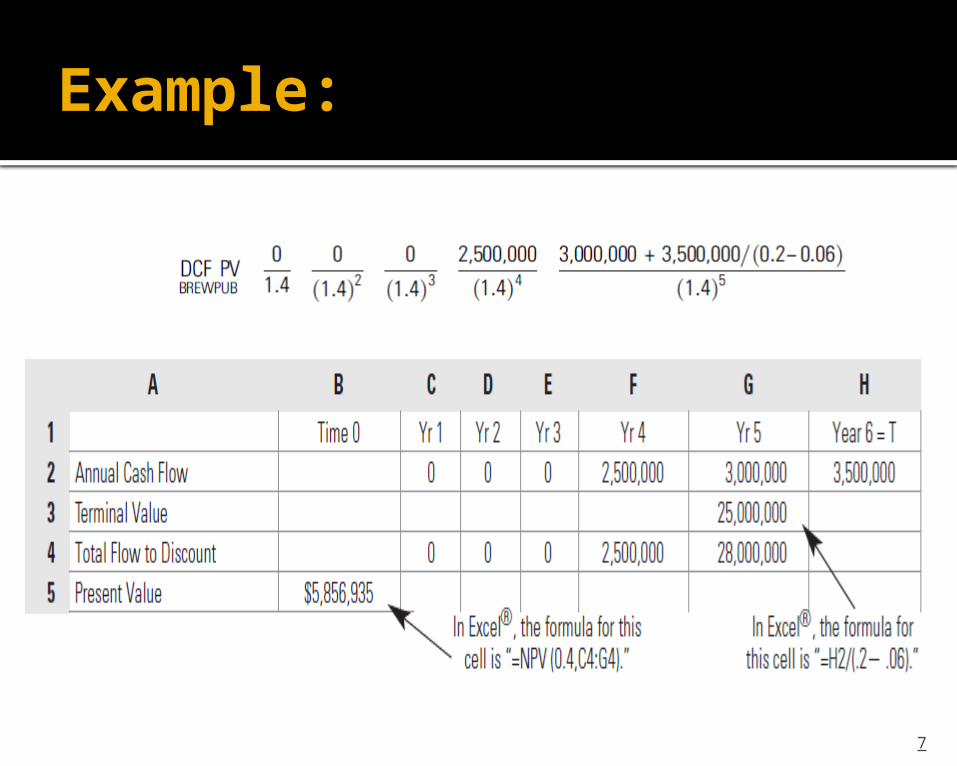
Example:
7
Useful Terms
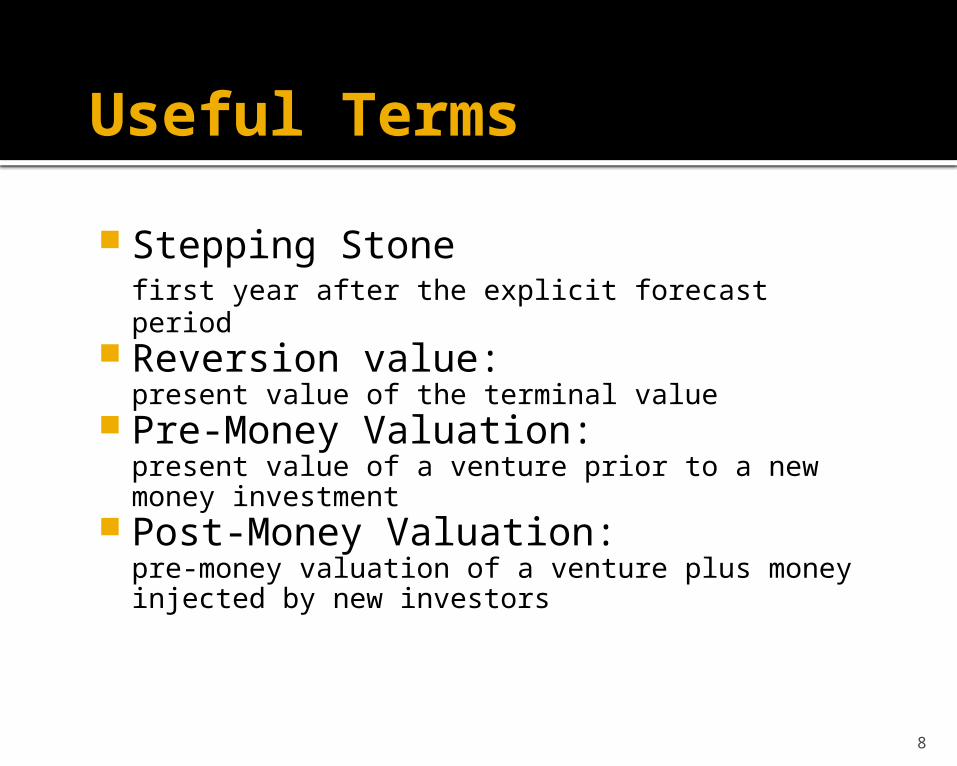
Stepping Stonefirst year after the explicit forecast period
Reversion value:present value of the terminal value
Pre-Money Valuation:present value of a venture prior to a new money investment
Post-Money Valuation:pre-money valuation of a venture plus money injected by new investors
8
More Useful Terms
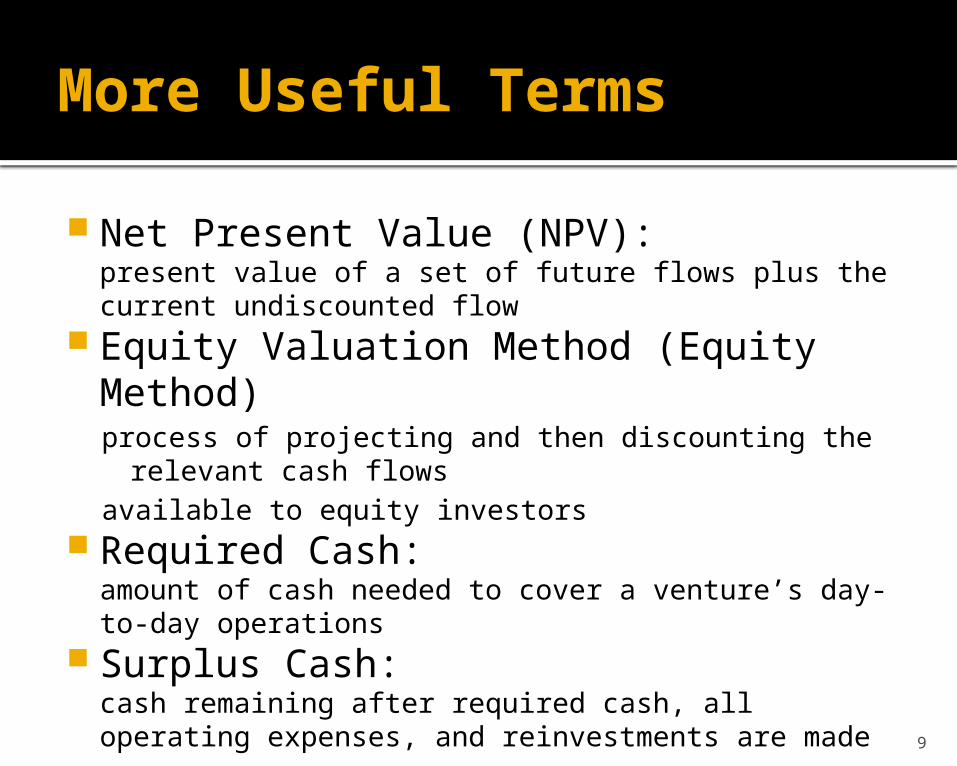
Net Present Value (NPV):present value of a set of future flows plus the current undiscounted flow
Equity Valuation Method (Equity Method)process of projecting and then discounting the relevant
cash flowsavailable to equity investors
Required Cash:amount of cash needed to cover a venture’s day-to-day operations
Surplus Cash:cash remaining after required cash, all operating expenses, and reinvestments are made
9
Required vs. Surplus Cash
10
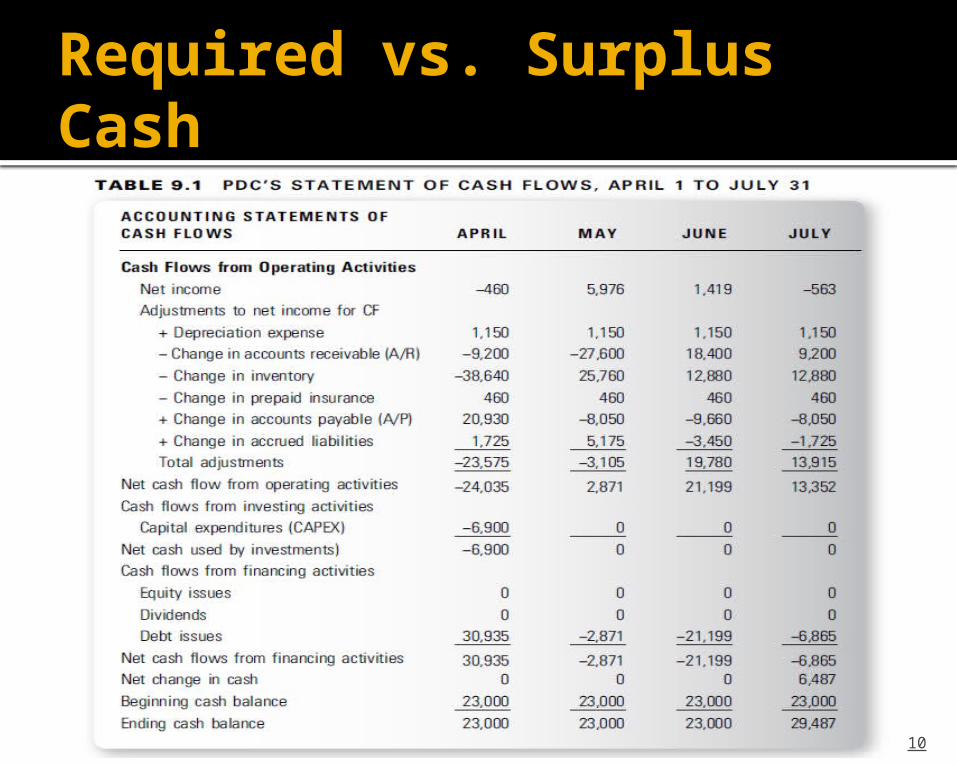
Required vs. Surplus Cash
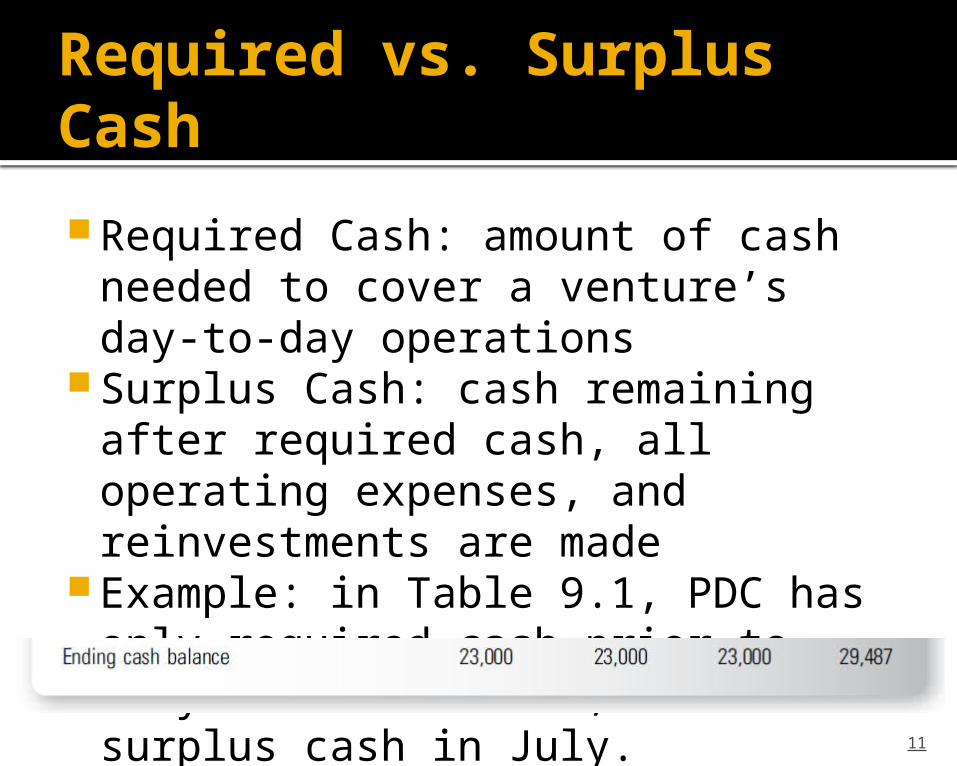
Required Cash: amount of cash needed to cover a venture’s day-to-day operations
Surplus Cash: cash remaining after required cash, all operating expenses, and reinvestments are made
Example: in Table 9.1, PDC has only required cash prior to July and then has 6,487 of surplus cash in July.
11
Developing Projected Financial Statement For DCF
12
Assume that the projected 4 month financial statement in Chapter 6 is right on track
A potential venture investor is considering buying some of the venture’s equity
Year T = 5, starting 8/1/Y0 and ending 7/31/Y5.
Developing Projected Financial Statement For DCF
13
Steps Formulate top line sales forecast Forecast relationship between individual
expense or cost accounts and sales▪ When venture is new, it has a little operating
history, past relationship may not reflect expected future relationship
▪ the entrepreneur can supplement subjective judgments by considering related competitor or industry financial relationship
▪ the entrepreneur team can use informed guesstimates or expected financial relationship
Developing Projected Financial Statement For DCF
14
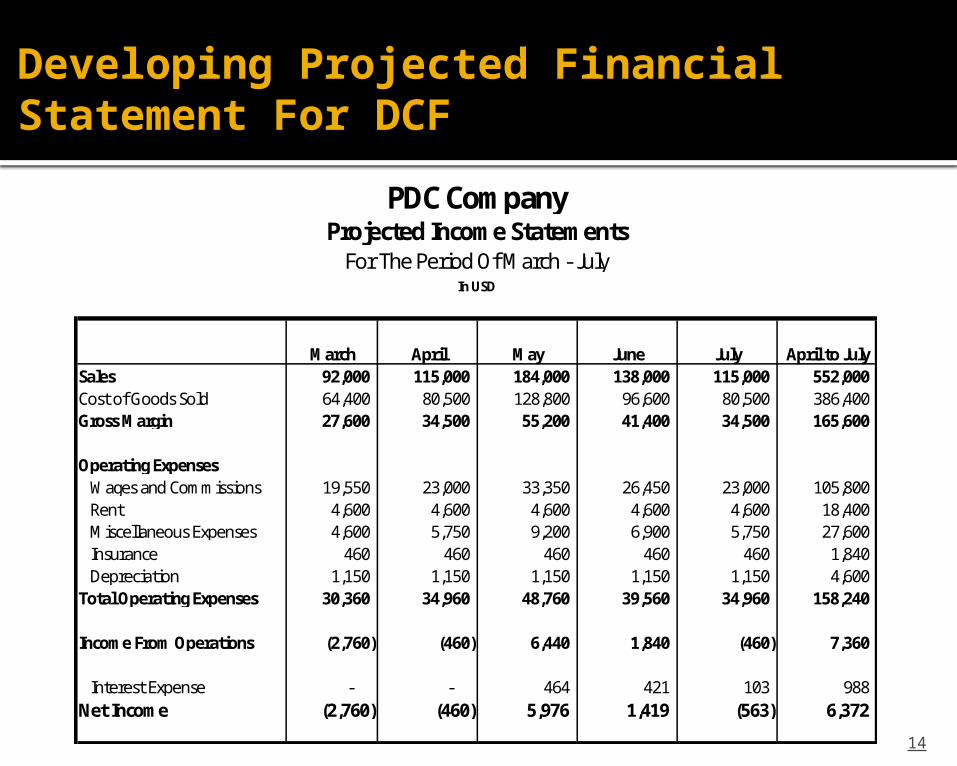
March April May June July April to JulySales 92,000 115,000 184,000 138,000 115,000 552,000 Cost of Goods Sold 64,400 80,500 128,800 96,600 80,500 386,400 Gross Margin 27,600 34,500 55,200 41,400 34,500 165,600
Operating Expenses Wages and Commissions 19,550 23,000 33,350 26,450 23,000 105,800 Rent 4,600 4,600 4,600 4,600 4,600 18,400 Miscellaneous Expenses 4,600 5,750 9,200 6,900 5,750 27,600 Insurance 460 460 460 460 460 1,840 Depreciation 1,150 1,150 1,150 1,150 1,150 4,600 Total Operating Expenses 30,360 34,960 48,760 39,560 34,960 158,240
Income From Operations (2,760) (460) 6,440 1,840 (460) 7,360
Interest Expense - - 464 421 103 988 Net Income (2,760) (460) 5,976 1,419 (563) 6,372
PDC CompanyProjected Income Statements
For The Period Of March - JulyIn USD
Developing Projected Financial Statement For DCF
15
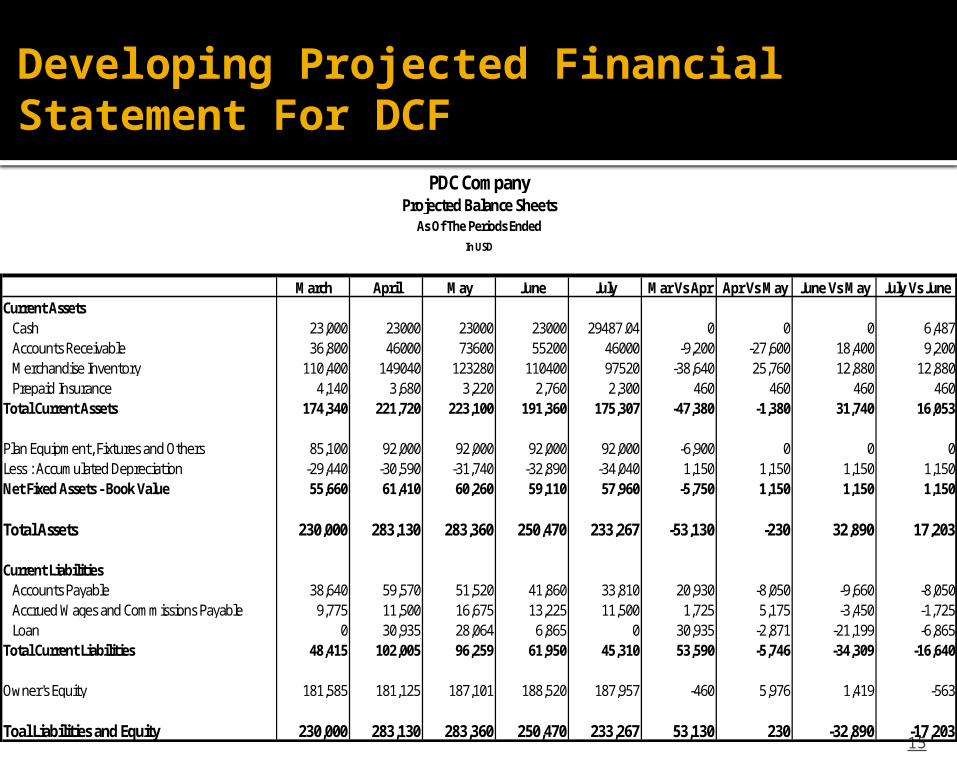
March April May June July Mar Vs Apr Apr Vs May June Vs May July Vs JuneCurrent Assets Cash 23,000 23000 23000 23000 29487.04 0 0 0 6,487 Accounts Receivable 36,800 46000 73600 55200 46000 -9,200 -27,600 18,400 9,200 Merchandise Inventory 110,400 149040 123280 110400 97520 -38,640 25,760 12,880 12,880 Prepaid Insurance 4,140 3,680 3,220 2,760 2,300 460 460 460 460Total Current Assets 174,340 221,720 223,100 191,360 175,307 -47,380 -1,380 31,740 16,053
Plan Equipment, Fixtures and Others 85,100 92,000 92,000 92,000 92,000 -6,900 0 0 0Less : Accumulated Depreciation -29,440 -30,590 -31,740 -32,890 -34,040 1,150 1,150 1,150 1,150Net Fixed Assets - Book Value 55,660 61,410 60,260 59,110 57,960 -5,750 1,150 1,150 1,150
Total Assets 230,000 283,130 283,360 250,470 233,267 -53,130 -230 32,890 17,203
Current Liabilities Accounts Payable 38,640 59,570 51,520 41,860 33,810 20,930 -8,050 -9,660 -8,050 Accrued Wages and Commissions Payable 9,775 11,500 16,675 13,225 11,500 1,725 5,175 -3,450 -1,725 Loan 0 30,935 28,064 6,865 0 30,935 -2,871 -21,199 -6,865Total Current Liabilities 48,415 102,005 96,259 61,950 45,310 53,590 -5,746 -34,309 -16,640
Owner's Equity 181,585 181,125 187,101 188,520 187,957 -460 5,976 1,419 -563
Toal Liabilities and Equity 230,000 283,130 283,360 250,470 233,267 53,130 230 -32,890 -17,203
PDC CompanyProjected Balance Sheets
As Of The Periods EndedIn USD
Developing Projected Financial Statement For DCF - Assumptions
16
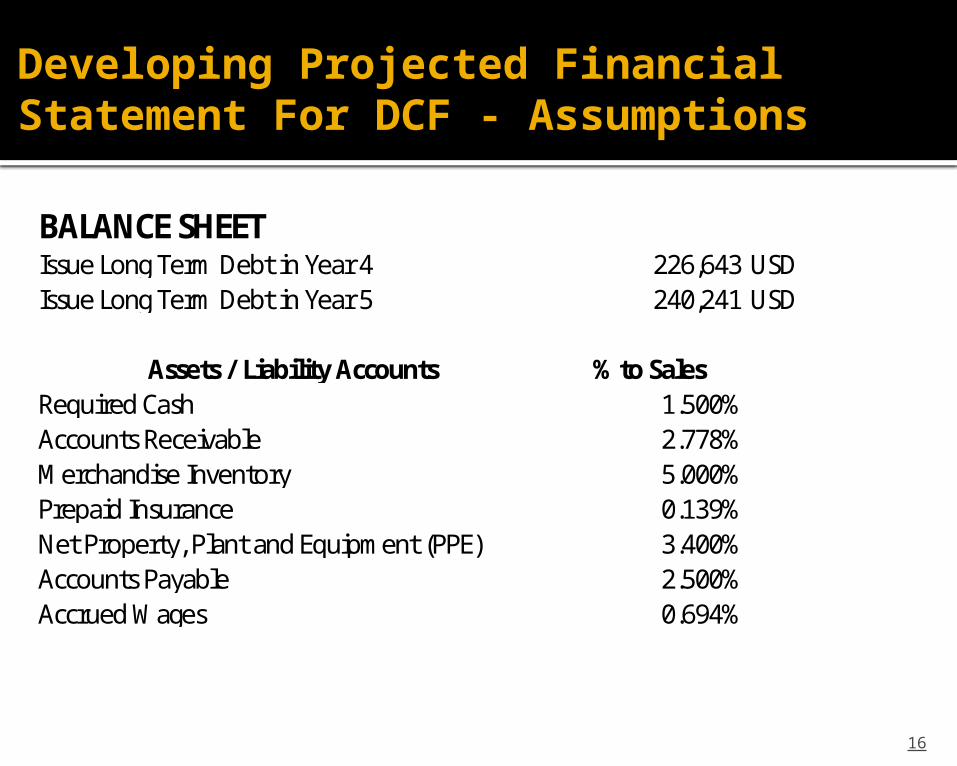
BALANCE SHEETIssue Long Term Debt in Year 4 226,643 USDIssue Long Term Debt in Year 5 240,241 USD
Assets / Liability Accounts % to SalesRequired Cash 1.500%Accounts Receivable 2.778%Merchandise Inventory 5.000%Prepaid Insurance 0.139%Net Property, Plant and Equipment (PPE) 3.400%Accounts Payable 2.500%Accrued Wages 0.694%
Developing Projected Financial Statement For DCF - Assumptions
17
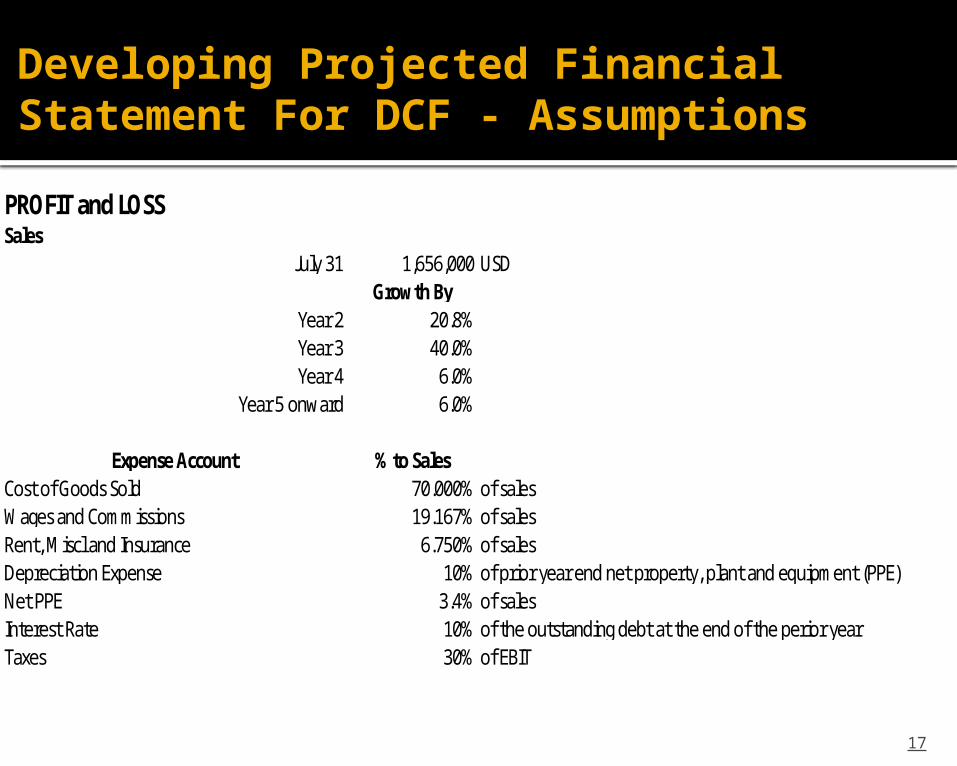
PROFIT and LOSSSales
July 31 1,656,000 USDGrowth By
Year 2 20.8%Year 3 40.0%Year 4 6.0%
Year 5 onward 6.0%
Expense Account % to SalesCost of Goods Sold 70.000% of salesWages and Commissions 19.167% of salesRent, Miscl and Insurance 6.750% of salesDepreciation Expense 10% of prior year end net property, plant and equipment (PPE)Net PPE 3.4% of salesInterest Rate 10% of the outstanding debt at the end of the perior yearTaxes 30% of EBIT
Developing Projected Financial Statement For DCF
18
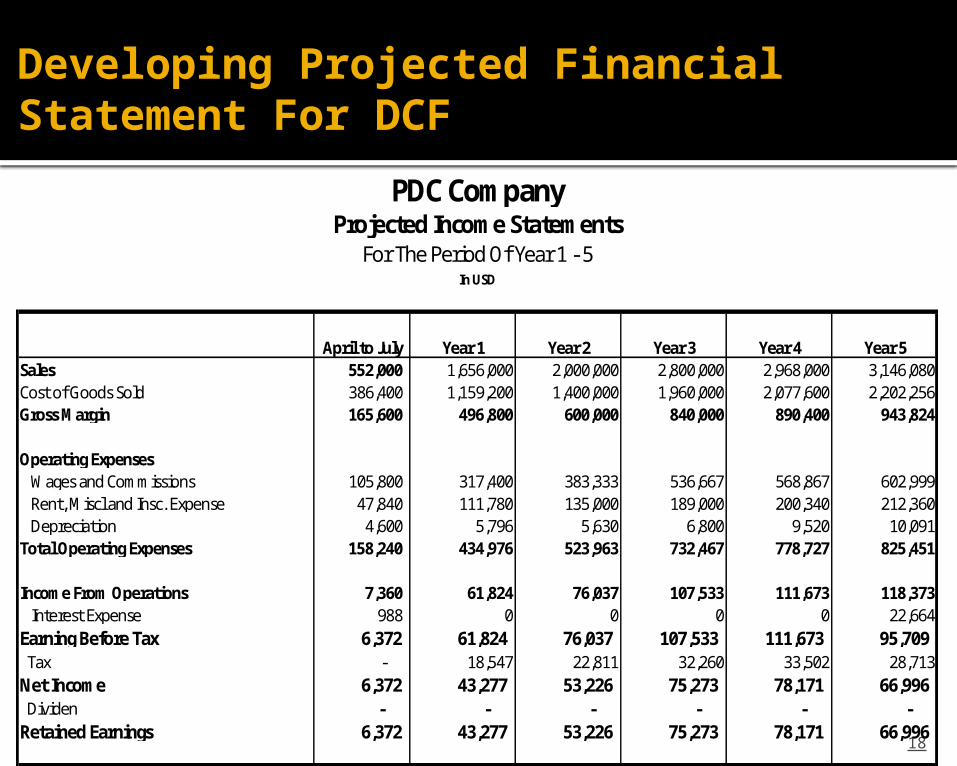
April to July Year 1 Year 2 Year 3 Year 4 Year 5Sales 552,000 1,656,000 2,000,000 2,800,000 2,968,000 3,146,080Cost of Goods Sold 386,400 1,159,200 1,400,000 1,960,000 2,077,600 2,202,256Gross Margin 165,600 496,800 600,000 840,000 890,400 943,824
Operating Expenses Wages and Commissions 105,800 317,400 383,333 536,667 568,867 602,999 Rent, Miscl and Insc. Expense 47,840 111,780 135,000 189,000 200,340 212,360 Depreciation 4,600 5,796 5,630 6,800 9,520 10,091Total Operating Expenses 158,240 434,976 523,963 732,467 778,727 825,451
Income From Operations 7,360 61,824 76,037 107,533 111,673 118,373 Interest Expense 988 0 0 0 0 22,664Earning Before Tax 6,372 61,824 76,037 107,533 111,673 95,709 Tax - 18,547 22,811 32,260 33,502 28,713Net Income 6,372 43,277 53,226 75,273 78,171 66,996 Dividen - - - - - - Retained Earnings 6,372 43,277 53,226 75,273 78,171 66,996
PDC CompanyProjected Income Statements
For The Period Of Year 1 - 5In USD
Developing Projected Financial Statement For DCF
19
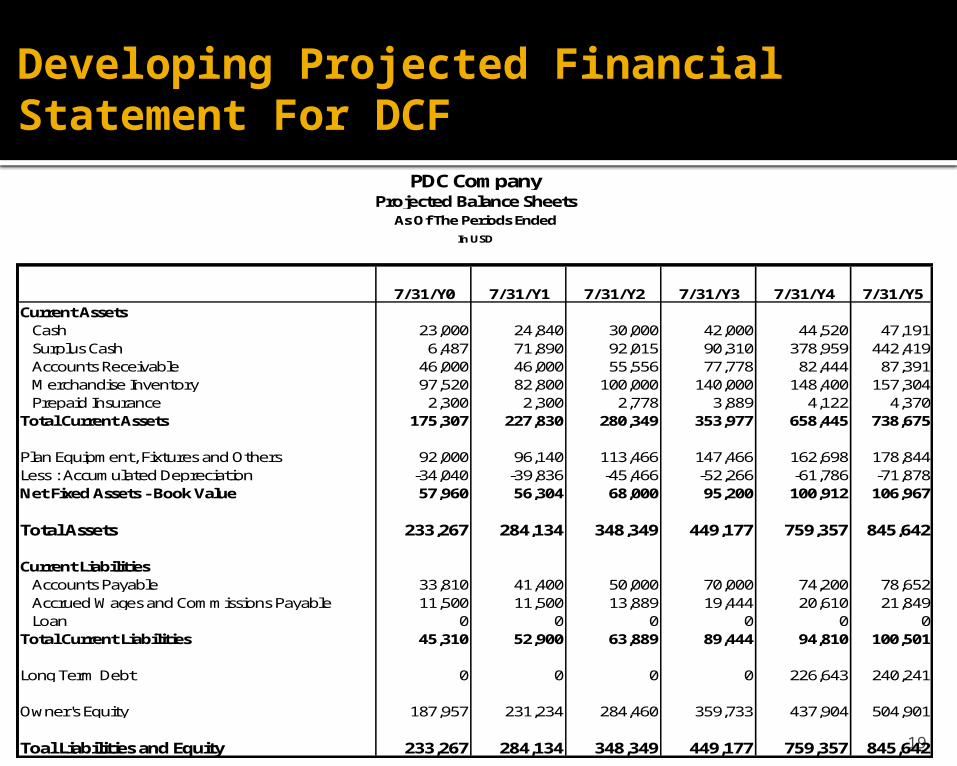
Current Assets Cash 23,000 24,840 30,000 42,000 44,520 47,191 Surplus Cash 6,487 71,890 92,015 90,310 378,959 442,419 Accounts Receivable 46,000 46,000 55,556 77,778 82,444 87,391 Merchandise Inventory 97,520 82,800 100,000 140,000 148,400 157,304 Prepaid Insurance 2,300 2,300 2,778 3,889 4,122 4,370Total Current Assets 175,307 227,830 280,349 353,977 658,445 738,675
Plan Equipment, Fixtures and Others 92,000 96,140 113,466 147,466 162,698 178,844Less : Accumulated Depreciation -34,040 -39,836 -45,466 -52,266 -61,786 -71,878Net Fixed Assets - Book Value 57,960 56,304 68,000 95,200 100,912 106,967
Total Assets 233,267 284,134 348,349 449,177 759,357 845,642
Current Liabilities Accounts Payable 33,810 41,400 50,000 70,000 74,200 78,652 Accrued Wages and Commissions Payable 11,500 11,500 13,889 19,444 20,610 21,849 Loan 0 0 0 0 0 0Total Current Liabilities 45,310 52,900 63,889 89,444 94,810 100,501
Long Term Debt 0 0 0 0 226,643 240,241
Owner's Equity 187,957 231,234 284,460 359,733 437,904 504,901
Toal Liabilities and Equity 233,267 284,134 348,349 449,177 759,357 845,642
7/31/Y5
PDC CompanyProjected Balance Sheets
As Of The Periods EndedIn USD
7/31/Y0 7/31/Y1 7/31/Y2 7/31/Y3 7/31/Y4
Developing Projected Financial Statement For DCF
20
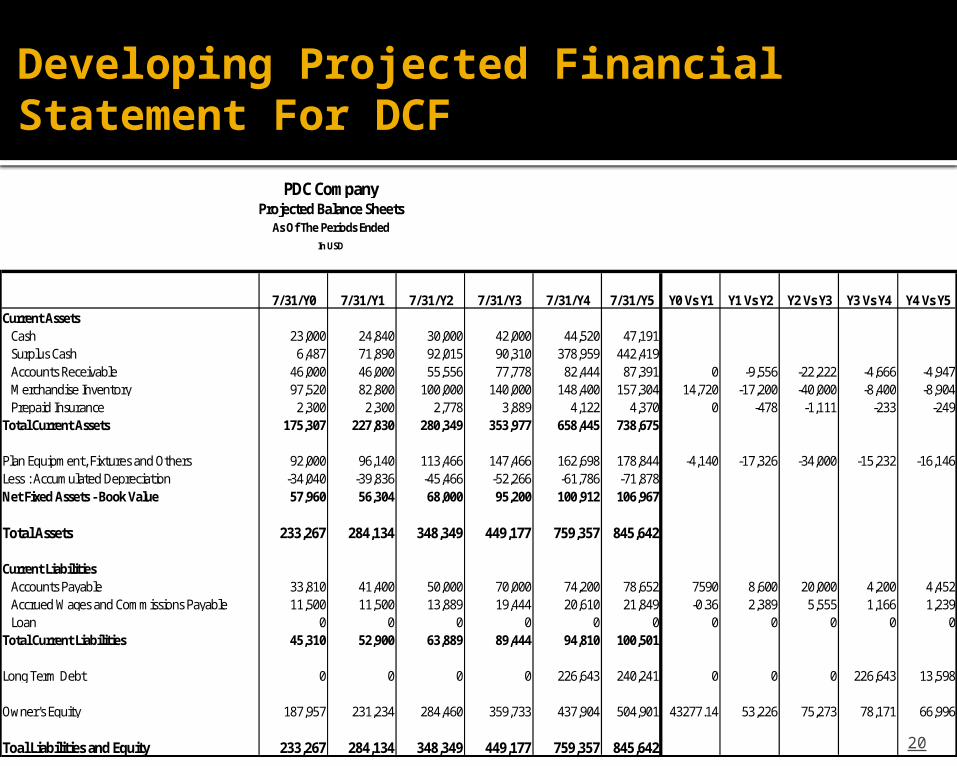
Current Assets Cash 23,000 24,840 30,000 42,000 44,520 47,191 Surplus Cash 6,487 71,890 92,015 90,310 378,959 442,419 Accounts Receivable 46,000 46,000 55,556 77,778 82,444 87,391 0 -9,556 -22,222 -4,666 -4,947 Merchandise Inventory 97,520 82,800 100,000 140,000 148,400 157,304 14,720 -17,200 -40,000 -8,400 -8,904 Prepaid Insurance 2,300 2,300 2,778 3,889 4,122 4,370 0 -478 -1,111 -233 -249Total Current Assets 175,307 227,830 280,349 353,977 658,445 738,675
Plan Equipment, Fixtures and Others 92,000 96,140 113,466 147,466 162,698 178,844 -4,140 -17,326 -34,000 -15,232 -16,146Less : Accumulated Depreciation -34,040 -39,836 -45,466 -52,266 -61,786 -71,878Net Fixed Assets - Book Value 57,960 56,304 68,000 95,200 100,912 106,967
Total Assets 233,267 284,134 348,349 449,177 759,357 845,642
Current Liabilities Accounts Payable 33,810 41,400 50,000 70,000 74,200 78,652 7590 8,600 20,000 4,200 4,452 Accrued Wages and Commissions Payable 11,500 11,500 13,889 19,444 20,610 21,849 -0.36 2,389 5,555 1,166 1,239 Loan 0 0 0 0 0 0 0 0 0 0 0Total Current Liabilities 45,310 52,900 63,889 89,444 94,810 100,501
Long Term Debt 0 0 0 0 226,643 240,241 0 0 0 226,643 13,598
Owner's Equity 187,957 231,234 284,460 359,733 437,904 504,901 43277.14 53,226 75,273 78,171 66,996
Toal Liabilities and Equity 233,267 284,134 348,349 449,177 759,357 845,642
7/31/Y5 Y0 Vs Y1 Y1 Vs Y2 Y2 Vs Y3 Y3 Vs Y4 Y4 Vs Y5
PDC CompanyProjected Balance Sheets
As Of The Periods EndedIn USD
7/31/Y0 7/31/Y1 7/31/Y2 7/31/Y3 7/31/Y4
Developing Projected Financial Statement For DCF
21
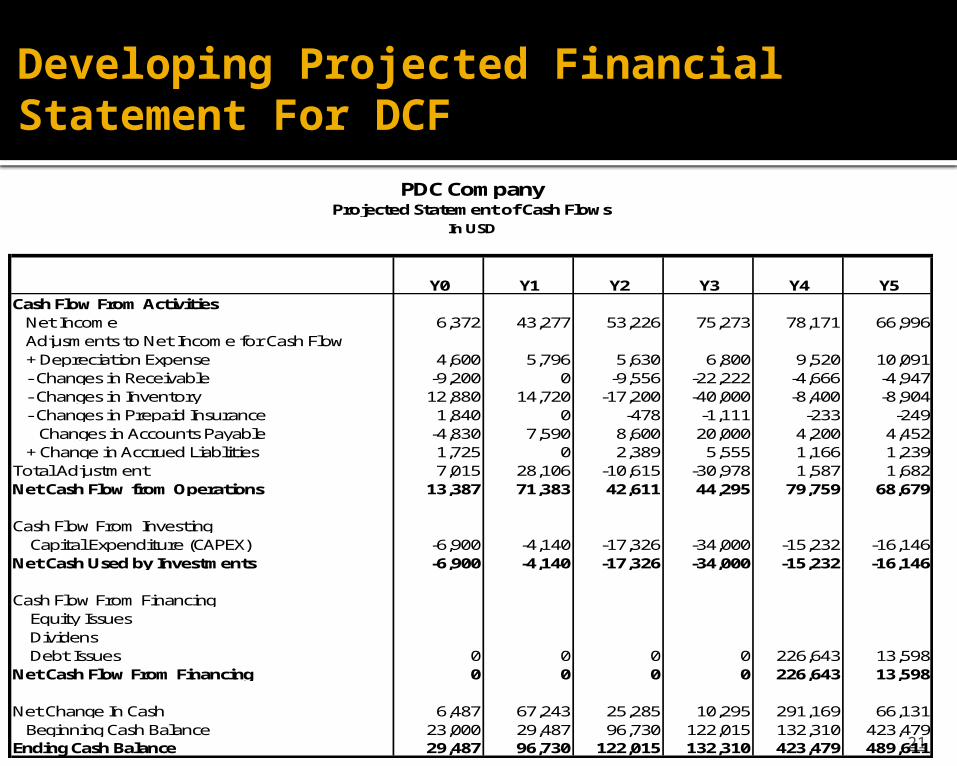
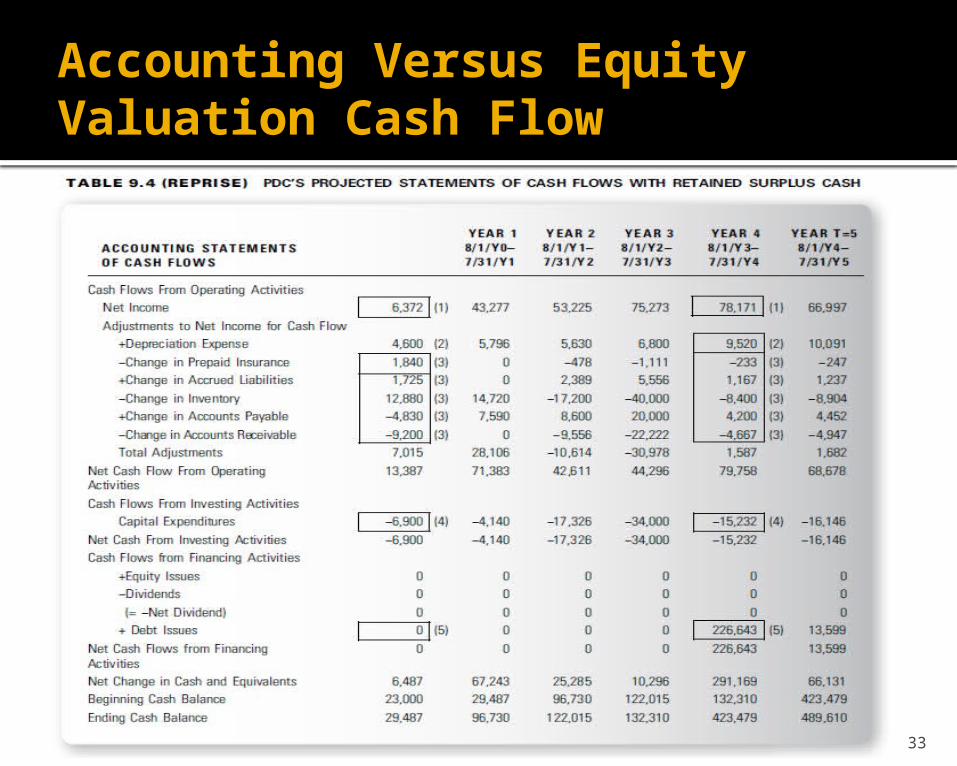
Y0 Y1 Y2 Y3 Y4 Y5Cash Flow From Activities Net Income 6,372 43,277 53,226 75,273 78,171 66,996 Adjusments to Net Income for Cash Flow + Depreciation Expense 4,600 5,796 5,630 6,800 9,520 10,091 - Changes in Receivable -9,200 0 -9,556 -22,222 -4,666 -4,947 - Changes in Inventory 12,880 14,720 -17,200 -40,000 -8,400 -8,904 - Changes in Prepaid Insurance 1,840 0 -478 -1,111 -233 -249 Changes in Accounts Payable -4,830 7,590 8,600 20,000 4,200 4,452 + Change in Accrued Liablities 1,725 0 2,389 5,555 1,166 1,239Total Adjustment 7,015 28,106 -10,615 -30,978 1,587 1,682Net Cash Flow from Operations 13,387 71,383 42,611 44,295 79,759 68,679
Cash Flow From Investing Capital Expenditure (CAPEX) -6,900 -4,140 -17,326 -34,000 -15,232 -16,146Net Cash Used by Investments -6,900 -4,140 -17,326 -34,000 -15,232 -16,146
Cash Flow From Financing Equity Issues Dividens Debt Issues 0 0 0 0 226,643 13,598Net Cash Flow From Financing 0 0 0 0 226,643 13,598
Net Change In Cash 6,487 67,243 25,285 10,295 291,169 66,131 Beginning Cash Balance 23,000 29,487 96,730 122,015 132,310 423,479Ending Cash Balance 29,487 96,730 122,015 132,310 423,479 489,611
PDC CompanyProjected Statement of Cash Flows
In USD
Equity Valuation: A Pseudo Dividend Approach
Pseudo dividend is excess cash not needed for investment in the assets or operations to carry out the business plan
Project PDC out five years assuming that a “surplus cash” account “plugs” the balance sheet (catching all remaining cash)
Calculate pseudo dividends by making sure that required investments in working capital do not include surplus cash
Discount the resulting pseudo dividends to get a value for the venture’s equity ownership
22

Equity Valuation: A Pseudo Dividend Approach
23
Two ways to conduct an equity method valuation: By altering the projected financial
statements to pay out the maximum dividend feasible each period and incorporating the recovery of those dividends when capital is needed for the execution of business plan
Using a formula approach to directly calculate the pseudo dividends
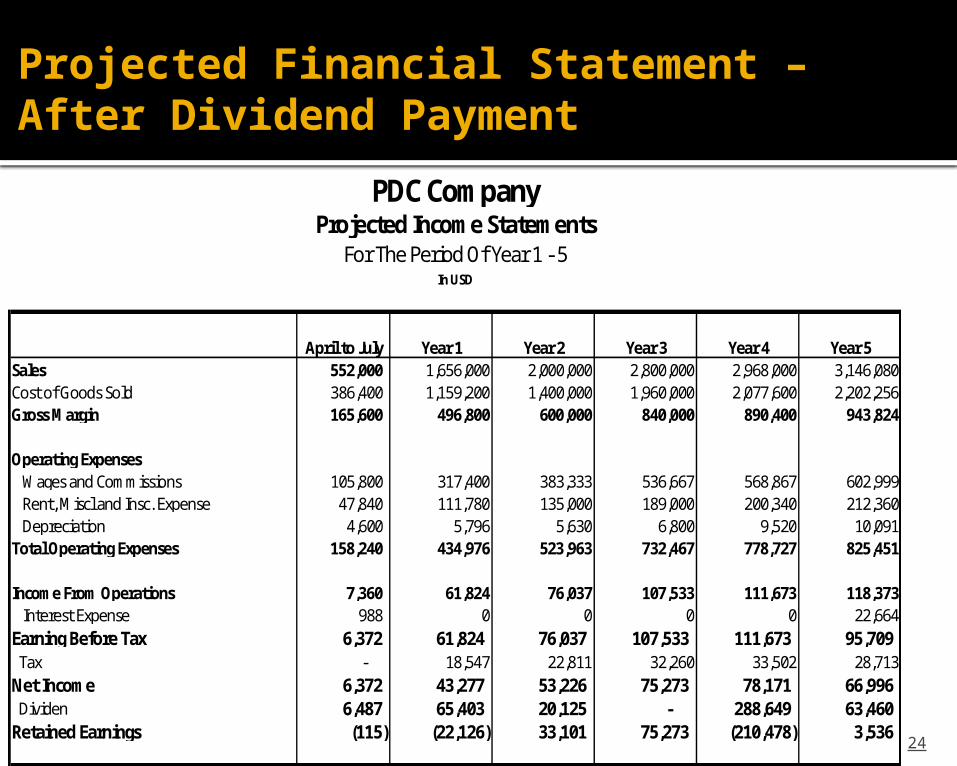
Projected Financial Statement – After Dividend Payment
24
April to July Year 1 Year 2 Year 3 Year 4 Year 5Sales 552,000 1,656,000 2,000,000 2,800,000 2,968,000 3,146,080Cost of Goods Sold 386,400 1,159,200 1,400,000 1,960,000 2,077,600 2,202,256Gross Margin 165,600 496,800 600,000 840,000 890,400 943,824
Operating Expenses Wages and Commissions 105,800 317,400 383,333 536,667 568,867 602,999 Rent, Miscl and Insc. Expense 47,840 111,780 135,000 189,000 200,340 212,360 Depreciation 4,600 5,796 5,630 6,800 9,520 10,091Total Operating Expenses 158,240 434,976 523,963 732,467 778,727 825,451
Income From Operations 7,360 61,824 76,037 107,533 111,673 118,373 Interest Expense 988 0 0 0 0 22,664Earning Before Tax 6,372 61,824 76,037 107,533 111,673 95,709 Tax - 18,547 22,811 32,260 33,502 28,713Net Income 6,372 43,277 53,226 75,273 78,171 66,996 Dividen 6,487 65,403 20,125 - 288,649 63,460 Retained Earnings (115) (22,126) 33,101 75,273 (210,478) 3,536
PDC CompanyProjected Income Statements
For The Period Of Year 1 - 5In USD
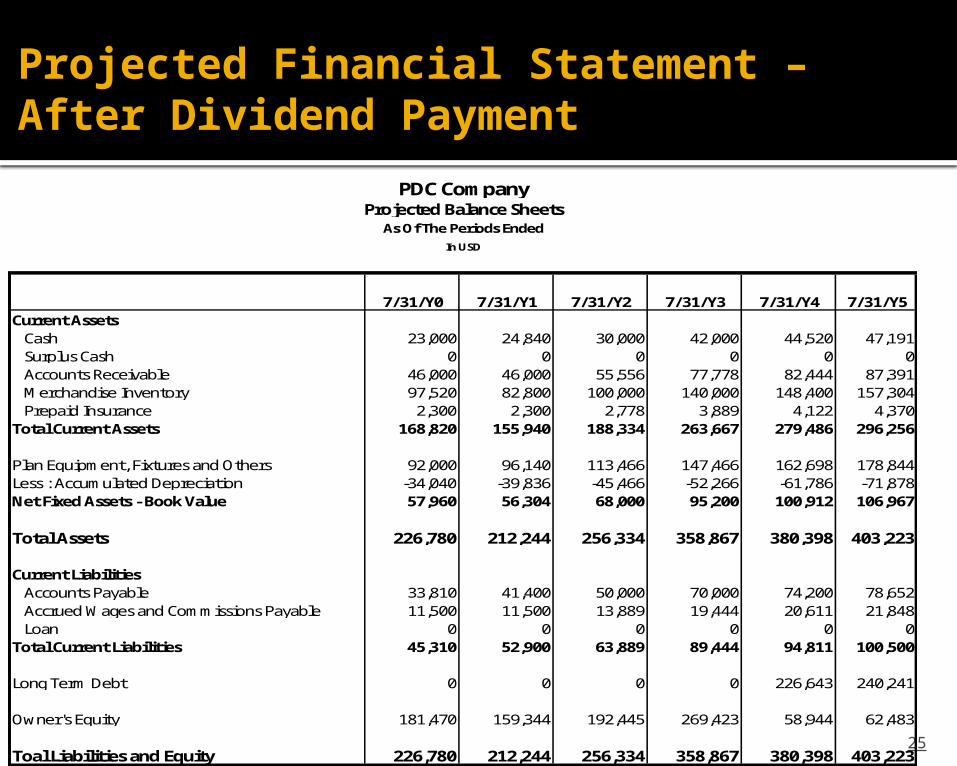
Projected Financial Statement – After Dividend Payment
25
Current Assets Cash 23,000 24,840 30,000 42,000 44,520 47,191 Surplus Cash 0 0 0 0 0 0 Accounts Receivable 46,000 46,000 55,556 77,778 82,444 87,391 Merchandise Inventory 97,520 82,800 100,000 140,000 148,400 157,304 Prepaid Insurance 2,300 2,300 2,778 3,889 4,122 4,370Total Current Assets 168,820 155,940 188,334 263,667 279,486 296,256
Plan Equipment, Fixtures and Others 92,000 96,140 113,466 147,466 162,698 178,844Less : Accumulated Depreciation -34,040 -39,836 -45,466 -52,266 -61,786 -71,878Net Fixed Assets - Book Value 57,960 56,304 68,000 95,200 100,912 106,967
Total Assets 226,780 212,244 256,334 358,867 380,398 403,223
Current Liabilities Accounts Payable 33,810 41,400 50,000 70,000 74,200 78,652 Accrued Wages and Commissions Payable 11,500 11,500 13,889 19,444 20,611 21,848 Loan 0 0 0 0 0 0Total Current Liabilities 45,310 52,900 63,889 89,444 94,811 100,500
Long Term Debt 0 0 0 0 226,643 240,241
Owner's Equity 181,470 159,344 192,445 269,423 58,944 62,483
Toal Liabilities and Equity 226,780 212,244 256,334 358,867 380,398 403,223
7/31/Y5
PDC CompanyProjected Balance Sheets
As Of The Periods EndedIn USD
7/31/Y0 7/31/Y1 7/31/Y2 7/31/Y3 7/31/Y4
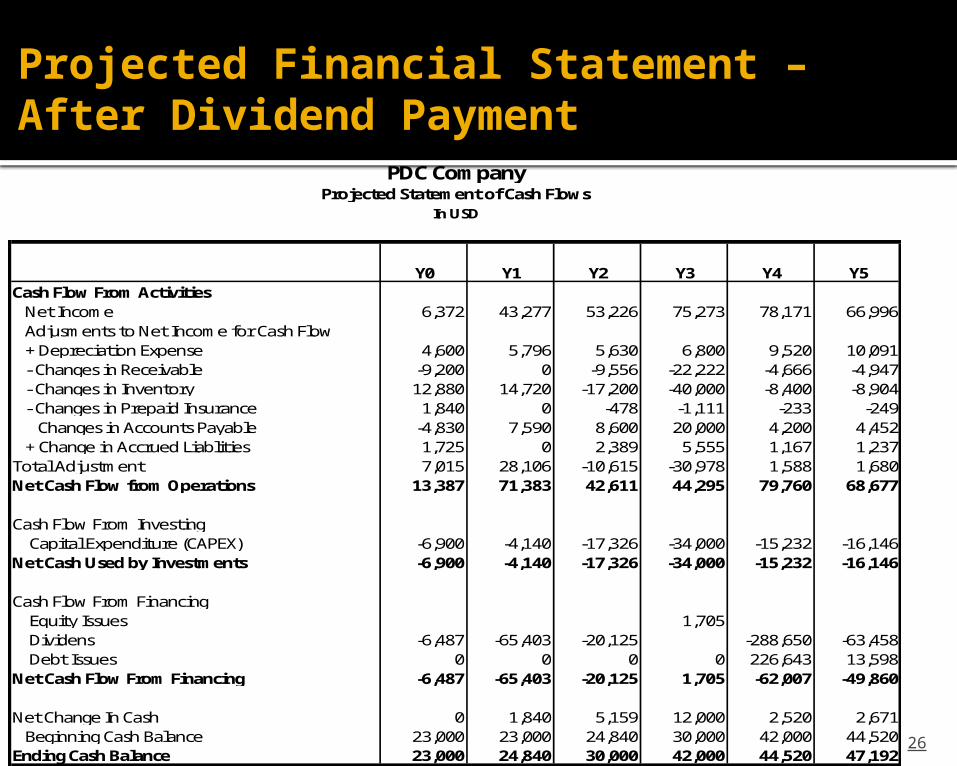
Projected Financial Statement – After Dividend Payment
26
Y0 Y1 Y2 Y3 Y4 Y5Cash Flow From Activities Net Income 6,372 43,277 53,226 75,273 78,171 66,996 Adjusments to Net Income for Cash Flow + Depreciation Expense 4,600 5,796 5,630 6,800 9,520 10,091 - Changes in Receivable -9,200 0 -9,556 -22,222 -4,666 -4,947 - Changes in Inventory 12,880 14,720 -17,200 -40,000 -8,400 -8,904 - Changes in Prepaid Insurance 1,840 0 -478 -1,111 -233 -249 Changes in Accounts Payable -4,830 7,590 8,600 20,000 4,200 4,452 + Change in Accrued Liablities 1,725 0 2,389 5,555 1,167 1,237Total Adjustment 7,015 28,106 -10,615 -30,978 1,588 1,680Net Cash Flow from Operations 13,387 71,383 42,611 44,295 79,760 68,677
Cash Flow From Investing Capital Expenditure (CAPEX) -6,900 -4,140 -17,326 -34,000 -15,232 -16,146Net Cash Used by Investments -6,900 -4,140 -17,326 -34,000 -15,232 -16,146
Cash Flow From Financing Equity Issues 1,705 Dividens -6,487 -65,403 -20,125 -288,650 -63,458 Debt Issues 0 0 0 0 226,643 13,598Net Cash Flow From Financing -6,487 -65,403 -20,125 1,705 -62,007 -49,860
Net Change In Cash 0 1,840 5,159 12,000 2,520 2,671 Beginning Cash Balance 23,000 23,000 24,840 30,000 42,000 44,520Ending Cash Balance 23,000 24,840 30,000 42,000 44,520 47,192
PDC CompanyProjected Statement of Cash Flows
In USD
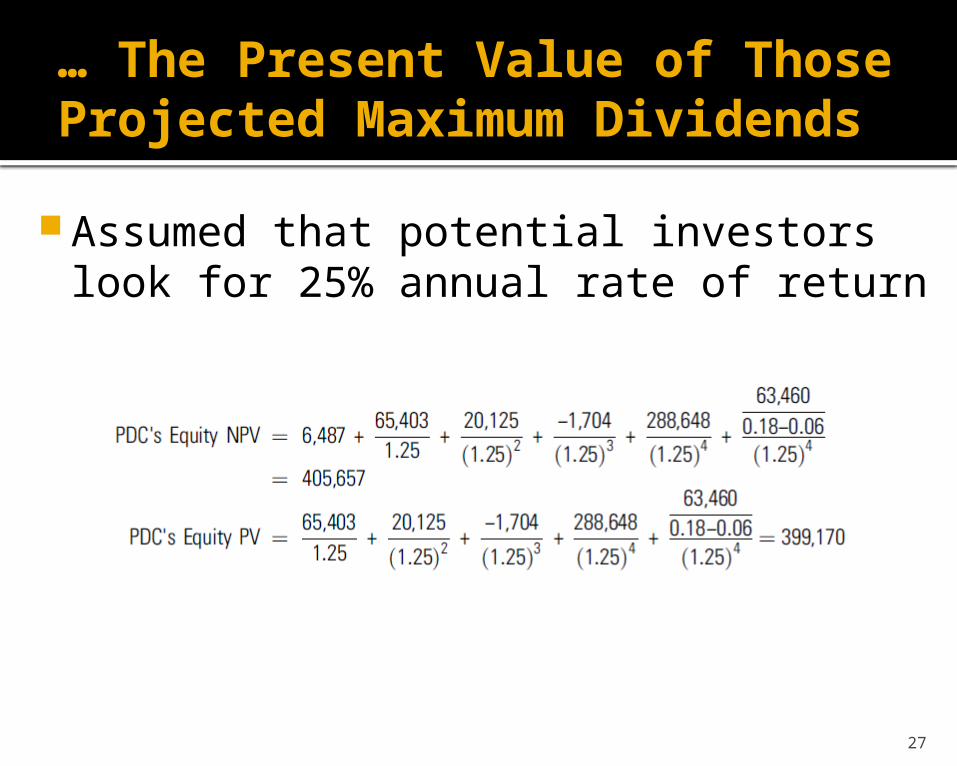
… The Present Value of Those Projected Maximum Dividends
27
Assumed that potential investors look for 25% annual rate of return
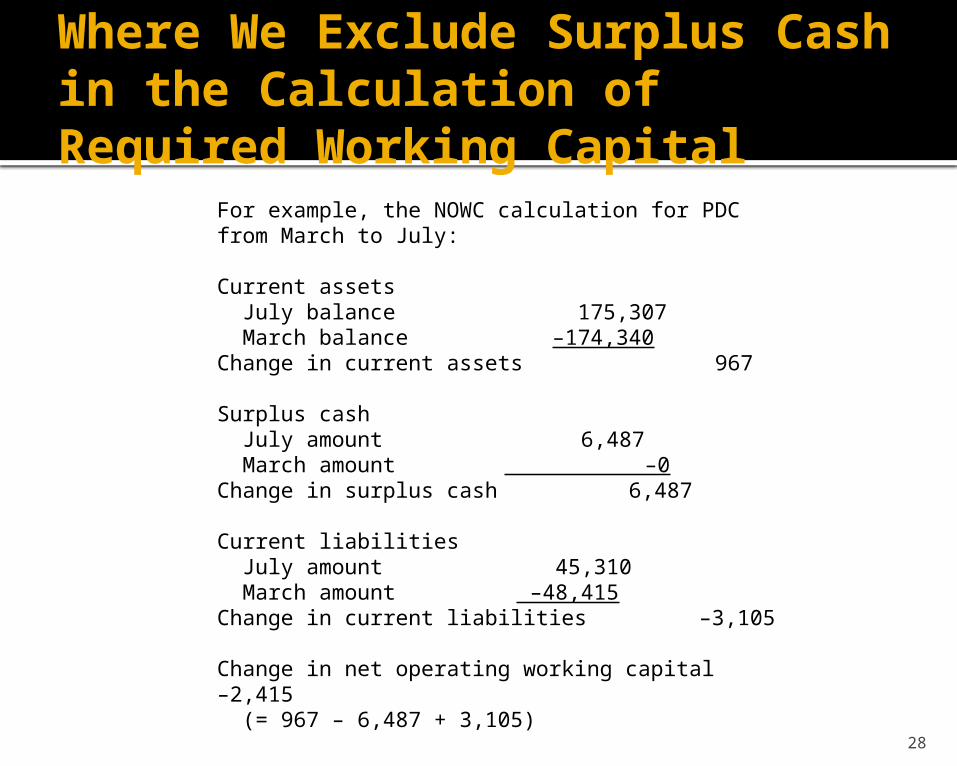
Where We Exclude Surplus Cash in the Calculation of Required Working Capital
28
For example, the NOWC calculation for PDC from March to July:
Current assets July balance 175,307 March balance –174,340Change in current assets 967
Surplus cash July amount 6,487 March amount –0Change in surplus cash 6,487
Current liabilities July amount 45,310 March amount –48,415Change in current liabilities –3,105
Change in net operating working capital –2,415 (= 967 – 6,487 + 3,105)
(= 967 – 6,487 + 3,105)
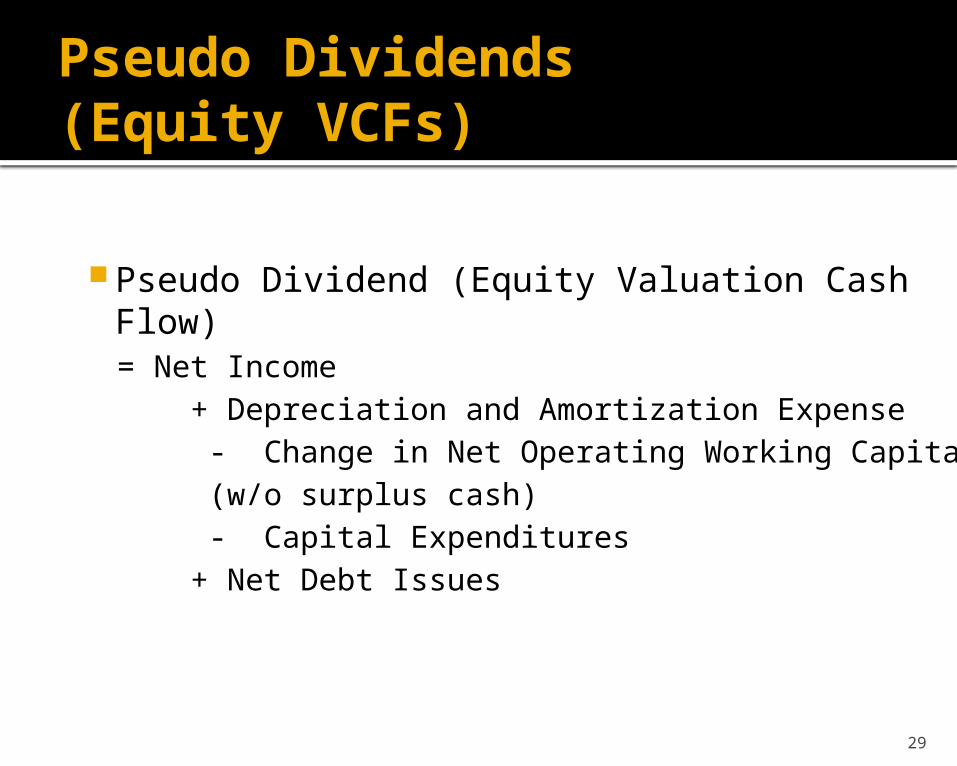
Pseudo Dividends (Equity VCFs)
Pseudo Dividend (Equity Valuation Cash Flow) = Net Income + Depreciation and Amortization Expense - Change in Net Operating Working Capital (w/o surplus cash) - Capital Expenditures + Net Debt Issues
29
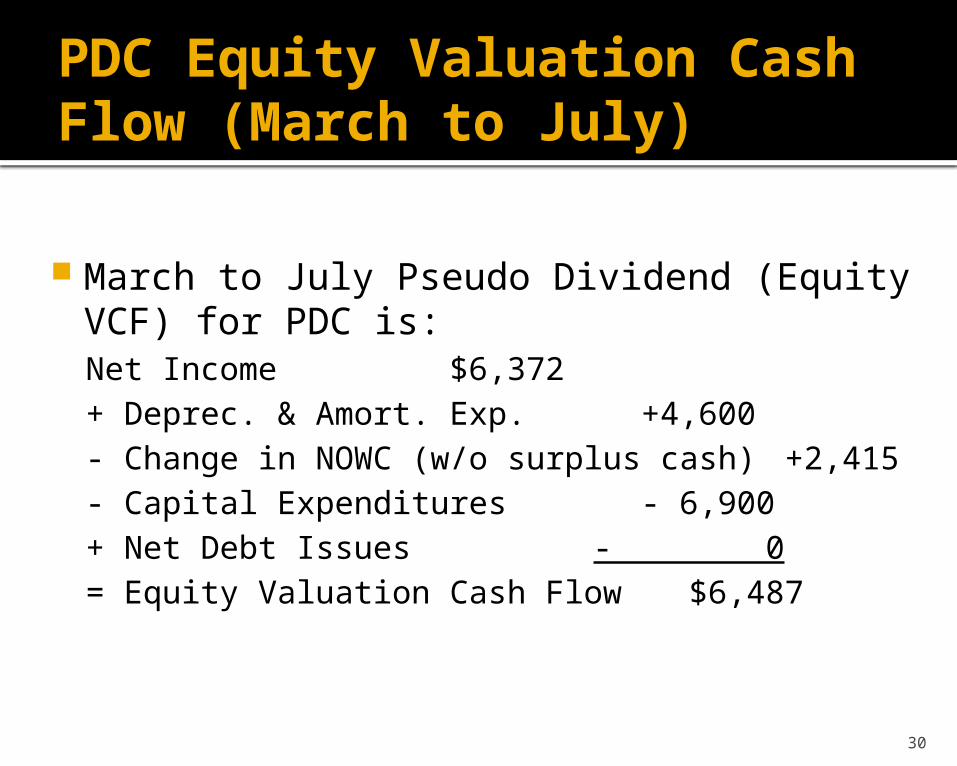
PDC Equity Valuation Cash Flow (March to July)
March to July Pseudo Dividend (Equity VCF) for PDC is:Net Income $6,372+ Deprec. & Amort. Exp. +4,600- Change in NOWC (w/o surplus cash) +2,415- Capital Expenditures - 6,900+ Net Debt Issues - 0= Equity Valuation Cash Flow $6,487
30
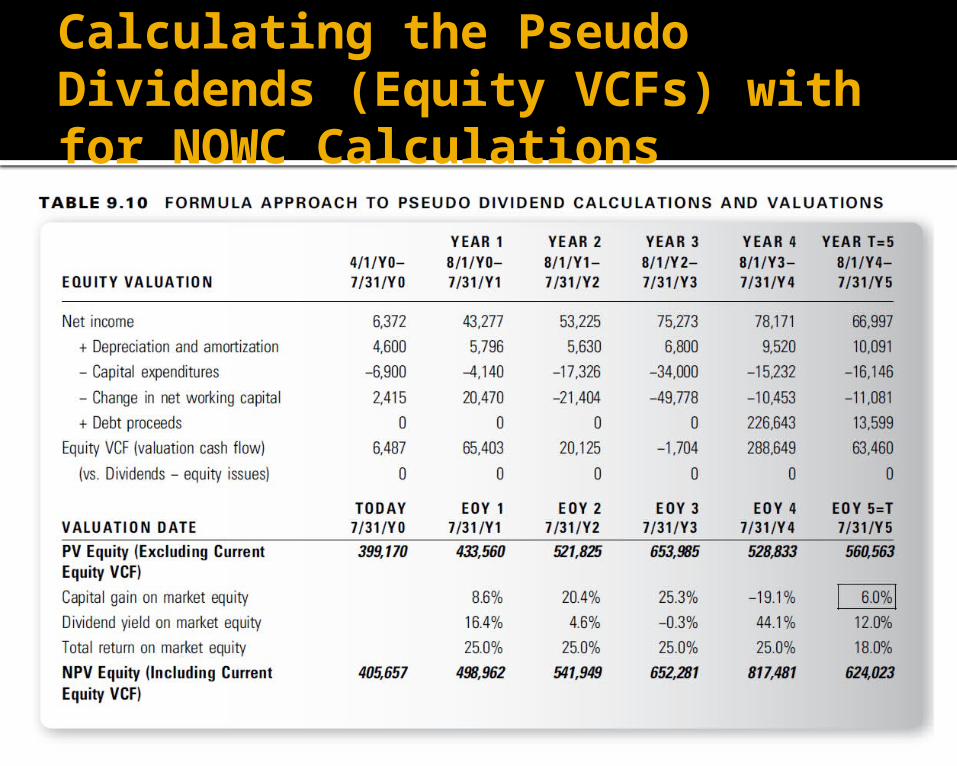
Calculating the Pseudo Dividends (Equity VCFs) with for NOWC Calculations
31
Accounting Versus Equity Valuation Cash Flow
32
Equity valuation cash flow is the cash flow that can be used directly to value a venture’s equity
Accounting Versus Equity Valuation Cash Flow
33

End
34