Embed Size (px)
Citation preview
TH
INK.
CH
AN
GE.
DO
.
M
AR
CH
200
9
NURSING WORKLOAD AND STAFFING: IMPACT ON PATIENTS AND STAFF
CE
NT
RE
FO
R H
EA
LT
H S
ER
VIC
ES
MA
NA
GE
ME
NT
U
TS
: T
HIN
K.C
HA
NG
E.D
O

NURSING WORKLOAD AND STAFFING: IMPACT ON PATIENTS AND STAFF
UNIVERSITY OF TECHNOLOGY, SYDNEY 3
Nursing Workload and Staffing: Impact on Patients and Staff
Professor Christine Duffield
Michael Roche
Professor Linda O’Brien-Pallas
Professor Donna Diers
Chris Aisbett
Kate Aisbett
Professor Caroline Homer
ISBN 978-0-9806239-3-2

NURSING WORKLOAD AND STAFFING: IMPACT ON PATIENTS AND STAFF
4 UNIVERSITY OF TECHNOLOGY, SYDNEY
NURSING WORKLOAD AND STAFFING: IMPACT ON PATIENTS AND STAFF
UNIVERSITY OF TECHNOLOGY, SYDNEY 5
Roles of Contributors
The roles of contributors during the project were as follows:
Professor Christine Duffield (Centre for Health Services Management – UTS)
o Project Director. Cross-sectional design. Cross-sectional sample definition.
Interpretation of cross-sectional and longitudinal analysis. Report
development.
Michael Roche (Centre for Health Services Management – UTS)
o Longitudinal data collection. Cross-sectional sample definition. Cross-
sectional data collection and entry. Analysis and interpretation of cross-
sectional data. Report development.
Professor Linda O’Brien-Pallas (Nursing Health Services Research Unit – University of Toronto and Adjunct Professor UTS)
o Cross-sectional design and supply of instruments, syntax for cross-sectional
analysis. Analysis and interpretation of cross-sectional data. Interpretation of
the longitudinal data.
Professor Donna Diers (Yale New Haven Health System [USA] and Adjunct Professor UTS)
o Longitudinal study outcomes design. Interpretation of longitudinal data.
Analysis of cross-sectional data and the integration of both methods. Report
development.
Chris Aisbett (Laeta Pty Ltd)
o Collation and editing of longitudinal data. Analysis and interpretation of
longitudinal data. Report development.
Kate Aisbett (Laeta Pty Ltd)
o Analysis and interpretation of longitudinal data. Report development.
Professor Caroline Homer (Centre for Family Health & Midwifery – UTS)
o Cross-sectional design. Report development.

NURSING WORKLOAD AND STAFFING: IMPACT ON PATIENTS AND STAFF
6 UNIVERSITY OF TECHNOLOGY, SYDNEY
NURSING WORKLOAD AND STAFFING: IMPACT ON PATIENTS AND STAFF
UNIVERSITY OF TECHNOLOGY, SYDNEY 7
Acknowledgements
The investigators wish to acknowledge the commitment of ACT Health to improving
patient safety and the working lives of nurses through funding this study. The ongoing
involvement of and input from senior staff in ACT Health and its two hospitals has been
critical to the success of this project. We would also like to acknowledge the support
and guidance provided by the Senior Nurses associated with this project throughout its
duration: the Chief Nurses, Adjunct Professor Jenny Beutel for her commitment to
ensuring this project was funded and Ms Joy Vickerstaff to whom this Report was
handed; and the Directors of Nursing, Ms Joy Vickerstaff and Ms Sue Hogan who
facilitated access to their hospitals and data collection. The additional assistance and
support of Leonie Johnson, Michelle Cole, and other staff of the Canberra Hospital
Research Centre, and of Sue Minter of Calvary Hospital was also gratefully received.
Without the assistance of all the staff in the Nursing and Midwifery Office, particularly
Sonia Hogan and Heather Austin, in their responses to our numerous requests for
assistance, this project would not have been completed. The team also acknowledges
the extraordinary diligence of Dianne Pelletier who coordinated the cross-sectional data
collection process and acted as the „trouble-shooter‟ and liaison throughout the project.
The research team is indebted also to the generous assistance provided by Dr Barbara
McCloskey in allowing us to use her SAS (analytic software) code for the outcomes
algorithms, Sping Wang and Xiaoqiang Li of The Nursing Health Services Research
Unit (University of Toronto) for the use of their SPSS syntax, Nancy van Doorn of Laeta
Pty for her extensive work in data cleaning and analysis, Christine Catling-Paull for her
comprehensive review of the literature, and Jane Ewing for her preliminary data
analysis. In addition, the assistance of ACT Health and Calvary Information Technology
staff in the extraction of workforce data was indispensable. Finally, the researchers
wish to recognise and acknowledge the support provided by the nursing profession
throughout the Territory and in particular, those nurses who willingly gave of their time
to complete the surveys, tolerated our intrusions and answered our questions.

NURSING WORKLOAD AND STAFFING: IMPACT ON PATIENTS AND STAFF
8 EXECUTIVE SUMMARY
NURSING WORKLOAD AND STAFFING: IMPACT ON PATIENTS AND STAFF
UNIVERSITY OF TECHNOLOGY, SYDNEY 9
Executive Summary
This study was commissioned by ACT Health to inform future policy decisions on
managing nursing workload in the Territory. The Australian Capital Territory (ACT) is
the smallest of Australia‟s six states and two territories. However it has the highest
population density and is the only state or territory without a sea border. The health
needs of its residents are served by only two public hospitals, The Canberra Hospital
and Calvary Public Hospital, as well as three private hospitals.
Planning and sample definition commenced during late 2006. Cross-sectional data
collection commenced September 2006 and was completed by November 2006.
Longitudinal patient data were collected from the ACT Administrative Data System for
two years (2004-2006) and nursing payroll (workforce) data where possible for the
same years, hospitals and wards.
The study of hospital (N=2) nursing wards (N=16) used longitudinal data held at
Territory levels to associate nursing workload and nursing skill mix (defined as the
percentage of RNs) to patient outcomes from 2004–2006. In-depth cross-sectional data
collected from 16 medical-surgical wards in the two hospitals in 2006 amplified the
findings. In addition, a variety of relationships between the work environment of nurses
and patient outcomes were examined, as were nurses‟ job satisfaction and intention to
leave.
The small sample across only two hospitals means that comparisons with other
studies (for example similar work conducted for NSW Health), must be viewed with
caution. NSW and ACT are different health systems and should not be compared
without careful analysis of admission and case-typing practices. Administrative
divisions such as acute, sub-acute, non-acute, daycase, admitted ED patient, non-
admitted ED and Outpatients are not standardised across health systems. However
where relevant, comparisons have been made.
The focus of this study was on medical and surgical nursing wards/units, the
operational unit where the work of patient care and cure happens, where innovation
can be most readily introduced with real consequences for patients and staff, and
where the relationship between hospital resources and patient outcomes needs to be
studied.
NURSING WORKLOAD AND STAFFING: IMPACT ON PATIENTS AND STAFF
10 EXECUTIVE SUMMARY
This study was designed to:
a) Improve understanding of what constitutes nurses‟ workload in medical and
surgical units across the two hospitals in the Australian Capital Territory.
b) Examine whether patient acuity and length of stay (LOS) have changed over
time, and the impact on nurses‟ workload.
c) Examine the impact of skill mix (the proportion of registered nurses to total
clinical nurse staffing) on patient outcomes as adverse patient circumstances
(casemix controlled in longitudinal data).
d) Determine the impact of the nursing work environment on patient and nurse
outcomes.
This information would assist ACT Health to:
1. Identify and implement innovative models of practice and care where
applicable;
2. Identify how best to meet the health service needs of the community;
3. Identify how to achieve the capacity and capability required to meet high
standards of practice and safe outcomes.
Nursing Workload
Across Australia, the nursing work environment and consequently nursing workload,
has changed considerably over the past few years. This trend is also evidenced in the
ACT data where the ever increasing patient turnover rate is impacting on nursing hours
required to meet workload.
In the longitudinal component, nursing workload on the ward is composed of patient
requirements measured as AR-DRGs, plus movement of patients on and off wards.
Nursing workload is also influenced by the amount of time patients spend on nursing
wards – length of ward (and hospital) stay. Shorter length of stay compresses nursing
work. In the cross-sectional component nursing workload was measured using a
standardised and validated measure, the PRN-80, which estimates the hours of care
required for a patient for the coming 24 hours. Information was collected from the un-
coded medical record by trained data collectors.
NURSING WORKLOAD AND STAFFING: IMPACT ON PATIENTS AND STAFF
UNIVERSITY OF TECHNOLOGY, SYDNEY 11
Staffing levels have increased overall at Canberra Hospital during the study period.
Most ward staffing is matched to acuity adjusted patient load (workload). In contrast,
there has been an increase in the workload of nurses Calvary Hospitals during the
study period.
Using longitudinal data, the average number of different case types (AR-DRGs) per
ward was calculated. The number ranges from a low of 164 to a high of 459, from a
possible range of 613. The wider the range of DRGs cared for in a ward the greater the
workload as nurses who work on these medical and surgical units must understand the
care requirements, the pharmacology, the treatments, the protocols and preferences of
specialist medical staff for an increasingly various patient assignment.
There is a growing awareness of the impact that the movement of patients to and
from nursing wards has on nursing workload (churn). Churn includes the effect of
admission to Emergency Departments (ED) so increased rates of admission to wards
through ED increases churn. Increased throughput, combined with strategies that result
in the movement of patients as space becomes available on the most appropriate ward
for their diagnosis, also increases churn. This bed movement is in addition to patient
transfer required by the treatment regimen itself – from ward to imaging, back to ward,
and so forth. Each new admission, transfer, or discharge, requires documentation,
orientation, clinical assessment and management review, and other tasks associated
with the patient. Accompanying a patient to another ward or service may take a nurse
away from his/her assignment of patients or tasks for an unknown period of time.
In the longitudinal study patients visited 1.24 and 1.32 wards per episode at the two
hospitals in an average length of stay (LOS) in hospital of 2.9 and 3.2 days
respectively. When attention was restricted to patients who had some contact with the
wards in the study the ward visit figures became 1.64 and 1.84 respectively and the
average LOS figures were 8.9 and 6.3 respectively. Either way, the ward visits were
less than the 2.26 wards per episode found in the NSW Health study. In the cross-
sectional study “patients per bed” was calculated per ward by dividing the number of
patients per day by the number of beds. This calculation does not include bed
movements within the ward. The mean was one patient per bed per day, again less
than the 1.25 found in NSW. Both these results may reflect better bed management
strategies.
NURSING WORKLOAD AND STAFFING: IMPACT ON PATIENTS AND STAFF
12 EXECUTIVE SUMMARY
Nursing hours per patient day (NHPPD) provided varied considerably on a per day
basis (mean 6.5, range 3.7 – 11.6) and were reasonably normally distributed though
the data, indicating significant variation between and within wards. When patient needs
vary significantly, staffing is more difficult to predict and can result in an increased
workload for nurses because staffing may fail to match patient needs.
The cross-sectional study used the PRN-80 (see Table 13, page 39 for further
explanation), a standardised and validated tool (Chagnon, Audette, Lebrun, & Tilquin,
1978; O'Brien-Pallas et al., 2004) which measures the minutes of care (later translated
into hours) required (both direct and indirect) per patient for the coming 24 hours.
Information was collected from the un-coded medical record by trained data collectors.
By comparing the hours of care required (using the PRN-80) and the hours of staffing
provided taken from the ward roster, on average, approximately one half hour per day
of additional care is required to meet each patient‟s needs. In addition, there was
considerable variation across the sample. The difference between the minimum and
maximum requirements per ward-day ranged from just over 4 hours to 10.7 hours. This
degree of variability in care needs makes it difficult to predict the staffing required, and
the discrepancy between hours needed and available hours may impact on workload,
quality of care and the work environment.
Nurses self-reported an average of 1.3 tasks per nurse per shift delayed and 1.5
tasks per nurse per shift not completed. The tasks not done include a range of care
and comfort measures: talking with patients, pressure area care, oral hygiene and
patient/family teaching, mobilisation and turning patients, adequate documentation and
the taking of vital signs. Just over one-third (34.3%) of nurses reported they were
unable to comfort and talk to their patients on the most recent shift. A small response
rate was seen for night shift so statistical comparisons could not be made, but an
apparently similar rate of tasks delayed was found, with a lower rate of tasks not done.
Similar factors were influential in regard to both tasks delayed and tasks not
completed. The proportion of nurses indicating less time available to deliver care, the
amount of additional time required to complete care this shift, and the proportion of
hours worked by agency staff were common elements. As these factors increased so
did the rate of tasks delayed or not done. Additional predictors were identified in regard
to the rate of tasks not done. These included the proportion of patients admitted from a
care facility and the amount of involuntary overtime reported. An increase in the
proportion of patients admitted from a care facility led to an increase in tasks delayed.
NURSING WORKLOAD AND STAFFING: IMPACT ON PATIENTS AND STAFF
UNIVERSITY OF TECHNOLOGY, SYDNEY 13
In terms of indirect or additional nursing care activities, nearly half of the
respondents reported that these included delivery or retrieval of patient meal trays
(47%), cleaning (46%) or clerical duties (45%). Over one-third (36%) of nurses order,
co-ordinate or perform ancillary work; 29% arrange discharge referrals and transport,
while 9% transport patients. Starting IVs (35%), undertaking routine phlebotomy (17%)
or ECGs (14%) were also undertaken by nurses.
Nurse Staffing and Skill Mix
Using the longitudinal data, nursing skill mix, defined as the proportion of registered
nurses (RNs) to clinical nurse staffing (Shullanberger, 2000), is highly variable across
the sample wards ranging from 49% to 80% at Canberra Hospital and 57% - 89% at
Calvary Hospital in the final period of analysis. Skillmix was lower in wards with aged or
rehabilitation casemix, higher in specialty surgical wards. Several wards at Canberra
Hospital have had a steady increase in hours worked. At Calvary Hospital all wards
have had an increase in hours worked, although as noted previously this has not
matched increases in workload.
In the cross-sectional data most wards had between 60% and 80% RN staff. Only
twelve ward-days over six different wards employed nurses which were other than RN
and EN categories and the percentage of these “other nurse” hours worked ranged
from 0 – 7.46%, with two outliers at 22.4 and 24.5%.
There were considerable differences in the proportion of full-time to part-time, casual
or agency hours worked. There were two wards which had less than 40% full-time staff.
Part-time staff ranged from 20.3 – 52.6% and casual staff ranged from 1 – 3%. Four
wards in the sample employed no agency staff at all, while the remaining 10 wards
employed between 1 – 8% agency staff. However, there is considerable variation in
these figures when reported on a ward-day basis. The lowest percentage of full-time
hours worked on one ward-day was 10.5% and the highest percentage was 93.3%.
There were ten ward-days which had less than 40% full-time staff and two ward-days
which had more than 80% full-time staff.
There were great variations in the proportion of hours worked per ward-day by
grade. RN L1 staff worked on average 51.6% of the hours with a large range from 21 –
89.9%; RN L2 staff worked on average 16.8% with a range of between 0 – 51%; and
ENs worked 29.9% of hours, also with a large range of 0 – 66%.
NURSING WORKLOAD AND STAFFING: IMPACT ON PATIENTS AND STAFF
14 EXECUTIVE SUMMARY
Patient Outcomes
Twelve clinical Outcomes Potentially Sensitive to Nursing (OPSN) were examined in
the study. In addition, failure to rescue (death following certain OPSN) was counted in
the longitudinal data. In the cross-sectional study data were collected from un-coded
patient records or the ward reporting system and included falls (with and without injury)
and medication errors (with and without patient consequences), events that cannot be
captured in administrative data.
The statistically significant findings supported the hypothesis that more nursing
hours per patient reduces patient length of stay, but the size of the effect was small. It
was found that if the two hospitals were to increase their RN hours by 10%, only a
minor reduction of 1-2% in patient length of stay would result. However when patient
outcomes as Outcomes Potentially Sensitive to Nursing (OPSN) were examined, it was
found that increasing RN hours by 10% could produce decreases in the adverse event
rates studied from 11% to 45%.
In the cross-sectional study 26 (4.3%) patients in the study were found to have
experienced a fall with or without injury, and some of these patients had experienced
both types of fall. Two patients experienced medication errors without consequences.
Out of the 601 patients studied, 34 (5.7%) experienced time-based medication errors,
lower than found in the NSW study. Falls also were lower in the B1 hospital but higher
in the A hospital than in NSW data. As a result of the low rates of adverse events, no
relationships could be established.
Work Environment
The cross-sectional design provided insight into nurses‟ perceptions of their working
environment, their ability to practice comfortably, and the relationship between nurses‟
perceptions and patient outcomes.
Most nurses (88%) rated the quality of care as excellent or good over the past shift.
When asked to indicate whether the quality of care given over the last 12 months had
changed on their wards, 80% of respondents indicated that it had improved or
remained the same.
NURSING WORKLOAD AND STAFFING: IMPACT ON PATIENTS AND STAFF
UNIVERSITY OF TECHNOLOGY, SYDNEY 15
Results from the Nursing Work Index-Revised (NWI-R) indicate that on four of the
five measures, that is, nurse autonomy, nurse control over practice, nurse-doctor
relationships and resource adequacy, nurses in ACT scored higher than did nurses in
NSW. Nurse leadership was slightly lower in the ACT data than NSW. Higher levels of
autonomy, control over practice and nurse-doctor relations correlated with lower
discrepancy between nursing demand and supply (hours of care required compared to
those provided). Conversely, a high nursing demand/supply figure (indicating wider
discrepancy between hours of care required and that supplied) related to lower levels
of autonomy, control over practice and nurse-doctor relations.
When asked whether they had experienced a physical or emotional threat or actual
abuse during the last five shifts, 33% of respondents experienced emotional abuse but
up to a maximum of 58% of staff on a ward did. In terms of threat of violence only 21%
experienced this and while there were wards where no staff experienced a threat of
violence, up to a maximum of 67% of staff on a ward did. The results are similar for
physical violence where 15% of staff experienced this in the past five shifts and up to
58% of staff on a ward did so. The source of violence was nearly exclusively patients
and families. Patients and families were responsible for most physical assaults (96.6%)
and threats of assault (95.1%) and emotional abuse (69.7%).
Nurse Outcomes
71.5% nurses were satisfied with their job and even more (79.5%) were satisfied
with the profession. Furthermore 74% do not intend to leave their current job in the next
12 months. Job satisfaction increased with greater satisfaction with nursing, resource
adequacy and total nursing hours provided, while decline in job satisfaction was related
to increases in the number of shifts missed and increased age of the respondent.
Nurses who were satisfied with their job and who perceived they had adequate
resources were more likely to be satisfied with their profession, while those in
temporary employment were less satisfied with nursing. A higher patient turnover also
predicted satisfaction with nursing.
Nurses were more likely to intend to leave their current job if they were required to
re-sequence their work frequently, if there was a higher proportion of agency hours
worked on their ward and if demand for nursing care per day exceeded supply. Nurses
who had worked longer and who were satisfied with their job were less likely to plan to

NURSING WORKLOAD AND STAFFING: IMPACT ON PATIENTS AND STAFF
16 EXECUTIVE SUMMARY
leave. Nurses indicating they had more time to deliver care per shift were more likely to
leave. Those working on wards with a higher proportion of patients waiting for a care
facility were less likely to intend to leave.
There was considerable variability between the wards. Overall, the study provides
insight into patterns in nursing staffing, the work environment and patient outcomes in
ACT public hospitals. The results suggest that to successfully manage a hospital
system requires an understanding of the nature of the work and a commitment to
matching resources to workload.

NURSING WORKLOAD AND STAFFING: IMPACT ON PATIENTS AND STAFF
UNIVERSITY OF TECHNOLOGY, SYDNEY 17
18 EXECUTIVE SUMMARY
Table of Contents.
1. Introduction ........................................................................................ 20
Purpose and Objectives ..................................................................................... 21
Organisation of the Report ................................................................................. 21
Glossary ............................................................................................................. 22
1.1 Literature Review .................................................................................... 27
2. Study Design & Ethics Approval ...................................................... 34
Study Design ...................................................................................................... 34
Ethics Approvals ................................................................................................ 35
3. Samples and Data Collection ............................................................ 36
Longitudinal Component .................................................................................... 36
Cross-sectional Component .............................................................................. 36
3.1 Data Analysis ........................................................................................... 41
Longitudinal Analysis ......................................................................................... 41
Cross-sectional Analysis .................................................................................... 50
4. Findings .............................................................................................. 53
4.1 Longitudinal Findings ............................................................................. 53
Patterns in Skill Mix............................................................................................ 53
Patterns in Staffing Levels ................................................................................. 62
Findings for OPSN other than ALOS ................................................................. 67
Conclusion ......................................................................................................... 73
4.2 Cross-sectional Findings ....................................................................... 75
Patient Characteristics ....................................................................................... 75
Nurse Characteristics ........................................................................................ 76
Ward Characteristics ......................................................................................... 80
Skill Mix Characteristics ..................................................................................... 81
Nursing Workload .............................................................................................. 89
Work Environment ............................................................................................. 93
Quality of Care ................................................................................................... 95
Violence Experienced ...................................................................................... 101
Satisfaction and Intention to Leave.................................................................. 102
Patient Outcomes ............................................................................................ 103
Outcome Predictors ......................................................................................... 105
Nurse Outcomes .............................................................................................. 107
5. Limitations ........................................................................................ 111
6. Summary and Discussion ............................................................... 112
7. References ....................................................................................... 117
8. Appendices....................................................................................... 121

UNIVERSITY OF TECHNOLOGY, SYDNEY 19
NURSING WORKLOAD AND STAFFING: IMPACT ON PATIENTS AND STAFF
20 INTRODUCTION
1. Introduction
Nurse staffing in Australian hospitals has received greater attention recently with
projections that the current shortage of nurses is unlikely to abate, particularly as the
workforce ages. An overall annual increase in demand for nurses of 2.56% until 2010
has been predicted, with 180,552 Registered Nurses (RNs) being required by that time.
A shortfall of approximately 40,000 is expected (Access Economics, 2004a; Karmel &
Li, 2002). Current workforce predictions indicate that the retirement of large numbers of
nurses in the „baby boomer‟ age bracket and the lower age at which female nurses
retire will exacerbate current shortages (Schofield & Beard, 2005). It is possible that
half the nursing workforce will be retired within 15 years (ARHRC, 2005). Efforts to
recruit more people into the profession without addressing retention will not have a
sustainable impact unless measures are undertaken to understand and address
nursing workload and the quality of the work environment for nurses. These factors
have been shown to have a significant impact on patient outcomes.
Much of the nursing workforce comprises general (although still highly specialised)
medical and surgical nurses. Not only are the majority of hospitalised patients found in
general medical/surgical wards, but also, it is frequently these nurses who move to
more specialised clinical areas such as intensive care, midwifery or mental health
where there are already documented shortages (AHWAC, 2002a, 2002b, 2004; VDHS,
1999). This study was commissioned to examine factors which impact on nurses‟
workload, particularly at the ward/unit level (medical and surgical) but in addition,
examines the relationships between patient outcomes, the nursing work environment,
nursing skill mix and workload. Study at the ward level enables a greater understanding
of the relationships between the factors mentioned above but more importantly, can
provide greater insight for those charged with responsibility for managing staff and
patient care.
NURSING WORKLOAD AND STAFFING: IMPACT ON PATIENTS AND STAFF
UNIVERSITY OF TECHNOLOGY, SYDNEY 21
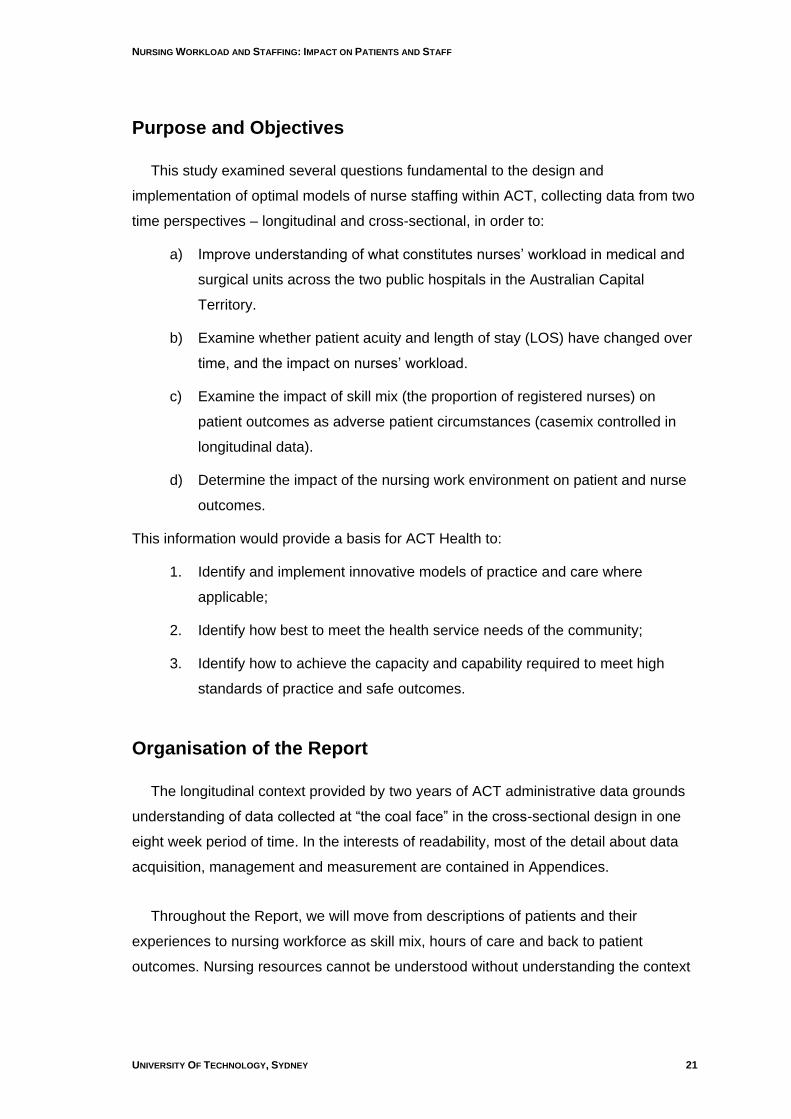
Purpose and Objectives
This study examined several questions fundamental to the design and
implementation of optimal models of nurse staffing within ACT, collecting data from two
time perspectives – longitudinal and cross-sectional, in order to:
a) Improve understanding of what constitutes nurses‟ workload in medical and
surgical units across the two public hospitals in the Australian Capital
Territory.
b) Examine whether patient acuity and length of stay (LOS) have changed over
time, and the impact on nurses‟ workload.
c) Examine the impact of skill mix (the proportion of registered nurses) on
patient outcomes as adverse patient circumstances (casemix controlled in
longitudinal data).
d) Determine the impact of the nursing work environment on patient and nurse
outcomes.
This information would provide a basis for ACT Health to:
1. Identify and implement innovative models of practice and care where
applicable;
2. Identify how best to meet the health service needs of the community;
3. Identify how to achieve the capacity and capability required to meet high
standards of practice and safe outcomes.
Organisation of the Report
The longitudinal context provided by two years of ACT administrative data grounds
understanding of data collected at “the coal face” in the cross-sectional design in one
eight week period of time. In the interests of readability, most of the detail about data
acquisition, management and measurement are contained in Appendices.
Throughout the Report, we will move from descriptions of patients and their
experiences to nursing workforce as skill mix, hours of care and back to patient
outcomes. Nursing resources cannot be understood without understanding the context
NURSING WORKLOAD AND STAFFING: IMPACT ON PATIENTS AND STAFF
22 INTRODUCTION
in which nursing is practiced – the work environment, the patients who require care and
the staff providing that care.
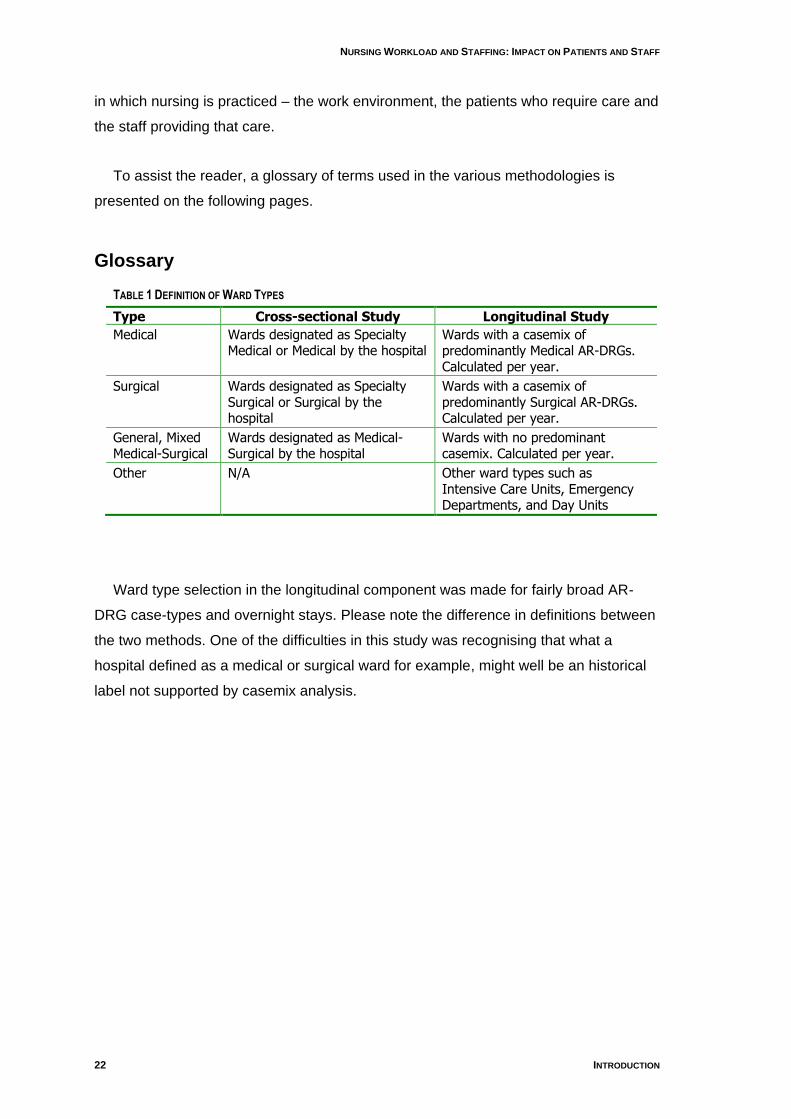
To assist the reader, a glossary of terms used in the various methodologies is
presented on the following pages.
Glossary
TABLE 1 DEFINITION OF WARD TYPES
Type Cross-sectional Study Longitudinal Study
Medical Wards designated as Specialty Medical or Medical by the hospital
Wards with a casemix of predominantly Medical AR-DRGs. Calculated per year.
Surgical Wards designated as Specialty Surgical or Surgical by the hospital
Wards with a casemix of predominantly Surgical AR-DRGs. Calculated per year.
General, Mixed Medical-Surgical
Wards designated as Medical-Surgical by the hospital
Wards with no predominant casemix. Calculated per year.
Other N/A Other ward types such as Intensive Care Units, Emergency Departments, and Day Units
Ward type selection in the longitudinal component was made for fairly broad AR-
DRG case-types and overnight stays. Please note the difference in definitions between
the two methods. One of the difficulties in this study was recognising that what a
hospital defined as a medical or surgical ward for example, might well be an historical
label not supported by casemix analysis.
NURSING WORKLOAD AND STAFFING: IMPACT ON PATIENTS AND STAFF
UNIVERSITY OF TECHNOLOGY, SYDNEY 23
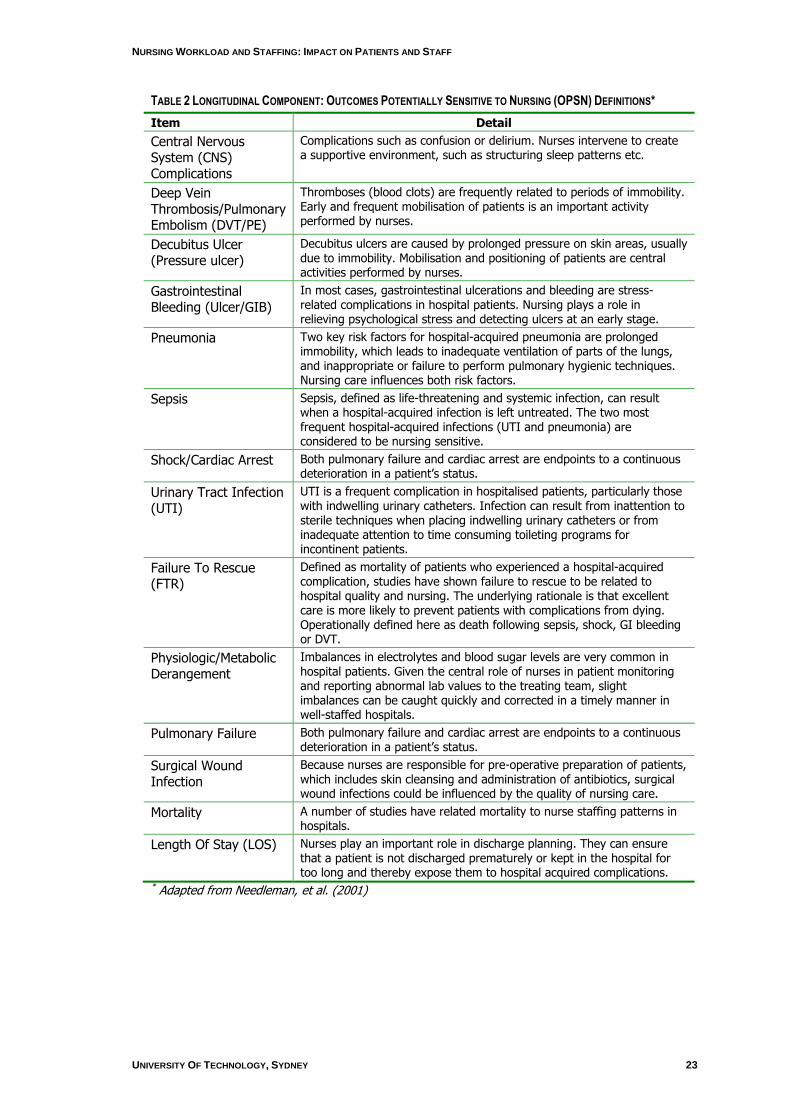
TABLE 2 LONGITUDINAL COMPONENT: OUTCOMES POTENTIALLY SENSITIVE TO NURSING (OPSN) DEFINITIONS*
Item Detail
Central Nervous System (CNS) Complications
Complications such as confusion or delirium. Nurses intervene to create a supportive environment, such as structuring sleep patterns etc.
Deep Vein Thrombosis/Pulmonary Embolism (DVT/PE)
Thromboses (blood clots) are frequently related to periods of immobility. Early and frequent mobilisation of patients is an important activity performed by nurses.
Decubitus Ulcer (Pressure ulcer)
Decubitus ulcers are caused by prolonged pressure on skin areas, usually due to immobility. Mobilisation and positioning of patients are central activities performed by nurses.
Gastrointestinal Bleeding (Ulcer/GIB)
In most cases, gastrointestinal ulcerations and bleeding are stress-related complications in hospital patients. Nursing plays a role in relieving psychological stress and detecting ulcers at an early stage.
Pneumonia Two key risk factors for hospital-acquired pneumonia are prolonged immobility, which leads to inadequate ventilation of parts of the lungs, and inappropriate or failure to perform pulmonary hygienic techniques. Nursing care influences both risk factors.
Sepsis Sepsis, defined as life-threatening and systemic infection, can result when a hospital-acquired infection is left untreated. The two most frequent hospital-acquired infections (UTI and pneumonia) are considered to be nursing sensitive.
Shock/Cardiac Arrest Both pulmonary failure and cardiac arrest are endpoints to a continuous deterioration in a patient‟s status.
Urinary Tract Infection (UTI)
UTI is a frequent complication in hospitalised patients, particularly those with indwelling urinary catheters. Infection can result from inattention to sterile techniques when placing indwelling urinary catheters or from inadequate attention to time consuming toileting programs for incontinent patients.
Failure To Rescue (FTR)
Defined as mortality of patients who experienced a hospital-acquired complication, studies have shown failure to rescue to be related to hospital quality and nursing. The underlying rationale is that excellent care is more likely to prevent patients with complications from dying. Operationally defined here as death following sepsis, shock, GI bleeding or DVT.
Physiologic/Metabolic Derangement
Imbalances in electrolytes and blood sugar levels are very common in hospital patients. Given the central role of nurses in patient monitoring and reporting abnormal lab values to the treating team, slight imbalances can be caught quickly and corrected in a timely manner in well-staffed hospitals.
Pulmonary Failure Both pulmonary failure and cardiac arrest are endpoints to a continuous deterioration in a patient‟s status.
Surgical Wound Infection
Because nurses are responsible for pre-operative preparation of patients, which includes skin cleansing and administration of antibiotics, surgical wound infections could be influenced by the quality of nursing care.
Mortality A number of studies have related mortality to nurse staffing patterns in hospitals.
Length Of Stay (LOS) Nurses play an important role in discharge planning. They can ensure that a patient is not discharged prematurely or kept in the hospital for too long and thereby expose them to hospital acquired complications.
* Adapted from Needleman, et al. (2001)
NURSING WORKLOAD AND STAFFING: IMPACT ON PATIENTS AND STAFF
24 INTRODUCTION
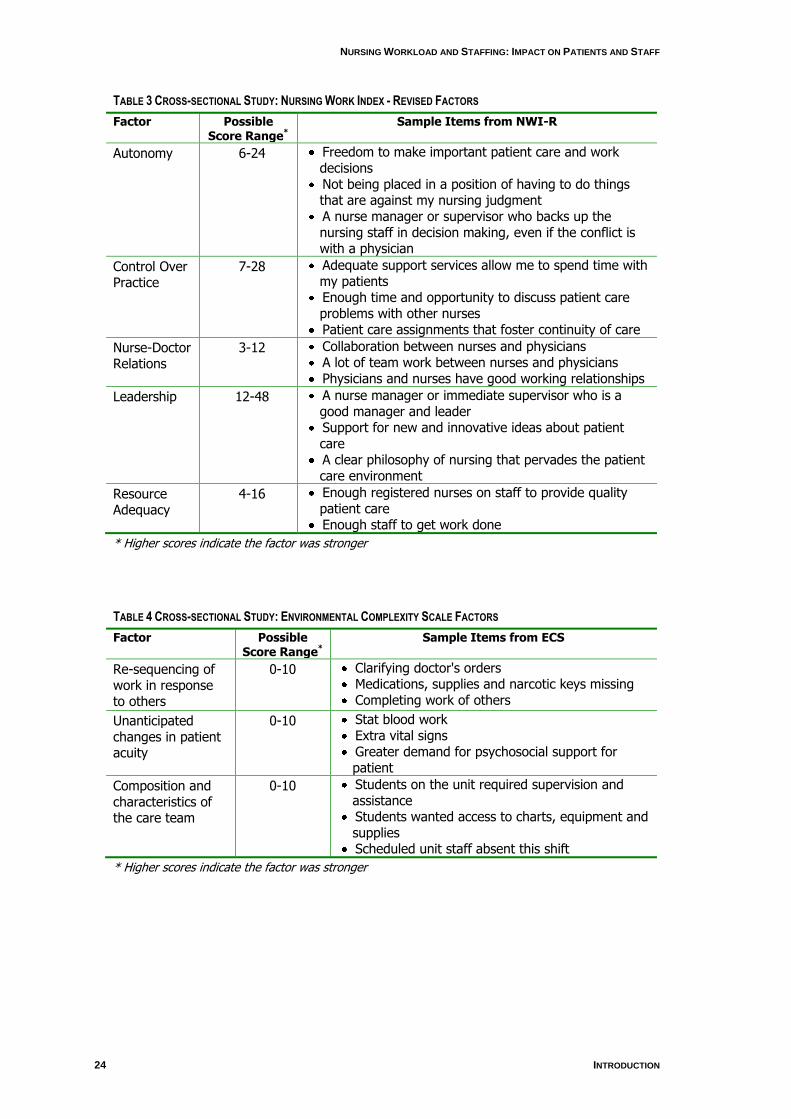
TABLE 3 CROSS-SECTIONAL STUDY: NURSING WORK INDEX - REVISED FACTORS
Factor Possible Score Range*
Sample Items from NWI-R
Autonomy 6-24 Freedom to make important patient care and work decisions
Not being placed in a position of having to do things that are against my nursing judgment
A nurse manager or supervisor who backs up the nursing staff in decision making, even if the conflict is with a physician
Control Over Practice
7-28 Adequate support services allow me to spend time with my patients
Enough time and opportunity to discuss patient care problems with other nurses
Patient care assignments that foster continuity of care
Nurse-Doctor Relations
3-12 Collaboration between nurses and physicians A lot of team work between nurses and physicians Physicians and nurses have good working relationships
Leadership 12-48 A nurse manager or immediate supervisor who is a good manager and leader
Support for new and innovative ideas about patient care
A clear philosophy of nursing that pervades the patient care environment
Resource Adequacy
4-16 Enough registered nurses on staff to provide quality patient care
Enough staff to get work done
* Higher scores indicate the factor was stronger
TABLE 4 CROSS-SECTIONAL STUDY: ENVIRONMENTAL COMPLEXITY SCALE FACTORS
Factor Possible Score Range*
Sample Items from ECS
Re-sequencing of work in response to others
0-10 Clarifying doctor's orders Medications, supplies and narcotic keys missing Completing work of others
Unanticipated changes in patient acuity
0-10 Stat blood work Extra vital signs Greater demand for psychosocial support for patient
Composition and characteristics of the care team
0-10 Students on the unit required supervision and assistance
Students wanted access to charts, equipment and supplies
Scheduled unit staff absent this shift
* Higher scores indicate the factor was stronger
NURSING WORKLOAD AND STAFFING: IMPACT ON PATIENTS AND STAFF
UNIVERSITY OF TECHNOLOGY, SYDNEY 25
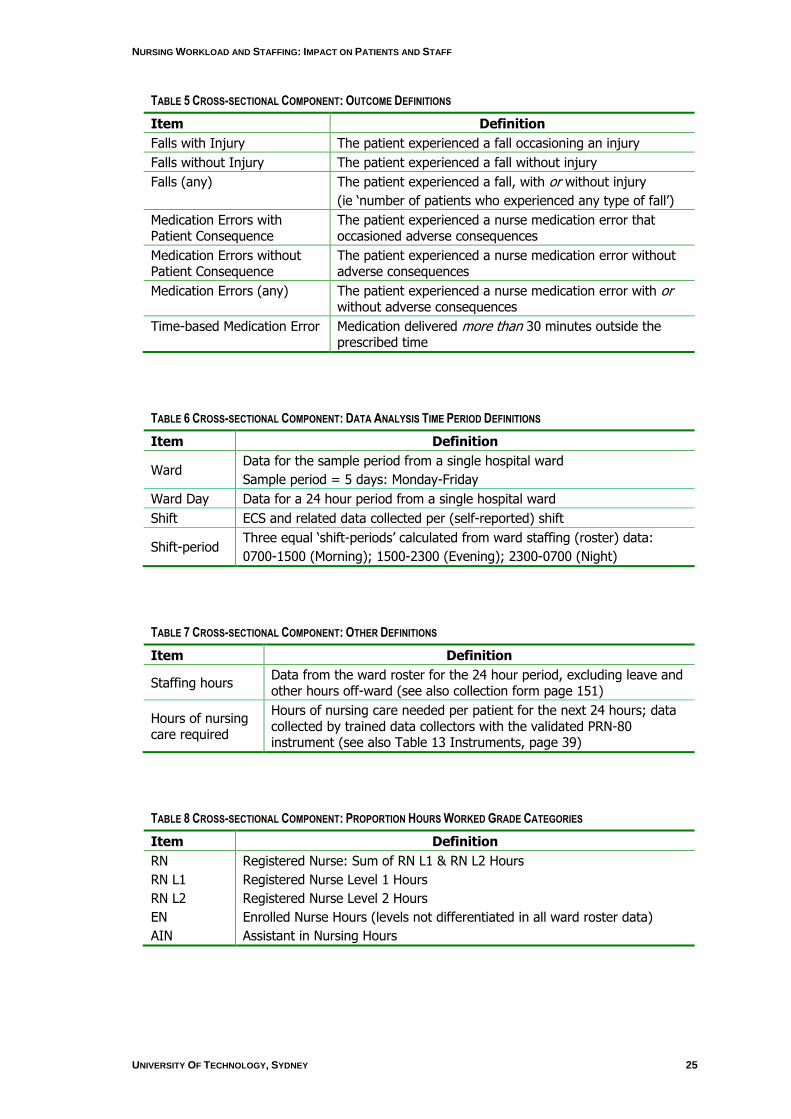
TABLE 5 CROSS-SECTIONAL COMPONENT: OUTCOME DEFINITIONS
Item Definition
Falls with Injury The patient experienced a fall occasioning an injury
Falls without Injury The patient experienced a fall without injury
Falls (any) The patient experienced a fall, with or without injury
(ie „number of patients who experienced any type of fall‟)
Medication Errors with Patient Consequence
The patient experienced a nurse medication error that occasioned adverse consequences
Medication Errors without Patient Consequence
The patient experienced a nurse medication error without adverse consequences
Medication Errors (any) The patient experienced a nurse medication error with or without adverse consequences
Time-based Medication Error Medication delivered more than 30 minutes outside the prescribed time
TABLE 6 CROSS-SECTIONAL COMPONENT: DATA ANALYSIS TIME PERIOD DEFINITIONS
Item Definition
Ward Data for the sample period from a single hospital ward
Sample period = 5 days: Monday-Friday
Ward Day Data for a 24 hour period from a single hospital ward
Shift ECS and related data collected per (self-reported) shift
Shift-period Three equal „shift-periods‟ calculated from ward staffing (roster) data:
0700-1500 (Morning); 1500-2300 (Evening); 2300-0700 (Night)
TABLE 7 CROSS-SECTIONAL COMPONENT: OTHER DEFINITIONS
Item Definition
Staffing hours Data from the ward roster for the 24 hour period, excluding leave and other hours off-ward (see also collection form page 151)
Hours of nursing care required
Hours of nursing care needed per patient for the next 24 hours; data collected by trained data collectors with the validated PRN-80 instrument (see also Table 13 Instruments, page 39)
TABLE 8 CROSS-SECTIONAL COMPONENT: PROPORTION HOURS WORKED GRADE CATEGORIES
Item Definition
RN Registered Nurse: Sum of RN L1 & RN L2 Hours
RN L1 Registered Nurse Level 1 Hours
RN L2 Registered Nurse Level 2 Hours
EN Enrolled Nurse Hours (levels not differentiated in all ward roster data)
AIN Assistant in Nursing Hours
NURSING WORKLOAD AND STAFFING: IMPACT ON PATIENTS AND STAFF
26 INTRODUCTION
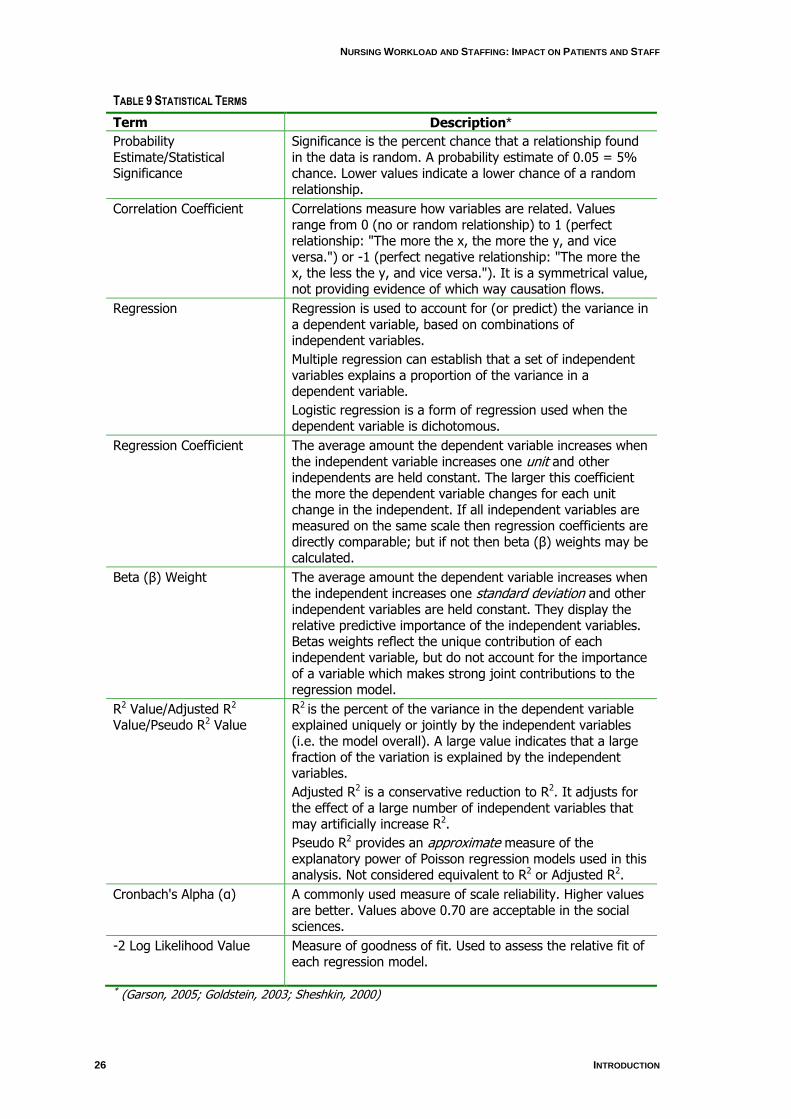
TABLE 9 STATISTICAL TERMS
Term Description*
Probability Estimate/Statistical Significance
Significance is the percent chance that a relationship found in the data is random. A probability estimate of 0.05 = 5% chance. Lower values indicate a lower chance of a random relationship.
Correlation Coefficient Correlations measure how variables are related. Values range from 0 (no or random relationship) to 1 (perfect relationship: "The more the x, the more the y, and vice versa.") or -1 (perfect negative relationship: "The more the x, the less the y, and vice versa."). It is a symmetrical value, not providing evidence of which way causation flows.
Regression Regression is used to account for (or predict) the variance in a dependent variable, based on combinations of independent variables.
Multiple regression can establish that a set of independent variables explains a proportion of the variance in a dependent variable.
Logistic regression is a form of regression used when the dependent variable is dichotomous.
Regression Coefficient The average amount the dependent variable increases when the independent variable increases one unit and other independents are held constant. The larger this coefficient the more the dependent variable changes for each unit change in the independent. If all independent variables are measured on the same scale then regression coefficients are directly comparable; but if not then beta (β) weights may be calculated.
Beta (β) Weight The average amount the dependent variable increases when the independent increases one standard deviation and other independent variables are held constant. They display the relative predictive importance of the independent variables. Betas weights reflect the unique contribution of each independent variable, but do not account for the importance of a variable which makes strong joint contributions to the regression model.
R2 Value/Adjusted R2 Value/Pseudo R2 Value
R2 is the percent of the variance in the dependent variable explained uniquely or jointly by the independent variables (i.e. the model overall). A large value indicates that a large fraction of the variation is explained by the independent variables.
Adjusted R2 is a conservative reduction to R2. It adjusts for the effect of a large number of independent variables that may artificially increase R2.
Pseudo R2 provides an approximate measure of the explanatory power of Poisson regression models used in this analysis. Not considered equivalent to R2 or Adjusted R2.
Cronbach's Alpha (α) A commonly used measure of scale reliability. Higher values are better. Values above 0.70 are acceptable in the social sciences.
-2 Log Likelihood Value Measure of goodness of fit. Used to assess the relative fit of each regression model.
* (Garson, 2005; Goldstein, 2003; Sheshkin, 2000)
NURSING WORKLOAD AND STAFFING: IMPACT ON PATIENTS AND STAFF
UNIVERSITY OF TECHNOLOGY, SYDNEY 27
Literature Review
The current nursing shortage in Australia has been well documented (AHWAC,
2002a, 2002b, 2004). In 2006, estimates of up to 12,270 new nurses were needed to
enter the profession to keep up with health care needs (AHWAC, 2004), and a shortfall
of approximately 40,000 nurses is expected by 2010 (Access Economics, 2004b;
Karmel & Li, 2002). This scenario will likely be detrimental to patient outcomes and
nurse turnover rates as workloads increase, job satisfaction rates decrease and nurses
find alternative employment (Duffield, O'Brien-Pallas, & Aitken, 2004). In light of these
projections it is becoming more important to employ strategies to help retain nursing
staff by addressing issues of work environment, skill mix, workload, job satisfaction,
and the relationship between these and patient outcomes. Without efforts to sustain the
existing nursing workforce, attempts to recruit more nurses will likely be short-lived and
unsuccessful.
Nursing work has changed considerably in recent years and a range of factors have
been identified which impact on nurses‟ workload. These include an increased ageing
population (including both nurses and patients), increased patient acuity, new
diseases, treatments and technologies, and changing employment patterns (AIHW,
2005; Karmel & Li, 2002). Nurse managers have had to become more creative in
staffing and patient allocations to try to maintain standards of care and positive patient
outcomes as skill mix and the workforce profile have changed.
Skill mix
The different categories of health care workers who provide care to patients is
termed „skill mix‟ or „staff mix‟ (McGillis-Hall, 1997). Skillmix is defined as the proportion
of registered nurses to total clinical nurse staffing (Aiken, Sochalski, & Anderson, 1996;
Shullanberger, 2000). It is argued that a lesser qualified skill mix may result in
increased nurse turnover and unproductive time (Orne, Garland, O'Hara, Perfetto, &
Stielau, 1998), and others have tried to clarify roles of unlicensed and untrained
personnel (McKenna, Hasson, & Keeney, 2004). Other large studies have found that a
higher proportion of RNs on medical and surgical wards was associated with better
outcomes in terms of morbidity and mortality (Estabrooks, Midodzi, Cummings, Ricker,
& Giovannetti, 2005; O'Brien-Pallas et al., 2004; Tourangeau et al., 2006). Critical in
these is the proportion of registered nurse hours worked as compared to other
categories of employee – regulated nurses such as enrolled nurses or licensed
NURSING WORKLOAD AND STAFFING: IMPACT ON PATIENTS AND STAFF
28 INTRODUCTION
practical nurses or unregulated workers such as health care assistants, assistants in
nursing.
Work environment
There is increasing emphasis on the work environment of nurses because of its
potential in retaining nurses and ensuring positive patient outcomes. Many years ago in
the United States (USA), a number of hospitals were labelled „Magnet‟ institutions –
“good places for nurses to work”. Nurses in these facilities were deemed central to the
hospital and as a result of this philosophy, had higher job satisfaction and retention
rates (Kramer & Schmalenberg, 1991). These institutions were found to have a 4.6%
lower patient mortality when compared with non-magnet hospitals (Aiken, Smith, &
Lake, 1994). A more recent study also found that attractive organisational
characteristics are key factors in nurse retention. An increased workload and having to
leave basic nursing tasks undone were also found to be fundamental to nurses‟ levels
of job satisfaction and retention rates (Aiken et al., 2001). A collegial working
environment, opportunities for nurse education, a richer skill mix and continuity of care
have also been linked to lower patient mortality levels (Baumann, O'Brien-Pallas et al.,
2001; Estabrooks et al., 2005).
Nurses‟ job satisfaction is affected by the perception of control over their work (Finn,
2001; Laschinger, Finegan, Shamian, & Wilk, 2004; Rafferty, Ball, & Aiken, 2001;
Stamps & Piedmont, 1986; Tillman, Salyer, Corley, & Mark, 1997). The Nursing Work
Index – Revised (NWI-R), used in the ACT study, is a measure of the work
environment. It has 49 items that measure nurse autonomy, control over practice,
nurse-doctor relations, nursing leadership and resource adequacy. The NWI-R was first
developed in the US and has since been refined and used widely including in Australia
(Aiken & Patrician, 2000; Aiken & Sloane, 1997; Aiken et al., 1994; Estabrooks et al.,
2002; Kramer & Hafner, 1989). Also used in this study was the Environmental
Complexity Scale (ECS) (O'Brien-Pallas, Irvine, Peereboom, & Murray, 1997) used
previously in Australia (Duffield et al., 2007). This tool has three domains:
resequencing of work in response to others‟ requests; unanticipated changes in patient
acuity; and characteristics and composition of the caregiver team. Nurses are also
asked whether nursing interventions were left undone or delayed due to lack of time.
Use of both of these tools provides a comprehensive measurement of nursing work
and the factors impacting on it.
NURSING WORKLOAD AND STAFFING: IMPACT ON PATIENTS AND STAFF
UNIVERSITY OF TECHNOLOGY, SYDNEY 29
Nursing care environments and the organisation of nursing care have been linked to
adverse patient outcomes such as medication errors, increased length of stay and
mortality (American Nurses' Association, 1997; Czaplinski & Diers, 1998; Estabrooks et
al., 2005; Grillo-Peck & Risner, 1995; Needleman, Buerhaus, Mattke, Stewart, &
Zelevinsky, 2002; Tourangeau, 2002; Tourangeau et al., 2006). Recent research
suggests that adverse patient events and nurses‟ emotional exhaustion are directly
affected by the quality of the work environment (Laschinger & Leiter, 2006). Aiken,
Clarke & Sloane (2002) report that understaffing leads to greater nursing turnover
because nurses are being prevented from providing the quality of care that they wish,
compromising patient care. Clarke and Aiken (2006) also argue that nurse productivity
could improve if there were improved work environments.
Workload
In Australia, there are many ways of allocating nursing resources which are not
related to types of patient or ward specialty (except intensive care and high
dependency units) (Duffield, Roche & Merrick, 2006). Some measures used include
nursing hours per patient day (NHPPD) (Western Australia). A „nurse to patient‟ ratio
has been adopted in Victoria which is designed to promote equal workload amongst
nurses (Plummer, 2005). Unruh & Fottler (2006) found this method may underestimate
nursing workload, and Graf et al. (2003) suggest such a method may produce
inflexibility which could exacerbate staffing and quality issues.
Other methods that measure nursing workload are patient dependency or patient
acuity systems. In the early 1980s in Australia, PAIS (Patient Assessment and
Information System) was introduced into Victoria (Hovenga, 1996). The resources
required (hours of nursing) for a given PAIS category had been developed from a
number of work sampling studies and included time for administrative work and indirect
nursing activities (Goodwin & Hawkins, 1990; Hovenga, 1996). These nursing activities
include direct patient care and indirect nursing care such as documentation and within
the PAIS model, patients are classified on a per shift, daily, weekly, monthly, random or
ad hoc basis to reflect the workload at a particular point in time. Software packages,
such as E-care (D. E. Goldstein, 2003) and TrendCare (Trend Care Systems Pty Ltd,
2004), involve nurses using care plans or clinical pathways, determining the time
necessary for each „unit of care‟, and establishing patient requirements from these
parameters.
NURSING WORKLOAD AND STAFFING: IMPACT ON PATIENTS AND STAFF
30 INTRODUCTION
Nursing workload can be impacted by many factors such as the number of case
types (Diagnostic Related Groups [DRGs]) nurses have to care for (Diers & Potter,
1997); the degree of patient turnover and churn (movement of patients between and
within wards) (Duffield et al. 2007); the increased throughput of patients (Unruh &
Fottler, 2006); their length of stay and acuity (Birch, O'Brien-Pallas, Alksnis, Murphy, &
Thomson, 2003); and staff shortages (Buerhaus, 1997). The decreased length of
patient stay in hospital and the concentration of, and increase in nursing work that this
requires, has not been widely studied (Graf et al., 2003).
Diers and Potter (1997) present a case study of an overspent and difficult to
manage ward. It became apparent that a large number of different DRGs (casemix)
contributed to the apparent disorganisation. Some studies argue for similar patient
types to be organised on specialised wards to enhance expert nursing care (Aiken,
Lake, Sochalski, & Sloane, 1997; Czaplinski & Diers, 1998; Diers & Potter, 1997). The
argument is that it is unreasonable for nurses to be expert in all manner of patient
types/specialities, and that by narrowing the demands on their expertise, they would
work more efficiently and improve patient outcomes. Case mix cohorting may help
managers predict nursing care requirements more efficiently, because when patient
needs vary in intensity on a day-to-day basis, nurse staffing requirements are more
difficult to anticipate: patient needs may not be met.
The nursing work environment, and consequently nursing workload, has changed
considerably over the past few years. As a result of technology and efficiency policies
that target length of stay, nurses have a more complex patient load (Baumann,
Giovannetti et al., 2001; Birch et al., 2003). The increased turnover of patients or
„churn‟ intensifies the nursing workload further. Birch (2003) found that after hospital
restructuring in Ontario (Canada) there was an increased number of severity-adjusted
patients using fewer beds cared for by fewer nurses. Patient throughput increased by
12% and inpatient episodes per bed increased by over 25%. Unruh & Fottler (2006)
found that patient turnover (in their sample of up to 205 hospitals) significantly
increased from 1994 to 2001 and that as a consequence, staffing requirements and
workload for nurses may be underestimated. Admission and discharge of patients
means extra documentation, educational, general nursing and organisational duties,
thereby increasing nursing workload. The movement of patients within wards is also a
factor in nursing workload, and one that is harder to quantify. However some wards will
have systems of management whereby it is necessary to move patients from area to
area on a regular basis (eg. from high to low acute areas). Nurses are also called upon
NURSING WORKLOAD AND STAFFING: IMPACT ON PATIENTS AND STAFF
UNIVERSITY OF TECHNOLOGY, SYDNEY 31
to assist with these when transferring patients between wards, and, depending on
resources, can be required to move the bed themselves. Nursing workload can be
further increased by nurses needing to accompany patients for investigations in other
departments (eg. CT or MRI scans), leaving their allocated patients in the care of a
colleague who already has his/her own patient load.
Another factor impacting on nursing workload is a general shortage of allied health
professionals in Australia (DEWR2006). This includes occupations such as
physiotherapists, occupational therapists, speech pathologists, radiographers and
pathologists. This shortage of staff may cause delays in patient treatment, and an
increased workload as nurses try to incorporate into their day the types of care patients
should ideally receive from these professionals.
Patient Outcomes / Outcomes Potentially Sensitive to Nursing (OPSN)
Nurses are the health professionals that are most directly involved with patients.
They monitor patients‟ progress, assess clinical changes, intervene when appropriate
and are central to communication and coordination among the allied health team.
Patient safety has been defined as „freedom from accident, or, more broadly, avoiding
injuries to patients from the care that is intended to help them‟ (IOM, 1999, 2001).
Ingersoll (1998) defined patient outcomes as the „end result of treatment or care
delivery‟.
Outcomes Potentially Sensitive to Nursing (OPSN) have been the focus of a number
of studies (Buerhaus, 1999; McCloskey & Diers, 2005; Needleman et al., 2002;
Needleman, Buerhaus, Mattke, Stewart, & Zelevinsky, 2001). Needleman et al. (2001)
found that lower levels of RNs were linked to higher rates of urinary tract infections,
pneumonia, shock and cardiac arrest, upper gastrointestinal bleeding, „failure to
rescue‟ (FTR), and length of hospital stay in both medical and surgical patients treated
in hospitals. FTR has been suggested as a better gauge of care quality than
complications alone (Clarke & Aiken, 2003), the term having been introduced by Silber
et al. (1992) to describe how patients are „rescued‟ from events that complicate their
health by nurses and other health care professionals. FTR is operationally defined as
death following adverse events such as sepsis, DVT, GI bleeding, cardiogenic shock
and hospital-acquired pneumonia.
NURSING WORKLOAD AND STAFFING: IMPACT ON PATIENTS AND STAFF
32 INTRODUCTION
The meta-analysis by Kane et al. (2007), established that an increase in RN staffing
was associated with a reduction in patient mortality, adverse events and FTR. This
study found that for surgical patients, an increase of one full-time RN a day was
associated with a reduction in the relative risk of FTR, and nosocomial bloodstream
infections. Similarly, in intensive care facilities, a similar increase in staffing consistently
decreased rates of cardiopulmonary resuscitation, unplanned extubation, pulmonary
failure and nosocomial pneumonia.
In the USA, the Nursing Care Report card (1997) was developed to monitor nursing
care in acute care settings. It was based on data collected by state agencies in 1992
and 1994 from 502 hospitals in California, Massachusetts, and New York. The purpose
of the study was to quantify nurse staffing, patient incidents, and lengths of stay at the
hospitals, as well as the relationship between these variables. Upon evaluation, the
American Nurses Association (1997) found that preventable conditions, such as
pressure ulcers, pneumonia, post-operative infections and urinary tract infections were
inversely related to RN skill mix and nurse staffing. Similar results were found by
Kovner & Gergen (1998) and more recently, Cho et al. (2003). The Institute of Medicine
(2004) suggested that lower levels of nursing staff (especially RNs) are related to
increases in length of stay, hospital acquired infections and the incidence of pressure
ulcers. Tourangeau (2006) found that by increasing the percentage of RNs by 10%,
there were six fewer deaths for every 1000 discharged patients. In New Zealand an
increase in the percentage of RNs together with a decreased number of nursing hours
per patient per day increased negative patient outcomes (McCloskey & Diers, 2005).
Recently there has been a subtle change in language from OPSN to „nursing (or
„nurse‟) sensitive outcomes‟. This originated in the USA and is now seen to be the
accepted term (Kane et al., 2007; Person et al., 2004).
Accurate information about safe and optimal ward staffing catering to different
patient types is only possible on a ward-level shift-by-shift basis. Study at this level
gives a clearer understanding of the ward environment and its effect upon nursing
practice and patient outcomes. To date, few published studies have been based at the
ward level (Boyle, 2004; Diers, Bozzo, Blatt, & Roussel, 1998; Diers & Potter, 1997).
NURSING WORKLOAD AND STAFFING: IMPACT ON PATIENTS AND STAFF
UNIVERSITY OF TECHNOLOGY, SYDNEY 33
Context
The ACT is the smallest of Australia's six states and two territories, but has the
highest population density and is the only state or territory without a sea border. At 30
June 2006, the Australian Capital Territory (ACT) had an estimated resident population
of 334,200 persons, with the majority residing in Canberra and nearby surrounds. The
Canberra-Queanbeyan Statistical District had a population of 381,400 persons at June
2006. This is 1.8% of Australia's total population making it the eighth largest major
population centre in Australia, larger than the capital cities of Hobart and Darwin
(Australian Bureau of Statistics, 2007 -a, 2007 -b).
Public in-patient hospital services in the ACT are provided at The Canberra Hospital
and Calvary Public Hospital. In-patient hospital services for private patients in the ACT
are provided by Calvary Private Hospital, John James Memorial Hospital and the
National Capital Private Hospital. According to the Australian Institute of Health and
Welfare (AIHW, 2007), there were 72,136 public hospital separations in the ACT during
2005–06, 1.6% of the nearly 4.5 million public hospital separations nationally.
NURSING WORKLOAD AND STAFFING: IMPACT ON PATIENTS AND STAFF
34 STUDY DESIGN & ETHICS APPROVAL
2. Study Design & Ethics Approval
Study Design
The study was designed to include both longitudinal data extracted from
administrative data systems for the two year period and cross-sectional data collected
within this time frame for medical and surgical wards in ACT hospitals.
The longitudinal component of the study included:
Patient data extracted from the ACT Administrative Data
System for two years (2004-2006)
Nursing payroll (workforce) data where possible for the same
years and hospitals.
These data allow the determination of the relationship of nursing resources as paid
hours worked, to patient outcomes as Outcomes Potentially Sensitive to Nursing
(OPSN) (Needleman et al., 2001) controlling for casemix as AR-DRGs and hospital
type. The nursing payroll data allow specification of nursing resources by skill mix, in
the context of patient load as case type, patient volume, ward type (medical-surgical or
other).
The key aspects of the data collected from the cross-sectional sample of hospital
wards are:
Ward organisation/environmental characteristics
Nursing workload and environmental complexity
Nurse outcomes as intent to stay/leave present job or the
profession
Patient characteristics
Patient outcomes as adverse events that cannot be captured in
administrative data (falls with and without injury and medication
errors with and without consequences).
The use of two compatible methodologies provides a powerful design in which the
known inadequacies of administrative data can be balanced by the cross-sectional data
collection and the known issues of labour intensive but small sample data collection

NURSING WORKLOAD AND STAFFING: IMPACT ON PATIENTS AND STAFF
UNIVERSITY OF TECHNOLOGY, SYDNEY 35
can be informed by the use of large, longitudinal datasets (Jiang, Stocks, & Wong,
2006).
A conceptual model based in General Systems Theory guided the study. The model
is presented in Appendix 1. Both a process and an outcome approach were taken in
the study.
Ethics Approvals
Ethics approval was sought and gained from the Human Research Ethics
Committee, University of Technology, Sydney, from ACT Health and Community Care
Human Research Ethics Committee, and from Calvary Health Care ACT Human
Research Ethics Committee. Approval from all committees included cross-sectional
and longitudinal components of the study. Participants were assured that no individual
or ward would be identified in any report or publication derived from the study, although
it is not possible to disguise the two participating hospitals completely. Where data
were analysed and reported at ward level, wards were deideintified using alphanumeric
codes.
NURSING WORKLOAD AND STAFFING: IMPACT ON PATIENTS AND STAFF
36 SAMPLES & DATA COLLECTION
3. Samples and Data Collection
Longitudinal Component
The data sources for this study were owned by the two ACT hospitals involved; The
Canberra Hospital and Calvary Public Hospital. Data on patients were held by ACT
Health as part of its mandatory hospital morbidity collection and patient level ward
history data. Data pertaining to the nursing workforce, specifically nurse rostering and
payroll data were held by the two individual hospitals.
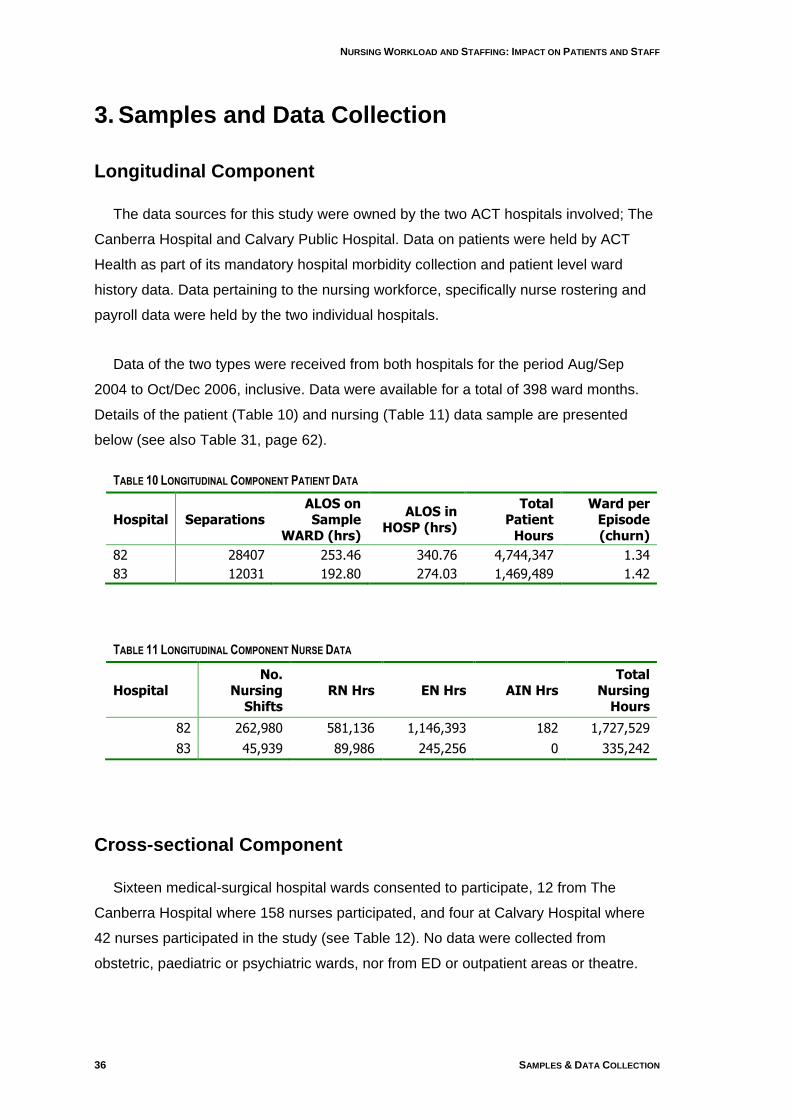
Data of the two types were received from both hospitals for the period Aug/Sep
2004 to Oct/Dec 2006, inclusive. Data were available for a total of 398 ward months.
Details of the patient (Table 10) and nursing (Table 11) data sample are presented
below (see also Table 31, page 62).
TABLE 10 LONGITUDINAL COMPONENT PATIENT DATA
Hospital Separations ALOS on Sample
WARD (hrs)
ALOS in HOSP (hrs)
Total Patient
Hours
Ward per Episode (churn)
82 28407 253.46 340.76 4,744,347 1.34
83 12031 192.80 274.03 1,469,489 1.42
TABLE 11 LONGITUDINAL COMPONENT NURSE DATA
Hospital No.
Nursing Shifts
RN Hrs EN Hrs AIN Hrs Total
Nursing Hours
82 262,980 581,136 1,146,393 182 1,727,529
83 45,939 89,986 245,256 0 335,242
Cross-sectional Component
Sixteen medical-surgical hospital wards consented to participate, 12 from The
Canberra Hospital where 158 nurses participated, and four at Calvary Hospital where
42 nurses participated in the study (see Table 12). No data were collected from
obstetric, paediatric or psychiatric wards, nor from ED or outpatient areas or theatre.
NURSING WORKLOAD AND STAFFING: IMPACT ON PATIENTS AND STAFF
UNIVERSITY OF TECHNOLOGY, SYDNEY 37
Data collection commenced on the 20 September 2006 at The Canberra Hospital
and 14 November at Calvary Hospital, and was completed by 12 October and 30
November 2006 respectively. Five experienced nurses were seconded from the
hospitals under study, and were trained to undertake data collection with support from
UTS staff. No eligible wards declined the invitation to participate. Each ward had one
week of data collection randomly assigned within the sampling period allocated for
each hospital.
Orientation sessions were held with each ward in the week before data collection
and nurses‟ consent obtained. Staff unable to attend and casual or agency staff were
given an information sheet, consent form and copy of the survey to complete and
return to a marked box at the nurses‟ station or by reply-paid post. Nurses were given a
study identification (ID) number. All nurses on the 16 nursing wards selected were
invited to participate.
The Nurse Survey captured information on nurse demographics, the work
environment and organisational attributes. At the end of each shift, nurses were asked
to complete the Environmental Complexity Scale which acquired information on ward
factors that influence nurses‟ ability to provide the required care for patients, in addition
to details of nursing interventions delayed or not done and indirect care activities. The
data collector completed the PRN-80 form which measured patient acuity daily for each
patient on the ward. This instrument lists nursing interventions that nurses complete
during a 24 hour period. This instrument provided the total minutes of care (later
converted to hours) required for that patient for the coming 24 hour period.
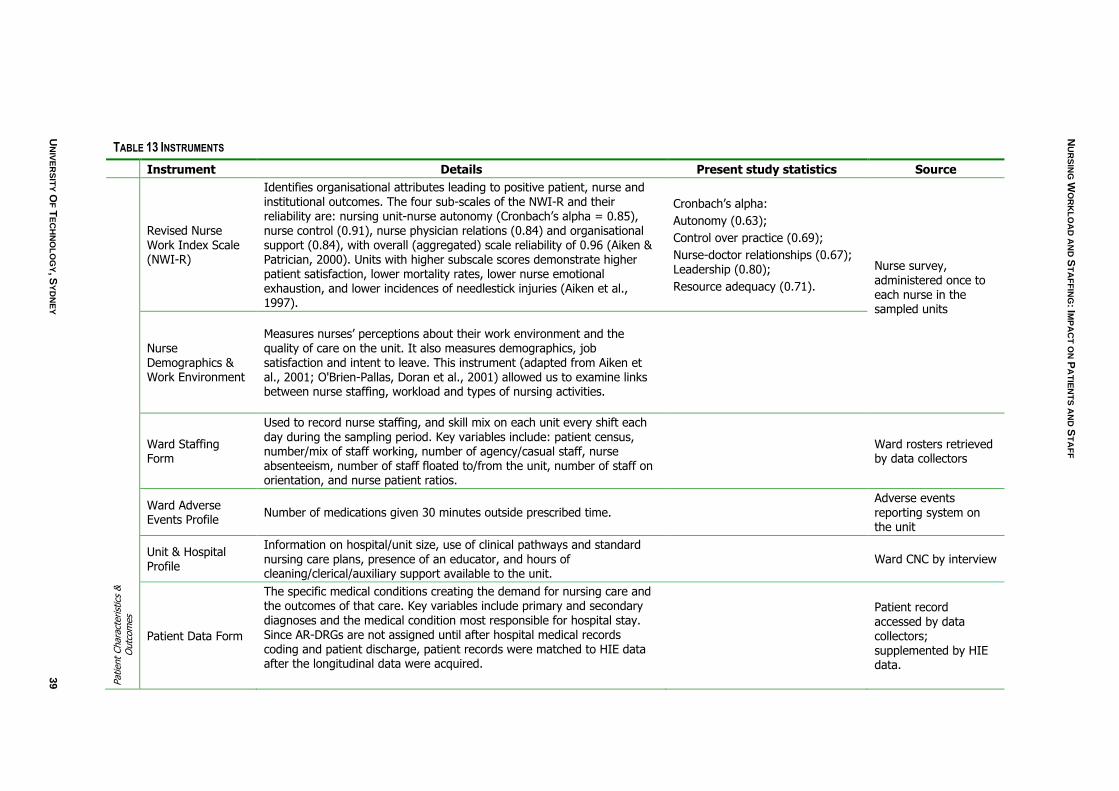
The data collector or the Clinical Nurse Consultant (CNC) completed the Daily Unit
Staffing Profile and Unit and Hospital Profile, providing roster data and information on
the ward. Table 13 (page 39) lists the instruments used in the cross-sectional part of
the study along with their psychometric properties and where appropriate, inter-rater
reliability (see also Appendix 7).
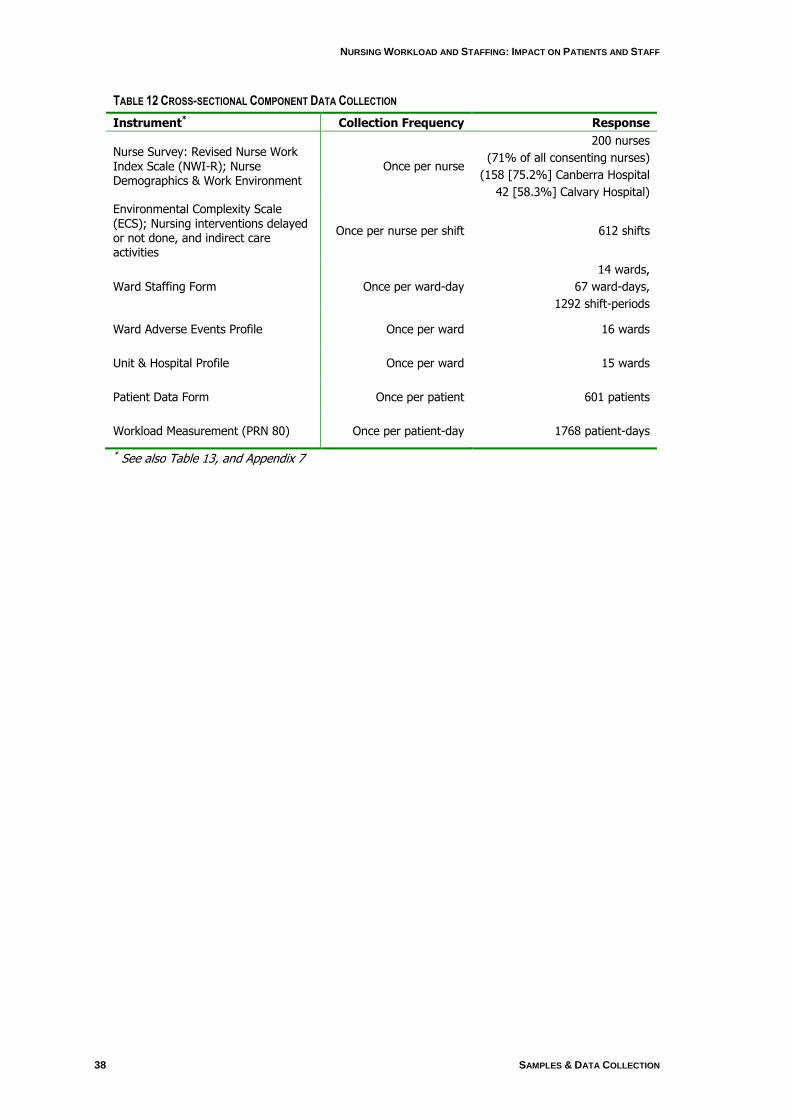
Table 12 outlines the details of cross-sectional data collection, and the number of
responses for each instrument. Two wards were not able to provide complete roster
data for the sample period, and one ward did not provide a unit profile. These wards
were omitted from description or analyses requiring those data. However, in order to
provide as complete a report as possible, data were included where available. The
number of wards used for each analysis or description is indicated.
NURSING WORKLOAD AND STAFFING: IMPACT ON PATIENTS AND STAFF
38 SAMPLES & DATA COLLECTION
TABLE 12 CROSS-SECTIONAL COMPONENT DATA COLLECTION
Instrument* Collection Frequency Response
Nurse Survey: Revised Nurse Work Index Scale (NWI-R); Nurse Demographics & Work Environment
Once per nurse
200 nurses
(71% of all consenting nurses)
(158 [75.2%] Canberra Hospital
42 [58.3%] Calvary Hospital)
Environmental Complexity Scale (ECS); Nursing interventions delayed or not done, and indirect care activities
Once per nurse per shift 612 shifts
Ward Staffing Form Once per ward-day
14 wards,
67 ward-days,
1292 shift-periods
Ward Adverse Events Profile Once per ward 16 wards
Unit & Hospital Profile Once per ward 15 wards
Patient Data Form Once per patient 601 patients
Workload Measurement (PRN 80) Once per patient-day 1768 patient-days
* See also Table 13, and Appendix 7
NU
RS
ING
WO
RK
LO
AD
AN
D S
TA
FF
ING
: IMP
AC
T O
N P
AT
IEN
TS
AN
D S
TA
FF
UN
IVE
RS
ITY
OF
TE
CH
NO
LO
GY, S
YD
NE
Y
39
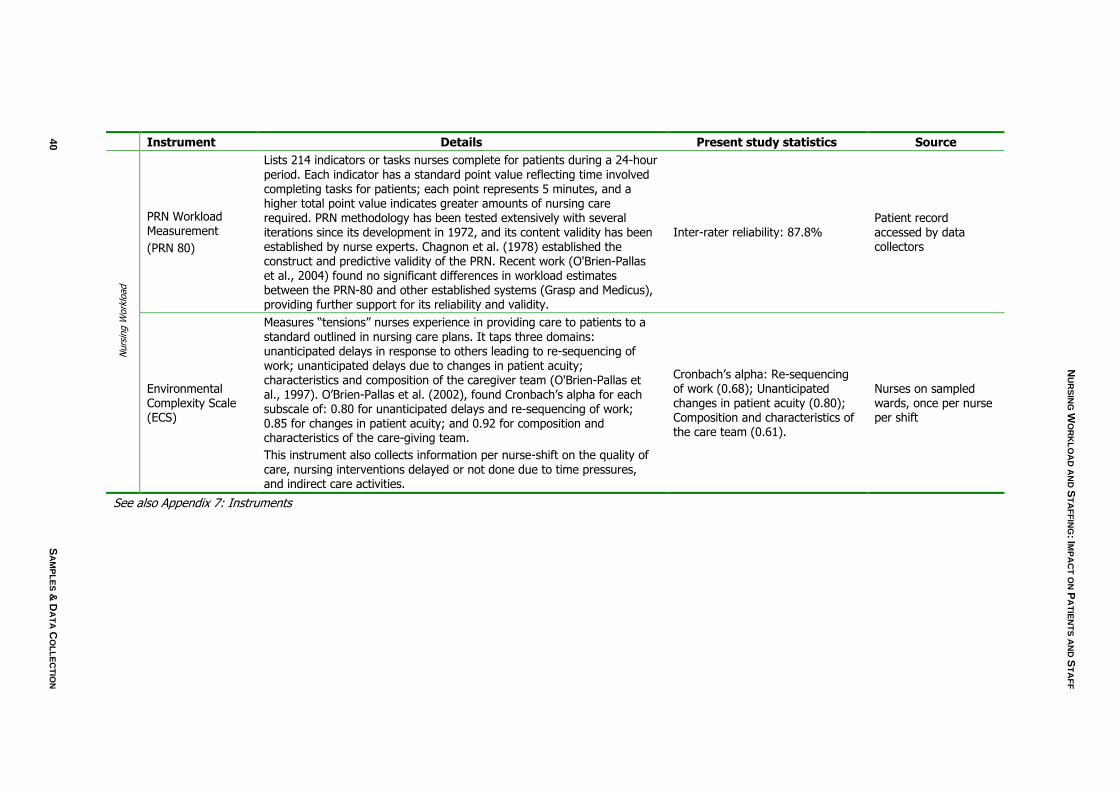
TABLE 13 INSTRUMENTS
Instrument Details Present study statistics Source
Revised Nurse Work Index Scale (NWI-R)
Identifies organisational attributes leading to positive patient, nurse and institutional outcomes. The four sub-scales of the NWI-R and their reliability are: nursing unit-nurse autonomy (Cronbach‟s alpha = 0.85), nurse control (0.91), nurse physician relations (0.84) and organisational support (0.84), with overall (aggregated) scale reliability of 0.96 (Aiken & Patrician, 2000). Units with higher subscale scores demonstrate higher patient satisfaction, lower mortality rates, lower nurse emotional exhaustion, and lower incidences of needlestick injuries (Aiken et al., 1997).
Cronbach‟s alpha:
Autonomy (0.63);
Control over practice (0.69);
Nurse-doctor relationships (0.67); Leadership (0.80);
Resource adequacy (0.71).
Nurse survey, administered once to each nurse in the sampled units
Nurse Demographics & Work Environment
Measures nurses‟ perceptions about their work environment and the quality of care on the unit. It also measures demographics, job satisfaction and intent to leave. This instrument (adapted from Aiken et al., 2001; O'Brien-Pallas, Doran et al., 2001) allowed us to examine links between nurse staffing, workload and types of nursing activities.
Ward Staffing Form
Used to record nurse staffing, and skill mix on each unit every shift each day during the sampling period. Key variables include: patient census, number/mix of staff working, number of agency/casual staff, nurse absenteeism, number of staff floated to/from the unit, number of staff on orientation, and nurse patient ratios.
Ward rosters retrieved by data collectors
Ward Adverse Events Profile
Number of medications given 30 minutes outside prescribed time. Adverse events reporting system on the unit
Unit & Hospital Profile
Information on hospital/unit size, use of clinical pathways and standard nursing care plans, presence of an educator, and hours of cleaning/clerical/auxiliary support available to the unit.
Ward CNC by interview
Patient
Chara
cterist
ics
&
Outc
om
es
Patient Data Form
The specific medical conditions creating the demand for nursing care and the outcomes of that care. Key variables include primary and secondary diagnoses and the medical condition most responsible for hospital stay. Since AR-DRGs are not assigned until after hospital medical records coding and patient discharge, patient records were matched to HIE data after the longitudinal data were acquired.
Patient record accessed by data collectors; supplemented by HIE data.
NU
RS
ING
WO
RK
LO
AD
AN
D S
TA
FF
ING
: IMP
AC
T O
N P
AT
IEN
TS
AN
D S
TA
FF
40
S
AM
PL
ES
& D
AT
A C
OL
LE
CT
ION
Instrument Details Present study statistics Source
Nurs
ing W
ork
load
PRN Workload Measurement
(PRN 80)
Lists 214 indicators or tasks nurses complete for patients during a 24-hour period. Each indicator has a standard point value reflecting time involved completing tasks for patients; each point represents 5 minutes, and a higher total point value indicates greater amounts of nursing care required. PRN methodology has been tested extensively with several iterations since its development in 1972, and its content validity has been established by nurse experts. Chagnon et al. (1978) established the construct and predictive validity of the PRN. Recent work (O'Brien-Pallas et al., 2004) found no significant differences in workload estimates between the PRN-80 and other established systems (Grasp and Medicus), providing further support for its reliability and validity.
Inter-rater reliability: 87.8% Patient record accessed by data collectors
Environmental Complexity Scale (ECS)
Measures “tensions” nurses experience in providing care to patients to a standard outlined in nursing care plans. It taps three domains: unanticipated delays in response to others leading to re-sequencing of work; unanticipated delays due to changes in patient acuity; characteristics and composition of the caregiver team (O'Brien-Pallas et al., 1997). O‟Brien-Pallas et al. (2002), found Cronbach‟s alpha for each subscale of: 0.80 for unanticipated delays and re-sequencing of work; 0.85 for changes in patient acuity; and 0.92 for composition and characteristics of the care-giving team.
This instrument also collects information per nurse-shift on the quality of care, nursing interventions delayed or not done due to time pressures, and indirect care activities.
Cronbach‟s alpha: Re-sequencing of work (0.68); Unanticipated changes in patient acuity (0.80); Composition and characteristics of the care team (0.61).
Nurses on sampled wards, once per nurse per shift
See also Appendix 7: Instruments
NURSING WORKLOAD AND STAFFING: IMPACT ON PATIENTS AND STAFF
UNIVERSITY OF TECHNOLOGY, SYDNEY 41
Data Analysis
Longitudinal Analysis
The aim of this research was to study the relationship between nursing inputs and
patient needs (e.g. nursing workload) with a focus on outcome measures as a means
of assessing the adequacy of care. The data were longitudinal, allowing assessment of
variation in the relationship over time and hence an assessment of the relative
adequacy of nurse staffing levels at various times during the study period. It related to
two public institutions and a number of ward areas in each, allowing a degree of
generalisation to a range of circumstances arising on a ward.
The methods used in the research employ controlling for workload (through AR-
DRG casemix and activity variables) and then reviewing the impacts of staffing level.
That is, it considers the impact of changes in staffing and skill-mix relative to a “fixed”
workload. However it also offers a method for determining what staffing has been more
or less successful for a given workload from a range of workloads encountered during
the study period.
Data Preparation
Two types of patient data were requested from ACT Health. The first were coded
morbidity records at patient episode of care level. These data, known as admitted
patient care data, were provided in the format shown in Appendix 2. These gave data
elements such as hospital of treatment, start and end dates and times for the episode
of treatment, basic demographic information on the patient, along with diseases and
procedures as coded under the Australian version of the International Classification of
Diseases (ICD-10-AM) 5th Ed. and the Australian Classification of Health Interventions
(ACHI) 5th Ed. respectively. In addition, information was available on mode of
separation/type of ending of episode. The data also uniquely identified each episode of
care without identifying the patient.
The second type of patient data, termed ward history data, was provided in the
format shown in Appendix 3. These identified ward area, start and end times and a
unique morbidity data identifier of every patient having contact with the ward (and its
staff). It should be noted that short absences from the ward do not generate new ward
episode data, however prolonged absences such as visits to theatre and recovery, do.
NURSING WORKLOAD AND STAFFING: IMPACT ON PATIENTS AND STAFF
42 FINDINGS
All records in the admitted patient care data were linked to the ward episode data to
provide a detailed ward history of the patient.
Data on nurse rostering and payroll for particular wards were provided by the two
study hospitals. These came from the computerised nurse rostering systems
(PROACT) in two formats, both reflecting the actual assignment of nurses to ward
areas rather than the planned assignment. The roster data included information on the
skill level of each nurse on a shift as well as their start and finish times. The nursing
data and patient data were then linked by ward to provide a detailed patient and nurse
profile for the ward. Although the ward identifiers used in the nursing data were not a
direct match to the ward identifiers used in the ward history collection, links could be
made between the two. These links were either made or confirmed by the staff of the
hospitals, project staff in the field or information systems staff in ACT Health. The links
settled on are in Appendix 4. There was an inconsistency in the data as originally
matched, which was resolved by combining two ward areas (ward codes 1AF & 1AI in
The Canberra Hospital).
The roster data reflected the shifts of nurses working on a ward during a given pay
period. However, for both the staffing and patient data, the focus of the study was the
wards and the events occurring there. Therefore the data were reorganised to be a
sequence of events of specified nature occurring at a specified time on the ward, for
example, the commencement of a shift by a RN qualified staff member or the transfer
to the ward of a patient in a particular AR-DRG with a particular number of hours
already spent in hospital. These reorganised data are referred to technically as
transaction records, but we treated and referred to them as Time Series. Time series
data allowed the construction of measures that could be used to assess changes in
workload. This included cumulative patient hours spent on the ward, and patient hours
spent in hospital before admission to the ward, or after discharge from the ward.
Similarly, for nursing data, measures included a cumulative count of nurses being
rostered on and off the ward, as well as the number of hours worked by the nurses.
Patient data covered a wider range of wards (n = 76), compared to the nursing data
(n =15). All wards from the nursing data were matched to corresponding patient data.
Data from wards 1AF and 1AI (Hospital 82) were combined and treated as a single
ward. In total a full nursing and patient profile was able to be provided for 14 wards
areas listed below.
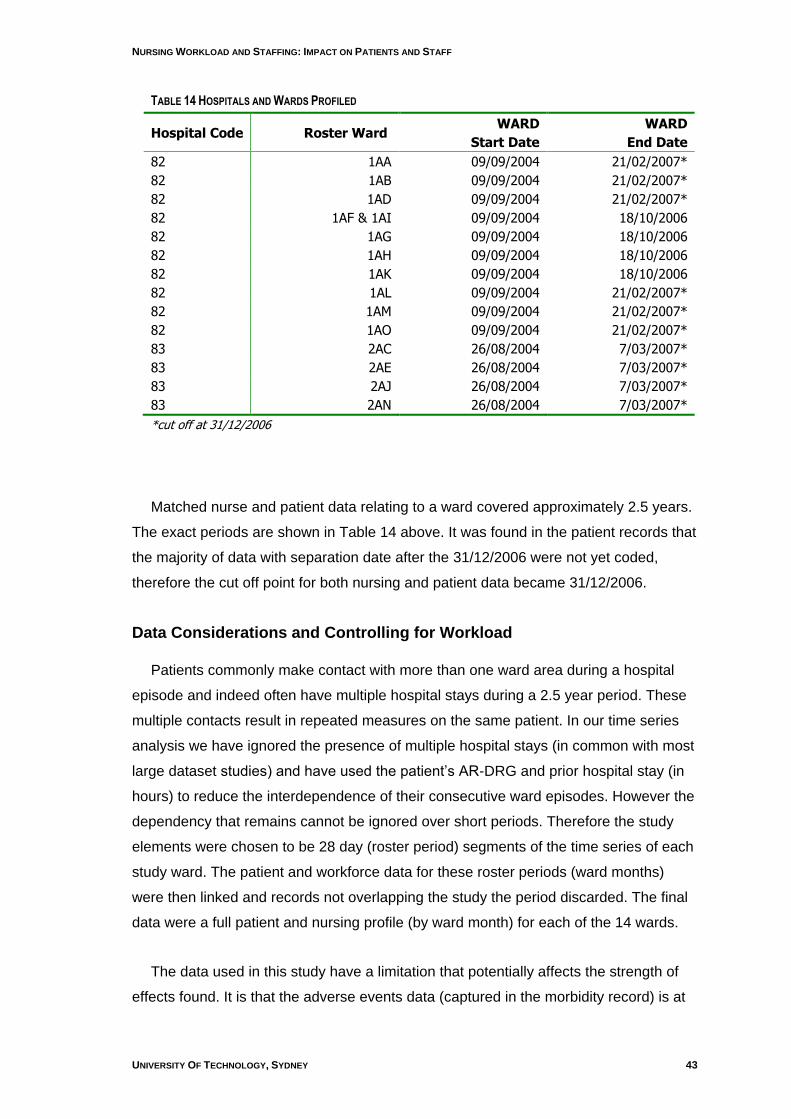
NURSING WORKLOAD AND STAFFING: IMPACT ON PATIENTS AND STAFF
UNIVERSITY OF TECHNOLOGY, SYDNEY 43
TABLE 14 HOSPITALS AND WARDS PROFILED
Hospital Code Roster Ward WARD
Start Date
WARD
End Date
82 1AA 09/09/2004 21/02/2007*
82 1AB 09/09/2004 21/02/2007*
82 1AD 09/09/2004 21/02/2007*
82 1AF & 1AI 09/09/2004 18/10/2006
82 1AG 09/09/2004 18/10/2006
82 1AH 09/09/2004 18/10/2006
82 1AK 09/09/2004 18/10/2006
82 1AL 09/09/2004 21/02/2007*
82 1AM 09/09/2004 21/02/2007*
82 1AO 09/09/2004 21/02/2007*
83 2AC 26/08/2004 7/03/2007*
83 2AE 26/08/2004 7/03/2007*
83 2AJ 26/08/2004 7/03/2007*
83 2AN 26/08/2004 7/03/2007*
*cut off at 31/12/2006
Matched nurse and patient data relating to a ward covered approximately 2.5 years.
The exact periods are shown in Table 14 above. It was found in the patient records that
the majority of data with separation date after the 31/12/2006 were not yet coded,
therefore the cut off point for both nursing and patient data became 31/12/2006.
Data Considerations and Controlling for Workload
Patients commonly make contact with more than one ward area during a hospital
episode and indeed often have multiple hospital stays during a 2.5 year period. These
multiple contacts result in repeated measures on the same patient. In our time series
analysis we have ignored the presence of multiple hospital stays (in common with most
large dataset studies) and have used the patient‟s AR-DRG and prior hospital stay (in
hours) to reduce the interdependence of their consecutive ward episodes. However the
dependency that remains cannot be ignored over short periods. Therefore the study
elements were chosen to be 28 day (roster period) segments of the time series of each
study ward. The patient and workforce data for these roster periods (ward months)
were then linked and records not overlapping the study the period discarded. The final
data were a full patient and nursing profile (by ward month) for each of the 14 wards.
The data used in this study have a limitation that potentially affects the strength of
effects found. It is that the adverse events data (captured in the morbidity record) is at
NURSING WORKLOAD AND STAFFING: IMPACT ON PATIENTS AND STAFF
44 FINDINGS
hospital episode level and does not attribute an event time or place. Therefore such
occurrences were attributed to a ward area in proportion to exposure. We felt biases
could arise through the transfer of “injured” patients from one ward area (for example a
short stay ward) to another ward area where they recovered. Therefore we controlled
for ward workloads during the contact period and placed the staffing in the role of
experimental variable.
The controlling approach used was based on clusters methodology. There were two
matchings of ward month used. The first, the load cluster, was based on the profile of
the ward months measured through:
Total patient hours for each AR-DRG
Total admissions to ward for each AR-DRG
Total hours in hospital before admission to ward for each AR-DRG
Total patient hours (a redundant variable used for consolidation)
Total ward separations
The second clustering was by assess cluster which matched ward months on a
profile of:
Total admissions to ward for each AR-DRG
Total hours in hospital before admission to ward for each AR-DRG
These methods produce relatively similar “clusters” of wards by the clinical
characteristics embedded in AR-DRGs and are therefore a form of “risk adjustment.”
Both these matchings ignore the size of the wards; they only use the patterns in the
profile variables. Other statistical controlling techniques, such as linear regression and
casemix index methodology, were used within clusters to strengthen the analyses
reported below.
The Outcome Measures
A recent development in the nursing literature has been the adoption of statistical
measures referred to as Outcomes Potentially Sensitive to Nursing (OPSN). The
OPSN algorithms were originally developed by Needleman and Buerhaus (2001). Dr
Barbara McCloskey developed the cross walks from the American ICD-9 to the
Australian/NZ ICD-10 for use with New Zealand data (McCloskey and Diers, 2005).
The OPSN definitions can be found in Appendix 5. Mapping tables from the National
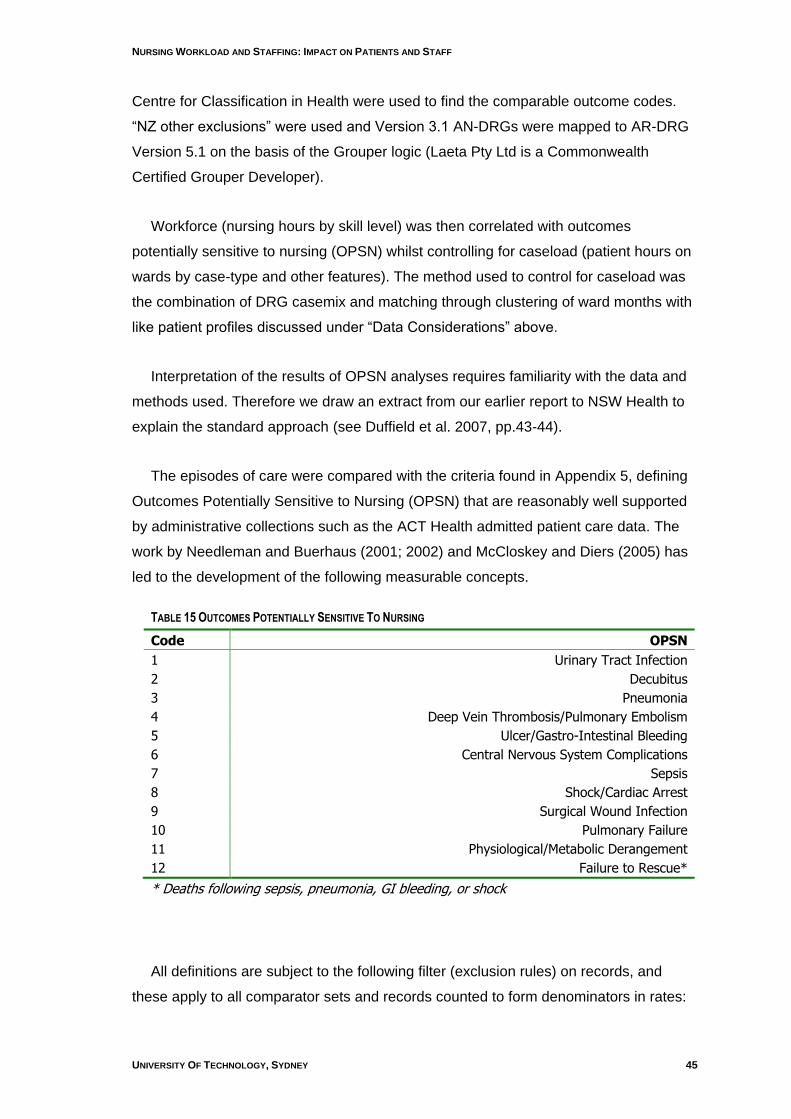
NURSING WORKLOAD AND STAFFING: IMPACT ON PATIENTS AND STAFF
UNIVERSITY OF TECHNOLOGY, SYDNEY 45
Centre for Classification in Health were used to find the comparable outcome codes.
“NZ other exclusions” were used and Version 3.1 AN-DRGs were mapped to AR-DRG
Version 5.1 on the basis of the Grouper logic (Laeta Pty Ltd is a Commonwealth
Certified Grouper Developer).
Workforce (nursing hours by skill level) was then correlated with outcomes
potentially sensitive to nursing (OPSN) whilst controlling for caseload (patient hours on
wards by case-type and other features). The method used to control for caseload was
the combination of DRG casemix and matching through clustering of ward months with
like patient profiles discussed under “Data Considerations” above.
Interpretation of the results of OPSN analyses requires familiarity with the data and
methods used. Therefore we draw an extract from our earlier report to NSW Health to
explain the standard approach (see Duffield et al. 2007, pp.43-44).
The episodes of care were compared with the criteria found in Appendix 5, defining
Outcomes Potentially Sensitive to Nursing (OPSN) that are reasonably well supported
by administrative collections such as the ACT Health admitted patient care data. The
work by Needleman and Buerhaus (2001; 2002) and McCloskey and Diers (2005) has
led to the development of the following measurable concepts.
TABLE 15 OUTCOMES POTENTIALLY SENSITIVE TO NURSING
Code OPSN
1 Urinary Tract Infection
2 Decubitus
3 Pneumonia
4 Deep Vein Thrombosis/Pulmonary Embolism
5 Ulcer/Gastro-Intestinal Bleeding
6 Central Nervous System Complications
7 Sepsis
8 Shock/Cardiac Arrest
9 Surgical Wound Infection
10 Pulmonary Failure
11 Physiological/Metabolic Derangement
12 Failure to Rescue*
* Deaths following sepsis, pneumonia, GI bleeding, or shock
All definitions are subject to the following filter (exclusion rules) on records, and
these apply to all comparator sets and records counted to form denominators in rates:
NURSING WORKLOAD AND STAFFING: IMPACT ON PATIENTS AND STAFF
46 FINDINGS
MDC = 14,15,19 or 20 (maternity, newborn, mental illness, substance abuse)
Paediatrics (i.e. age <18)
LOS < 1 day
LOS > 90 days
Error DRGs (i.e. DRG = 961Z, 962Z, 963Z)
Each OPSN category is supported by a list of ICD-10 diagnosis codes (some also
include ACHI surgery codes) for inclusion of cases, and a set of exclusion rules that
apply to both the codes selected for the presence of codes and those in scope of the
concept (denominator). For example Category 1, UTI, is defined as either diagnoses
N39.0 or T83.5 or as a secondary diagnosis (but not as a primary diagnosis) and the
case is not grouped to any of MDC 11 through to MDC 15 inclusive nor to MDC19 or
MDC 20 (mental illness and substance abuse), and nor is the rubric of the principal
diagnosis A40, or A41. Another simple OPSN is Category 9, surgical wound infection,
where either of the diagnosis codes T79.3 or T81.4 appears as a secondary diagnosis,
but neither as a principal diagnosis gives membership of the category. See Appendix 4
for detailed definition of category membership. The denominators used to form the
rates for either of these indicators are the count of cases restricted to the same set of
MDCs and with the principal diagnosis being other than one excluded by the OPSNs
definition. In practice, the both the Numerator and Denominator counts are restricted to
being either of medical or surgical DRGs and a medical and a surgical version of the
OPSN is produced. Failure to rescue (FTR) is death following an adverse event of
sepsis, pneumonia, GI bleeding, or shock (Silber et al., 1995; Silber et al., 1992),
Therefore the denominator is the count of these particular adverse events.
OPSN have been investigated in a number of studies (Beurhaus, 1999; McCloskey
& Diers, 2005; Needlemen et al., 2001, 2002). They were also investigated in the
recent NSW report by our team.
The analysis of OPSN is complicated in these data, and in general, because the
measures were initially intended to be applied at hospital level to quite similar hospitals,
or the same hospital over a number of time periods. However we bring the analysis to
bear on the units of our study, ward months. One of the most immediate consequences
of this shift is that the casemix seen on a ward will affect the rate of adverse outcomes
in an unbalanced way. Therefore we used the load cluster to match ward months.
NURSING WORKLOAD AND STAFFING: IMPACT ON PATIENTS AND STAFF
UNIVERSITY OF TECHNOLOGY, SYDNEY 47
Another technical complication arises in the analysis of OPSN because the rates of
these events in a typical ward over a 28 day period are numerically low, so that the
counts of events do not suit Analysis of Variance based on the Normal Distribution. The
Statistical literature contains a number of relevant examples of analyses of counts data
based on Generalised Linear Modelling – with Poisson distribution. In particular SPSS
Version 15.0 has implemented the approach so that it could be applied to our OPSN
data. We needed to replace the OPSN values by their nearest integer value because
the Poisson method expects count data.
OPSN analyses were performed using Generalised Linear Modelling – with Poisson
distribution. A range of different models were tested using the following factors:
Cluster
Cluster, NH:PH
Cluster, RN:PH, EN:PH
Cluster, RN:NH
Cluster, RN:NH, NH:PH
Cluster, RN:NH, RN:PH
Cluster, RN:NH, RN:PH, EN:PH
Where Cluster = group which the ward month falls into dependent upon the number of hours of care by each AR-DRG etc
NH = total nursing hours
PH = total patient hours
RN: total hours worked by Registered Nurses
EN: total hours worked by Enrolled Nurses
The best model for each individual OPSN was selected dependent upon the
significance of the Omnibus test, and Model Effects Type III Chi-Square results
(produced by SPSS Version 15 (SPSS Inc., 2006)). Once the best model was chosen,
the direction of the parameter estimates was noted. This indicated whether the
parameter was having a positive or negative effect on the incidence of OPSN.
Review of the SPSS output made it clear that the effect of rounding the OPSN may
affect findings, so a subsidiary testing process was put in place. This secondary
approach was guided by the standard method for testing the difference of proportions
and by the Gauss Markov Theorem. We only applied it to testing for RN Proportion
Effect.
NURSING WORKLOAD AND STAFFING: IMPACT ON PATIENTS AND STAFF
48 FINDINGS
We start by taking the underlying rate for an OPSN in a ward month to be that of its
load cluster under the null hypothesis that only Cluster has an effect. This is estimated
by summing the OPSN across the cluster, summing the patient hours on ward across
the cluster and then dividing the former by the latter. We then predict the number of
OPSN for each ward month by multiplying its estimated underlying rate by its patient
hours on ward. In keeping with the standard tests of proportions we then divide each
ward month‟s OPSN number by its predicted value.
It is at this point we bring Gauss Markov and the underlying Poisson distribution to
bear and weighted each ward month ratio by the square root of its predicted value. If
RN proportion has no effect, each weighted ratio (GME) is an unbiased, unit variance
predictor of unity. Under the null hypotheses there will be no regression of GME on RN
proportion. Under the alternative there will be and negative slope will be associated
with better outcomes. The actual testing process included a modification, which was to
conduct the regression while controlling for cluster effects. The latter could be induced
by the differing RN proportion across Cluster, and hence needed to be controlled for.
An important methodological point here is that while this second approach does not
take full advantage of the Poisson error distribution, use is made of Gauss Markov.
Further, under the Poisson analysis our model for the parameter b is not identified: the
absolute size of the anti-logged cluster effects is completely confounded with the
absolute value of b. We also found it necessary to adopt some sample statistics for the
cluster effects when the largest attributed OPSN count was less than 0.5 for a whole
Cluster. We conducted the follow up test described above to strengthen our findings
and report these results along with the formal method results.
Poisson analysis allows the assessment of the statistical significance of a factor and
the direction of its effect, but not a readily interpretable measure of its size. This gap in
understanding needs to be filled using other methods. The follow-up testing approach
assists in this but is biased by the weighting applied to form GME. In addition the
clusters have different average proportions of RN hours say. However use of the
General Linear Model with fixed effects of Cluster, Intercept set to zero and weighted
least squares (using the expected OPSN number as weight variable) offers an
approximate approach consistent with the Gauss Markov based approach. This follows
from the fact that the unweighted ratios are unbiased estimators of 1 with variance
equal to the inverse of the variance of the observed value.
NURSING WORKLOAD AND STAFFING: IMPACT ON PATIENTS AND STAFF
UNIVERSITY OF TECHNOLOGY, SYDNEY 49
The regression slope for an experimental variable in this new type of analysis needs
interpretation which we now offer. If b is the regression parameter for RN hours as a
proportion of nursing hours (for example), then we see the effect of increasing the RN
hours proportion by 10% as changing the rate of the OPSN by b times 10%. So if b
were -3 then a 10% increase in the RN hours proportion would reduce the rate of the
OPSN to 70% of its current value.
In this report we extend our investigations to include length of hospital stay (LOS) as
an OPSN variable. LOS is responsive to the quality of nursing care (as well as other
factors) and therefore ward months associated with patients who have longer than
expected stays may also be those where the quality of nursing care is lower.
One of the obvious factors affecting LOS is the patient‟s illness and medical
intervention. These are not nursing dependent. Therefore LOS as an OPSN needs to
be controlled for the patient‟s AR-DRG V5.1. The standard approach for doing this is to
form casemix indices, where the LOS performance of a particular ward is compared
with that to be expected if it had the same average LOS for each AR-DRG as seen in
the whole dataset. Another method for dealing with these factors is by matching ward
months (through load clusters) before considering the effects of nurse staffing and skill
mix. To be particularly careful, we combined these approaches and a further linear
regression approach to adjust for prior exposure to risk.
ALOS as an OPSN Methodology
As discussed above, each ward month had been assigned to a load cluster and an
assess cluster. Taking each assess cluster at a time, casemix adjusted indices for both
the time spent in hospital before encountering a ward month and time spent in hospital
after contact with the ward month were calculated. The use of casemix adjustment
within assess cluster was to make sure LOS precursors and outcomes were being
compared like with like.
The next step was conducted load cluster by load cluster, thereby controlling for
workload on the ward at the time of the assess cluster patient contacts. The within load
cluster processing was the conduct of linear regression involving the logarithms of
indices calculated in the previous step. These indices were each ward month‟s index
for after contact hours of stay (After Index) and its index of before contact hours of stay
NURSING WORKLOAD AND STAFFING: IMPACT ON PATIENTS AND STAFF
50 FINDINGS
(Before Index). The regression predicted the logarithm of After Index based on the
logarithm of Before Index.
After the regressions had been run for each load cluster, it was possible to calculate
the difference between each ward month‟s observed logarithm of After Index and its
predicted value. These residuals are referred to as performances. The anti-logarithm of
a performance provides a measure of the care hours after ward contact as a proportion
of the care after contact expected in a ward in the same assess cluster, in the same
load cluster, with the same casemix and the same patient pre-contact history.
The methodology for assessing the effects of nursing hours per patient hour, and
proportion of RN nursing care hours could thus be based on the correlations and
regressions of performance on the experimental variables. It was safe to assume that
the statistical dependence between the ward months‟ performance statistics could be
ignored as there were many raw data points and 398 ward months.
Cross-sectional Analysis
Cross-sectional data were entered into a Microsoft Access (Microsoft Corporation,
2003) database and extracted to SPSS versions 14 and 15 (SPSS Inc., 2005, 2006) for
analysis. Where data were missing at the patient or nurse level, they were imputed as
the ward mean calculated from the non-missing values on that ward. Where more than
10% of data were missing at the patient or nurse level, that variable was not used in
regression analyses. Complete staffing data were not available on two wards. These
wards were consequently excluded from analyses that used staffing data.
Subscale scores and alpha reliabilities for the instruments used were generated
using syntax provided from the Canadian study (O'Brien-Pallas et al., 2004).
Correlation analysis (Pearson‟s r or Kendall‟s tau b [τ], depending on the nature of the
data (Sheshkin, 2000) was used to explore relationships between variables at the
individual and ward level. Data collected at the patient and nurse level were
aggregated to ward level for some analyses, using mean values, rates or proportions.
Some patient level data were converted to percentage of patients per ward, for
example, adverse patient outcomes such as falls and medication errors.
In similar studies, multilevel modelling (MLM) has been used for analysis of
hierarchical or clustered data (Duffield et al., 2007; H. Goldstein, 2003). That approach
NURSING WORKLOAD AND STAFFING: IMPACT ON PATIENTS AND STAFF
UNIVERSITY OF TECHNOLOGY, SYDNEY 51
is considered appropriate where some variables are measured at the individual level
(patient or nurse) and others measured at the ward level. Data are therefore not
aggregated, but rather retained at the measurement level. However, the number of
wards with complete data in this study (14) does not provide sufficient statistical power
to undertake this type of analysis. Data were therefore used at the most appropriate
level of aggregation for each analysis.
Some data from the Environmental Complexity Scale (ECS) in the cross-sectional
component were further analysed at the „shift-period‟ level (see Table 6, page 25). In
this case, hours of nursing care data were apportioned to three conventional time
periods: morning (0700-1500); evening (1500-2300 hours) and night (2300-0700
hours), using the individual nurses‟ shift start and end times.
For all regression modelling explanatory variables were added in sequence to the
statistical models. The order of entry of variables into the statistical modelling process
was consistent with the theoretical framework described in Appendix 1. In order to
address potential multicollinearity, a univariate regression analysis on each individual
explanatory variable identified all significant predictors, and a factor analysis was
conducted. This identified 17 variable groupings. The significant univariate predictors
were then identified within the different groups. All predictor variables for each outcome
variable were put into a stepwise regression model, whereby the properties of each
model were compared to the previous one using the -2 Log Likelihood value. The
output for that model was then considered in terms of its position among the 17
components to ensure that any two predictor variables did not fall into the same group.
In order to compare the relative contributions of the independent variables to the
models, beta (β) weights were calculated. In the case of linear models, the adjusted R2
value was also calculated to provide an estimate of overall model fit (see also
Glossary, page 22).
Linear regression models for tasks delayed and not done were developed with data
at the ward-day level. This level of data provides outcome variables that are an
aggregate of responses for that ward for that day. Analysis at this level of data for
these outcomes is more meaningful as it accounts for the overall picture of the ward for
a given day, and the impact of workload and other variables for that period.
Analyses for the nurse outcome variables job satisfaction, satisfaction with nursing,
and intention to leave the current job, were conducted with these variables measured
NURSING WORKLOAD AND STAFFING: IMPACT ON PATIENTS AND STAFF
52 FINDINGS
at the nurse level. Data collected at shift level (Environmental Complexity Scale) were
aggregated to nurse level to permit matching with nurse data. However, not all data
could be matched, leaving a reduced dataset of 149 cases. As these outcomes are
dichotomous, logistic regression models were developed.
In summary, longitudinal data were examined for changes in the relationship
between the amount and type of nursing resources and OPSNs across the two year
period, at a ward level. Cross-sectional data were analysed for relationships between
variables, and models were developed to determine the variables that significantly
impact on outcomes. Comparison with similar research in NSW was made where data
were available, either as overall figures or by hospital grouping. Where possible in both
components of the study, estimates of the strength of each model and of the relative
contribution of each variable were calculated.
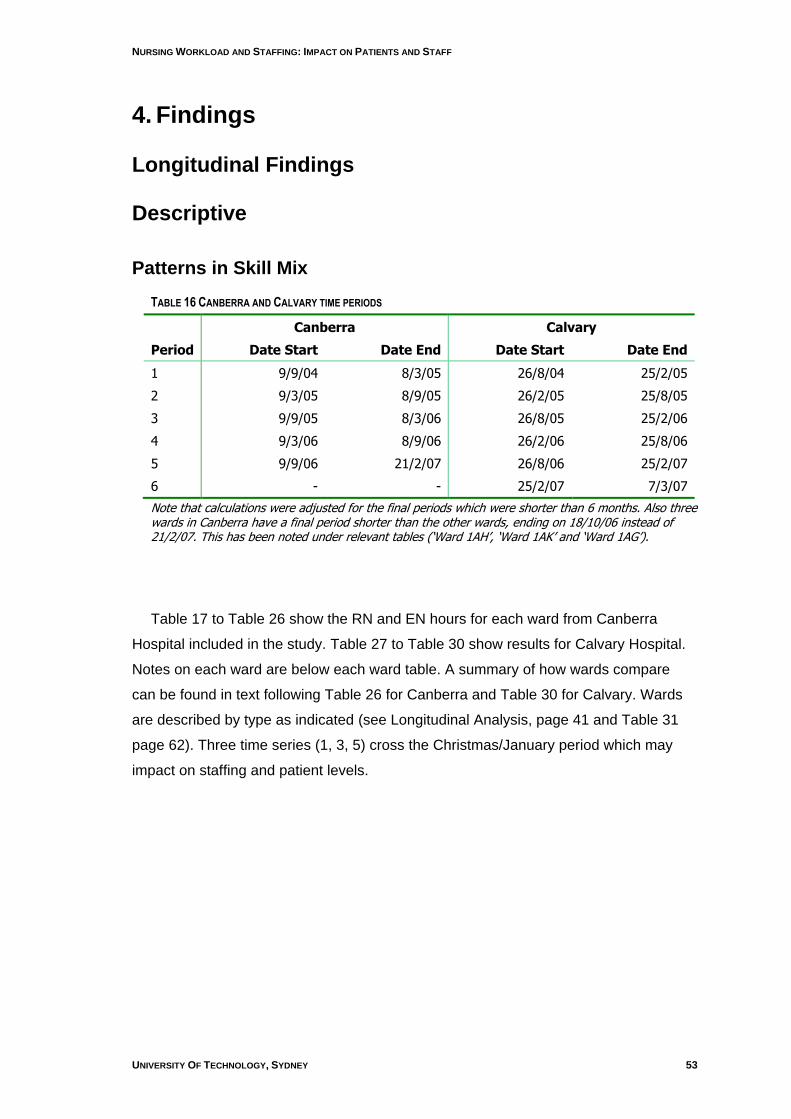
NURSING WORKLOAD AND STAFFING: IMPACT ON PATIENTS AND STAFF
UNIVERSITY OF TECHNOLOGY, SYDNEY 53
4. Findings
Longitudinal Findings
Descriptive
Patterns in Skill Mix
TABLE 16 CANBERRA AND CALVARY TIME PERIODS
Canberra Calvary
Period Date Start Date End Date Start Date End
1 9/9/04 8/3/05 26/8/04 25/2/05
2 9/3/05 8/9/05 26/2/05 25/8/05
3 9/9/05 8/3/06 26/8/05 25/2/06
4 9/3/06 8/9/06 26/2/06 25/8/06
5 9/9/06 21/2/07 26/8/06 25/2/07
6 - - 25/2/07 7/3/07
Note that calculations were adjusted for the final periods which were shorter than 6 months. Also three wards in Canberra have a final period shorter than the other wards, ending on 18/10/06 instead of 21/2/07. This has been noted under relevant tables („Ward 1AH‟, „Ward 1AK‟ and „Ward 1AG‟).
Table 17 to Table 26 show the RN and EN hours for each ward from Canberra
Hospital included in the study. Table 27 to Table 30 show results for Calvary Hospital.
Notes on each ward are below each ward table. A summary of how wards compare
can be found in text following Table 26 for Canberra and Table 30 for Calvary. Wards
are described by type as indicated (see Longitudinal Analysis, page 41 and Table 31
page 62). Three time series (1, 3, 5) cross the Christmas/January period which may
impact on staffing and patient levels.
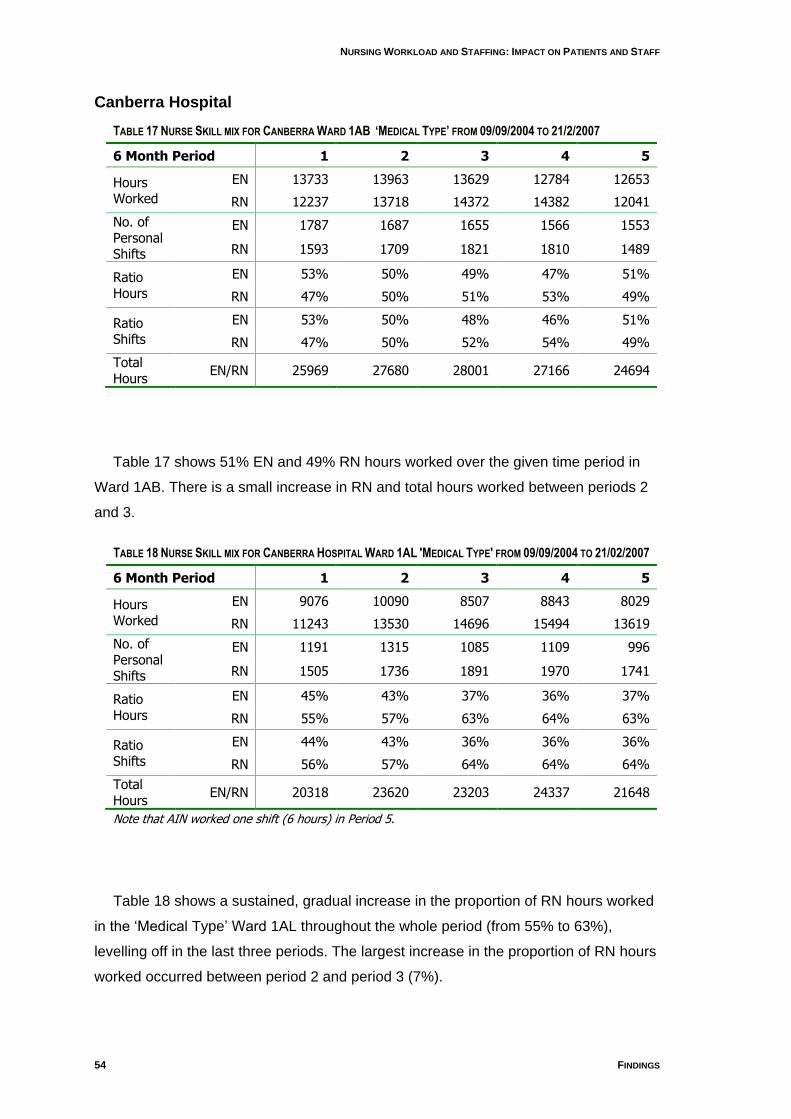
NURSING WORKLOAD AND STAFFING: IMPACT ON PATIENTS AND STAFF
54 FINDINGS
Canberra Hospital
TABLE 17 NURSE SKILL MIX FOR CANBERRA WARD 1AB ‘MEDICAL TYPE’ FROM 09/09/2004 TO 21/2/2007
6 Month Period 1 2 3 4 5
Hours Worked
EN 13733 13963 13629 12784 12653
RN 12237 13718 14372 14382 12041
No. of Personal Shifts
EN 1787 1687 1655 1566 1553
RN 1593 1709 1821 1810 1489
Ratio Hours
EN 53% 50% 49% 47% 51%
RN 47% 50% 51% 53% 49%
Ratio Shifts
EN 53% 50% 48% 46% 51%
RN 47% 50% 52% 54% 49%
Total Hours
EN/RN 25969 27680 28001 27166 24694
Table 17 shows 51% EN and 49% RN hours worked over the given time period in
Ward 1AB. There is a small increase in RN and total hours worked between periods 2
and 3.
TABLE 18 NURSE SKILL MIX FOR CANBERRA HOSPITAL WARD 1AL 'MEDICAL TYPE' FROM 09/09/2004 TO 21/02/2007
6 Month Period 1 2 3 4 5
Hours Worked
EN 9076 10090 8507 8843 8029
RN 11243 13530 14696 15494 13619
No. of Personal Shifts
EN 1191 1315 1085 1109 996
RN 1505 1736 1891 1970 1741
Ratio Hours
EN 45% 43% 37% 36% 37%
RN 55% 57% 63% 64% 63%
Ratio Shifts
EN 44% 43% 36% 36% 36%
RN 56% 57% 64% 64% 64%
Total Hours
EN/RN 20318 23620 23203 24337 21648
Note that AIN worked one shift (6 hours) in Period 5.
Table 18 shows a sustained, gradual increase in the proportion of RN hours worked
in the „Medical Type‟ Ward 1AL throughout the whole period (from 55% to 63%),
levelling off in the last three periods. The largest increase in the proportion of RN hours
worked occurred between period 2 and period 3 (7%).
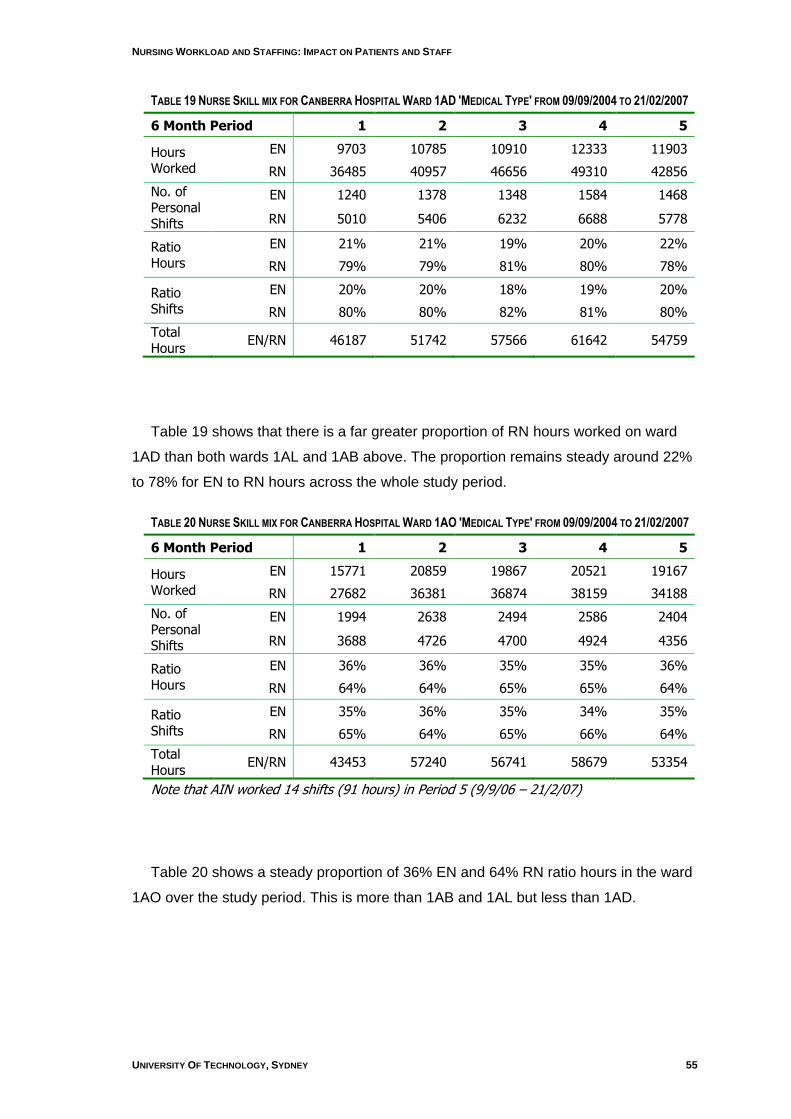
NURSING WORKLOAD AND STAFFING: IMPACT ON PATIENTS AND STAFF
UNIVERSITY OF TECHNOLOGY, SYDNEY 55
TABLE 19 NURSE SKILL MIX FOR CANBERRA HOSPITAL WARD 1AD 'MEDICAL TYPE' FROM 09/09/2004 TO 21/02/2007
6 Month Period 1 2 3 4 5
Hours Worked
EN 9703 10785 10910 12333 11903
RN 36485 40957 46656 49310 42856
No. of Personal Shifts
EN 1240 1378 1348 1584 1468
RN 5010 5406 6232 6688 5778
Ratio Hours
EN 21% 21% 19% 20% 22%
RN 79% 79% 81% 80% 78%
Ratio Shifts
EN 20% 20% 18% 19% 20%
RN 80% 80% 82% 81% 80%
Total Hours
EN/RN 46187 51742 57566 61642 54759
Table 19 shows that there is a far greater proportion of RN hours worked on ward
1AD than both wards 1AL and 1AB above. The proportion remains steady around 22%
to 78% for EN to RN hours across the whole study period.
TABLE 20 NURSE SKILL MIX FOR CANBERRA HOSPITAL WARD 1AO 'MEDICAL TYPE' FROM 09/09/2004 TO 21/02/2007
6 Month Period 1 2 3 4 5
Hours Worked
EN 15771 20859 19867 20521 19167
RN 27682 36381 36874 38159 34188
No. of Personal Shifts
EN 1994 2638 2494 2586 2404
RN 3688 4726 4700 4924 4356
Ratio Hours
EN 36% 36% 35% 35% 36%
RN 64% 64% 65% 65% 64%
Ratio Shifts
EN 35% 36% 35% 34% 35%
RN 65% 64% 65% 66% 64%
Total Hours
EN/RN 43453 57240 56741 58679 53354
Note that AIN worked 14 shifts (91 hours) in Period 5 (9/9/06 – 21/2/07)
Table 20 shows a steady proportion of 36% EN and 64% RN ratio hours in the ward
1AO over the study period. This is more than 1AB and 1AL but less than 1AD.
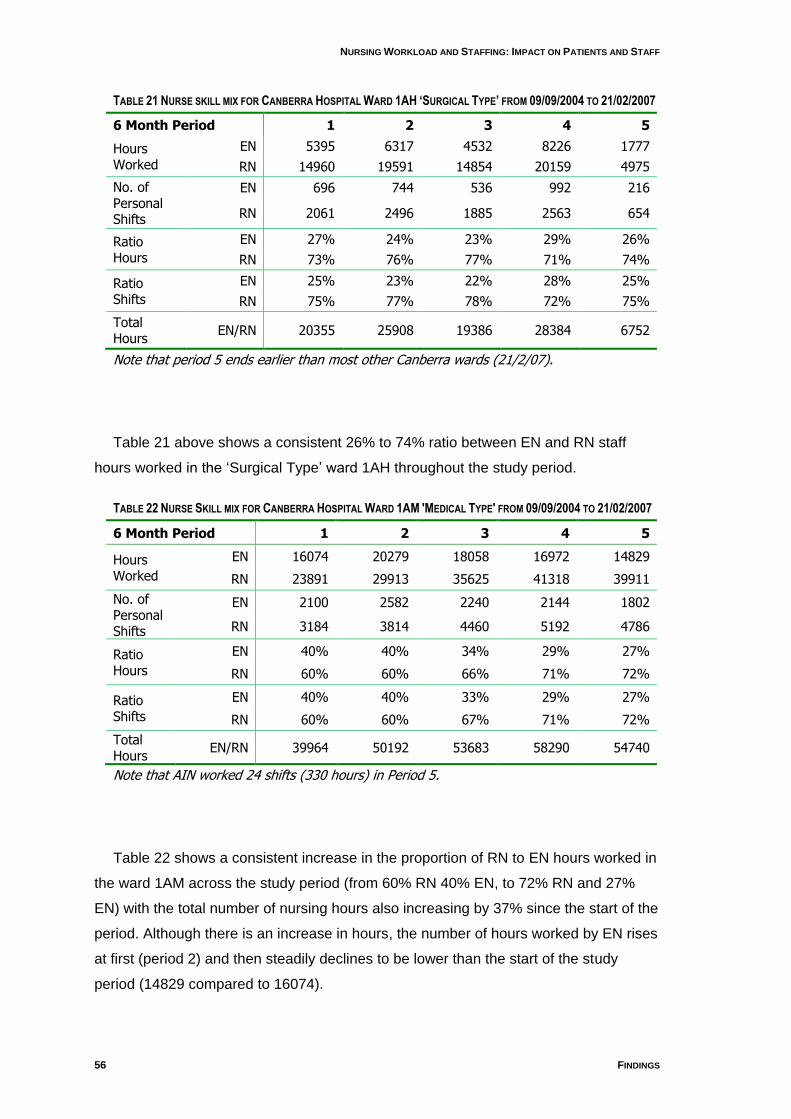
NURSING WORKLOAD AND STAFFING: IMPACT ON PATIENTS AND STAFF
56 FINDINGS
TABLE 21 NURSE SKILL MIX FOR CANBERRA HOSPITAL WARD 1AH ‘SURGICAL TYPE’ FROM 09/09/2004 TO 21/02/2007
6 Month Period 1 2 3 4 5
Hours Worked
EN 5395 6317 4532 8226 1777
RN 14960 19591 14854 20159 4975
No. of Personal Shifts
EN 696 744 536 992 216
RN 2061 2496 1885 2563 654
Ratio Hours
EN 27% 24% 23% 29% 26%
RN 73% 76% 77% 71% 74%
Ratio Shifts
EN 25% 23% 22% 28% 25%
RN 75% 77% 78% 72% 75%
Total Hours
EN/RN 20355 25908 19386 28384 6752
Note that period 5 ends earlier than most other Canberra wards (21/2/07).
Table 21 above shows a consistent 26% to 74% ratio between EN and RN staff
hours worked in the „Surgical Type‟ ward 1AH throughout the study period.
TABLE 22 NURSE SKILL MIX FOR CANBERRA HOSPITAL WARD 1AM 'MEDICAL TYPE' FROM 09/09/2004 TO 21/02/2007
6 Month Period 1 2 3 4 5
Hours Worked
EN 16074 20279 18058 16972 14829
RN 23891 29913 35625 41318 39911
No. of Personal Shifts
EN 2100 2582 2240 2144 1802
RN 3184 3814 4460 5192 4786
Ratio Hours
EN 40% 40% 34% 29% 27%
RN 60% 60% 66% 71% 72%
Ratio Shifts
EN 40% 40% 33% 29% 27%
RN 60% 60% 67% 71% 72%
Total Hours
EN/RN 39964 50192 53683 58290 54740
Note that AIN worked 24 shifts (330 hours) in Period 5.
Table 22 shows a consistent increase in the proportion of RN to EN hours worked in
the ward 1AM across the study period (from 60% RN 40% EN, to 72% RN and 27%
EN) with the total number of nursing hours also increasing by 37% since the start of the
period. Although there is an increase in hours, the number of hours worked by EN rises
at first (period 2) and then steadily declines to be lower than the start of the study
period (14829 compared to 16074).
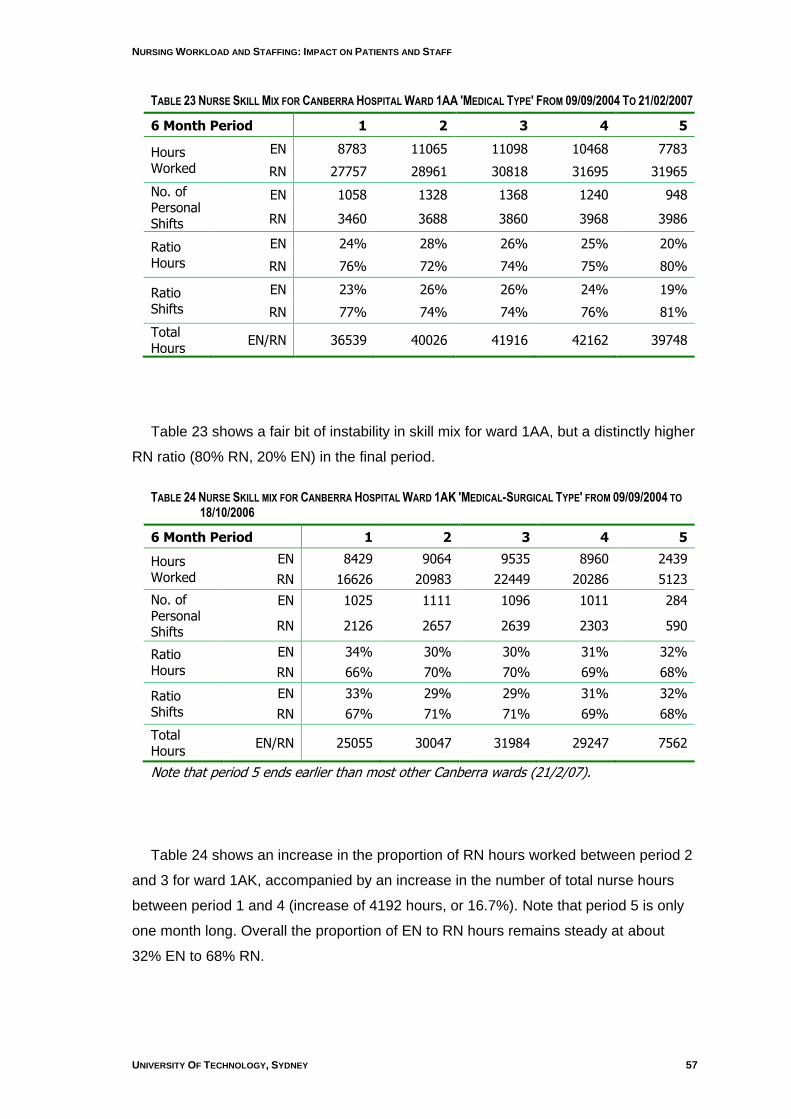
NURSING WORKLOAD AND STAFFING: IMPACT ON PATIENTS AND STAFF
UNIVERSITY OF TECHNOLOGY, SYDNEY 57
TABLE 23 NURSE SKILL MIX FOR CANBERRA HOSPITAL WARD 1AA 'MEDICAL TYPE' FROM 09/09/2004 TO 21/02/2007
6 Month Period 1 2 3 4 5
Hours Worked
EN 8783 11065 11098 10468 7783
RN 27757 28961 30818 31695 31965
No. of Personal Shifts
EN 1058 1328 1368 1240 948
RN 3460 3688 3860 3968 3986
Ratio Hours
EN 24% 28% 26% 25% 20%
RN 76% 72% 74% 75% 80%
Ratio Shifts
EN 23% 26% 26% 24% 19%
RN 77% 74% 74% 76% 81%
Total Hours
EN/RN 36539 40026 41916 42162 39748
Table 23 shows a fair bit of instability in skill mix for ward 1AA, but a distinctly higher
RN ratio (80% RN, 20% EN) in the final period.
TABLE 24 NURSE SKILL MIX FOR CANBERRA HOSPITAL WARD 1AK 'MEDICAL-SURGICAL TYPE' FROM 09/09/2004 TO
18/10/2006
6 Month Period 1 2 3 4 5
Hours Worked
EN 8429 9064 9535 8960 2439
RN 16626 20983 22449 20286 5123
No. of Personal Shifts
EN 1025 1111 1096 1011 284
RN 2126 2657 2639 2303 590
Ratio Hours
EN 34% 30% 30% 31% 32%
RN 66% 70% 70% 69% 68%
Ratio Shifts
EN 33% 29% 29% 31% 32%
RN 67% 71% 71% 69% 68%
Total Hours
EN/RN 25055 30047 31984 29247 7562
Note that period 5 ends earlier than most other Canberra wards (21/2/07).
Table 24 shows an increase in the proportion of RN hours worked between period 2
and 3 for ward 1AK, accompanied by an increase in the number of total nurse hours
between period 1 and 4 (increase of 4192 hours, or 16.7%). Note that period 5 is only
one month long. Overall the proportion of EN to RN hours remains steady at about
32% EN to 68% RN.
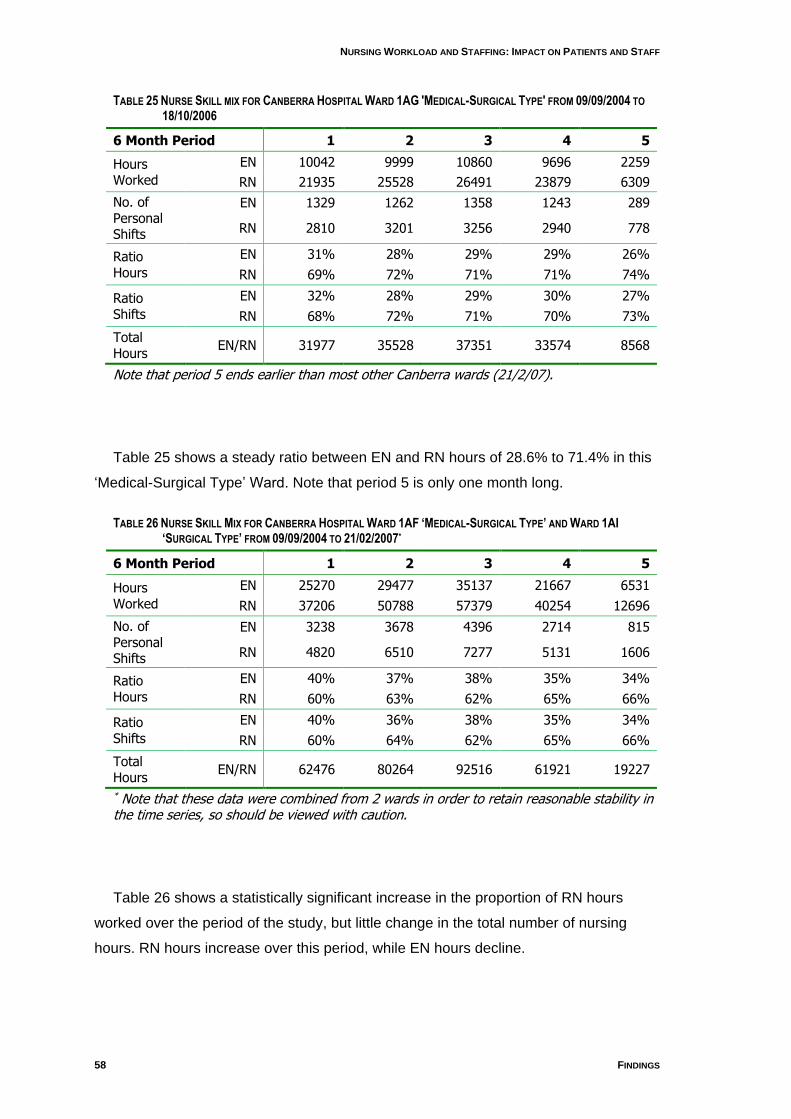
NURSING WORKLOAD AND STAFFING: IMPACT ON PATIENTS AND STAFF
58 FINDINGS
TABLE 25 NURSE SKILL MIX FOR CANBERRA HOSPITAL WARD 1AG 'MEDICAL-SURGICAL TYPE' FROM 09/09/2004 TO
18/10/2006
6 Month Period 1 2 3 4 5
Hours Worked
EN 10042 9999 10860 9696 2259
RN 21935 25528 26491 23879 6309
No. of Personal Shifts
EN 1329 1262 1358 1243 289
RN 2810 3201 3256 2940 778
Ratio Hours
EN 31% 28% 29% 29% 26%
RN 69% 72% 71% 71% 74%
Ratio Shifts
EN 32% 28% 29% 30% 27%
RN 68% 72% 71% 70% 73%
Total Hours
EN/RN 31977 35528 37351 33574 8568
Note that period 5 ends earlier than most other Canberra wards (21/2/07).
Table 25 shows a steady ratio between EN and RN hours of 28.6% to 71.4% in this
„Medical-Surgical Type‟ Ward. Note that period 5 is only one month long.
TABLE 26 NURSE SKILL MIX FOR CANBERRA HOSPITAL WARD 1AF ‘MEDICAL-SURGICAL TYPE’ AND WARD 1AI ‘SURGICAL TYPE’ FROM 09/09/2004 TO 21/02/2007*
6 Month Period 1 2 3 4 5
Hours Worked
EN 25270 29477 35137 21667 6531
RN 37206 50788 57379 40254 12696
No. of Personal Shifts
EN 3238 3678 4396 2714 815
RN 4820 6510 7277 5131 1606
Ratio Hours
EN 40% 37% 38% 35% 34%
RN 60% 63% 62% 65% 66%
Ratio Shifts
EN 40% 36% 38% 35% 34%
RN 60% 64% 62% 65% 66%
Total Hours
EN/RN 62476 80264 92516 61921 19227
* Note that these data were combined from 2 wards in order to retain reasonable stability in the time series, so should be viewed with caution.
Table 26 shows a statistically significant increase in the proportion of RN hours
worked over the period of the study, but little change in the total number of nursing
hours. RN hours increase over this period, while EN hours decline.
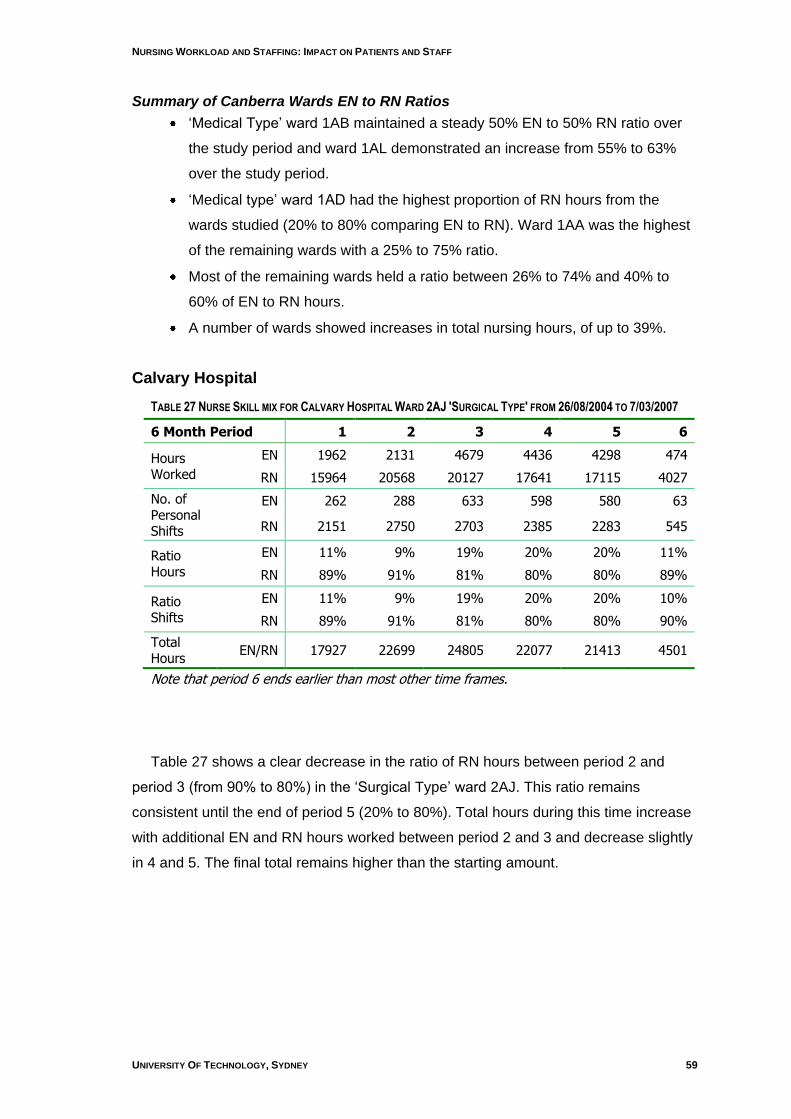
NURSING WORKLOAD AND STAFFING: IMPACT ON PATIENTS AND STAFF
UNIVERSITY OF TECHNOLOGY, SYDNEY 59
Summary of Canberra Wards EN to RN Ratios
„Medical Type‟ ward 1AB maintained a steady 50% EN to 50% RN ratio over
the study period and ward 1AL demonstrated an increase from 55% to 63%
over the study period.
„Medical type‟ ward 1AD had the highest proportion of RN hours from the
wards studied (20% to 80% comparing EN to RN). Ward 1AA was the highest
of the remaining wards with a 25% to 75% ratio.
Most of the remaining wards held a ratio between 26% to 74% and 40% to
60% of EN to RN hours.
A number of wards showed increases in total nursing hours, of up to 39%.
Calvary Hospital
TABLE 27 NURSE SKILL MIX FOR CALVARY HOSPITAL WARD 2AJ 'SURGICAL TYPE' FROM 26/08/2004 TO 7/03/2007
6 Month Period 1 2 3 4 5 6
Hours Worked
EN 1962 2131 4679 4436 4298 474
RN 15964 20568 20127 17641 17115 4027
No. of Personal Shifts
EN 262 288 633 598 580 63
RN 2151 2750 2703 2385 2283 545
Ratio Hours
EN 11% 9% 19% 20% 20% 11%
RN 89% 91% 81% 80% 80% 89%
Ratio Shifts
EN 11% 9% 19% 20% 20% 10%
RN 89% 91% 81% 80% 80% 90%
Total Hours
EN/RN 17927 22699 24805 22077 21413 4501
Note that period 6 ends earlier than most other time frames.
Table 27 shows a clear decrease in the ratio of RN hours between period 2 and
period 3 (from 90% to 80%) in the „Surgical Type‟ ward 2AJ. This ratio remains
consistent until the end of period 5 (20% to 80%). Total hours during this time increase
with additional EN and RN hours worked between period 2 and 3 and decrease slightly
in 4 and 5. The final total remains higher than the starting amount.
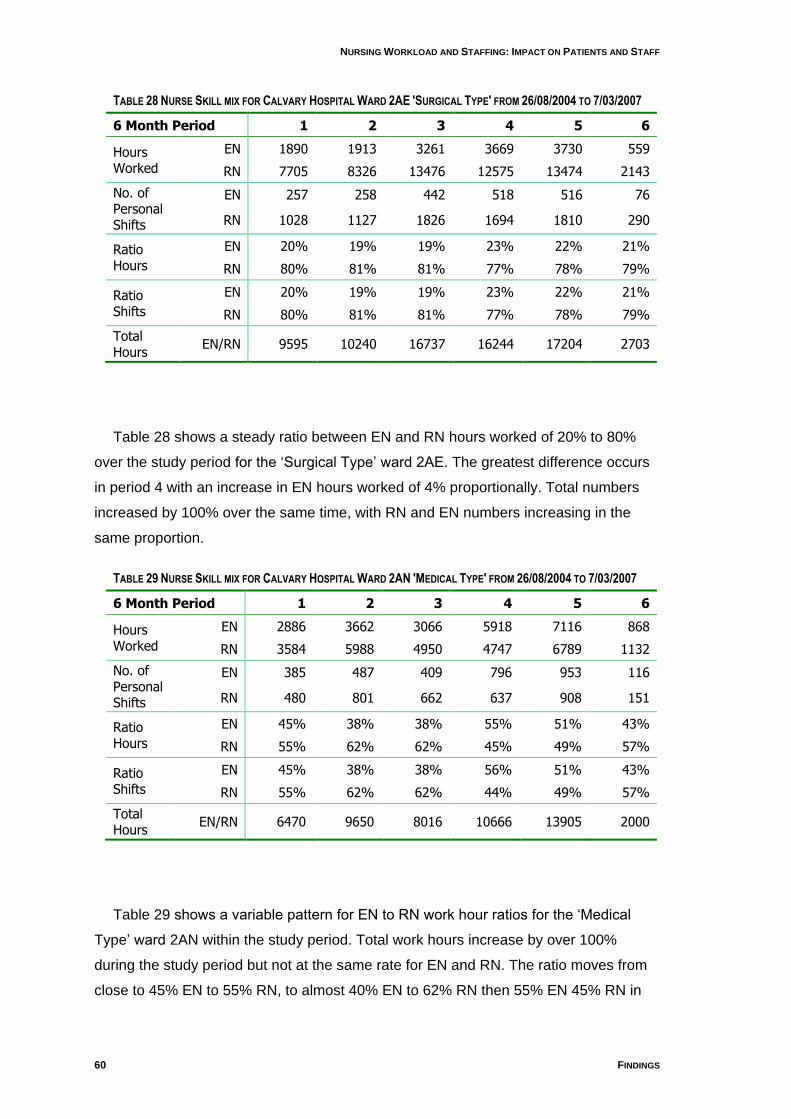
NURSING WORKLOAD AND STAFFING: IMPACT ON PATIENTS AND STAFF
60 FINDINGS
TABLE 28 NURSE SKILL MIX FOR CALVARY HOSPITAL WARD 2AE 'SURGICAL TYPE' FROM 26/08/2004 TO 7/03/2007
6 Month Period 1 2 3 4 5 6
Hours Worked
EN 1890 1913 3261 3669 3730 559
RN 7705 8326 13476 12575 13474 2143
No. of Personal Shifts
EN 257 258 442 518 516 76
RN 1028 1127 1826 1694 1810 290
Ratio Hours
EN 20% 19% 19% 23% 22% 21%
RN 80% 81% 81% 77% 78% 79%
Ratio Shifts
EN 20% 19% 19% 23% 22% 21%
RN 80% 81% 81% 77% 78% 79%
Total Hours
EN/RN 9595 10240 16737 16244 17204 2703
Table 28 shows a steady ratio between EN and RN hours worked of 20% to 80%
over the study period for the „Surgical Type‟ ward 2AE. The greatest difference occurs
in period 4 with an increase in EN hours worked of 4% proportionally. Total numbers
increased by 100% over the same time, with RN and EN numbers increasing in the
same proportion.
TABLE 29 NURSE SKILL MIX FOR CALVARY HOSPITAL WARD 2AN 'MEDICAL TYPE' FROM 26/08/2004 TO 7/03/2007
6 Month Period 1 2 3 4 5 6
Hours Worked
EN 2886 3662 3066 5918 7116 868
RN 3584 5988 4950 4747 6789 1132
No. of Personal Shifts
EN 385 487 409 796 953 116
RN 480 801 662 637 908 151
Ratio Hours
EN 45% 38% 38% 55% 51% 43%
RN 55% 62% 62% 45% 49% 57%
Ratio Shifts
EN 45% 38% 38% 56% 51% 43%
RN 55% 62% 62% 44% 49% 57%
Total Hours
EN/RN 6470 9650 8016 10666 13905 2000
Table 29 shows a variable pattern for EN to RN work hour ratios for the „Medical
Type‟ ward 2AN within the study period. Total work hours increase by over 100%
during the study period but not at the same rate for EN and RN. The ratio moves from
close to 45% EN to 55% RN, to almost 40% EN to 62% RN then 55% EN 45% RN in
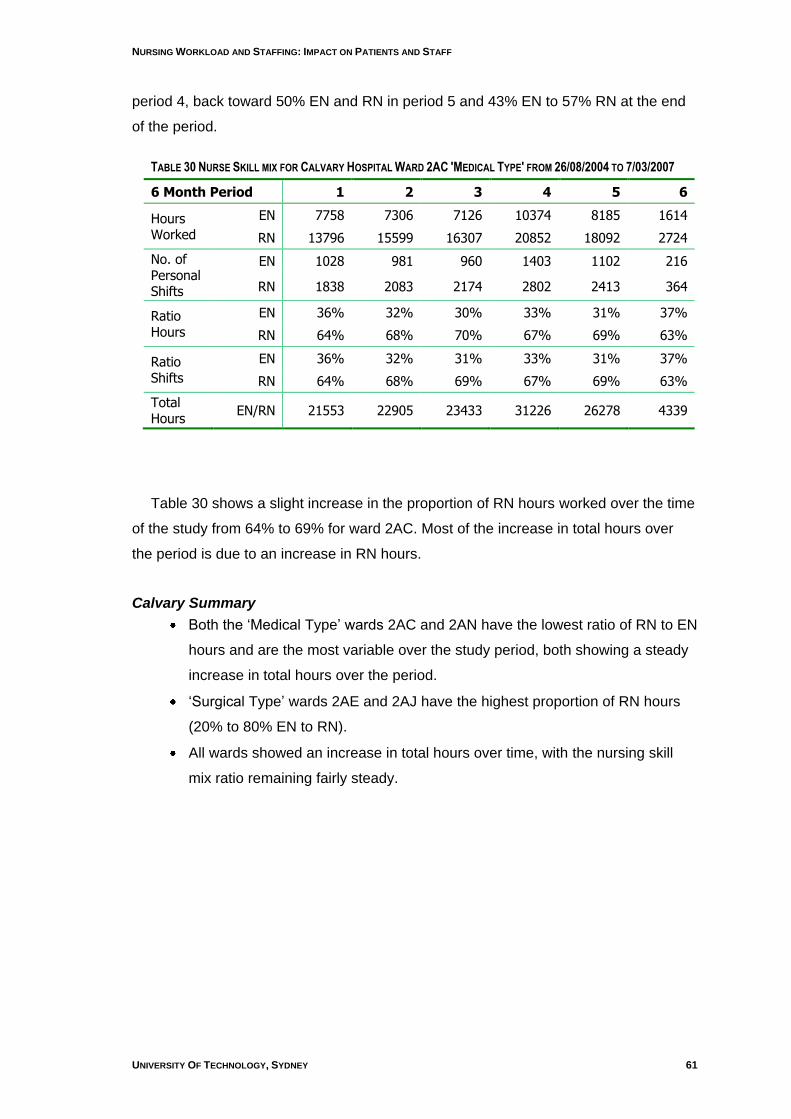
NURSING WORKLOAD AND STAFFING: IMPACT ON PATIENTS AND STAFF
UNIVERSITY OF TECHNOLOGY, SYDNEY 61
period 4, back toward 50% EN and RN in period 5 and 43% EN to 57% RN at the end
of the period.
TABLE 30 NURSE SKILL MIX FOR CALVARY HOSPITAL WARD 2AC 'MEDICAL TYPE' FROM 26/08/2004 TO 7/03/2007
6 Month Period 1 2 3 4 5 6
Hours Worked
EN 7758 7306 7126 10374 8185 1614
RN 13796 15599 16307 20852 18092 2724
No. of Personal Shifts
EN 1028 981 960 1403 1102 216
RN 1838 2083 2174 2802 2413 364
Ratio Hours
EN 36% 32% 30% 33% 31% 37%
RN 64% 68% 70% 67% 69% 63%
Ratio Shifts
EN 36% 32% 31% 33% 31% 37%
RN 64% 68% 69% 67% 69% 63%
Total Hours
EN/RN 21553 22905 23433 31226 26278 4339
Table 30 shows a slight increase in the proportion of RN hours worked over the time
of the study from 64% to 69% for ward 2AC. Most of the increase in total hours over
the period is due to an increase in RN hours.
Calvary Summary
Both the „Medical Type‟ wards 2AC and 2AN have the lowest ratio of RN to EN
hours and are the most variable over the study period, both showing a steady
increase in total hours over the period.
„Surgical Type‟ wards 2AE and 2AJ have the highest proportion of RN hours
(20% to 80% EN to RN).
All wards showed an increase in total hours over time, with the nursing skill
mix ratio remaining fairly steady.
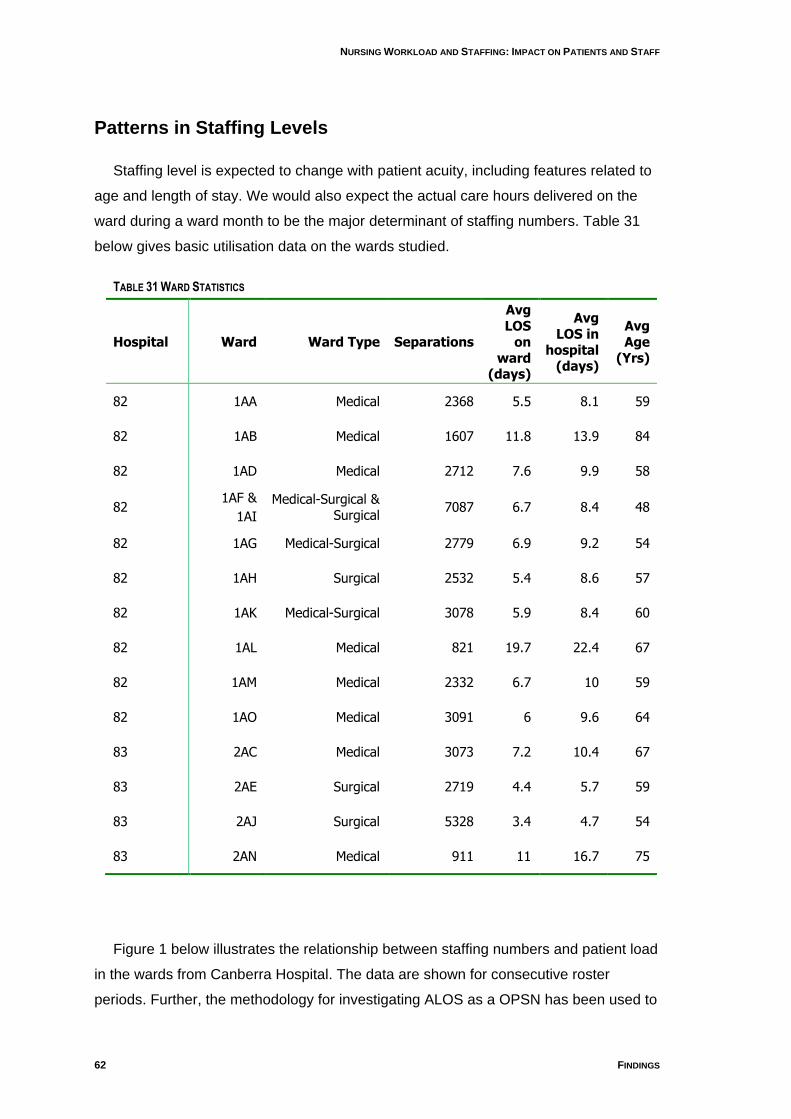
NURSING WORKLOAD AND STAFFING: IMPACT ON PATIENTS AND STAFF
62 FINDINGS
Patterns in Staffing Levels
Staffing level is expected to change with patient acuity, including features related to
age and length of stay. We would also expect the actual care hours delivered on the
ward during a ward month to be the major determinant of staffing numbers. Table 31
below gives basic utilisation data on the wards studied.
TABLE 31 WARD STATISTICS
Hospital Ward Ward Type Separations
Avg LOS
on ward
(days)
Avg LOS in
hospital (days)
Avg Age
(Yrs)
82 1AA Medical 2368 5.5 8.1 59
82 1AB Medical 1607 11.8 13.9 84
82 1AD Medical 2712 7.6 9.9 58
82 1AF &
1AI
Medical-Surgical & Surgical
7087 6.7 8.4 48
82 1AG Medical-Surgical 2779 6.9 9.2 54
82 1AH Surgical 2532 5.4 8.6 57
82 1AK Medical-Surgical 3078 5.9 8.4 60
82 1AL Medical 821 19.7 22.4 67
82 1AM Medical 2332 6.7 10 59
82 1AO Medical 3091 6 9.6 64
83 2AC Medical 3073 7.2 10.4 67
83 2AE Surgical 2719 4.4 5.7 59
83 2AJ Surgical 5328 3.4 4.7 54
83 2AN Medical 911 11 16.7 75
Figure 1 below illustrates the relationship between staffing numbers and patient load
in the wards from Canberra Hospital. The data are shown for consecutive roster
periods. Further, the methodology for investigating ALOS as a OPSN has been used to
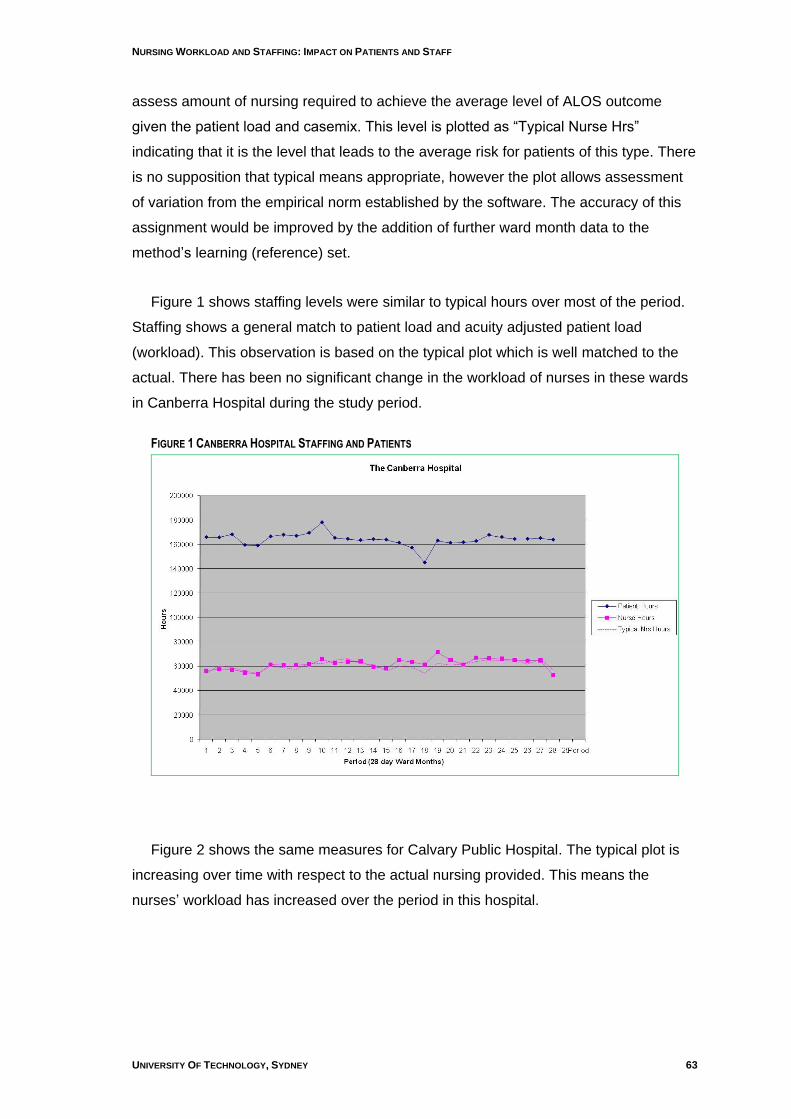
NURSING WORKLOAD AND STAFFING: IMPACT ON PATIENTS AND STAFF
UNIVERSITY OF TECHNOLOGY, SYDNEY 63
assess amount of nursing required to achieve the average level of ALOS outcome
given the patient load and casemix. This level is plotted as “Typical Nurse Hrs”
indicating that it is the level that leads to the average risk for patients of this type. There
is no supposition that typical means appropriate, however the plot allows assessment
of variation from the empirical norm established by the software. The accuracy of this
assignment would be improved by the addition of further ward month data to the
method‟s learning (reference) set.
Figure 1 shows staffing levels were similar to typical hours over most of the period.
Staffing shows a general match to patient load and acuity adjusted patient load
(workload). This observation is based on the typical plot which is well matched to the
actual. There has been no significant change in the workload of nurses in these wards
in Canberra Hospital during the study period.
FIGURE 1 CANBERRA HOSPITAL STAFFING AND PATIENTS
Figure 2 shows the same measures for Calvary Public Hospital. The typical plot is
increasing over time with respect to the actual nursing provided. This means the
nurses‟ workload has increased over the period in this hospital.
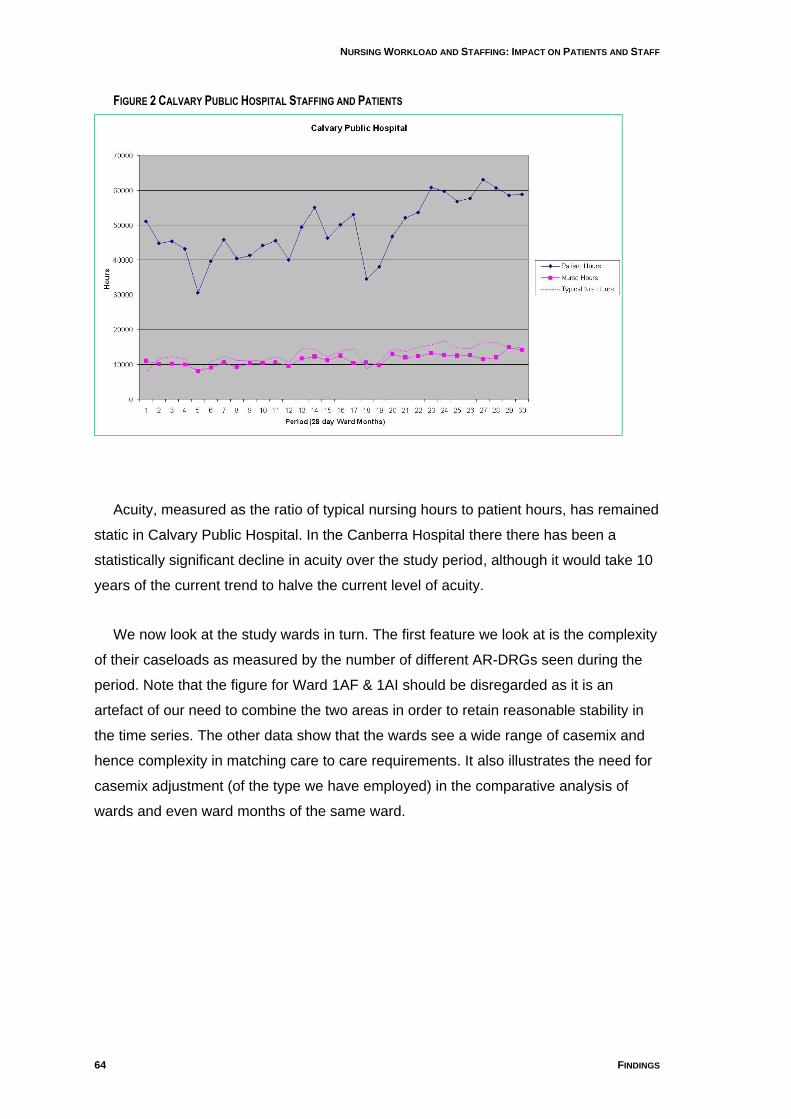
NURSING WORKLOAD AND STAFFING: IMPACT ON PATIENTS AND STAFF
64 FINDINGS
FIGURE 2 CALVARY PUBLIC HOSPITAL STAFFING AND PATIENTS
Acuity, measured as the ratio of typical nursing hours to patient hours, has remained
static in Calvary Public Hospital. In the Canberra Hospital there there has been a
statistically significant decline in acuity over the study period, although it would take 10
years of the current trend to halve the current level of acuity.
We now look at the study wards in turn. The first feature we look at is the complexity
of their caseloads as measured by the number of different AR-DRGs seen during the
period. Note that the figure for Ward 1AF & 1AI should be disregarded as it is an
artefact of our need to combine the two areas in order to retain reasonable stability in
the time series. The other data show that the wards see a wide range of casemix and
hence complexity in matching care to care requirements. It also illustrates the need for
casemix adjustment (of the type we have employed) in the comparative analysis of
wards and even ward months of the same ward.
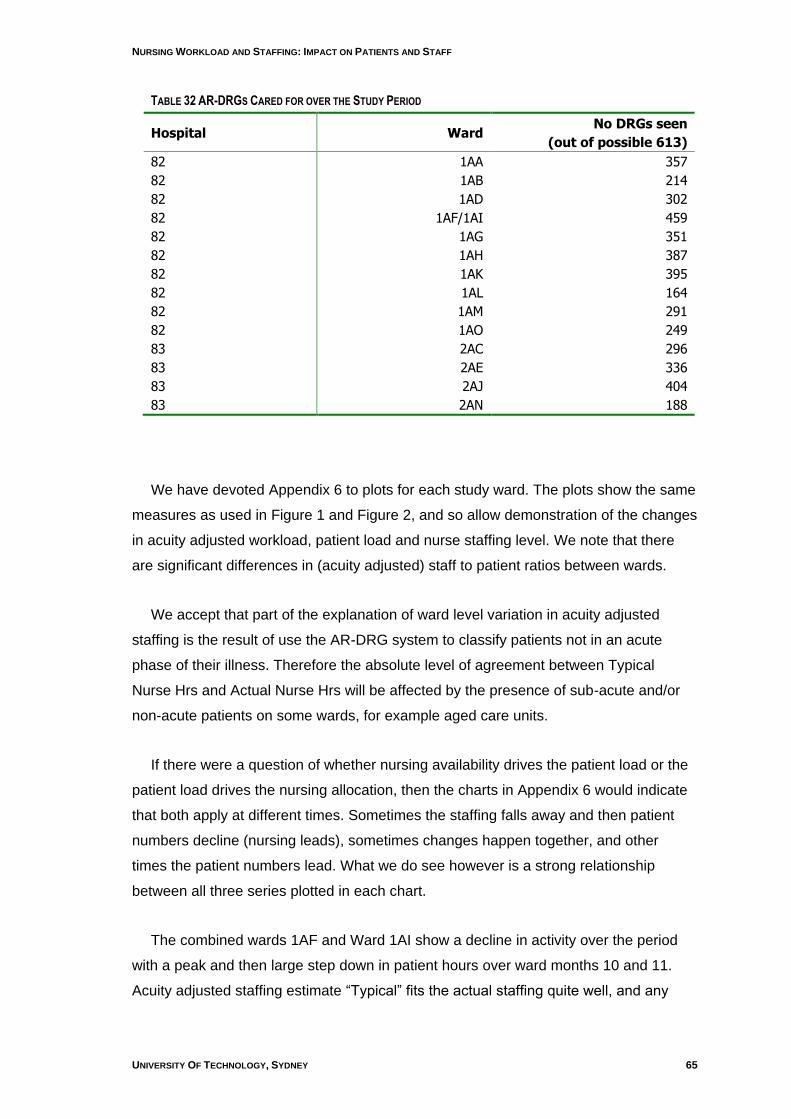
NURSING WORKLOAD AND STAFFING: IMPACT ON PATIENTS AND STAFF
UNIVERSITY OF TECHNOLOGY, SYDNEY 65
TABLE 32 AR-DRGS CARED FOR OVER THE STUDY PERIOD
Hospital Ward No DRGs seen
(out of possible 613)
82 1AA 357
82 1AB 214
82 1AD 302
82 1AF/1AI 459
82 1AG 351
82 1AH 387
82 1AK 395
82 1AL 164
82 1AM 291
82 1AO 249
83 2AC 296
83 2AE 336
83 2AJ 404
83 2AN 188
We have devoted Appendix 6 to plots for each study ward. The plots show the same
measures as used in Figure 1 and Figure 2, and so allow demonstration of the changes
in acuity adjusted workload, patient load and nurse staffing level. We note that there
are significant differences in (acuity adjusted) staff to patient ratios between wards.
We accept that part of the explanation of ward level variation in acuity adjusted
staffing is the result of use the AR-DRG system to classify patients not in an acute
phase of their illness. Therefore the absolute level of agreement between Typical
Nurse Hrs and Actual Nurse Hrs will be affected by the presence of sub-acute and/or
non-acute patients on some wards, for example aged care units.
If there were a question of whether nursing availability drives the patient load or the
patient load drives the nursing allocation, then the charts in Appendix 6 would indicate
that both apply at different times. Sometimes the staffing falls away and then patient
numbers decline (nursing leads), sometimes changes happen together, and other
times the patient numbers lead. What we do see however is a strong relationship
between all three series plotted in each chart.
The combined wards 1AF and Ward 1AI show a decline in activity over the period
with a peak and then large step down in patient hours over ward months 10 and 11.
Acuity adjusted staffing estimate “Typical” fits the actual staffing quite well, and any
NURSING WORKLOAD AND STAFFING: IMPACT ON PATIENTS AND STAFF
66 FINDINGS
large deviation is towards better actual staffing. There has been no real change in
acuity adjusted patient hours per nursing hour.
Ward 1AL has very stable series but so is the difference between typical and actual
nursing, with the actual nursing only about 60% of the former. This ward exemplifies
the issue of clinical acuity as an influence on AR-DRG assessed nursing requirement.
The „Medical Type‟ patient load includes some less acute patients than AR-DRG is
designed to classify. We may conclude however that there has been no real change in
acuity adjusted patient hours per nursing hour.
Ward 1AD has a high staff to patient ratio but one which is fully supported in acuity
adjusted terms. The trend is towards reduced workload for the nurses.
Ward 1AB is a little less stable than Ward 1AL, but is also a lower acuity type ward.
The patient load and staffing series track quite well, however there are quite dramatic
up-changes in acuity adjusted patient load (as reflected in the Typical series) which are
not matched by changes in staffing. This means the nurses on this ward face very
variable workloads, but no clear trend over time.
Ward 1AO shows the interdependence of the patient and nursing series very clearly.
However no clear trend over time (between Typical and Actual Nursing Hrs) emerges.
Ward 1AH shows a large variation in patient hours around ward months 18 and 22,
with concurrent changes (although of lesser magnitude) in staffing hours at the same
time. There is no trend in regard to workload.
Ward 1AM shows a growth of activity during the period. There is a trend for reduced
workload for its nurses.
Ward 1AA shows a disconnect between its acuity adjusted nursing measure and its
actual staffing level. No trend emerges.
Ward 1AK also displays a disparity between the actual staffing level and acuity
adjusted nursing hours, although the two measures are more closely matched from
ward month 11.
NURSING WORKLOAD AND STAFFING: IMPACT ON PATIENTS AND STAFF
UNIVERSITY OF TECHNOLOGY, SYDNEY 67
Ward 1AG shows a close match between actual staffing and the acuity adjusted
measure, except for two ward months (14 and 15).
Ward 2AJ shows considerable variation in patient hours that are not clearly reflected
in staffing numbers. The acuity adjusted measure and actual staffing track each other
quite well with no clear trend. The low staffing levels in this ward mean that variations,
such as that observed at ward month 17 must place a great deal of strain on the
nurses.
Ward 2AE would appear very difficult to manage and it is clear that reduction in
staffing to meet reduced patient numbers is more easily achieved than staffing up to
meet added patient load. This leads to some very distinct staffing shortfalls, for
example ward month 24. However no time trend emerges. From the nurses‟ point of
view, this would mean unpredictable patient assignments.
Ward 2AN shows seasonal effects (including closure1) which mask a major step up
in activity. The staffing level lags behind the increase in patient care requirements
leading to a massive increase in workload.
Ward 2AC also shows the effect of a slow-down around ward month 18 and
evidence of increased activity in the later months, but its staffing tracks the activity
change well. There is no trend in nursing workload.
Findings on Outcomes Potentially Sensitive to Nursing (OPSN)
Findings for OPSN other than ALOS
Our approach to this technically difficult area has been described in detail in the
Longitudinal Analysis section, page 41. We first set about using a counts data
approach found in the literature and our findings from these analyses are summarized
as Poisson or Approach 1 (A1). We then adopted a less rigorous approach that
accommodated the fact that our OPSN data were not actual count data and could be
non-integers, and in particular between 0 and 1. We report the findings from this
approach under the label GM Ratios or Approach 3 (A3). Finally we adopted a
1 Note that closure and slow-down were only strongly evident in the Calvary data.
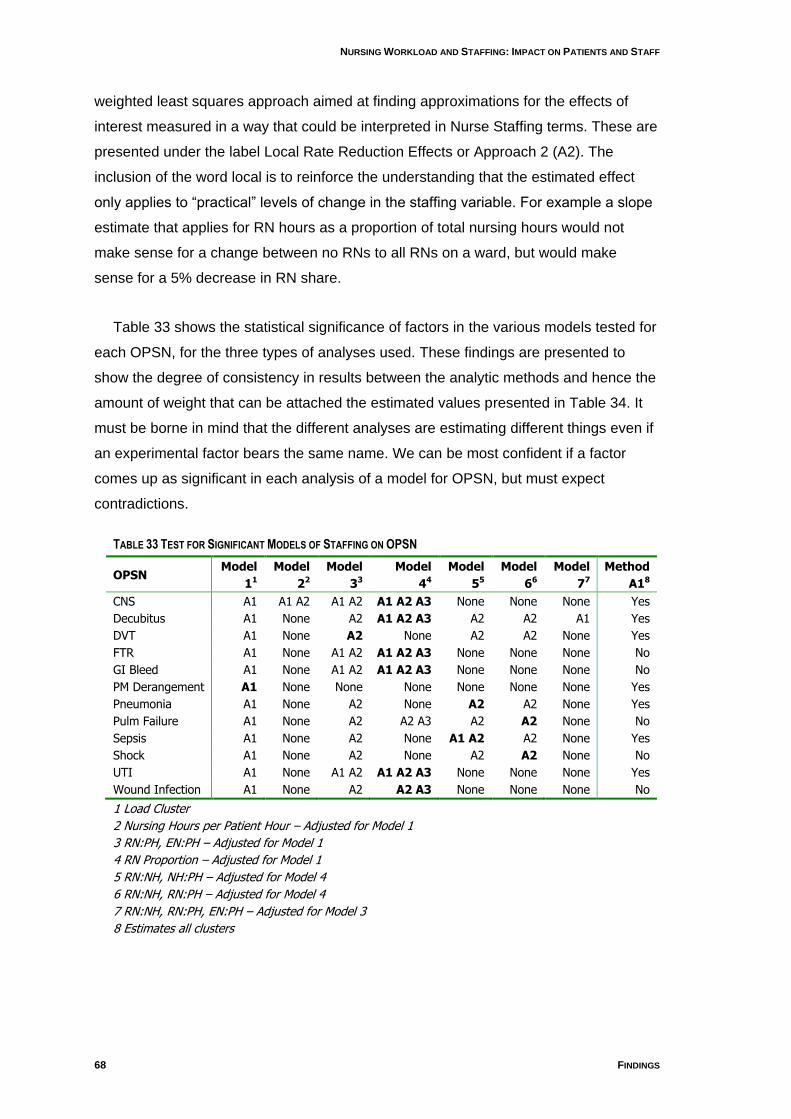
NURSING WORKLOAD AND STAFFING: IMPACT ON PATIENTS AND STAFF
68 FINDINGS
weighted least squares approach aimed at finding approximations for the effects of
interest measured in a way that could be interpreted in Nurse Staffing terms. These are
presented under the label Local Rate Reduction Effects or Approach 2 (A2). The
inclusion of the word local is to reinforce the understanding that the estimated effect
only applies to “practical” levels of change in the staffing variable. For example a slope
estimate that applies for RN hours as a proportion of total nursing hours would not
make sense for a change between no RNs to all RNs on a ward, but would make
sense for a 5% decrease in RN share.
Table 33 shows the statistical significance of factors in the various models tested for
each OPSN, for the three types of analyses used. These findings are presented to
show the degree of consistency in results between the analytic methods and hence the
amount of weight that can be attached the estimated values presented in Table 34. It
must be borne in mind that the different analyses are estimating different things even if
an experimental factor bears the same name. We can be most confident if a factor
comes up as significant in each analysis of a model for OPSN, but must expect
contradictions.
TABLE 33 TEST FOR SIGNIFICANT MODELS OF STAFFING ON OPSN
OPSN Model
11
Model
22
Model
33
Model
44
Model
55
Model
66
Model
77
Method
A18
CNS A1 A1 A2 A1 A2 A1 A2 A3 None None None Yes
Decubitus A1 None A2 A1 A2 A3 A2 A2 A1 Yes
DVT A1 None A2 None A2 A2 None Yes
FTR A1 None A1 A2 A1 A2 A3 None None None No
GI Bleed A1 None A1 A2 A1 A2 A3 None None None No
PM Derangement A1 None None None None None None Yes
Pneumonia A1 None A2 None A2 A2 None Yes
Pulm Failure A1 None A2 A2 A3 A2 A2 None No
Sepsis A1 None A2 None A1 A2 A2 None Yes
Shock A1 None A2 None A2 A2 None No
UTI A1 None A1 A2 A1 A2 A3 None None None Yes
Wound Infection A1 None A2 A2 A3 None None None No
1 Load Cluster
2 Nursing Hours per Patient Hour – Adjusted for Model 1
3 RN:PH, EN:PH – Adjusted for Model 1
4 RN Proportion – Adjusted for Model 1
5 RN:NH, NH:PH – Adjusted for Model 4
6 RN:NH, RN:PH – Adjusted for Model 4
7 RN:NH, RN:PH, EN:PH – Adjusted for Model 3
8 Estimates all clusters
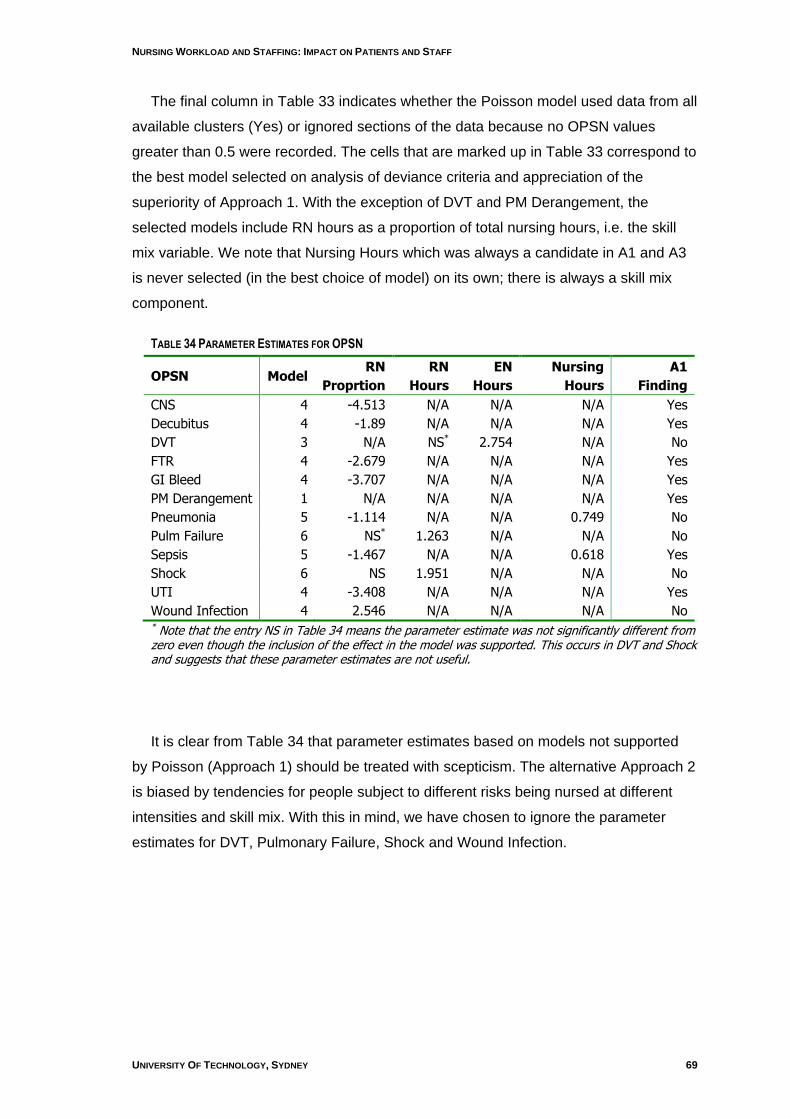
NURSING WORKLOAD AND STAFFING: IMPACT ON PATIENTS AND STAFF
UNIVERSITY OF TECHNOLOGY, SYDNEY 69
The final column in Table 33 indicates whether the Poisson model used data from all
available clusters (Yes) or ignored sections of the data because no OPSN values
greater than 0.5 were recorded. The cells that are marked up in Table 33 correspond to
the best model selected on analysis of deviance criteria and appreciation of the
superiority of Approach 1. With the exception of DVT and PM Derangement, the
selected models include RN hours as a proportion of total nursing hours, i.e. the skill
mix variable. We note that Nursing Hours which was always a candidate in A1 and A3
is never selected (in the best choice of model) on its own; there is always a skill mix
component.
TABLE 34 PARAMETER ESTIMATES FOR OPSN
OPSN Model RN
Proprtion
RN
Hours
EN
Hours
Nursing
Hours
A1
Finding
CNS 4 -4.513 N/A N/A N/A Yes
Decubitus 4 -1.89 N/A N/A N/A Yes
DVT 3 N/A NS* 2.754 N/A No
FTR 4 -2.679 N/A N/A N/A Yes
GI Bleed 4 -3.707 N/A N/A N/A Yes
PM Derangement 1 N/A N/A N/A N/A Yes
Pneumonia 5 -1.114 N/A N/A 0.749 No
Pulm Failure 6 NS* 1.263 N/A N/A No
Sepsis 5 -1.467 N/A N/A 0.618 Yes
Shock 6 NS 1.951 N/A N/A No
UTI 4 -3.408 N/A N/A N/A Yes
Wound Infection 4 2.546 N/A N/A N/A No * Note that the entry NS in Table 34 means the parameter estimate was not significantly different from zero even though the inclusion of the effect in the model was supported. This occurs in DVT and Shock and suggests that these parameter estimates are not useful.
It is clear from Table 34 that parameter estimates based on models not supported
by Poisson (Approach 1) should be treated with scepticism. The alternative Approach 2
is biased by tendencies for people subject to different risks being nursed at different
intensities and skill mix. With this in mind, we have chosen to ignore the parameter
estimates for DVT, Pulmonary Failure, Shock and Wound Infection.
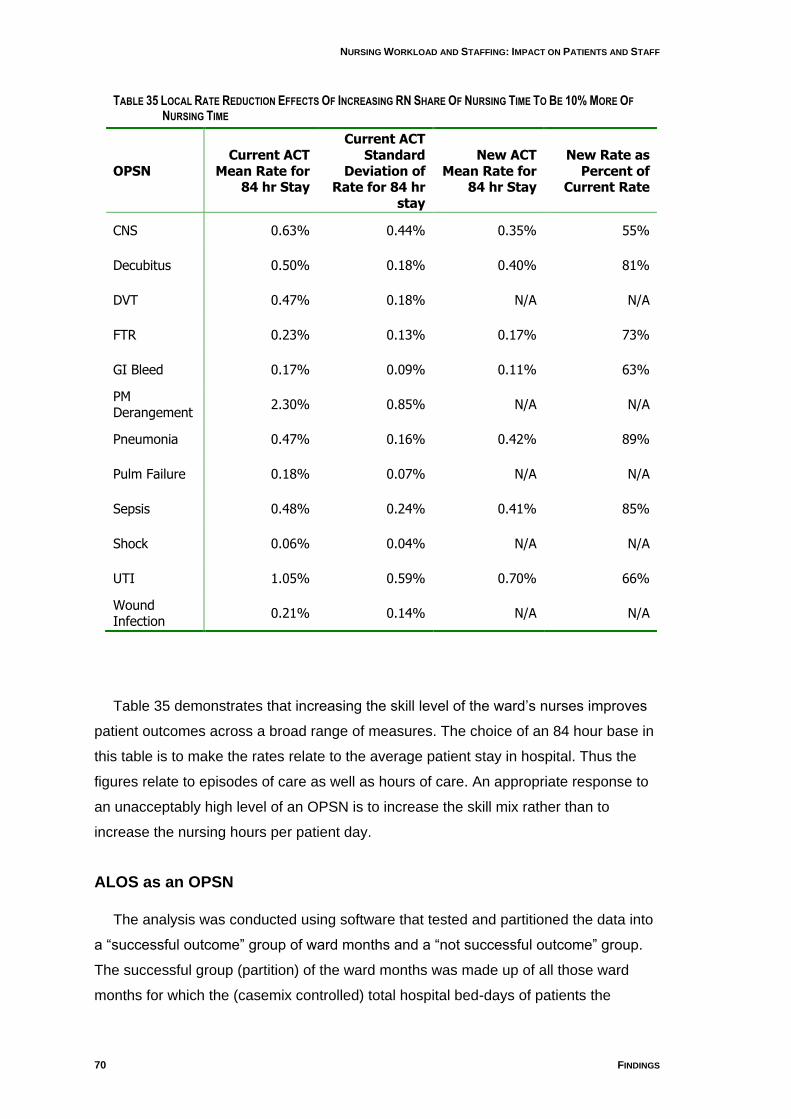
NURSING WORKLOAD AND STAFFING: IMPACT ON PATIENTS AND STAFF
70 FINDINGS
TABLE 35 LOCAL RATE REDUCTION EFFECTS OF INCREASING RN SHARE OF NURSING TIME TO BE 10% MORE OF
NURSING TIME
OPSN Current ACT
Mean Rate for 84 hr Stay
Current ACT Standard
Deviation of Rate for 84 hr
stay
New ACT Mean Rate for
84 hr Stay
New Rate as Percent of
Current Rate
CNS 0.63% 0.44% 0.35% 55%
Decubitus 0.50% 0.18% 0.40% 81%
DVT 0.47% 0.18% N/A N/A
FTR 0.23% 0.13% 0.17% 73%
GI Bleed 0.17% 0.09% 0.11% 63%
PM Derangement
2.30% 0.85% N/A N/A
Pneumonia 0.47% 0.16% 0.42% 89%
Pulm Failure 0.18% 0.07% N/A N/A
Sepsis 0.48% 0.24% 0.41% 85%
Shock 0.06% 0.04% N/A N/A
UTI 1.05% 0.59% 0.70% 66%
Wound Infection
0.21% 0.14% N/A N/A
Table 35 demonstrates that increasing the skill level of the ward‟s nurses improves
patient outcomes across a broad range of measures. The choice of an 84 hour base in
this table is to make the rates relate to the average patient stay in hospital. Thus the
figures relate to episodes of care as well as hours of care. An appropriate response to
an unacceptably high level of an OPSN is to increase the skill mix rather than to
increase the nursing hours per patient day.
ALOS as an OPSN
The analysis was conducted using software that tested and partitioned the data into
a “successful outcome” group of ward months and a “not successful outcome” group.
The successful group (partition) of the ward months was made up of all those ward
months for which the (casemix controlled) total hospital bed-days of patients the
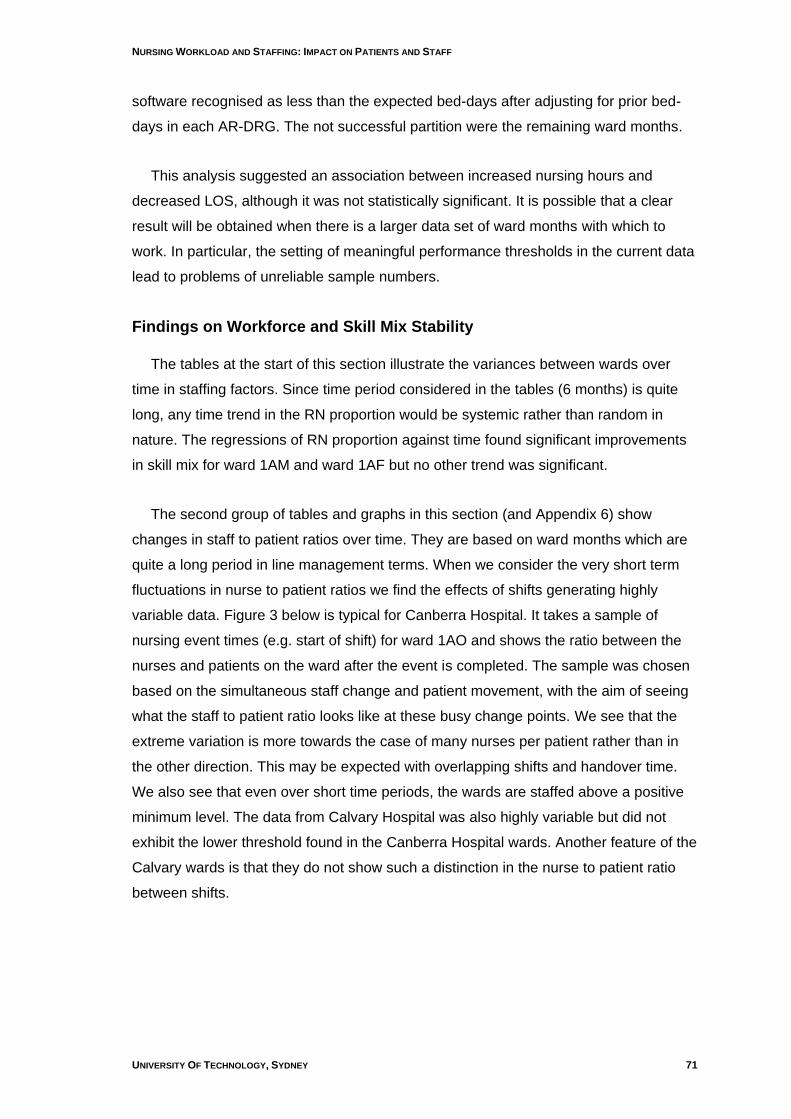
NURSING WORKLOAD AND STAFFING: IMPACT ON PATIENTS AND STAFF
UNIVERSITY OF TECHNOLOGY, SYDNEY 71
software recognised as less than the expected bed-days after adjusting for prior bed-
days in each AR-DRG. The not successful partition were the remaining ward months.
This analysis suggested an association between increased nursing hours and
decreased LOS, although it was not statistically significant. It is possible that a clear
result will be obtained when there is a larger data set of ward months with which to
work. In particular, the setting of meaningful performance thresholds in the current data
lead to problems of unreliable sample numbers.
Findings on Workforce and Skill Mix Stability
The tables at the start of this section illustrate the variances between wards over
time in staffing factors. Since time period considered in the tables (6 months) is quite
long, any time trend in the RN proportion would be systemic rather than random in
nature. The regressions of RN proportion against time found significant improvements
in skill mix for ward 1AM and ward 1AF but no other trend was significant.
The second group of tables and graphs in this section (and Appendix 6) show
changes in staff to patient ratios over time. They are based on ward months which are
quite a long period in line management terms. When we consider the very short term
fluctuations in nurse to patient ratios we find the effects of shifts generating highly
variable data. Figure 3 below is typical for Canberra Hospital. It takes a sample of
nursing event times (e.g. start of shift) for ward 1AO and shows the ratio between the
nurses and patients on the ward after the event is completed. The sample was chosen
based on the simultaneous staff change and patient movement, with the aim of seeing
what the staff to patient ratio looks like at these busy change points. We see that the
extreme variation is more towards the case of many nurses per patient rather than in
the other direction. This may be expected with overlapping shifts and handover time.
We also see that even over short time periods, the wards are staffed above a positive
minimum level. The data from Calvary Hospital was also highly variable but did not
exhibit the lower threshold found in the Canberra Hospital wards. Another feature of the
Calvary wards is that they do not show such a distinction in the nurse to patient ratio
between shifts.
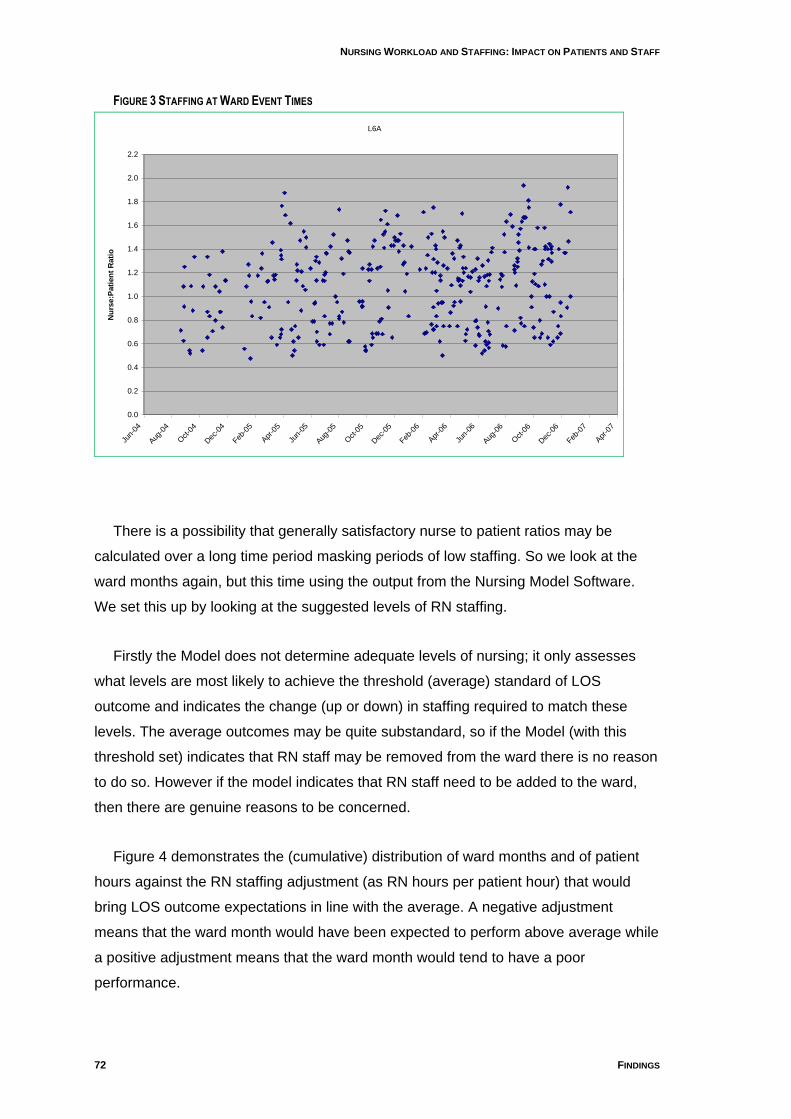
NURSING WORKLOAD AND STAFFING: IMPACT ON PATIENTS AND STAFF
72 FINDINGS
FIGURE 3 STAFFING AT WARD EVENT TIMES
L6A
0.0
0.2
0.4
0.6
0.8
1.0
1.2
1.4
1.6
1.8
2.0
2.2
Jun-
04
Aug
-04
Oct-0
4
Dec
-04
Feb-0
5
Apr
-05
Jun-
05
Aug
-05
Oct-0
5
Dec
-05
Feb-0
6
Apr
-06
Jun-
06
Aug
-06
Oct-0
6
Dec
-06
Feb-0
7
Apr
-07
Nu
rse:P
ati
en
t R
ati
o
L6A
There is a possibility that generally satisfactory nurse to patient ratios may be
calculated over a long time period masking periods of low staffing. So we look at the
ward months again, but this time using the output from the Nursing Model Software.
We set this up by looking at the suggested levels of RN staffing.
Firstly the Model does not determine adequate levels of nursing; it only assesses
what levels are most likely to achieve the threshold (average) standard of LOS
outcome and indicates the change (up or down) in staffing required to match these
levels. The average outcomes may be quite substandard, so if the Model (with this
threshold set) indicates that RN staff may be removed from the ward there is no reason
to do so. However if the model indicates that RN staff need to be added to the ward,
then there are genuine reasons to be concerned.
Figure 4 demonstrates the (cumulative) distribution of ward months and of patient
hours against the RN staffing adjustment (as RN hours per patient hour) that would
bring LOS outcome expectations in line with the average. A negative adjustment
means that the ward month would have been expected to perform above average while
a positive adjustment means that the ward month would tend to have a poor
performance.
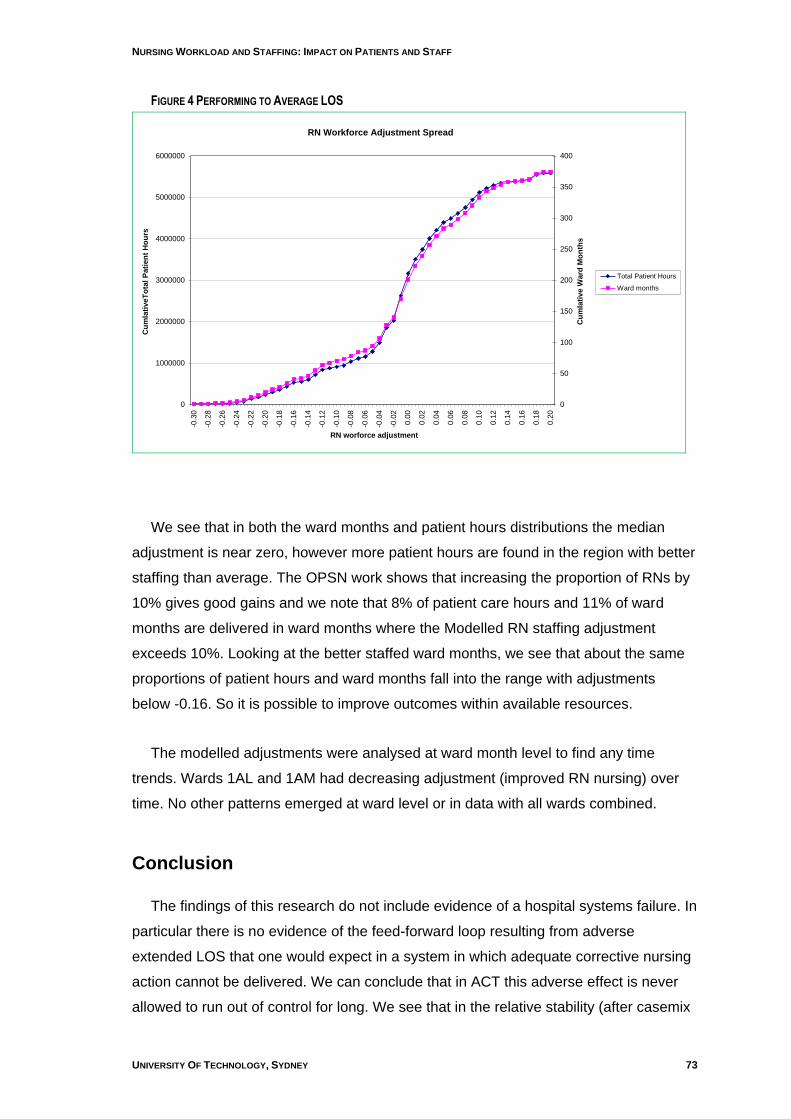
NURSING WORKLOAD AND STAFFING: IMPACT ON PATIENTS AND STAFF
UNIVERSITY OF TECHNOLOGY, SYDNEY 73
FIGURE 4 PERFORMING TO AVERAGE LOS
RN Workforce Adjustment Spread
0
1000000
2000000
3000000
4000000
5000000
6000000
-0.3
0
-0.2
8
-0.2
6
-0.2
4
-0.2
2
-0.2
0
-0.1
8
-0.1
6
-0.1
4
-0.1
2
-0.1
0
-0.0
8
-0.0
6
-0.0
4
-0.0
2
0.0
0
0.0
2
0.0
4
0.0
6
0.0
8
0.1
0
0.1
2
0.1
4
0.1
6
0.1
8
0.2
0
RN worforce adjustment
Cu
mla
tiveT
ota
l P
ati
en
t H
ou
rs
0
50
100
150
200
250
300
350
400
Cu
mla
tive W
ard
Mo
nth
s
Total Patient Hours
Ward months
We see that in both the ward months and patient hours distributions the median
adjustment is near zero, however more patient hours are found in the region with better
staffing than average. The OPSN work shows that increasing the proportion of RNs by
10% gives good gains and we note that 8% of patient care hours and 11% of ward
months are delivered in ward months where the Modelled RN staffing adjustment
exceeds 10%. Looking at the better staffed ward months, we see that about the same
proportions of patient hours and ward months fall into the range with adjustments
below -0.16. So it is possible to improve outcomes within available resources.
The modelled adjustments were analysed at ward month level to find any time
trends. Wards 1AL and 1AM had decreasing adjustment (improved RN nursing) over
time. No other patterns emerged at ward level or in data with all wards combined.
Conclusion
The findings of this research do not include evidence of a hospital systems failure. In
particular there is no evidence of the feed-forward loop resulting from adverse
extended LOS that one would expect in a system in which adequate corrective nursing
action cannot be delivered. We can conclude that in ACT this adverse effect is never
allowed to run out of control for long. We see that in the relative stability (after casemix
NURSING WORKLOAD AND STAFFING: IMPACT ON PATIENTS AND STAFF
74 FINDINGS
adjustment) of skill mix and staffing levels over the medium to longer term (though not
at ward level).
We note that there has been an increase in acuity adjusted workload in both
hospitals. This increase is more evident at Calvary Public Hospital where nursing
workloads are approaching unsustainable levels for an environment where the
provision of quality patient care is important.
A positive but weak association between adverse LOS and low nursing numbers
was shown by running the Nurse Staffing Model software. The effect does not seem
large. This may be the result of the masking brought about by the fact nursing levels
are never allowed to remain critically low for extended periods and when the levels are
low the nurses compensate by giving more of their time. Findings from the cross-
sectional study support a ”safety valve” model.
A relationship between better OPSN outcomes and higher skill mix was found. It is
strong enough to encourage the further skilling of the ACT nursing workforce. This is
particularly the case because the OPSN are only indicator values that are likely to
markedly understate the true rate of avoidable adverse events, and because our
analysis was limited by the data on adverse events. We would expect the true gains to
be much higher. This hypothesis should be confirmed by analysing data in which the
time and place of the adverse events were recorded. Then time periods shorter than
ward months could be used as the basis of staffing and skill mix evaluation, removing
the masking referred to above.
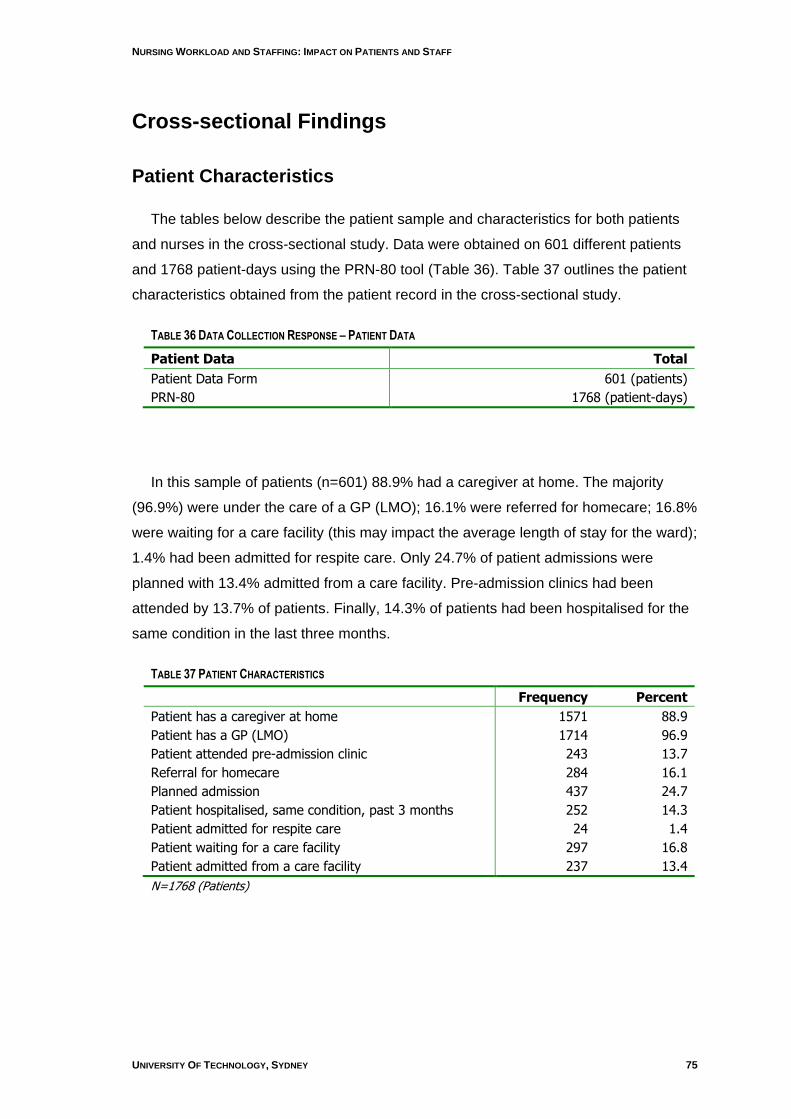
NURSING WORKLOAD AND STAFFING: IMPACT ON PATIENTS AND STAFF
UNIVERSITY OF TECHNOLOGY, SYDNEY 75
Cross-sectional Findings
Patient Characteristics
The tables below describe the patient sample and characteristics for both patients
and nurses in the cross-sectional study. Data were obtained on 601 different patients
and 1768 patient-days using the PRN-80 tool (Table 36). Table 37 outlines the patient
characteristics obtained from the patient record in the cross-sectional study.
TABLE 36 DATA COLLECTION RESPONSE – PATIENT DATA
Patient Data Total
Patient Data Form 601 (patients)
PRN-80 1768 (patient-days)
In this sample of patients (n=601) 88.9% had a caregiver at home. The majority
(96.9%) were under the care of a GP (LMO); 16.1% were referred for homecare; 16.8%
were waiting for a care facility (this may impact the average length of stay for the ward);
1.4% had been admitted for respite care. Only 24.7% of patient admissions were
planned with 13.4% admitted from a care facility. Pre-admission clinics had been
attended by 13.7% of patients. Finally, 14.3% of patients had been hospitalised for the
same condition in the last three months.
TABLE 37 PATIENT CHARACTERISTICS
Frequency Percent
Patient has a caregiver at home 1571 88.9
Patient has a GP (LMO) 1714 96.9
Patient attended pre-admission clinic 243 13.7
Referral for homecare 284 16.1
Planned admission 437 24.7
Patient hospitalised, same condition, past 3 months 252 14.3
Patient admitted for respite care 24 1.4
Patient waiting for a care facility 297 16.8
Patient admitted from a care facility 237 13.4
N=1768 (Patients)
NURSING WORKLOAD AND STAFFING: IMPACT ON PATIENTS AND STAFF
76 FINDINGS
Nurse Characteristics
As indicated earlier 200 nurses responded to the nurse survey. The staff
classifications for which self-reported data were collected included registered nurses
level 1 and 2 (RNL1 & RNL2), enrolled nurses (ENs) endorsed enrolled nurses (EENs),
trainee enrolled nurses (TENs) and assistants in nursing (AINs). In addition nurses in
charge of the wards/units, clinical nurse consultants (CNCs), were asked to participate.
Definitions of Nurse Categories
RNL1 means a registered nurse who delivers nursing and/or midwifery care to
patients/clients in any practice setting and is provided with, or has access to, guidance
from more experienced nurses or midwives and, who provides support and direction to
enrolled nurses and nursing and midwifery students. RNL2 is a registered nurse who
has demonstrated competence in advanced nursing or midwifery practice, provides
guidance to RNL1, enrolled nurses, and nursing and midwifery students in the delivery
of nursing and/or midwifery care; and acts as Team Leader in the absence of the
Clinical Nurse Consultant. An EN is an enrolled nurse who completes one year of
training within the Vocational Education and Training (VET) sector. The VET sector
consists principally of government-funded Technical and Further Education (TAFE)
institutes (McKenna et al. 2000). An EEN is an enrolled nurse who has completed a 6-
month post-enrolment medication administration certificate. An AIN assists in the
performance of nursing duties and other duties incidental and related to the provision of
nursing care services. The AIN is under the direct or indirect supervision of a RN. A
Clinical Nurse Consultant (CNC) is responsible for the quality of clinical nursing care
provided in a ward or clinical unit or to a specified group of patients (ACT Health / ANF,
2007).
When the profile of respondents (n = 200) in the cross-sectional sample is
compared to AIHW data (Table 38) the sample had 12% fewer registered nurses and
10% more enrolled nurses; 13% fewer part time nurses and 7% more full time nurses;
and 4% more male nurses than ACT data (AIHW, 2006).
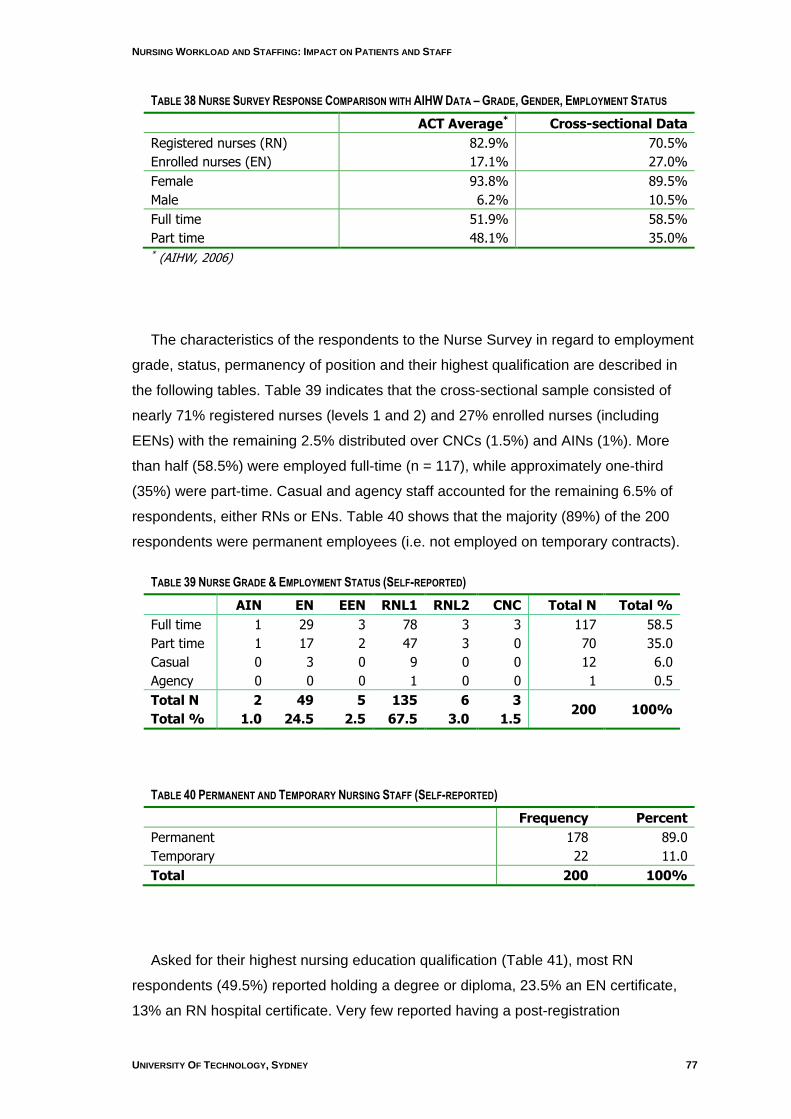
NURSING WORKLOAD AND STAFFING: IMPACT ON PATIENTS AND STAFF
UNIVERSITY OF TECHNOLOGY, SYDNEY 77
TABLE 38 NURSE SURVEY RESPONSE COMPARISON WITH AIHW DATA – GRADE, GENDER, EMPLOYMENT STATUS
ACT Average* Cross-sectional Data
Registered nurses (RN) 82.9% 70.5%
Enrolled nurses (EN) 17.1% 27.0%
Female 93.8% 89.5%
Male 6.2% 10.5%
Full time 51.9% 58.5%
Part time 48.1% 35.0% * (AIHW, 2006)
The characteristics of the respondents to the Nurse Survey in regard to employment
grade, status, permanency of position and their highest qualification are described in
the following tables. Table 39 indicates that the cross-sectional sample consisted of
nearly 71% registered nurses (levels 1 and 2) and 27% enrolled nurses (including
EENs) with the remaining 2.5% distributed over CNCs (1.5%) and AINs (1%). More
than half (58.5%) were employed full-time (n = 117), while approximately one-third
(35%) were part-time. Casual and agency staff accounted for the remaining 6.5% of
respondents, either RNs or ENs. Table 40 shows that the majority (89%) of the 200
respondents were permanent employees (i.e. not employed on temporary contracts).
TABLE 39 NURSE GRADE & EMPLOYMENT STATUS (SELF-REPORTED)
AIN EN EEN RNL1 RNL2 CNC Total N Total %
Full time 1 29 3 78 3 3 117 58.5
Part time 1 17 2 47 3 0 70 35.0
Casual 0 3 0 9 0 0 12 6.0
Agency 0 0 0 1 0 0 1 0.5
Total N 2 49 5 135 6 3 200 100%
Total % 1.0 24.5 2.5 67.5 3.0 1.5
TABLE 40 PERMANENT AND TEMPORARY NURSING STAFF (SELF-REPORTED)
Frequency Percent
Permanent 178 89.0
Temporary 22 11.0
Total 200 100%
Asked for their highest nursing education qualification (Table 41), most RN
respondents (49.5%) reported holding a degree or diploma, 23.5% an EN certificate,
13% an RN hospital certificate. Very few reported having a post-registration

NURSING WORKLOAD AND STAFFING: IMPACT ON PATIENTS AND STAFF
78 FINDINGS
qualification ranging from post basic certificates (2.5%) to 6.5% with postgraduate
qualifications (i.e. graduate certificate, graduate diploma or a master level degree). In
addition, more than half the respondents (n = 119, 59.5%) report that they hold a non-
nursing qualification (see Table 42).
TABLE 41 HIGHEST NURSING QUALIFICATION (SELF-REPORTED)
Frequency Percent
EN Certificate 47 23.5
EEN Certificate 7 3.5
RN Hospital Certificate 26 13.0
Post Basic Certificate 5 2.5
RN Diploma 10 5.0
RN Degree 89 44.5
Graduate Certificate 7 3.5
Graduate Diploma 3 1.5
Master of Nursing 3 1.5
No Qualification 3 1.5
Total 200 100%
TABLE 42 HIGHEST NON-NURSING QUALIFICATION (SELF-REPORTED)
Frequency Percent
TAFE Certificate 43 21.5
Diploma 20 10.0
Degree 25 12.5
Graduate Certificate 10 5.0
Graduate Diploma 3 1.5
Masters Degree 0 0.0
PhD 1 0.5
Other 17 8.5
No Qualification 81 40.5
Total 200 100
In terms of age the youngest respondent was 20 while the oldest was 67 years. The
mean age of 39.2 years is less than the reported average age of employed nurses for
the ACT (45.3 years) (AIHW, 2006). Forty-five percent (45%) of the 200 nurses have
children living at home, with only 7% having other dependents living with them (Table
44). On average respondents reported having worked as a nurse for almost 12 years,
had worked at the present hospital for almost five years, and had worked on the current
ward for almost three years (Table 43).
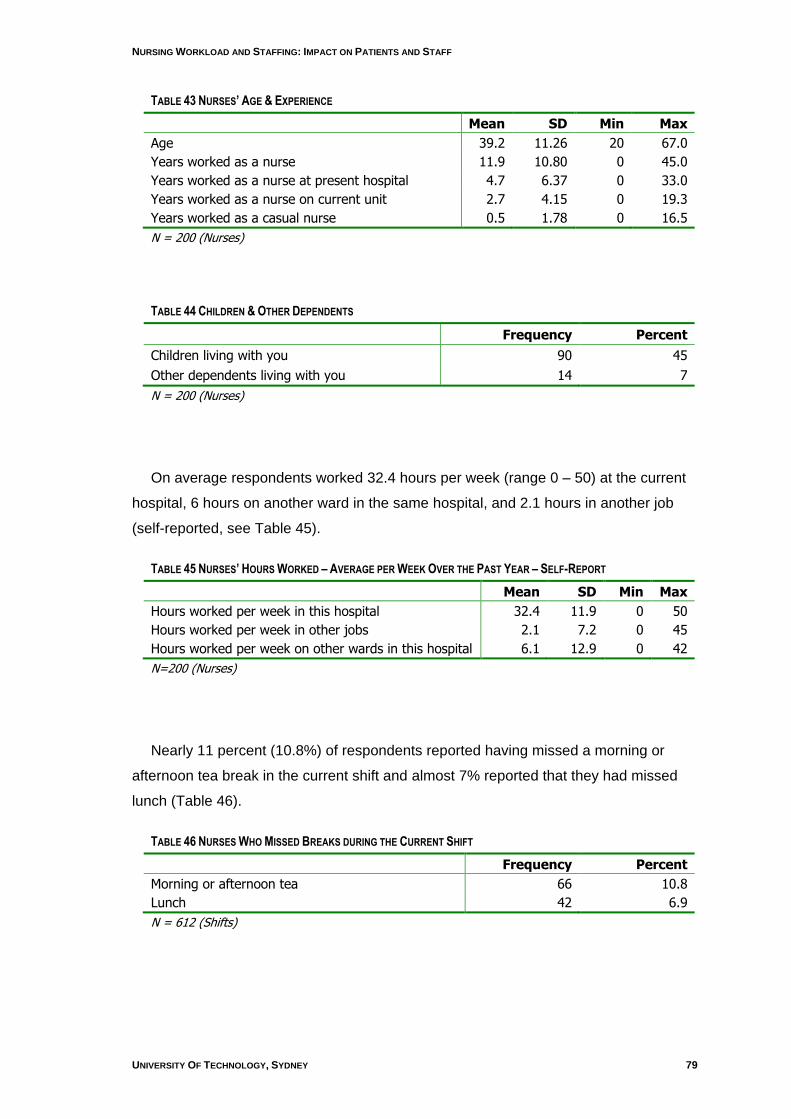
NURSING WORKLOAD AND STAFFING: IMPACT ON PATIENTS AND STAFF
UNIVERSITY OF TECHNOLOGY, SYDNEY 79
TABLE 43 NURSES’ AGE & EXPERIENCE
Mean SD Min Max
Age 39.2 11.26 20 67.0
Years worked as a nurse 11.9 10.80 0 45.0
Years worked as a nurse at present hospital 4.7 6.37 0 33.0
Years worked as a nurse on current unit 2.7 4.15 0 19.3
Years worked as a casual nurse 0.5 1.78 0 16.5
N = 200 (Nurses)
TABLE 44 CHILDREN & OTHER DEPENDENTS
Frequency Percent
Children living with you 90 45
Other dependents living with you 14 7
N = 200 (Nurses)
On average respondents worked 32.4 hours per week (range 0 – 50) at the current
hospital, 6 hours on another ward in the same hospital, and 2.1 hours in another job
(self-reported, see Table 45).
TABLE 45 NURSES’ HOURS WORKED – AVERAGE PER WEEK OVER THE PAST YEAR – SELF-REPORT
Mean SD Min Max
Hours worked per week in this hospital 32.4 11.9 0 50
Hours worked per week in other jobs 2.1 7.2 0 45
Hours worked per week on other wards in this hospital 6.1 12.9 0 42
N=200 (Nurses)
Nearly 11 percent (10.8%) of respondents reported having missed a morning or
afternoon tea break in the current shift and almost 7% reported that they had missed
lunch (Table 46).
TABLE 46 NURSES WHO MISSED BREAKS DURING THE CURRENT SHIFT
Frequency Percent
Morning or afternoon tea 66 10.8
Lunch 42 6.9
N = 612 (Shifts)
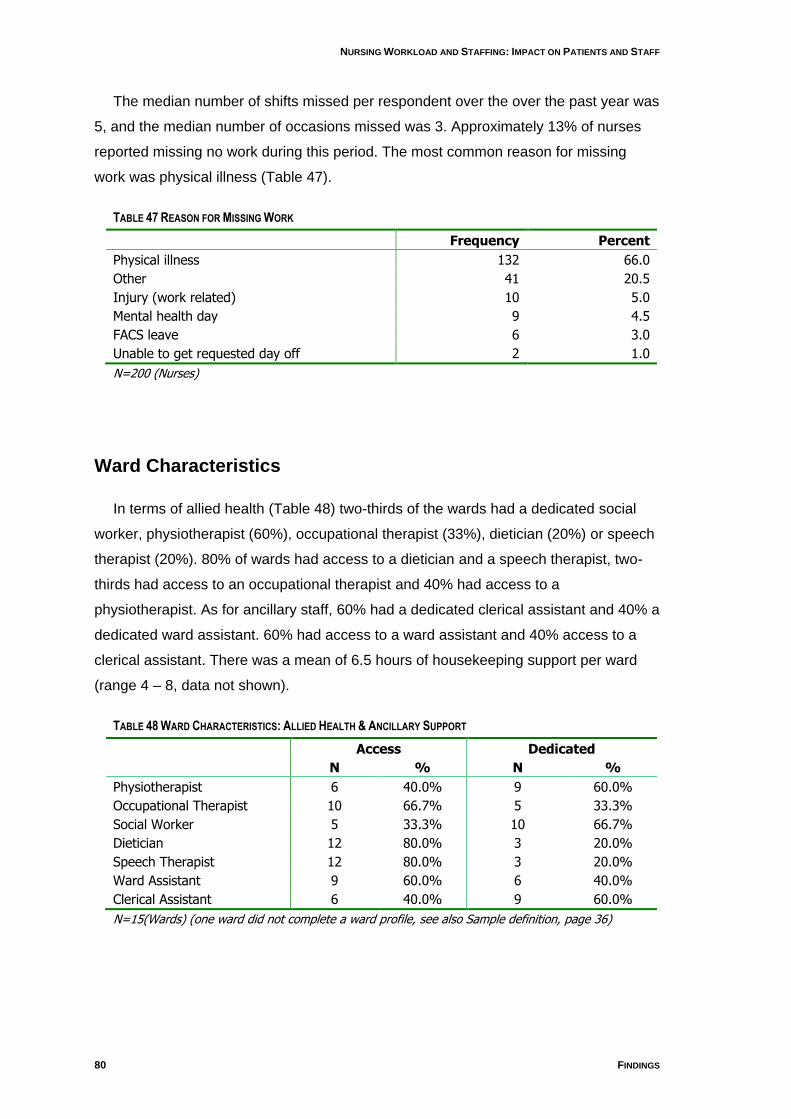
NURSING WORKLOAD AND STAFFING: IMPACT ON PATIENTS AND STAFF
80 FINDINGS
The median number of shifts missed per respondent over the over the past year was
5, and the median number of occasions missed was 3. Approximately 13% of nurses
reported missing no work during this period. The most common reason for missing
work was physical illness (Table 47).
TABLE 47 REASON FOR MISSING WORK
Frequency Percent
Physical illness 132 66.0
Other 41 20.5
Injury (work related) 10 5.0
Mental health day 9 4.5
FACS leave 6 3.0
Unable to get requested day off 2 1.0
N=200 (Nurses)
Ward Characteristics
In terms of allied health (Table 48) two-thirds of the wards had a dedicated social
worker, physiotherapist (60%), occupational therapist (33%), dietician (20%) or speech
therapist (20%). 80% of wards had access to a dietician and a speech therapist, two-
thirds had access to an occupational therapist and 40% had access to a
physiotherapist. As for ancillary staff, 60% had a dedicated clerical assistant and 40% a
dedicated ward assistant. 60% had access to a ward assistant and 40% access to a
clerical assistant. There was a mean of 6.5 hours of housekeeping support per ward
(range 4 – 8, data not shown).
TABLE 48 WARD CHARACTERISTICS: ALLIED HEALTH & ANCILLARY SUPPORT
Access Dedicated
N % N %
Physiotherapist 6 40.0% 9 60.0%
Occupational Therapist 10 66.7% 5 33.3%
Social Worker 5 33.3% 10 66.7%
Dietician 12 80.0% 3 20.0%
Speech Therapist 12 80.0% 3 20.0%
Ward Assistant 9 60.0% 6 40.0%
Clerical Assistant 6 40.0% 9 60.0%
N=15(Wards) (one ward did not complete a ward profile, see also Sample definition, page 36)
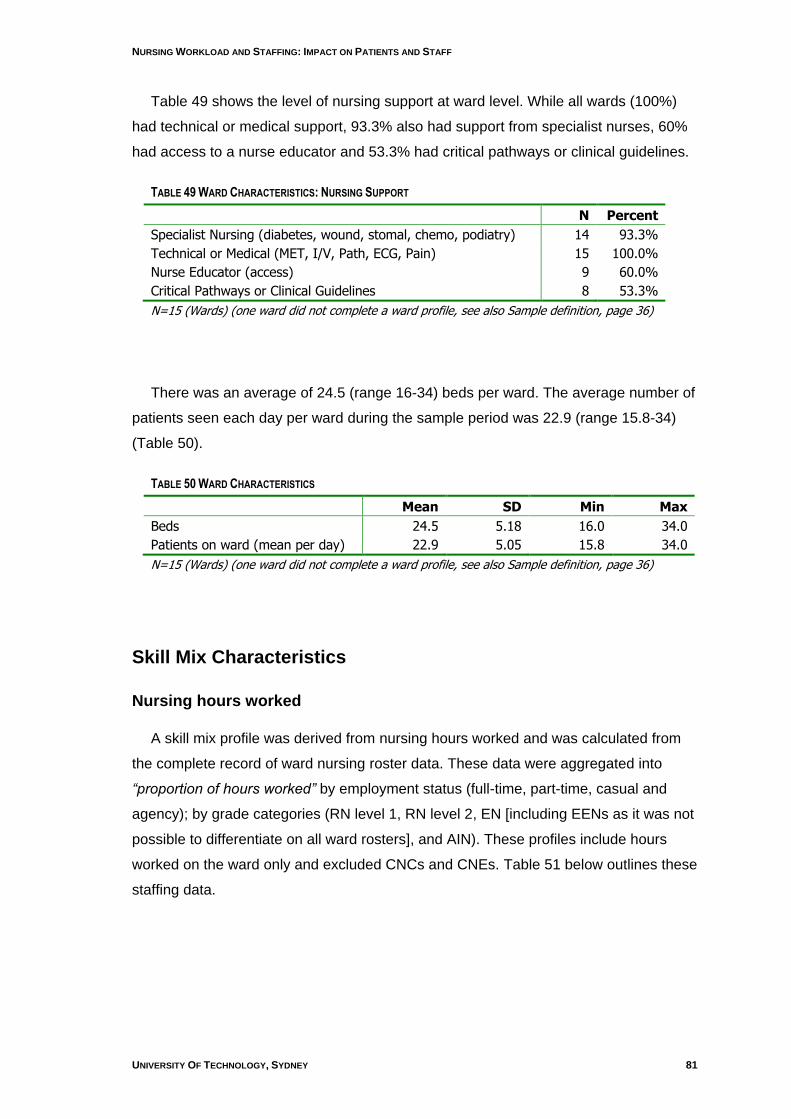
NURSING WORKLOAD AND STAFFING: IMPACT ON PATIENTS AND STAFF
UNIVERSITY OF TECHNOLOGY, SYDNEY 81
Table 49 shows the level of nursing support at ward level. While all wards (100%)
had technical or medical support, 93.3% also had support from specialist nurses, 60%
had access to a nurse educator and 53.3% had critical pathways or clinical guidelines.
TABLE 49 WARD CHARACTERISTICS: NURSING SUPPORT
N Percent
Specialist Nursing (diabetes, wound, stomal, chemo, podiatry) 14 93.3%
Technical or Medical (MET, I/V, Path, ECG, Pain) 15 100.0%
Nurse Educator (access) 9 60.0%
Critical Pathways or Clinical Guidelines 8 53.3%
N=15 (Wards) (one ward did not complete a ward profile, see also Sample definition, page 36)
There was an average of 24.5 (range 16-34) beds per ward. The average number of
patients seen each day per ward during the sample period was 22.9 (range 15.8-34)
(Table 50).
TABLE 50 WARD CHARACTERISTICS
Mean SD Min Max
Beds 24.5 5.18 16.0 34.0
Patients on ward (mean per day) 22.9 5.05 15.8 34.0
N=15 (Wards) (one ward did not complete a ward profile, see also Sample definition, page 36)
Skill Mix Characteristics
Nursing hours worked
A skill mix profile was derived from nursing hours worked and was calculated from
the complete record of ward nursing roster data. These data were aggregated into
“proportion of hours worked” by employment status (full-time, part-time, casual and
agency); by grade categories (RN level 1, RN level 2, EN [including EENs as it was not
possible to differentiate on all ward rosters], and AIN). These profiles include hours
worked on the ward only and excluded CNCs and CNEs. Table 51 below outlines these
staffing data.
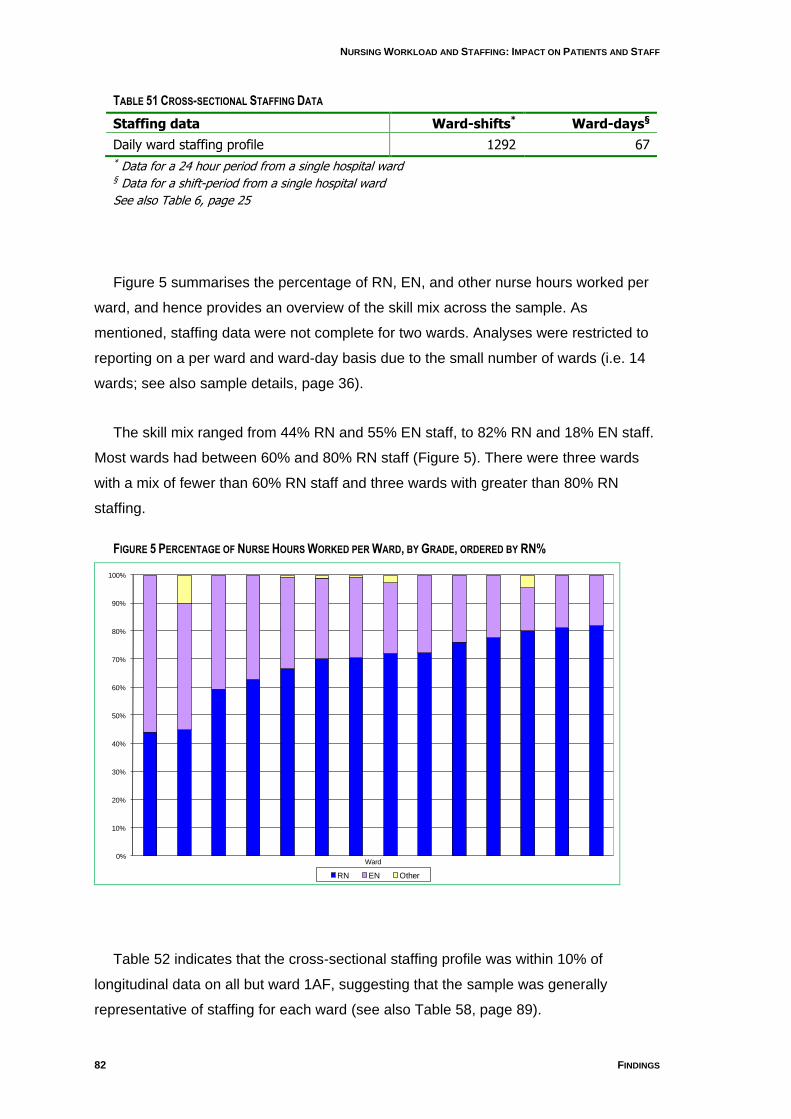
NURSING WORKLOAD AND STAFFING: IMPACT ON PATIENTS AND STAFF
82 FINDINGS
TABLE 51 CROSS-SECTIONAL STAFFING DATA
Staffing data Ward-shifts* Ward-days§
Daily ward staffing profile 1292 67 * Data for a 24 hour period from a single hospital ward § Data for a shift-period from a single hospital ward
See also Table 6, page 25
Figure 5 summarises the percentage of RN, EN, and other nurse hours worked per
ward, and hence provides an overview of the skill mix across the sample. As
mentioned, staffing data were not complete for two wards. Analyses were restricted to
reporting on a per ward and ward-day basis due to the small number of wards (i.e. 14
wards; see also sample details, page 36).
The skill mix ranged from 44% RN and 55% EN staff, to 82% RN and 18% EN staff.
Most wards had between 60% and 80% RN staff (Figure 5). There were three wards
with a mix of fewer than 60% RN staff and three wards with greater than 80% RN
staffing.
FIGURE 5 PERCENTAGE OF NURSE HOURS WORKED PER WARD, BY GRADE, ORDERED BY RN%
0%
10%
20%
30%
40%
50%
60%
70%
80%
90%
100%
Ward
RN EN Other
Table 52 indicates that the cross-sectional staffing profile was within 10% of
longitudinal data on all but ward 1AF, suggesting that the sample was generally
representative of staffing for each ward (see also Table 58, page 89).

NURSING WORKLOAD AND STAFFING: IMPACT ON PATIENTS AND STAFF
UNIVERSITY OF TECHNOLOGY, SYDNEY 83
TABLE 52 COMPARISON OF LONGITUDINAL & CROSS-SECTIONAL STAFFING PROFILE,, BY WARD
RN% EN%
Ward Code Cross-sectional Longitudinal Cross-sectional Longitudinal
1AA 80.2 75.4 15.2 24.6
1AB 44.1 49.9 55.9 50.1
1AD 81.1 79.5 18.9 20.5
1AF 77.7§ 62.3 22.3 37.7
1AG 72.1 70.7 25.0 29.4
1AH 70.2 74.1 28.8 25.9
1AI 59.3 62.3 40.7 37.7
1AK 66.6 68.7 32.6 31.3
1AM 72.2 66.3 27.8 33.7
1AO 62.7 64.3 37.3 35.7
2AC 70.5 67.5 28.7 32.5
2AE 76.2 79.4 23.8 20.6
2AJ 82.0 84.1 18.1 16.0
2AN 44.8 53.8 45.0 46.2
* Cross-sectional data recorded „other‟ nursing staff as follows: 1AA:4.6%; 1AG:2.9%; 1AH:1.1%; 1AK:4.0%; 2AC: 0.8%; 2AN:10.2%. These data were not collected in the longitudinal component. § Staffing data for Ward 1AF was atypical when compared to longitudinal data.
On a ward-day basis (Figure 6) there were 39 (58%) ward-days that had between
60-80% RN hours worked and one that had 100% RN hours. Fifteen ward-days had
fewer than 60% of hours worked by RNs and 13 had 80% or more. Twenty ward-days
had greater than 35% EN hours worked. Only twelve ward-days over six different
wards employed nurses which were other than RN and EN categories and the
percentage of these “other nurse” hours worked ranged from 0 – 7.46%, with two
outliers at 22.4 and 24.5%.
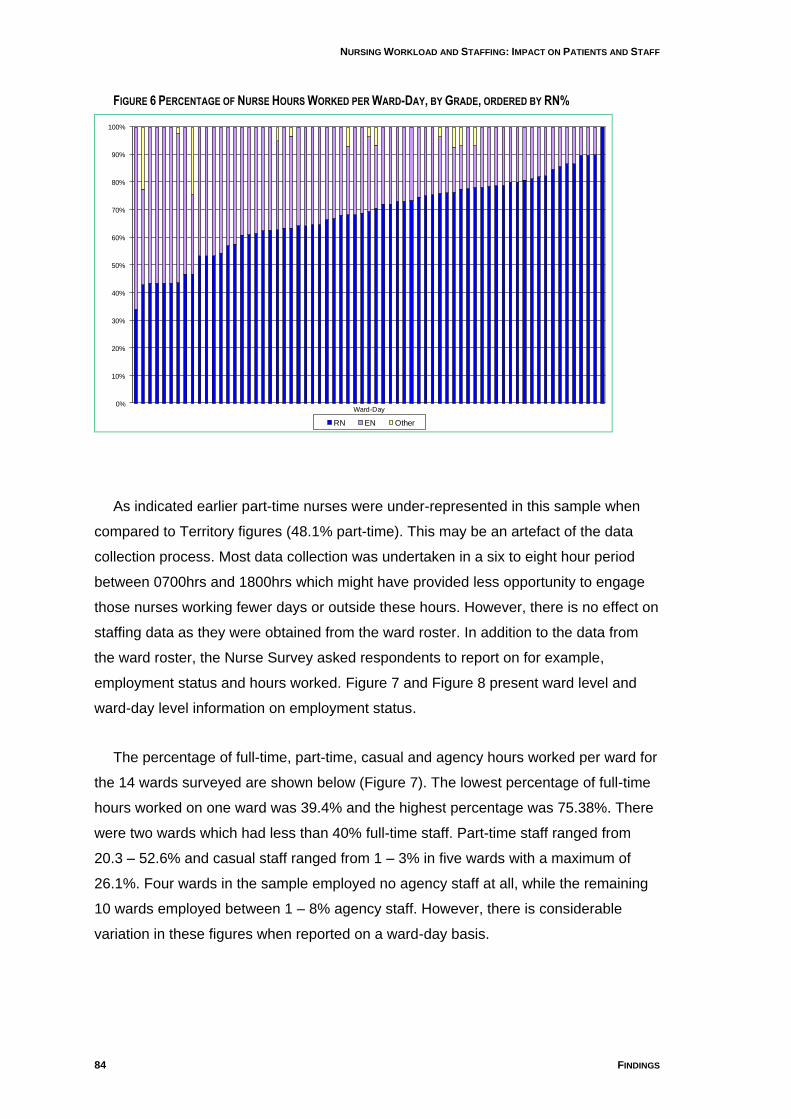
NURSING WORKLOAD AND STAFFING: IMPACT ON PATIENTS AND STAFF
84 FINDINGS
FIGURE 6 PERCENTAGE OF NURSE HOURS WORKED PER WARD-DAY, BY GRADE, ORDERED BY RN%
0%
10%
20%
30%
40%
50%
60%
70%
80%
90%
100%
Ward-Day
RN EN Other
As indicated earlier part-time nurses were under-represented in this sample when
compared to Territory figures (48.1% part-time). This may be an artefact of the data
collection process. Most data collection was undertaken in a six to eight hour period
between 0700hrs and 1800hrs which might have provided less opportunity to engage
those nurses working fewer days or outside these hours. However, there is no effect on
staffing data as they were obtained from the ward roster. In addition to the data from
the ward roster, the Nurse Survey asked respondents to report on for example,
employment status and hours worked. Figure 7 and Figure 8 present ward level and
ward-day level information on employment status.
The percentage of full-time, part-time, casual and agency hours worked per ward for
the 14 wards surveyed are shown below (Figure 7). The lowest percentage of full-time
hours worked on one ward was 39.4% and the highest percentage was 75.38%. There
were two wards which had less than 40% full-time staff. Part-time staff ranged from
20.3 – 52.6% and casual staff ranged from 1 – 3% in five wards with a maximum of
26.1%. Four wards in the sample employed no agency staff at all, while the remaining
10 wards employed between 1 – 8% agency staff. However, there is considerable
variation in these figures when reported on a ward-day basis.
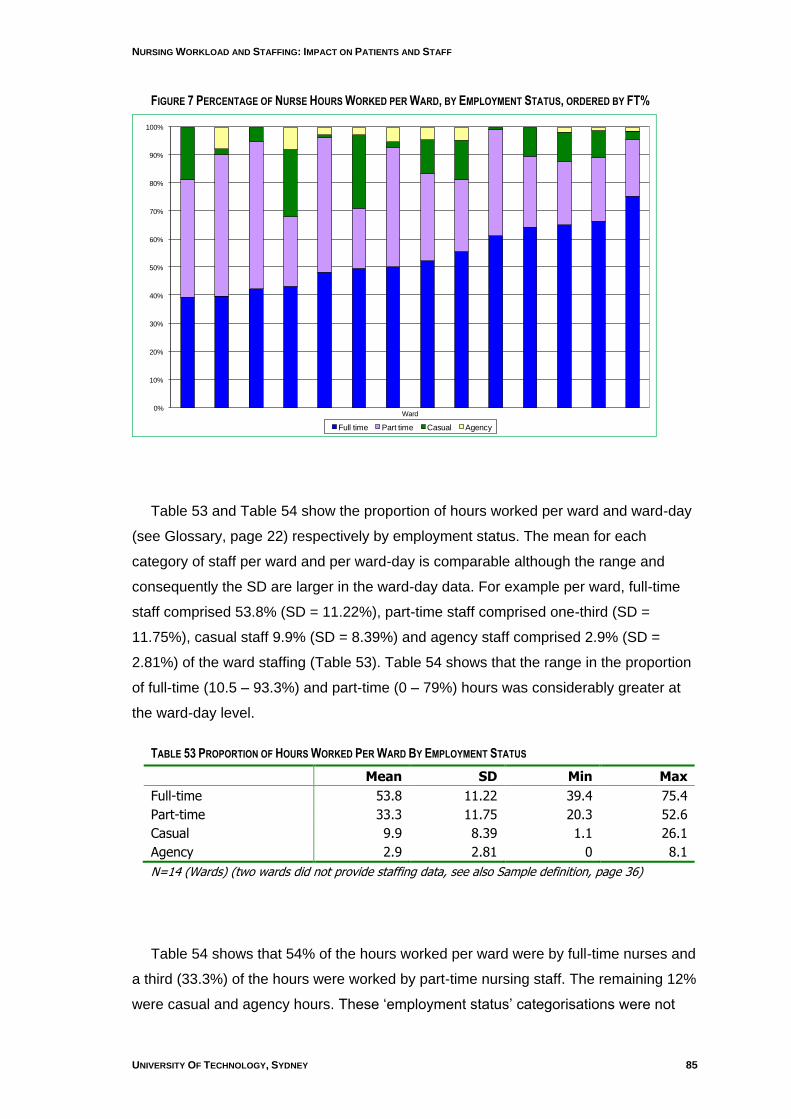
NURSING WORKLOAD AND STAFFING: IMPACT ON PATIENTS AND STAFF
UNIVERSITY OF TECHNOLOGY, SYDNEY 85
FIGURE 7 PERCENTAGE OF NURSE HOURS WORKED PER WARD, BY EMPLOYMENT STATUS, ORDERED BY FT%
0%
10%
20%
30%
40%
50%
60%
70%
80%
90%
100%
Ward
Full time Part time Casual Agency
Table 53 and Table 54 show the proportion of hours worked per ward and ward-day
(see Glossary, page 22) respectively by employment status. The mean for each
category of staff per ward and per ward-day is comparable although the range and
consequently the SD are larger in the ward-day data. For example per ward, full-time
staff comprised 53.8% (SD = 11.22%), part-time staff comprised one-third (SD =
11.75%), casual staff 9.9% (SD = 8.39%) and agency staff comprised 2.9% (SD =
2.81%) of the ward staffing (Table 53). Table 54 shows that the range in the proportion
of full-time (10.5 – 93.3%) and part-time (0 – 79%) hours was considerably greater at
the ward-day level.
TABLE 53 PROPORTION OF HOURS WORKED PER WARD BY EMPLOYMENT STATUS
Mean SD Min Max
Full-time 53.8 11.22 39.4 75.4
Part-time 33.3 11.75 20.3 52.6
Casual 9.9 8.39 1.1 26.1
Agency 2.9 2.81 0 8.1
N=14 (Wards) (two wards did not provide staffing data, see also Sample definition, page 36)
Table 54 shows that 54% of the hours worked per ward were by full-time nurses and
a third (33.3%) of the hours were worked by part-time nursing staff. The remaining 12%
were casual and agency hours. These „employment status‟ categorisations were not
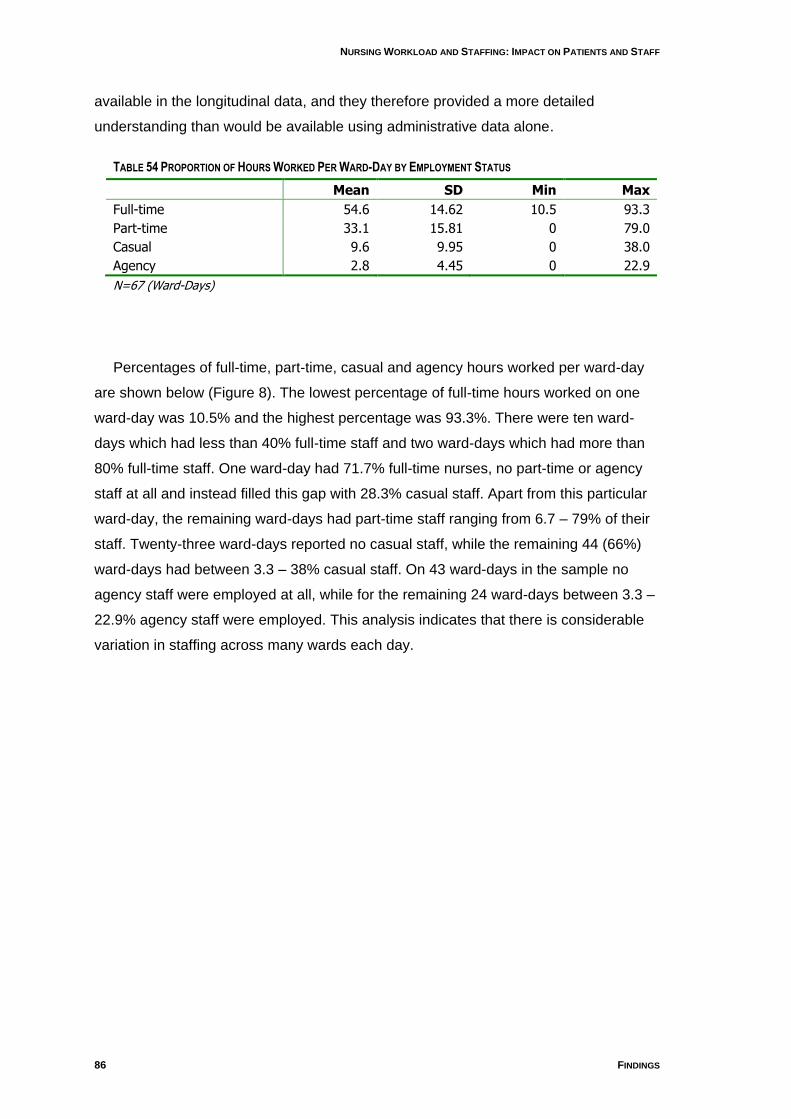
NURSING WORKLOAD AND STAFFING: IMPACT ON PATIENTS AND STAFF
86 FINDINGS
available in the longitudinal data, and they therefore provided a more detailed
understanding than would be available using administrative data alone.
TABLE 54 PROPORTION OF HOURS WORKED PER WARD-DAY BY EMPLOYMENT STATUS
Mean SD Min Max
Full-time 54.6 14.62 10.5 93.3
Part-time 33.1 15.81 0 79.0
Casual 9.6 9.95 0 38.0
Agency 2.8 4.45 0 22.9
N=67 (Ward-Days)
Percentages of full-time, part-time, casual and agency hours worked per ward-day
are shown below (Figure 8). The lowest percentage of full-time hours worked on one
ward-day was 10.5% and the highest percentage was 93.3%. There were ten ward-
days which had less than 40% full-time staff and two ward-days which had more than
80% full-time staff. One ward-day had 71.7% full-time nurses, no part-time or agency
staff at all and instead filled this gap with 28.3% casual staff. Apart from this particular
ward-day, the remaining ward-days had part-time staff ranging from 6.7 – 79% of their
staff. Twenty-three ward-days reported no casual staff, while the remaining 44 (66%)
ward-days had between 3.3 – 38% casual staff. On 43 ward-days in the sample no
agency staff were employed at all, while for the remaining 24 ward-days between 3.3 –
22.9% agency staff were employed. This analysis indicates that there is considerable
variation in staffing across many wards each day.
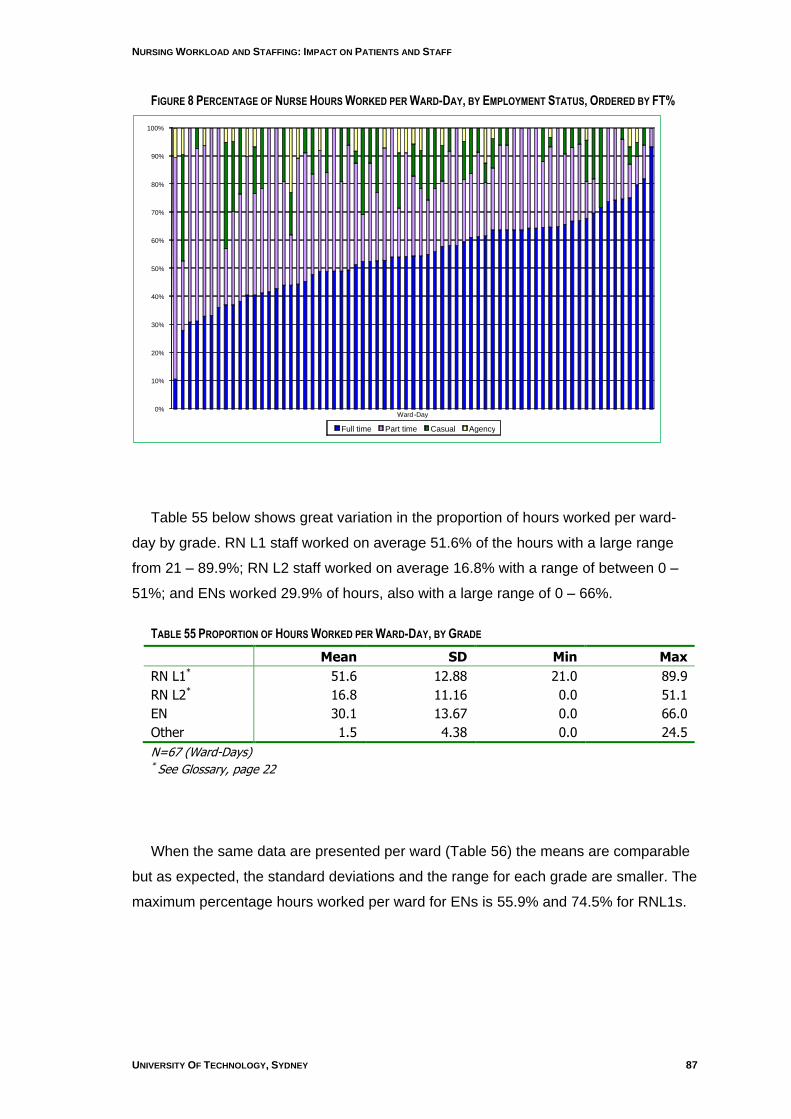
NURSING WORKLOAD AND STAFFING: IMPACT ON PATIENTS AND STAFF
UNIVERSITY OF TECHNOLOGY, SYDNEY 87
FIGURE 8 PERCENTAGE OF NURSE HOURS WORKED PER WARD-DAY, BY EMPLOYMENT STATUS, ORDERED BY FT%
Table 55 below shows great variation in the proportion of hours worked per ward-
day by grade. RN L1 staff worked on average 51.6% of the hours with a large range
from 21 – 89.9%; RN L2 staff worked on average 16.8% with a range of between 0 –
51%; and ENs worked 29.9% of hours, also with a large range of 0 – 66%.
TABLE 55 PROPORTION OF HOURS WORKED PER WARD-DAY, BY GRADE
Mean SD Min Max
RN L1* 51.6 12.88 21.0 89.9
RN L2* 16.8 11.16 0.0 51.1
EN 30.1 13.67 0.0 66.0
Other 1.5 4.38 0.0 24.5
N=67 (Ward-Days) * See Glossary, page 22
When the same data are presented per ward (Table 56) the means are comparable
but as expected, the standard deviations and the range for each grade are smaller. The
maximum percentage hours worked per ward for ENs is 55.9% and 74.5% for RNL1s.
0%
10%
20%
30%
40%
50%
60%
70%
80%
90%
100%
Ward - Day Full time Part time Casual Agency
NURSING WORKLOAD AND STAFFING: IMPACT ON PATIENTS AND STAFF
88 FINDINGS
TABLE 56 PROPORTION OF HOURS WORKED PER WARD, BY GRADE
Mean SD Min Max
RN L1 51.7 10.66 35.3 74.5
RN L2 16.9 10.26 0.0 33.5
EN 30.0 11.39 15.2 55.9
Other 1.5 2.87 0.0 10.2
N=14 (Wards) (two wards did not provide staffing data, see also Sample definition, page 36)
Staffing data were also examined for skill mix across three equal „shift-periods‟ (see
Table 6, page 25), referred to as morning (0700-1500), evening (1500-2300) and night
(2300-0700) „shift-periods‟. Raw staffing data were apportioned to these periods to
provide an indication of the relative availability of these staffing categories during the
day, evening or night (see also Table 6, page 25). Similar proportions of all categories
were found on morning and evening shift-periods, while the night period showed an
increased presence of ENs, significantly fewer RNL1 hours, and slightly fewer RNL2
hours (Table 57).
TABLE 57 PROPORTION OF HOURS WORKED PER SHIFT-PERIOD BY GRADE
% Hours Evening Morning Night
RNL1 54.0% 54.0% 41.8%
RNL2 17.6% 16.6% 15.9%
EN 27.5% 27.4% 41.1%
Other 1.0% 1.9% 1.2%
N=1292 (Shift-periods)
A comparison of cross-sectional and longitudinal staffing data indicated that there
were similar mean proportions of staffing hours per ward (eg RN = 68.5% and 68.4%
respectively), although with slightly greater variation in the cross-sectional data (eg RN
SD = 12.20 and 9.72 respectively, see Table 58).
NURSING WORKLOAD AND STAFFING: IMPACT ON PATIENTS AND STAFF
UNIVERSITY OF TECHNOLOGY, SYDNEY 89
EQUATION 1 PATIENTS PER BED
NumberofPatientsOnWardPerDayPatientsPerBed=
NumberofBedsPerDay
EQUATION 2 NURSING HOURS PER PATIENT DAY
NursingHoursWorkedOnWardNHPPD=
NumberofPatients
TABLE 58 COMPARISON OF LONGITUDINAL & CROSS-SECTIONAL STAFFING PROFILE, BY GRADE
N* Mean SD Min Max
Cross-sectional
RN 14 68.5 12.20 44.1 82.0
EN 14 30.0 11.39 15.2 55.9
Other 14 1.7 2.93 0.0 10.2
Longitudinal
RN 14 68.4 9.72 49.9 84.1
EN 14 31.6 9.72 16.0 50.1
Other 14 0.0 0.00 0.0 0.0
* Two wards did not provide cross-sectional staffing data, see also Sample definition, page 36
Nursing Workload
The movement of patients through the ward is referred to as patient “churn”. Each
new admission, transfer, or discharge, requires documentation, orientation, clinical
assessment and management review, and other tasks associated with the patient. In
order to provide an indication of the amount of churn per ward, “Patients per bed” was
calculated per ward by dividing the number of patients per day by the number of beds
(Equation 1). This calculation does not include bed movements within the ward. While
the mean was one patient per
bed per day there was
considerable variation between
wards, with the range from less
than one patient (0.7) per bed per day and the maximum 1.2 (Table 59). When
examined on a day by day basis, rather than averaged across the ward sample period,
the maximum rose to 1.4, with a larger range (0.5 – 1.4).
TABLE 59 PATIENTS PER BED
N Mean SD Min Max
Patients per bed by ward 14* 1.0 0.14 0.7 1.2
Patients per bed by ward-day 67 1.0 0.15 0.5 1.4
* Two wards did not provide cross-sectional staffing data, see also Sample definition, page 36
Nursing hours per patient day & hours of care required per patient day
Nursing hours per patient day
(NHPPD, Equation 2) provided varied
considerably on a per day basis (mean
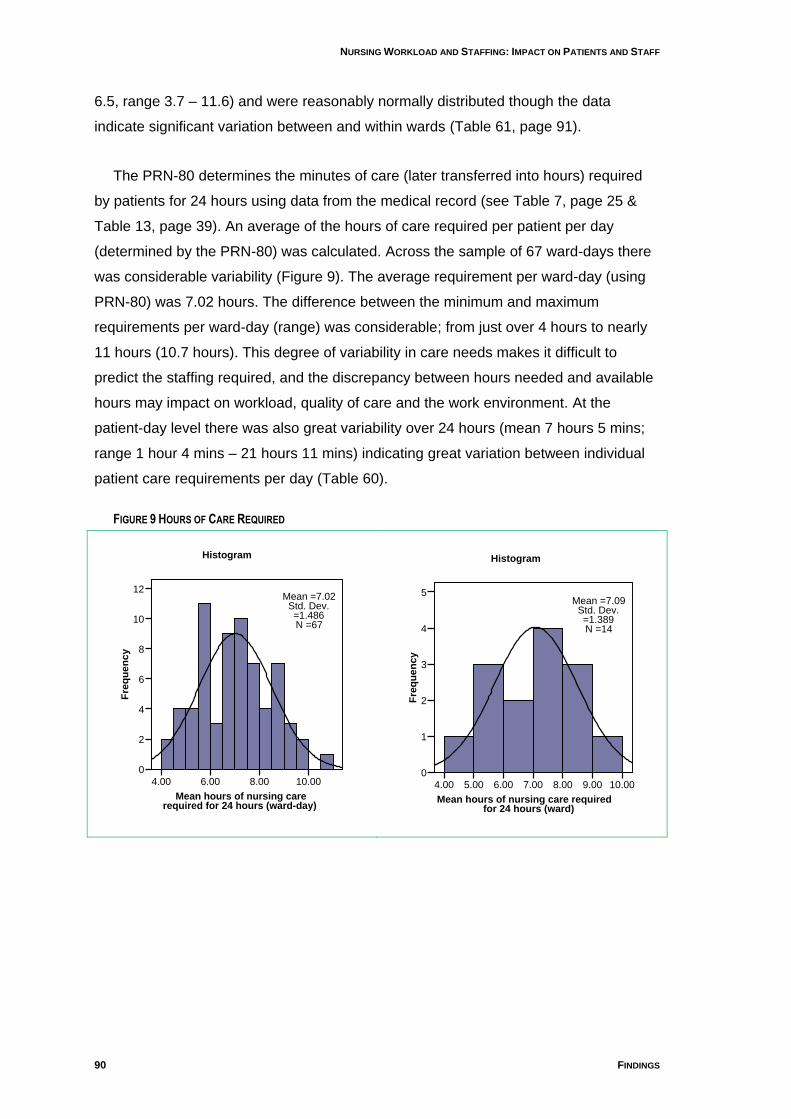
NURSING WORKLOAD AND STAFFING: IMPACT ON PATIENTS AND STAFF
90 FINDINGS
6.5, range 3.7 – 11.6) and were reasonably normally distributed though the data
indicate significant variation between and within wards (Table 61, page 91).
The PRN-80 determines the minutes of care (later transferred into hours) required
by patients for 24 hours using data from the medical record (see Table 7, page 25 &
Table 13, page 39). An average of the hours of care required per patient per day
(determined by the PRN-80) was calculated. Across the sample of 67 ward-days there
was considerable variability (Figure 9). The average requirement per ward-day (using
PRN-80) was 7.02 hours. The difference between the minimum and maximum
requirements per ward-day (range) was considerable; from just over 4 hours to nearly
11 hours (10.7 hours). This degree of variability in care needs makes it difficult to
predict the staffing required, and the discrepancy between hours needed and available
hours may impact on workload, quality of care and the work environment. At the
patient-day level there was also great variability over 24 hours (mean 7 hours 5 mins;
range 1 hour 4 mins – 21 hours 11 mins) indicating great variation between individual
patient care requirements per day (Table 60).
FIGURE 9 HOURS OF CARE REQUIRED
Mean hours of nursing care required for 24 hours (ward-day)
10.008.006.004.00
Fre
qu
en
cy
12
10
8
6
4
2
0
Histogram
Mean =7.02Std. Dev. =1.486N =67
Mean hours of nursing care required
for 24 hours (ward)
10.009.008.007.006.005.004.00
Fre
qu
en
cy
5
4
3
2
1
0
Histogram
Mean =7.09Std. Dev. =1.389N =14
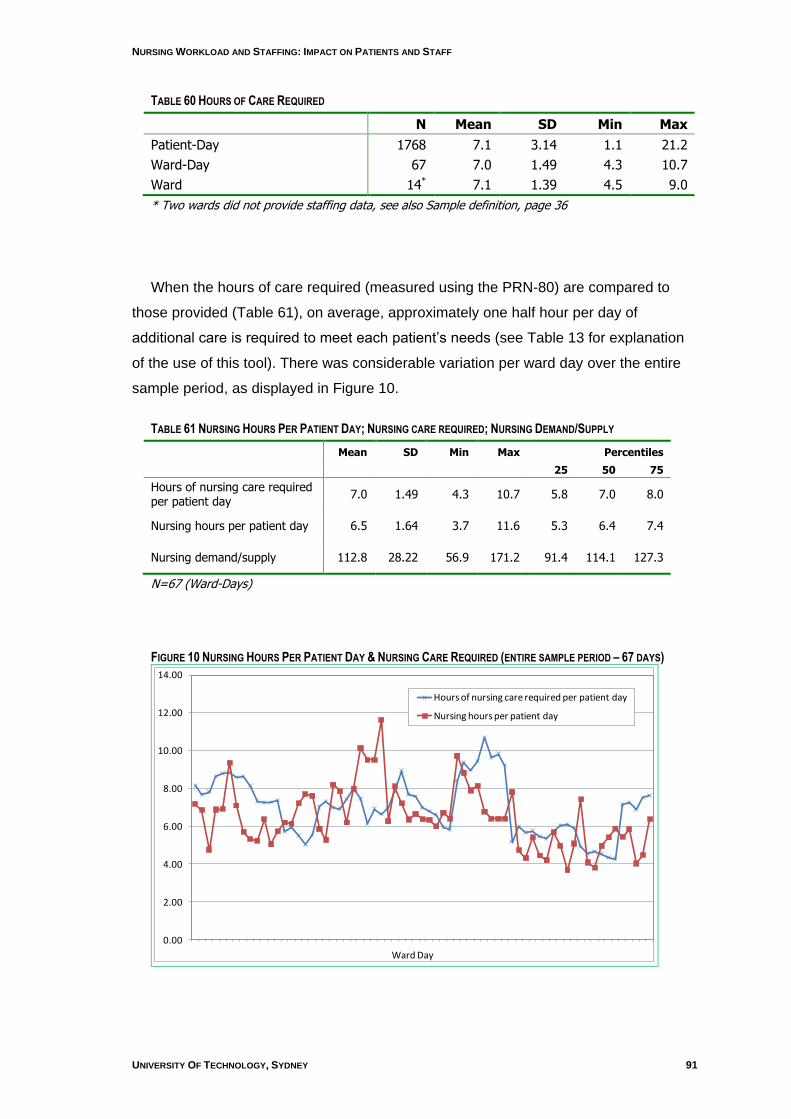
NURSING WORKLOAD AND STAFFING: IMPACT ON PATIENTS AND STAFF
UNIVERSITY OF TECHNOLOGY, SYDNEY 91
TABLE 60 HOURS OF CARE REQUIRED
N Mean SD Min Max
Patient-Day 1768 7.1 3.14 1.1 21.2
Ward-Day 67 7.0 1.49 4.3 10.7
Ward 14* 7.1 1.39 4.5 9.0
* Two wards did not provide staffing data, see also Sample definition, page 36
When the hours of care required (measured using the PRN-80) are compared to
those provided (Table 61), on average, approximately one half hour per day of
additional care is required to meet each patient‟s needs (see Table 13 for explanation
of the use of this tool). There was considerable variation per ward day over the entire
sample period, as displayed in Figure 10.
TABLE 61 NURSING HOURS PER PATIENT DAY; NURSING CARE REQUIRED; NURSING DEMAND/SUPPLY
Mean SD Min Max Percentiles
25 50 75
Hours of nursing care required per patient day
7.0 1.49 4.3 10.7 5.8 7.0 8.0
Nursing hours per patient day 6.5 1.64 3.7 11.6 5.3 6.4 7.4
Nursing demand/supply 112.8 28.22 56.9 171.2 91.4 114.1 127.3
N=67 (Ward-Days)
FIGURE 10 NURSING HOURS PER PATIENT DAY & NURSING CARE REQUIRED (ENTIRE SAMPLE PERIOD – 67 DAYS)
0.00
2.00
4.00
6.00
8.00
10.00
12.00
14.00
Hours of nursing care required per patient day
Nursing hours per patient day
Ward Day
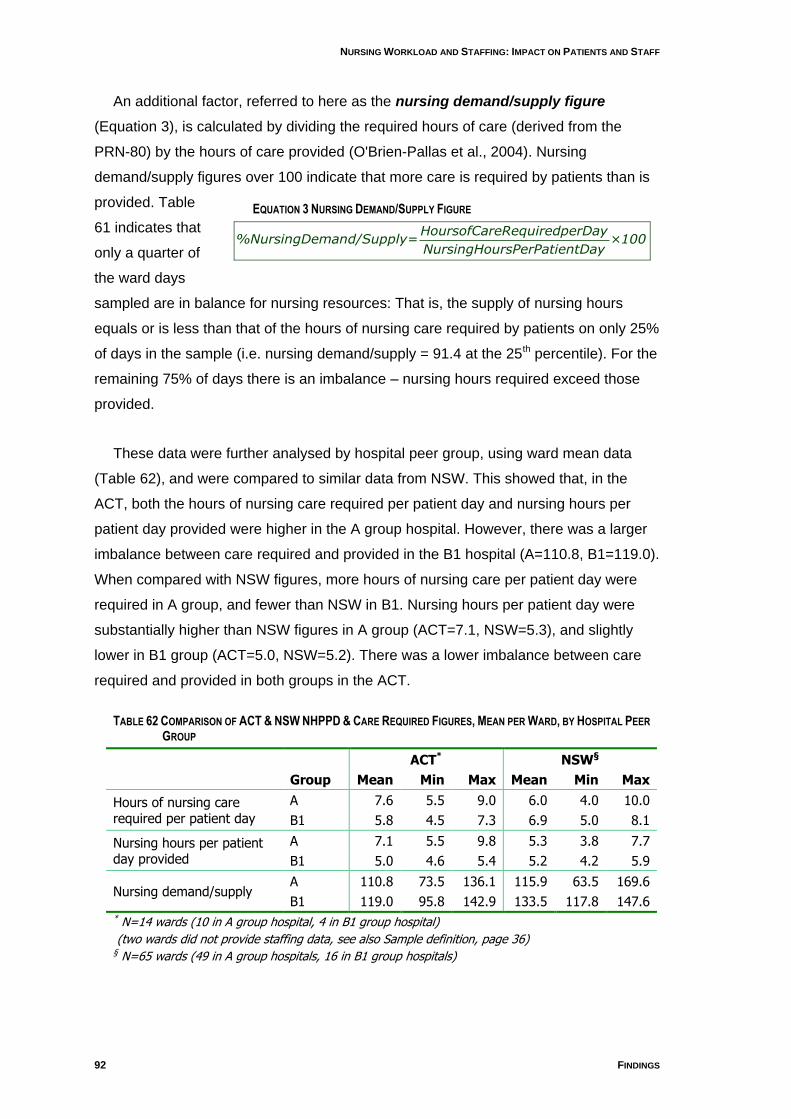
NURSING WORKLOAD AND STAFFING: IMPACT ON PATIENTS AND STAFF
92 FINDINGS
EQUATION 3 NURSING DEMAND/SUPPLY FIGURE
HoursofCareRequiredperDay%NursingDemand/Supply= ×100
NursingHoursPerPatientDay
An additional factor, referred to here as the nursing demand/supply figure
(Equation 3), is calculated by dividing the required hours of care (derived from the
PRN-80) by the hours of care provided (O'Brien-Pallas et al., 2004). Nursing
demand/supply figures over 100 indicate that more care is required by patients than is
provided. Table
61 indicates that
only a quarter of
the ward days
sampled are in balance for nursing resources: That is, the supply of nursing hours
equals or is less than that of the hours of nursing care required by patients on only 25%
of days in the sample (i.e. nursing demand/supply = 91.4 at the 25th percentile). For the
remaining 75% of days there is an imbalance – nursing hours required exceed those
provided.
These data were further analysed by hospital peer group, using ward mean data
(Table 62), and were compared to similar data from NSW. This showed that, in the
ACT, both the hours of nursing care required per patient day and nursing hours per
patient day provided were higher in the A group hospital. However, there was a larger
imbalance between care required and provided in the B1 hospital (A=110.8, B1=119.0).
When compared with NSW figures, more hours of nursing care per patient day were
required in A group, and fewer than NSW in B1. Nursing hours per patient day were
substantially higher than NSW figures in A group (ACT=7.1, NSW=5.3), and slightly
lower in B1 group (ACT=5.0, NSW=5.2). There was a lower imbalance between care
required and provided in both groups in the ACT.
TABLE 62 COMPARISON OF ACT & NSW NHPPD & CARE REQUIRED FIGURES, MEAN PER WARD, BY HOSPITAL PEER
GROUP
ACT* NSW§
Group Mean Min Max Mean Min Max
Hours of nursing care required per patient day
A 7.6 5.5 9.0 6.0 4.0 10.0
B1 5.8 4.5 7.3 6.9 5.0 8.1
Nursing hours per patient day provided
A 7.1 5.5 9.8 5.3 3.8 7.7
B1 5.0 4.6 5.4 5.2 4.2 5.9
Nursing demand/supply A 110.8 73.5 136.1 115.9 63.5 169.6
B1 119.0 95.8 142.9 133.5 117.8 147.6 * N=14 wards (10 in A group hospital, 4 in B1 group hospital)
(two wards did not provide staffing data, see also Sample definition, page 36) § N=65 wards (49 in A group hospitals, 16 in B1 group hospitals)
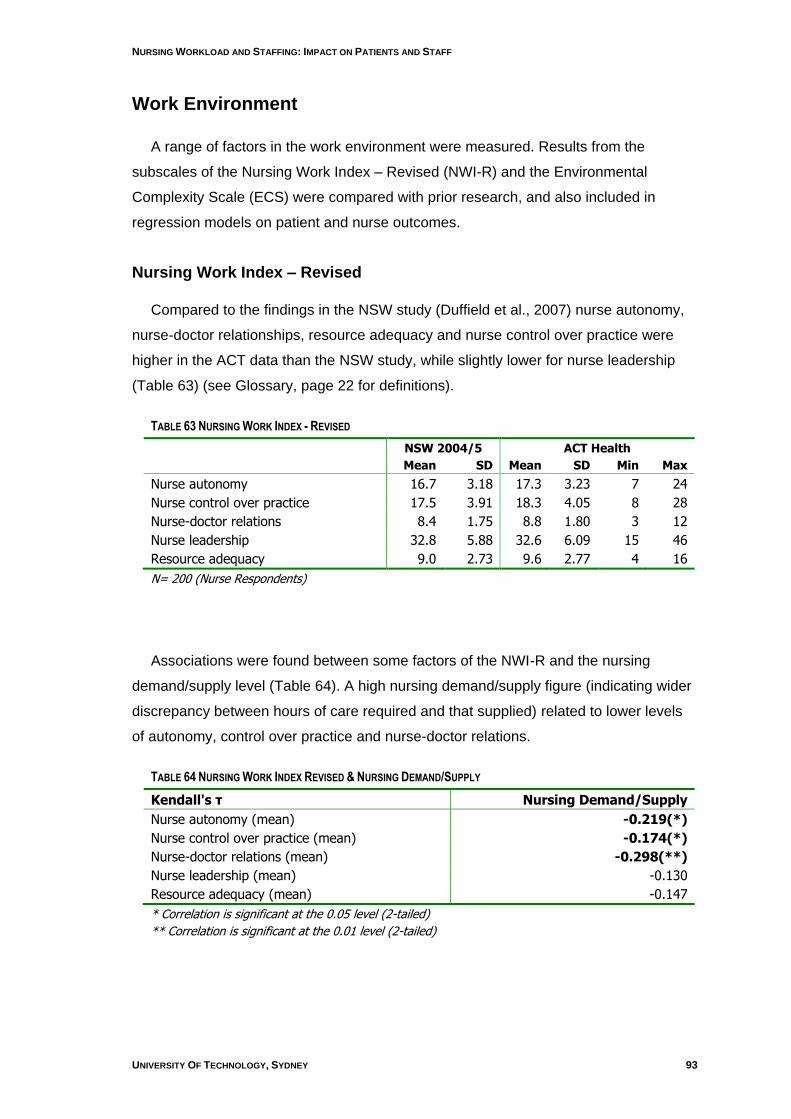
NURSING WORKLOAD AND STAFFING: IMPACT ON PATIENTS AND STAFF
UNIVERSITY OF TECHNOLOGY, SYDNEY 93
Work Environment
A range of factors in the work environment were measured. Results from the
subscales of the Nursing Work Index – Revised (NWI-R) and the Environmental
Complexity Scale (ECS) were compared with prior research, and also included in
regression models on patient and nurse outcomes.
Nursing Work Index – Revised
Compared to the findings in the NSW study (Duffield et al., 2007) nurse autonomy,
nurse-doctor relationships, resource adequacy and nurse control over practice were
higher in the ACT data than the NSW study, while slightly lower for nurse leadership
(Table 63) (see Glossary, page 22 for definitions).
TABLE 63 NURSING WORK INDEX - REVISED
NSW 2004/5 ACT Health
Mean SD Mean SD Min Max
Nurse autonomy 16.7 3.18 17.3 3.23 7 24
Nurse control over practice 17.5 3.91 18.3 4.05 8 28
Nurse-doctor relations 8.4 1.75 8.8 1.80 3 12
Nurse leadership 32.8 5.88 32.6 6.09 15 46
Resource adequacy 9.0 2.73 9.6 2.77 4 16
N= 200 (Nurse Respondents)
Associations were found between some factors of the NWI-R and the nursing
demand/supply level (Table 64). A high nursing demand/supply figure (indicating wider
discrepancy between hours of care required and that supplied) related to lower levels
of autonomy, control over practice and nurse-doctor relations.
TABLE 64 NURSING WORK INDEX REVISED & NURSING DEMAND/SUPPLY
Kendall's τ Nursing Demand/Supply
Nurse autonomy (mean) -0.219(*)
Nurse control over practice (mean) -0.174(*)
Nurse-doctor relations (mean) -0.298(**)
Nurse leadership (mean) -0.130
Resource adequacy (mean) -0.147
* Correlation is significant at the 0.05 level (2-tailed)
** Correlation is significant at the 0.01 level (2-tailed)

NURSING WORKLOAD AND STAFFING: IMPACT ON PATIENTS AND STAFF
94 FINDINGS
Environmental Complexity Scale
This instrument was completed by nurses per shift2. Compared to results in the
NSW study (Duffield et al., 2007), nurses in ACT scored slightly higher for
unanticipated changes in patient acuity (6.4, SD = 1.02), and identically in the other two
sub-scales.
TABLE 65 ENVIRONMENTAL COMPLEXITY SCALE
NSW 2004/5§ ACT*
Mean SD Mean SD Min Max
Re-sequencing of work in response to others
5.9 0.88 5.9 0.79 4.3 9.3
Unanticipated changes in patient acuity
6.3 1.04 6.4 1.02 4.6 10
Composition and characteristics of the care team
6.4 1.06 6.4 1.28 0 10
* N = 612 (Shifts) § N = 6839 (Shifts)
Items one and two on the Environment Complexity Scale referred specifically to the
impact of students on the ward. In both instances, the majority of responses indicated
that students were not present on that shift (Table 66 & Table 67). When students were
present on the ward, over half of respondents suggested that their workload increased.
TABLE 66 ECS ITEM 1: STUDENTS ON THE UNIT REQUIRED SUPERVISION AND ASSISTANCE
Students required supervision/assistance Frequency Percent
Increased 102 16.7
Decreased 15 2.5
Same 55 9.0
N/A 440 71.9
N = 612 (Shifts)
2 Note that the term „shift‟ indicates the shift as reported by the respondent. It is not the same as
a „shift-period‟ derived from roster data (see Table 6, page 25).

NURSING WORKLOAD AND STAFFING: IMPACT ON PATIENTS AND STAFF
UNIVERSITY OF TECHNOLOGY, SYDNEY 95
TABLE 67 ECS ITEM 2: STUDENTS WANTED ACCESS TO CHARTS, EQUIPMENT AND SUPPLIES
Students wanted access to charts, etc Frequency Percent
Increased 97 15.8
Decreased 5 0.8
Same 57 9.3
N/A 453 74.0
N = 612 (Shifts)
Quality of Care
Nurses were asked on the Environmental Complexity Scale “How would you
describe the quality of your nursing care delivered during this shift?” The response
choices were “excellent”, “good”, “fair” and “poor”. They were also asked on the Nurse
Survey for their view of the changes in quality of care over the past 12 months (see
Appendix 7, Instruments).
Table 68 indicates the quality of care reported per shift. Of the 612 responses 88%
of nurses rated the quality of care as excellent or good while 12% reported it as fair or
poor over the past shift.
When asked to indicate whether the quality of care given over the last 12 months
had changed on their wards, 80% of respondents indicated that it had improved or
remained the same, and 20% believed that it had deteriorated (Table 69).
TABLE 68 QUALITY OF CARE PER SHIFT
Frequency Percentage
Excellent/good 537 87.7
Fair/poor 75 12.3
Total 612 100.0
TABLE 69 QUALITY OF CARE OVER THE PAST YEAR
Frequency Percentage
Improved 38 19.0
Remained same 122 61.0
Deteriorated 40 20.0
Total 200 100.0
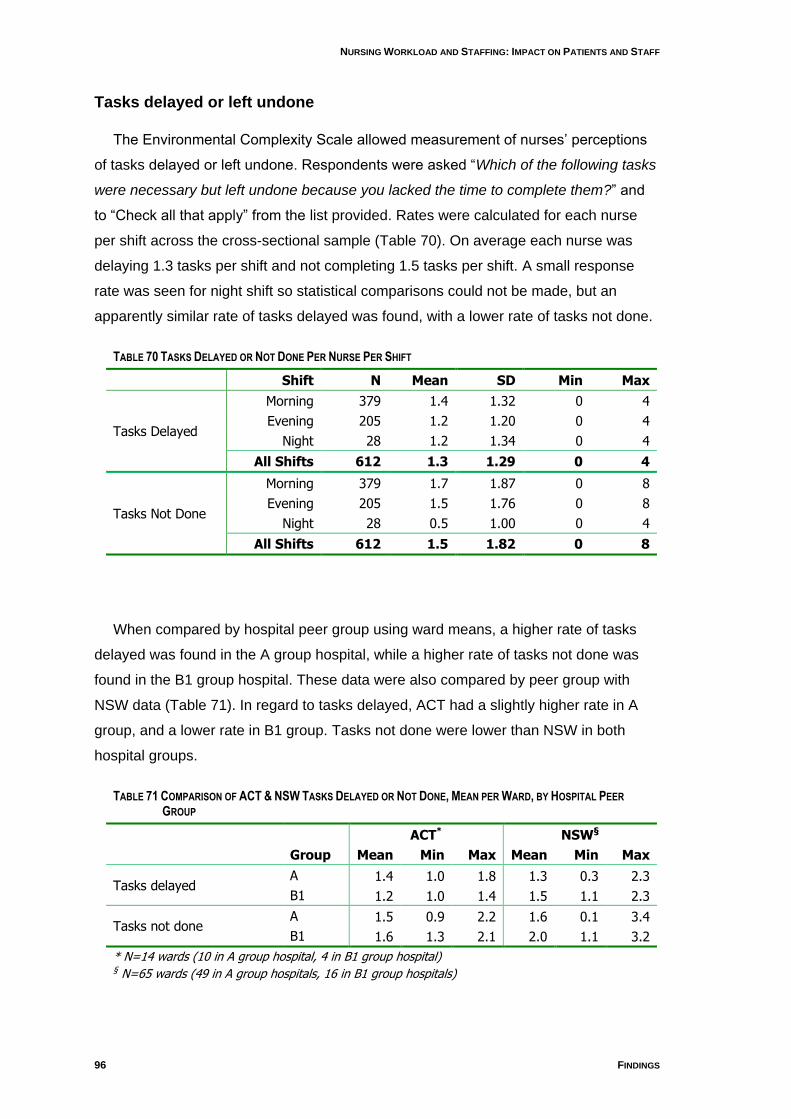
NURSING WORKLOAD AND STAFFING: IMPACT ON PATIENTS AND STAFF
96 FINDINGS
Tasks delayed or left undone
The Environmental Complexity Scale allowed measurement of nurses‟ perceptions
of tasks delayed or left undone. Respondents were asked “Which of the following tasks
were necessary but left undone because you lacked the time to complete them?” and
to “Check all that apply” from the list provided. Rates were calculated for each nurse
per shift across the cross-sectional sample (Table 70). On average each nurse was
delaying 1.3 tasks per shift and not completing 1.5 tasks per shift. A small response
rate was seen for night shift so statistical comparisons could not be made, but an
apparently similar rate of tasks delayed was found, with a lower rate of tasks not done.
TABLE 70 TASKS DELAYED OR NOT DONE PER NURSE PER SHIFT
Shift N Mean SD Min Max
Tasks Delayed
Morning 379 1.4 1.32 0 4
Evening 205 1.2 1.20 0 4
Night 28 1.2 1.34 0 4
All Shifts 612 1.3 1.29 0 4
Tasks Not Done
Morning 379 1.7 1.87 0 8
Evening 205 1.5 1.76 0 8
Night 28 0.5 1.00 0 4
All Shifts 612 1.5 1.82 0 8
When compared by hospital peer group using ward means, a higher rate of tasks
delayed was found in the A group hospital, while a higher rate of tasks not done was
found in the B1 group hospital. These data were also compared by peer group with
NSW data (Table 71). In regard to tasks delayed, ACT had a slightly higher rate in A
group, and a lower rate in B1 group. Tasks not done were lower than NSW in both
hospital groups.
TABLE 71 COMPARISON OF ACT & NSW TASKS DELAYED OR NOT DONE, MEAN PER WARD, BY HOSPITAL PEER
GROUP
ACT* NSW§
Group Mean Min Max Mean Min Max
Tasks delayed A 1.4 1.0 1.8 1.3 0.3 2.3
B1 1.2 1.0 1.4 1.5 1.1 2.3
Tasks not done A 1.5 0.9 2.2 1.6 0.1 3.4
B1 1.6 1.3 2.1 2.0 1.1 3.2
* N=14 wards (10 in A group hospital, 4 in B1 group hospital) § N=65 wards (49 in A group hospitals, 16 in B1 group hospitals)
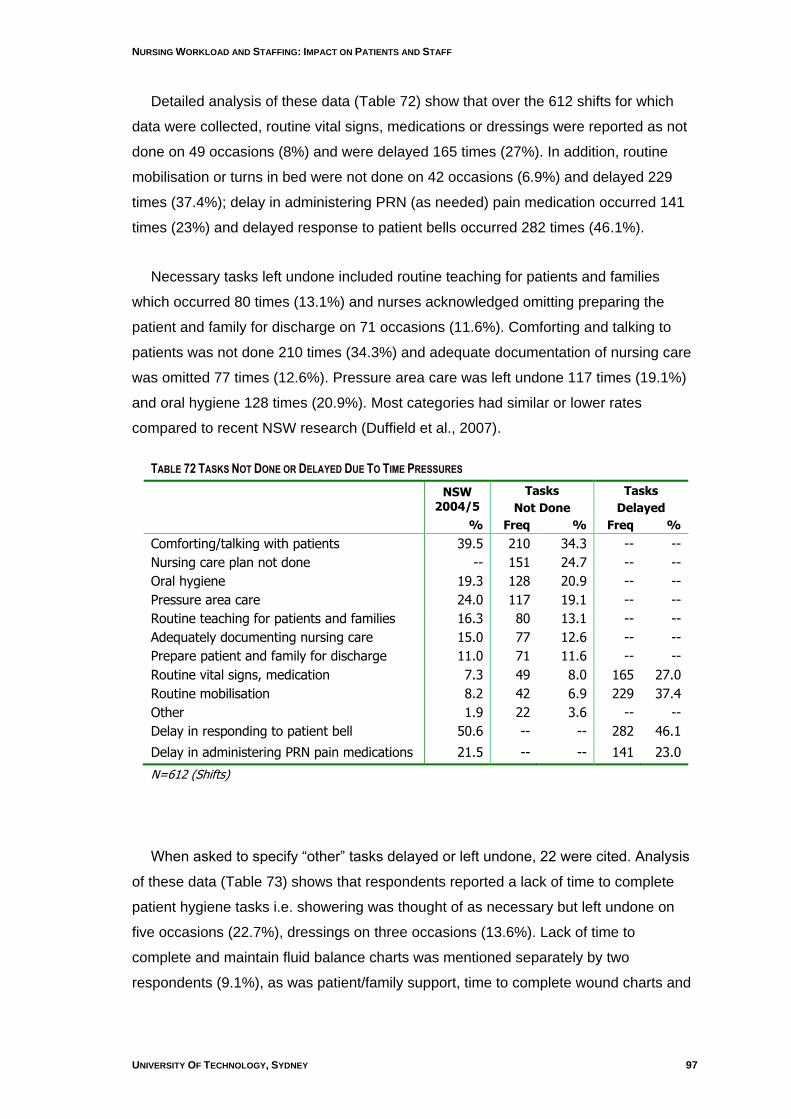
NURSING WORKLOAD AND STAFFING: IMPACT ON PATIENTS AND STAFF
UNIVERSITY OF TECHNOLOGY, SYDNEY 97
Detailed analysis of these data (Table 72) show that over the 612 shifts for which
data were collected, routine vital signs, medications or dressings were reported as not
done on 49 occasions (8%) and were delayed 165 times (27%). In addition, routine
mobilisation or turns in bed were not done on 42 occasions (6.9%) and delayed 229
times (37.4%); delay in administering PRN (as needed) pain medication occurred 141
times (23%) and delayed response to patient bells occurred 282 times (46.1%).
Necessary tasks left undone included routine teaching for patients and families
which occurred 80 times (13.1%) and nurses acknowledged omitting preparing the
patient and family for discharge on 71 occasions (11.6%). Comforting and talking to
patients was not done 210 times (34.3%) and adequate documentation of nursing care
was omitted 77 times (12.6%). Pressure area care was left undone 117 times (19.1%)
and oral hygiene 128 times (20.9%). Most categories had similar or lower rates
compared to recent NSW research (Duffield et al., 2007).
TABLE 72 TASKS NOT DONE OR DELAYED DUE TO TIME PRESSURES
NSW
2004/5
Tasks
Not Done
Tasks
Delayed
% Freq % Freq %
Comforting/talking with patients 39.5 210 34.3 -- --
Nursing care plan not done -- 151 24.7 -- --
Oral hygiene 19.3 128 20.9 -- --
Pressure area care 24.0 117 19.1 -- --
Routine teaching for patients and families 16.3 80 13.1 -- --
Adequately documenting nursing care 15.0 77 12.6 -- --
Prepare patient and family for discharge 11.0 71 11.6 -- --
Routine vital signs, medication 7.3 49 8.0 165 27.0
Routine mobilisation 8.2 42 6.9 229 37.4
Other 1.9 22 3.6 -- --
Delay in responding to patient bell 50.6 -- -- 282 46.1
Delay in administering PRN pain medications 21.5 -- -- 141 23.0
N=612 (Shifts)
When asked to specify “other” tasks delayed or left undone, 22 were cited. Analysis
of these data (Table 73) shows that respondents reported a lack of time to complete
patient hygiene tasks i.e. showering was thought of as necessary but left undone on
five occasions (22.7%), dressings on three occasions (13.6%). Lack of time to
complete and maintain fluid balance charts was mentioned separately by two
respondents (9.1%), as was patient/family support, time to complete wound charts and
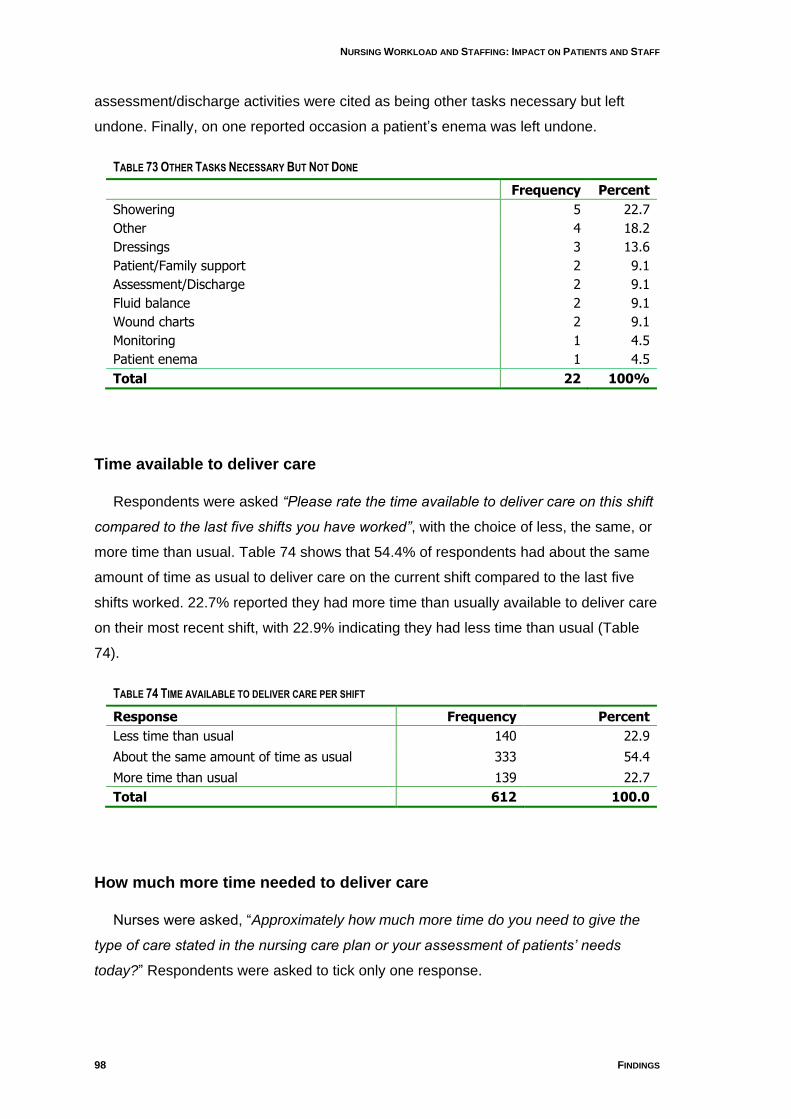
NURSING WORKLOAD AND STAFFING: IMPACT ON PATIENTS AND STAFF
98 FINDINGS
assessment/discharge activities were cited as being other tasks necessary but left
undone. Finally, on one reported occasion a patient‟s enema was left undone.
TABLE 73 OTHER TASKS NECESSARY BUT NOT DONE
Frequency Percent
Showering 5 22.7
Other 4 18.2
Dressings 3 13.6
Patient/Family support 2 9.1
Assessment/Discharge 2 9.1
Fluid balance 2 9.1
Wound charts 2 9.1
Monitoring 1 4.5
Patient enema 1 4.5
Total 22 100%
Time available to deliver care
Respondents were asked “Please rate the time available to deliver care on this shift
compared to the last five shifts you have worked”, with the choice of less, the same, or
more time than usual. Table 74 shows that 54.4% of respondents had about the same
amount of time as usual to deliver care on the current shift compared to the last five
shifts worked. 22.7% reported they had more time than usually available to deliver care
on their most recent shift, with 22.9% indicating they had less time than usual (Table
74).
TABLE 74 TIME AVAILABLE TO DELIVER CARE PER SHIFT
Response Frequency Percent
Less time than usual 140 22.9
About the same amount of time as usual 333 54.4
More time than usual 139 22.7
Total 612 100.0
How much more time needed to deliver care
Nurses were asked, “Approximately how much more time do you need to give the
type of care stated in the nursing care plan or your assessment of patients‟ needs
today?” Respondents were asked to tick only one response.
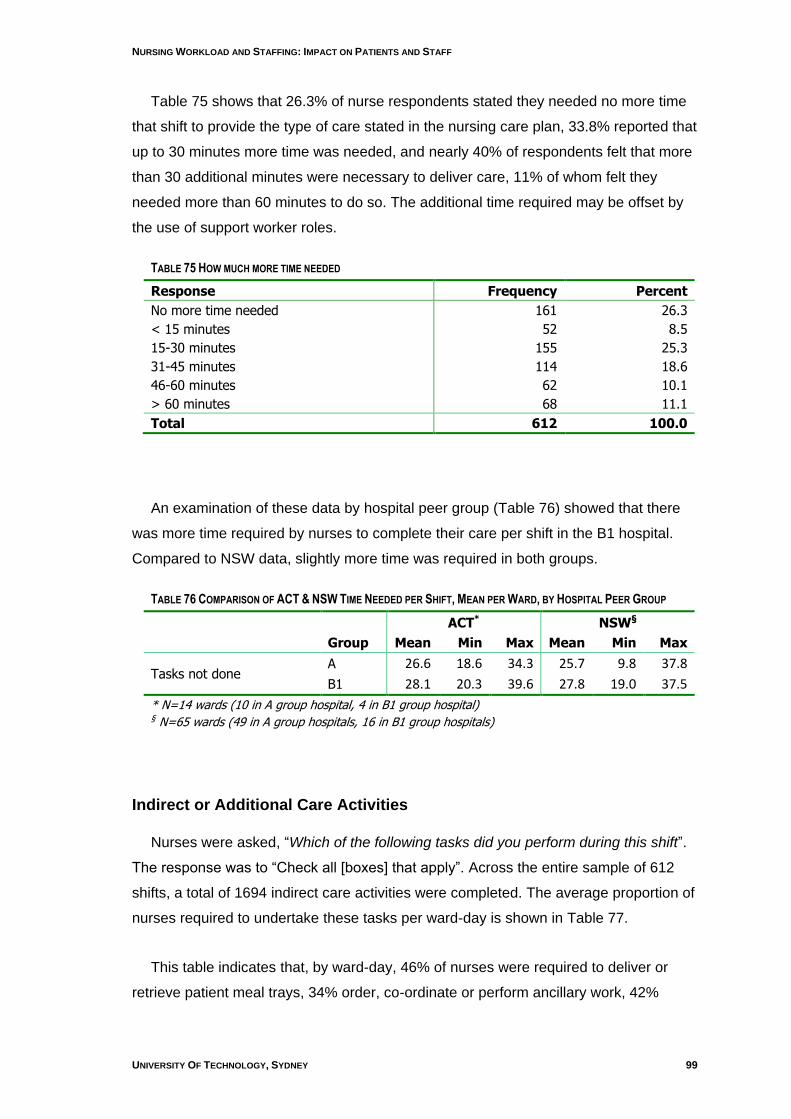
NURSING WORKLOAD AND STAFFING: IMPACT ON PATIENTS AND STAFF
UNIVERSITY OF TECHNOLOGY, SYDNEY 99
Table 75 shows that 26.3% of nurse respondents stated they needed no more time
that shift to provide the type of care stated in the nursing care plan, 33.8% reported that
up to 30 minutes more time was needed, and nearly 40% of respondents felt that more
than 30 additional minutes were necessary to deliver care, 11% of whom felt they
needed more than 60 minutes to do so. The additional time required may be offset by
the use of support worker roles.
TABLE 75 HOW MUCH MORE TIME NEEDED
Response Frequency Percent
No more time needed 161 26.3
< 15 minutes 52 8.5
15-30 minutes 155 25.3
31-45 minutes 114 18.6
46-60 minutes 62 10.1
> 60 minutes 68 11.1
Total 612 100.0
An examination of these data by hospital peer group (Table 76) showed that there
was more time required by nurses to complete their care per shift in the B1 hospital.
Compared to NSW data, slightly more time was required in both groups.
TABLE 76 COMPARISON OF ACT & NSW TIME NEEDED PER SHIFT, MEAN PER WARD, BY HOSPITAL PEER GROUP
ACT* NSW§
Group Mean Min Max Mean Min Max
Tasks not done A 26.6 18.6 34.3 25.7 9.8 37.8
B1 28.1 20.3 39.6 27.8 19.0 37.5
* N=14 wards (10 in A group hospital, 4 in B1 group hospital) § N=65 wards (49 in A group hospitals, 16 in B1 group hospitals)
Indirect or Additional Care Activities
Nurses were asked, “Which of the following tasks did you perform during this shift”.
The response was to “Check all [boxes] that apply”. Across the entire sample of 612
shifts, a total of 1694 indirect care activities were completed. The average proportion of
nurses required to undertake these tasks per ward-day is shown in Table 77.
This table indicates that, by ward-day, 46% of nurses were required to deliver or
retrieve patient meal trays, 34% order, co-ordinate or perform ancillary work, 42%
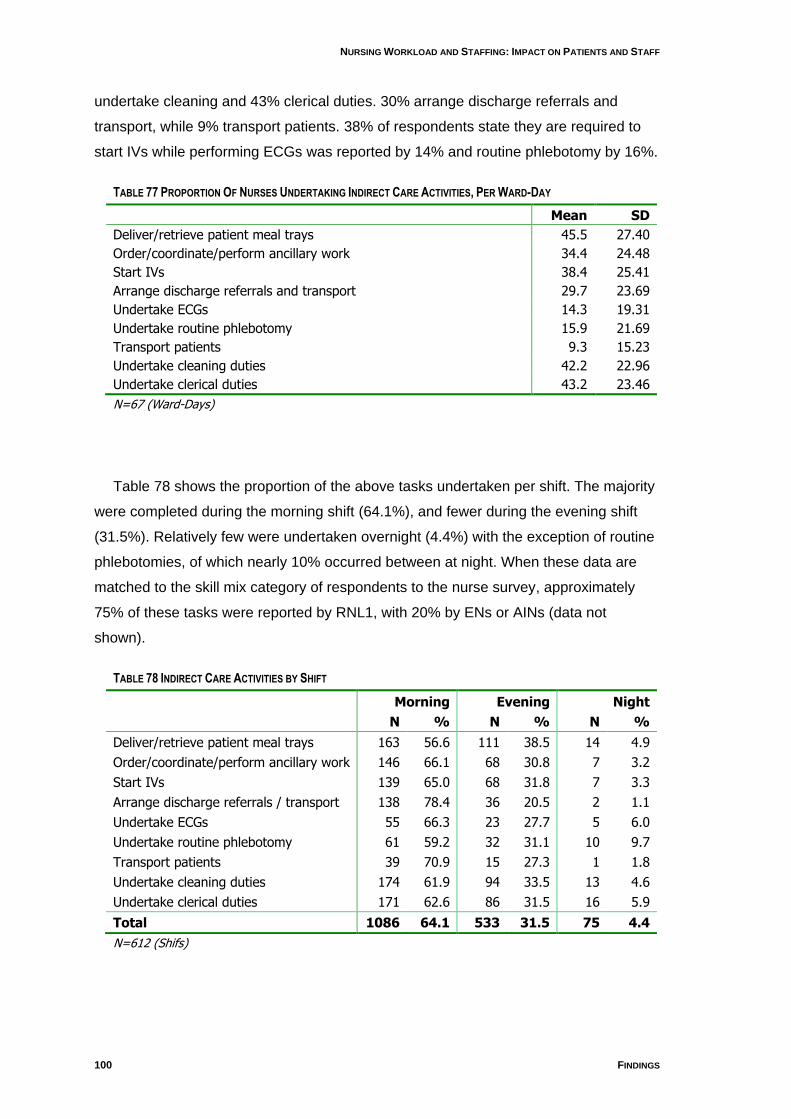
NURSING WORKLOAD AND STAFFING: IMPACT ON PATIENTS AND STAFF
100 FINDINGS
undertake cleaning and 43% clerical duties. 30% arrange discharge referrals and
transport, while 9% transport patients. 38% of respondents state they are required to
start IVs while performing ECGs was reported by 14% and routine phlebotomy by 16%.
TABLE 77 PROPORTION OF NURSES UNDERTAKING INDIRECT CARE ACTIVITIES, PER WARD-DAY
Mean SD
Deliver/retrieve patient meal trays 45.5 27.40
Order/coordinate/perform ancillary work 34.4 24.48
Start IVs 38.4 25.41
Arrange discharge referrals and transport 29.7 23.69
Undertake ECGs 14.3 19.31
Undertake routine phlebotomy 15.9 21.69
Transport patients 9.3 15.23
Undertake cleaning duties 42.2 22.96
Undertake clerical duties 43.2 23.46
N=67 (Ward-Days)
Table 78 shows the proportion of the above tasks undertaken per shift. The majority
were completed during the morning shift (64.1%), and fewer during the evening shift
(31.5%). Relatively few were undertaken overnight (4.4%) with the exception of routine
phlebotomies, of which nearly 10% occurred between at night. When these data are
matched to the skill mix category of respondents to the nurse survey, approximately
75% of these tasks were reported by RNL1, with 20% by ENs or AINs (data not
shown).
TABLE 78 INDIRECT CARE ACTIVITIES BY SHIFT
Morning Evening Night
N % N % N %
Deliver/retrieve patient meal trays 163 56.6 111 38.5 14 4.9
Order/coordinate/perform ancillary work 146 66.1 68 30.8 7 3.2
Start IVs 139 65.0 68 31.8 7 3.3
Arrange discharge referrals / transport 138 78.4 36 20.5 2 1.1
Undertake ECGs 55 66.3 23 27.7 5 6.0
Undertake routine phlebotomy 61 59.2 32 31.1 10 9.7
Transport patients 39 70.9 15 27.3 1 1.8
Undertake cleaning duties 174 61.9 94 33.5 13 4.6
Undertake clerical duties 171 62.6 86 31.5 16 5.9
Total 1086 64.1 533 31.5 75 4.4
N=612 (Shifs)
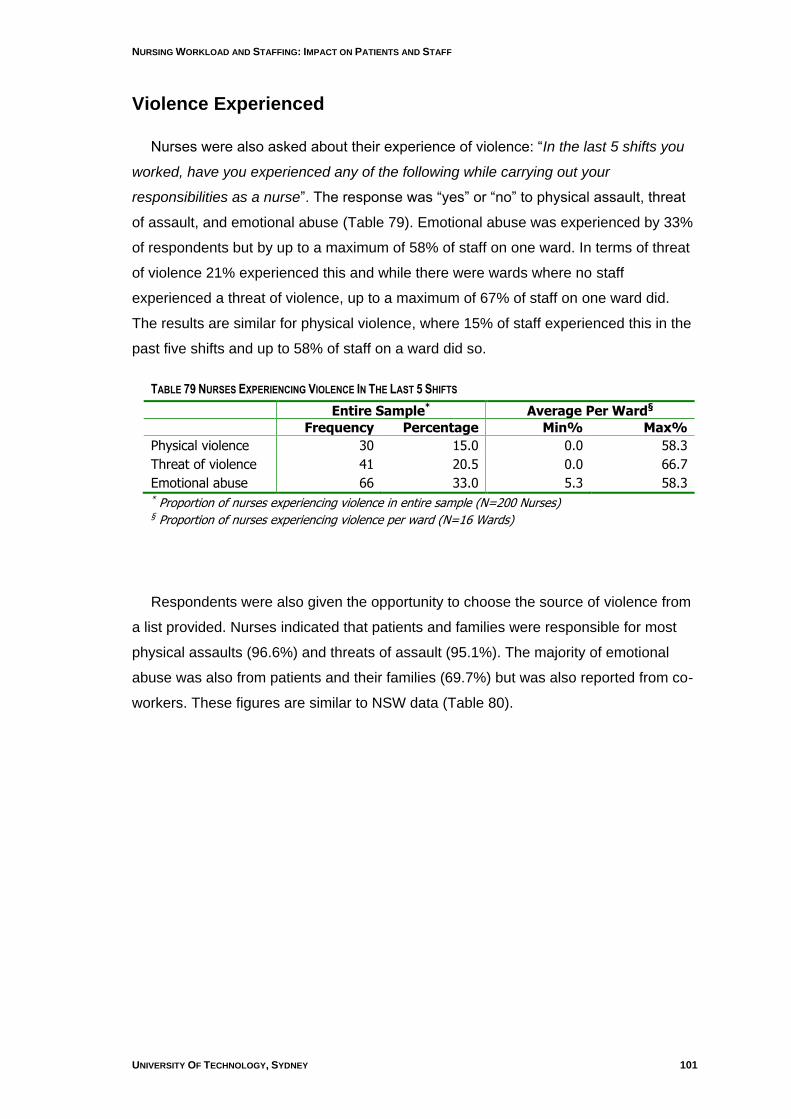
NURSING WORKLOAD AND STAFFING: IMPACT ON PATIENTS AND STAFF
UNIVERSITY OF TECHNOLOGY, SYDNEY 101
Violence Experienced
Nurses were also asked about their experience of violence: “In the last 5 shifts you
worked, have you experienced any of the following while carrying out your
responsibilities as a nurse”. The response was “yes” or “no” to physical assault, threat
of assault, and emotional abuse (Table 79). Emotional abuse was experienced by 33%
of respondents but by up to a maximum of 58% of staff on one ward. In terms of threat
of violence 21% experienced this and while there were wards where no staff
experienced a threat of violence, up to a maximum of 67% of staff on one ward did.
The results are similar for physical violence, where 15% of staff experienced this in the
past five shifts and up to 58% of staff on a ward did so.
TABLE 79 NURSES EXPERIENCING VIOLENCE IN THE LAST 5 SHIFTS
Entire Sample* Average Per Ward§
Frequency Percentage Min% Max%
Physical violence 30 15.0 0.0 58.3
Threat of violence 41 20.5 0.0 66.7
Emotional abuse 66 33.0 5.3 58.3 * Proportion of nurses experiencing violence in entire sample (N=200 Nurses) § Proportion of nurses experiencing violence per ward (N=16 Wards)
Respondents were also given the opportunity to choose the source of violence from
a list provided. Nurses indicated that patients and families were responsible for most
physical assaults (96.6%) and threats of assault (95.1%). The majority of emotional
abuse was also from patients and their families (69.7%) but was also reported from co-
workers. These figures are similar to NSW data (Table 80).
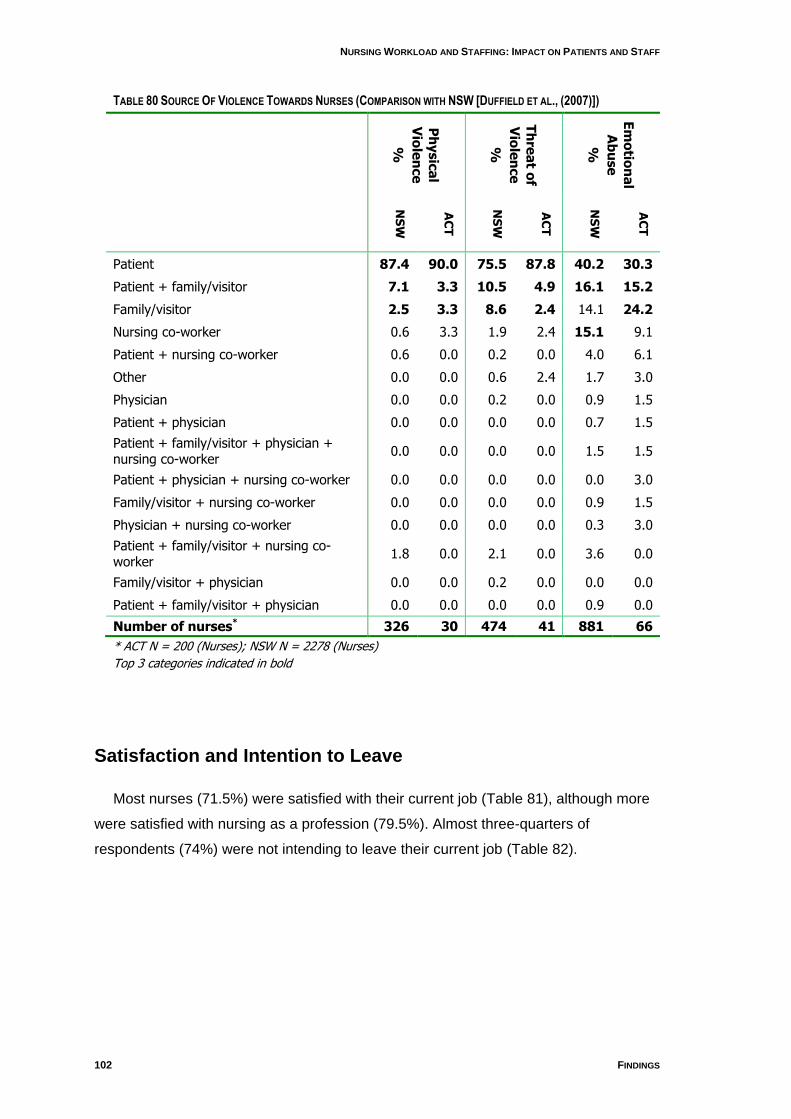
NURSING WORKLOAD AND STAFFING: IMPACT ON PATIENTS AND STAFF
102 FINDINGS
TABLE 80 SOURCE OF VIOLENCE TOWARDS NURSES (COMPARISON WITH NSW [DUFFIELD ET AL., (2007)])
Ph
ysic
al
Vio
len
ce
%
Th
rea
t of
Vio
len
ce
%
Em
otio
na
l
Ab
use
%
NS
W
AC
T
NS
W
AC
T
NS
W
AC
T
Patient 87.4 90.0 75.5 87.8 40.2 30.3
Patient + family/visitor 7.1 3.3 10.5 4.9 16.1 15.2
Family/visitor 2.5 3.3 8.6 2.4 14.1 24.2
Nursing co-worker 0.6 3.3 1.9 2.4 15.1 9.1
Patient + nursing co-worker 0.6 0.0 0.2 0.0 4.0 6.1
Other 0.0 0.0 0.6 2.4 1.7 3.0
Physician 0.0 0.0 0.2 0.0 0.9 1.5
Patient + physician 0.0 0.0 0.0 0.0 0.7 1.5
Patient + family/visitor + physician + nursing co-worker
0.0 0.0 0.0 0.0 1.5 1.5
Patient + physician + nursing co-worker 0.0 0.0 0.0 0.0 0.0 3.0
Family/visitor + nursing co-worker 0.0 0.0 0.0 0.0 0.9 1.5
Physician + nursing co-worker 0.0 0.0 0.0 0.0 0.3 3.0
Patient + family/visitor + nursing co-worker
1.8 0.0 2.1 0.0 3.6 0.0
Family/visitor + physician 0.0 0.0 0.2 0.0 0.0 0.0
Patient + family/visitor + physician 0.0 0.0 0.0 0.0 0.9 0.0
Number of nurses* 326 30 474 41 881 66
* ACT N = 200 (Nurses); NSW N = 2278 (Nurses)
Top 3 categories indicated in bold
Satisfaction and Intention to Leave
Most nurses (71.5%) were satisfied with their current job (Table 81), although more
were satisfied with nursing as a profession (79.5%). Almost three-quarters of
respondents (74%) were not intending to leave their current job (Table 82).
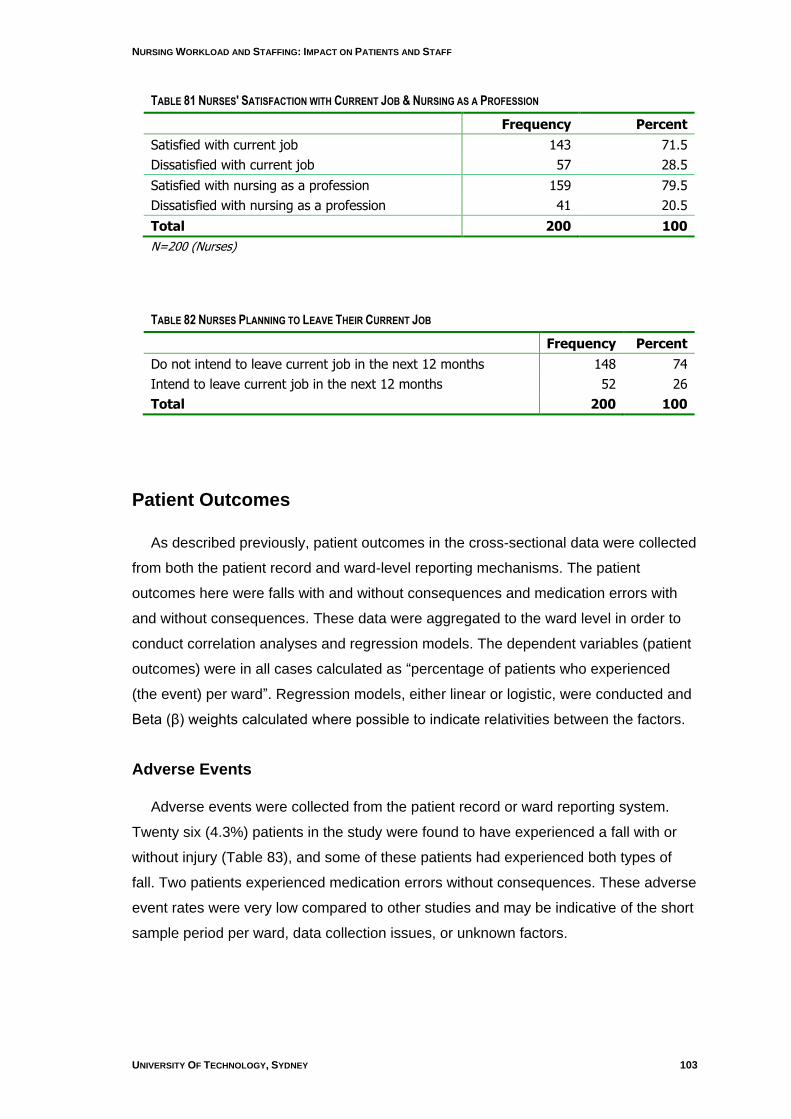
NURSING WORKLOAD AND STAFFING: IMPACT ON PATIENTS AND STAFF
UNIVERSITY OF TECHNOLOGY, SYDNEY 103
TABLE 81 NURSES' SATISFACTION WITH CURRENT JOB & NURSING AS A PROFESSION
Frequency Percent
Satisfied with current job 143 71.5
Dissatisfied with current job 57 28.5
Satisfied with nursing as a profession 159 79.5
Dissatisfied with nursing as a profession 41 20.5
Total 200 100
N=200 (Nurses)
TABLE 82 NURSES PLANNING TO LEAVE THEIR CURRENT JOB
Frequency Percent
Do not intend to leave current job in the next 12 months 148 74
Intend to leave current job in the next 12 months 52 26
Total 200 100
Patient Outcomes
As described previously, patient outcomes in the cross-sectional data were collected
from both the patient record and ward-level reporting mechanisms. The patient
outcomes here were falls with and without consequences and medication errors with
and without consequences. These data were aggregated to the ward level in order to
conduct correlation analyses and regression models. The dependent variables (patient
outcomes) were in all cases calculated as “percentage of patients who experienced
(the event) per ward”. Regression models, either linear or logistic, were conducted and
Beta (β) weights calculated where possible to indicate relativities between the factors.
Adverse Events
Adverse events were collected from the patient record or ward reporting system.
Twenty six (4.3%) patients in the study were found to have experienced a fall with or
without injury (Table 83), and some of these patients had experienced both types of
fall. Two patients experienced medication errors without consequences. These adverse
event rates were very low compared to other studies and may be indicative of the short
sample period per ward, data collection issues, or unknown factors.
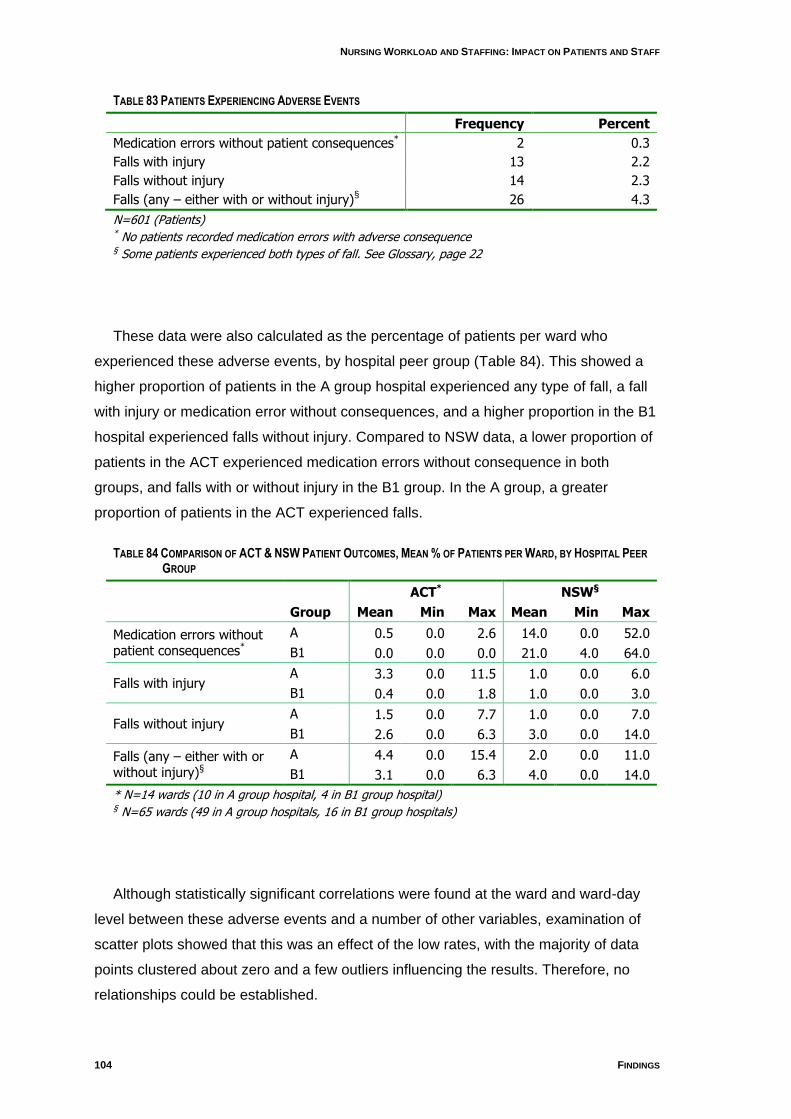
NURSING WORKLOAD AND STAFFING: IMPACT ON PATIENTS AND STAFF
104 FINDINGS
TABLE 83 PATIENTS EXPERIENCING ADVERSE EVENTS
Frequency Percent
Medication errors without patient consequences* 2 0.3
Falls with injury 13 2.2
Falls without injury 14 2.3
Falls (any – either with or without injury)§ 26 4.3
N=601 (Patients) * No patients recorded medication errors with adverse consequence § Some patients experienced both types of fall. See Glossary, page 22
These data were also calculated as the percentage of patients per ward who
experienced these adverse events, by hospital peer group (Table 84). This showed a
higher proportion of patients in the A group hospital experienced any type of fall, a fall
with injury or medication error without consequences, and a higher proportion in the B1
hospital experienced falls without injury. Compared to NSW data, a lower proportion of
patients in the ACT experienced medication errors without consequence in both
groups, and falls with or without injury in the B1 group. In the A group, a greater
proportion of patients in the ACT experienced falls.
TABLE 84 COMPARISON OF ACT & NSW PATIENT OUTCOMES, MEAN % OF PATIENTS PER WARD, BY HOSPITAL PEER
GROUP
ACT* NSW§
Group Mean Min Max Mean Min Max
Medication errors without patient consequences*
A 0.5 0.0 2.6 14.0 0.0 52.0
B1 0.0 0.0 0.0 21.0 4.0 64.0
Falls with injury A 3.3 0.0 11.5 1.0 0.0 6.0
B1 0.4 0.0 1.8 1.0 0.0 3.0
Falls without injury A 1.5 0.0 7.7 1.0 0.0 7.0
B1 2.6 0.0 6.3 3.0 0.0 14.0
Falls (any – either with or without injury)§
A 4.4 0.0 15.4 2.0 0.0 11.0
B1 3.1 0.0 6.3 4.0 0.0 14.0
* N=14 wards (10 in A group hospital, 4 in B1 group hospital) § N=65 wards (49 in A group hospitals, 16 in B1 group hospitals)
Although statistically significant correlations were found at the ward and ward-day
level between these adverse events and a number of other variables, examination of
scatter plots showed that this was an effect of the low rates, with the majority of data
points clustered about zero and a few outliers influencing the results. Therefore, no
relationships could be established.
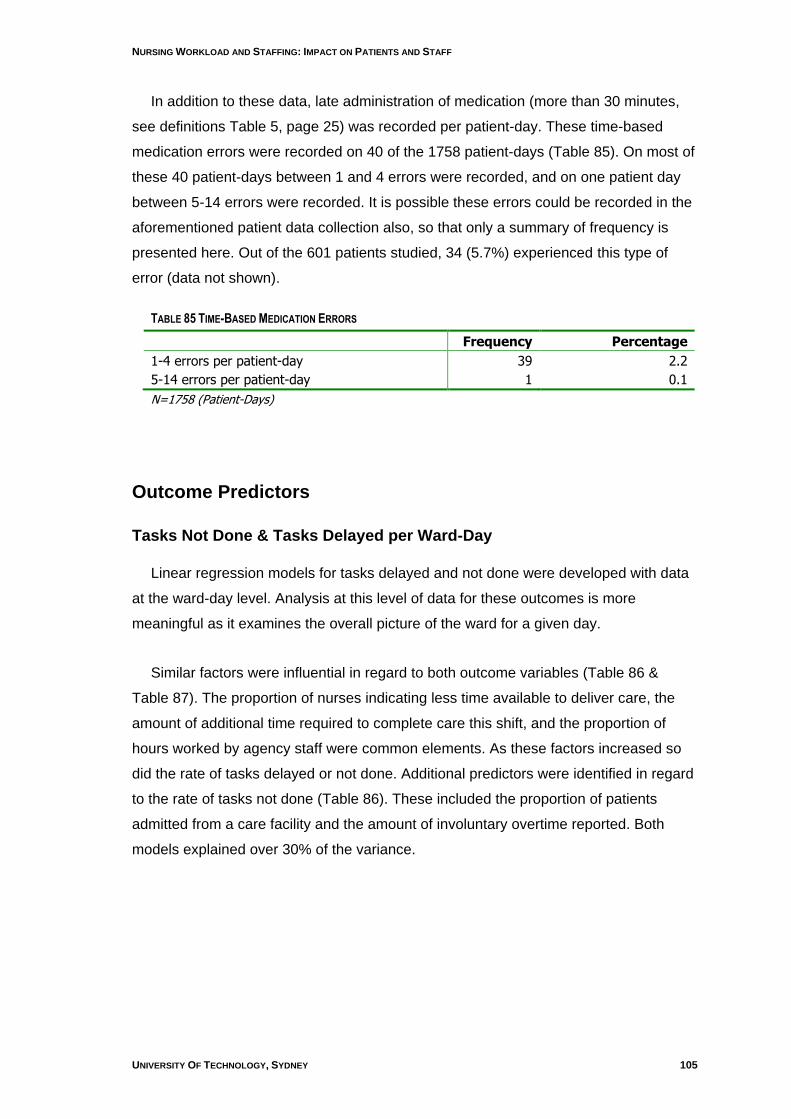
NURSING WORKLOAD AND STAFFING: IMPACT ON PATIENTS AND STAFF
UNIVERSITY OF TECHNOLOGY, SYDNEY 105
In addition to these data, late administration of medication (more than 30 minutes,
see definitions Table 5, page 25) was recorded per patient-day. These time-based
medication errors were recorded on 40 of the 1758 patient-days (Table 85). On most of
these 40 patient-days between 1 and 4 errors were recorded, and on one patient day
between 5-14 errors were recorded. It is possible these errors could be recorded in the
aforementioned patient data collection also, so that only a summary of frequency is
presented here. Out of the 601 patients studied, 34 (5.7%) experienced this type of
error (data not shown).
TABLE 85 TIME-BASED MEDICATION ERRORS
Frequency Percentage
1-4 errors per patient-day 39 2.2
5-14 errors per patient-day 1 0.1
N=1758 (Patient-Days)
Outcome Predictors
Tasks Not Done & Tasks Delayed per Ward-Day
Linear regression models for tasks delayed and not done were developed with data
at the ward-day level. Analysis at this level of data for these outcomes is more
meaningful as it examines the overall picture of the ward for a given day.
Similar factors were influential in regard to both outcome variables (Table 86 &
Table 87). The proportion of nurses indicating less time available to deliver care, the
amount of additional time required to complete care this shift, and the proportion of
hours worked by agency staff were common elements. As these factors increased so
did the rate of tasks delayed or not done. Additional predictors were identified in regard
to the rate of tasks not done (Table 86). These included the proportion of patients
admitted from a care facility and the amount of involuntary overtime reported. Both
models explained over 30% of the variance.
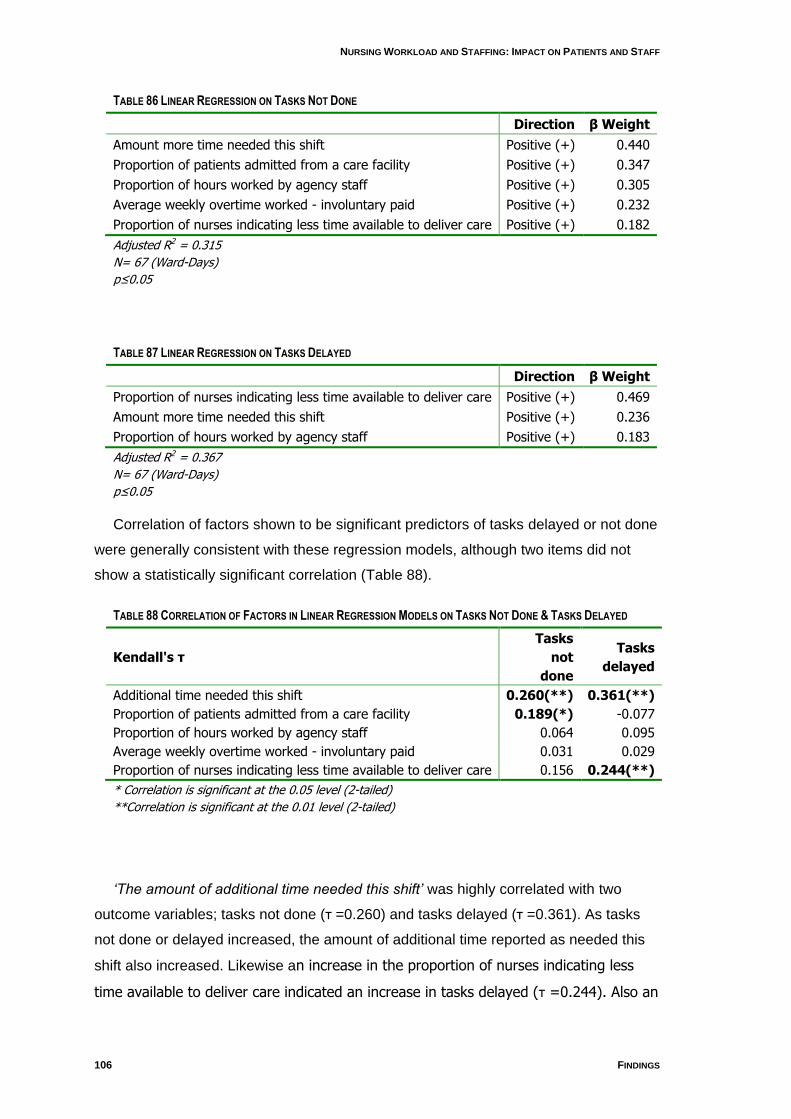
NURSING WORKLOAD AND STAFFING: IMPACT ON PATIENTS AND STAFF
106 FINDINGS
TABLE 86 LINEAR REGRESSION ON TASKS NOT DONE
Direction β Weight
Amount more time needed this shift Positive (+) 0.440
Proportion of patients admitted from a care facility Positive (+) 0.347
Proportion of hours worked by agency staff Positive (+) 0.305
Average weekly overtime worked - involuntary paid Positive (+) 0.232
Proportion of nurses indicating less time available to deliver care Positive (+) 0.182
Adjusted R2 = 0.315
N= 67 (Ward-Days)
p≤0.05
TABLE 87 LINEAR REGRESSION ON TASKS DELAYED
Direction β Weight
Proportion of nurses indicating less time available to deliver care Positive (+) 0.469
Amount more time needed this shift Positive (+) 0.236
Proportion of hours worked by agency staff Positive (+) 0.183
Adjusted R2 = 0.367
N= 67 (Ward-Days)
p≤0.05
Correlation of factors shown to be significant predictors of tasks delayed or not done
were generally consistent with these regression models, although two items did not
show a statistically significant correlation (Table 88).
TABLE 88 CORRELATION OF FACTORS IN LINEAR REGRESSION MODELS ON TASKS NOT DONE & TASKS DELAYED
Kendall's τ
Tasks
not
done
Tasks
delayed
Additional time needed this shift 0.260(**) 0.361(**)
Proportion of patients admitted from a care facility 0.189(*) -0.077
Proportion of hours worked by agency staff 0.064 0.095
Average weekly overtime worked - involuntary paid 0.031 0.029
Proportion of nurses indicating less time available to deliver care 0.156 0.244(**)
* Correlation is significant at the 0.05 level (2-tailed)
**Correlation is significant at the 0.01 level (2-tailed)
„The amount of additional time needed this shift‟ was highly correlated with two
outcome variables; tasks not done (τ =0.260) and tasks delayed (τ =0.361). As tasks
not done or delayed increased, the amount of additional time reported as needed this
shift also increased. Likewise an increase in the proportion of nurses indicating less
time available to deliver care indicated an increase in tasks delayed (τ =0.244). Also an
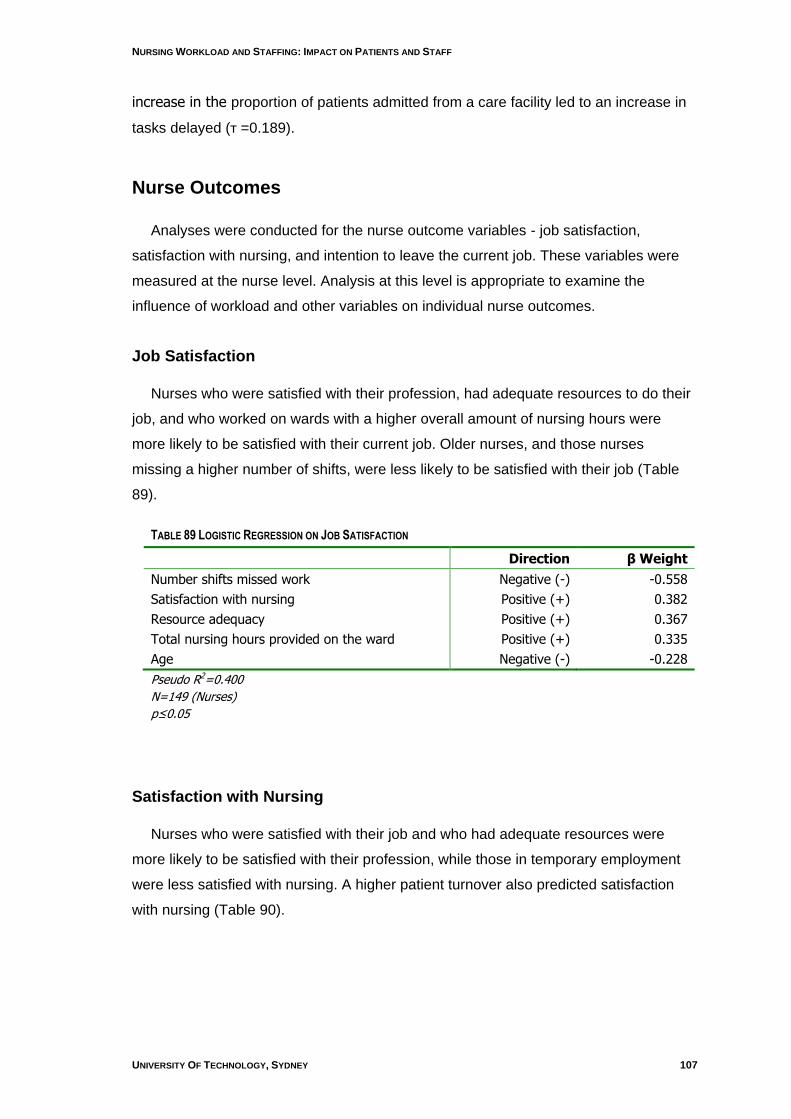
NURSING WORKLOAD AND STAFFING: IMPACT ON PATIENTS AND STAFF
UNIVERSITY OF TECHNOLOGY, SYDNEY 107
increase in the proportion of patients admitted from a care facility led to an increase in
tasks delayed (τ =0.189).
Nurse Outcomes
Analyses were conducted for the nurse outcome variables - job satisfaction,
satisfaction with nursing, and intention to leave the current job. These variables were
measured at the nurse level. Analysis at this level is appropriate to examine the
influence of workload and other variables on individual nurse outcomes.
Job Satisfaction
Nurses who were satisfied with their profession, had adequate resources to do their
job, and who worked on wards with a higher overall amount of nursing hours were
more likely to be satisfied with their current job. Older nurses, and those nurses
missing a higher number of shifts, were less likely to be satisfied with their job (Table
89).
TABLE 89 LOGISTIC REGRESSION ON JOB SATISFACTION
Direction β Weight
Number shifts missed work Negative (-) -0.558
Satisfaction with nursing Positive (+) 0.382
Resource adequacy Positive (+) 0.367
Total nursing hours provided on the ward Positive (+) 0.335
Age Negative (-) -0.228
Pseudo R2=0.400
N=149 (Nurses)
p≤0.05
Satisfaction with Nursing
Nurses who were satisfied with their job and who had adequate resources were
more likely to be satisfied with their profession, while those in temporary employment
were less satisfied with nursing. A higher patient turnover also predicted satisfaction
with nursing (Table 90).
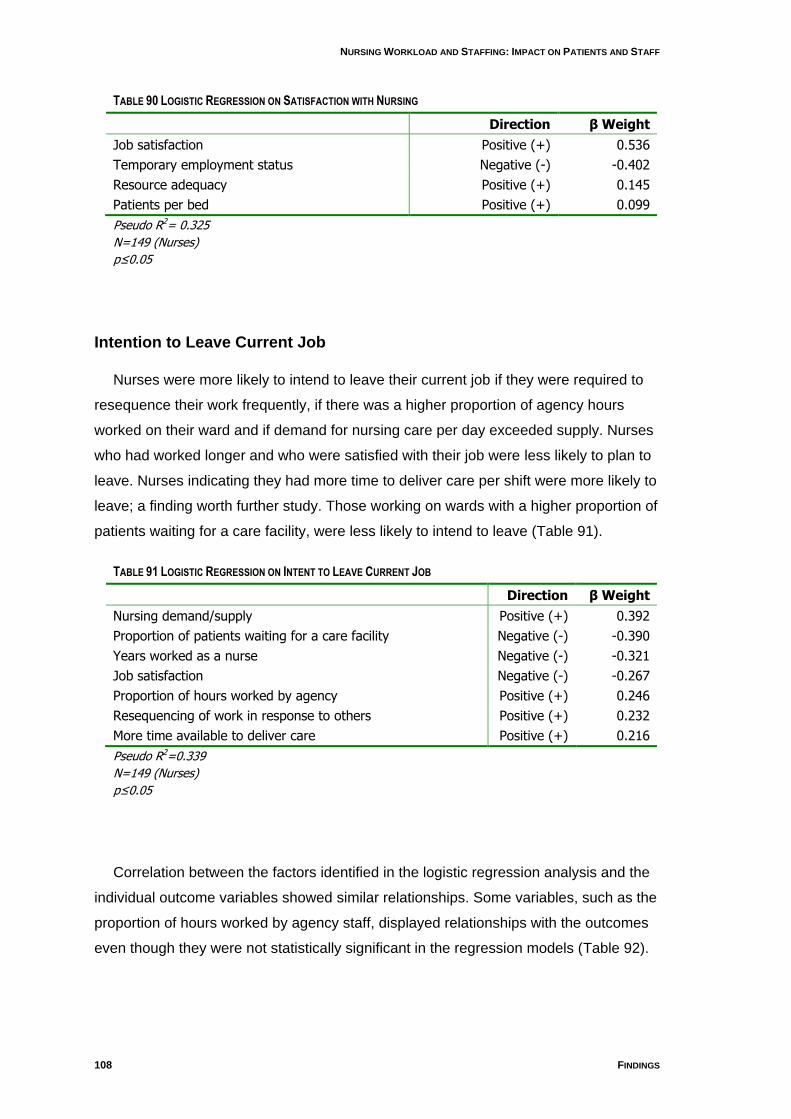
NURSING WORKLOAD AND STAFFING: IMPACT ON PATIENTS AND STAFF
108 FINDINGS
TABLE 90 LOGISTIC REGRESSION ON SATISFACTION WITH NURSING
Direction β Weight
Job satisfaction Positive (+) 0.536
Temporary employment status Negative (-) -0.402
Resource adequacy Positive (+) 0.145
Patients per bed Positive (+) 0.099
Pseudo R2= 0.325
N=149 (Nurses)
p≤0.05
Intention to Leave Current Job
Nurses were more likely to intend to leave their current job if they were required to
resequence their work frequently, if there was a higher proportion of agency hours
worked on their ward and if demand for nursing care per day exceeded supply. Nurses
who had worked longer and who were satisfied with their job were less likely to plan to
leave. Nurses indicating they had more time to deliver care per shift were more likely to
leave; a finding worth further study. Those working on wards with a higher proportion of
patients waiting for a care facility, were less likely to intend to leave (Table 91).
TABLE 91 LOGISTIC REGRESSION ON INTENT TO LEAVE CURRENT JOB
Direction β Weight
Nursing demand/supply Positive (+) 0.392
Proportion of patients waiting for a care facility Negative (-) -0.390
Years worked as a nurse Negative (-) -0.321
Job satisfaction Negative (-) -0.267
Proportion of hours worked by agency Positive (+) 0.246
Resequencing of work in response to others Positive (+) 0.232
More time available to deliver care Positive (+) 0.216
Pseudo R2=0.339
N=149 (Nurses)
p≤0.05
Correlation between the factors identified in the logistic regression analysis and the
individual outcome variables showed similar relationships. Some variables, such as the
proportion of hours worked by agency staff, displayed relationships with the outcomes
even though they were not statistically significant in the regression models (Table 92).
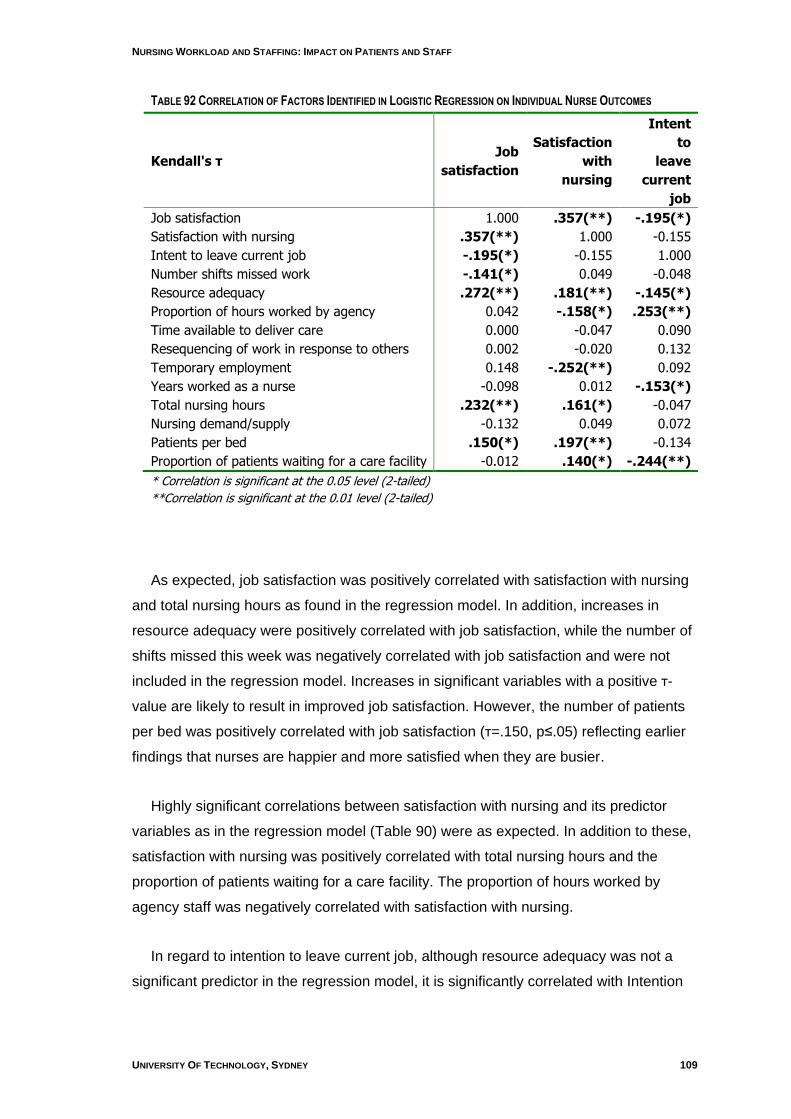
NURSING WORKLOAD AND STAFFING: IMPACT ON PATIENTS AND STAFF
UNIVERSITY OF TECHNOLOGY, SYDNEY 109
TABLE 92 CORRELATION OF FACTORS IDENTIFIED IN LOGISTIC REGRESSION ON INDIVIDUAL NURSE OUTCOMES
Kendall's τ Job
satisfaction
Satisfaction
with
nursing
Intent
to
leave
current
job
Job satisfaction 1.000 .357(**) -.195(*)
Satisfaction with nursing .357(**) 1.000 -0.155
Intent to leave current job -.195(*) -0.155 1.000
Number shifts missed work -.141(*) 0.049 -0.048
Resource adequacy .272(**) .181(**) -.145(*)
Proportion of hours worked by agency 0.042 -.158(*) .253(**)
Time available to deliver care 0.000 -0.047 0.090
Resequencing of work in response to others 0.002 -0.020 0.132
Temporary employment 0.148 -.252(**) 0.092
Years worked as a nurse -0.098 0.012 -.153(*)
Total nursing hours .232(**) .161(*) -0.047
Nursing demand/supply -0.132 0.049 0.072
Patients per bed .150(*) .197(**) -0.134
Proportion of patients waiting for a care facility -0.012 .140(*) -.244(**)
* Correlation is significant at the 0.05 level (2-tailed)
**Correlation is significant at the 0.01 level (2-tailed)
As expected, job satisfaction was positively correlated with satisfaction with nursing
and total nursing hours as found in the regression model. In addition, increases in
resource adequacy were positively correlated with job satisfaction, while the number of
shifts missed this week was negatively correlated with job satisfaction and were not
included in the regression model. Increases in significant variables with a positive τ-
value are likely to result in improved job satisfaction. However, the number of patients
per bed was positively correlated with job satisfaction (τ=.150, p≤.05) reflecting earlier
findings that nurses are happier and more satisfied when they are busier.
Highly significant correlations between satisfaction with nursing and its predictor
variables as in the regression model (Table 90) were as expected. In addition to these,
satisfaction with nursing was positively correlated with total nursing hours and the
proportion of patients waiting for a care facility. The proportion of hours worked by
agency staff was negatively correlated with satisfaction with nursing.
In regard to intention to leave current job, although resource adequacy was not a
significant predictor in the regression model, it is significantly correlated with Intention

NURSING WORKLOAD AND STAFFING: IMPACT ON PATIENTS AND STAFF
110 FINDINGS
to leave (τ =-.145, p≤.05) and indicates that as resource adequacy improves the
intention to leave the current job declines.
NURSING WORKLOAD AND STAFFING: IMPACT ON PATIENTS AND STAFF
UNIVERSITY OF TECHNOLOGY, SYDNEY 111
5. Limitations
Any study using standard administrative data is limited to what is in the data. In this
instance, the administrative data mined in the longitudinal study were supplemented by
the cross-sectional data collection to provide information on variables that are simply
not part of standard data collection. These were particularly those variables concerned
with the quality of the working environment and the nursing outcomes.
In previous studies it has been shown that there is wide variation in a range of the
variables captured in both the longitudinal and dross-sectional data. This potential
variation should be considered when applying these findings outside the sampled
hospitals.
The longitudinal data were essentially the entire population of patients for the period
studied and the entire record of nurses working for the periods available. Still, the data
cover only about two years. Similarly, the cross-sectional data include all eligible
nursing units after maternity, newborn, pediatric and psychiatric units were excluded.
There are several limitations in regard to the longitudinal analysis:
Limited amount of usable data
Lack of large learning (reference) set for threshold contrast method
Lack of direct link between ward and adverse event
Potential seasonal effects for data time span
As discussed earlier, the time and place of OPSN could not be determined in the
data so attribution to the nursing unit is a limitation.
Instrument reliability and validity have been reported. A high proportion of
consenting nursing staff responded to the surveys overall (71%), but it is not known
whether important responders declined to participate. The sampling period for the
cross-sectional study was only one week per nursing unit and although it appeared to
be similar to longitudinal data in terms of skill mix, it is not known how representative
that week might have been in regard to patient type and the remainder of the the unit‟s
life. This short sample period, unknown data collection issues or other factors may
have been related to the very low number of patient adverse events collected.
NURSING WORKLOAD AND STAFFING: IMPACT ON PATIENTS AND STAFF
112 SUMMARY AND DISCUSSION
GL
UE
ING
IT T
OG
ET
HE
R: N
UR
SE
S, T
HE
IR W
OR
K E
NV
IRO
NM
EN
T &
PA
TIE
NT
SA
FE
TY
6. Summary and Discussion
Synopsis of Objectives, Design and Measures
This study used a combination of longitudinal and cross-sectional data collection to
examine nursing workload (and changes therein), patient acuity and length of stay, skill
mix and the working environment and their relationships with patient outcomes in two
hospitals in the Australian Capital Territory. The unit of analysis was the nursing ward,
the business and operational unit of the hospital. The project was designed to provide
information to assist policy development in the ACT toward innovations in care delivery.
In particular it was to determine approaches to staffing which would provide for the
health needs of the population, achieve high standards of care and enhance patient
outcomes. The focus was on medical/surgical nursing units where the majority of
nurses work.
Patient data were obtained on all discharges from the two hospitals for two financial
years, 2005 and 2006 (approximately 185,000 hospital morbidity records of which
40,538 contributed to the final analysis). Nursing payroll data were obtained for roughly
the same period. Payroll data allowed tracking nurses to the wards on which patients
were nursed. Eventually 398 ward months of data were used in the analysis. Casemix
control to the ward level provided risk adjustment. Twelve Outcomes Potentially
Sensitive to Nursing (OPSN) – adverse events coded in administrative data – were
studied along with length of stay as an outcome.
Cross-sectional data which involved original data collection at ward level, took place
over a three week period at Canberra Hospital and two weeks at Calvary Hospital
toward the end of the longitudinal data collection. Surveys of nurses collected data on
job satisfaction, perception of the ward working environment (including environmental
complexity), and perception of the extent to which work was accomplished fully and on
time. Additional data collection at ward level obtained data on staffing and patient
outcomes as falls and medication errors.
Statistical treatment was designed to determine patterns of nursing resources and
their relationship to patient outcomes, and in the case of cross-sectional data, nurse
outcomes such as job satisfaction. Where appropriate, comparisons to a similar study
conducted in New South Wales (NSW) were made.
NURSING WORKLOAD AND STAFFING: IMPACT ON PATIENTS AND STAFF
UNIVERSITY OF TECHNOLOGY, SYDNEY 113
Discussion of Results
Sixteen medical/surgical nursing units were included in the sample. Relevant
nursing data were available for 15 of these units, two of which were collapsed into one
for analysis for statistical reasons leaving 14 units as the sample for the longitudinal
analysis. There were 16 units in the cross-sectional study, but two did not provide
complete roster data.
Over time, nursing workload as measured by nursing hours per patient hour
increased, especially in one of the hospitals; the ratio of nurse hours on ward to patient
hours on ward decreased. Skill mix measured as the percentage of RN hours worked
was quite variable ranging from 50% to 80% at one hospital and 54% to 84% at the
other. Skillmix was lower in wards with aged or rehabilitation casemix, higher in
specialty surgical wards. This is not an unexpected finding but it raises questions about
the conventional wisdom that decrees a lesser skilled workforce for aged or infirm
patients, many of whom may actually be more frail than surgical specialty patients.
Patient movements can contribute to nursing workload. The findings here indicate
the number of wards per patient episode over the two years (average length of stay =
4.0) were on average 1.24 and 1.32 at the two hospitals, considerably lower than the
NSW result of 2.26. In addition the number of patients per bed per day was on average
one, compared to 1.25 in NSW. This may reflect better bed management strategies.
In terms of the nursing hours required and provided, there was an average
difference of 0.5 hours per patient day, less than in NSW data. Of interest is that in the
ACT, both the hours of nursing care required per patient day and nursing hours per
patient day provided were higher in the A group hospital than in NSW. The reverse is
true of the B group hospital, where hours of nursing care required per patient day and
nursing hours per patient day provided were less than in NSW.
Nursing workload in ACT is influenced by the number of different AR-DRGs per
nursing unit. There is a wide degree of variability ranging from 164 – 459 DRGs per
ward, from a possible range of 613. It cannot be expected that nurses are equally
skilled or comfortable caring for a wide range of patient types, each with its treatments,
procedures, protocols, medications and physician teams. Smaller hospitals, such as
found in ACT, cannot create the number of specialty units found in larger hospitals, a
fact that managers need to appreciate. The nursing workload will always feel heavier in
NURSING WORKLOAD AND STAFFING: IMPACT ON PATIENTS AND STAFF
114 SUMMARY AND DISCUSSION
GL
UE
ING
IT T
OG
ET
HE
R: N
UR
SE
S, T
HE
IR W
OR
K E
NV
IRO
NM
EN
T &
PA
TIE
NT
SA
FE
TY
wards with a large number of different AR-DRGs. Still, the role of casemix in staffing
has been little identified nor studied.
As we have found in previous research, there was considerable variation in nursing
unit staffing and skill mix over only a two year period, variation that was neither
seasonal nor predictable. There should be no expectation that every nursing unit has
the same ratio of nursing hours per patient day nor the same skill mix for different
mixes of cases. However, such variation itself increases nursing workload and may
contribute to job dissatisfaction. Indeed, the cross-sectional results showed that
adequacy of nursing resources was one of the stronger predictors of nursing job
satisfaction. Decisions about how to titrate nursing resources to patient types should be
made consciously, not simply allowed to vary with the ability of the nurse manager to
advocate for resources or the constraints imposed by a tight labour market. Indeed, our
analysis suggested that parity in nursing staffing could be achieved with modest
increases in resources.
Analysis also showed that increased skill mix was associated with decreased length
of stay, although the relationship was not strong in this sample. It has been observed
that physicians admit patients to hospital but nurses get them out. Yet skill mix has
rarely been considered in itself an efficiency investment.
When patient outcomes as Outcomes Potentially Sensitive to Nursing (OPSN) were
examined, it was found that increasing RN hours by 10% could produce decreases in
the adverse event rates studied from 11% to 45%. While we did not attempt cost
analyses in this study, it is known that adverse outcomes such as hospital-acquired
decubiti, infections etc. increase length of stay and cost. It should be in hospitals‟
interest to invest in the resource(nurses) to lower such rates, not only for financial
reasons but more importantly, to minimise harm to patients.
The cross-sectional data amplified these findings. Comparisons were made where
appropriate with our New South Wales study. This is a new area of inquiry, however,
so the NSW findings cannot be taken as the “gold standard” – they are simply
descriptive of the situation as the data revealed it in the prior study. It was not possible
to determine the impact that medicaton endorsed ENs might have on medication
errors.
NURSING WORKLOAD AND STAFFING: IMPACT ON PATIENTS AND STAFF
UNIVERSITY OF TECHNOLOGY, SYDNEY 115
The nursing work environment in ACT was rated as somewhat better by the ACT
nurses than NSW nurses rated theirs, and, largely because there were only two
hospitals in the ACT study, we did not find the enormous variations in nursing units that
we had found in NSW. Still, with a sample of only 16 units, there was a striking amount
of variation in nearly every measure.
Nursing supply/demand analysis showed that only 25% of the units were in
“balance”, with the rest showing a deficit of nursing for patient requirements. When
nurses reported numbers of tasks delayed or not done, these figures were related to a
perception of resource adequacy – staffing, support services etc. That is, where there
were adequate resources, fewer tasks were reported undone or delayed.
It was interesting to note, as it had been in NSW, that nurses on wards with larger
proportions of patients from care facilities and wards with a higher proportion of agency
staff and overtime reported more work undone at the end of shift. These are wards that
are stressed; the necessity for involving agency staff is a signal to managers that
something is not right on the ward with respect to staffing. The finding about patients
from care facilities might signal a systemic problem of coordination of care across
institutions or perhaps an issue of quality of facility care.
A higher proportion of nurses in ACT reported experiencing a threat of violence or
physical violence than did nurses in NSW but less emotional abuse. The perpetrators
were most often patients or families. This is an under-appreciated aspect of nursing
workload.
In terms of nurse outcomes, 71.5% of nurses were satisfied with their current job
and this was related to having adequate resources to do their job and a higher overall
amount of nursing hours. More than three quarters (79.5%) were satisfied with nursing
and again this was related to having adequate resources to do the job. While workload
is an important factor in job satisfaction and satisfaction with nursing, there is evidence
that nurses were more satisfied when they were busier (measured as higher patient
turnover per bed). In terms of workforce planning, 74% of nurses had no intention of
leaving their current job in the next 12 months and as resource adequacy improves, the
intention to leave the current job declines.
Overall, the study of ACT hospitals reveals hitherto unknown patterns in nursing
staffing, the work environment and patient outcomes. The study suggests that to

NURSING WORKLOAD AND STAFFING: IMPACT ON PATIENTS AND STAFF
116 SUMMARY AND DISCUSSION
GL
UE
ING
IT T
OG
ET
HE
R: N
UR
SE
S, T
HE
IR W
OR
K E
NV
IRO
NM
EN
T &
PA
TIE
NT
SA
FE
TY
successfully manage a hospital system requires an understanding of the nature of the
work and a commitment to matching resources to workload. The workload/staffing
software used in this study was developed from the NSW study and its test here shows
interesting possibilities.
NURSING WORKLOAD AND STAFFING: IMPACT ON PATIENTS AND STAFF
UNIVERSITY OF TECHNOLOGY, SYDNEY 117
7. References Access Economics. (2004a). Employment Demand in Nursing Occupations. Canberra:
Australian Government Department of Health and Ageing.
Access Economics. (2004b). Employment Demand in Nursing Occupations Canberra: Dept. Health & Ageing.
ACT Health / ANF. (2007). A.C.T. Public Sector Nursing and Midwifery Staff Union Collective Agreement 2007-2009. Canberra: ACT Health & Australian Nursing Federation.
Adams, A., & Duffield, C. (1991). The value of drills in developing and maintaining numeracy skills in an undergraduate nursing programme. Nurse Education Today, 11(3), 213-219.
AHWAC. (2002a). The Critical Care Nurse Workforce in Australia 2001-2011 (No. 2002.1). Sydney: Australian Health Workforce Advisory Committee.
AHWAC. (2002b). The Midwifery Workforce in Australia 2002-2012 (No. 2002.2). Sydney: Australian Health Workforce Advisory Committee.
AHWAC. (2004). The Australian Nursing Workforce - An Overview of Workforce Planning 2001-2004 (No. 2004.2). Sydney: Australian Health Workforce Advisory Committee.
AIHW. (2005). Nursing and midwifery labour force 2003 (No. HWL 31). Canberra: Australian Institute of Health and Welfare.
AIHW. (2006). Nursing and midwifery labour force 2004 (No. HWL 37). Canberra: Australian Institute of Health and Welfare.
AIHW. (2007). Australian hospital statistics 2005–06 (No. HSE 50). Canberra: Australian Institute of Health and Welfare.
Aiken, L. H., Clarke, S. P., & Sloane, D. M. (2002). Hospital staffing, organization, and quality of care: cross-national findings. International Journal for Quality in Health Care, 14(1), 5.
Aiken, L. H., Clarke, S. P., Sloane, D. M., Sochalski, J. A., Busse, R., Clarke, H., et al. (2001). Nurses' reports on hospital care in five countries: the ways in which nurses' work is structured have left nurses among the least satisfied workers, and the problem is getting worse. Health Affairs, 20(3), 43-53.
Aiken, L. H., Lake, T. E., Sochalski, J., & Sloane, D. M. (1997). Design of an Outcomes Study of the Organization of Hospital AIDS Care. Research in the Sociology of Health Care, 14, 3-26.
Aiken, L. H., & Patrician, P. A. (2000). Measuring organizational traits of hospitals: the Revised Nursing Work Index. Nursing Research, 49(3), 146-153.
Aiken, L. H., & Sloane, D. M. (1997). Effects of organizational innovations in AIDS care on burnout among urban hospital nurses. Work and Occupations, 24(4), 453-477.
Aiken, L. H., Smith, H. L., & Lake, E. T. (1994). Lower Medicare mortality among a set of hospitals known for good nursing care. Medical Care, 32(8), 771.
Aiken, L. H., Sochalski, J., & Anderson, G. F. (1996). Downsizing the hospital nursing workforce. Health Affairs, 15(4), 88-92.
American Nurses' Association. (1997). Implementing Nursing's Report Card: A Study of RN Staffing, Length of Stay and Patient Outcomes. Washington: ANA.
ARHRC. (2005). Submission: Productivity Commission Health Workforce Study. Retrieved July 2005, from http://www.pc.gov.au/study/healthworkforce/subs/sub034.pdf
Australian Bureau of Statistics. (2007 -a). Australian Capital Territory at a Glance [Electronic Version], from http://www.ausstats.abs.gov.au/ausstats/subscriber.nsf/0/814267A44480432BCA2573A10017C7AD/$File/13148_2007.pdf
Australian Bureau of Statistics. (2007 -b). Australian Capitol Territory in Focus [Electronic Version], from http://www.ausstats.abs.gov.au/ausstats/subscriber.nsf/0/814267A44480432BCA2573A10017C7AD/$File/13148_2007.pdf
Baumann, A. O., Giovannetti, P., O'Brien-Pallas, L. L., Mallette, C., Deber, R., Blythe, J., et al. (2001). Healthcare restructuring: the impact of job change. Canadian Journal of Nursing Leadership, 14(1), 14-20.
NURSING WORKLOAD AND STAFFING: IMPACT ON PATIENTS AND STAFF
118 REFERENCES
GL
UE
ING
IT T
OG
ET
HE
R: N
UR
SE
S, T
HE
IR W
OR
K E
NV
IRO
NM
EN
T &
PA
TIE
NT
SA
FE
TY
Baumann, A. O., O'Brien-Pallas, L., Armstrong-Stassen, M., Blyth, J., Bourbonnai, R., Cameron, S., et al. (2001). Commitment and care: The benefits of a health workplace for nurses, their patients and the system. Ottawa: Canadian Health Services Research Foundation and The Change Foundation.
Birch, S., O'Brien-Pallas, L., Alksnis, C., Murphy, G. T., & Thomson, D. (2003). Beyond demographic change in human resources planning: an extended framework and application to nursing. Journal of Health Services Research and Policy, 8(4), 225-229.
Boyle, S. M. (2004). Nursing Unit Characteristics And Patient Outcomes. Nursing Economic$, 22(3), 111.
Buerhaus, P. I. (1997). What is the harm in imposing mandatory hospital nurse staffing regulations? Nursing Economic$, 15(2), 66-72.
Buerhaus, P. I. (1999). Lucian Leape on the causes and prevention of errors and adverse events in health care. Image the Journal of Nursing Scholarship, 31(3), 281-286.
Chagnon, M., Audette, L. M., Lebrun, L., & Tilquin, C. (1978). Validation of a patient classification through evaluation of the nursing staff degree of occupation. Medical Care, 16(6), 465.
Cho, S. H., Ketefian, S., Barkauskas, V. H., & Smith, D. G. (2003). The effects of nurse staffing on adverse events, morbidity, mortality, and medical costs. Nursing Research, 52(2), 71-79.
Clarke, S. P., & Aiken, L. H. (2003). Failure to rescue. American Journal of Nursing, 103(1), 42-47.
Clarke, S. P., & Aiken, L. H. (2006). More nursing, fewer deaths. Quality & Safety in Health Care, 15(1), 2-3.
Czaplinski, C., & Diers, D. (1998). The Effect of Staff Nursing on Length of Stay and Mortality. Medical Care, 12, 1626-1638.
Daft, R. L. (1995). Organizational theory and design (5 ed.). St Paul: MN:West Publishing.
Department of Employment and Workplace Relations. (2006). Do you have an occupation in demand? Retrieved 23/05/2007, from http://www.immi.gov.au/skilled/general-skilled-migration/skilled-occupations/occupations-in-demand.htm
Diers, D., Bozzo, J., Blatt, L., & Roussel, M. (1998). Understanding nursing resources in intensive care: a case study. American Journal of Critical Care, 7(2), 143-148.
Diers, D., & Potter, J. (1997). Understanding the unmanageable nursing unit with casemix data: a case study. Journal of Nursing Administration, 27(11), 27-32.
Duffield, C., O'Brien-Pallas, L. L., & Aitken, L. M. (2004). Nurses who work outside nursing. Journal of Advanced Nursing, 47(6), 664-671.
Duffield, C., Roche, M., O'Brien-Pallas L. L., Diers, D. K., Aisbett, C., King, M., et al. (2007). Glueing it together: nurses, their work environment and patient safety. Sydney: Centre for Health Services Management, UTS.
Estabrooks, C. A., Midodzi, W. K., Cummings, G. G., Ricker, K. L., & Giovannetti, P. (2005). The impact of hospital nursing characteristics on 30-day mortality. Nurs Res, 54(2), 74-84.
Estabrooks, C. A., Tourangeau, A. E., Humphrey, C. K., Hesketh, K. L., Giovannetti, P., Thomson, D., et al. (2002). Measuring the hospital practice environment: a Canadian context... revised Nursing Work Index (NWI-R). Research in Nursing & Health., 25(4), 256-268.
Fabb, W. E., Chao, D. V., & Chan, C. S. (1997). The trouble with family medicine. Fam. Pract., 14(1), 5-11.
Falco, S. M., & Lobo, M. L. (1990). Martha E. Rogers. In J. George (Ed.), Nursing Theories: The Base for Professional Nursing Practice (pp. 211-229): Prentice-Hall.
Finn, C. P. (2001). Autonomy: an important component for nurses' job satisfaction. International Journal of Nursing Studies, 38(3), 349-357.
Freeman, T. (2005). Assessing the role of formal and informal caregivers in the current tertiary healthcare system: Factors influencing care roles and satisfaction with care. Unpublished Doctoral Dissertation, University of Toronto, Toronto.
Goldstein, D. E. (2003). Digital e-care technology delivers quality healthcare. Internet Healthcare Strategies, 5(2), 5-7.
NURSING WORKLOAD AND STAFFING: IMPACT ON PATIENTS AND STAFF
UNIVERSITY OF TECHNOLOGY, SYDNEY 119
Goldstein, H. (2003). Multilevel Statistical Models (2nd ed.). New York: John Wiley & Sons.
Goodwin, M., & Hawkins, A. (1990). PAIS dependency system: a validation. Australian Journal of Advanced Nursing., 7(3), 24-27.
Graf, C. M., Millar, S., Feilteau, C., Coakley, P. J., & Erickson, J. I. (2003). Patients' needs for nursing care: beyond staffing ratios. Journal of Nursing Administration, 33(2), 76-81.
Grillo-Peck, A. M., & Risner, P. B. (1995). The effect of a partnership model on quality and length of stay. Nursing Economic$, 13(6), 367-372, 374.
Hovenga, E. J. S. (1996). Patient Assessment and Information System (PAIS).Unpublished manuscript, Rockhampton, Australia.
Ingersoll, G. L. (1998). Organizational Redesign: Changing Educational Needs of Midlevel Nurse Administrators. Journal of Nursing Administration, 28(4), 13-16.
Institute of Medicine. (2004). Keeping patients safe: transforming the work environment of nurses. Washington: The Institute of Medicine of the National Academies.
IOM. (1999). To Err is Human: Building A Safer Health System. Washington: Institute of Medicine.
IOM. (2001). Crossing the Quality Chasm: A New Health System for the 21st Century. Washington: Institute of Medicine.
Jelinek, R. C. (1967). A structural model for the patient care operation. Health Serv Res., 2(3), 226-242.
Jelinek, R. C. (1969). An operational analysis of the patient care function. Inquiry, 6, 51-58.
Jiang, H. J., Stocks, C., & Wong, C. J. (2006). Disparities between two common data sources on hospital nurse staffing. Journal of Nursing Scholarship, 38(2), 187-193.
Kane, R. L., Shamliyan, T., Mueller, C., Duval, S., & Wilt, T. (2007). Nursing Staffing and Quality of Patient Care. Evidence Report/Technology Assessment No. 151 (Prepared by the Minnesota Evidence based Practice Center under Contract No. 290-02-0009). Rockville, MD: Agency for Healthcare Research and Quality.
Karmel, T., & Li, J. (2002). The Nursing Workforce - 2010. Canberra: National Review of Nursing Education.
Kovner, C., & Gergen, P. (1998). Nurse Staffing and Adverse Events Following Surgery in US Hospitals. Image the Journal of Nursing Scholarship, 30(4), 315-321.
Kramer, M., & Hafner, L. P. (1989). Shared values: impact on staff nurse job satisfaction and perceived productivity. Nursing Research, 38(3), 172-177.
Kramer, M., & Schmalenberg, C. (1991). Job satisfaction and retention insight for the 90's: Part I. Nursing, 21(3), 50-55.
Laschinger, H. K. S., Finegan, J., Shamian, J., & Wilk, P. (2004). A longitudinal analysis of the impact of workplace empowerment on work satisfaction. Journal of Organizational Behavior, 25(4), 527.
Laschinger, H. K. S., & Leiter, M. P. (2006). The impact of nursing work environments on patient safety outcomes. Journal of Nursing Administration, 36(5), 259-267.
Laszlo, E. (1975). The systems view of the world: The natural philosophy of the new developments in the sciences. Oxford: Blackwell.
McCloskey, B. A., & Diers, D. (2005). Effects of New Zealand's health reengineering on nursing and patient outcomes. Medical Care, 43(11), 1140-1146,.
McGillis-Hall, L. (1997). Staff mix models: complementary or substitution roles for nurses. Nursing Administration Quarterly, 21(2), 31-39.
McKenna, H. P., Hasson, F., & Keeney, S. (2004). Patient safety and quality of care: the role of the health care assistant. Journal of Nursing Management, 12(6), 452-459.
Microsoft Corporation. (2003). Microsoft Office Access 2003 (Version 11.6355.6360 SP1). Redmond: Microsoft Corporation.
Nadler, D. A., & Tushman, M. L. (1980). A Model for Diagnosing Organizational Behavior. Organizational Dynamics, 9, 35–51.
Needleman, J., Buerhaus, P., Mattke, S., Stewart, M., & Zelevinsky, K. (2002). Nurse-staffing levels and the quality of care in hospitals. New England Journal of Medicine, 346(22), 1715-1722.
Needleman, J., Buerhaus, P. I., Mattke, S., Stewart, M., & Zelevinsky, K. (2001). Nurse staffing and patient outcomes in hospitals. Boston: Harvard School of Public Health.
NURSING WORKLOAD AND STAFFING: IMPACT ON PATIENTS AND STAFF
120 REFERENCES
GL
UE
ING
IT T
OG
ET
HE
R: N
UR
SE
S, T
HE
IR W
OR
K E
NV
IRO
NM
EN
T &
PA
TIE
NT
SA
FE
TY
O'Brien-Pallas, L. L., Baumann, A. O., Donner, G., Tomblin-Murphy, G., Lochhaas-Gerlach, J., & Luba, M. (2001). Forecasting models for human resources in health care. Journal of Advanced Nursing, 33(1), 120-129.
O'Brien-Pallas, L. L., Doran, D. I., Murray, M., Cockerill, R., Sidani, S., Laurie-Shaw, B., et al. (2001). Evaluation of a Client Care Delivery Model, Part 1: Variability in Nursing Utilization in Community Home Nursing. Nursing Economic$, 19(6), 267.
O'Brien-Pallas, L. L., Doran, D. I., Murray, M., Cockerill, R., Sidani, S., Laurie-Shaw, B., et al. (2002). Evaluation of a Client Care Delivery Model, Part 2: Variability in Client Outcomes in Community Home Nursing. Nursing Economic$, 20(1), 13.
O'Brien-Pallas, L. L., Irvine, D., Peereboom, E., & Murray, M. (1997). Measuring nursing workload: understanding the variability. Nursing Economic$, 15(4), 171-182.
O'Brien-Pallas, L. L., Thomson, D., Alksnis, C., & Bruce, S. (2001). The economic impact of nurse staffing decisions: time to turn down another road? Hospital Quarterly, 4, 42-50.
O'Brien-Pallas, L. L., Thomson, D., McGillis-Hall, L., Pink, G. H., Kerr, M., Wang, S., et al. (2004). Evidence-based Standards for Measuring Nurse Staffing and Performance: Canadian Health Services Research Foundation.
Orne, R. M., Garland, D., O'Hara, M., Perfetto, L., & Stielau, J. (1998). Caught in the cross fire of change: nurses' experience with unlicensed assistive personnel. Applied Nursing Research, 11(3), 101-110.
Person, S. D., Allison, J. J., Kiefe, C. I., Weaver, M. T., Williams, O. D., Centor, R. M., et al. (2004). Nurse Staffing and Mortality for Medicare Patients with Acute Myocardial Infarction. Medical Care, 42(1), 4-12.
Plummer, V. (2005). Analysis of patient dependency data utilising the Trendcare system. Unpublished Unpublished PhD Thesis, Monash University, Frankston, Victoria.
Putt, A. M. (1978). General systems theory applied to nursing. Boston: Little, Brown.
Rafferty, A. M., Ball, J., & Aiken, L. H. (2001). Are teamwork and professional autonomy compatible, and do they result in improved hospital care? Qual Saf Health Care, 10(90002), 32ii-37.
Schofield, D., & Beard, J. (2005). Baby boomer doctors and nurses: demographic change and transitions to retirement. Medical Journal of Australia, 183, 80-83.
Sheshkin, D. J. (2000). Handbook of parametric and nonparametric statistical procedures (2nd ed.). Boca Raton: Chapman & Hall/CRC.
Shullanberger, G. (2000). Nurse staffing decisions: An integrative review of the literature. Nursing Economic$, 18(3), 124-132.
Silber, J. H., Williams, S. V., Krakauer, H., & Schwartz, J. S. (1992). Hospital and patient characteristics associated with death after surgery. A study of adverse occurrence and failure to rescue. Medical Care, 30(7), 615-629.
SPSS Inc. (2005). SPSS for Windows (Version 14.0.0). Chicago: SPSS Inc.
SPSS Inc. (2006). SPSS for Windows (Version 15.0.0). Chicago: SPSS Inc.
Stamps, P. L., & Piedmont, E. B. (1986). Nurses and Work SatisfactionAn Index for Measurement. 1-125.
Tillman, H. J., Salyer, J., Corley, M. C., & Mark, B. A. (1997). Environmental turbulence staff nurse perspectives. Journal of Nursing Administration, 27(11), 15-22.
Tourangeau, A. E. (2002). Nursing skill mix and experience reduce patient mortality. Hospital Quarterly, 5(3), 19.
Tourangeau, A. E., Doran, D., Pringle, D., O'Brien-Pallas, L., McGillis-Hall, L., Tu, J., et al. (2006). Nurse Staffing and Work Environments: Relationships with hospital level outcomes. Toronto: Canadian Health Services Research Foundation.
Trend Care Systems Pty Ltd. (2004). Product Overview. Retrieved 15th June 2004, 2004, from http://www.trendcare.com.au/product_overview.html
Unruh, L. Y., & Fottler, M. D. (2006). Patient turnover and nursing staff adequacy. Health Services Research, 41(2), 599-612, 2006 Apr.
VDHS. (1999). Nurse labourforce projections: Victoria 1998-2009. Melbourne: Public Health and Development Division, Victorian Government Department of Human Services..
NURSING WORKLOAD AND STAFFING: IMPACT ON PATIENTS AND STAFF
UNIVERSITY OF TECHNOLOGY, SYDNEY 121
8. Appendices
Appendix 1 Theoretical Foundations
Appendix 2 Format for Admitted Patient Care Data
Appendix 3 Format for Ward Episode Data
Appendix 4 Matching Wards
Appendix 5 OPSN Analysis
Appendix 6 Staffing of the Study Wards
Appendix 7 Instruments for Cross-sectional Component
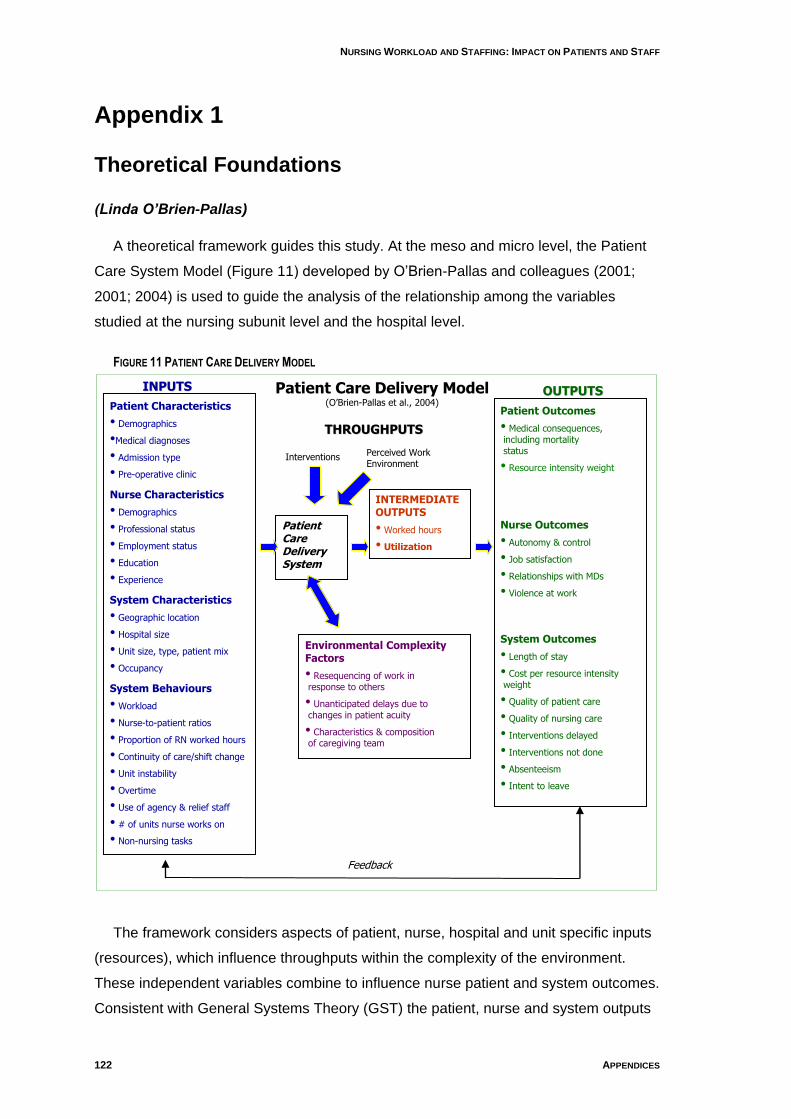
NURSING WORKLOAD AND STAFFING: IMPACT ON PATIENTS AND STAFF
122 APPENDICES
GL
UE
ING
IT T
OG
ET
HE
R: N
UR
SE
S, T
HE
IR W
OR
K E
NV
IRO
NM
EN
T &
PA
TIE
NT
SA
FE
TY
Appendix 1
Theoretical Foundations
(Linda O’Brien-Pallas)
A theoretical framework guides this study. At the meso and micro level, the Patient
Care System Model (Figure 11) developed by O‟Brien-Pallas and colleagues (2001;
2001; 2004) is used to guide the analysis of the relationship among the variables
studied at the nursing subunit level and the hospital level.
FIGURE 11 PATIENT CARE DELIVERY MODEL
The framework considers aspects of patient, nurse, hospital and unit specific inputs
(resources), which influence throughputs within the complexity of the environment.
These independent variables combine to influence nurse patient and system outcomes.
Consistent with General Systems Theory (GST) the patient, nurse and system outputs
Patient Characteristics
• Demographics
•Medical diagnoses
• Admission type
• Pre-operative clinic
Nurse Characteristics
• Demographics
• Professional status
• Employment status
• Education
• Experience
System Characteristics
• Geographic location
• Hospital size
• Unit size, type, patient mix
• Occupancy
System Behaviours
• Workload
• Nurse-to-patient ratios
• Proportion of RN worked hours
• Continuity of care/shift change
• Unit instability
• Overtime
• Use of agency & relief staff
• # of units nurse works on
• Non-nursing tasks
Patient Outcomes
• Medical consequences, including mortality status
• Resource intensity weight
Nurse Outcomes
• Autonomy & control
• Job satisfaction
• Relationships with MDs
• Violence at work
System Outcomes
• Length of stay
• Cost per resource intensity weight
• Quality of patient care
• Quality of nursing care
• Interventions delayed
• Interventions not done
• Absenteeism
• Intent to leave
Patient Care Delivery System
INTERMEDIATE OUTPUTS
• Worked hours
• Utilization
Environmental Complexity Factors
• Resequencing of work in response to others
• Unanticipated delays due to changes in patient acuity
• Characteristics & composition of caregiving team
IINNPPUUTTSS
Feedback
TTHHRROOUUGGHHPPUUTTSS
OOUUTTPPUUTTSS
Perceived Work Environment
Interventions
Patient Care Delivery Model (O‟Brien-Pallas et al., 2004)
NURSING WORKLOAD AND STAFFING: IMPACT ON PATIENTS AND STAFF
UNIVERSITY OF TECHNOLOGY, SYDNEY 123
serve as dependent variables to the system as a whole (O'Brien-Pallas et al, 2001) but
can also serve as independent variables for other analysis of the system.
The underlying assumptions of the GST are as follows: GST is a general science of
wholeness, concerned with the problems of organisation and dynamic interactions
manifested in the difference of the behaviour of the parts when isolates (Falco & Lobo,
1990; Freeman, 2005; Putt, 1978). GST believes an organisation must be “open” and
continually change, adapt and interact to meet the challenges posed by both the
internal and external environment, in order to meet the needs of their clients and
stakeholders (Shortell et al, 1991; Daft, 1995; Freeman, 2005). An open system
interacts with the environment, taking input from the environment, subjects it to some
form of transformation process and then produces an output (Nadler & Tushman,
1980).
The holistic view that GST provides, allows a comprehensive and specific view of
the system or individual under investigation, never as the mechanistic accumulation of
parts in segregated causal relationships (Laszlo, 1975). A system is characterised by a
number of constraining but interacting factors, each fulfilling a function not
accomplished by the others which connect through communication and feedback
mechanisms (Fabb, Chao, & Chan, 1997). Basic concepts of GST are those of: 1)
nonsummativity, 2) input, throughput and output, 3) entropy, 4) equifinality/ multifinality,
5) equilibrium, 6) feedback and 7) control (Fabb et al., 1997; Freeman, 2005; Putt,
1978).
GST concepts can be represented in the following propositions:
1. A system is a set of interacting and interrelated parts. A system is more than
a sum of its parts; its characteristics derive from the association among the
parts and from the system‟s connection with the environment (Fabb et al.,
1997; Freeman, 2005). In this study unit characteristics including patient
characteristics, staff characteristics, system characteristics and behaviours
influence throughput including environmental complexity, interventions and
perceived work environment. These in turn influence intermediate outcomes
including workload and staff utilisation and these in turn influence patient,
nurse and system outputs.
2. Open systems have permeable boundaries that continually engage in the
input, throughput and output of matter, energy and information (Fabb et al.,
NURSING WORKLOAD AND STAFFING: IMPACT ON PATIENTS AND STAFF
124 APPENDICES
GL
UE
ING
IT T
OG
ET
HE
R: N
UR
SE
S, T
HE
IR W
OR
K E
NV
IRO
NM
EN
T &
PA
TIE
NT
SA
FE
TY
1997; Freeman, 2005). In this study the system is conceptualised as
interconnecting parts including nursing, patient and system variables and
their relationship workload and staff utilisation recognising these in turn
influence patient, nurse and system outputs.
3. Systems are capable of negative entropy, that is, systems can survive and
grow rather than decay and die, if they are able to work out mutually
beneficial relationships with their environment (negentropic) (Fabb et al.,
1997). The process of entropy is universal, existing in both closed and open
systems (Putt, 1978). In this study the system will be explored to identify
factors that influence workload and patient nurse and system outputs.
Through this study areas for improvement within work systems will be
identified and positive change maybe recommended.
4. When acting on a system of interrelated parts, the effects cannot be gauged
on knowledge of inputs alone but must include the entire system. The overall
pattern must be considered, in order to determine the results of specific
stimulus/ stimuli. In other words, the results of equifinality and multifinality
must be taken into account (Freeman, 2005). In this study the nursing,
patient and system inputs will be viewed within the broader scope of the unit
throughputs and the nurse, patient and system outputs.
5. Systems tend to maintain steady states of dynamic equilibrium, in which
conflicting pressures are balanced. Such steady states have the property of
evolution; the more the system is threatened with disequilibrium, the more
resources it will deploy to maintain or restore balance (Fabb et al., 1997;
Freeman, 2005). In this study the factors that threaten nurses‟ workload and
patient nurse and system outputs will be explored. Further, the current
practice and overall system will not change unless this research is
conducted.
6. To maintain a steady state, open systems need adaptive processes such as
feedback loops and control. This allows the system to detect applicable
changes in the internal and external environment and adjust appropriately
(Fabb et al., 1997; Freeman, 2005). In this study a feedback loop will be
utilised to link the outputs to the inputs and throughputs to demonstrate the
openness of the system.
Consistent with systems theory (Jelinek, 1967), these dependent variables feed
back into the system and, in turn, affect future inputs. This model allows the researcher
NURSING WORKLOAD AND STAFFING: IMPACT ON PATIENTS AND STAFF
UNIVERSITY OF TECHNOLOGY, SYDNEY 125
to gain comprehension of the nursing system unit and the broader components of the
patient care system. It permits the management of complex interdependent
relationships that exist in the patient care system.
Jelinek (1969), described the patient care systems model comprising inputs and
outputs that can be affected by workload, the environment, and organisation factors.
Inputs are postulated to refer to resources, both personnel and physical, involved in
patient care. Organisational factors capture the form of organisation used in delivering
patient care and include rules and policies. Workload factors explore the workload the
patient imposes on the input resources. Environmental factors include factors that may
affect patient care such as services a hospital offers. Output describes patient
outcomes in terms of the quality and quantity of patient care delivered (O'Brien-Pallas
et al, 2004).
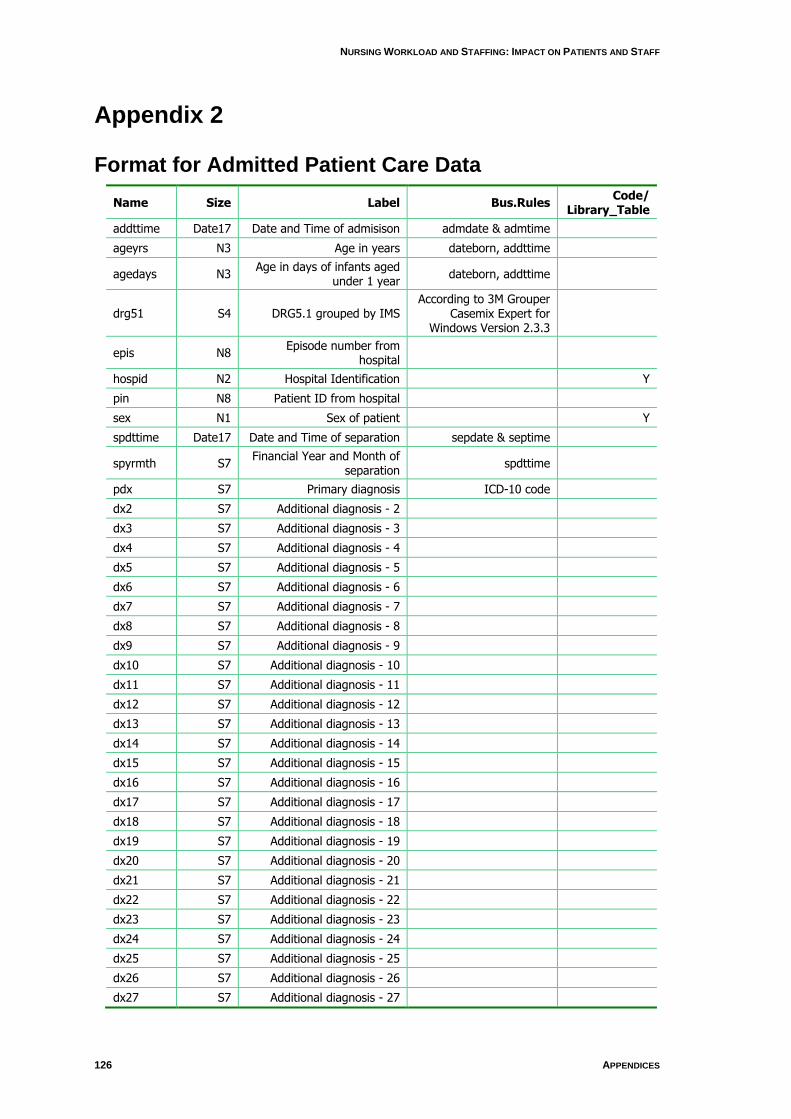
NURSING WORKLOAD AND STAFFING: IMPACT ON PATIENTS AND STAFF
126 APPENDICES
GL
UE
ING
IT T
OG
ET
HE
R: N
UR
SE
S, T
HE
IR W
OR
K E
NV
IRO
NM
EN
T &
PA
TIE
NT
SA
FE
TY
Appendix 2
Format for Admitted Patient Care Data
Name Size Label Bus.Rules Code/
Library_Table
addttime Date17 Date and Time of admisison admdate & admtime
ageyrs N3 Age in years dateborn, addttime
agedays N3 Age in days of infants aged
under 1 year dateborn, addttime
drg51 S4 DRG5.1 grouped by IMS According to 3M Grouper
Casemix Expert for Windows Version 2.3.3
epis N8 Episode number from
hospital
hospid N2 Hospital Identification Y
pin N8 Patient ID from hospital
sex N1 Sex of patient Y
spdttime Date17 Date and Time of separation sepdate & septime
spyrmth S7 Financial Year and Month of
separation spdttime
pdx S7 Primary diagnosis ICD-10 code
dx2 S7 Additional diagnosis - 2
dx3 S7 Additional diagnosis - 3
dx4 S7 Additional diagnosis - 4
dx5 S7 Additional diagnosis - 5
dx6 S7 Additional diagnosis - 6
dx7 S7 Additional diagnosis - 7
dx8 S7 Additional diagnosis - 8
dx9 S7 Additional diagnosis - 9
dx10 S7 Additional diagnosis - 10
dx11 S7 Additional diagnosis - 11
dx12 S7 Additional diagnosis - 12
dx13 S7 Additional diagnosis - 13
dx14 S7 Additional diagnosis - 14
dx15 S7 Additional diagnosis - 15
dx16 S7 Additional diagnosis - 16
dx17 S7 Additional diagnosis - 17
dx18 S7 Additional diagnosis - 18
dx19 S7 Additional diagnosis - 19
dx20 S7 Additional diagnosis - 20
dx21 S7 Additional diagnosis - 21
dx22 S7 Additional diagnosis - 22
dx23 S7 Additional diagnosis - 23
dx24 S7 Additional diagnosis - 24
dx25 S7 Additional diagnosis - 25
dx26 S7 Additional diagnosis - 26
dx27 S7 Additional diagnosis - 27
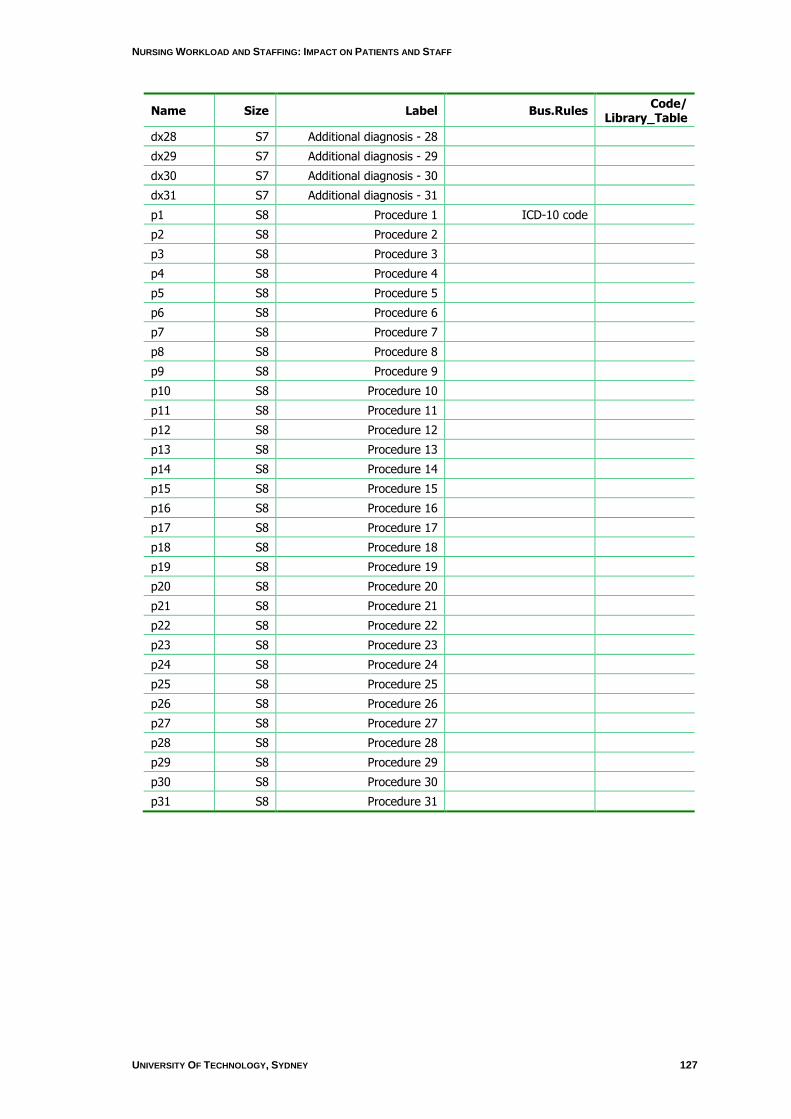
NURSING WORKLOAD AND STAFFING: IMPACT ON PATIENTS AND STAFF
UNIVERSITY OF TECHNOLOGY, SYDNEY 127
Name Size Label Bus.Rules Code/
Library_Table
dx28 S7 Additional diagnosis - 28
dx29 S7 Additional diagnosis - 29
dx30 S7 Additional diagnosis - 30
dx31 S7 Additional diagnosis - 31
p1 S8 Procedure 1 ICD-10 code
p2 S8 Procedure 2
p3 S8 Procedure 3
p4 S8 Procedure 4
p5 S8 Procedure 5
p6 S8 Procedure 6
p7 S8 Procedure 7
p8 S8 Procedure 8
p9 S8 Procedure 9
p10 S8 Procedure 10
p11 S8 Procedure 11
p12 S8 Procedure 12
p13 S8 Procedure 13
p14 S8 Procedure 14
p15 S8 Procedure 15
p16 S8 Procedure 16
p17 S8 Procedure 17
p18 S8 Procedure 18
p19 S8 Procedure 19
p20 S8 Procedure 20
p21 S8 Procedure 21
p22 S8 Procedure 22
p23 S8 Procedure 23
p24 S8 Procedure 24
p25 S8 Procedure 25
p26 S8 Procedure 26
p27 S8 Procedure 27
p28 S8 Procedure 28
p29 S8 Procedure 29
p30 S8 Procedure 30
p31 S8 Procedure 31
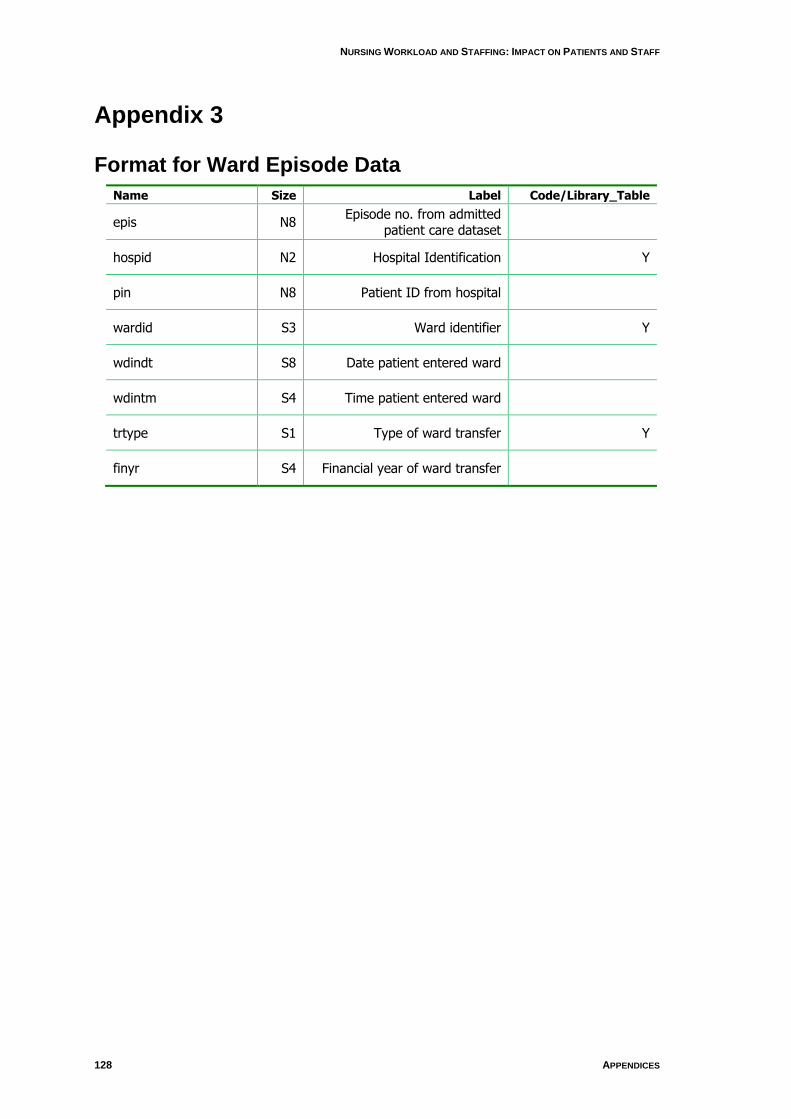
NURSING WORKLOAD AND STAFFING: IMPACT ON PATIENTS AND STAFF
128 APPENDICES
GL
UE
ING
IT T
OG
ET
HE
R: N
UR
SE
S, T
HE
IR W
OR
K E
NV
IRO
NM
EN
T &
PA
TIE
NT
SA
FE
TY
Appendix 3
Format for Ward Episode Data
Name Size Label Code/Library_Table
epis N8 Episode no. from admitted
patient care dataset
hospid N2 Hospital Identification Y
pin N8 Patient ID from hospital
wardid S3 Ward identifier Y
wdindt S8 Date patient entered ward
wdintm S4 Time patient entered ward
trtype S1 Type of ward transfer Y
finyr S4 Financial year of ward transfer
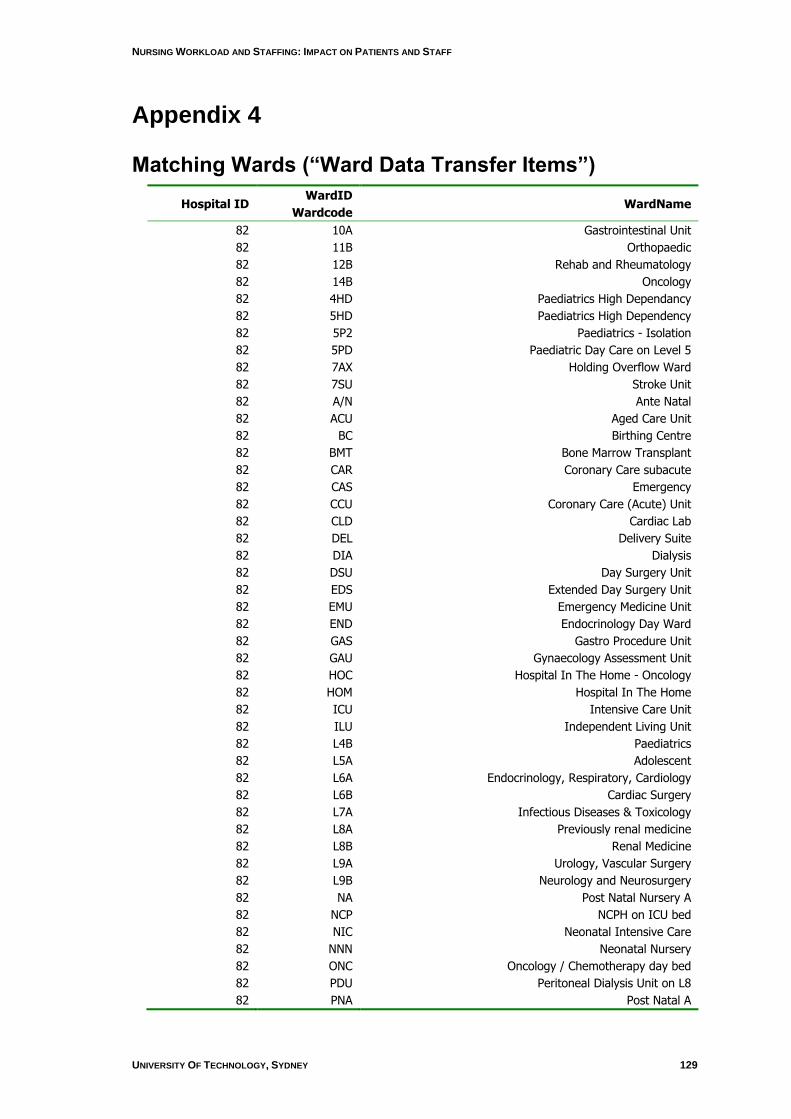
NURSING WORKLOAD AND STAFFING: IMPACT ON PATIENTS AND STAFF
UNIVERSITY OF TECHNOLOGY, SYDNEY 129
Appendix 4
Matching Wards (“Ward Data Transfer Items”)
Hospital ID WardID
Wardcode WardName
82 10A Gastrointestinal Unit
82 11B Orthopaedic
82 12B Rehab and Rheumatology
82 14B Oncology
82 4HD Paediatrics High Dependancy
82 5HD Paediatrics High Dependency
82 5P2 Paediatrics - Isolation
82 5PD Paediatric Day Care on Level 5
82 7AX Holding Overflow Ward
82 7SU Stroke Unit
82 A/N Ante Natal
82 ACU Aged Care Unit
82 BC Birthing Centre
82 BMT Bone Marrow Transplant
82 CAR Coronary Care subacute
82 CAS Emergency
82 CCU Coronary Care (Acute) Unit
82 CLD Cardiac Lab
82 DEL Delivery Suite
82 DIA Dialysis
82 DSU Day Surgery Unit
82 EDS Extended Day Surgery Unit
82 EMU Emergency Medicine Unit
82 END Endocrinology Day Ward
82 GAS Gastro Procedure Unit
82 GAU Gynaecology Assessment Unit
82 HOC Hospital In The Home - Oncology
82 HOM Hospital In The Home
82 ICU Intensive Care Unit
82 ILU Independent Living Unit
82 L4B Paediatrics
82 L5A Adolescent
82 L6A Endocrinology, Respiratory, Cardiology
82 L6B Cardiac Surgery
82 L7A Infectious Diseases & Toxicology
82 L8A Previously renal medicine
82 L8B Renal Medicine
82 L9A Urology, Vascular Surgery
82 L9B Neurology and Neurosurgery
82 NA Post Natal Nursery A
82 NCP NCPH on ICU bed
82 NIC Neonatal Intensive Care
82 NNN Neonatal Nursery
82 ONC Oncology / Chemotherapy day bed
82 PDU Peritoneal Dialysis Unit on L8
82 PNA Post Natal A
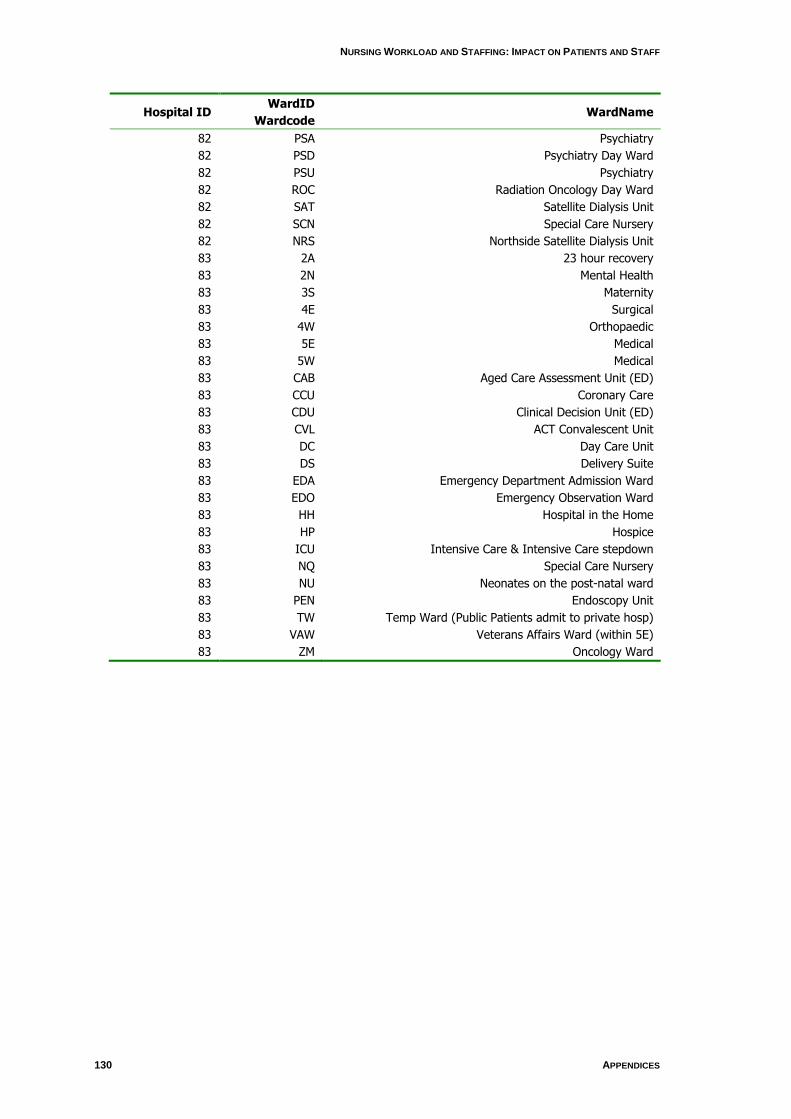
NURSING WORKLOAD AND STAFFING: IMPACT ON PATIENTS AND STAFF
130 APPENDICES
GL
UE
ING
IT T
OG
ET
HE
R: N
UR
SE
S, T
HE
IR W
OR
K E
NV
IRO
NM
EN
T &
PA
TIE
NT
SA
FE
TY
Hospital ID WardID
Wardcode WardName
82 PSA Psychiatry
82 PSD Psychiatry Day Ward
82 PSU Psychiatry
82 ROC Radiation Oncology Day Ward
82 SAT Satellite Dialysis Unit
82 SCN Special Care Nursery
82 NRS Northside Satellite Dialysis Unit
83 2A 23 hour recovery
83 2N Mental Health
83 3S Maternity
83 4E Surgical
83 4W Orthopaedic
83 5E Medical
83 5W Medical
83 CAB Aged Care Assessment Unit (ED)
83 CCU Coronary Care
83 CDU Clinical Decision Unit (ED)
83 CVL ACT Convalescent Unit
83 DC Day Care Unit
83 DS Delivery Suite
83 EDA Emergency Department Admission Ward
83 EDO Emergency Observation Ward
83 HH Hospital in the Home
83 HP Hospice
83 ICU Intensive Care & Intensive Care stepdown
83 NQ Special Care Nursery
83 NU Neonates on the post-natal ward
83 PEN Endoscopy Unit
83 TW Temp Ward (Public Patients admit to private hosp)
83 VAW Veterans Affairs Ward (within 5E)
83 ZM Oncology Ward

NURSING WORKLOAD AND STAFFING: IMPACT ON PATIENTS AND STAFF
UNIVERSITY OF TECHNOLOGY, SYDNEY 131
Appendix 5
OPSN Analysis
Steps for selecting Denominator
1. Combine All years (2001-2006) data selecting fields: hospital, stay number,
Age, LOS, MDC, separation mode, AR-DRG, same-day field.
2. Link to study hospitals and select only hospitals with nursedata = 1.
3. Run delete query (denomselect.sql) to exclude cases which:
a. Have MDC = 14,15,19 or 20
b. Are paediatrics (ie age <18)
c. Have LOS < 1 day
d. Have LOS > 90 days
e. Have DRG = Inappropriate diagnosis (ie. 961Z, 962Z, 963Z)
4. Add Med/Surg field
5. Update Med/Surg field where second character of AR-DRG:
a. 6 and above = medical
b. below 6 = surgical.
6. Get final denominators by running query “finaldenom” – groupby year and
med/surg, and count. This is in Adverse.mdb database
7. Final denominators have been calculated and added (overwritten old
previous denominators) to the AdverseResults.xls
should be cases 4,in DENOMSALL
should be cases in DENOMS Study Hospitals
Mini notes: Make DENOMSALL – then copy for numerator, then delete irrelevant fields from denoms all.. then make a copy for Denoms Study hosps.
Steps for selecting Numerators
1. Use table NurseworkAdverse (ie.denomintors)
2. Run queries (nGroup1…nGroup11, and Failure to Rescue) to select initial
adverse and flag Group for type of adverse (1 or 0)
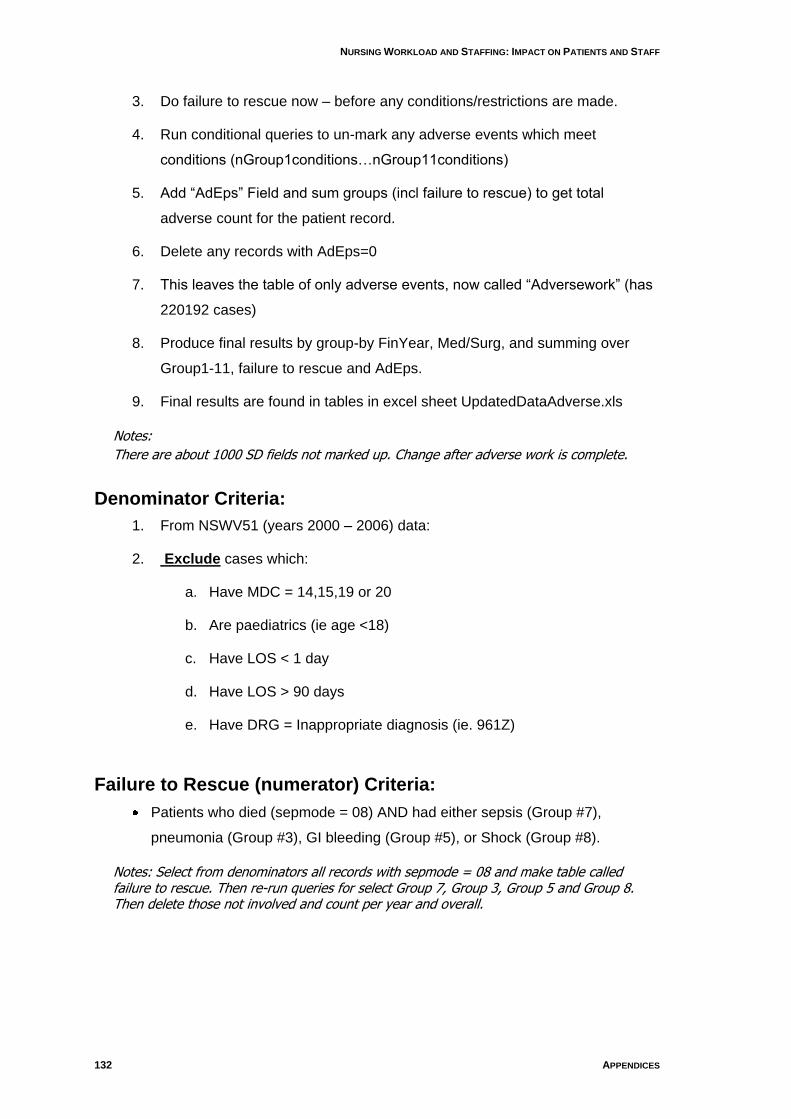
NURSING WORKLOAD AND STAFFING: IMPACT ON PATIENTS AND STAFF
132 APPENDICES
GL
UE
ING
IT T
OG
ET
HE
R: N
UR
SE
S, T
HE
IR W
OR
K E
NV
IRO
NM
EN
T &
PA
TIE
NT
SA
FE
TY
3. Do failure to rescue now – before any conditions/restrictions are made.
4. Run conditional queries to un-mark any adverse events which meet
conditions (nGroup1conditions…nGroup11conditions)
5. Add “AdEps” Field and sum groups (incl failure to rescue) to get total
adverse count for the patient record.
6. Delete any records with AdEps=0
7. This leaves the table of only adverse events, now called “Adversework” (has
220192 cases)
8. Produce final results by group-by FinYear, Med/Surg, and summing over
Group1-11, failure to rescue and AdEps.
9. Final results are found in tables in excel sheet UpdatedDataAdverse.xls
Notes:
There are about 1000 SD fields not marked up. Change after adverse work is complete.
Denominator Criteria:
1. From NSWV51 (years 2000 – 2006) data:
2. Exclude cases which:
a. Have MDC = 14,15,19 or 20
b. Are paediatrics (ie age <18)
c. Have LOS < 1 day
d. Have LOS > 90 days
e. Have DRG = Inappropriate diagnosis (ie. 961Z)
Failure to Rescue (numerator) Criteria:
Patients who died (sepmode = 08) AND had either sepsis (Group #7),
pneumonia (Group #3), GI bleeding (Group #5), or Shock (Group #8).
Notes: Select from denominators all records with sepmode = 08 and make table called failure to rescue. Then re-run queries for select Group 7, Group 3, Group 5 and Group 8. Then delete those not involved and count per year and overall.
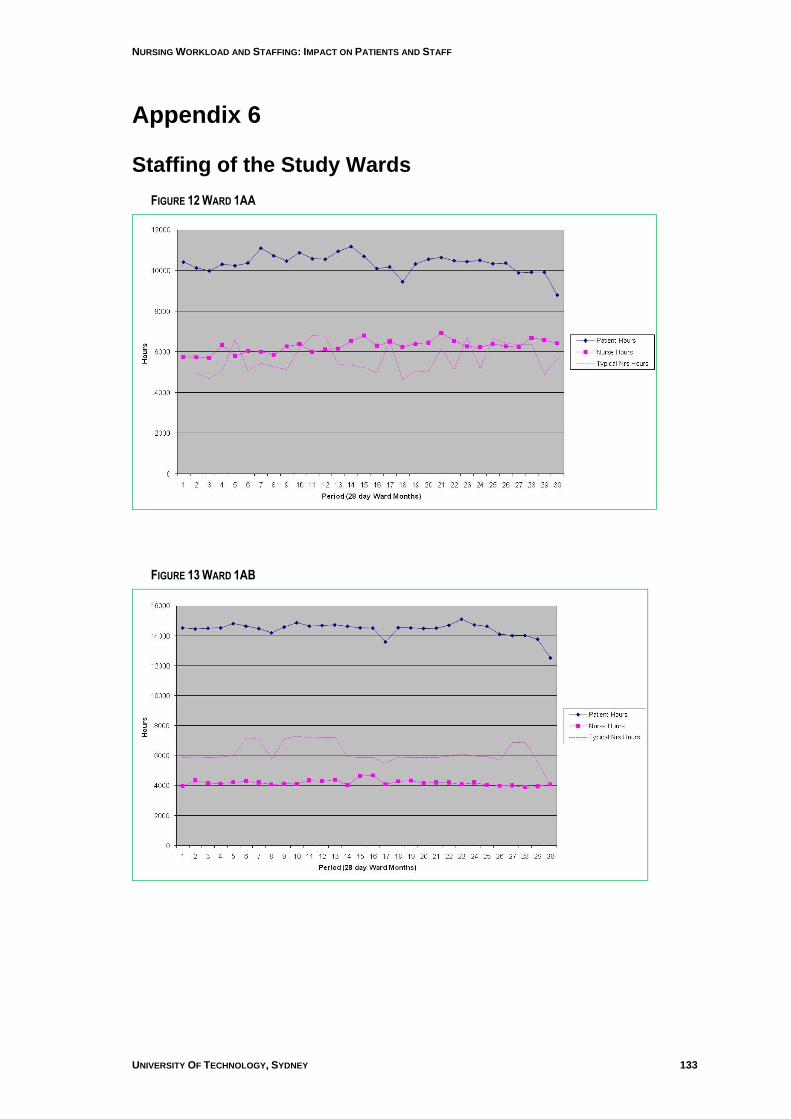
NURSING WORKLOAD AND STAFFING: IMPACT ON PATIENTS AND STAFF
UNIVERSITY OF TECHNOLOGY, SYDNEY 133
Appendix 6
Staffing of the Study Wards
FIGURE 12 WARD 1AA
FIGURE 13 WARD 1AB
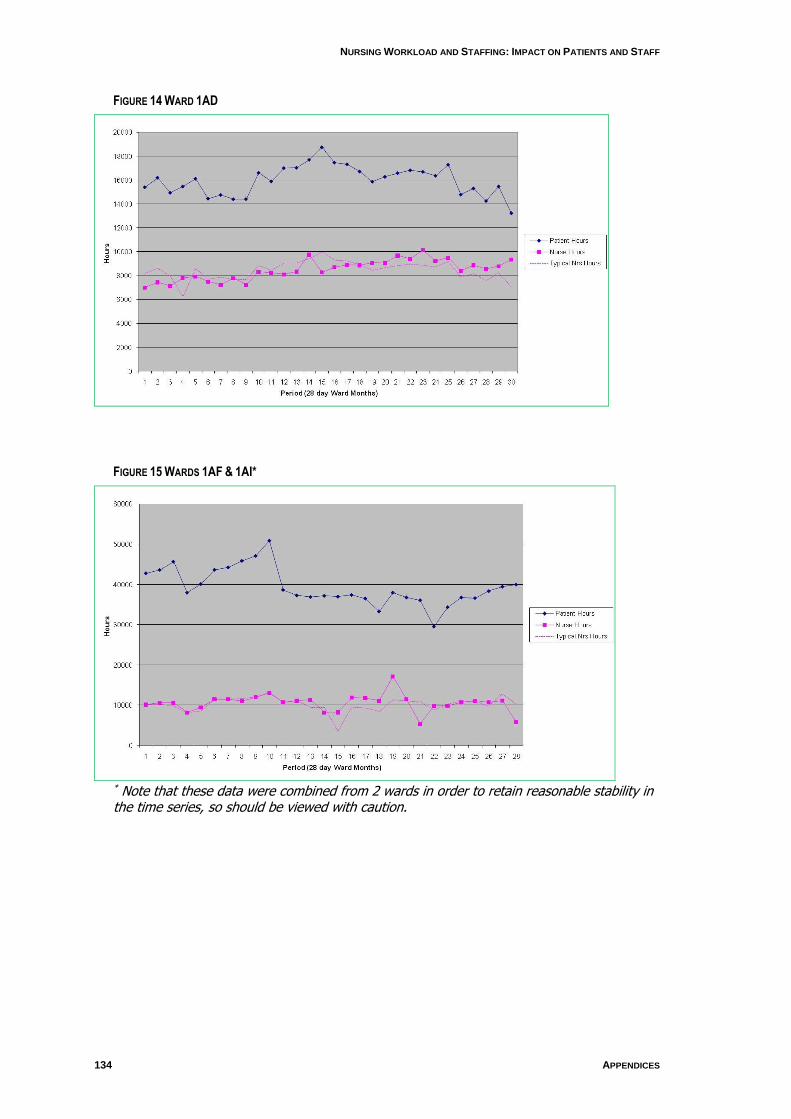
NURSING WORKLOAD AND STAFFING: IMPACT ON PATIENTS AND STAFF
134 APPENDICES
GL
UE
ING
IT T
OG
ET
HE
R: N
UR
SE
S, T
HE
IR W
OR
K E
NV
IRO
NM
EN
T &
PA
TIE
NT
SA
FE
TY
FIGURE 14 WARD 1AD
FIGURE 15 WARDS 1AF & 1AI*
* Note that these data were combined from 2 wards in order to retain reasonable stability in the time series, so should be viewed with caution.
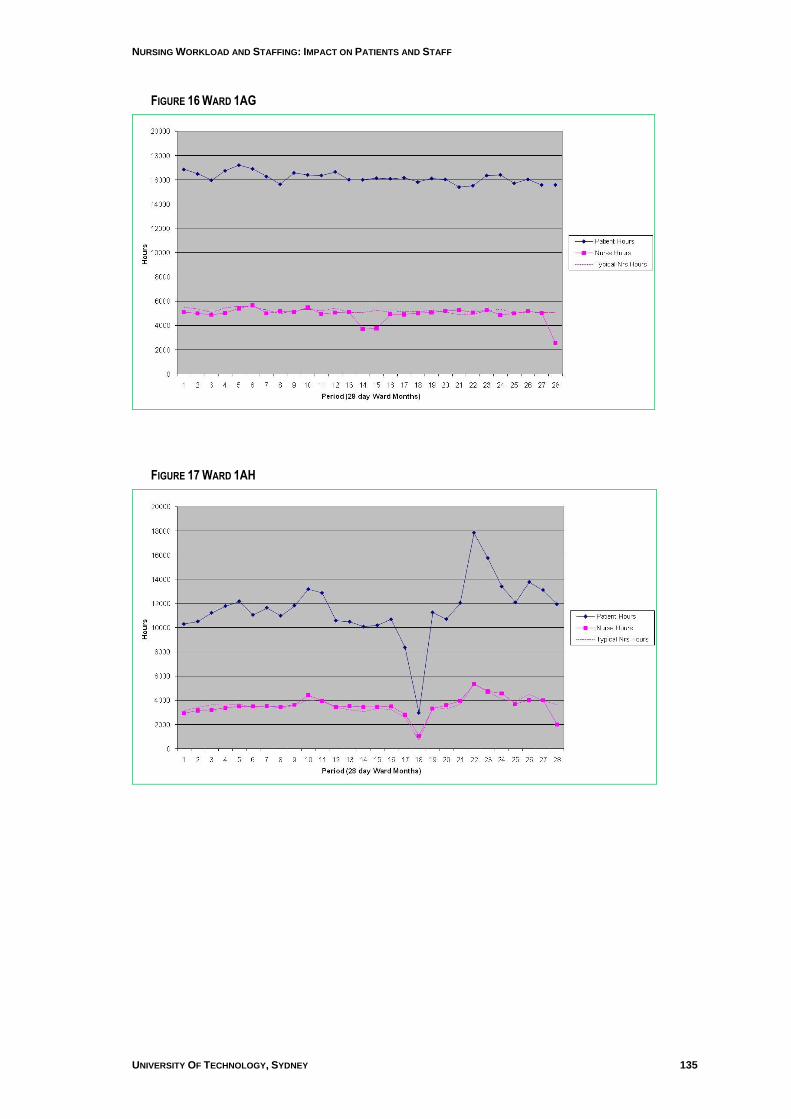
NURSING WORKLOAD AND STAFFING: IMPACT ON PATIENTS AND STAFF
UNIVERSITY OF TECHNOLOGY, SYDNEY 135
FIGURE 16 WARD 1AG
FIGURE 17 WARD 1AH
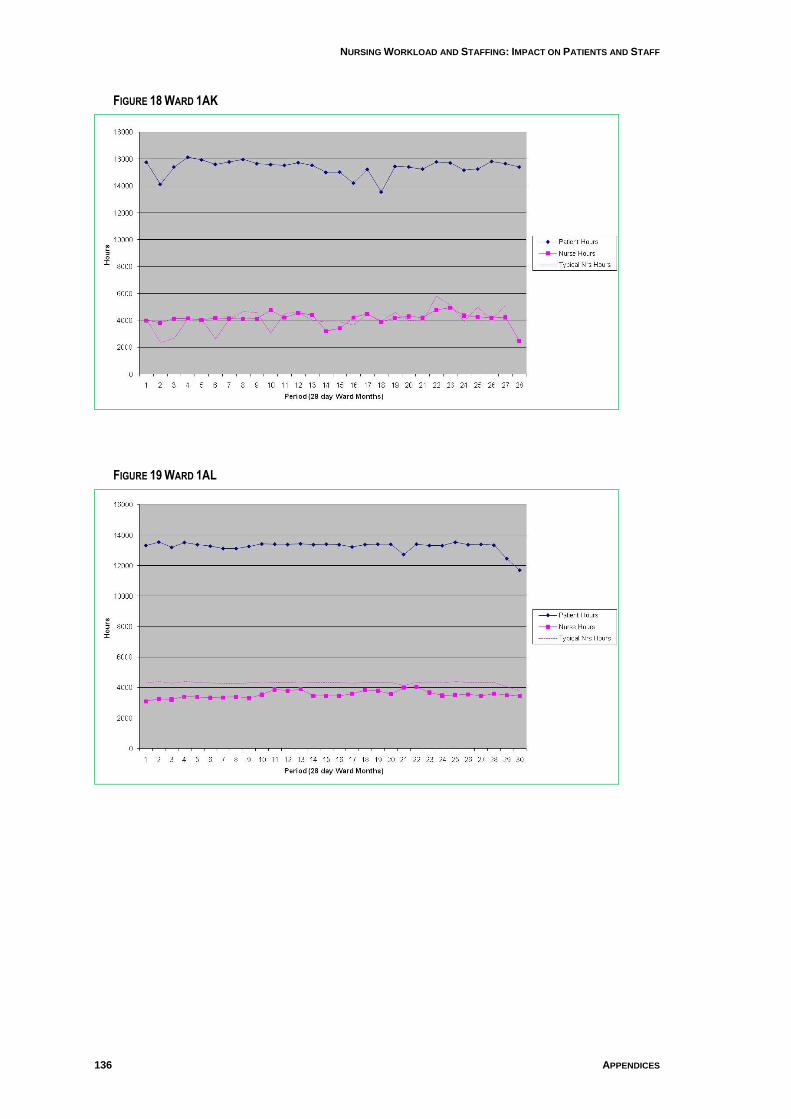
NURSING WORKLOAD AND STAFFING: IMPACT ON PATIENTS AND STAFF
136 APPENDICES
GL
UE
ING
IT T
OG
ET
HE
R: N
UR
SE
S, T
HE
IR W
OR
K E
NV
IRO
NM
EN
T &
PA
TIE
NT
SA
FE
TY
FIGURE 18 WARD 1AK
FIGURE 19 WARD 1AL
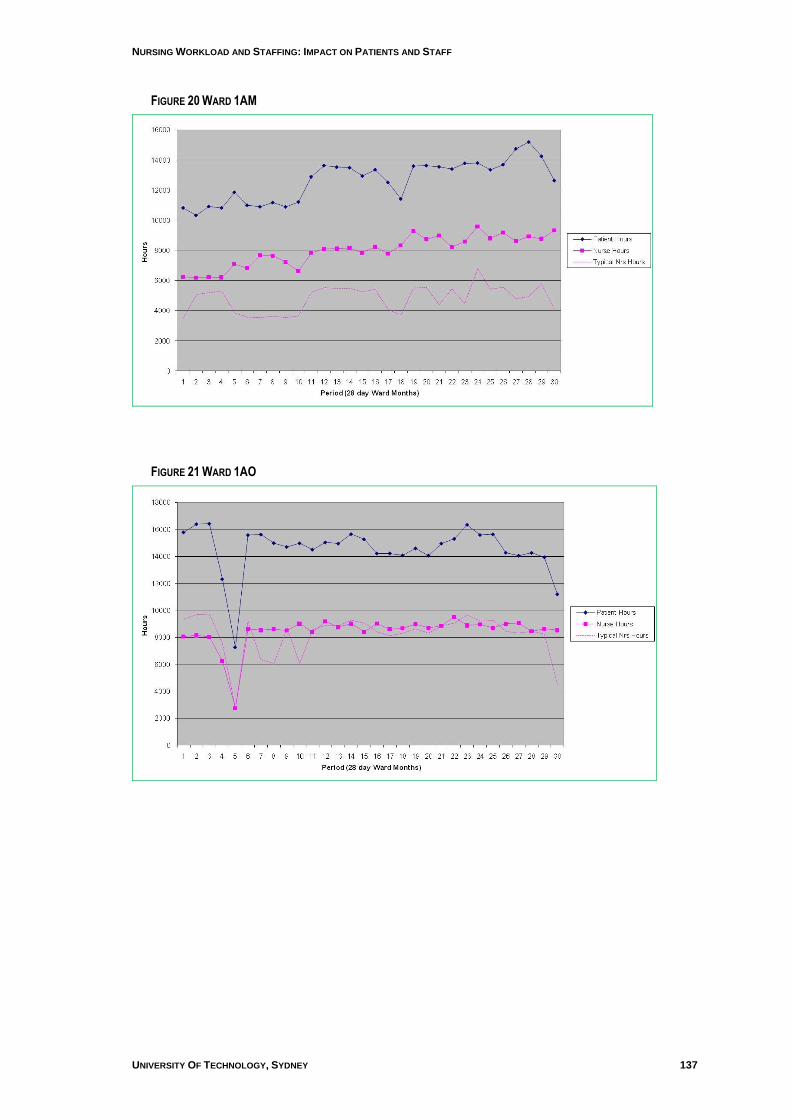
NURSING WORKLOAD AND STAFFING: IMPACT ON PATIENTS AND STAFF
UNIVERSITY OF TECHNOLOGY, SYDNEY 137
FIGURE 20 WARD 1AM
FIGURE 21 WARD 1AO
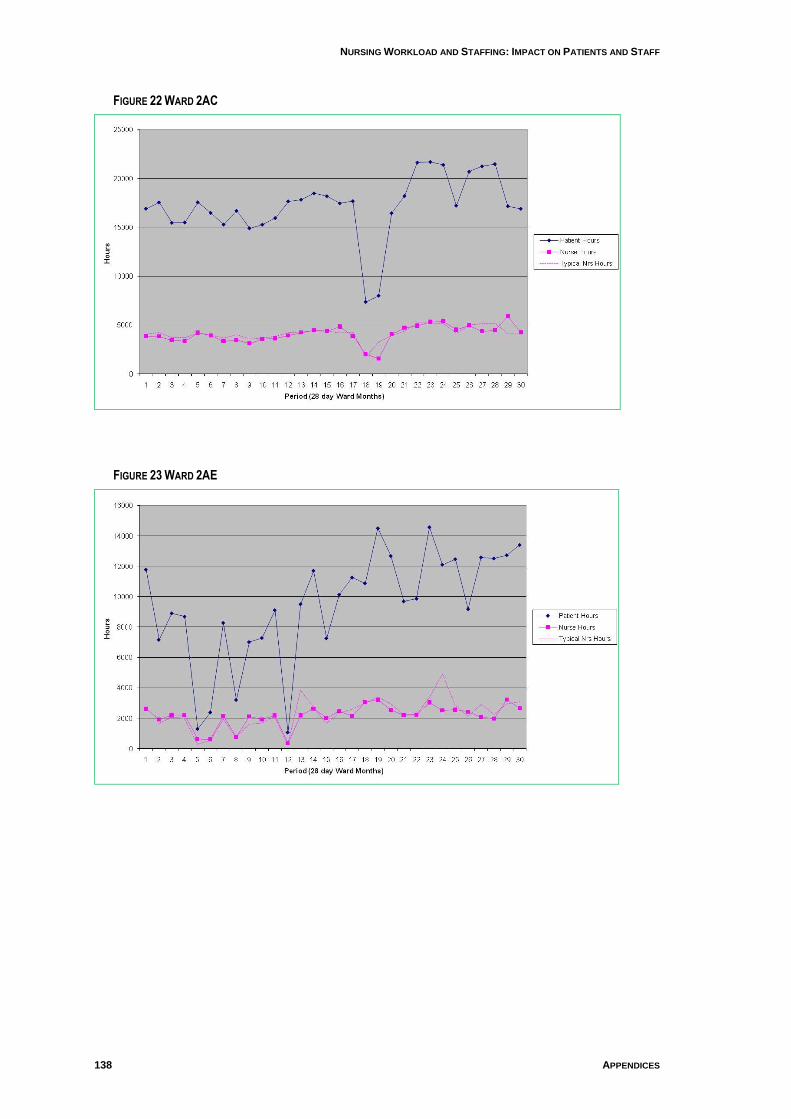
NURSING WORKLOAD AND STAFFING: IMPACT ON PATIENTS AND STAFF
138 APPENDICES
GL
UE
ING
IT T
OG
ET
HE
R: N
UR
SE
S, T
HE
IR W
OR
K E
NV
IRO
NM
EN
T &
PA
TIE
NT
SA
FE
TY
FIGURE 22 WARD 2AC
FIGURE 23 WARD 2AE
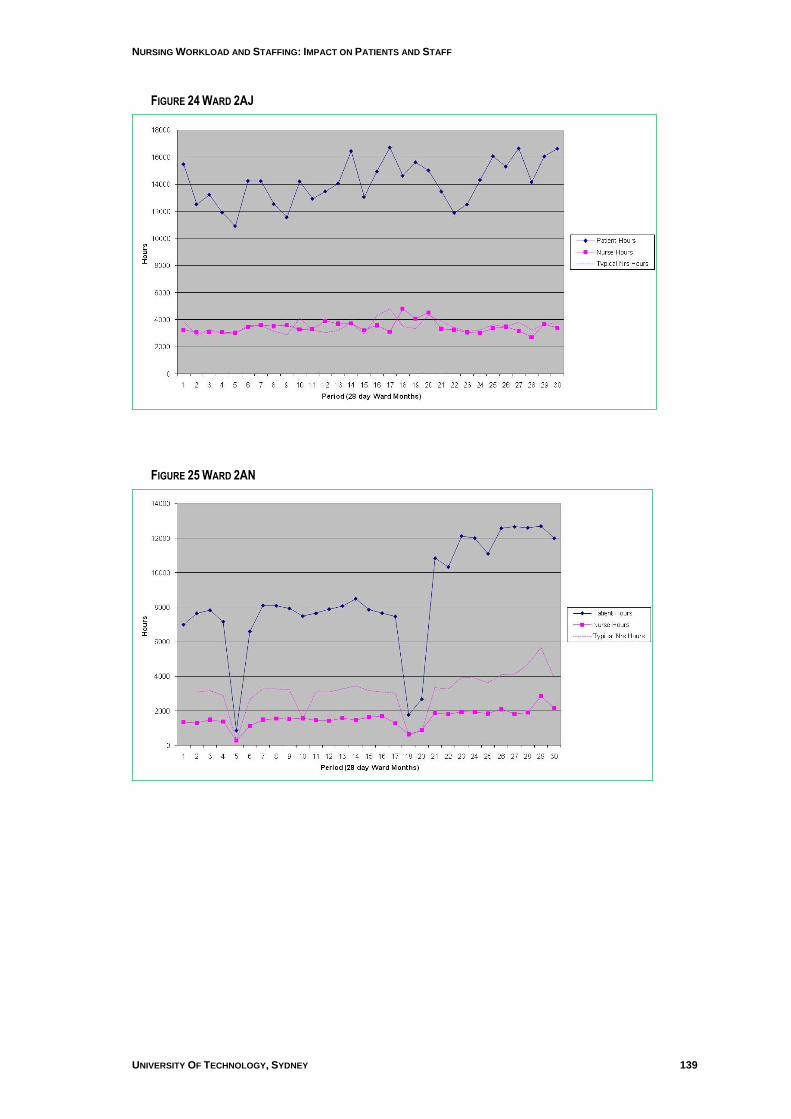
NURSING WORKLOAD AND STAFFING: IMPACT ON PATIENTS AND STAFF
UNIVERSITY OF TECHNOLOGY, SYDNEY 139
FIGURE 24 WARD 2AJ
FIGURE 25 WARD 2AN
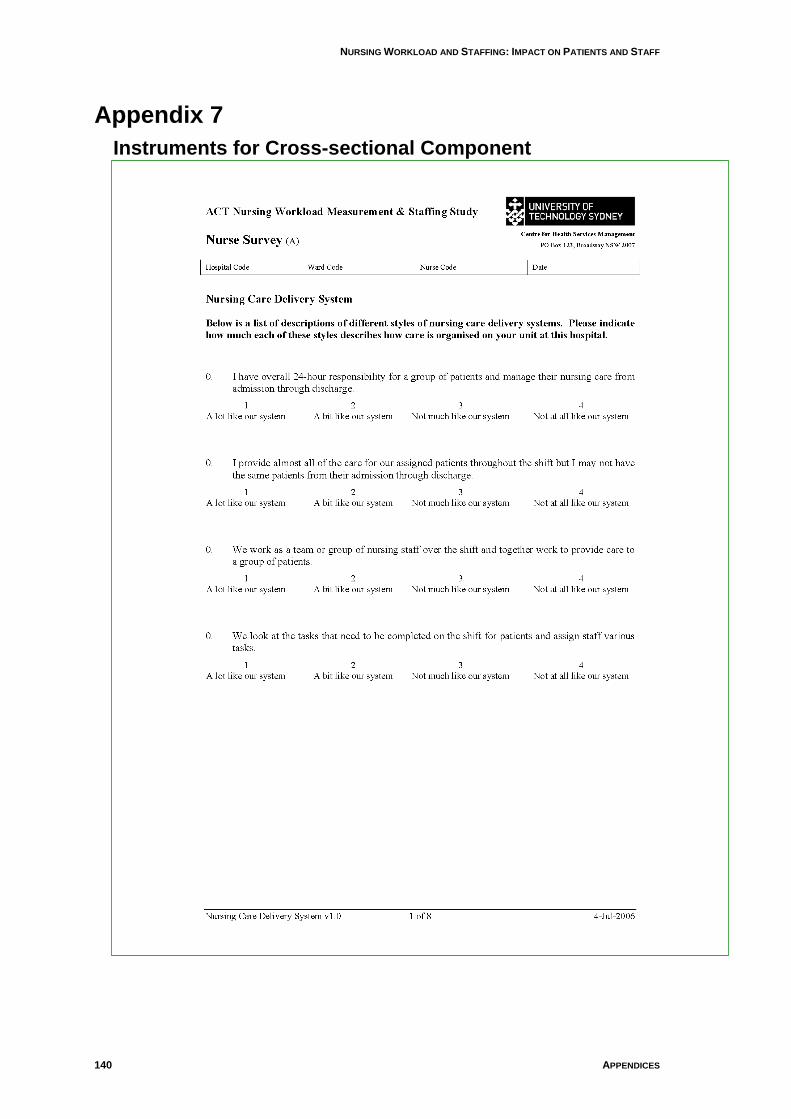
NURSING WORKLOAD AND STAFFING: IMPACT ON PATIENTS AND STAFF
140 APPENDICES
GL
UE
ING
IT T
OG
ET
HE
R: N
UR
SE
S, T
HE
IR W
OR
K E
NV
IRO
NM
EN
T &
PA
TIE
NT
SA
FE
TY
Appendix 7
Instruments for Cross-sectional Component
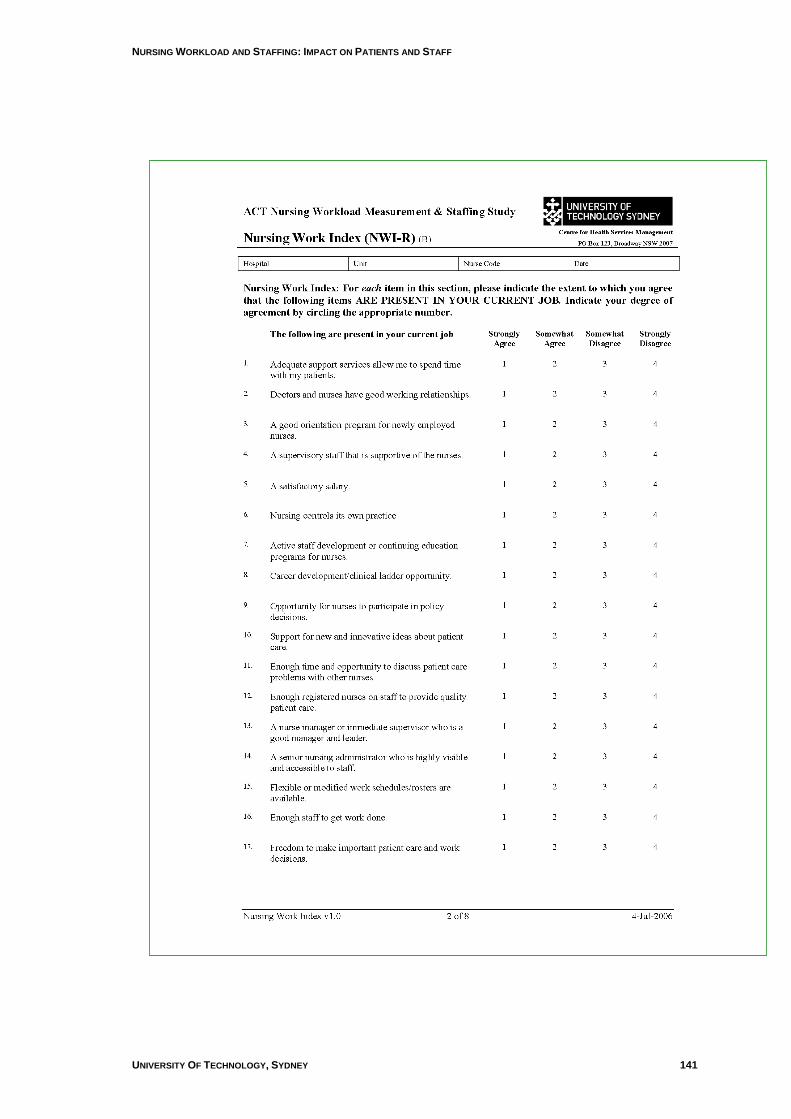
NURSING WORKLOAD AND STAFFING: IMPACT ON PATIENTS AND STAFF
UNIVERSITY OF TECHNOLOGY, SYDNEY 141
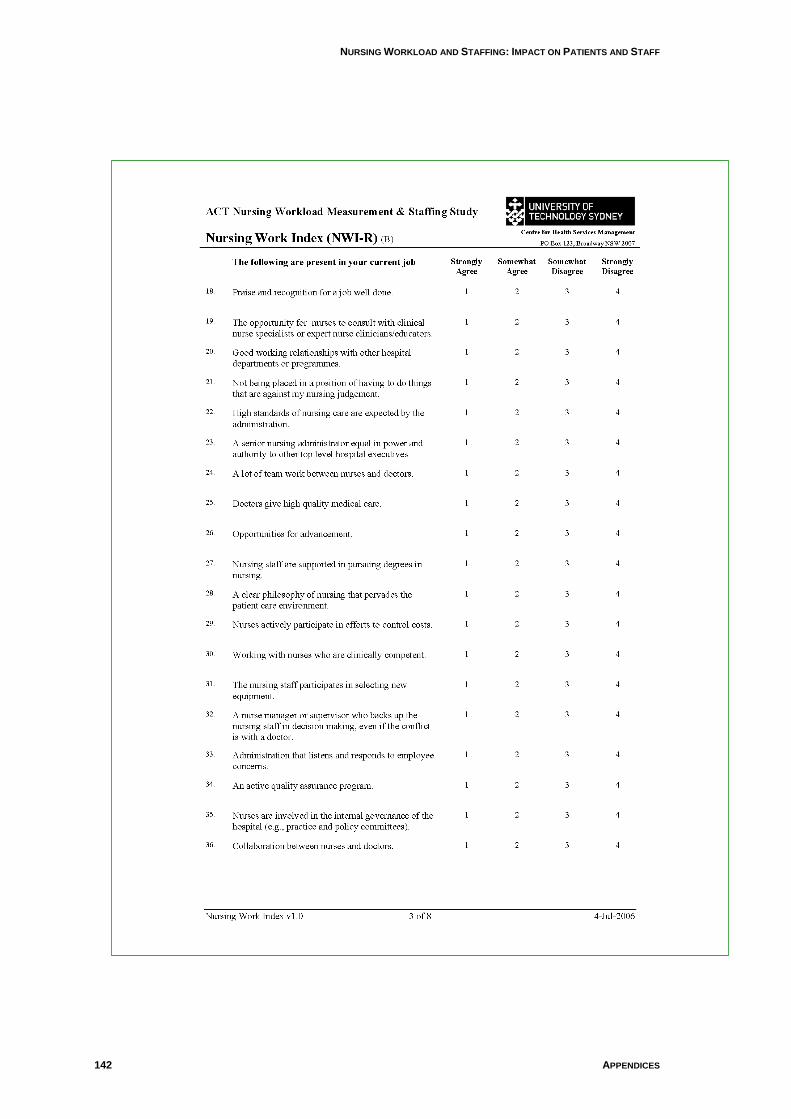
NURSING WORKLOAD AND STAFFING: IMPACT ON PATIENTS AND STAFF
142 APPENDICES
GL
UE
ING
IT T
OG
ET
HE
R: N
UR
SE
S, T
HE
IR W
OR
K E
NV
IRO
NM
EN
T &
PA
TIE
NT
SA
FE
TY
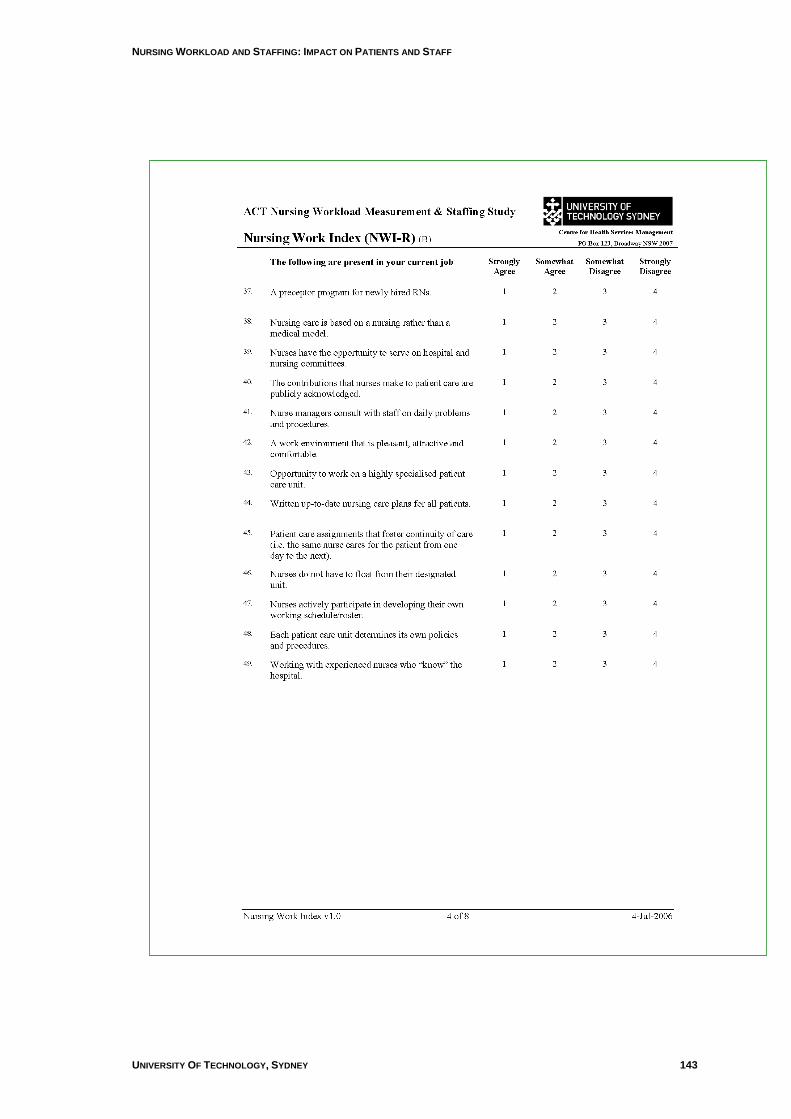
NURSING WORKLOAD AND STAFFING: IMPACT ON PATIENTS AND STAFF
UNIVERSITY OF TECHNOLOGY, SYDNEY 143
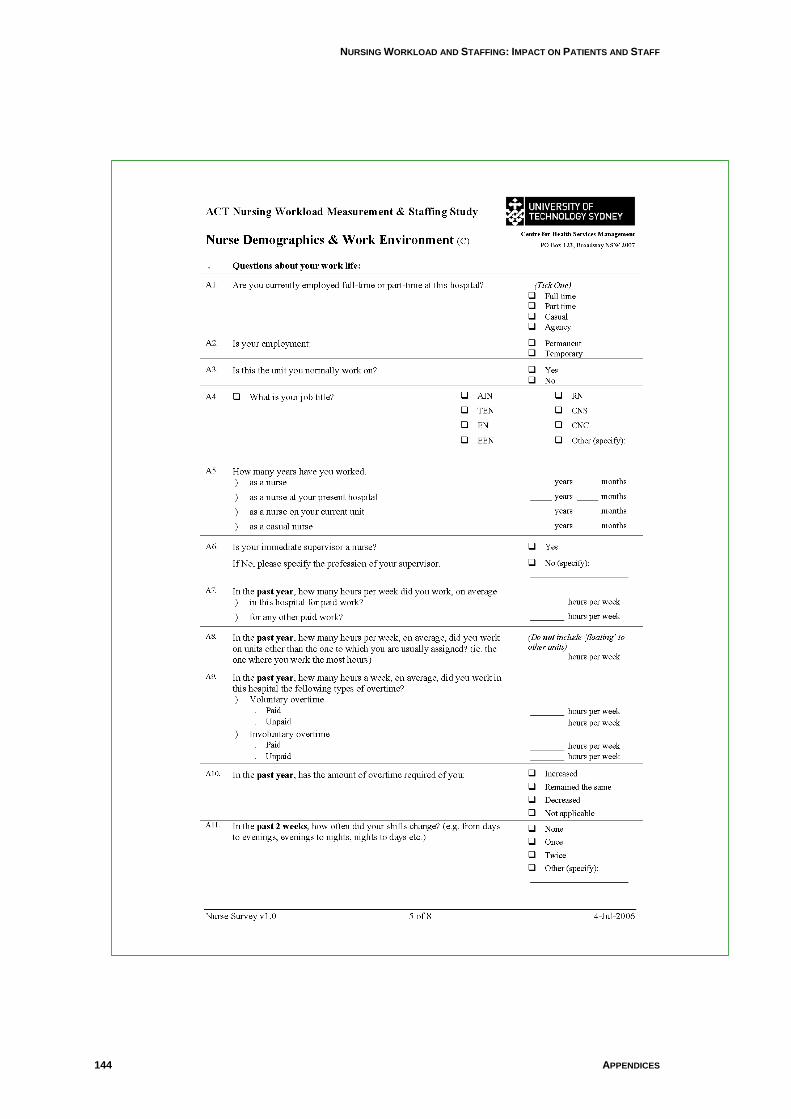
NURSING WORKLOAD AND STAFFING: IMPACT ON PATIENTS AND STAFF
144 APPENDICES
GL
UE
ING
IT T
OG
ET
HE
R: N
UR
SE
S, T
HE
IR W
OR
K E
NV
IRO
NM
EN
T &
PA
TIE
NT
SA
FE
TY

NURSING WORKLOAD AND STAFFING: IMPACT ON PATIENTS AND STAFF
UNIVERSITY OF TECHNOLOGY, SYDNEY 145
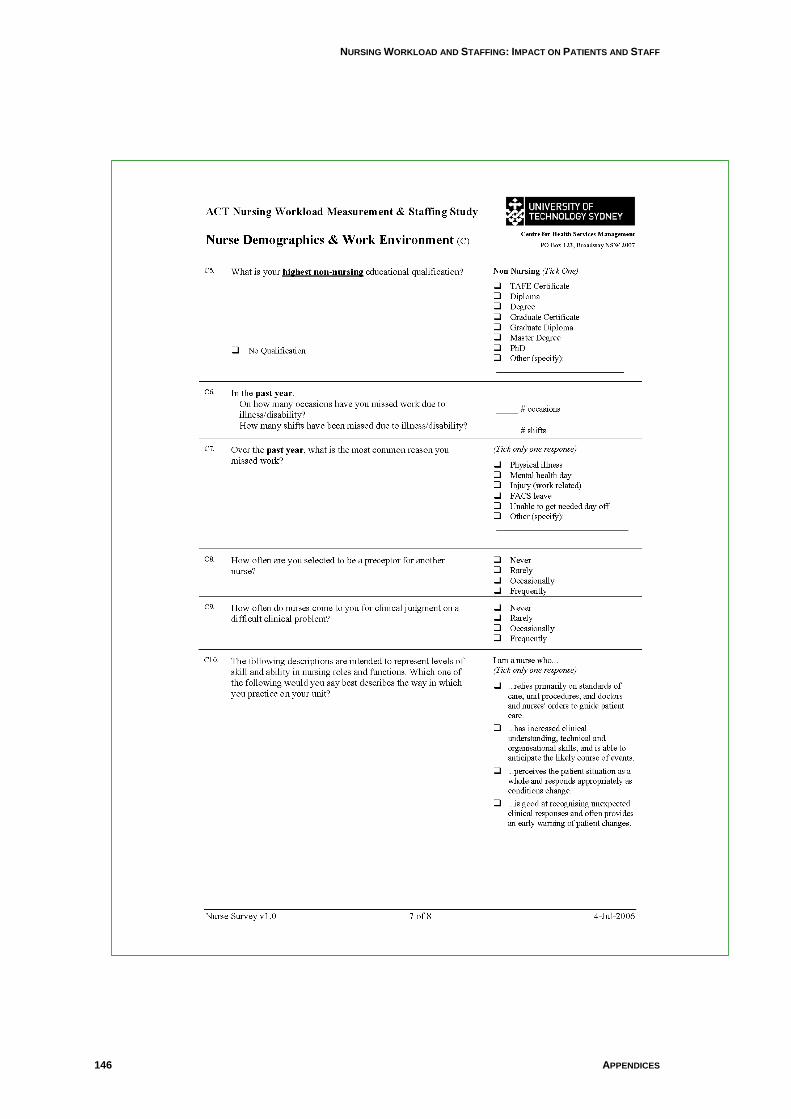
NURSING WORKLOAD AND STAFFING: IMPACT ON PATIENTS AND STAFF
146 APPENDICES
GL
UE
ING
IT T
OG
ET
HE
R: N
UR
SE
S, T
HE
IR W
OR
K E
NV
IRO
NM
EN
T &
PA
TIE
NT
SA
FE
TY
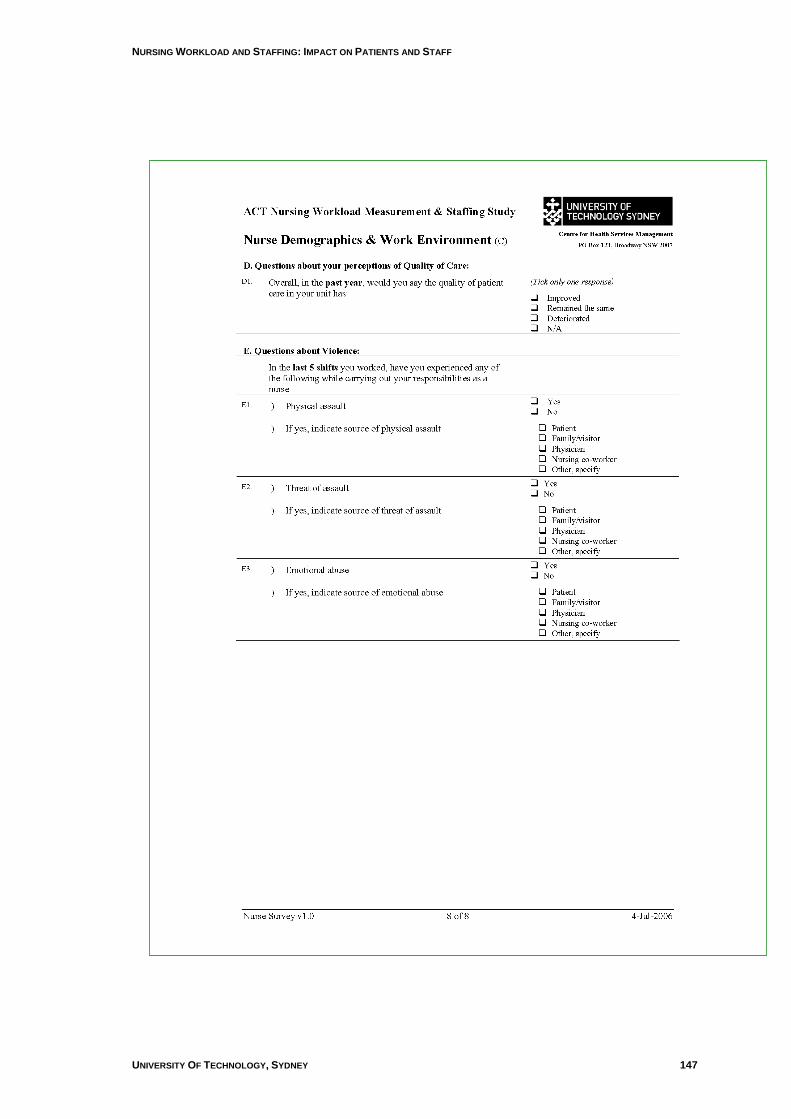
NURSING WORKLOAD AND STAFFING: IMPACT ON PATIENTS AND STAFF
UNIVERSITY OF TECHNOLOGY, SYDNEY 147
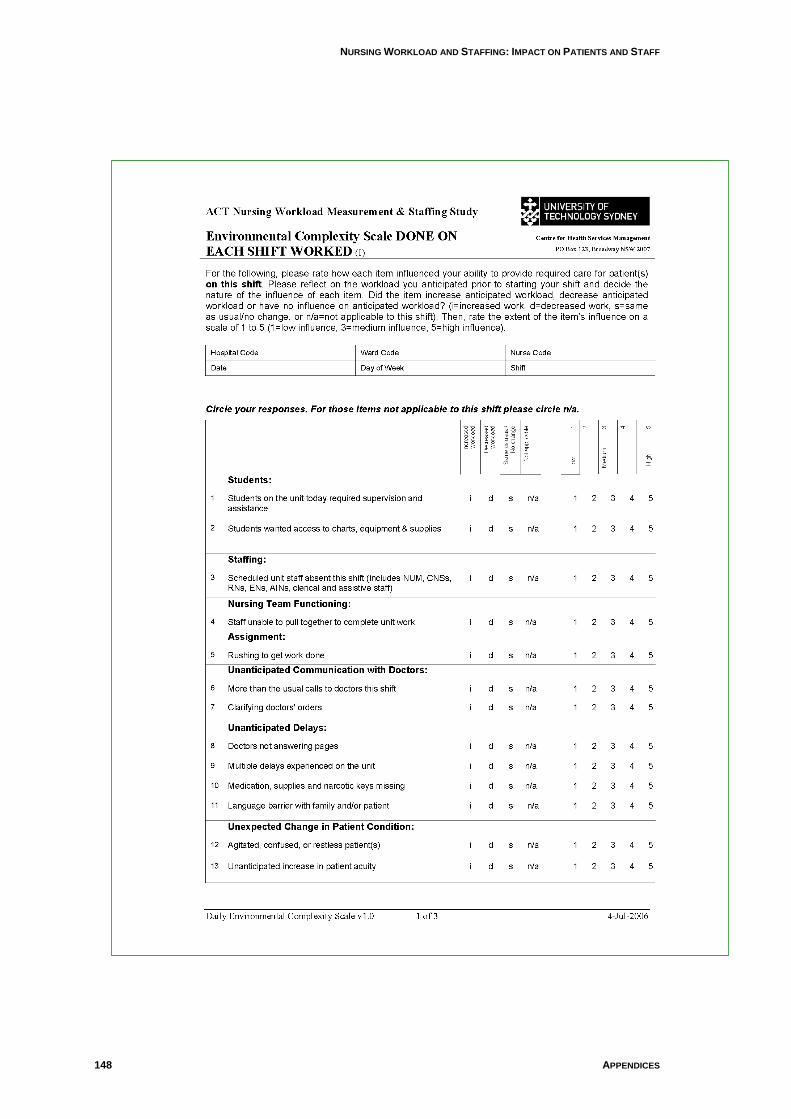
NURSING WORKLOAD AND STAFFING: IMPACT ON PATIENTS AND STAFF
148 APPENDICES
GL
UE
ING
IT T
OG
ET
HE
R: N
UR
SE
S, T
HE
IR W
OR
K E
NV
IRO
NM
EN
T &
PA
TIE
NT
SA
FE
TY
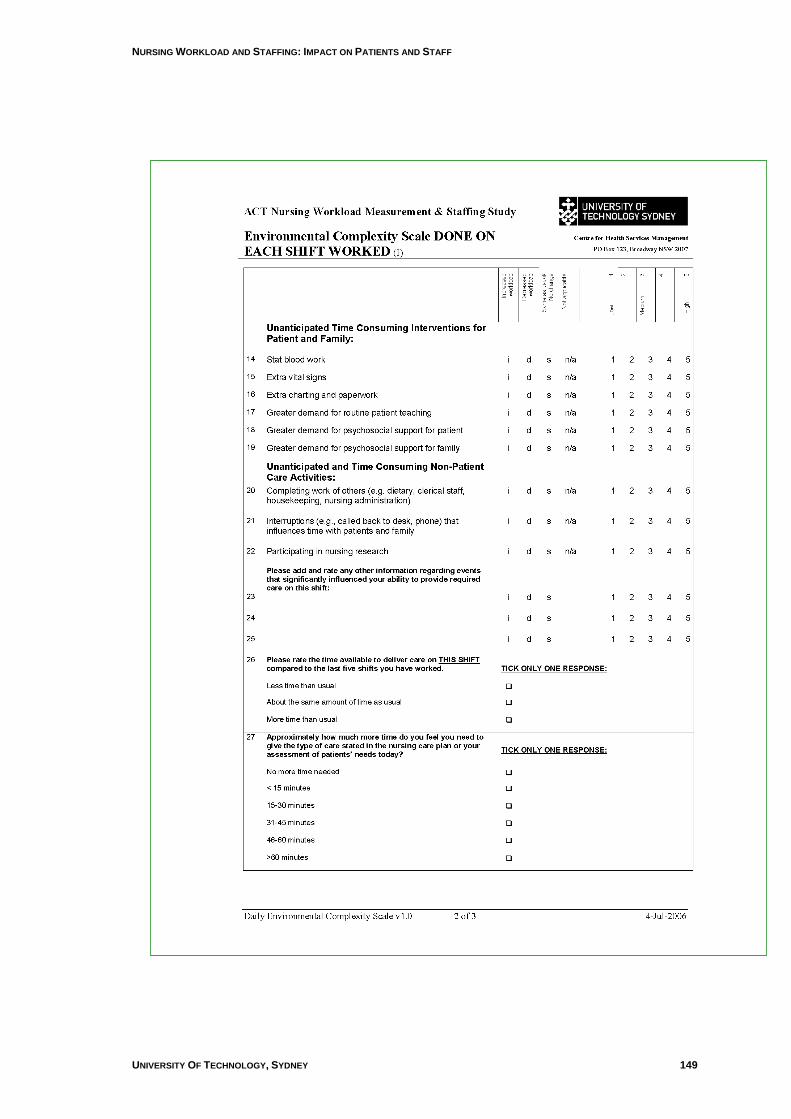
NURSING WORKLOAD AND STAFFING: IMPACT ON PATIENTS AND STAFF
UNIVERSITY OF TECHNOLOGY, SYDNEY 149
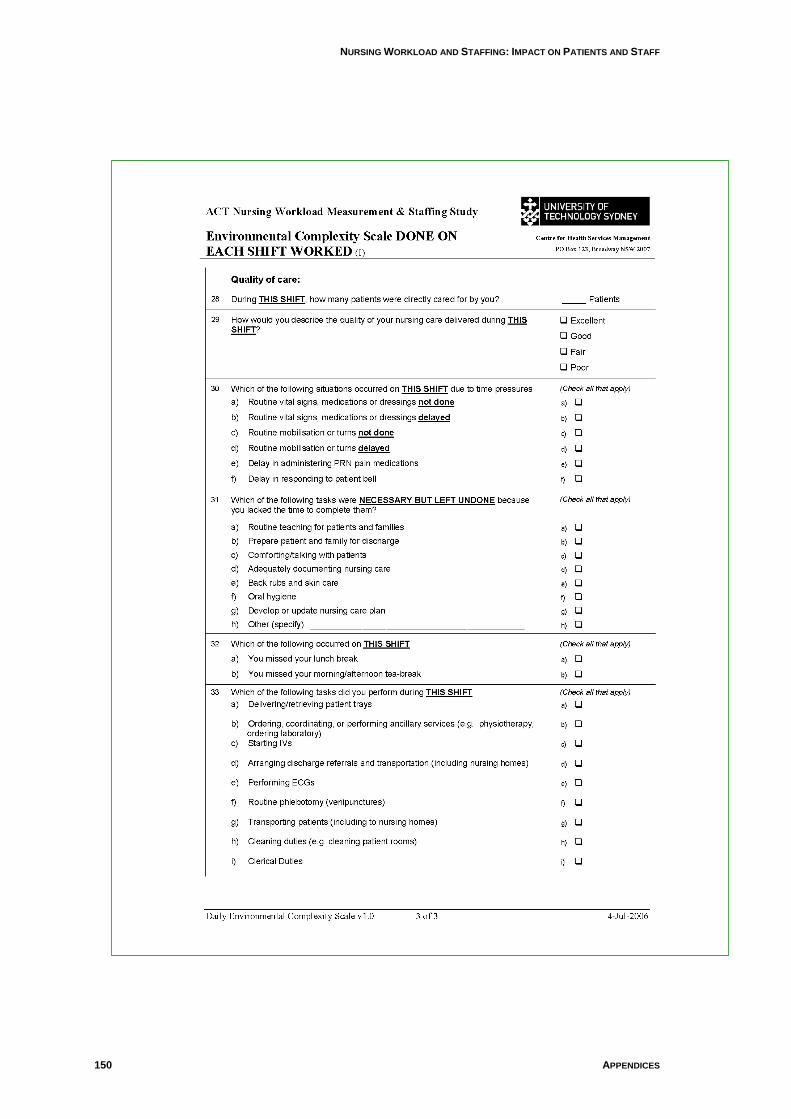
NURSING WORKLOAD AND STAFFING: IMPACT ON PATIENTS AND STAFF
150 APPENDICES
GL
UE
ING
IT T
OG
ET
HE
R: N
UR
SE
S, T
HE
IR W
OR
K E
NV
IRO
NM
EN
T &
PA
TIE
NT
SA
FE
TY
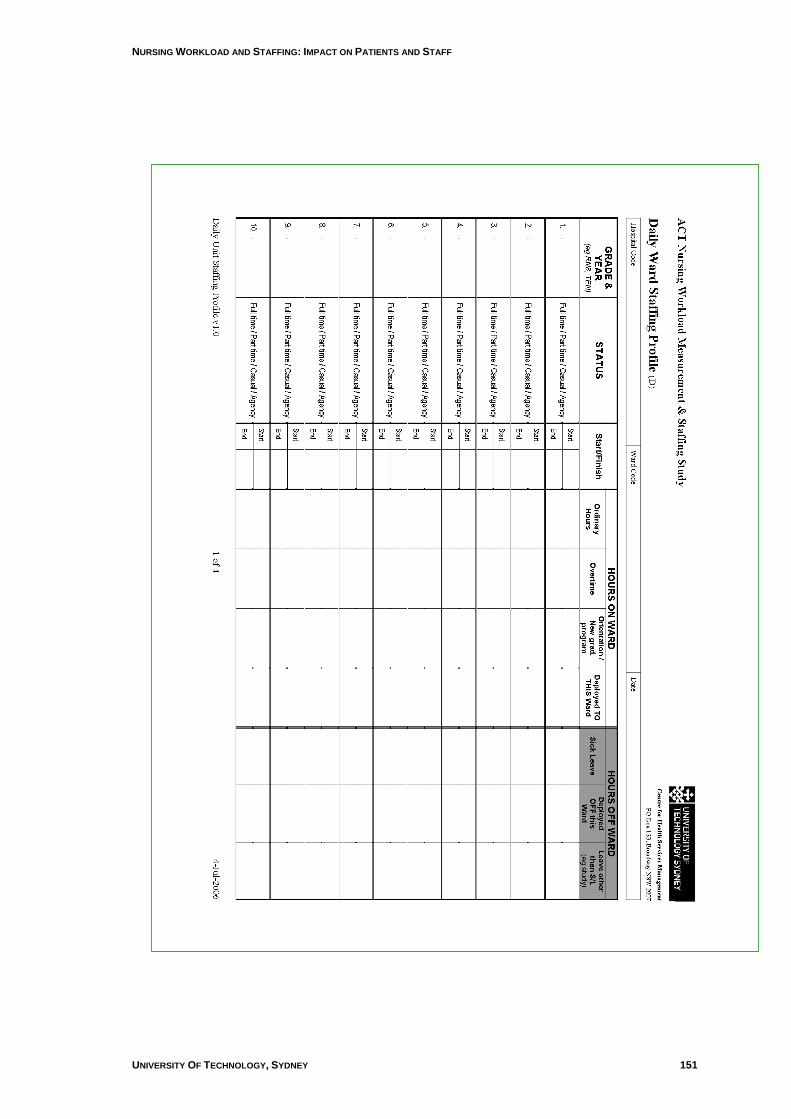
NURSING WORKLOAD AND STAFFING: IMPACT ON PATIENTS AND STAFF
UNIVERSITY OF TECHNOLOGY, SYDNEY 151
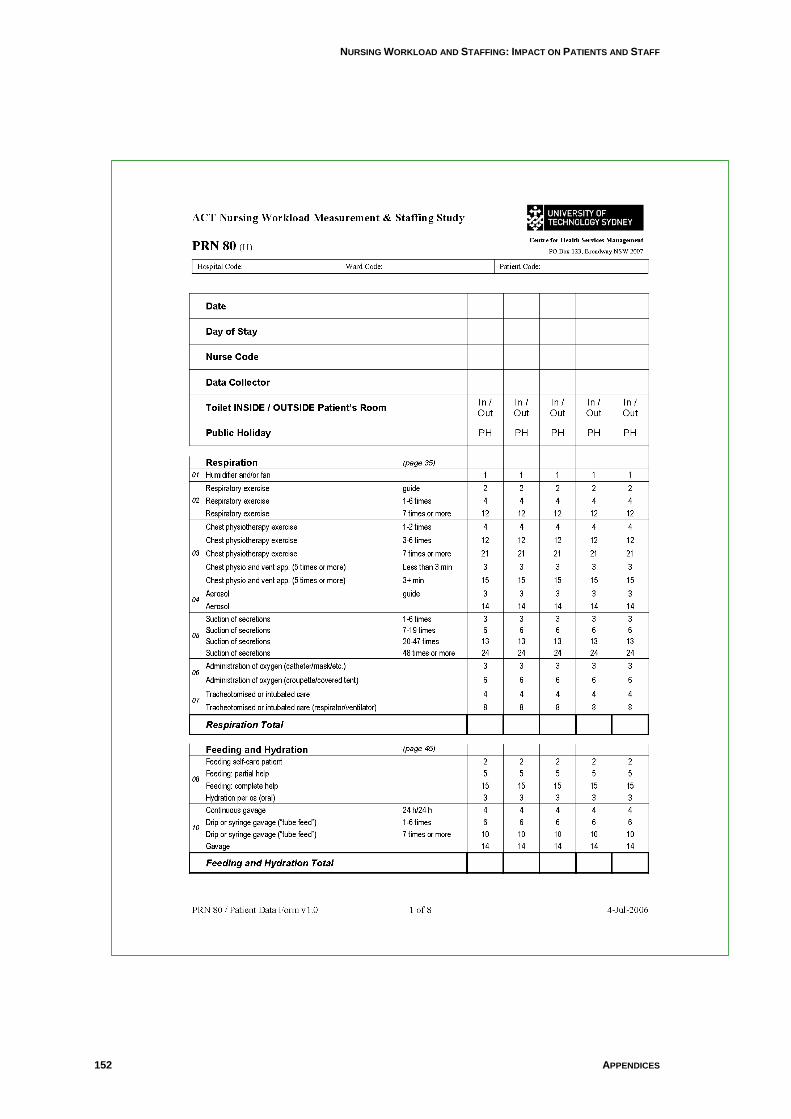
NURSING WORKLOAD AND STAFFING: IMPACT ON PATIENTS AND STAFF
152 APPENDICES
GL
UE
ING
IT T
OG
ET
HE
R: N
UR
SE
S, T
HE
IR W
OR
K E
NV
IRO
NM
EN
T &
PA
TIE
NT
SA
FE
TY
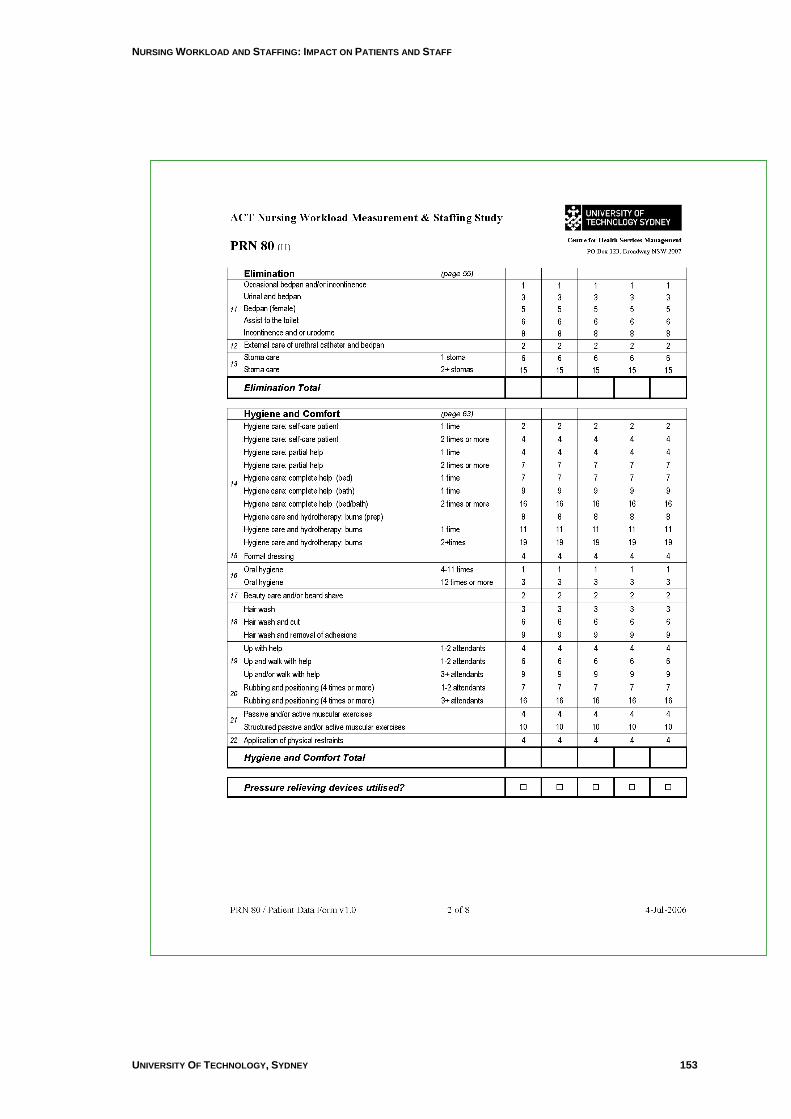
NURSING WORKLOAD AND STAFFING: IMPACT ON PATIENTS AND STAFF
UNIVERSITY OF TECHNOLOGY, SYDNEY 153
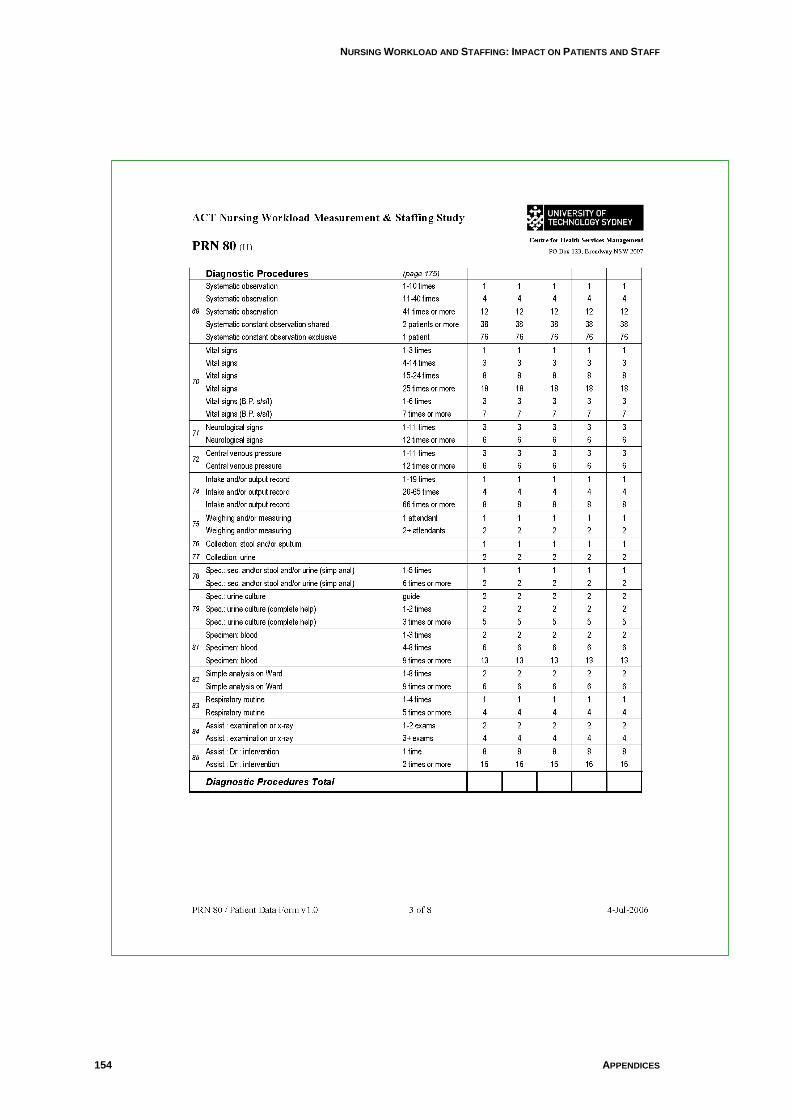
NURSING WORKLOAD AND STAFFING: IMPACT ON PATIENTS AND STAFF
154 APPENDICES
GL
UE
ING
IT T
OG
ET
HE
R: N
UR
SE
S, T
HE
IR W
OR
K E
NV
IRO
NM
EN
T &
PA
TIE
NT
SA
FE
TY
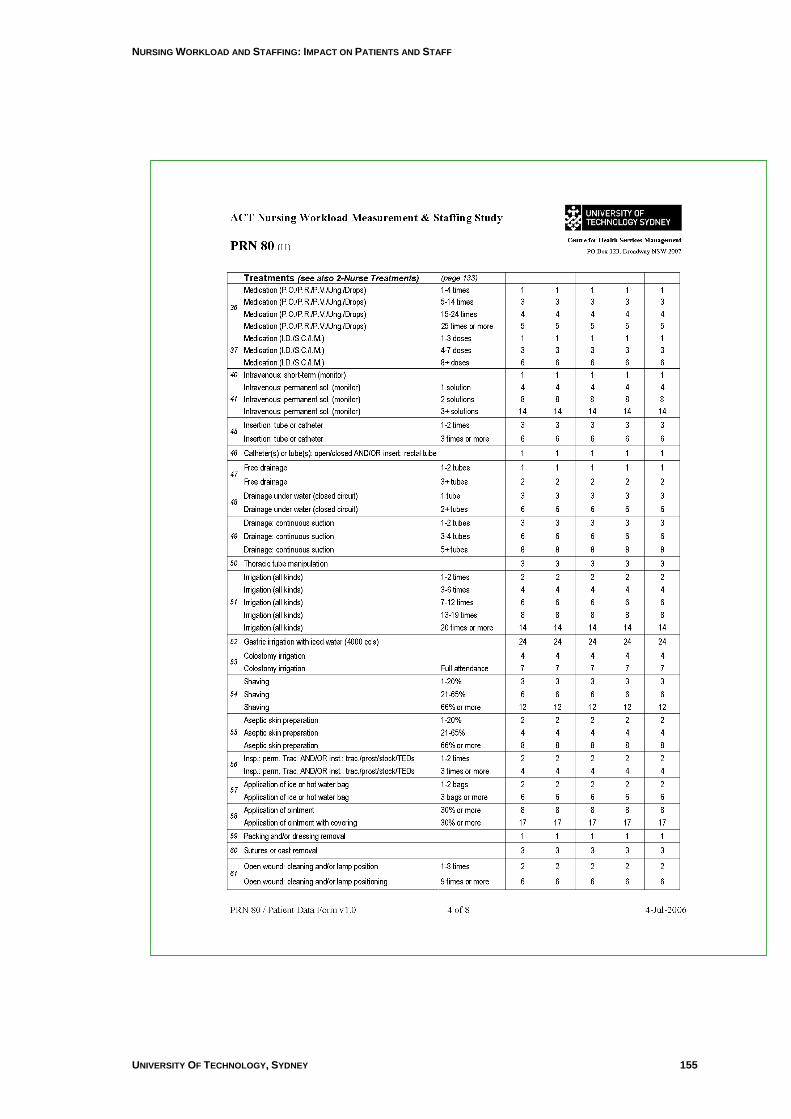
NURSING WORKLOAD AND STAFFING: IMPACT ON PATIENTS AND STAFF
UNIVERSITY OF TECHNOLOGY, SYDNEY 155
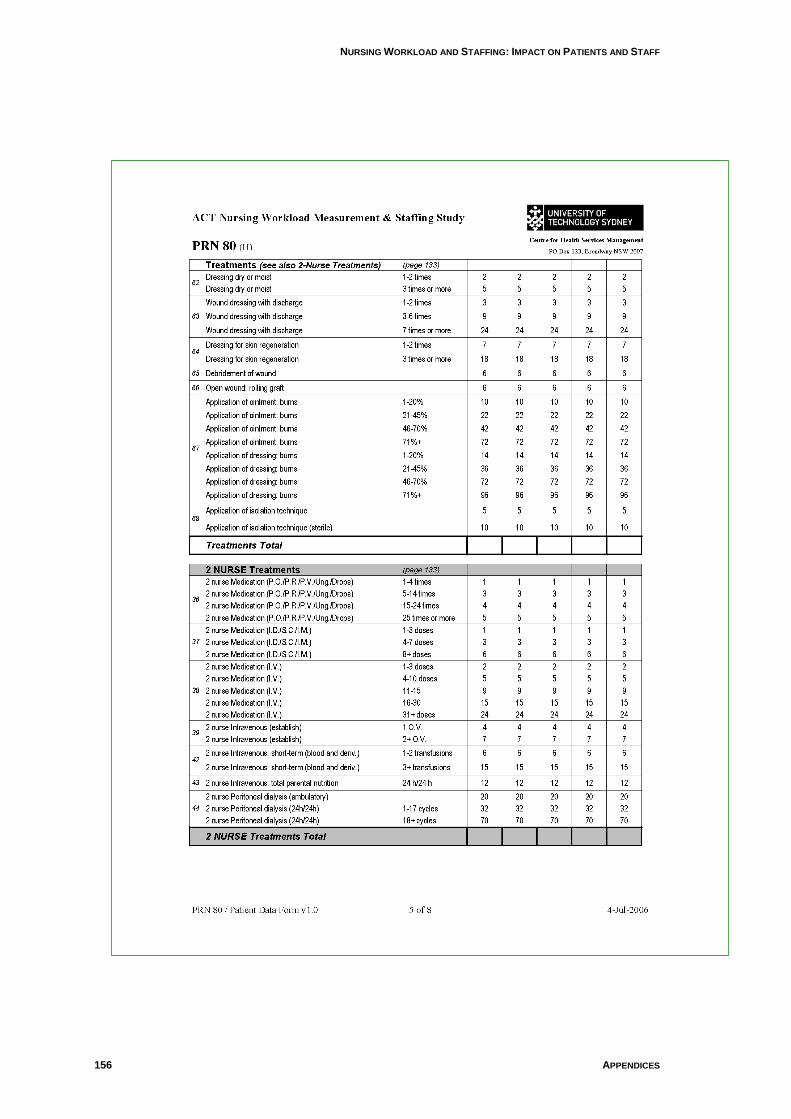
NURSING WORKLOAD AND STAFFING: IMPACT ON PATIENTS AND STAFF
156 APPENDICES
GL
UE
ING
IT T
OG
ET
HE
R: N
UR
SE
S, T
HE
IR W
OR
K E
NV
IRO
NM
EN
T &
PA
TIE
NT
SA
FE
TY
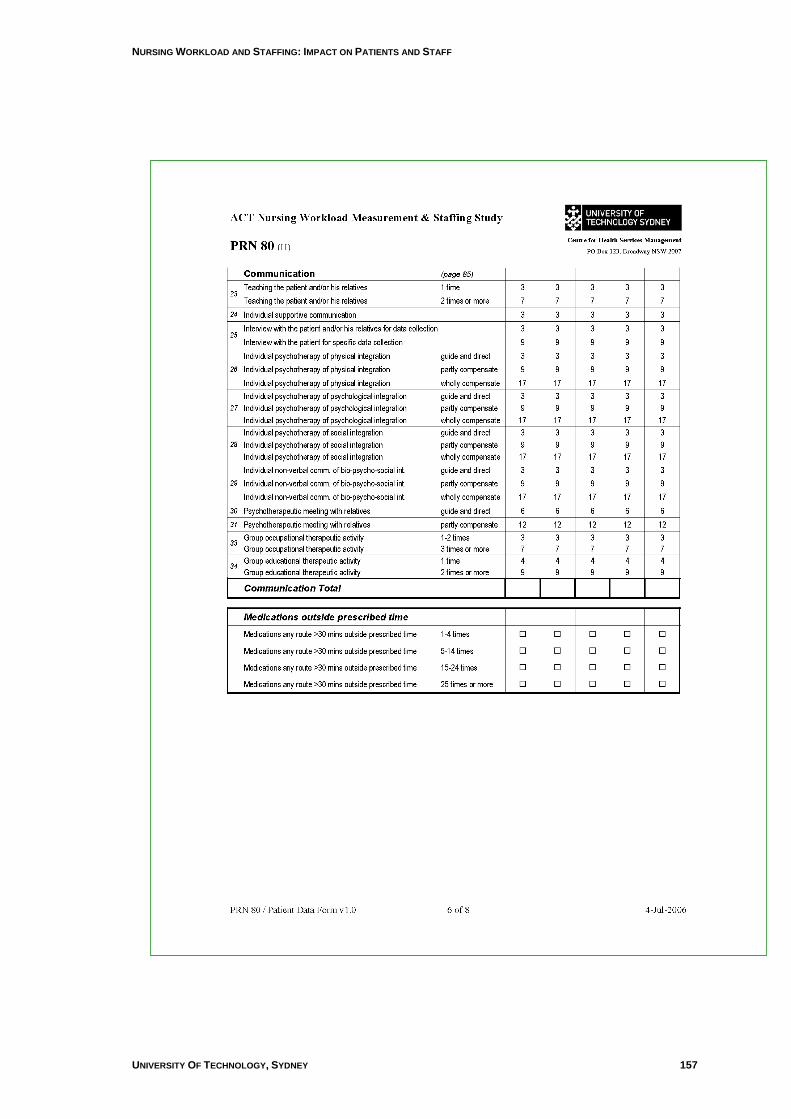
NURSING WORKLOAD AND STAFFING: IMPACT ON PATIENTS AND STAFF
UNIVERSITY OF TECHNOLOGY, SYDNEY 157
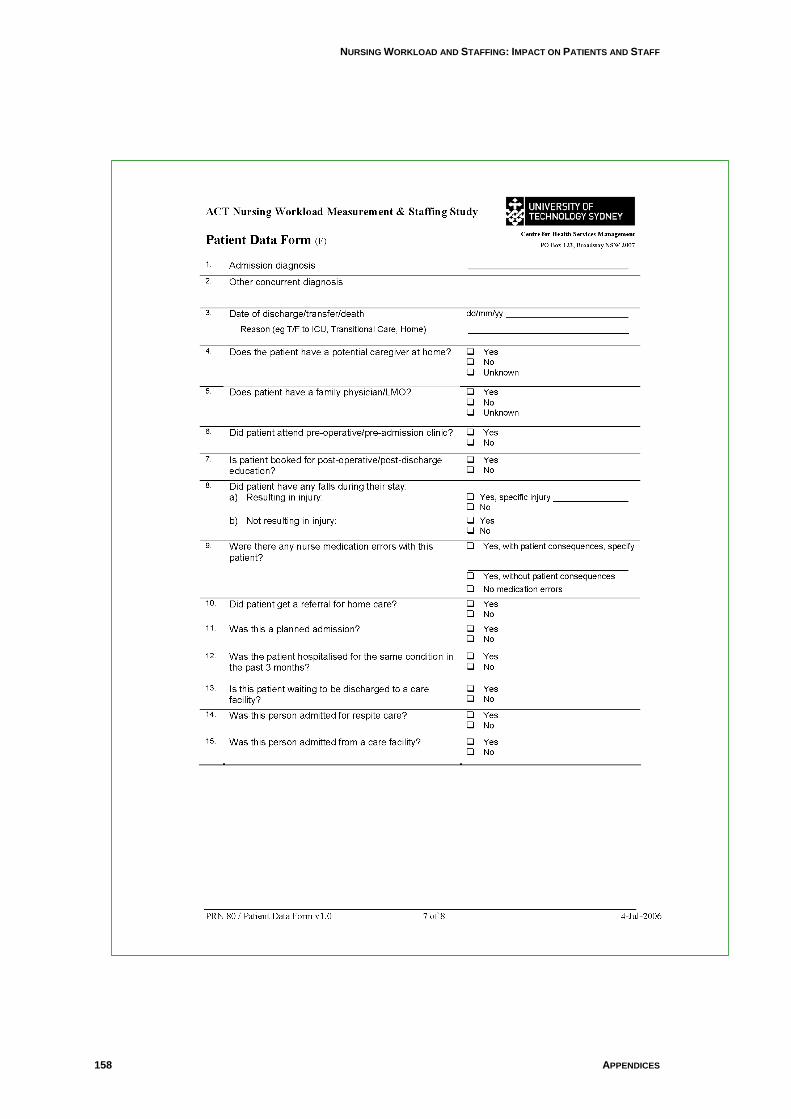
NURSING WORKLOAD AND STAFFING: IMPACT ON PATIENTS AND STAFF
158 APPENDICES
GL
UE
ING
IT T
OG
ET
HE
R: N
UR
SE
S, T
HE
IR W
OR
K E
NV
IRO
NM
EN
T &
PA
TIE
NT
SA
FE
TY
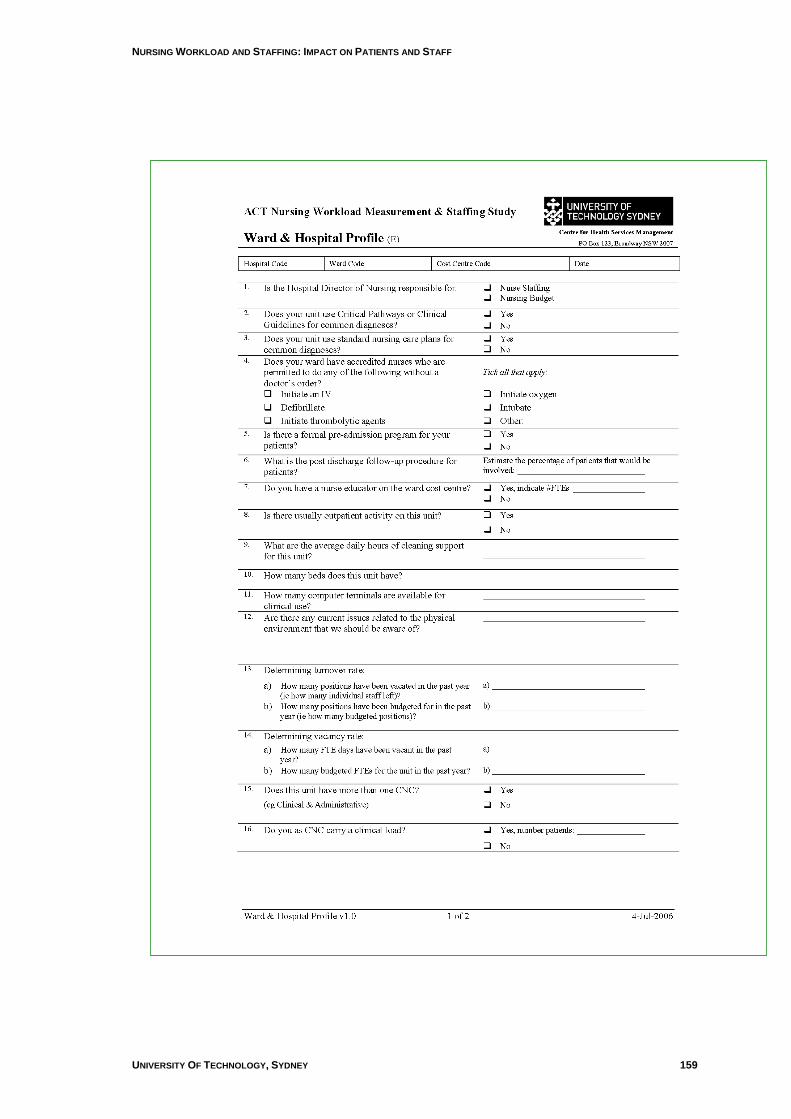
NURSING WORKLOAD AND STAFFING: IMPACT ON PATIENTS AND STAFF
UNIVERSITY OF TECHNOLOGY, SYDNEY 159
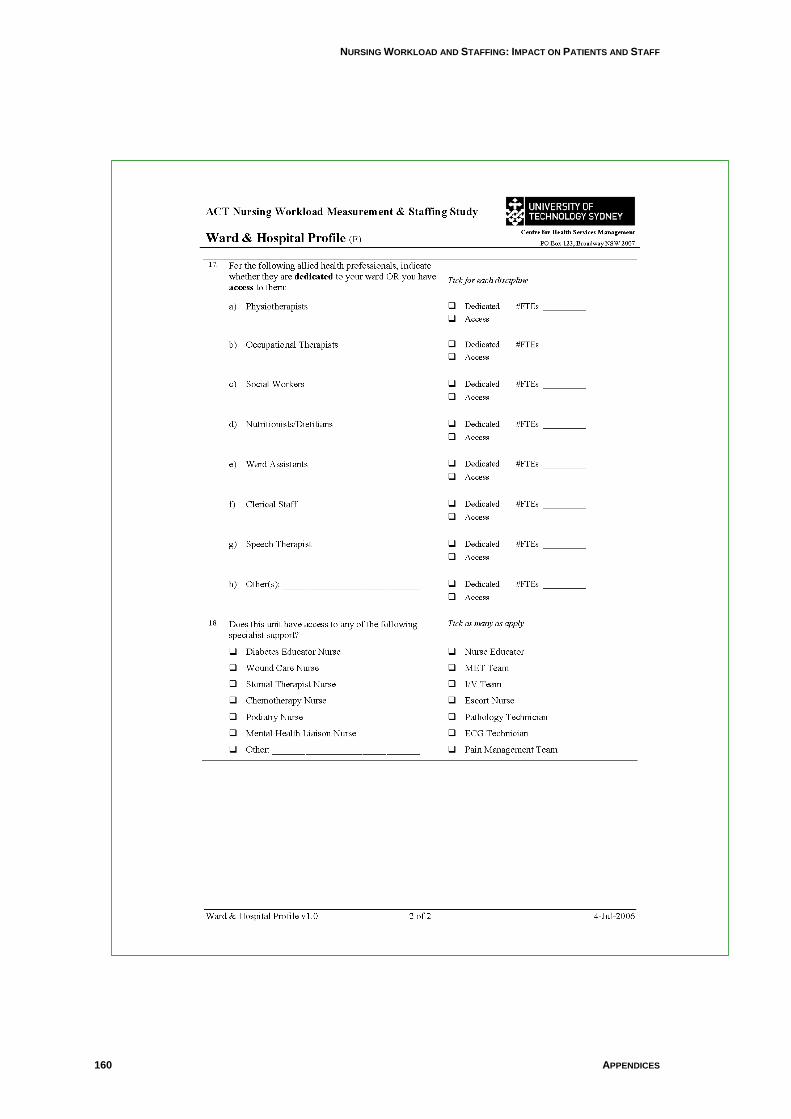
NURSING WORKLOAD AND STAFFING: IMPACT ON PATIENTS AND STAFF
160 APPENDICES
GL
UE
ING
IT T
OG
ET
HE
R: N
UR
SE
S, T
HE
IR W
OR
K E
NV
IRO
NM
EN
T &
PA
TIE
NT
SA
FE
TY

Centre for Health Services Management
University of Technology, Sydney
PO BOX 123
Broadway NSW 2007
Australia