Embed Size (px)
Citation preview
Analyzing the Change in Nursing Workload from Pre-CareLink to Post-CareLink at the University Hospital
Final Report To: Ms. Pat Schmidt Nursing Team Lead, Orders Management Project
Bobby Beasley Management Engineer Fellow, Programs & Operations Analysis
From: Seraphina Koordi, Rohan Tilak, Alda Wardhana
IOE 481 Team 1 University of Michigan, Ann Arbor Date of Submission: December 11, 2008
2
Table of Contents Executive Summary 4 Introduction 6 Background 6 Key Issues 7 Goals and Objectives 7 Project Scope 7 Methodology 8 Literature Search 8 Work Sampling Study 8 Observational Study 9 Findings 9 Overall 9
Unit 5D 12 Unit 5D by Shift 14 Unit 6D 15 Unit 6D by Shift 17
Unit 5A 18 Unit 5A by Shift 20 Unit 6C 21 Unit 6C by Shift 23 Unit 8B 24 Unit 8B by Shift 26 Recap 27
Unit Types: ICU, ACU and Oncology 28 ICU 29 ACU 30 Oncology 31 Qualitative Responses 31 Support Provided from Operating Entities 32 Team Hours Completed 32 Summary 33 Appendices
Appendix A: Literature Used 34 Appendix B: Beeper Study Data Collection Sheet 35 Appendix C: Observational Study Data Collection Sheet 36 Appendix D: 2-Proportion Test Results 37
3
Tables Table 1. Medication Task Percentage Differences for UH Nurses 4 Table 2. Overall Medication Task Percentage Difference for UH Nurses 10 Table 3. Two-proportion Test Summary 27
Figures
Figure 1. Medication Task Differences for UH Nurses 5 Figure 2. UH Overall Nursing Workload Breakdown 10 Figure 3. UH Overall Medication Task Breakdown 11 Figure 4. Unit 5D Nursing Workload Breakdown 12 Figure 5. Unit 5D Medication Task Breakdown 13 Figure 6. Unit 5D Comparison of Nursing Workload Breakdown by Shift 14 Figure 7. Unit 6D Nursing Workload Breakdown 15 Figure 8. Unit 6D Medication Task Breakdown 16 Figure 9. Unit 6D Comparison of Nursing Workload Breakdown by Shift 17 Figure 10. Unit 5A Nursing Workload Breakdown 18 Figure 11. Unit 5A Medication Task Breakdown 19 Figure 12. Unit 5A Comparison of Nursing Workload Breakdown by Shift 20 Figure 13. Unit 6C Nursing Workload Breakdown 21 Figure 14. Unit 6C Medication Task Breakdown 22 Figure 15. Unit 6C Comparison of Nursing Workload Breakdown by Shift 23 Figure 16. Unit 8B Nursing Workload Breakdown 24 Figure 17. Unit 8B Medication Task Breakdown 25 Figure 18. Unit 8B Comparison of Nursing Workload Breakdown by Shift 26 Figure 19. Unit Type Overall Nursing Workload Breakdown 28 Figure 20. ICU Medication Task Breakdown 29 Figure 21. ACU Medication Task Breakdown 30 Figure 22. Oncology Medication Task Breakdown 31
4
Executive Summary To make the ordering process in University of Michigan Hospital (UH) faster, safer, and more manageable, UH management fully replaced the paper order entry system with a new computer order entry system, UM-CareLink, in UH on April 28th, 2008. Two teams conducted pre-CareLink studies in 2006 and 2007 respectively to assess nursing workload using the paper order entry system. Following the structure of these pre-CareLink studies, our team evaluated medication administration process within the UM-CareLink system. As established by the Nursing Team Lead of the Orders Management Project (OMP), the primary goal of this project was to quantify the change in the nursing medication workload from pre-CareLink to post-Carelink. To achieve this goal, the team has analyzed the following UH Units:
• Two Intensive Care Units (ICU): Units 5D and 6D • Two Acute Care Units (ACU): Units 5A and 6C • One Oncology Unit: Unit 8B
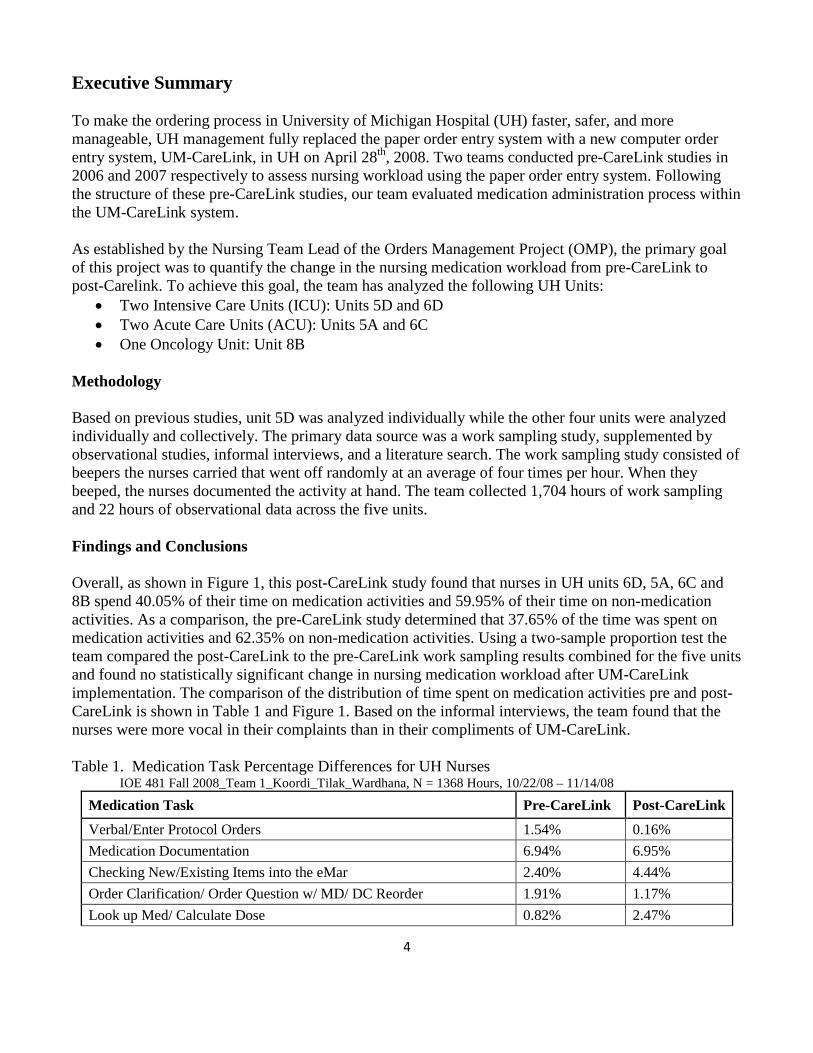
Methodology Based on previous studies, unit 5D was analyzed individually while the other four units were analyzed individually and collectively. The primary data source was a work sampling study, supplemented by observational studies, informal interviews, and a literature search. The work sampling study consisted of beepers the nurses carried that went off randomly at an average of four times per hour. When they beeped, the nurses documented the activity at hand. The team collected 1,704 hours of work sampling and 22 hours of observational data across the five units. Findings and Conclusions Overall, as shown in Figure 1, this post-CareLink study found that nurses in UH units 6D, 5A, 6C and 8B spend 40.05% of their time on medication activities and 59.95% of their time on non-medication activities. As a comparison, the pre-CareLink study determined that 37.65% of the time was spent on medication activities and 62.35% on non-medication activities. Using a two-sample proportion test the team compared the post-CareLink to the pre-CareLink work sampling results combined for the five units and found no statistically significant change in nursing medication workload after UM-CareLink implementation. The comparison of the distribution of time spent on medication activities pre and post-CareLink is shown in Table 1 and Figure 1. Based on the informal interviews, the team found that the nurses were more vocal in their complaints than in their compliments of UM-CareLink. Table 1. Medication Task Percentage Differences for UH Nurses
IOE 481 Fall 2008_Team 1_Koordi_Tilak_Wardhana, N = 1368 Hours, 10/22/08 – 11/14/08
Medication Task Pre-CareLink Post-CareLink Verbal/Enter Protocol Orders 1.54% 0.16% Medication Documentation 6.94% 6.95% Checking New/Existing Items into the eMar 2.40% 4.44% Order Clarification/ Order Question w/ MD/ DC Reorder 1.91% 1.17% Look up Med/ Calculate Dose 0.82% 2.47%
5
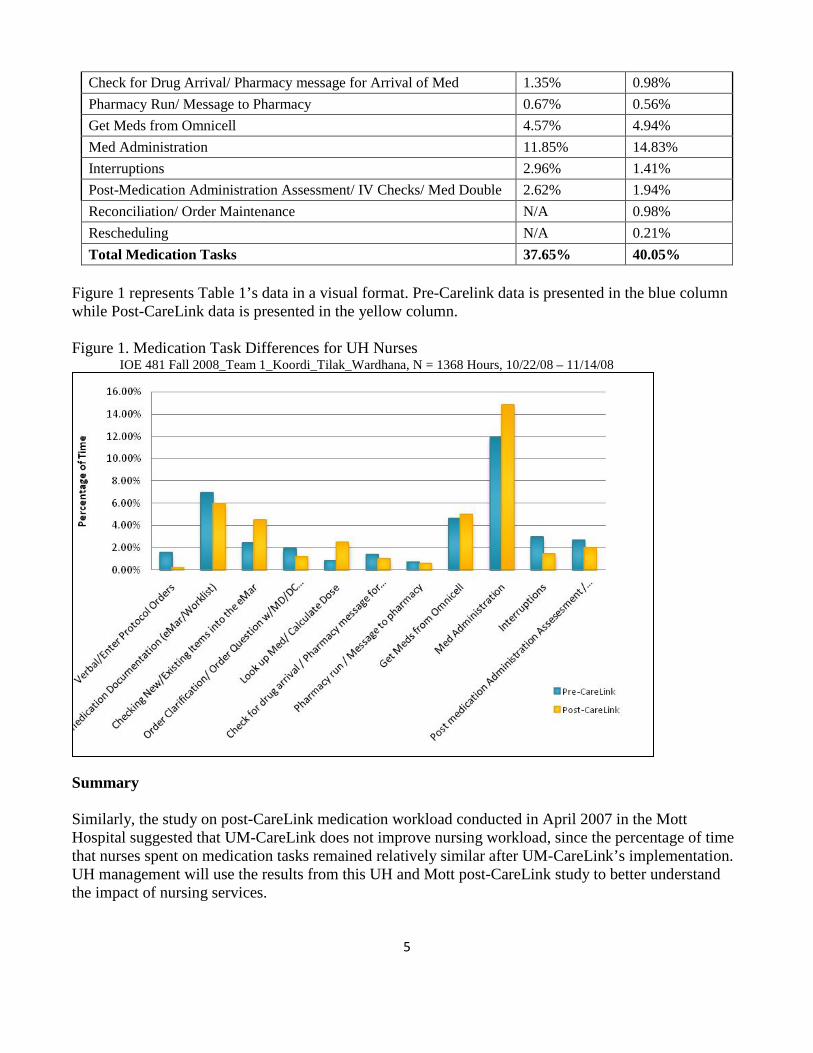
Check for Drug Arrival/ Pharmacy message for Arrival of Med 1.35% 0.98% Pharmacy Run/ Message to Pharmacy 0.67% 0.56% Get Meds from Omnicell 4.57% 4.94% Med Administration 11.85% 14.83% Interruptions 2.96% 1.41% Post-Medication Administration Assessment/ IV Checks/ Med Double 2.62% 1.94% Reconciliation/ Order Maintenance N/A 0.98% Rescheduling N/A 0.21% Total Medication Tasks 37.65% 40.05%
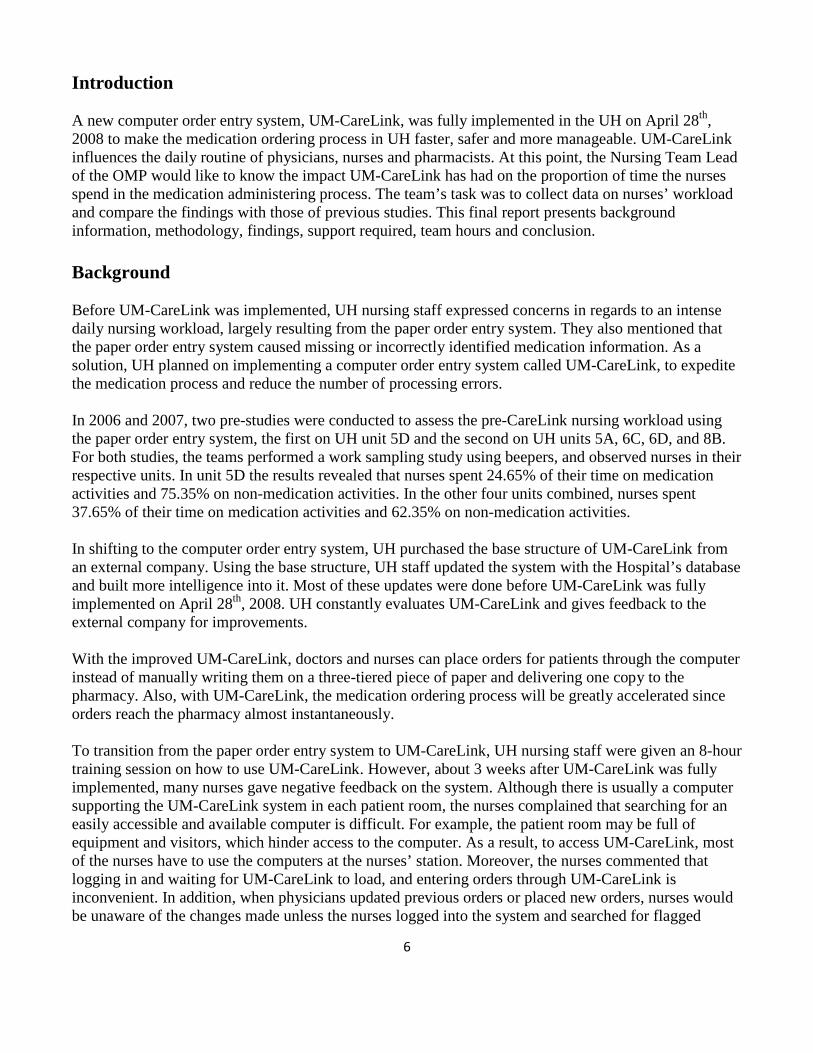
Figure 1 represents Table 1’s data in a visual format. Pre-Carelink data is presented in the blue column while Post-CareLink data is presented in the yellow column. Figure 1. Medication Task Differences for UH Nurses
IOE 481 Fall 2008_Team 1_Koordi_Tilak_Wardhana, N = 1368 Hours, 10/22/08 – 11/14/08
Summary Similarly, the study on post-CareLink medication workload conducted in April 2007 in the Mott Hospital suggested that UM-CareLink does not improve nursing workload, since the percentage of time that nurses spent on medication tasks remained relatively similar after UM-CareLink’s implementation. UH management will use the results from this UH and Mott post-CareLink study to better understand the impact of nursing services.
6
Introduction A new computer order entry system, UM-CareLink, was fully implemented in the UH on April 28th, 2008 to make the medication ordering process in UH faster, safer and more manageable. UM-CareLink influences the daily routine of physicians, nurses and pharmacists. At this point, the Nursing Team Lead of the OMP would like to know the impact UM-CareLink has had on the proportion of time the nurses spend in the medication administering process. The team’s task was to collect data on nurses’ workload and compare the findings with those of previous studies. This final report presents background information, methodology, findings, support required, team hours and conclusion. Background Before UM-CareLink was implemented, UH nursing staff expressed concerns in regards to an intense daily nursing workload, largely resulting from the paper order entry system. They also mentioned that the paper order entry system caused missing or incorrectly identified medication information. As a solution, UH planned on implementing a computer order entry system called UM-CareLink, to expedite the medication process and reduce the number of processing errors. In 2006 and 2007, two pre-studies were conducted to assess the pre-CareLink nursing workload using the paper order entry system, the first on UH unit 5D and the second on UH units 5A, 6C, 6D, and 8B. For both studies, the teams performed a work sampling study using beepers, and observed nurses in their respective units. In unit 5D the results revealed that nurses spent 24.65% of their time on medication activities and 75.35% on non-medication activities. In the other four units combined, nurses spent 37.65% of their time on medication activities and 62.35% on non-medication activities. In shifting to the computer order entry system, UH purchased the base structure of UM-CareLink from an external company. Using the base structure, UH staff updated the system with the Hospital’s database and built more intelligence into it. Most of these updates were done before UM-CareLink was fully implemented on April 28th, 2008. UH constantly evaluates UM-CareLink and gives feedback to the external company for improvements. With the improved UM-CareLink, doctors and nurses can place orders for patients through the computer instead of manually writing them on a three-tiered piece of paper and delivering one copy to the pharmacy. Also, with UM-CareLink, the medication ordering process will be greatly accelerated since orders reach the pharmacy almost instantaneously. To transition from the paper order entry system to UM-CareLink, UH nursing staff were given an 8-hour training session on how to use UM-CareLink. However, about 3 weeks after UM-CareLink was fully implemented, many nurses gave negative feedback on the system. Although there is usually a computer supporting the UM-CareLink system in each patient room, the nurses complained that searching for an easily accessible and available computer is difficult. For example, the patient room may be full of equipment and visitors, which hinder access to the computer. As a result, to access UM-CareLink, most of the nurses have to use the computers at the nurses’ station. Moreover, the nurses commented that logging in and waiting for UM-CareLink to load, and entering orders through UM-CareLink is inconvenient. In addition, when physicians updated previous orders or placed new orders, nurses would be unaware of the changes made unless the nurses logged into the system and searched for flagged
7
orders. Nurses report that this routine is undesirable because they have to constantly log into UM-CareLink to check for order revisions. To improve the patient medication administering process, UH currently has a pre-determined schedule for medication administration. As a result, when an order is placed through UM-CareLink, UM-CareLink will immediately schedule the time to administer the medication in the Medication Administration Record (MAR) section in UM-CareLink. However, when a physician updates or changes an order, time discrepancies in the administration times will occur. These discrepancies intensify nurses’ burden in manipulating the system to solve this problem, and in some cases have resulted in adverse patient events when done improperly. As a result, to evaluate the impact of UM-CareLink on nursing workload in the medication administration process, the purpose of this project was to collect and analyze data on the UH post-CareLink nursing workload, conduct the UH post-CareLink study using a similar structure as the UH pre-CareLink study, and compare results to pre-CareLink. Key Issues The key issues for this study included the following:
• The UM-CareLink system has replaced the paper order entry methods on April 28th, 2008 • The UM-CareLink system influences the workload of UH nurses • Nurses have given negative feedback regarding the UM-CareLink system • The change in the amount of time nurses spend on medication issues from pre-CareLink to post-
CareLink is unknown Goals and Objectives The primary goal of this project was to quantify the change in the proportion of time nurses spend in handling medication from pre-CareLink to post-Carelink. To achieve this goal, the team has completed the following tasks:
• Conducted work sampling and observational studies on the current nurses’ workload • Conducted informal interviews with the nurses to obtain feedback on UM-CareLink • Used the above-mentioned information to compare pre-CareLink and post-CareLink nursing
workload related to medication administration Project Scope This post-CareLink study analyzed the following UH Units:
• Two Intensive Care Units (ICU): Units 5D and 6D • Two Acute Care Units (ACU): Units 5A and 6C • One Oncology Units: Unit 8B
Specifically, the project included: • Work sampling and observational studies in Units 5D, 6D, 5A, 6C, and 8B • Informal interviews with nurses and the point people of Units 5D, 6D, 5A, 6C, and 8B • Breakdown of times on nursing medication tasks
8
• Consolidated time on other nursing tasks • Evaluation of time spent on different components of the medication administration process from
pre-CareLink to post-CareLink
The project excluded: • Interviews with and studies on other UM-CareLink users such as physicians and pharmacists • Formal recommendations to the UH on improving the process
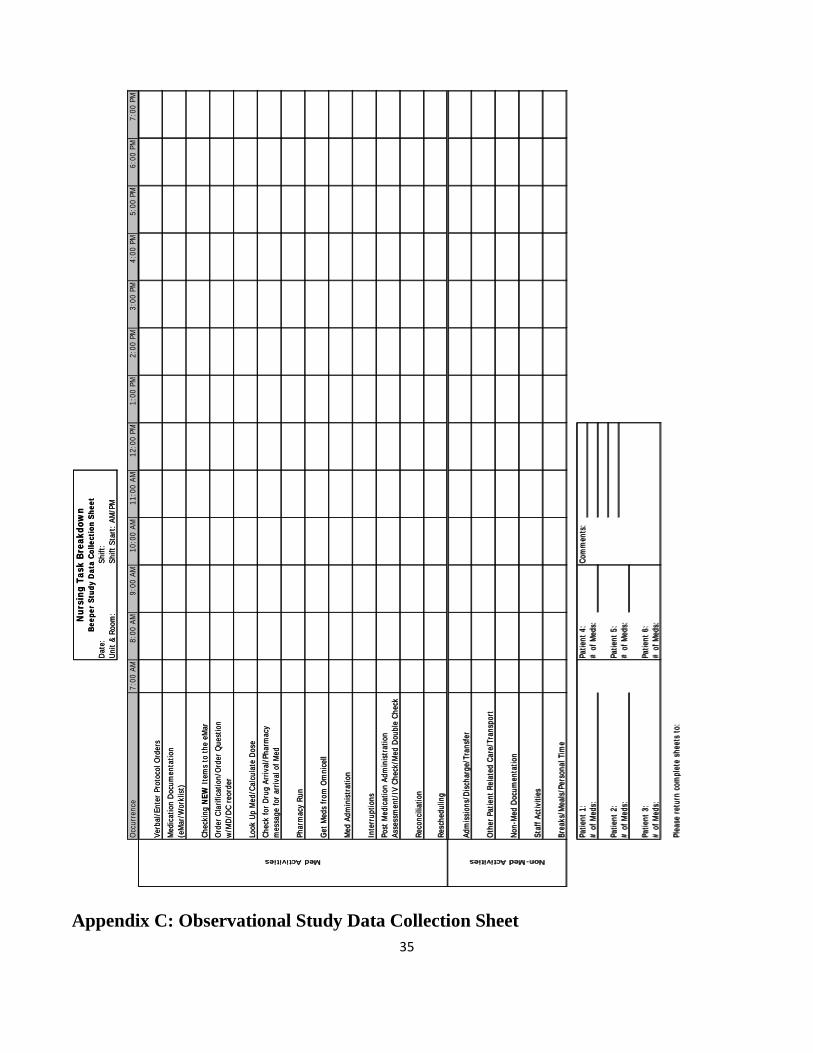
Methodology The team used three procedures to determine the impact of UM-CareLink on the portion of nursing workload dedicated to medication activities as outlined below. Literature Search To gain a better understanding of the project, the team analyzed five previous nursing workload studies done on the UH and Mott. The team adapted the work sampling and observational studies for this post-CareLink project from the UH Pre-CareLink and C.S. Mott Hospital’s Post-CareLink study reports (Appendix A). Work Sampling Study The team sampled approximately 1680 hours of nursing work using a work sampling study. The team equipped nurses from each unit with electronic beepers that went off randomly at a mean of four signals per hour, while the nursing unit representatives (point people) were responsible in arranging the logistics of the work sampling study and training the nurses to use the beepers. Nurses who participated in the study had at least one year of experience in the hospital and did not have the beeper for more than a day at a time. At each beep, the nurses were instructed to mark a work sampling data collection sheet (Appendix B). The team developed the sheet based on the Mott post-CareLink study data collection checklist by Clarke et al. Due to changes in processes from pre-CareLink to post-CareLink, the team made amendments to the study data collection sheet (Appendix B) based on the recommendations and suggestions from the point people. To determine the appropriate sample size for the work sampling study the UH pre-study was referenced. According to the UH pre-CareLink study, the medication tasks with the lowest frequency of 0.67% is pharmacy run. Based on this frequency, the minimum amount of data required for the distribution to be statistically accurate was determined by referring to the “Standard Tables of Sample Size per Relative Accuracy and Confidence” by Laura Mittendorf. To achieve a 90% confidence interval with p-value greater than 0.1, the number of hours to be collected per unit = 26,790 beeps * [1 hour / 4 beeps] / 5 units
= 1340 hours per unit = 56 days per unit = 28 days per unit per beeper
9
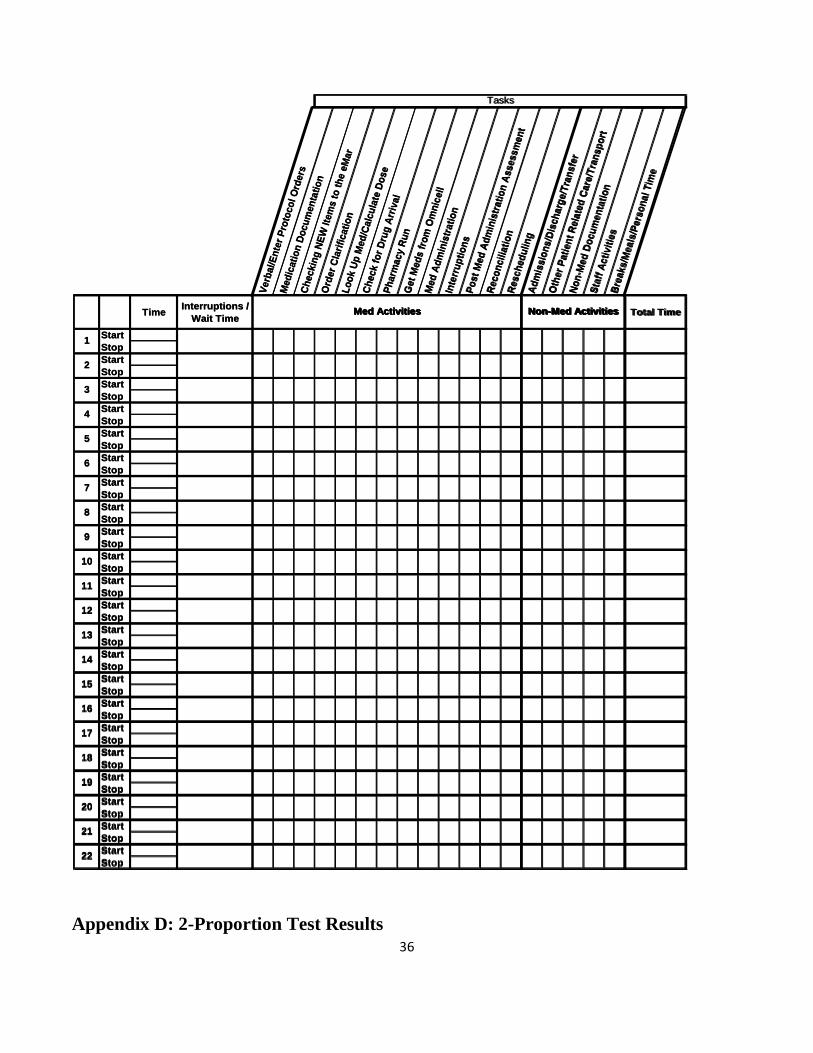
However, collecting 28 days worth of data is not possible given the timeframe of the project. Therefore, the team modeled the amount of data to be collected based on the UH pre-CareLink study. In the UH pre-CareLink study, a total of 606 hours of data were collected over 4 units, which translates to 152 hours of data per unit. As a result, at least 760 hours of data was needed for this study. To account for differences in workload during weekdays and weekends as well as bias in data, the team has collected 1704 hours or 7 days (5 weekdays and 1 weekend) worth of data. The team has used a two-proportion test to assess the statistical significance of the changes in nursing workload between pre-CareLink and post-CareLink. Observational Study The team performed 22 hours of observational studies on nursing medication tasks by being physically present in the unit floors and shadowing nurses across the five units. The team observed 4 hours per unit for Units 5A, 6C, 6D and 8B, as well as 6 hours for Unit 5D upon their request. During the study, the team also conducted informal interviews with the nurses. The results from the observational studies were documented in observational study data collection sheets adapted from the UH pre-CareLink study (Appendix C). Findings and Conclusions The team performed the methodology outlined above and compared post-CareLink to pre-CareLink work sampling data for the following analysis:
• Overall trends: 5A, 6C, 6D, and 8B • By individual unit: Units 5D, 6D, 5A, 6C and 8B • By individual unit and shift: Units 5D, 6D, 5A, 6C and 8B by shift • By 3 unit types: ICU, ACU and Oncology • Qualitative responses
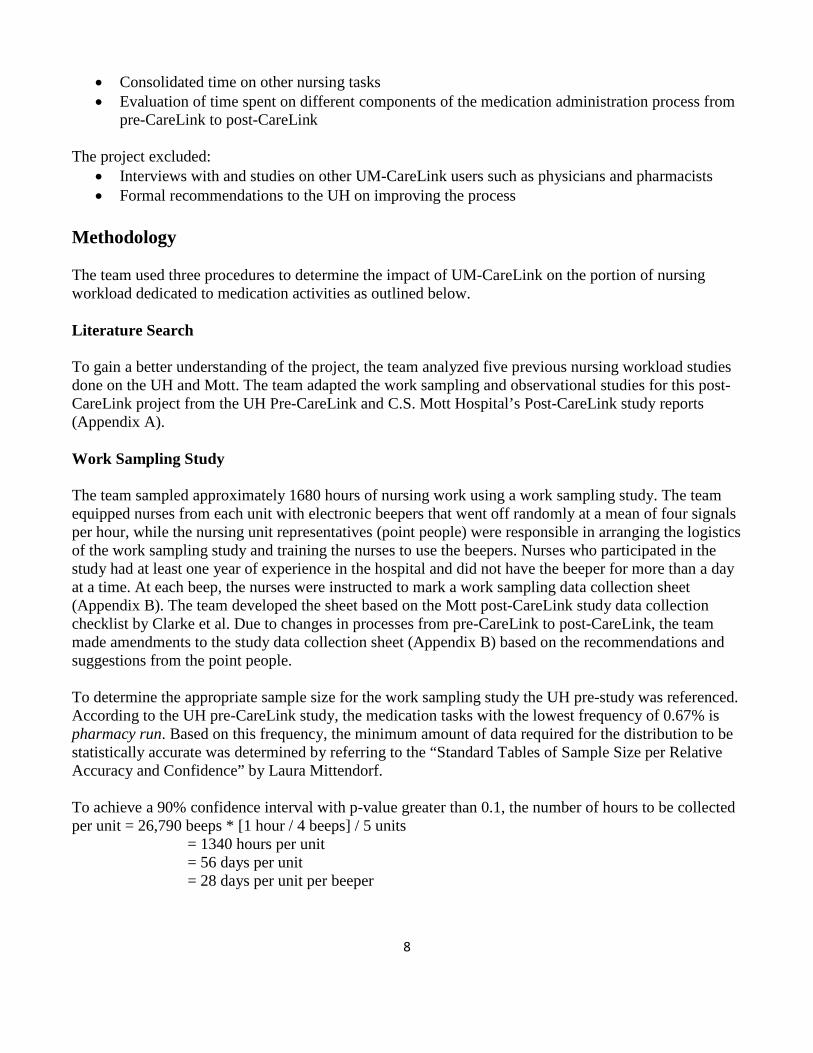
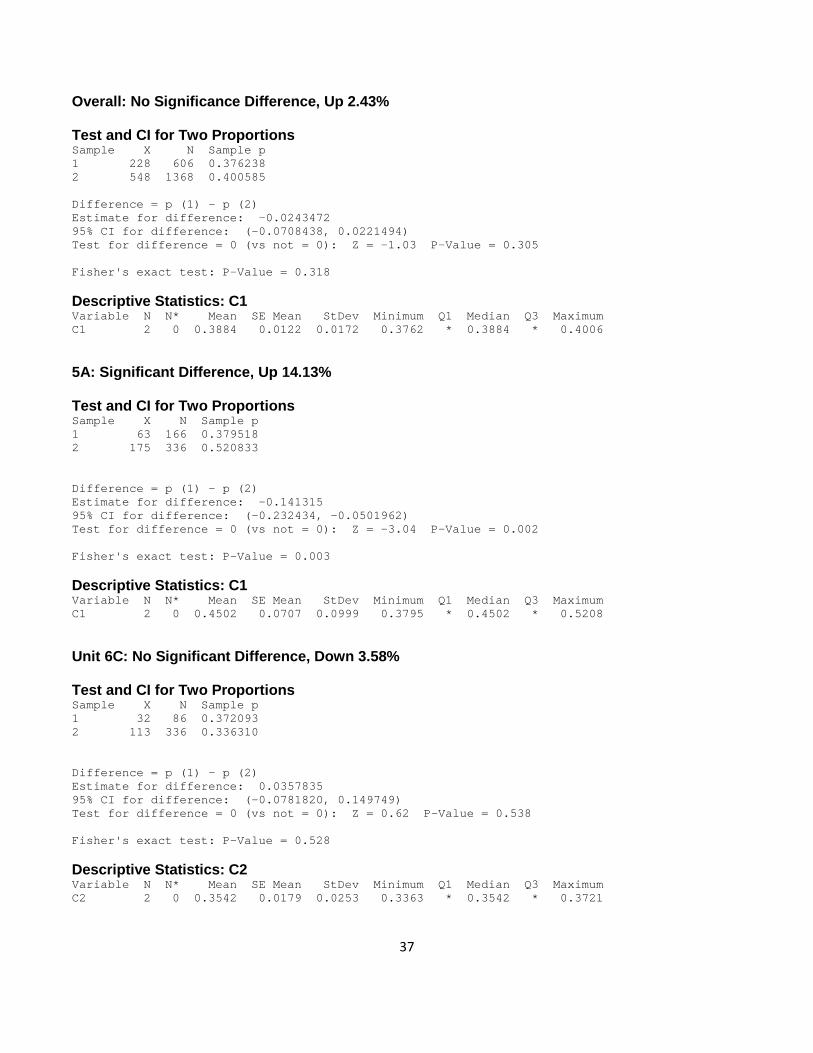
The pre-study on unit 5D was carried out earlier and with a slightly different methodology than the other units. As a result, unit 5D was not included in the overall analysis but analyzed individually to ensure that the pre-CareLink and post-CareLink nursing workload comparison is representative. Please refer to Appendix D for the 2-proportion test analysis. Overall: Not Significant, 2.40% Increase The team compared the results of the work sampling study against the work sampling data from the pre-CareLink study in the 2007 report of UH Nursing Workload Study. The purpose of this analysis was to determine the overall impact of UM-CareLink on the portion of nursing workload dedicated to medication activities. Overall, 1,368 hours of work sampling data was obtained from the four units. The two proportion test shows that the 2.40% increase in nursing workload from pre-CareLink to post-CareLink is not significant (p = 0.305) (Figure 2).
10
Figure 2. UH Overall Nursing Workload Breakdown IOE 481 Fall 2008_Team 1_Koordi_Tilak_Wardhana, N = 1368 Hours
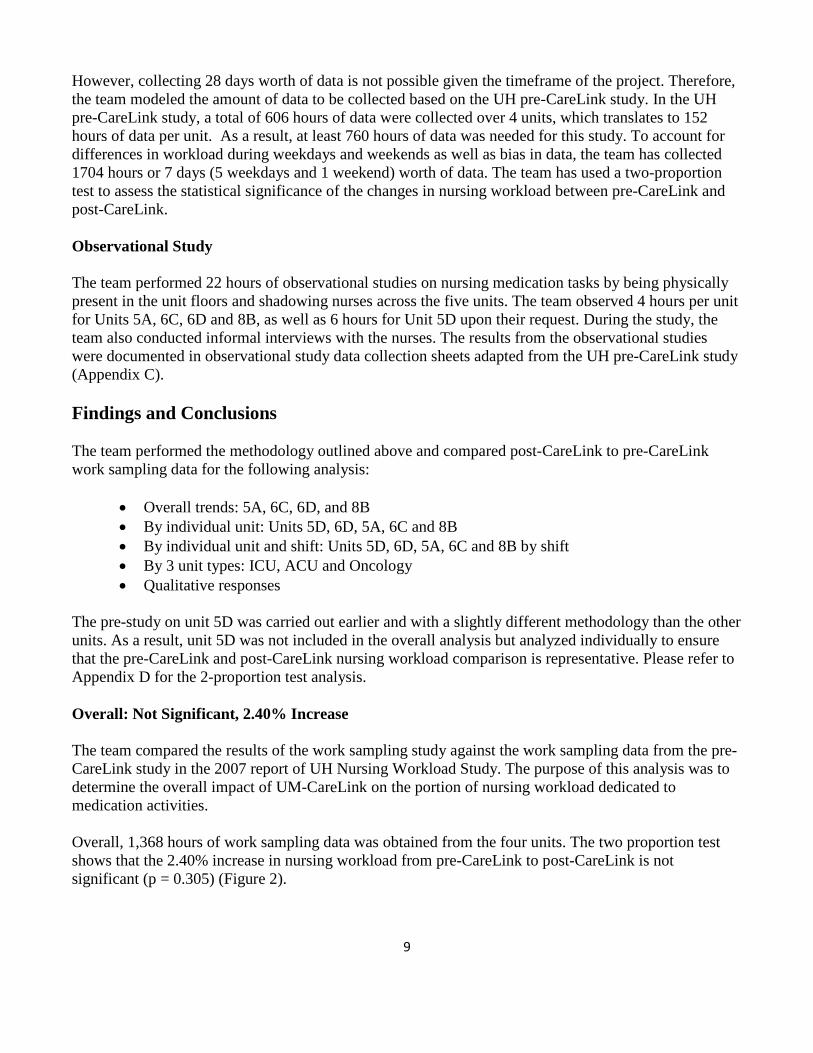
Table 2 shows the percentage of time nurses spent on various medication tasks before and after UM-CareLink implementation. After the introduction of UM-CareLink, medication task percentages were marginally affected with medication administration showing the largest increase at approximately 3%. Table 2. Overall Medication Task Percentage Difference for UH Nurses IOE 481 Fall 2008_Team 1_Koordi_Tilak_Wardhana, N = 1368 Hours
Medication Task Pre-CareLink Post-CareLink Verbal/Enter Protocol Orders 1.54% 0.16% Medication Documentation 6.94% 6.95% Checking New/Existing Items into the eMar 2.40% 4.44% Order Clarification/ Order Question w/ MD/ DC Reorder 1.91% 1.17% Look up Med/ Calculate Dose 0.82% 2.47% Check for Drug Arrival/ Pharmacy message for Arrival of Med 1.35% 0.98% Pharmacy Run/ Message to Pharmacy 0.67% 0.56% Get Meds from Omnicell 4.57% 4.94% Med Administration 11.85% 14.83% Interruptions 2.96% 1.41% Post-Medication Administration Assessment/ IV Checks/ Med Double 2.62% 1.94% Reconciliation/ Order Maintenance N/A 0.98%
11
Rescheduling N/A 0.21% Total Medication Tasks 37.65% 40.05%
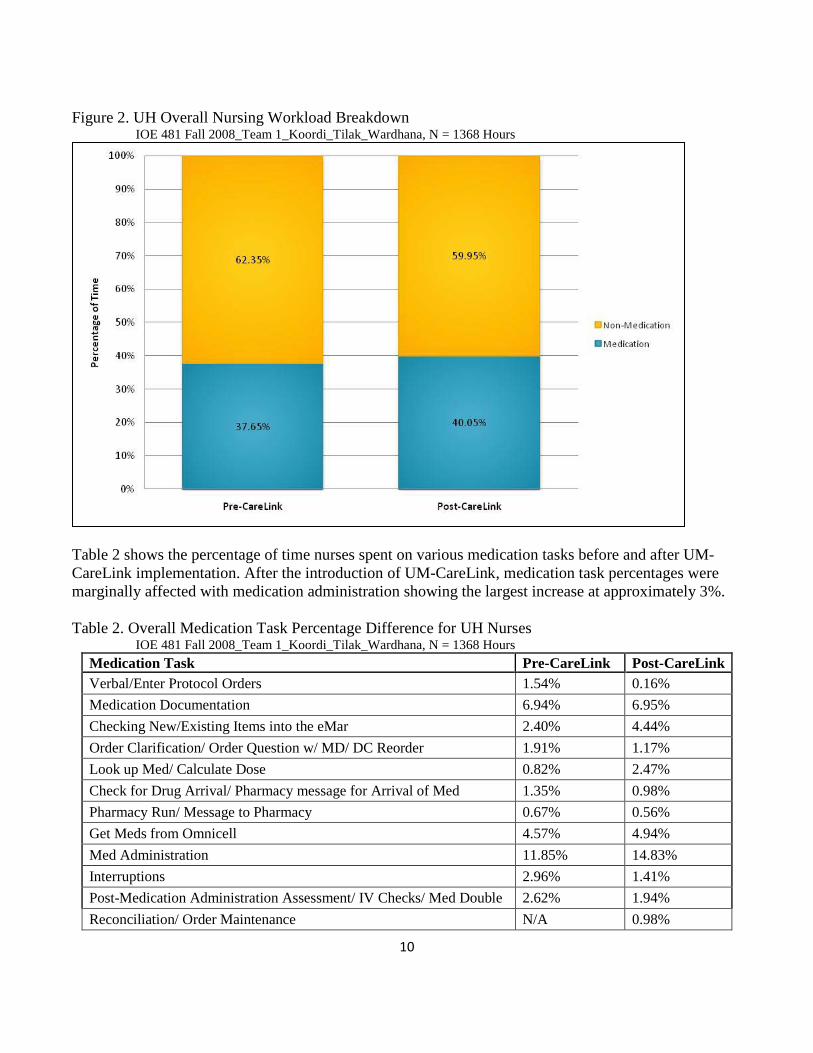
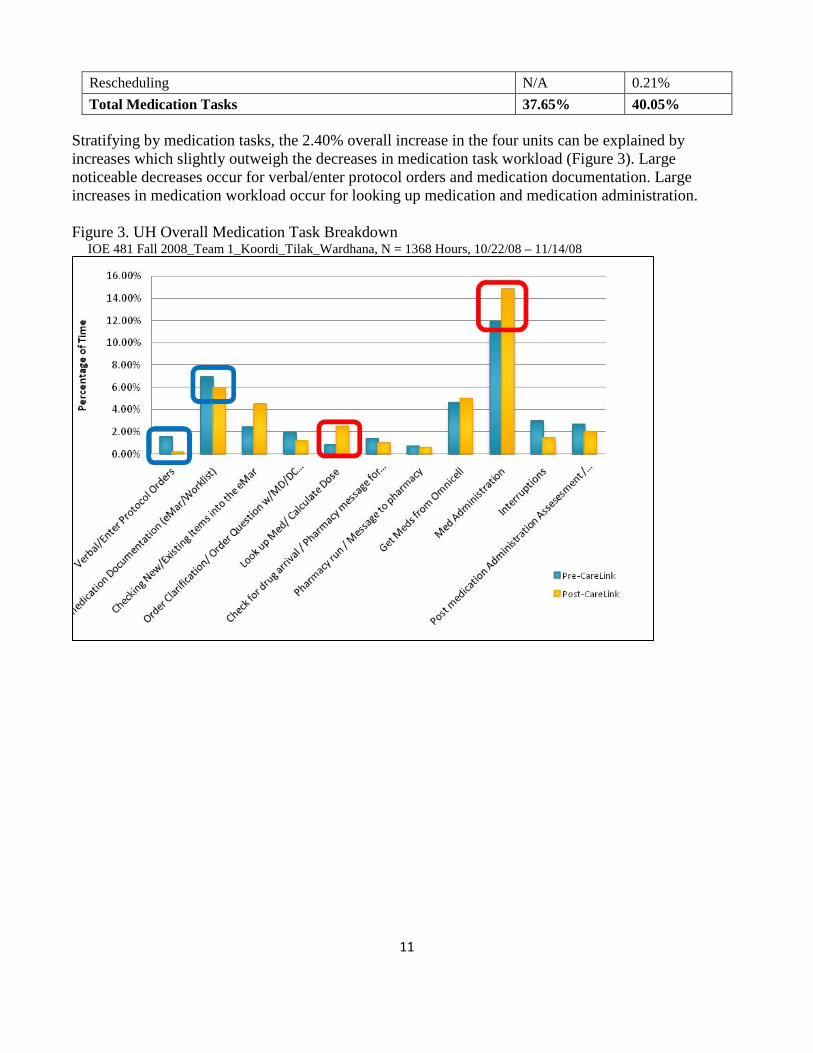
Stratifying by medication tasks, the 2.40% overall increase in the four units can be explained by increases which slightly outweigh the decreases in medication task workload (Figure 3). Large noticeable decreases occur for verbal/enter protocol orders and medication documentation. Large increases in medication workload occur for looking up medication and medication administration. Figure 3. UH Overall Medication Task Breakdown IOE 481 Fall 2008_Team 1_Koordi_Tilak_Wardhana, N = 1368 Hours, 10/22/08 – 11/14/08
12
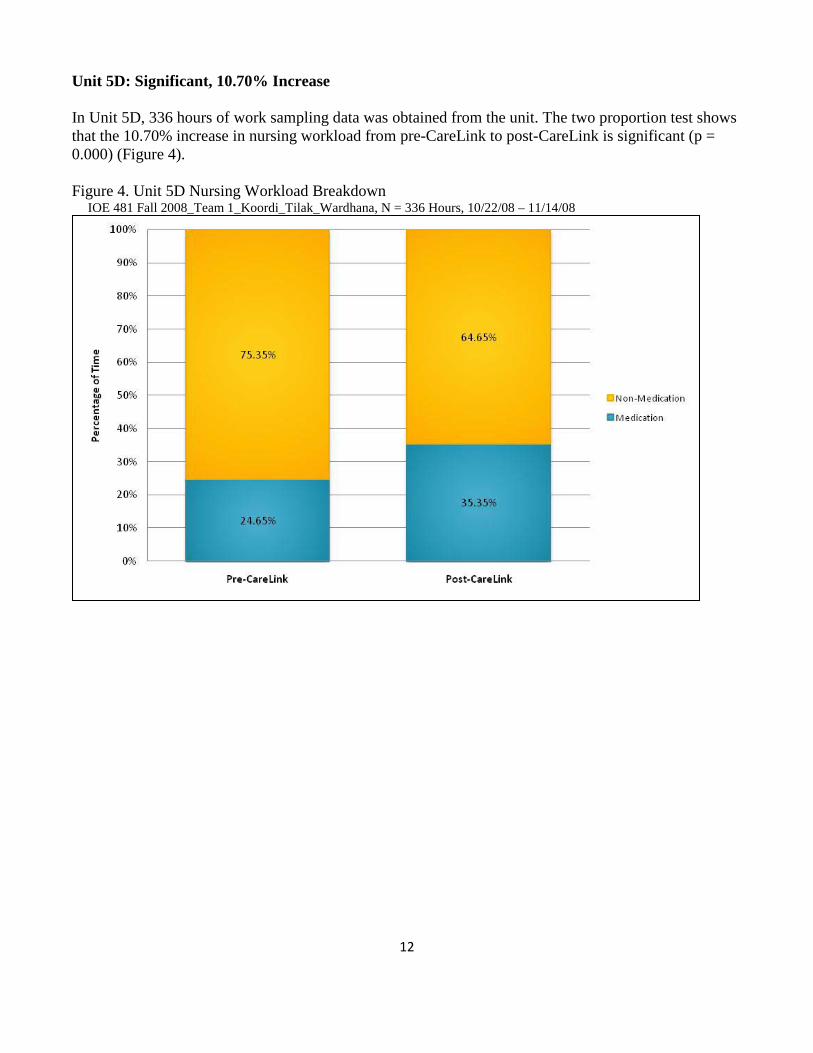
Unit 5D: Significant, 10.70% Increase In Unit 5D, 336 hours of work sampling data was obtained from the unit. The two proportion test shows that the 10.70% increase in nursing workload from pre-CareLink to post-CareLink is significant (p = 0.000) (Figure 4). Figure 4. Unit 5D Nursing Workload Breakdown IOE 481 Fall 2008_Team 1_Koordi_Tilak_Wardhana, N = 336 Hours, 10/22/08 – 11/14/08
13
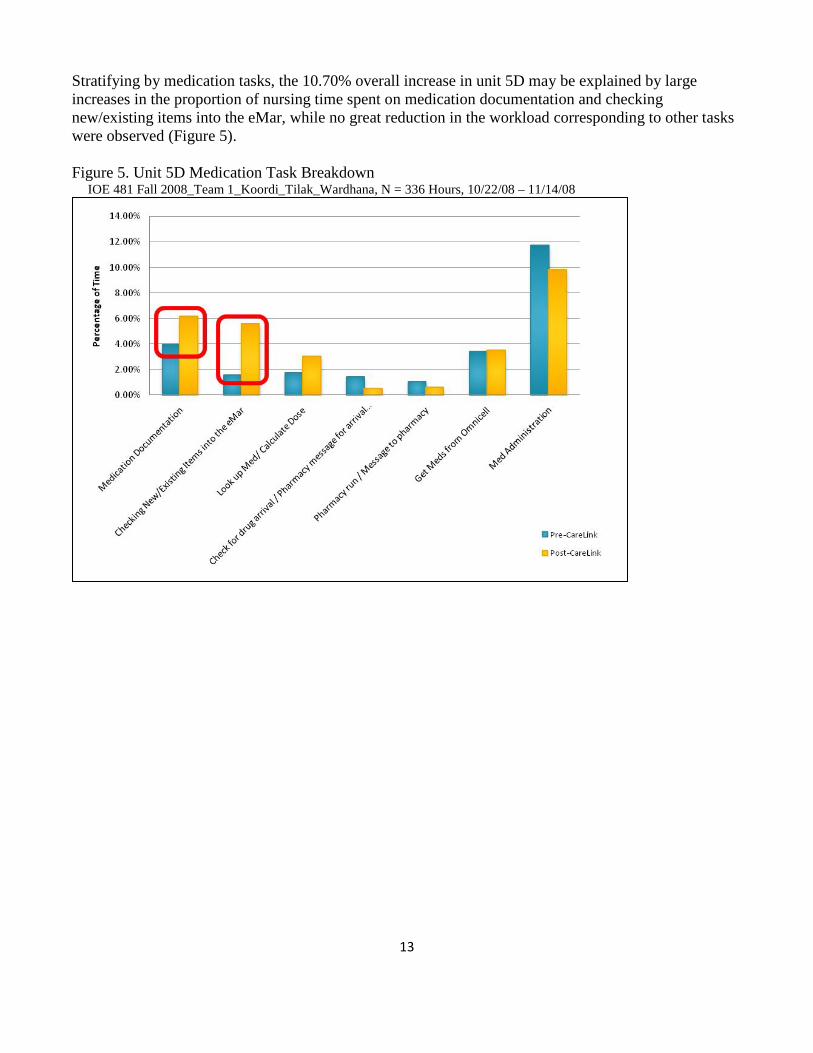
Stratifying by medication tasks, the 10.70% overall increase in unit 5D may be explained by large increases in the proportion of nursing time spent on medication documentation and checking new/existing items into the eMar, while no great reduction in the workload corresponding to other tasks were observed (Figure 5). Figure 5. Unit 5D Medication Task Breakdown IOE 481 Fall 2008_Team 1_Koordi_Tilak_Wardhana, N = 336 Hours, 10/22/08 – 11/14/08
14
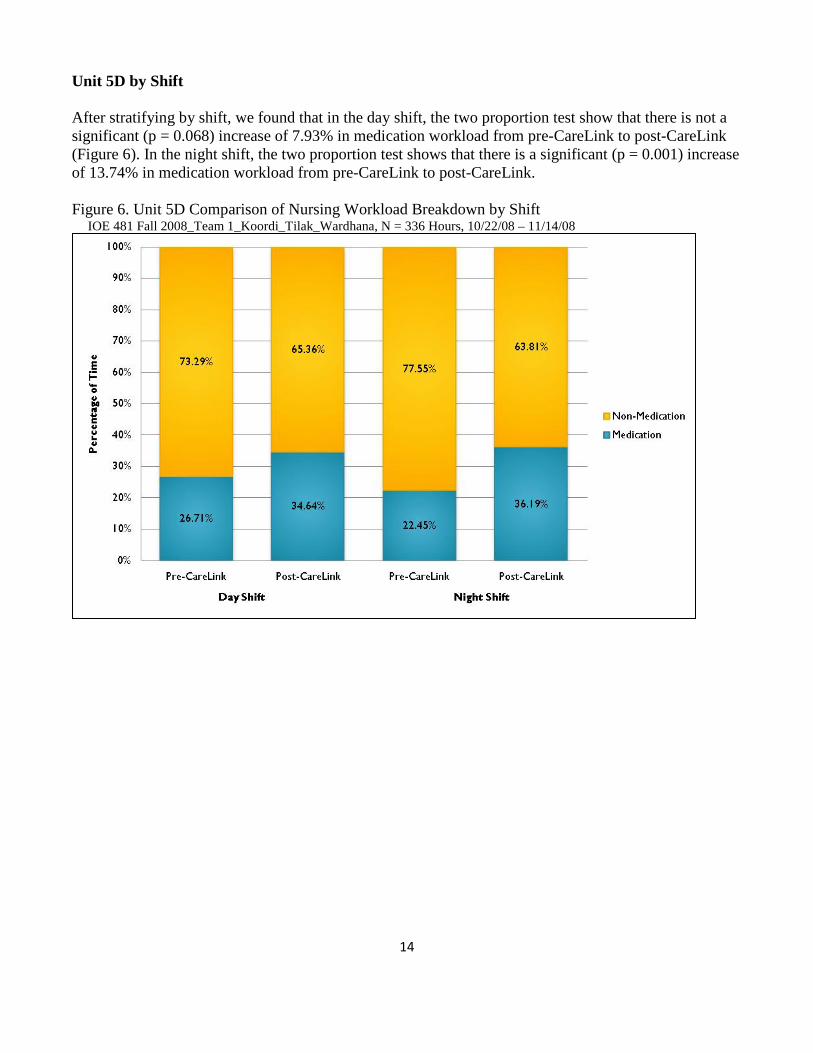
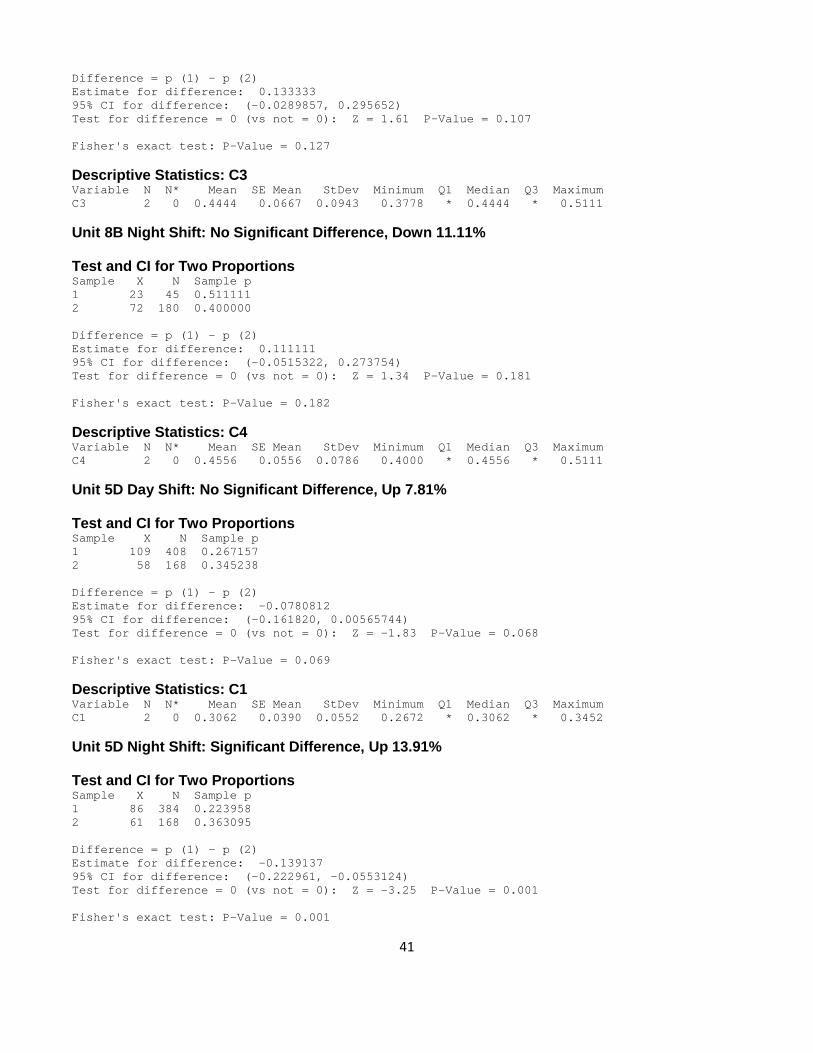
Unit 5D by Shift After stratifying by shift, we found that in the day shift, the two proportion test show that there is not a significant (p = 0.068) increase of 7.93% in medication workload from pre-CareLink to post-CareLink (Figure 6). In the night shift, the two proportion test shows that there is a significant (p = 0.001) increase of 13.74% in medication workload from pre-CareLink to post-CareLink. Figure 6. Unit 5D Comparison of Nursing Workload Breakdown by Shift IOE 481 Fall 2008_Team 1_Koordi_Tilak_Wardhana, N = 336 Hours, 10/22/08 – 11/14/08
15
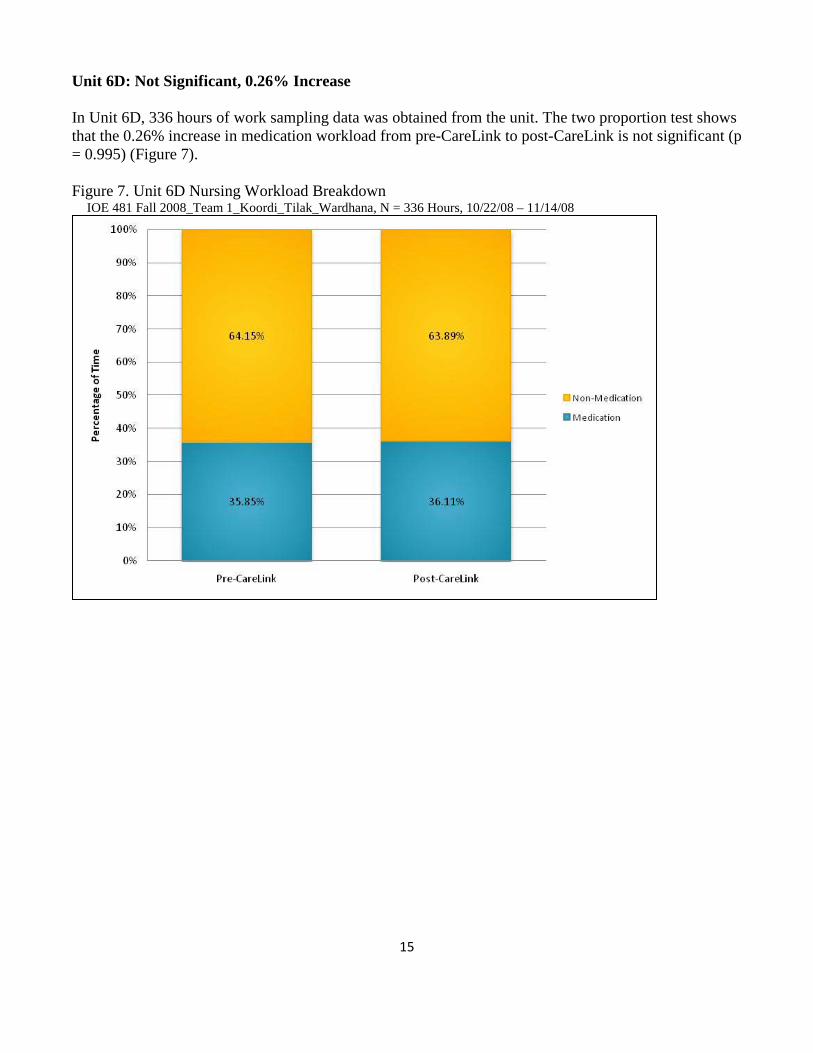
Unit 6D: Not Significant, 0.26% Increase In Unit 6D, 336 hours of work sampling data was obtained from the unit. The two proportion test shows that the 0.26% increase in medication workload from pre-CareLink to post-CareLink is not significant (p = 0.995) (Figure 7). Figure 7. Unit 6D Nursing Workload Breakdown
IOE 481 Fall 2008_Team 1_Koordi_Tilak_Wardhana, N = 336 Hours, 10/22/08 – 11/14/08
16
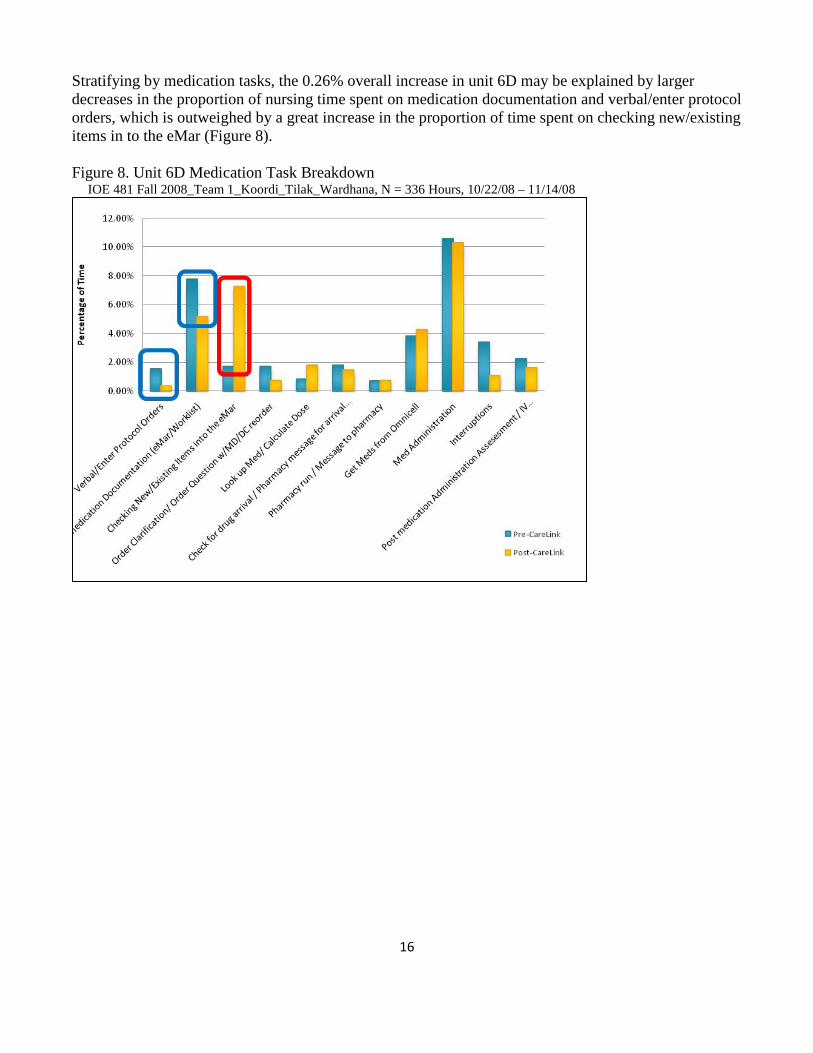
Stratifying by medication tasks, the 0.26% overall increase in unit 6D may be explained by larger decreases in the proportion of nursing time spent on medication documentation and verbal/enter protocol orders, which is outweighed by a great increase in the proportion of time spent on checking new/existing items in to the eMar (Figure 8). Figure 8. Unit 6D Medication Task Breakdown IOE 481 Fall 2008_Team 1_Koordi_Tilak_Wardhana, N = 336 Hours, 10/22/08 – 11/14/08
17
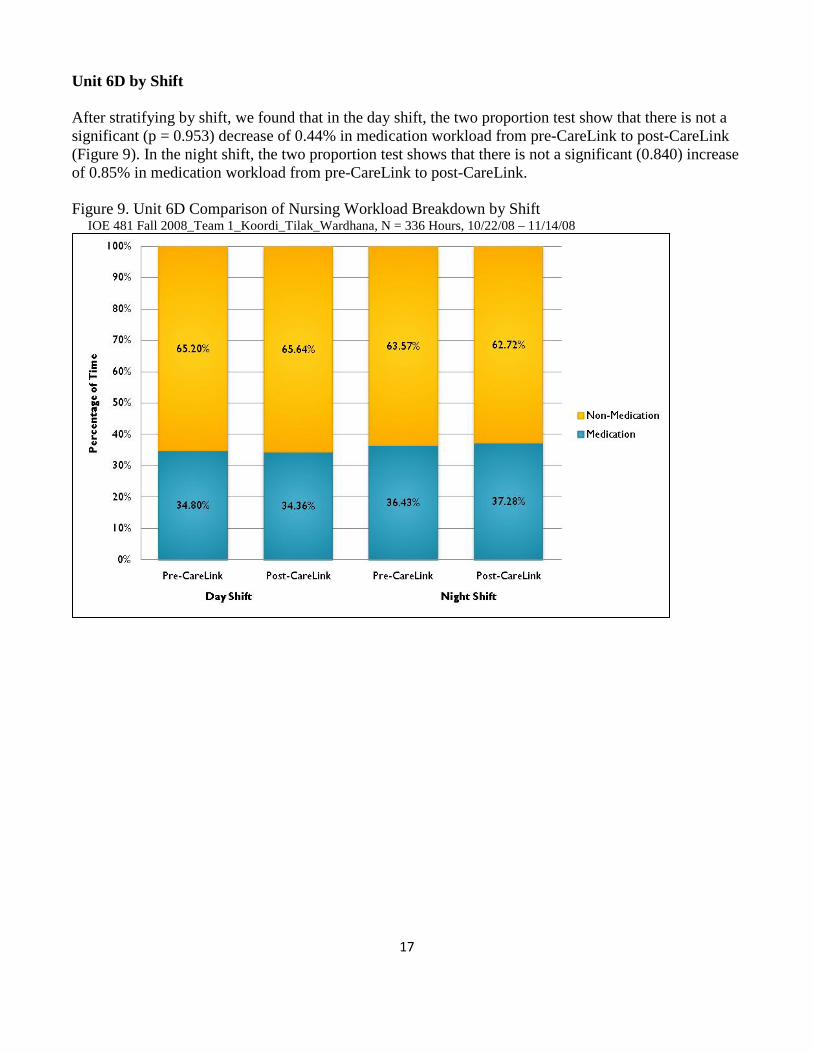
Unit 6D by Shift After stratifying by shift, we found that in the day shift, the two proportion test show that there is not a significant (p = 0.953) decrease of 0.44% in medication workload from pre-CareLink to post-CareLink (Figure 9). In the night shift, the two proportion test shows that there is not a significant (0.840) increase of 0.85% in medication workload from pre-CareLink to post-CareLink. Figure 9. Unit 6D Comparison of Nursing Workload Breakdown by Shift IOE 481 Fall 2008_Team 1_Koordi_Tilak_Wardhana, N = 336 Hours, 10/22/08 – 11/14/08
18
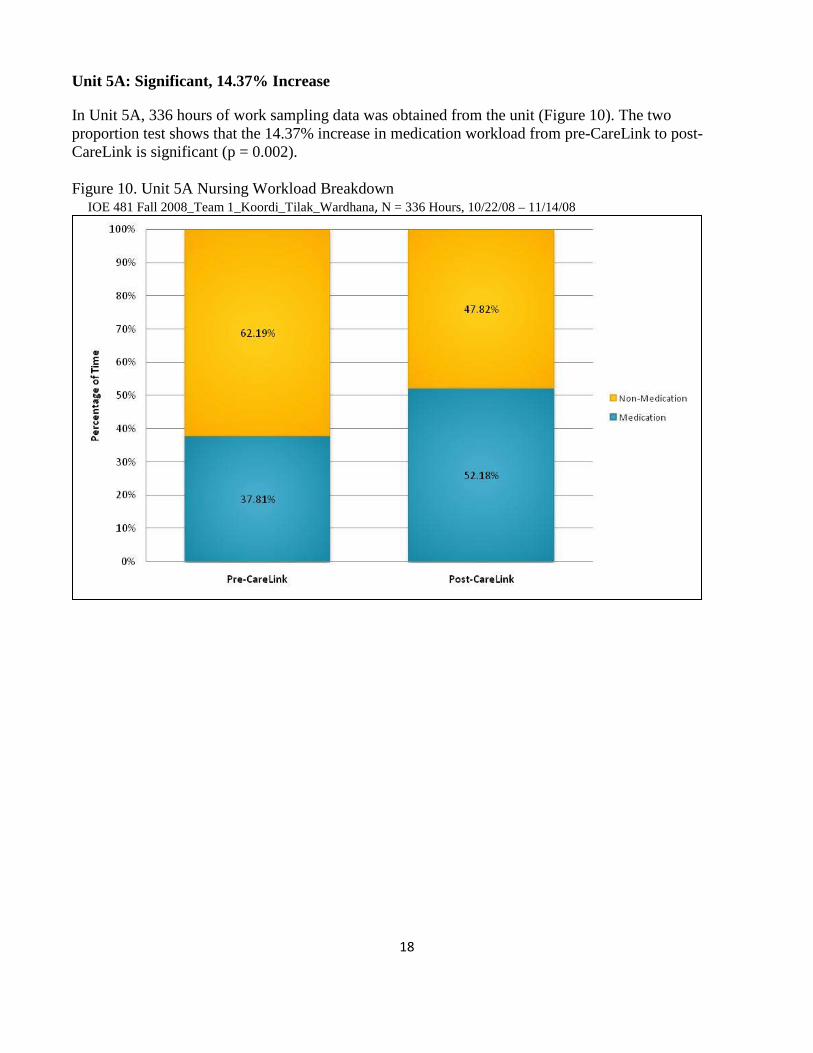
Unit 5A: Significant, 14.37% Increase
In Unit 5A, 336 hours of work sampling data was obtained from the unit (Figure 10). The two proportion test shows that the 14.37% increase in medication workload from pre-CareLink to post-CareLink is significant (p = 0.002). Figure 10. Unit 5A Nursing Workload Breakdown IOE 481 Fall 2008_Team 1_Koordi_Tilak_Wardhana, N = 336 Hours, 10/22/08 – 11/14/08
19
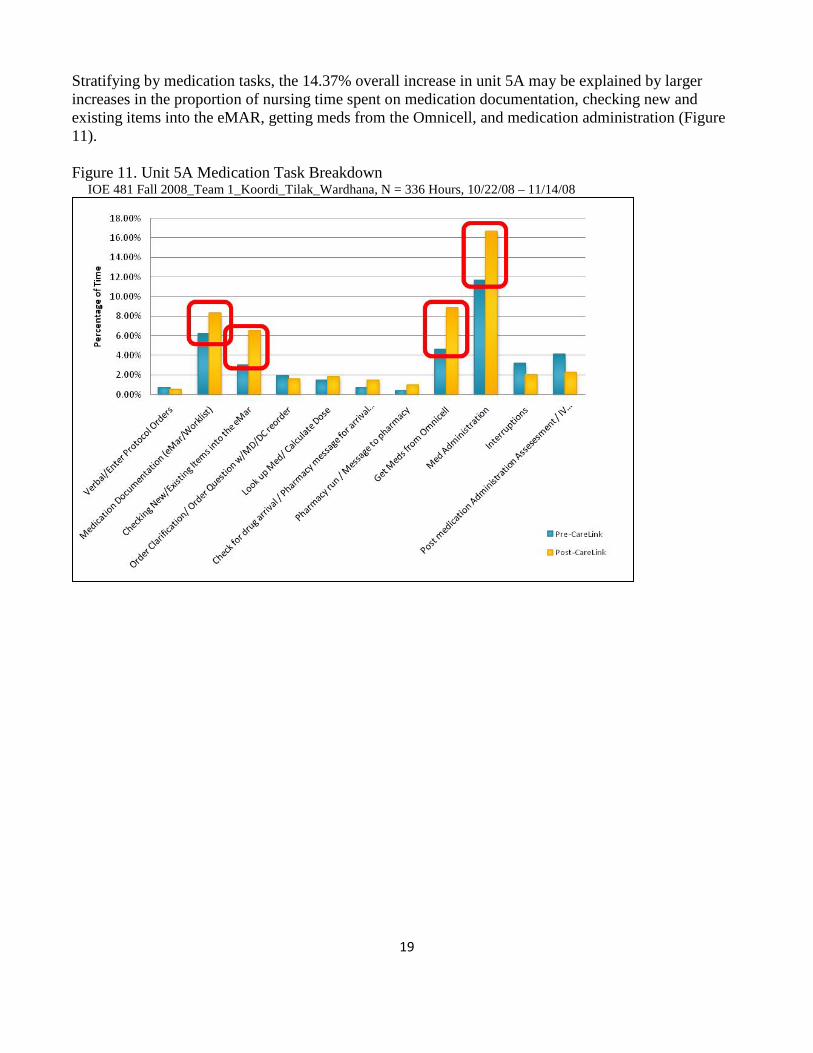
Stratifying by medication tasks, the 14.37% overall increase in unit 5A may be explained by larger increases in the proportion of nursing time spent on medication documentation, checking new and existing items into the eMAR, getting meds from the Omnicell, and medication administration (Figure 11). Figure 11. Unit 5A Medication Task Breakdown IOE 481 Fall 2008_Team 1_Koordi_Tilak_Wardhana, N = 336 Hours, 10/22/08 – 11/14/08
20
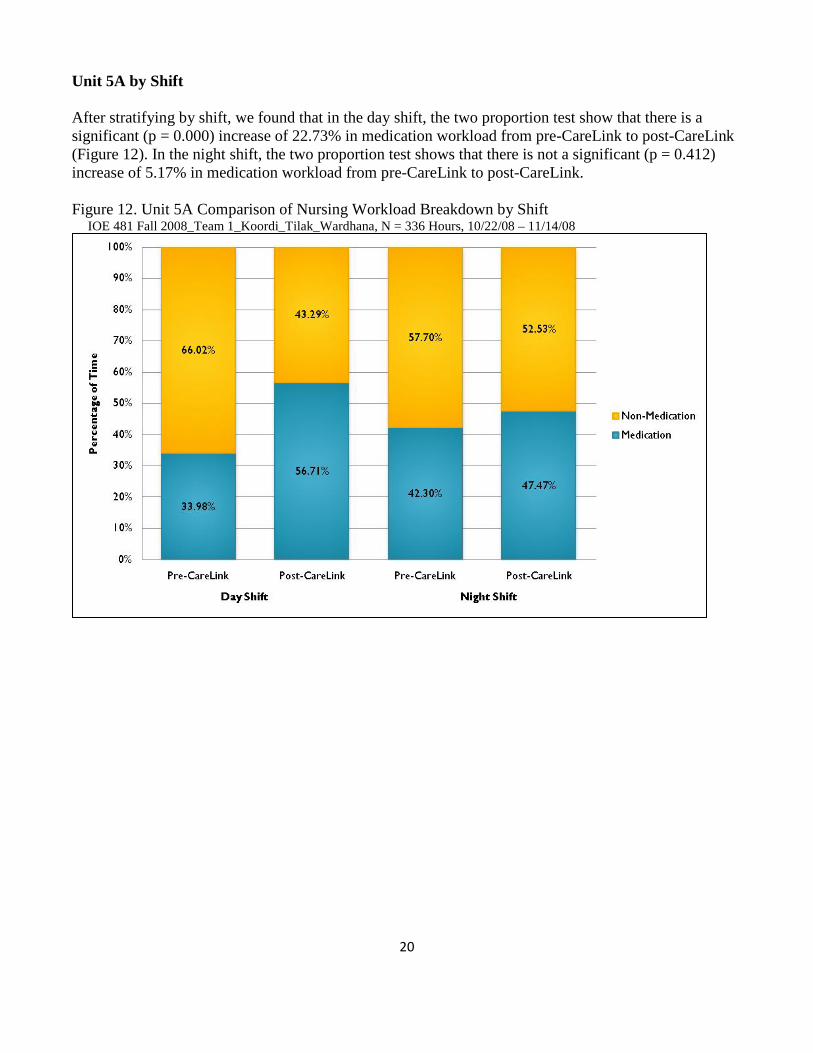
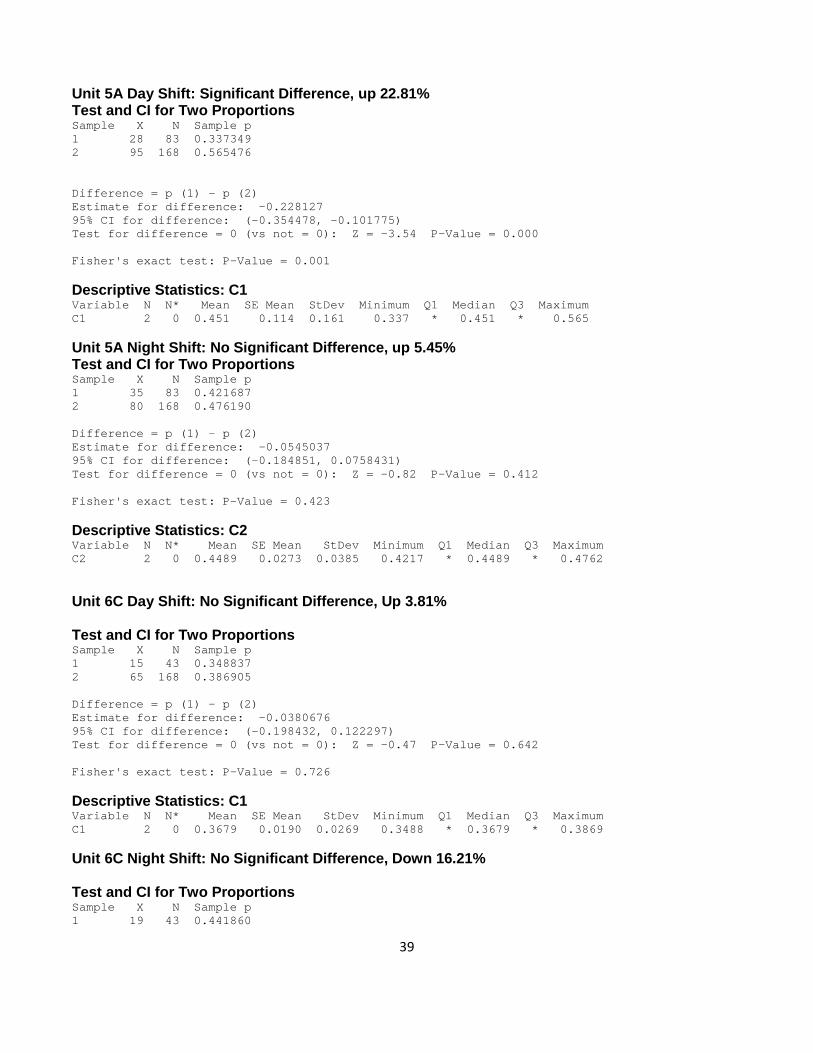
Unit 5A by Shift After stratifying by shift, we found that in the day shift, the two proportion test show that there is a significant (p = 0.000) increase of 22.73% in medication workload from pre-CareLink to post-CareLink (Figure 12). In the night shift, the two proportion test shows that there is not a significant (p = 0.412) increase of 5.17% in medication workload from pre-CareLink to post-CareLink. Figure 12. Unit 5A Comparison of Nursing Workload Breakdown by Shift IOE 481 Fall 2008_Team 1_Koordi_Tilak_Wardhana, N = 336 Hours, 10/22/08 – 11/14/08
21
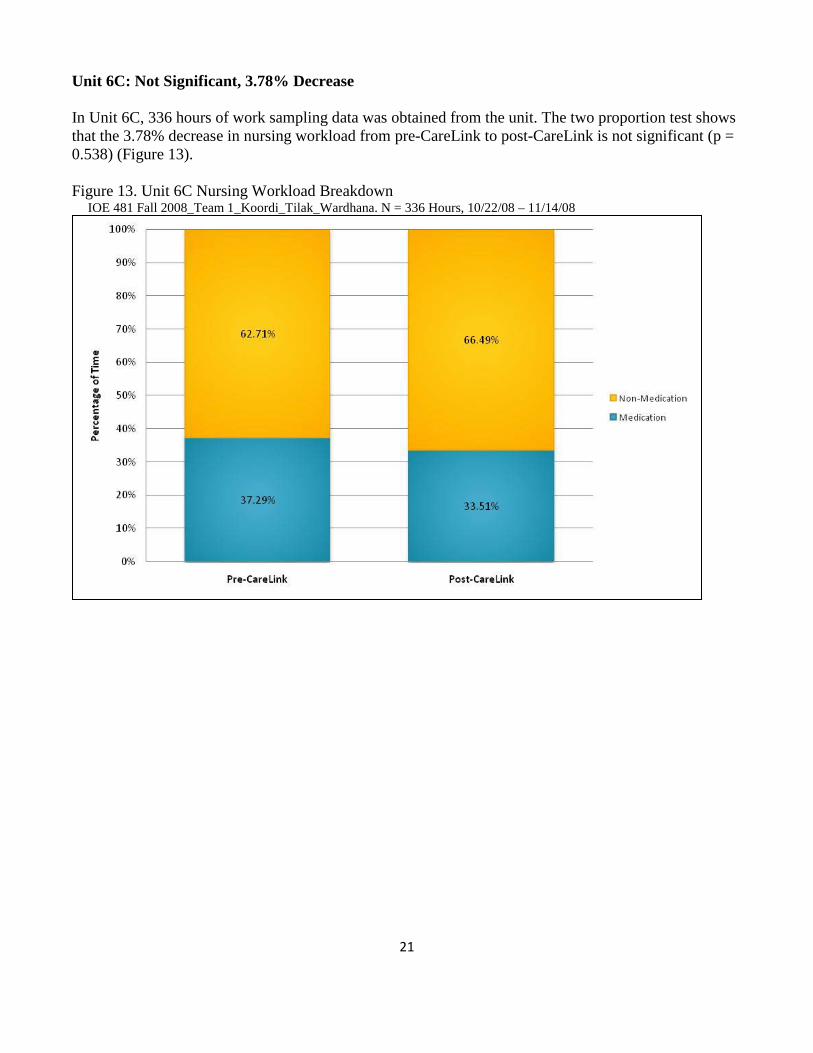
Unit 6C: Not Significant, 3.78% Decrease In Unit 6C, 336 hours of work sampling data was obtained from the unit. The two proportion test shows that the 3.78% decrease in nursing workload from pre-CareLink to post-CareLink is not significant (p = 0.538) (Figure 13). Figure 13. Unit 6C Nursing Workload Breakdown IOE 481 Fall 2008_Team 1_Koordi_Tilak_Wardhana. N = 336 Hours, 10/22/08 – 11/14/08
22
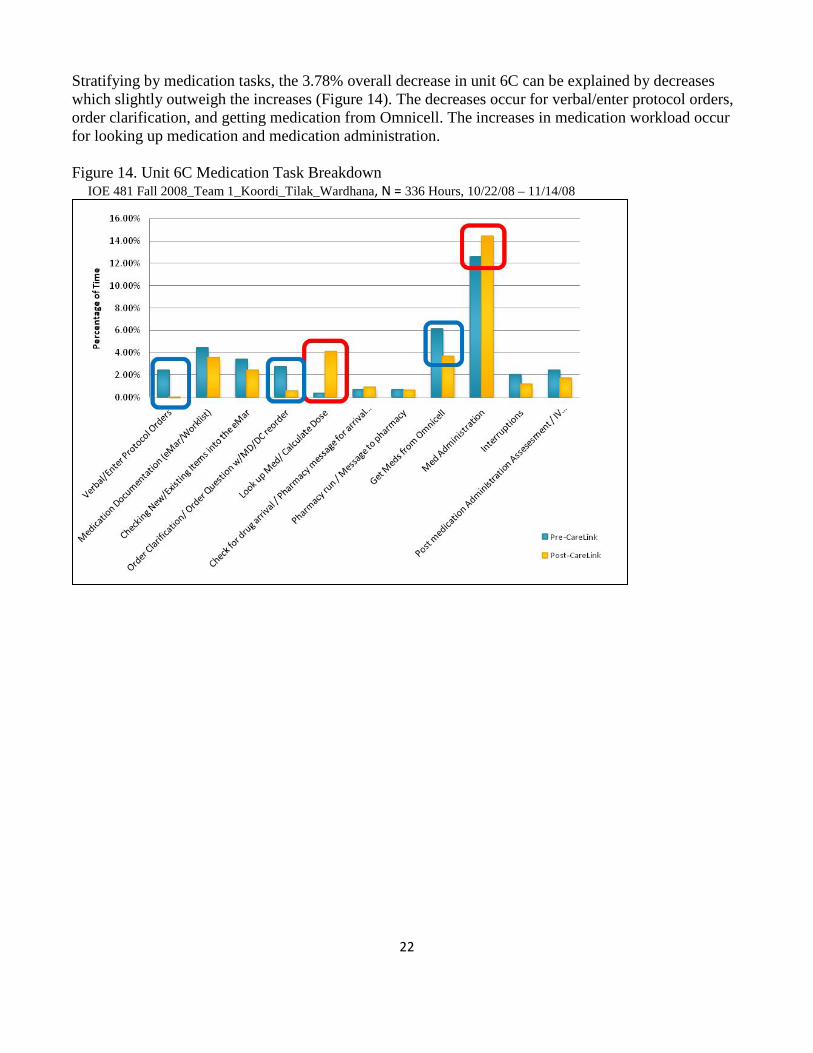
Stratifying by medication tasks, the 3.78% overall decrease in unit 6C can be explained by decreases which slightly outweigh the increases (Figure 14). The decreases occur for verbal/enter protocol orders, order clarification, and getting medication from Omnicell. The increases in medication workload occur for looking up medication and medication administration. Figure 14. Unit 6C Medication Task Breakdown IOE 481 Fall 2008_Team 1_Koordi_Tilak_Wardhana, N = 336 Hours, 10/22/08 – 11/14/08
23
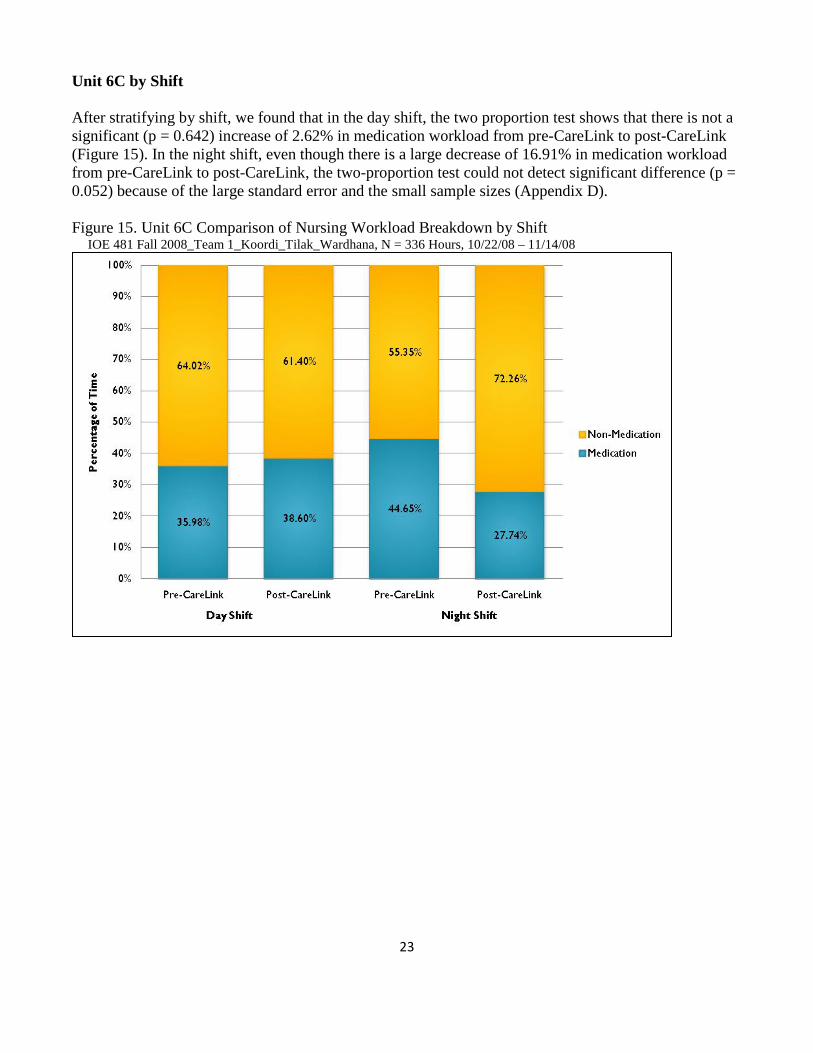
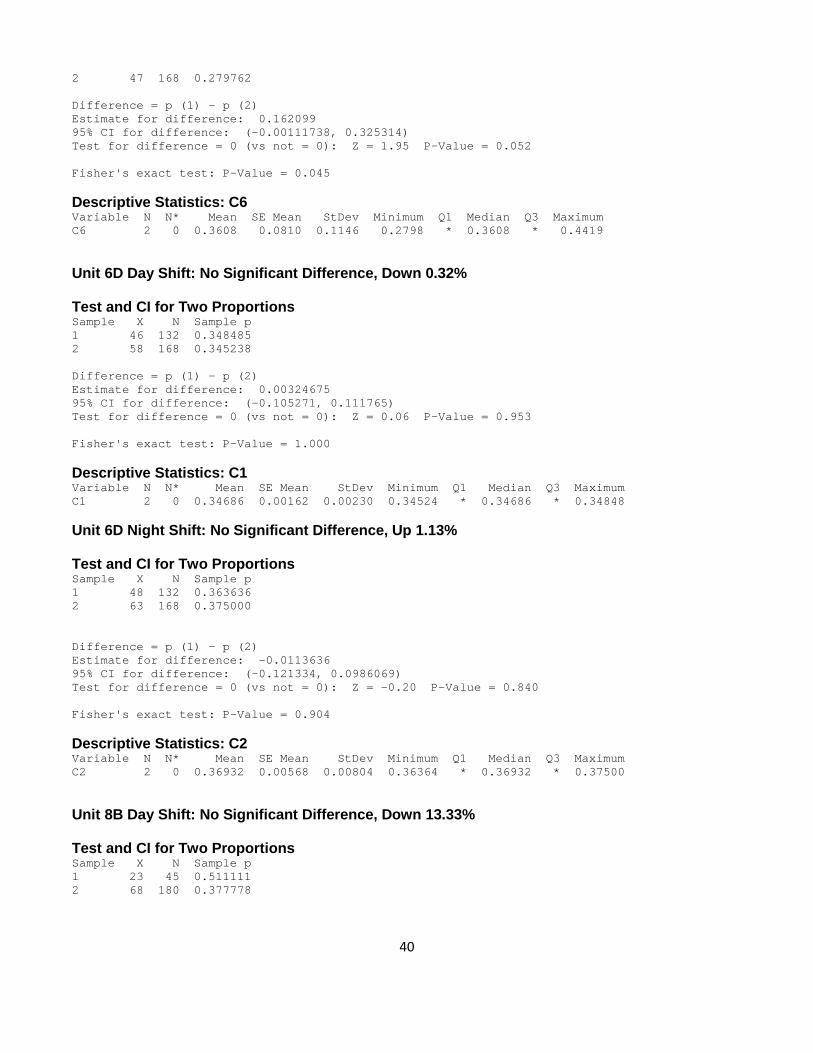
Unit 6C by Shift After stratifying by shift, we found that in the day shift, the two proportion test shows that there is not a significant (p = 0.642) increase of 2.62% in medication workload from pre-CareLink to post-CareLink (Figure 15). In the night shift, even though there is a large decrease of 16.91% in medication workload from pre-CareLink to post-CareLink, the two-proportion test could not detect significant difference (p = 0.052) because of the large standard error and the small sample sizes (Appendix D). Figure 15. Unit 6C Comparison of Nursing Workload Breakdown by Shift IOE 481 Fall 2008_Team 1_Koordi_Tilak_Wardhana, N = 336 Hours, 10/22/08 – 11/14/08
24
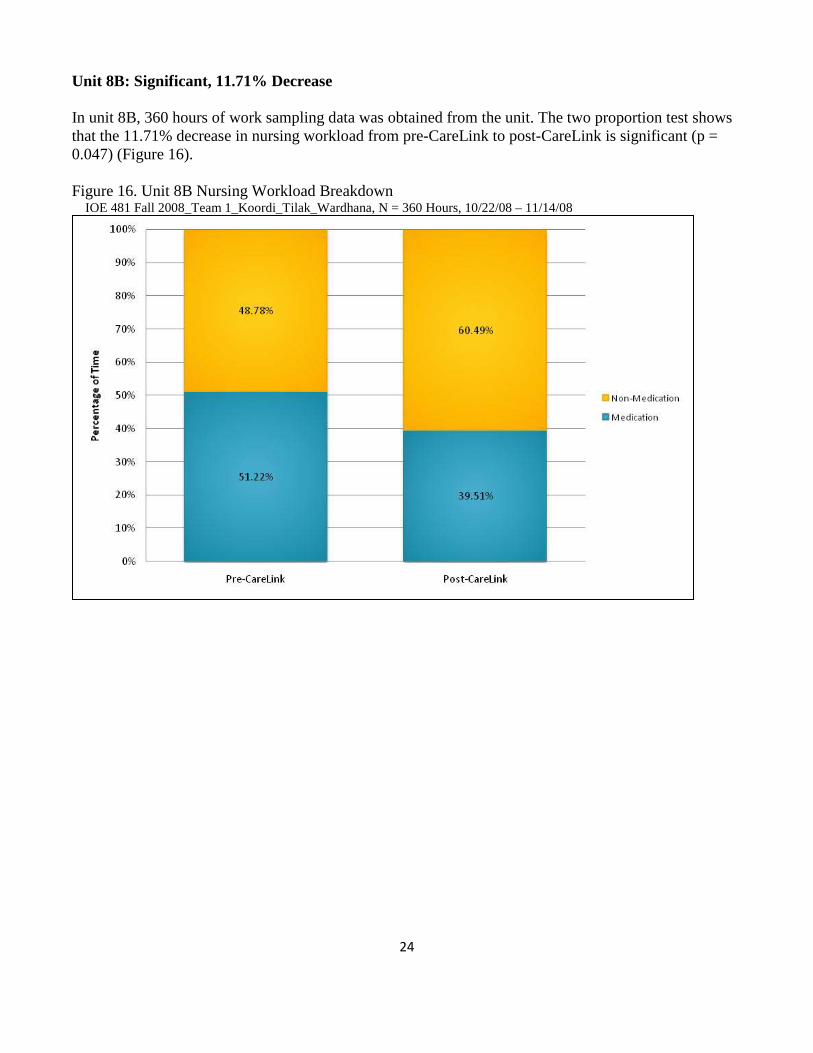
Unit 8B: Significant, 11.71% Decrease In unit 8B, 360 hours of work sampling data was obtained from the unit. The two proportion test shows that the 11.71% decrease in nursing workload from pre-CareLink to post-CareLink is significant (p = 0.047) (Figure 16). Figure 16. Unit 8B Nursing Workload Breakdown IOE 481 Fall 2008_Team 1_Koordi_Tilak_Wardhana, N = 360 Hours, 10/22/08 – 11/14/08
25
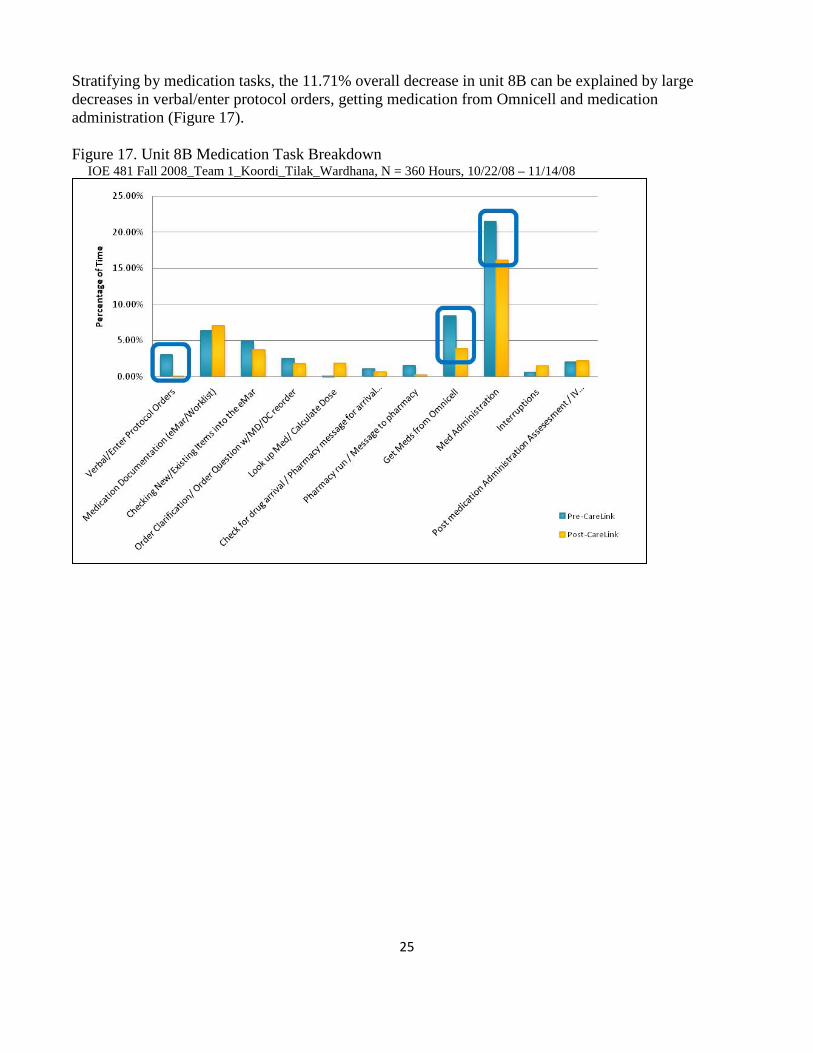
Stratifying by medication tasks, the 11.71% overall decrease in unit 8B can be explained by large decreases in verbal/enter protocol orders, getting medication from Omnicell and medication administration (Figure 17). Figure 17. Unit 8B Medication Task Breakdown IOE 481 Fall 2008_Team 1_Koordi_Tilak_Wardhana, N = 360 Hours, 10/22/08 – 11/14/08
26
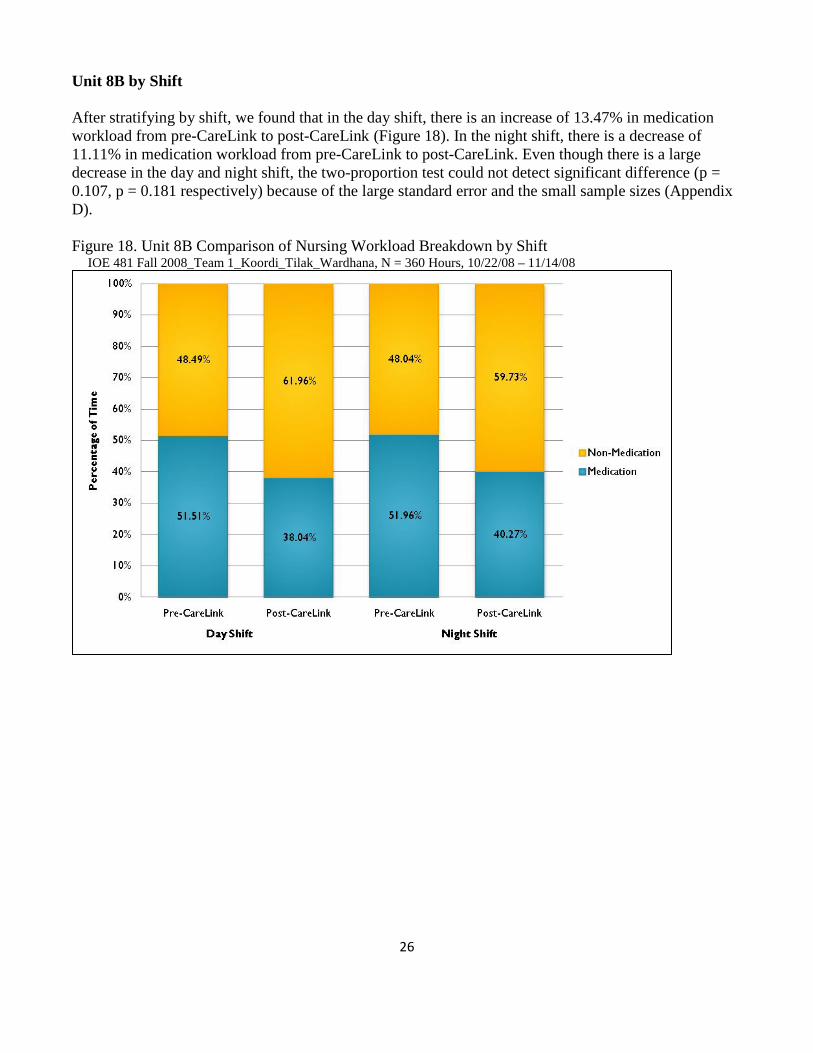
Unit 8B by Shift After stratifying by shift, we found that in the day shift, there is an increase of 13.47% in medication workload from pre-CareLink to post-CareLink (Figure 18). In the night shift, there is a decrease of 11.11% in medication workload from pre-CareLink to post-CareLink. Even though there is a large decrease in the day and night shift, the two-proportion test could not detect significant difference (p = 0.107, p = 0.181 respectively) because of the large standard error and the small sample sizes (Appendix D). Figure 18. Unit 8B Comparison of Nursing Workload Breakdown by Shift IOE 481 Fall 2008_Team 1_Koordi_Tilak_Wardhana, N = 360 Hours, 10/22/08 – 11/14/08
27
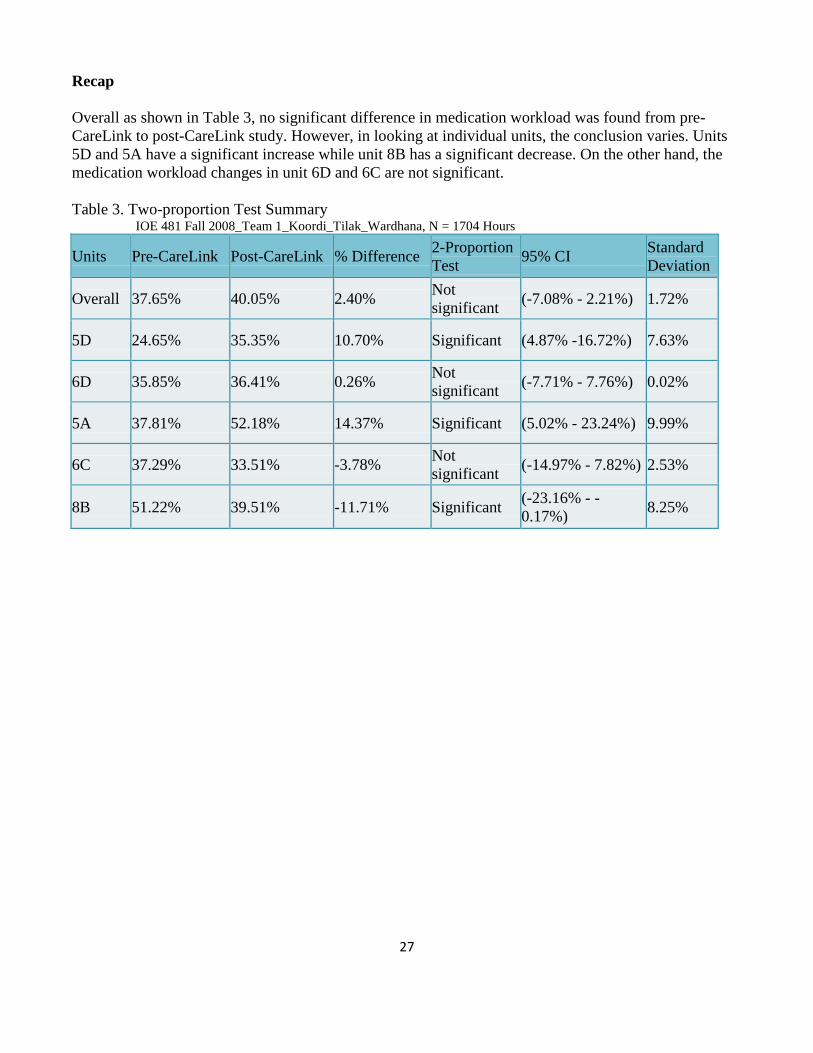
Recap Overall as shown in Table 3, no significant difference in medication workload was found from pre-CareLink to post-CareLink study. However, in looking at individual units, the conclusion varies. Units 5D and 5A have a significant increase while unit 8B has a significant decrease. On the other hand, the medication workload changes in unit 6D and 6C are not significant. Table 3. Two-proportion Test Summary IOE 481 Fall 2008_Team 1_Koordi_Tilak_Wardhana, N = 1704 Hours
Units Pre-CareLink Post-CareLink % Difference 2-Proportion Test 95% CI Standard
Deviation
Overall 37.65% 40.05% 2.40% Not significant (-7.08% - 2.21%) 1.72%
5D 24.65% 35.35% 10.70% Significant (4.87% -16.72%) 7.63%
6D 35.85% 36.41% 0.26% Not significant (-7.71% - 7.76%) 0.02%
5A 37.81% 52.18% 14.37% Significant (5.02% - 23.24%) 9.99%
6C 37.29% 33.51% -3.78% Not significant (-14.97% - 7.82%) 2.53%
8B 51.22% 39.51% -11.71% Significant (-23.16% - -0.17%) 8.25%
28
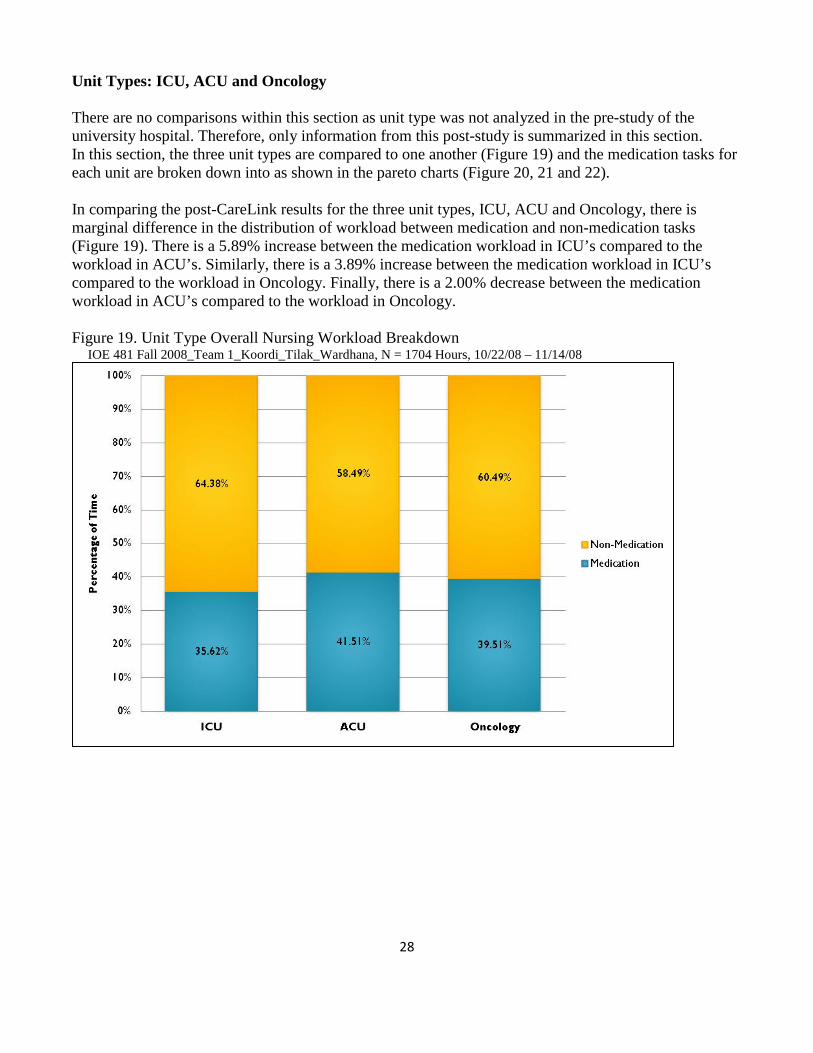
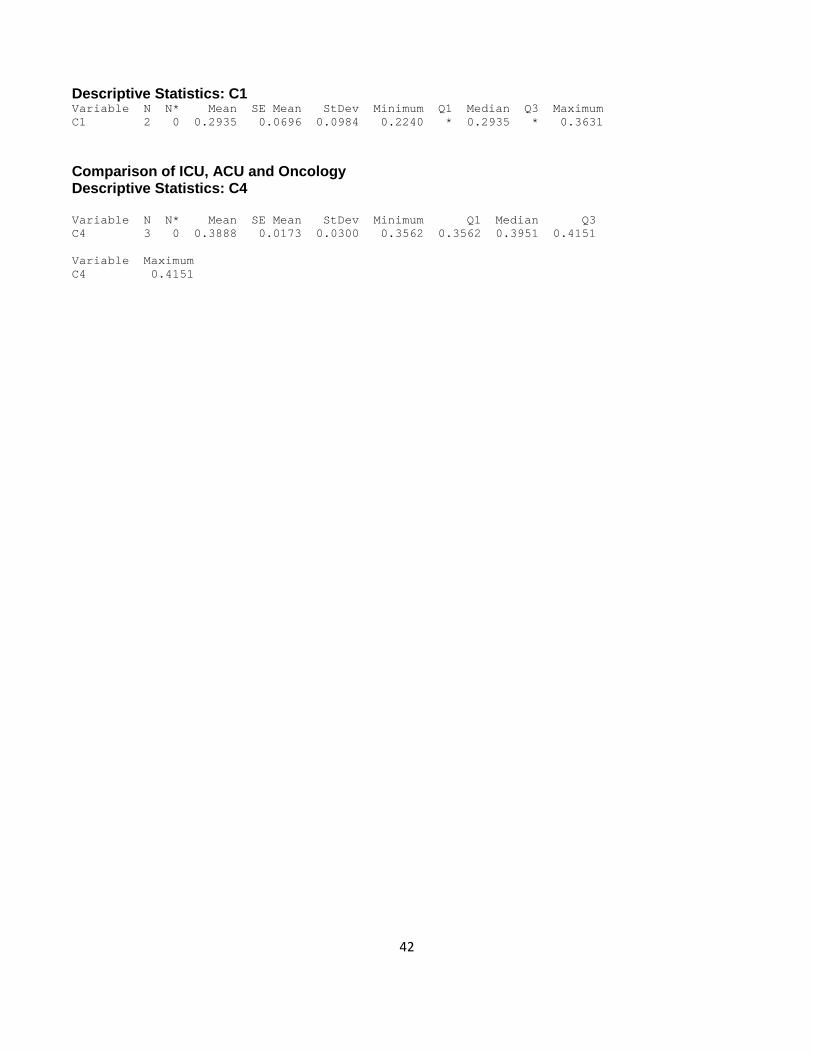
Unit Types: ICU, ACU and Oncology There are no comparisons within this section as unit type was not analyzed in the pre-study of the university hospital. Therefore, only information from this post-study is summarized in this section. In this section, the three unit types are compared to one another (Figure 19) and the medication tasks for each unit are broken down into as shown in the pareto charts (Figure 20, 21 and 22). In comparing the post-CareLink results for the three unit types, ICU, ACU and Oncology, there is marginal difference in the distribution of workload between medication and non-medication tasks (Figure 19). There is a 5.89% increase between the medication workload in ICU’s compared to the workload in ACU’s. Similarly, there is a 3.89% increase between the medication workload in ICU’s compared to the workload in Oncology. Finally, there is a 2.00% decrease between the medication workload in ACU’s compared to the workload in Oncology. Figure 19. Unit Type Overall Nursing Workload Breakdown IOE 481 Fall 2008_Team 1_Koordi_Tilak_Wardhana, N = 1704 Hours, 10/22/08 – 11/14/08
29
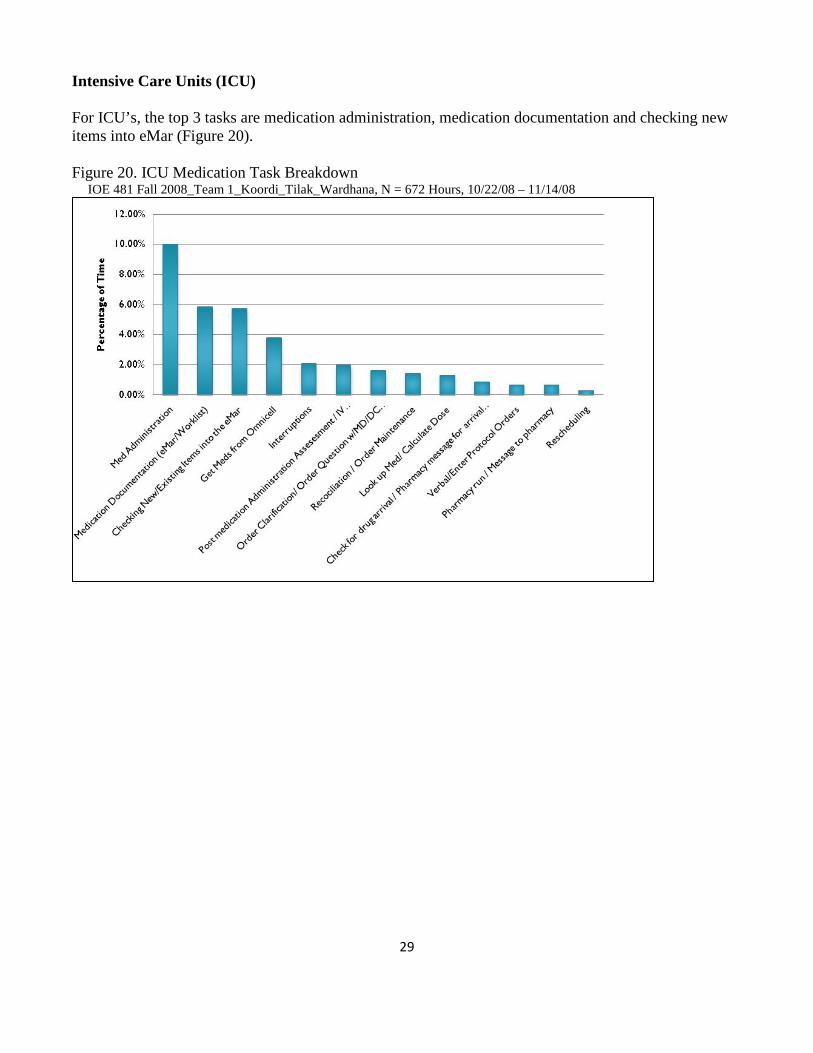
Intensive Care Units (ICU) For ICU’s, the top 3 tasks are medication administration, medication documentation and checking new items into eMar (Figure 20). Figure 20. ICU Medication Task Breakdown IOE 481 Fall 2008_Team 1_Koordi_Tilak_Wardhana, N = 672 Hours, 10/22/08 – 11/14/08
30
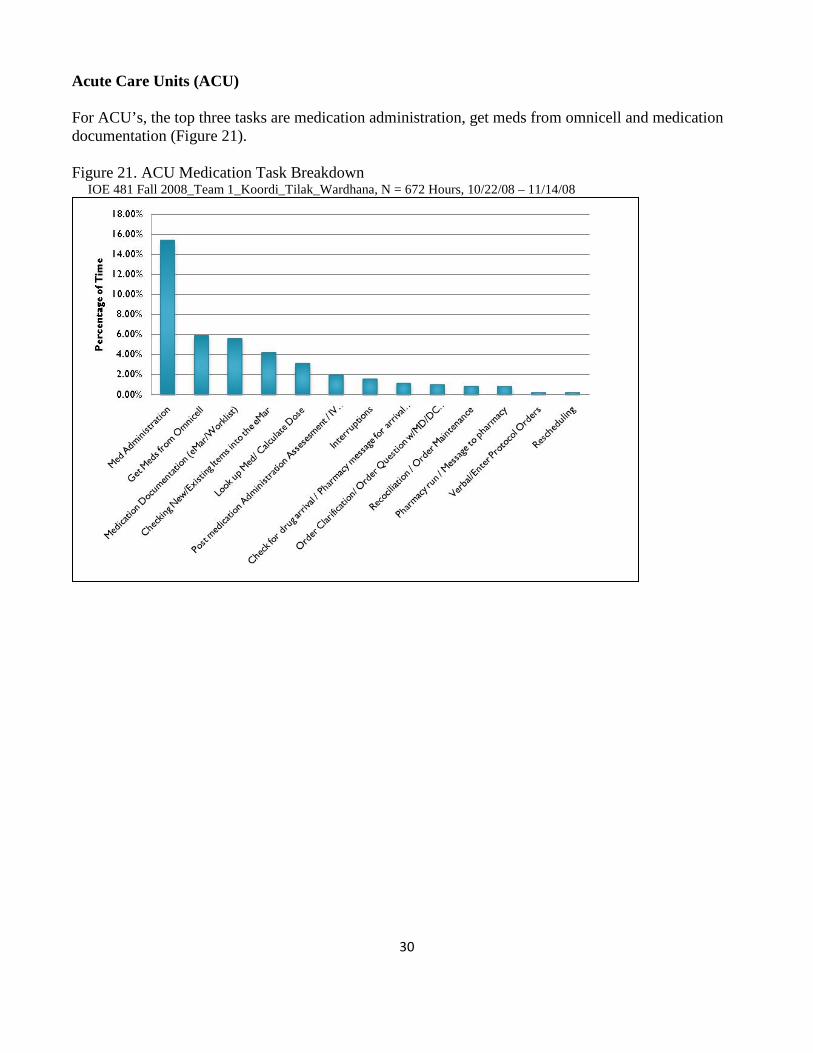
Acute Care Units (ACU) For ACU’s, the top three tasks are medication administration, get meds from omnicell and medication documentation (Figure 21). Figure 21. ACU Medication Task Breakdown IOE 481 Fall 2008_Team 1_Koordi_Tilak_Wardhana, N = 672 Hours, 10/22/08 – 11/14/08
31
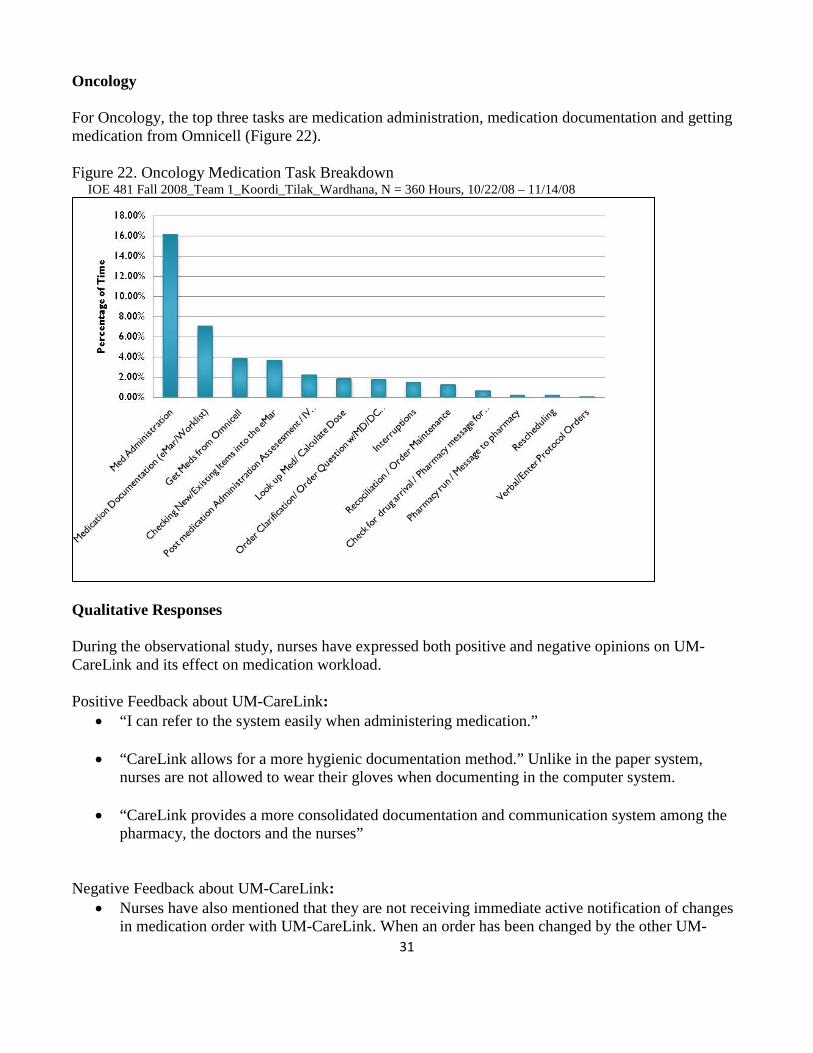
Oncology For Oncology, the top three tasks are medication administration, medication documentation and getting medication from Omnicell (Figure 22). Figure 22. Oncology Medication Task Breakdown IOE 481 Fall 2008_Team 1_Koordi_Tilak_Wardhana, N = 360 Hours, 10/22/08 – 11/14/08
Qualitative Responses During the observational study, nurses have expressed both positive and negative opinions on UM-CareLink and its effect on medication workload. Positive Feedback about UM-CareLink:
• “I can refer to the system easily when administering medication.”
• “CareLink allows for a more hygienic documentation method.” Unlike in the paper system, nurses are not allowed to wear their gloves when documenting in the computer system.
• “CareLink provides a more consolidated documentation and communication system among the
pharmacy, the doctors and the nurses” Negative Feedback about UM-CareLink:
• Nurses have also mentioned that they are not receiving immediate active notification of changes in medication order with UM-CareLink. When an order has been changed by the other UM-
32
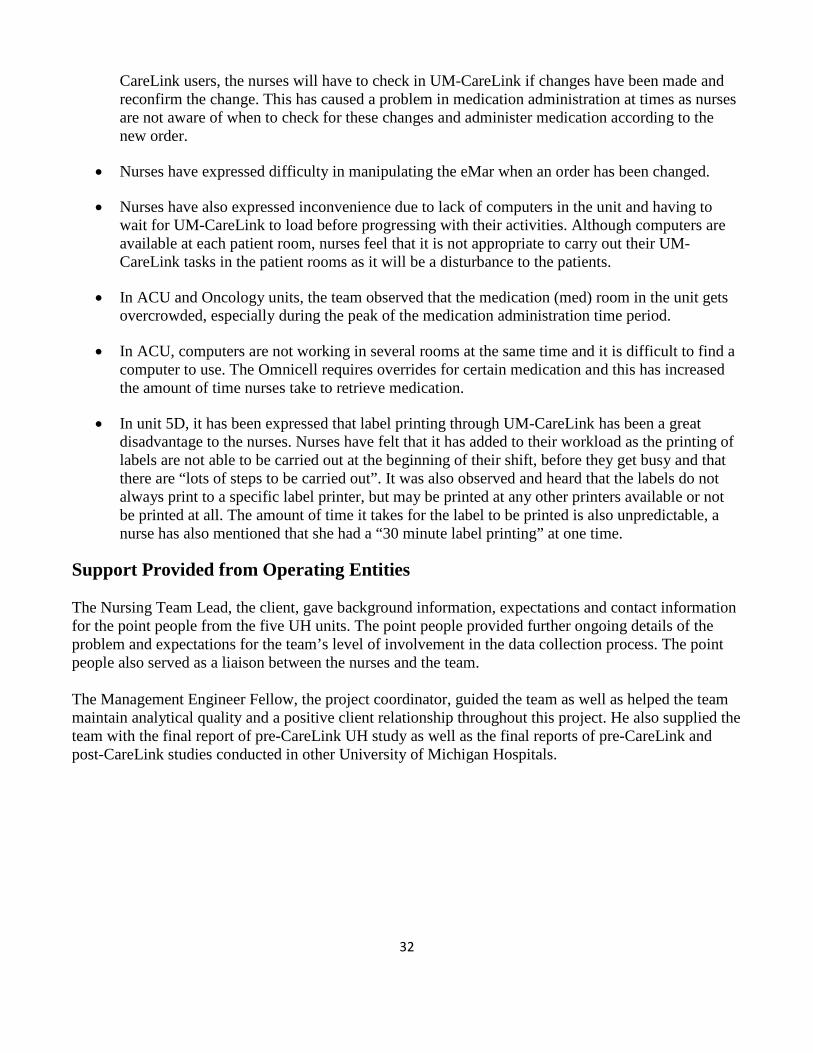
CareLink users, the nurses will have to check in UM-CareLink if changes have been made and reconfirm the change. This has caused a problem in medication administration at times as nurses are not aware of when to check for these changes and administer medication according to the new order.
• Nurses have expressed difficulty in manipulating the eMar when an order has been changed.
• Nurses have also expressed inconvenience due to lack of computers in the unit and having to wait for UM-CareLink to load before progressing with their activities. Although computers are available at each patient room, nurses feel that it is not appropriate to carry out their UM-CareLink tasks in the patient rooms as it will be a disturbance to the patients.
• In ACU and Oncology units, the team observed that the medication (med) room in the unit gets overcrowded, especially during the peak of the medication administration time period.
• In ACU, computers are not working in several rooms at the same time and it is difficult to find a computer to use. The Omnicell requires overrides for certain medication and this has increased the amount of time nurses take to retrieve medication.
• In unit 5D, it has been expressed that label printing through UM-CareLink has been a great disadvantage to the nurses. Nurses have felt that it has added to their workload as the printing of labels are not able to be carried out at the beginning of their shift, before they get busy and that there are “lots of steps to be carried out”. It was also observed and heard that the labels do not always print to a specific label printer, but may be printed at any other printers available or not be printed at all. The amount of time it takes for the label to be printed is also unpredictable, a nurse has also mentioned that she had a “30 minute label printing” at one time.
Support Provided from Operating Entities The Nursing Team Lead, the client, gave background information, expectations and contact information for the point people from the five UH units. The point people provided further ongoing details of the problem and expectations for the team’s level of involvement in the data collection process. The point people also served as a liaison between the nurses and the team. The Management Engineer Fellow, the project coordinator, guided the team as well as helped the team maintain analytical quality and a positive client relationship throughout this project. He also supplied the team with the final report of pre-CareLink UH study as well as the final reports of pre-CareLink and post-CareLink studies conducted in other University of Michigan Hospitals.
33
Team Hours Completed The project team logged a total of 450 person-hours (approximately 10 hours per week per team member) throughout the study. This was spent on various tasks including:
• Data collection through literature search, work sampling, and observational study • Meetings with client, coordinator, and nursing staff • Data analysis • Preparing and presenting reports
Summary The team collected nursing workload data using a work sampling study. Although the data showed individual differences between pre-CareLink and post-CareLink implementation for specific medication task time percentages, the overall outcome shows no statistically significant change. Informal interviews indicated a generally unenthusiastic response from the nursing staff regarding UM-CareLink’s effects on medication workload. The study proved, however, no significant change was measured in nursing medication workload after UM-CareLink implementation.
34
Appendix A: Literature Used Author information for the University Hospital Pre-Study was unavailable Analyzing Nursing Workload at C.S. Mott Children’s Hospital After UM-CareLink Implementation conducted in C.S. Mott Hospital, University of Michigan by: Stephanie Clarke, Christine Cubbin, Brett Milliman, and Tiger Li Appendix B: Beeper Study Data Collection Sheet
35
Da
te:
Shift
:Un
it &
Room
:Sh
ift S
tart
: AM
/PM
Occ
urre
nce
7:00
AM
8:00
AM
9:00
AM
10:0
0 AM
11:0
0 AM
12:0
0 PM
1:00
PM
2:00
PM
3:00
PM
4:00
PM
5:00
PM
6:00
PM
7:00
PM
Verb
al/E
nter
Pro
toco
l Ord
ers
Med
icat
ion
Docu
men
tatio
n (e
Mar
/Wor
klis
t)
Chec
king
NEW
Item
s to
the
eMar
Ord
er C
larif
icat
ion/
Ord
er Q
uest
ion
w/M
D/DC
reor
der
Look
Up
Med
/Cal
cula
te D
ose
Chec
k fo
r Dru
g Ar
rival
/Pha
rmac
y m
essa
ge fo
r arr
ival
of M
ed
Phar
mac
y Ru
n
Get M
eds
from
Om
nice
ll
Med
Adm
inis
trat
ion
Inte
rrup
tions
Post
Med
icat
ion
Adm
inis
trat
ion
Asse
ssm
ent/
IV C
heck
/Med
Dou
ble
Chec
k
Reco
ncili
atio
n
Resc
hedu
ling
Adm
issi
ons/
Disc
harg
e/Tr
ansf
er
Oth
er P
atie
nt R
elat
ed C
are/
Tran
spor
t
Non-
Med
Doc
umen
tatio
n
Staf
f Act
iviti
es
Brea
ks/M
eals
/Per
sona
l Tim
e
Patie
nt 1
:Pa
tient
4:
Com
men
ts:
# o
f Med
s:#
of M
eds:
Patie
nt 2
:Pa
tient
5:
# o
f Med
s:#
of M
eds:
Patie
nt 3
:Pa
tient
6:
# o
f Med
s:#
of M
eds:
Plea
se re
turn
com
plet
e sh
eets
to:
Non-Med ActivitiesMed Activities
Nur
sing
Tas
k Br
eakd
own
Beep
er S
tudy
Dat
a Co
llect
ion
Shee
tDa
te:
Shift
:Un
it &
Room
:Sh
ift S
tart
: AM
/PM
Occ
urre
nce
7:00
AM
8:00
AM
9:00
AM
10:0
0 AM
11:0
0 AM
12:0
0 PM
1:00
PM
2:00
PM
3:00
PM
4:00
PM
5:00
PM
6:00
PM
7:00
PM
Verb
al/E
nter
Pro
toco
l Ord
ers
Med
icat
ion
Docu
men
tatio
n (e
Mar
/Wor
klis
t)
Chec
king
NEW
Item
s to
the
eMar
Ord
er C
larif
icat
ion/
Ord
er Q
uest
ion
w/M
D/DC
reor
der
Look
Up
Med
/Cal
cula
te D
ose
Chec
k fo
r Dru
g Ar
rival
/Pha
rmac
y m
essa
ge fo
r arr
ival
of M
ed
Phar
mac
y Ru
n
Get M
eds
from
Om
nice
ll
Med
Adm
inis
trat
ion
Inte
rrup
tions
Post
Med
icat
ion
Adm
inis
trat
ion
Asse
ssm
ent/
IV C
heck
/Med
Dou
ble
Chec
k
Reco
ncili
atio
n
Resc
hedu
ling
Adm
issi
ons/
Disc
harg
e/Tr
ansf
er
Oth
er P
atie
nt R
elat
ed C
are/
Tran
spor
t
Non-
Med
Doc
umen
tatio
n
Staf
f Act
iviti
es
Brea
ks/M
eals
/Per
sona
l Tim
e
Patie
nt 1
:Pa
tient
4:
Com
men
ts:
# o
f Med
s:#
of M
eds:
Patie
nt 2
:Pa
tient
5:
# o
f Med
s:#
of M
eds:
Patie
nt 3
:Pa
tient
6:
# o
f Med
s:#
of M
eds:
Plea
se re
turn
com
plet
e sh
eets
to:
Non-Med ActivitiesMed Activities
Nur
sing
Tas
k Br
eakd
own
Beep
er S
tudy
Dat
a Co
llect
ion
Shee
t
Appendix C: Observational Study Data Collection Sheet
36
Tasks
Verb
al/E
nter
Pro
toco
l Ord
ers
Med
icat
ion
Docu
men
tatio
nCh
ecki
ng N
EW It
ems
to th
e eM
ar
Ord
er C
larif
icat
ion
Look
Up
Med
/Cal
cula
te D
ose
Chec
k fo
r Dru
g Ar
rival
Phar
mac
y Ru
nG
et M
eds
from
Om
nice
llM
ed A
dmin
istra
tion
Inte
rrup
tions
Post
Med
Adm
inis
tratio
n As
sess
men
t
Reco
ncili
atio
nRe
sche
dulin
gAd
mis
sion
s/Di
scha
rge/
Tran
sfer
Oth
er P
atie
nt R
elat
ed C
are/
Tran
spor
t
Non-
Med
Doc
umen
tatio
nSt
aff A
ctiv
ities
Brea
ks/M
eals
/Per
sona
l Tim
e
Med Activities Non-Med ActivitiesTime Interruptions / Wait Time Total Time
StartStopStartStopStartStopStartStopStartStopStartStopStartStopStartStopStartStopStartStopStartStopStartStopStartStopStartStopStartStopStartStopStartStopStartStopStartStopStartStopStartStopStartStop
Med Activities Non-Med Activities
1
2
3
4
5
6
7
8
9
10
11
12
13
22
18
19
20
21
14
15
16
17
Appendix D: 2-Proportion Test Results
37
Overall: No Significance Difference, Up 2.43% Test and CI for Two Proportions Sample X N Sample p 1 228 606 0.376238 2 548 1368 0.400585 Difference = p (1) - p (2) Estimate for difference: -0.0243472 95% CI for difference: (-0.0708438, 0.0221494) Test for difference = 0 (vs not = 0): Z = -1.03 P-Value = 0.305 Fisher's exact test: P-Value = 0.318 Descriptive Statistics: C1 Variable N N* Mean SE Mean StDev Minimum Q1 Median Q3 Maximum C1 2 0 0.3884 0.0122 0.0172 0.3762 * 0.3884 * 0.4006 5A: Significant Difference, Up 14.13% Test and CI for Two Proportions Sample X N Sample p 1 63 166 0.379518 2 175 336 0.520833 Difference = p (1) - p (2) Estimate for difference: -0.141315 95% CI for difference: (-0.232434, -0.0501962) Test for difference = 0 (vs not = 0): Z = -3.04 P-Value = 0.002 Fisher's exact test: P-Value = 0.003 Descriptive Statistics: C1 Variable N N* Mean SE Mean StDev Minimum Q1 Median Q3 Maximum C1 2 0 0.4502 0.0707 0.0999 0.3795 * 0.4502 * 0.5208 Unit 6C: No Significant Difference, Down 3.58% Test and CI for Two Proportions Sample X N Sample p 1 32 86 0.372093 2 113 336 0.336310 Difference = p (1) - p (2) Estimate for difference: 0.0357835 95% CI for difference: (-0.0781820, 0.149749) Test for difference = 0 (vs not = 0): Z = 0.62 P-Value = 0.538 Fisher's exact test: P-Value = 0.528 Descriptive Statistics: C2 Variable N N* Mean SE Mean StDev Minimum Q1 Median Q3 Maximum C2 2 0 0.3542 0.0179 0.0253 0.3363 * 0.3542 * 0.3721

38
Unit 6D: No significant Difference, Up 0.03% Test and CI for Two Proportions Sample X N Sample p 1 95 264 0.359848 2 121 336 0.360119 Difference = p (1) - p (2) Estimate for difference: -0.000270563 95% CI for difference: (-0.0776427, 0.0771016) Test for difference = 0 (vs not = 0): Z = -0.01 P-Value = 0.995 Fisher's exact test: P-Value = 1.000 Descriptive Statistics: C1 Variable N N* Mean SE Mean StDev Minimum Q1 Median Q3 Maximum C1 2 0 0.35998 0.000136 0.000192 0.35985 * 0.35998 * 0.36012 Unit 8B: Significant Difference, down 11.67% Test and CI for Two Proportions Sample X N Sample p 1 46 90 0.511111 2 142 360 0.394444 Difference = p (1) - p (2) Estimate for difference: 0.116667 95% CI for difference: (0.00171347, 0.231620) Test for difference = 0 (vs not = 0): Z = 1.99 P-Value = 0.047 Fisher's exact test: P-Value = 0.056 Descriptive Statistics: C1 Variable N N* Mean SE Mean StDev Minimum Q1 Median Q3 Maximum C1 2 0 0.4528 0.0583 0.0825 0.3944 * 0.4528 * 0.5111 Unit 5D: Significant Difference, up 10.80% Test and CI for Two Proportions Sample X N Sample p 1 195 792 0.246212 2 119 336 0.354167 Difference = p (1) - p (2) Estimate for difference: -0.107955 95% CI for difference: (-0.167244, -0.0486649) Test for difference = 0 (vs not = 0): Z = -3.57 P-Value = 0.000 Fisher's exact test: P-Value = 0.000 Descriptive Statistics: C2 Variable N N* Mean SE Mean StDev Minimum Q1 Median Q3 Maximum C2 2 0 0.3002 0.0540 0.0763 0.2462 * 0.3002 * 0.3542
39
Unit 5A Day Shift: Significant Difference, up 22.81% Test and CI for Two Proportions Sample X N Sample p 1 28 83 0.337349 2 95 168 0.565476 Difference = p (1) - p (2) Estimate for difference: -0.228127 95% CI for difference: (-0.354478, -0.101775) Test for difference = 0 (vs not = 0): Z = -3.54 P-Value = 0.000 Fisher's exact test: P-Value = 0.001 Descriptive Statistics: C1 Variable N N* Mean SE Mean StDev Minimum Q1 Median Q3 Maximum C1 2 0 0.451 0.114 0.161 0.337 * 0.451 * 0.565 Unit 5A Night Shift: No Significant Difference, up 5.45% Test and CI for Two Proportions Sample X N Sample p 1 35 83 0.421687 2 80 168 0.476190 Difference = p (1) - p (2) Estimate for difference: -0.0545037 95% CI for difference: (-0.184851, 0.0758431) Test for difference = 0 (vs not = 0): Z = -0.82 P-Value = 0.412 Fisher's exact test: P-Value = 0.423 Descriptive Statistics: C2 Variable N N* Mean SE Mean StDev Minimum Q1 Median Q3 Maximum C2 2 0 0.4489 0.0273 0.0385 0.4217 * 0.4489 * 0.4762 Unit 6C Day Shift: No Significant Difference, Up 3.81% Test and CI for Two Proportions Sample X N Sample p 1 15 43 0.348837 2 65 168 0.386905 Difference = p (1) - p (2) Estimate for difference: -0.0380676 95% CI for difference: (-0.198432, 0.122297) Test for difference = 0 (vs not = 0): Z = -0.47 P-Value = 0.642 Fisher's exact test: P-Value = 0.726 Descriptive Statistics: C1 Variable N N* Mean SE Mean StDev Minimum Q1 Median Q3 Maximum C1 2 0 0.3679 0.0190 0.0269 0.3488 * 0.3679 * 0.3869 Unit 6C Night Shift: No Significant Difference, Down 16.21% Test and CI for Two Proportions Sample X N Sample p 1 19 43 0.441860
40
2 47 168 0.279762 Difference = p (1) - p (2) Estimate for difference: 0.162099 95% CI for difference: (-0.00111738, 0.325314) Test for difference = 0 (vs not = 0): Z = 1.95 P-Value = 0.052 Fisher's exact test: P-Value = 0.045 Descriptive Statistics: C6 Variable N N* Mean SE Mean StDev Minimum Q1 Median Q3 Maximum C6 2 0 0.3608 0.0810 0.1146 0.2798 * 0.3608 * 0.4419 Unit 6D Day Shift: No Significant Difference, Down 0.32% Test and CI for Two Proportions Sample X N Sample p 1 46 132 0.348485 2 58 168 0.345238 Difference = p (1) - p (2) Estimate for difference: 0.00324675 95% CI for difference: (-0.105271, 0.111765) Test for difference = 0 (vs not = 0): Z = 0.06 P-Value = 0.953 Fisher's exact test: P-Value = 1.000 Descriptive Statistics: C1 Variable N N* Mean SE Mean StDev Minimum Q1 Median Q3 Maximum C1 2 0 0.34686 0.00162 0.00230 0.34524 * 0.34686 * 0.34848 Unit 6D Night Shift: No Significant Difference, Up 1.13% Test and CI for Two Proportions Sample X N Sample p 1 48 132 0.363636 2 63 168 0.375000 Difference = p (1) - p (2) Estimate for difference: -0.0113636 95% CI for difference: (-0.121334, 0.0986069) Test for difference = 0 (vs not = 0): Z = -0.20 P-Value = 0.840 Fisher's exact test: P-Value = 0.904 Descriptive Statistics: C2 Variable N N* Mean SE Mean StDev Minimum Q1 Median Q3 Maximum C2 2 0 0.36932 0.00568 0.00804 0.36364 * 0.36932 * 0.37500 Unit 8B Day Shift: No Significant Difference, Down 13.33% Test and CI for Two Proportions Sample X N Sample p 1 23 45 0.511111 2 68 180 0.377778
41
Difference = p (1) - p (2) Estimate for difference: 0.133333 95% CI for difference: (-0.0289857, 0.295652) Test for difference = 0 (vs not = 0): Z = 1.61 P-Value = 0.107 Fisher's exact test: P-Value = 0.127 Descriptive Statistics: C3 Variable N N* Mean SE Mean StDev Minimum Q1 Median Q3 Maximum C3 2 0 0.4444 0.0667 0.0943 0.3778 * 0.4444 * 0.5111 Unit 8B Night Shift: No Significant Difference, Down 11.11% Test and CI for Two Proportions Sample X N Sample p 1 23 45 0.511111 2 72 180 0.400000 Difference = p (1) - p (2) Estimate for difference: 0.111111 95% CI for difference: (-0.0515322, 0.273754) Test for difference = 0 (vs not = 0): Z = 1.34 P-Value = 0.181 Fisher's exact test: P-Value = 0.182 Descriptive Statistics: C4 Variable N N* Mean SE Mean StDev Minimum Q1 Median Q3 Maximum C4 2 0 0.4556 0.0556 0.0786 0.4000 * 0.4556 * 0.5111 Unit 5D Day Shift: No Significant Difference, Up 7.81% Test and CI for Two Proportions Sample X N Sample p 1 109 408 0.267157 2 58 168 0.345238 Difference = p (1) - p (2) Estimate for difference: -0.0780812 95% CI for difference: (-0.161820, 0.00565744) Test for difference = 0 (vs not = 0): Z = -1.83 P-Value = 0.068 Fisher's exact test: P-Value = 0.069 Descriptive Statistics: C1 Variable N N* Mean SE Mean StDev Minimum Q1 Median Q3 Maximum C1 2 0 0.3062 0.0390 0.0552 0.2672 * 0.3062 * 0.3452 Unit 5D Night Shift: Significant Difference, Up 13.91% Test and CI for Two Proportions Sample X N Sample p 1 86 384 0.223958 2 61 168 0.363095 Difference = p (1) - p (2) Estimate for difference: -0.139137 95% CI for difference: (-0.222961, -0.0553124) Test for difference = 0 (vs not = 0): Z = -3.25 P-Value = 0.001 Fisher's exact test: P-Value = 0.001
42
Descriptive Statistics: C1 Variable N N* Mean SE Mean StDev Minimum Q1 Median Q3 Maximum C1 2 0 0.2935 0.0696 0.0984 0.2240 * 0.2935 * 0.3631
Comparison of ICU, ACU and Oncology Descriptive Statistics: C4 Variable N N* Mean SE Mean StDev Minimum Q1 Median Q3 C4 3 0 0.3888 0.0173 0.0300 0.3562 0.3562 0.3951 0.4151 Variable Maximum C4 0.4151