Embed Size (px)
Citation preview
GE Capital
Investor Meeting
December 8, 2009"Results are preliminary and unaudited. This document contains “forward-looking statements”- that is, statements related to future, not past, events. In this context, forward-looking statements often address our expected future business and financial performance and financial condition, and often contain words such as “expect,” “anticipate,” “intend,” “plan,” “believe,”“seek,” “see,” or “will.” Forward-looking statements by their nature address matters that are, to different degrees, uncertain. For us, particular uncertainties that could cause our actual results to be materially different than those expressed in our forward-looking statements include: the severity and duration of current economic and financial conditions, including volatility in interest and exchange rates, commodity and equity prices and the value of financial assets; the impact of U.S. and foreign government programs to restore liquidity and stimulate national and global economies; the impact of conditions in the financial and credit markets on the availability and cost of GE Capital’s funding and on our ability to reduce GE Capital’s asset levels as planned; the impact of conditions in the housing market and unemployment rates on the level of commercial and consumer credit defaults; our ability to maintain our current credit rating and the impact on our funding costs and competitive position if we do not do so; the soundness of other financial institutions with which GE Capital does business; the adequacy of our cash flow and earnings and other conditions which may affect our ability to maintain our quarterly dividend at the current level; the level of demand and financial performance of the major industries we serve, including, without limitation, air and rail transportation, energy generation, network television, real estate and healthcare; the impact of regulation and regulatory, investigative and legal proceedings and legal compliance risks, including the impact of proposed financial services regulation; strategic actions, including acquisitions and dispositions and our success in integrating acquired businesses; and numerous other matters of national, regional and global scale, including those of a political, economic, business and competitive nature. These uncertainties may cause our actual future results to be materially different than those expressed in our forward-looking statements. We do not undertake to update our forward-looking statements.”
“This document may also contain non-GAAP financial information. Management uses this information in its internal analysis of results and believes that this information may be informative to investors in gauging the quality of our financial performance, identifying trends in our results and providing meaningful period-to-period comparisons. For a reconciliation of non-GAAP measures presented in this document, see the accompanying supplemental information posted to the investor relations section of our website at www.ge.com.”
“In this document, “GE Capital” refers to GE Capital Finance, unless otherwise noted. “GE” refers to the Industrial businesses of the Company including GECS on an equity basis. “GE (ex. GECS)” and/or “Industrial” refer to GE excluding Financial Services.”
CFPA1478 Security Analysts_December 2009_TUES a.m. 2
Key messagesGE Capital has a strong and advantaged business model
Cautiously optimistic about the form and implications of regulatory reform
GE Capital’s long-term debt plan is fully funded through 2010. Cost of funds have significantly improved; liquidity position has strengthened
Balance sheet reduced by ~$40B 3Q’09 YTD … well ahead of plan
Real Estate risk is manageable within our framework
Expect losses and impairments to peak in 2010
Margins are improving
Earnings ~flat in 2010, should improve in 2011+
11
22
33
44
66
55
77
88
CFPA1478 Security Analysts_December 2009_TUES a.m. 3
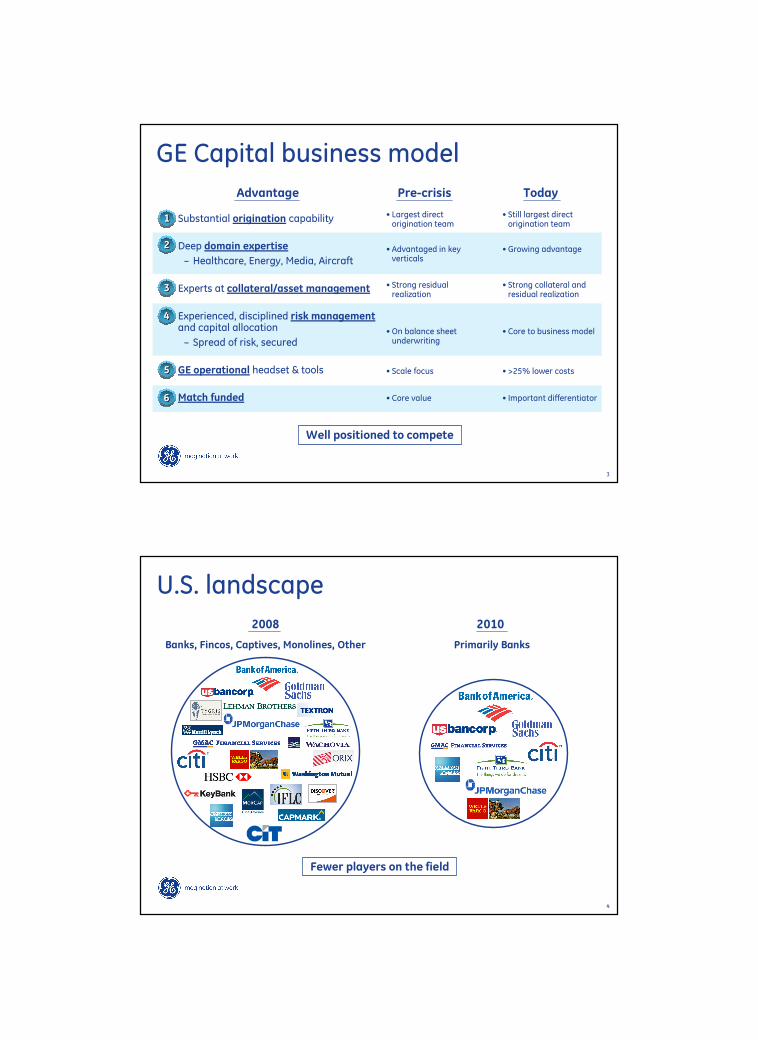
GE Capital business model
Pre-crisis
• Substantial origination capability
• Deep domain expertise
– Healthcare, Energy, Media, Aircraft
• Experts at collateral/asset management
• Experienced, disciplined risk managementand capital allocation
– Spread of risk, secured
• GE operational headset & tools
• Match funded
Today
• Largest direct origination team
Well positioned to compete
• Still largest direct origination team
• Advantaged in key verticals
• Growing advantage
• Strong residual realization
• Strong collateral and residual realization
• On balance sheet underwriting
• Core to business model
• Scale focus • >25% lower costs
• Core value • Important differentiator
Advantage
11
22
33
44
66
55
CFPA1478 Security Analysts_December 2009_TUES a.m. 4
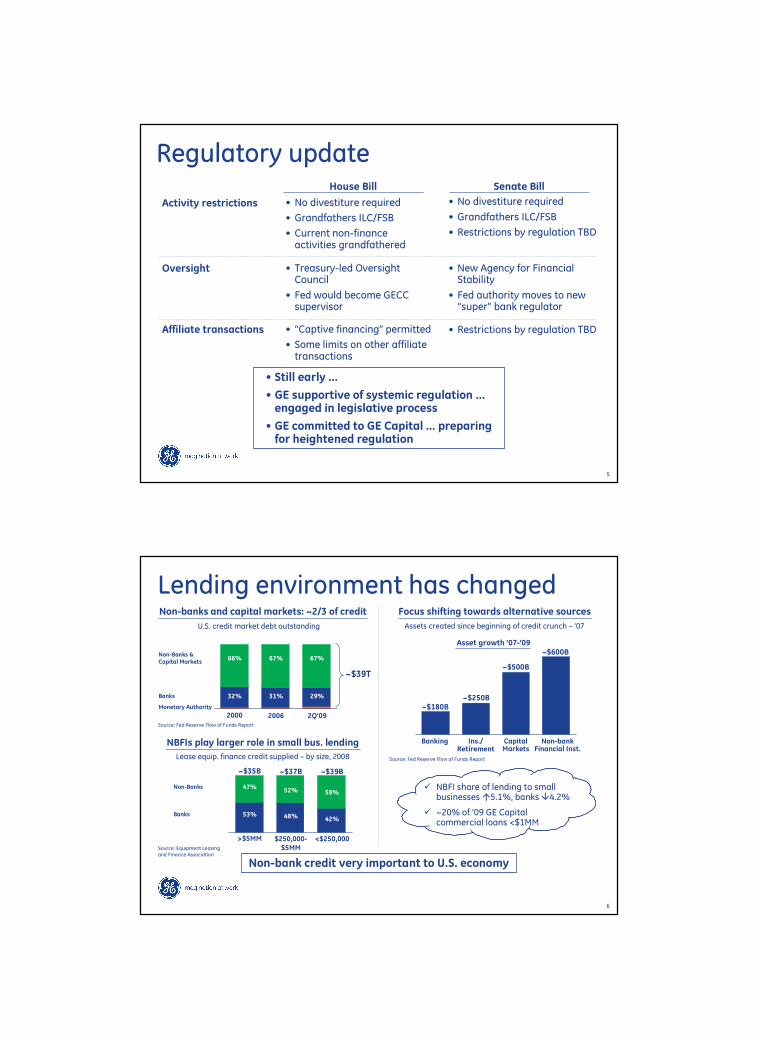
U.S. landscape
2008 2010
Banks, Fincos, Captives, Monolines, Other Primarily Banks
Fewer players on the field
CFPA1478 Security Analysts_December 2009_TUES a.m. 5
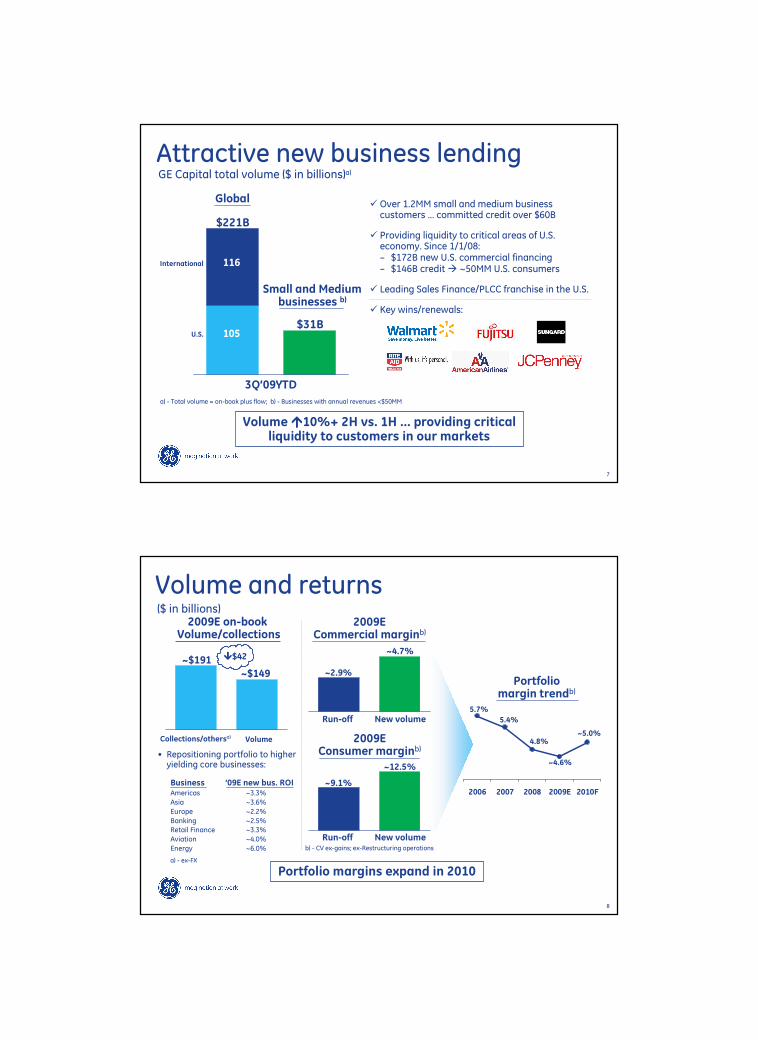
Regulatory updateSenate BillHouse Bill
• New Agency for Financial Stability
• Fed authority moves to new “super” bank regulator
• Treasury-led Oversight Council
• Fed would become GECC supervisor
• Still early …
• GE supportive of systemic regulation … engaged in legislative process
• GE committed to GE Capital … preparing for heightened regulation
Oversight
• “Captive financing” permitted
• Some limits on other affiliate transactions
• No divestiture required
• Grandfathers ILC/FSB
• Current non-finance activities grandfathered
Activity restrictions
Affiliate transactions
• No divestiture required
• Grandfathers ILC/FSB
• Restrictions by regulation TBD
• Restrictions by regulation TBD
CFPA1478 Security Analysts_December 2009_TUES a.m. 6
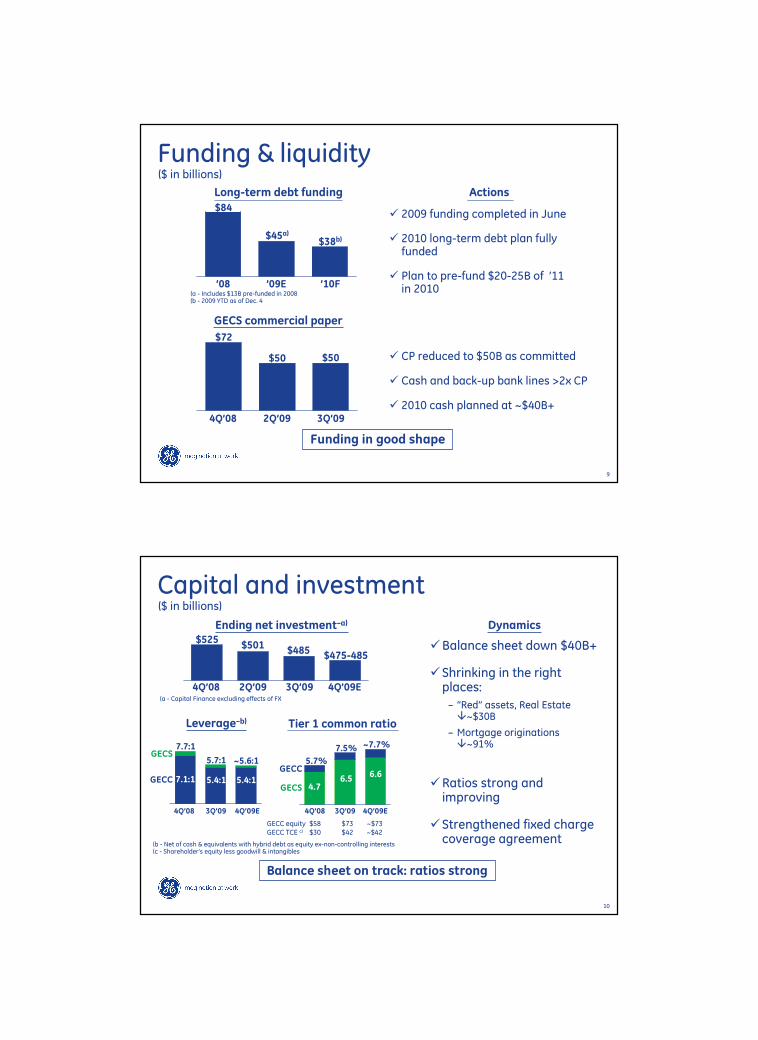
Asset growth ’07-’09
~$180B~$250B
~$500B
~$600B
Lending environment has changedNon-banks and capital markets: ~2/3 of credit Focus shifting towards alternative sources
Assets created since beginning of credit crunch – ’07
Non-bank credit very important to U.S. economy
U.S. credit market debt outstanding
Source: Equipment Leasingand Finance Association
� NBFI share of lending to small businesses �5.1%, banks �4.2%
� ~20% of ’09 GE Capital commercial loans <$1MM
Non-Banks & Capital Markets
~$39T
29%
67%
32%
66%
Banks
Non-Banks
Banks
Source: Fed Reserve Flow of Funds Report
Source: Fed Reserve Flow of Funds Report
31%
67%
Monetary Authority
NBFIs play larger role in small bus. lending
Lease equip. finance credit supplied – by size, 2008
Banking Ins./Retirement
CapitalMarkets
Non-bankFinancial Inst.
2000 2Q’092006
>$5MM <$250,000$250,000-$5MM
~$35B ~$39B
42%
58%
53%
47%
~$37B
48%
52%
CFPA1478 Security Analysts_December 2009_TUES a.m. 7
� Over 1.2MM small and medium business customers … committed credit over $60B
� Providing liquidity to critical areas of U.S. economy. Since 1/1/08:– $172B new U.S. commercial financing– $146B credit � ~50MM U.S. consumers
� Leading Sales Finance/PLCC franchise in the U.S.
� Key wins/renewals:
Attractive new business lending
Volume ����10%+ 2H vs. 1H … providing criticalliquidity to customers in our markets
$221B
Global
$31B
Small and Mediumbusinesses b)
3Q’09YTD
International
U.S.
116
105
a) - Total volume = on-book plus flow; b) - Businesses with annual revenues <$50MM
GE Capital total volume ($ in billions)a)
CFPA1478 Security Analysts_December 2009_TUES a.m. 8
Volume and returns($ in billions)
2009EConsumer marginb)
Run-off New volume
~9.1%
~12.5%
2009ECommercial marginb)
Run-off New volume
~2.9%
~4.7%
b) - CV ex-gains; ex-Restructuring operations
2006 2007 2008 2009E 2010F
Portfoliomargin trendb)
5.7%
5.4%
4.8%
~4.6%
~5.0%
Portfolio margins expand in 2010
2009E on-book Volume/collections
• Repositioning portfolio to higher yielding core businesses:
Business ’09E new bus. ROIAmericas ~3.3%
Asia ~3.6%
Europe ~2.2%
Banking ~2.5%
Retail Finance ~3.3%
Aviation ~4.0%
Energy ~6.0%
~$191
~$149
VolumeCollections/othersa)
����$42
a) - ex-FX
CFPA1478 Security Analysts_December 2009_TUES a.m. 9
Funding & liquidity
GECS commercial paper
$72
$50 $50
Long-term debt funding
$84
$45a)$38b)
(a - Includes $13B pre-funded in 2008(b - 2009 YTD as of Dec. 4
($ in billions)
’08 ’09E ’10F
4Q’08 2Q’09 3Q’09
Funding in good shape
� 2009 funding completed in June
� 2010 long-term debt plan fully funded
� Plan to pre-fund $20-25B of ’11in 2010
� CP reduced to $50B as committed
� Cash and back-up bank lines >2x CP
� 2010 cash planned at ~$40B+
Actions
CFPA1478 Security Analysts_December 2009_TUES a.m. 10
Capital and investment
Tier 1 common ratio
5.7%
7.5%
4.76.5GECC
GECS
Ending net investment–a)
$525$501
$485
($ in billions)
$475-485
Balance sheet on track: ratios strong
GECC equity $58 $73 ~$73GECC TCE c) $30 $42 ~$42
4Q’08 3Q’09
4Q’08 2Q’09 3Q’09 4Q’09E
Leverage–b)
7.7:1
5.7:1
7.1:1 5.4:1
4Q’08 3Q’09
(a - Capital Finance excluding effects of FX
�Balance sheet down $40B+
�Shrinking in the right places:
– “Red” assets, Real Estate �~$30B
– Mortgage originations �~91%
(b - Net of cash & equivalents with hybrid debt as equity ex-non-controlling interests(c - Shareholder’s equity less goodwill & intangibles
4Q’09E 4Q’09E
~5.6:1
~7.7%
6.65.4:1 �Ratios strong and
improving
�Strengthened fixed charge coverage agreement
Dynamics
GECC
GECS
CFPA1478 Security Analysts_December 2009_TUES a.m. 11
~Base case
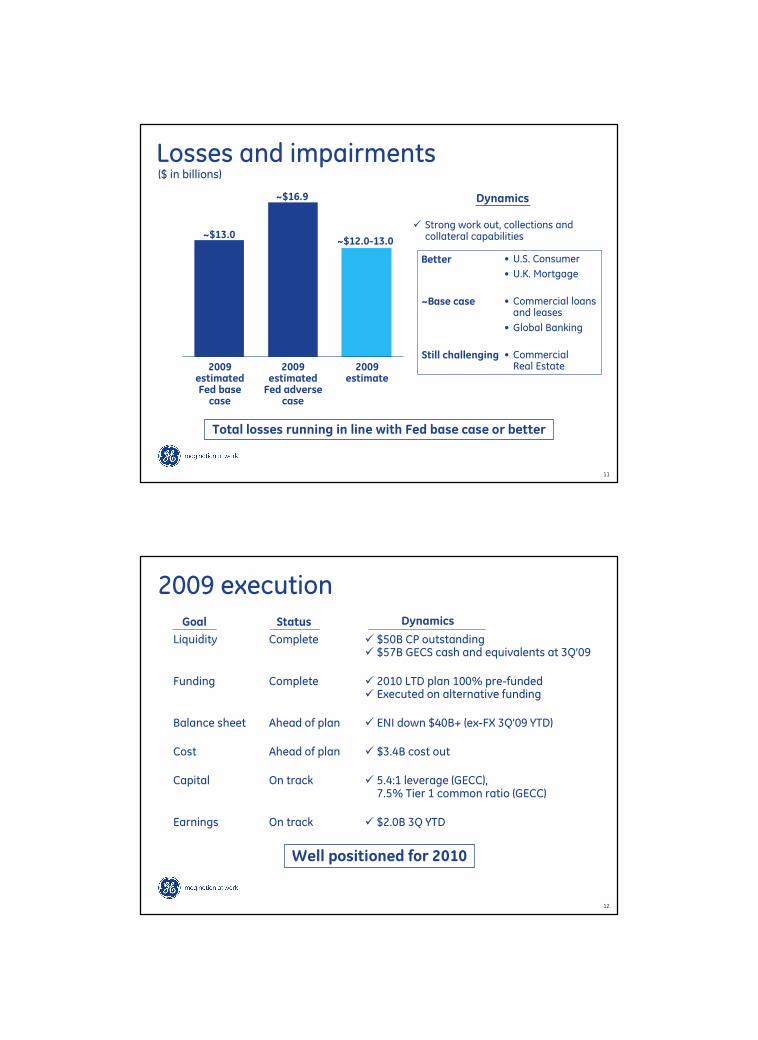
Losses and impairments($ in billions)
Dynamics
� Strong work out, collections and collateral capabilities
Total losses running in line with Fed base case or better
~$16.9
2009estimatedFed adverse
case
2009estimate
2009estimatedFed basecase
~$13.0~$12.0-13.0
Better
Still challenging
• U.S. Consumer
• U.K. Mortgage
• Commercial loansand leases
• Global Banking
• CommercialReal Estate
CFPA1478 Security Analysts_December 2009_TUES a.m. 12
2009 executionStatus
Liquidity Complete � $50B CP outstanding� $57B GECS cash and equivalents at 3Q’09
Funding Complete � 2010 LTD plan 100% pre-funded� Executed on alternative funding
Balance sheet Ahead of plan � ENI down $40B+ (ex-FX 3Q’09 YTD)
Cost Ahead of plan � $3.4B cost out
Capital On track � 5.4:1 leverage (GECC),� 7.5% Tier 1 common ratio (GECC)
Earnings On track � $2.0B 3Q YTD
Well positioned for 2010
Goal Dynamics
CFPA1478 Security Analysts_December 2009_TUES a.m. 13
Agenda
Funding & Liquidity Kathy Cassidy – Treasurer
Financial Update Jeff Bornstein – CFO
Portfolio Update Jim Colica – CRO
Real Estate Ron Pressman – Real Estate CEO
CLL Americas Dan Henson – CLL Americas CEO
Operations Update Bill Cary – COO
Summary Mike Neal
Q&A
CFPA1478 Security Analysts_December 2009_TUES a.m. 14
Funding & Liquidity
CFPA1478 Security Analysts_December 2009_TUES a.m. 15
4Q'08 4Q'09E 4Q'10F
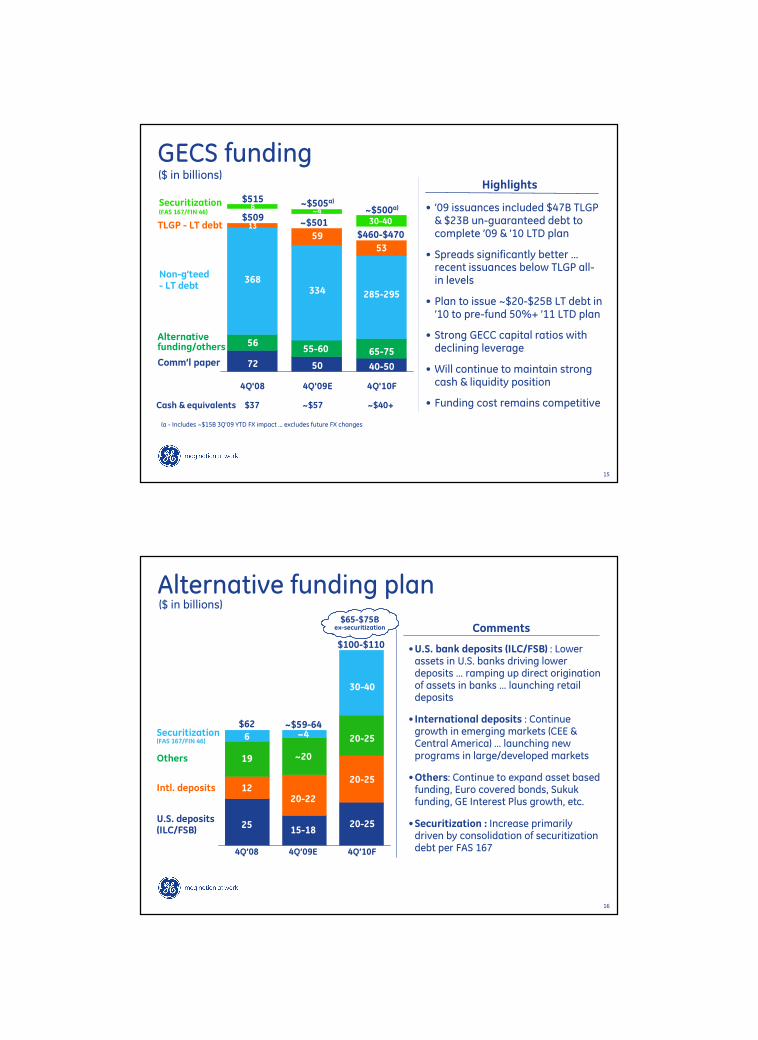
GECS funding($ in billions)
Cash & equivalents $37 ~$57 ~$40+
Comm’l paper
Alternative funding/others
Non-g’teed- LT debt
Securitization(FAS 167/FIN 46)
~$505a)~4
50
55-60
334
$5156
72
56
368
~$500a)
30-40
40-50
65-75
285-295
13
5953
TLGP - LT debt
• ’09 issuances included $47B TLGP & $23B un-guaranteed debt to complete ’09 & ’10 LTD plan
• Spreads significantly better … recent issuances below TLGP all-in levels
• Plan to issue ~$20-$25B LT debt in ’10 to pre-fund 50%+ ’11 LTD plan
• Strong GECC capital ratios with declining leverage
• Will continue to maintain strong cash & liquidity position
• Funding cost remains competitive
Highlights
(a - Includes ~$15B 3Q’09 YTD FX impact … excludes future FX changes
~$501$509
$460-$470
CFPA1478 Security Analysts_December 2009_TUES a.m. 16
Alternative funding plan($ in billions)
Intl. deposits 1220-22
19 ~20
$62 ~$59-64
15-18
Securitization (FAS 167/FIN 46)
6 ~4
•U.S. bank deposits (ILC/FSB) : Lower assets in U.S. banks driving lower deposits … ramping up direct origination of assets in banks … launching retail deposits
• International deposits : Continue growth in emerging markets (CEE & Central America) … launching new programs in large/developed markets
•Others: Continue to expand asset based funding, Euro covered bonds, Sukukfunding, GE Interest Plus growth, etc.
•Securitization : Increase primarily driven by consolidation of securitization debt per FAS 167
Comments
4Q’08 4Q’09E
$100-$110
20-25
30-40
20-25
20-25
4Q’10F
25U.S. deposits(ILC/FSB)
Others
$65-$75Bex-securitization
CFPA1478 Security Analysts_December 2009_TUES a.m. 17
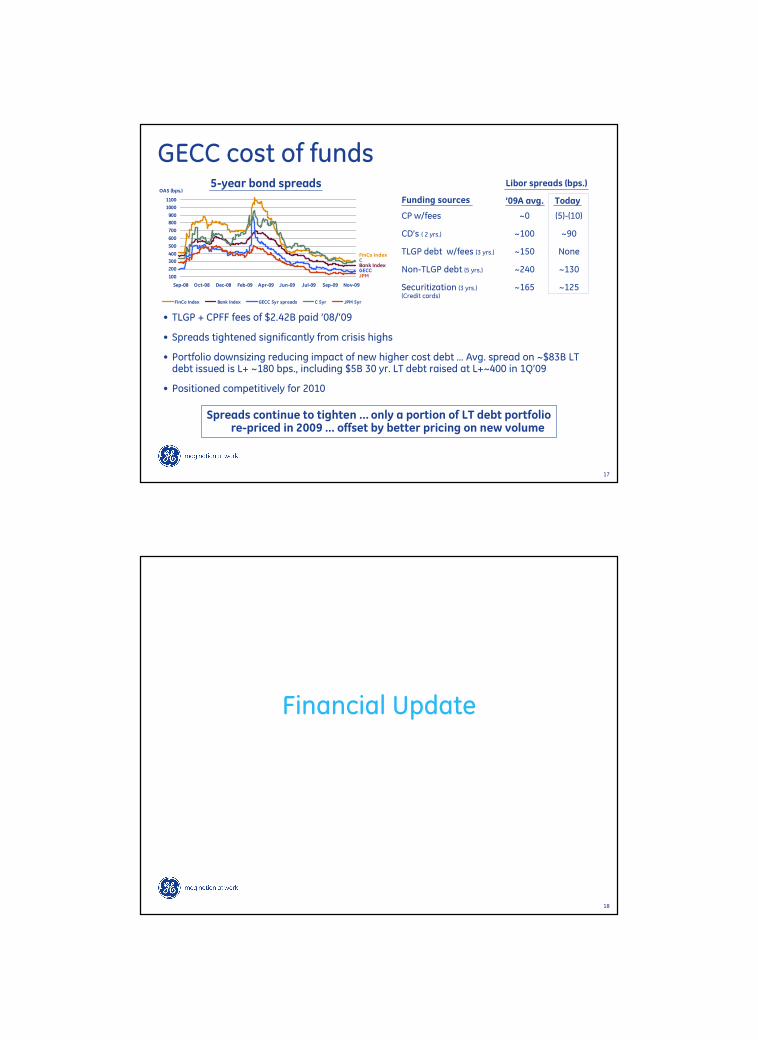
GECC cost of funds
• TLGP + CPFF fees of $2.42B paid ’08/’09
• Spreads tightened significantly from crisis highs
• Portfolio downsizing reducing impact of new higher cost debt … Avg. spread on ~$83B LT debt issued is L+ ~180 bps., including $5B 30 yr. LT debt raised at L+~400 in 1Q’09
• Positioned competitively for 2010
Spreads continue to tighten ... only a portion of LT debt portfolio re-priced in 2009 … offset by better pricing on new volume
Funding sources Today
CP w/fees ~0 (5)-(10)
CD’s ( 2 yrs.) ~100 ~90
TLGP debt w/fees (3 yrs.) ~150 None
Non-TLGP debt (5 yrs.) ~240 ~130
Securitization (3 yrs.) ~165 ~125(Credit cards)
Libor spreads (bps.)
’09A avg.
5-year bond spreads
100
200
300
400
500
600
700
800
900
1000
1100
Sep-08 Oct-08 Dec-08 Feb-09 Apr-09 Jun-09 Jul-09 Sep-09 Nov-09
OAS (bps.)
FinCo Index Bank Index GECC 5yr spreads C 5yr JPM 5yr
FinCo IndexCBank IndexGECCJPM
CFPA1478 Security Analysts_December 2009_TUES a.m. 18
Financial Update
CFPA1478 Security Analysts_December 2009_TUES a.m. 19
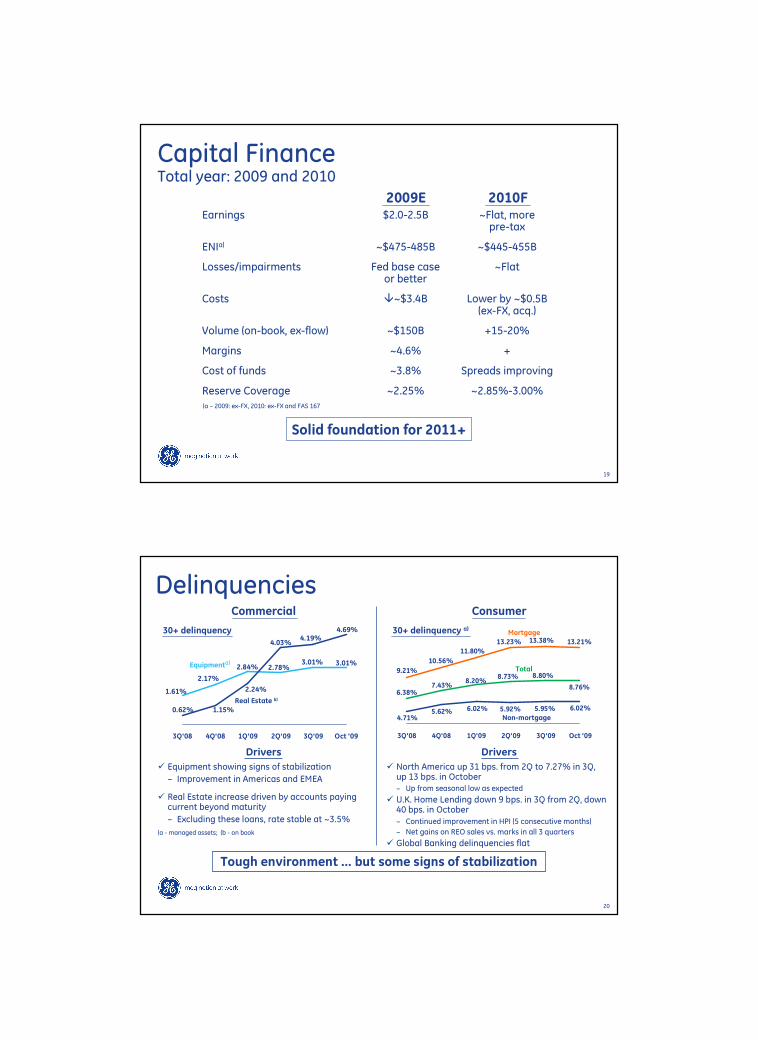
Capital FinanceTotal year: 2009 and 2010
Solid foundation for 2011+
Earnings $2.0-2.5B ~Flat, morepre-tax
ENIa) ~$475-485B ~$445-455B
Losses/impairments Fed base case ~Flator better
Costs �~$3.4B Lower by ~$0.5B(ex-FX, acq.)
Volume (on-book, ex-flow) ~$150B +15-20%
Margins ~4.6% +
Cost of funds ~3.8% Spreads improving
Reserve Coverage ~2.25% ~2.85%-3.00%
2009E 2010F
(a – 2009: ex-FX, 2010: ex-FX and FAS 167
CFPA1478 Security Analysts_December 2009_TUES a.m. 20
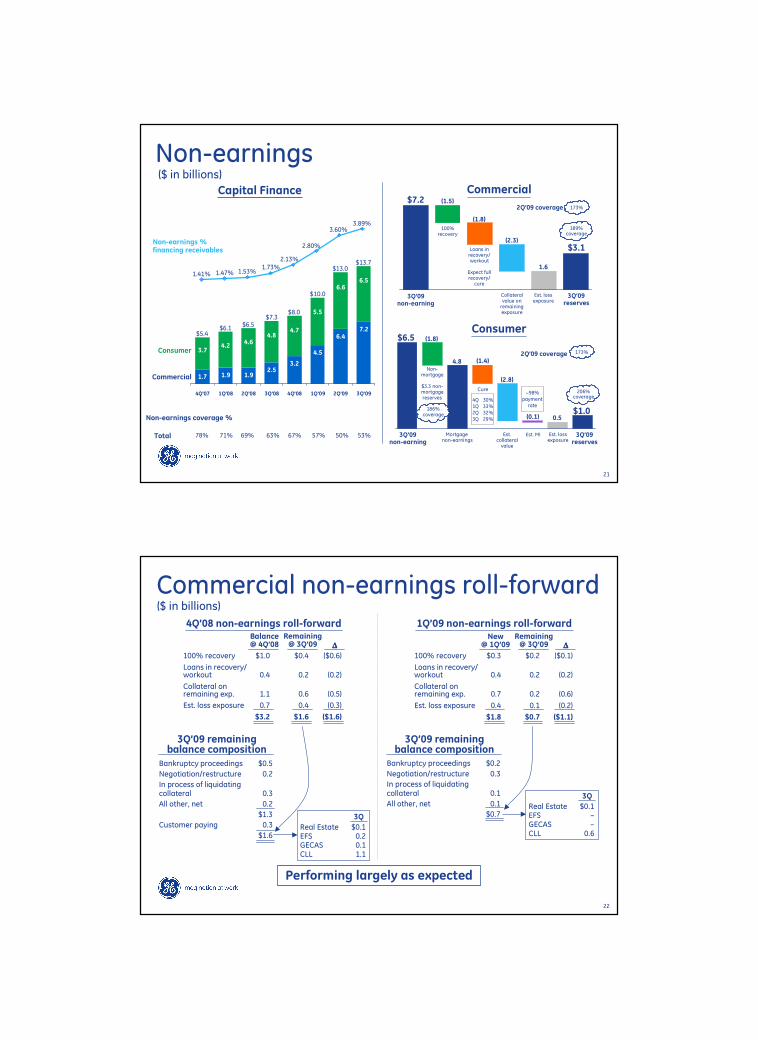
3.01%2.78%
1.61%
3.01%2.84%
2.17%
4.03%
2.24%
1.15%0.62%
4.69%4.19%
3Q'08 4Q'08 1Q'09 2Q'09 3Q'09 Oct '09
Commercial Consumer
6.02%5.95%5.92%6.02%
4.71%5.62%
8.76%
8.73%8.20%
7.43%6.38%
8.80%9.21%
13.21%
11.80%
10.56%
13.23% 13.38%
3Q'08 4Q'08 1Q'09 2Q'09 3Q'09 Oct '09
� North America up 31 bps. from 2Q to 7.27% in 3Q,up 13 bps. in October‒ Up from seasonal low as expected
� U.K. Home Lending down 9 bps. in 3Q from 2Q, down 40 bps. in October
‒ Continued improvement in HPI (5 consecutive months)
‒ Net gains on REO sales vs. marks in all 3 quarters
� Global Banking delinquencies flat
Total
Non-mortgage
� Equipment showing signs of stabilization
– Improvement in Americas and EMEA
� Real Estate increase driven by accounts paying current beyond maturity
– Excluding these loans, rate stable at ~3.5%
Drivers
Mortgage
Drivers
30+ delinquency a)
Tough environment … but some signs of stabilization
(a - managed assets; (b - on book
Delinquencies
30+ delinquency
Equipmenta)
Real Estate b)
CFPA1478 Security Analysts_December 2009_TUES a.m. 21
Non-earningsCapital Finance
4Q'07 1Q'08 2Q'08 3Q'08 4Q'08 1Q'09 2Q'09 3Q'09
$13.01.47%
3.60%
Non-earnings %financing receivables
2.80%
1.41%
Consumer
Commercial
Total
2.13%1.73%
1.53%
$10.0
$8.0$7.3
$6.5$6.1
$5.4
50%57%67%63%69%71%78%
6.4
4.5
3.22.5
1.91.91.7
6.6
5.5
4.74.8
4.64.2
3.7
Non-earnings coverage %
3.89%
$13.7
7.2
6.5
53%
($ in billions)
3Q’09non-earning
3Q’09reserves
Collateralvalue onremainingexposure
Loans inrecovery/workout
Expect fullrecovery/
cure
100%recovery
$7.2
$3.1
(1.5)
(1.8)
(2.3)
1.6
Est. lossexposure
Commercial
189%coverage
173%2Q’09 coverage
3Q’09non-earning
3Q’09reserves
Consumer
Est. MIEst.collateralvalue
Mortgage non-earnings
Non-mortgage
$3.3 non-mortgagereserves
$6.5
186%coverage
(1.8)
4.8
(0.1)$1.0
(2.8)
0.5
Cure
(1.4)
Est. lossexposure
206%coverage
173%2Q’09 coverage
4Q 30%1Q 33%2Q 32%3Q 29%
~98%paymentrate
CFPA1478 Security Analysts_December 2009_TUES a.m. 22
Commercial non-earnings roll-forward($ in billions)
100% recovery $1.0 $0.4 ($0.6)
Loans in recovery/workout 0.4 0.2 (0.2)
Collateral onremaining exp. 1.1 0.6 (0.5)
Est. loss exposure 0.7 0.4 (0.3)
$3.2 $1.6 ($1.6)
Balance@ 4Q’08
Remaining@ 3Q’09 ∆∆∆∆
4Q’08 non-earnings roll-forward
Bankruptcy proceedings $0.5
Negotiation/restructure 0.2
In process of liquidatingcollateral 0.3
All other, net 0.2
$1.3
Customer paying 0.3
$1.6
3Q’09 remainingbalance composition
Real Estate $0.1EFS 0.2GECAS 0.1CLL 1.1
3Q
1Q’09 non-earnings roll-forward
100% recovery $0.3 $0.2 ($0.1)
Loans in recovery/workout 0.4 0.2 (0.2)
Collateral onremaining exp. 0.7 0.2 (0.6)
Est. loss exposure 0.4 0.1 (0.2)
$1.8 $0.7 ($1.1)
New@ 1Q’09
Remaining@ 3Q’09 ∆∆∆∆
Bankruptcy proceedings $0.2
Negotiation/restructure 0.3
In process of liquidatingcollateral 0.1
All other, net 0.1
$0.7
3Q’09 remainingbalance composition
Real Estate $0.1EFS –GECAS –CLL 0.6
3Q
Performing largely as expected
CFPA1478 Security Analysts_December 2009_TUES a.m. 23
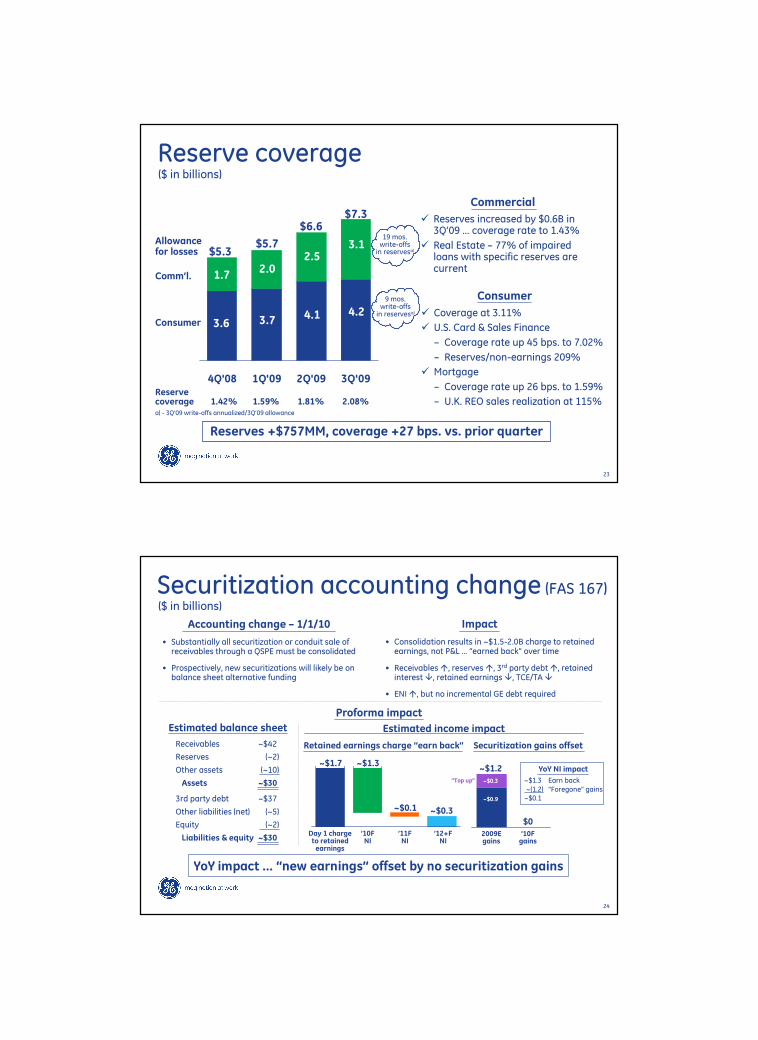
4Q'08 1Q'09 2Q'09 3Q'09
Reserve coverage($ in billions)
$5.3$5.7
$6.6Allowancefor losses
Reservecoverage 1.42% 1.59% 1.81% 2.08%a) - 3Q’09 write-offs annualized/3Q’09 allowance
Consumer
� Coverage at 3.11%
� U.S. Card & Sales Finance
– Coverage rate up 45 bps. to 7.02%
– Reserves/non-earnings 209%
� Mortgage
– Coverage rate up 26 bps. to 1.59%
– U.K. REO sales realization at 115%
� Reserves increased by $0.6B in 3Q’09 … coverage rate to 1.43%
� Real Estate – 77% of impaired loans with specific reserves are current
Commercial
Reserves +$757MM, coverage +27 bps. vs. prior quarter
Comm’l.
Consumer 3.6
1.7
3.7
2.0
4.1
2.5
$7.3
4.2
3.119 mos.write-offsin reservesa)
9 mos.write-offsin reservesa)
CFPA1478 Security Analysts_December 2009_TUES a.m. 24
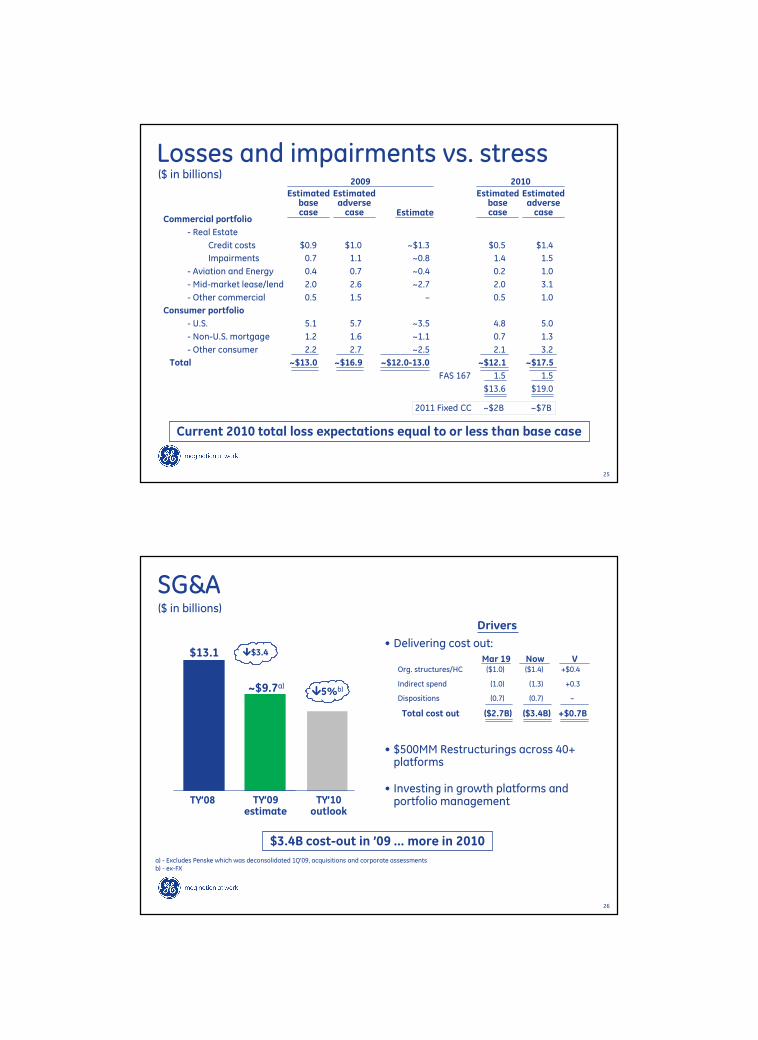
Securitization accounting change (FAS 167)
Accounting change – 1/1/10 Impact
• Substantially all securitization or conduit sale of receivables through a QSPE must be consolidated
• Prospectively, new securitizations will likely be on balance sheet alternative funding
• Consolidation results in ~$1.5-2.0B charge to retained earnings, not P&L … “earned back” over time
• Receivables �, reserves �, 3rd party debt �, retained interest �, retained earnings �, TCE/TA �
• ENI �, but no incremental GE debt required
Receivables ~$42
Reserves (~2)
Other assets (~10)
Assets ~$30
3rd party debt ~$37
Other liabilities (net) (~5)
Equity (~2)
Liabilities & equity ~$30
Estimated balance sheet
Retained earnings charge “earn back” Securitization gains offset
2009Egains
~$1.2
’10Fgains
$0
YoY NI impact
~$1.3 Earn back~(1.2) “Foregone” gains~$0.1
Day 1 chargeto retainedearnings
’12+FNI
~$1.3
’10FNI
’11FNI
~$1.7
~$0.3~$0.1
($ in billions)
YoY impact … “new earnings” offset by no securitization gains
Proforma impact
Estimated income impact
~$0.3
~$0.9
“Top up”
CFPA1478 Security Analysts_December 2009_TUES a.m. 25
Losses and impairments vs. stress($ in billions)
Commercial portfolio
- Real Estate
Credit costs $0.9 $1.0 ~$1.3 $0.5 $1.4
Impairments 0.7 1.1 ~0.8 1.4 1.5
- Aviation and Energy 0.4 0.7 ~0.4 0.2 1.0
- Mid-market lease/lend 2.0 2.6 ~2.7 2.0 3.1
- Other commercial 0.5 1.5 – 0.5 1.0
Consumer portfolio
- U.S. 5.1 5.7 ~3.5 4.8 5.0
- Non-U.S. mortgage 1.2 1.6 ~1.1 0.7 1.3
- Other consumer 2.2 2.7 ~2.5 2.1 3.2
Total ~$13.0 ~$16.9 ~$12.0-13.0 ~$12.1 ~$17.5
FAS 167 1.5 1.5
$13.6 $19.0
2011 Fixed CC ~$2B ~$7B
Estimated base case
Estimated adverse case
2009 2010
Estimate
Current 2010 total loss expectations equal to or less than base case
Estimated base case
Estimated adverse case
CFPA1478 Security Analysts_December 2009_TUES a.m. 26
SG&A
Drivers
• Delivering cost out:
• $500MM Restructurings across 40+ platforms
• Investing in growth platforms and portfolio management
a) - Excludes Penske which was deconsolidated 1Q’09, acquisitions and corporate assessments b) - ex-FX
TY’09estimate
~$9.7a)
$13.1
TY’08
����$3.4
$3.4B cost-out in ’09 … more in 2010
($ in billions)
TY’10outlook
����5%b)
Org. structures/HC ($1.0) ($1.4) +$0.4
Indirect spend (1.0) (1.3) +0.3
Dispositions (0.7) (0.7) –
Total cost out ($2.7B) ($3.4B) +$0.7B
Mar 19 Now V
CFPA1478 Security Analysts_December 2009_TUES a.m. 27
Summary
� Losses and impairments running at to below Fed base case
�Equipment and Consumer delinquency flattening, Real Estate continues to be pressured
�Non-earnings coverage strong … managing portfolio
�Reserves coverage up to 2.08%, +66 bps. 3Q YTD
�2010 similar to 2009, higher pre-tax earnings …improved margins, lower costs
CFPA1478 Security Analysts_December 2009_TUES a.m. 28
Portfolio Update
CFPA1478 Security Analysts_December 2009_TUES a.m. 29
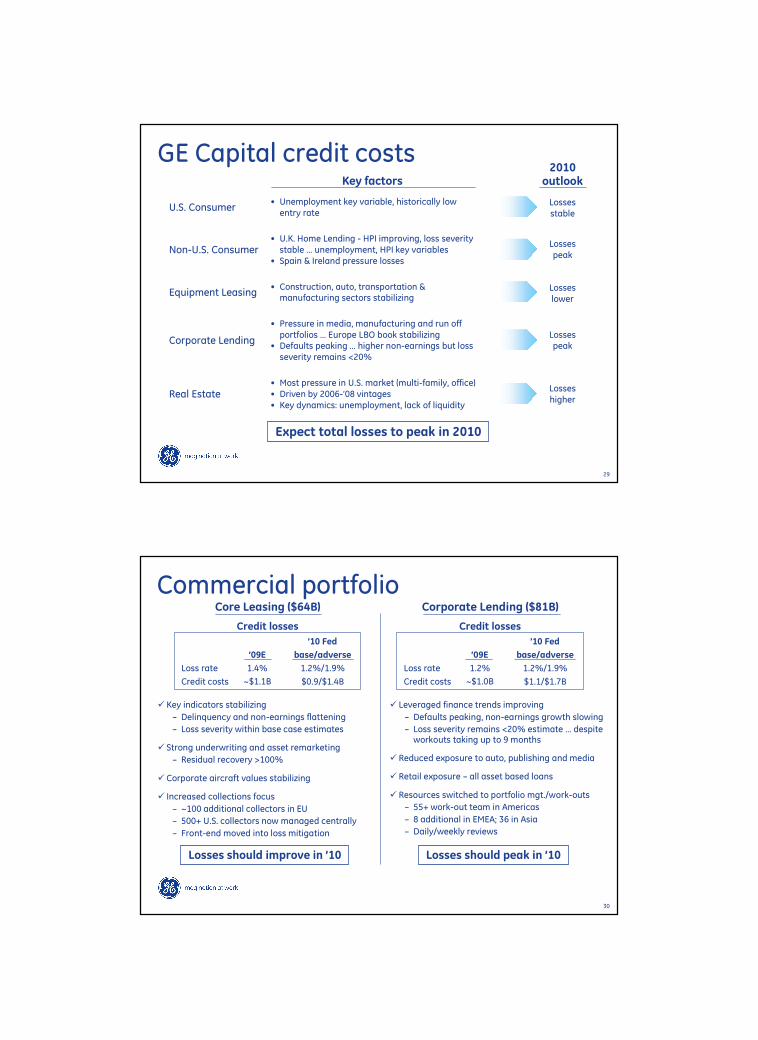
GE Capital credit costsKey factors
2010outlook
Expect total losses to peak in 2010
U.S. Consumer• Unemployment key variable, historically low entry rate
Real Estate• Most pressure in U.S. market (multi-family, office)• Driven by 2006-’08 vintages • Key dynamics: unemployment, lack of liquidity
Losseshigher
Equipment Leasing• Construction, auto, transportation & manufacturing sectors stabilizing
Corporate Lending
• Pressure in media, manufacturing and run off portfolios … Europe LBO book stabilizing
• Defaults peaking … higher non-earnings but loss severity remains <20%
Lossespeak
Non-U.S. Consumer• U.K. Home Lending - HPI improving, loss severity stable … unemployment, HPI key variables
• Spain & Ireland pressure losses
Losseslower
Lossespeak
Lossesstable
CFPA1478 Security Analysts_December 2009_TUES a.m. 30
� Key indicators stabilizing
– Delinquency and non-earnings flattening
– Loss severity within base case estimates
� Strong underwriting and asset remarketing
– Residual recovery >100%
� Corporate aircraft values stabilizing
� Increased collections focus
– ~100 additional collectors in EU
– 500+ U.S. collectors now managed centrally
– Front-end moved into loss mitigation
Core Leasing ($64B) Corporate Lending ($81B)
� Leveraged finance trends improving
– Defaults peaking, non-earnings growth slowing
– Loss severity remains <20% estimate … despite workouts taking up to 9 months
� Reduced exposure to auto, publishing and media
� Retail exposure – all asset based loans
� Resources switched to portfolio mgt./work-outs
– 55+ work-out team in Americas
– 8 additional in EMEA; 36 in Asia
– Daily/weekly reviews
Commercial portfolio
Losses should improve in ’10 Losses should peak in ’10
Credit losses
’09E
1.4%
~$1.1B
’10 Fed
base/adverse
1.2%/1.9%
$0.9/$1.4B
Loss rate
Credit costs
Credit losses
’09E
1.2%
~$1.0B
’10 Fed
base/adverse
1.2%/1.9%
$1.1/$1.7B
Loss rate
Credit costs
CFPA1478 Security Analysts_December 2009_TUES a.m. 31
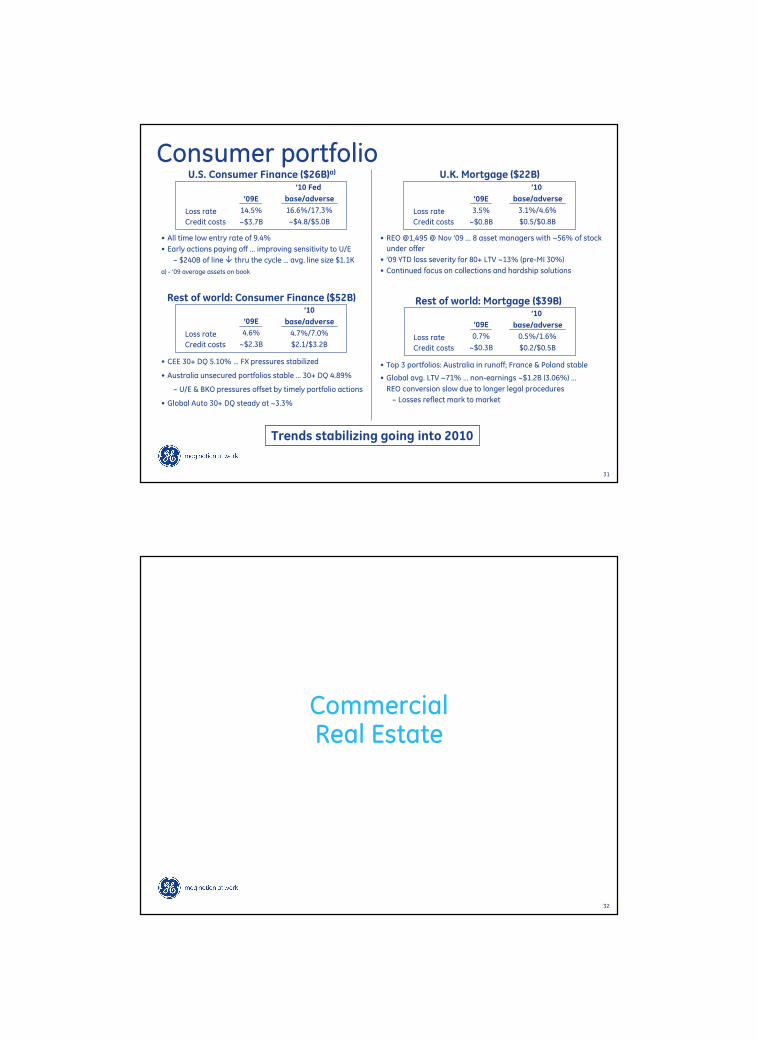
Consumer portfolioU.S. Consumer Finance ($26B)a) U.K. Mortgage ($22B)
Rest of world: Consumer Finance ($52B)
’09E
14.5%
~$3.7B
’10 Fed
base/adverse
16.6%/17.3%
~$4.8/$5.0B
Loss rate
Credit costs
• All time low entry rate of 9.4%
• Early actions paying off ... improving sensitivity to U/E
– $240B of line � thru the cycle … avg. line size $1.1K
Rest of world: Mortgage ($39B)
• REO @1,495 @ Nov ’09 ... 8 asset managers with ~56% of stock
under offer
• ’09 YTD loss severity for 80+ LTV ~13% (pre-MI 30%)
• Continued focus on collections and hardship solutions
• CEE 30+ DQ 5.10% … FX pressures stabilized
• Australia unsecured portfolios stable … 30+ DQ 4.89%
– U/E & BKO pressures offset by timely portfolio actions
• Global Auto 30+ DQ steady at ~3.3%
• Top 3 portfolios: Australia in runoff; France & Poland stable
• Global avg. LTV ~71% … non-earnings ~$1.2B (3.06%) …
REO conversion slow due to longer legal procedures
– Losses reflect mark to market
Trends stabilizing going into 2010
’09E
3.5%
~$0.8B
’10
base/adverse
3.1%/4.6%
$0.5/$0.8B
Loss rate
Credit costs
’09E
4.6%
~$2.3B
’10
base/adverse
4.7%/7.0%
$2.1/$3.2B
Loss rate
Credit costs
’09E
0.7%
~$0.3B
’10
base/adverse
0.5%/1.6%
$0.2/$0.5B
Loss rate
Credit costs
a) - ’09 average assets on book
CFPA1478 Security Analysts_December 2009_TUES a.m. 32
CommercialReal Estate

CFPA1478 Security Analysts_December 2009_TUES a.m. 33
777533
1,202
(776)
(1,570)
88
3Q’09 YTD performance
Assets ($B)
3Q’09 YTD dynamics
3Q’09YTD
3Q’08YTD
Net income ($MM)
$88.7 $83.7
$1,204
($948)
Gains
Depreciation/ losses
Financials
Levers ($MM)Originaloutlook Actuals Status
NOI(pre-tax)
$1,104 $1,199
Debt margin(net)
$618 $500
Gains(net)
$124 $88
Depreciation/losses(pre-tax)
$1,377 $2,392
Volume ($B) $19.3 $1.3
Core
Leasing(MM sq. ft.)
18.0 19.1
Occupancy 80% 79%
Team is executing … losses are challenge
CFPA1478 Security Analysts_December 2009_TUES a.m. 34
Equity portfolio @ 3Q’09: $33B
• Leased 19.1MM sq. ft. YTD (13.1MM renewals;6.0MM new leases) vs. 18.0MM sq. ft. plan
2Q’09
80%
3Q’09
Occupancy b)
79%
b) - Excludes multifamily, hotel, parking & Mexico JV assets
• Each asset a small business with multiple performance levers
NOI
3Qa)
$1.6
Yield
3Qa)
5.6%
3/19 3/19
5.4% $1.5
Property income
a) - 3Q’09 annualized
Leasing outlook
•Market will remain challenging• GE portfolio roll reduces in ’10/’11• Team targeting strong out-performance
- Outperformed in 8 of 11 major markets YTD• Availability of capex/tenant improvement $ is a critical differentiator
• Limited debt on properties … increases speed on leasing decisions
(MM sq. ft.) ’08A ’09E ’10F ’11F
GE lease roll 22 32 23 22
87% wholly-owned
•97% existing properties
• 3% development
• $11MM average investment
Owned RE87%
JV10%
Other3%
CFPA1478 Security Analysts_December 2009_TUES a.m. 35
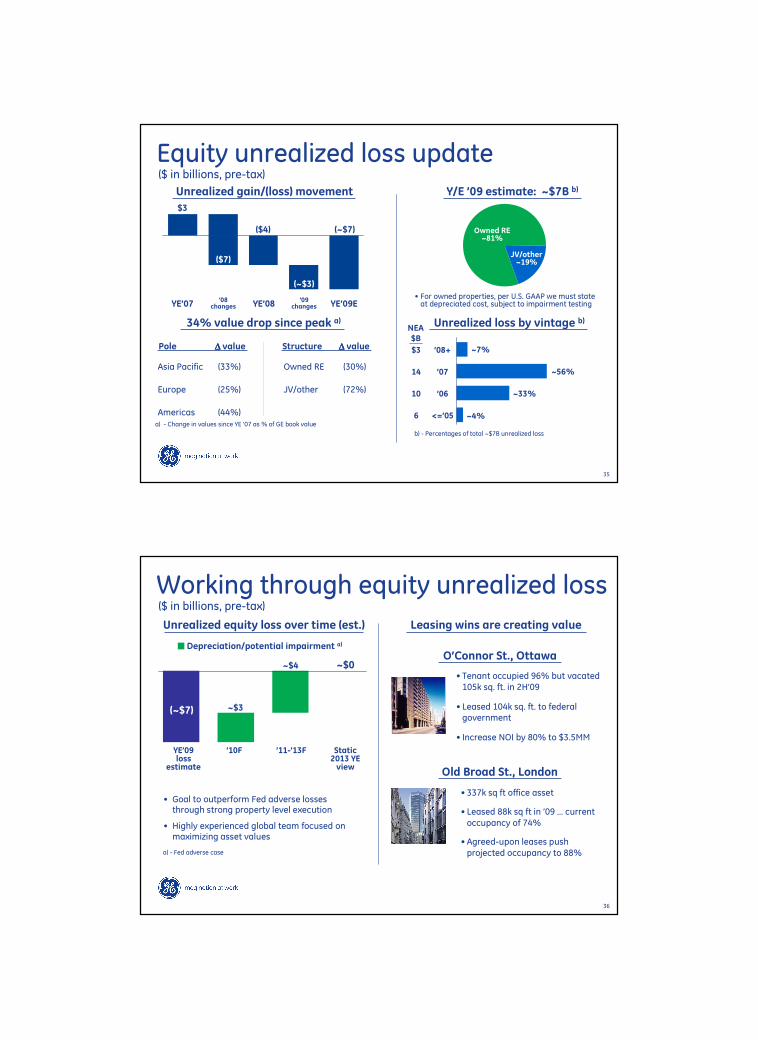
Equity unrealized loss update($ in billions, pre-tax)
Y/E ’09 estimate: ~$7B b)
~7%’08+
’07
’06
<=’05
Unrealized loss by vintage b)
JV/other~19%
Owned RE~81%
• For owned properties, per U.S. GAAP we must state at depreciated cost, subject to impairment testing
Unrealized gain/(loss) movement
Asia Pacific (33%) Owned RE (30%)
Europe (25%) JV/other (72%)
Americas (44%)
Pole ∆∆∆∆ value Structure ∆∆∆∆ value
$3
(~$7)
($7)
YE’09E
a) - Change in values since YE ’07 as % of GE book value
YE’07
34% value drop since peak a)
YE’08
(~$3)
($4)
’08changes
’09changes
$3
14
10
6
NEA$B
b) - Percentages of total ~$7B unrealized loss
~56%
~33%
~4%
CFPA1478 Security Analysts_December 2009_TUES a.m. 36
Working through equity unrealized loss($ in billions, pre-tax)
• Goal to outperform Fed adverse losses through strong property level execution
• Highly experienced global team focused on maximizing asset values
Unrealized equity loss over time (est.)
(~$7) ~$3
~$4
a) - Fed adverse case
Depreciation/potential impairment a)
YE’09 ’10F ’11-’13F Staticloss 2013 YE
estimate view
~$0
Leasing wins are creating value
O’Connor St., Ottawa
• Tenant occupied 96% but vacated 105k sq. ft. in 2H’09
• Leased 104k sq. ft. to federal government
• Increase NOI by 80% to $3.5MM
Old Broad St., London
• 337k sq ft office asset
• Leased 88k sq ft in ’09 … current occupancy of 74%
• Agreed-upon leases push projected occupancy to 88%
CFPA1478 Security Analysts_December 2009_TUES a.m. 37
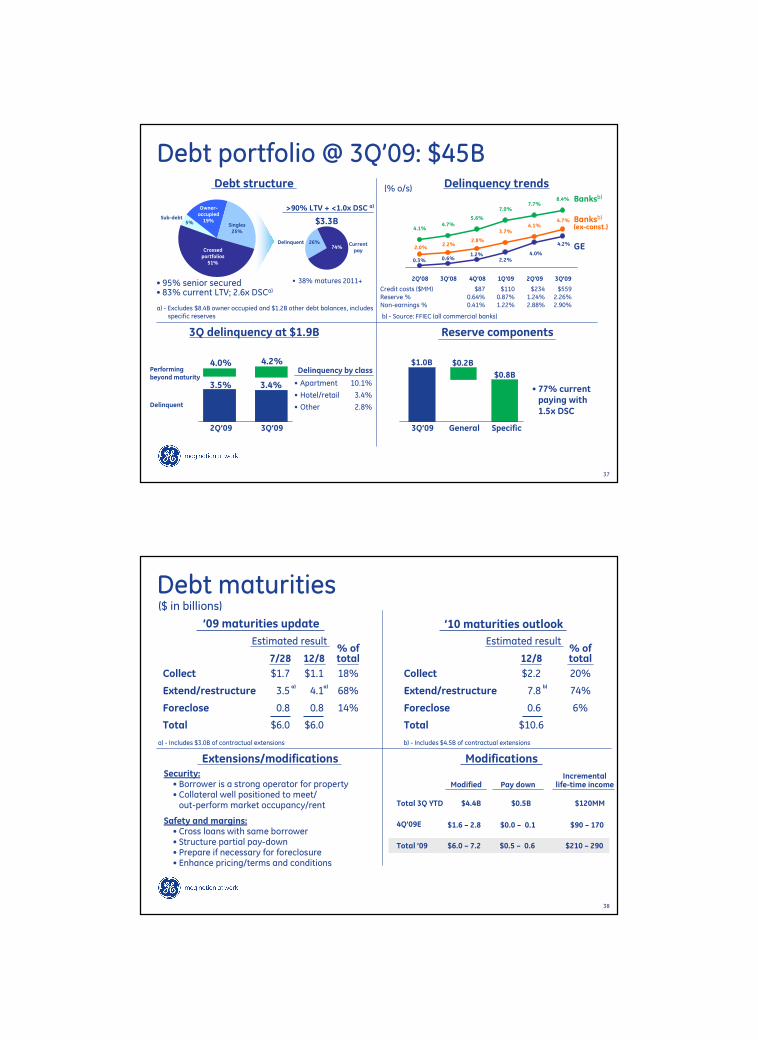
Debt portfolio @ 3Q’09: $45B
• Apartment 10.1%
• Hotel/retail 3.4%
• Other 2.8%
4.0% 4.2%
3Q’092Q’09
Reserve components3Q delinquency at $1.9B
(% o/s) Delinquency trendsDebt structure
• 38% matures 2011+• 95% senior secured• 83% current LTV; 2.6x DSCa)
>90% LTV + <1.0x DSC a)
Delinquent Currentpay
$3.3B
26%74%
a) - Excludes $8.4B owner occupied and $1.2B other debt balances, includesspecific reserves
Sub-debt5%
Owner-occupied19%
Singles25%
Crossedportfolios
51%
Delinquency by class
4.1%4.7%
5.6%
7.0%7.7%
0.3% 0.6%1.2%
2.2%4.0%
4.2%2.0%
2.2%2.8%
3.7%4.1%
4.7%
8.4%
2Q'08 3Q'08 4Q'08 1Q'09 2Q'09 3Q'09
GE
Banksb)
Banksb)(ex-const.)
b) - Source: FFIEC (all commercial banks)
Credit costs ($MM) $87 $110 $234 $559Reserve % 0.64% 0.87% 1.24% 2.26%Non-earnings % 0.41% 1.22% 2.88% 2.90%
Performingbeyond maturity
Delinquent
3.5% 3.4%
3Q’09 General Specific
$1.0B $0.2B
$0.8B
• 77% current paying with 1.5x DSC
CFPA1478 Security Analysts_December 2009_TUES a.m. 38
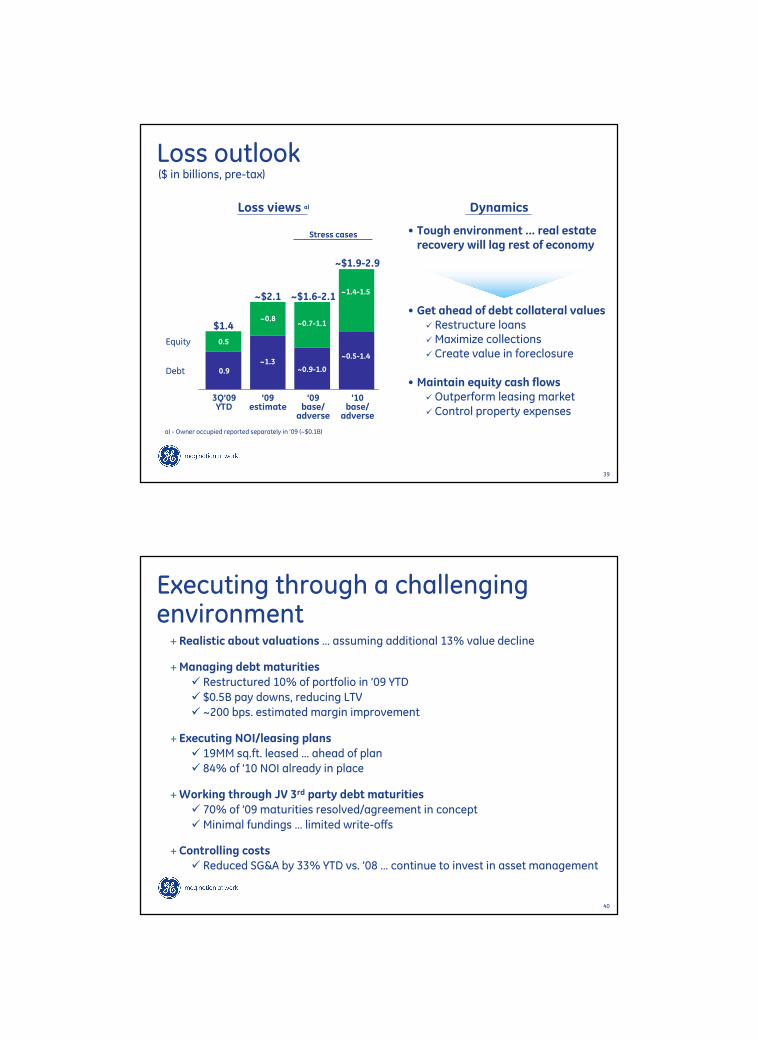
Debt maturities
$6.0
$0.8
$3.5
$1.7
7/28
$6.0Total
14%$0.8Foreclose
68%$4.1Extend/restructure
18%$1.1Collect
% of total12/8
Estimated result
’10 maturities outlook
($ in billions)
’09 maturities update
Modifications
Total 3Q YTD
4Q’09E
Total ’09
$4.4B $0.5B $120MM
$1.6 – 2.8
$6.0 – 7.2
$0.0 – 0.1 $90 – 170
$0.5 – 0.6 $210 – 290
Modified Pay downIncremental
life-time income
Extensions/modificationsSecurity:• Borrower is a strong operator for property • Collateral well positioned to meet/out-perform market occupancy/rent
Safety and margins:• Cross loans with same borrower• Structure partial pay-down• Prepare if necessary for foreclosure• Enhance pricing/terms and conditions
a) - Includes $3.0B of contractual extensions
a)a)
$10.6Total
6%$0.6Foreclose
74%$7.8Extend/restructure
20%$2.2Collect
% of total12/8
Estimated result
b)
b) - Includes $4.5B of contractual extensions
CFPA1478 Security Analysts_December 2009_TUES a.m. 39
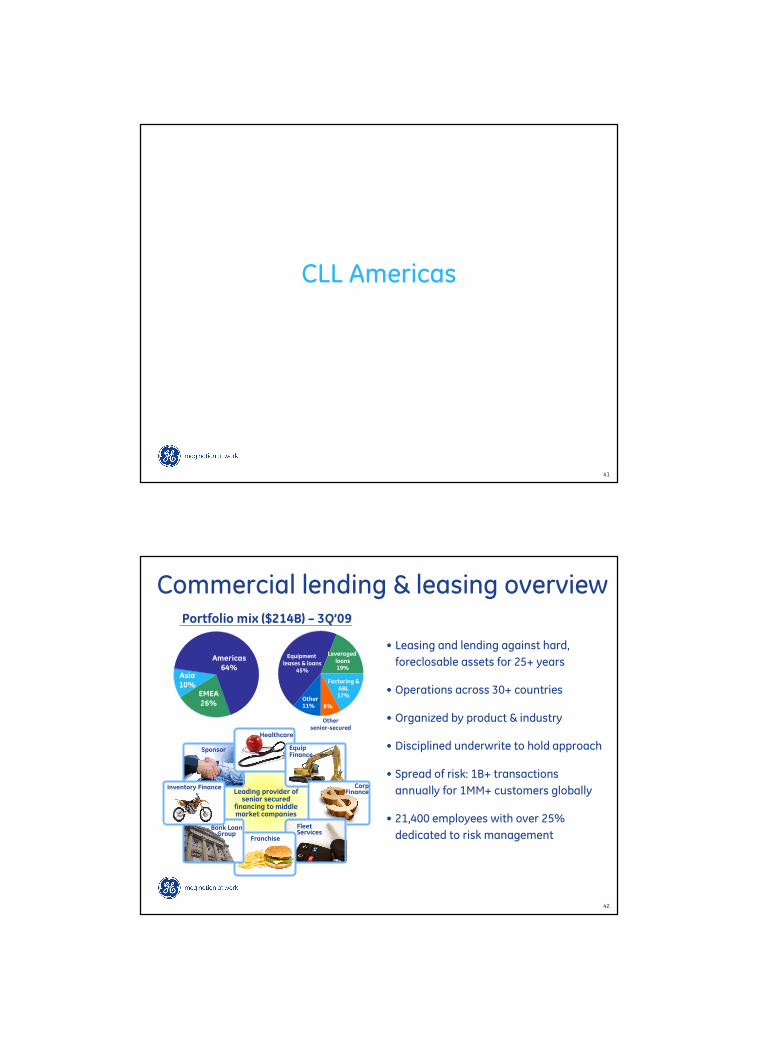
Loss outlook($ in billions, pre-tax)
Loss views a)
Stress cases
’09base/
adverse
’10base/
adverse
Equity
Debt 0.9
3Q’09YTD
$1.4
0.5
• Tough environment … real estate recovery will lag rest of economy
• Get ahead of debt collateral values� Restructure loans�Maximize collections� Create value in foreclosure
• Maintain equity cash flows�Outperform leasing market� Control property expenses
’09estimate
~1.3
~$2.1
~0.8~0.7-1.1
~0.9-1.0
~$1.6-2.1~1.4-1.5
~0.5-1.4
~$1.9-2.9
a) - Owner occupied reported separately in ’09 (~$0.1B)
Dynamics
CFPA1478 Security Analysts_December 2009_TUES a.m. 40
Executing through a challenging environment
+Realistic about valuations … assuming additional 13% value decline
+Managing debt maturities
� Restructured 10% of portfolio in ’09 YTD
� $0.5B pay downs, reducing LTV
� ~200 bps. estimated margin improvement
+ Executing NOI/leasing plans
� 19MM sq.ft. leased … ahead of plan
� 84% of ’10 NOI already in place
+Working through JV 3rd party debt maturities
� 70% of ’09 maturities resolved/agreement in concept
�Minimal fundings … limited write-offs
+Controlling costs
� Reduced SG&A by 33% YTD vs. ’08 … continue to invest in asset management
CFPA1478 Security Analysts_December 2009_TUES a.m. 41
CLL Americas
CFPA1478 Security Analysts_December 2009_TUES a.m. 42
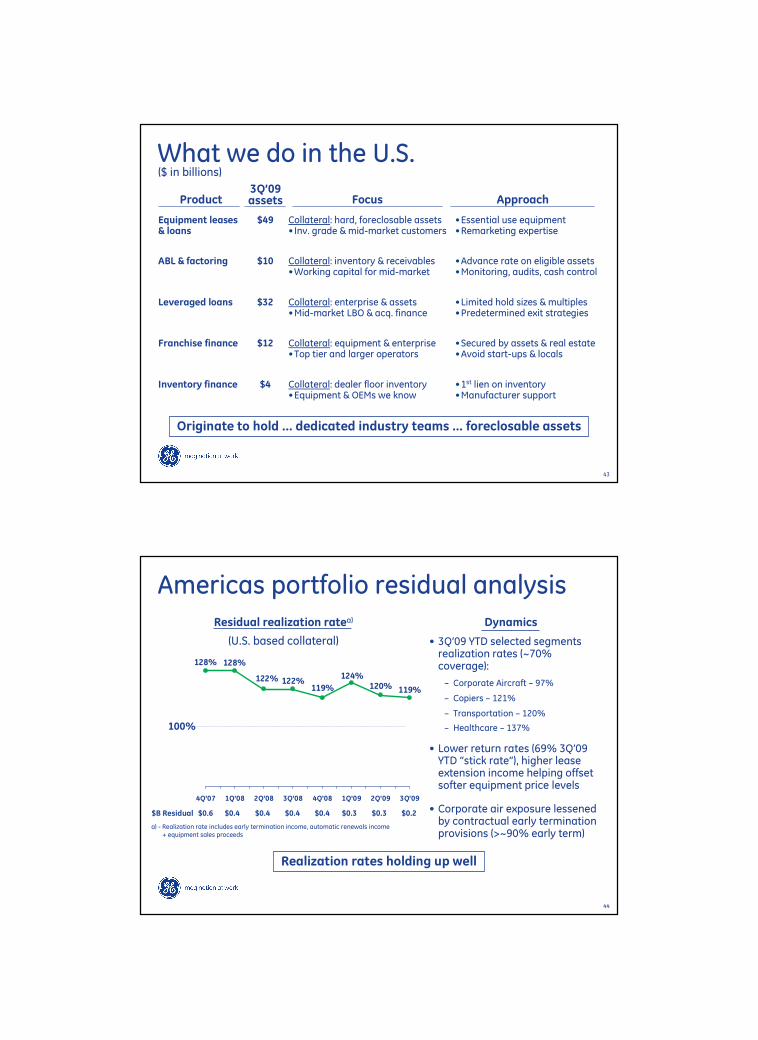
Commercial lending & leasing overview
• Leasing and lending against hard,
foreclosable assets for 25+ years
• Operations across 30+ countries
• Organized by product & industry
• Disciplined underwrite to hold approach
• Spread of risk: 1B+ transactions
annually for 1MM+ customers globally
• 21,400 employees with over 25%
dedicated to risk management
Sponsor
Leading provider of senior secured
financing to middle market companies
Healthcare
Equip Finance
Corp Finance
Fleet Services
Franchise
Bank Loan Group
Inventory Finance
EMEA26%
Asia10%
Americas64%
Equipment leases & loans
45%
Leveraged loans19%
Othersenior-secured
Factoring &ABL17%
8%Other11%
Portfolio mix ($214B) – 3Q’09
CFPA1478 Security Analysts_December 2009_TUES a.m. 43
What we do in the U.S.
Equipment leases & loans
Product
$49 Collateral: hard, foreclosable assets•Inv. grade & mid-market customers
3Q’09assets Approach
•Essential use equipment•Remarketing expertise
ABL & factoring $10 Collateral: inventory & receivables •Working capital for mid-market
•Advance rate on eligible assets•Monitoring, audits, cash control
Leveraged loans $32 Collateral: enterprise & assets•Mid-market LBO & acq. finance
•Limited hold sizes & multiples•Predetermined exit strategies
Franchise finance $12 Collateral: equipment & enterprise•Top tier and larger operators
•Secured by assets & real estate •Avoid start-ups & locals
Inventory finance $4 Collateral: dealer floor inventory•Equipment & OEMs we know
•1st lien on inventory•Manufacturer support
Focus
Originate to hold … dedicated industry teams … foreclosable assets
($ in billions)
CFPA1478 Security Analysts_December 2009_TUES a.m. 44
119%120%124%
119%122%122%
128%128%
4Q'07 1Q'08 2Q'08 3Q'08 4Q'08 1Q'09 2Q'09 3Q'09
Americas portfolio residual analysis
• 3Q’09 YTD selected segments realization rates (~70% coverage):
– Corporate Aircraft – 97%
– Copiers – 121%
– Transportation – 120%
– Healthcare – 137%
• Lower return rates (69% 3Q’09 YTD “stick rate”), higher lease extension income helping offset softer equipment price levels
• Corporate air exposure lessened by contractual early termination provisions (>~90% early term)
Realization rates holding up well
Residual realization ratea)
(U.S. based collateral)
$B Residual $0.6 $0.4 $0.4 $0.4 $0.4 $0.3 $0.3 $0.2
100%
Dynamics
a) - Realization rate includes early termination income, automatic renewals income+ equipment sales proceeds
CFPA1478 Security Analysts_December 2009_TUES a.m. 45
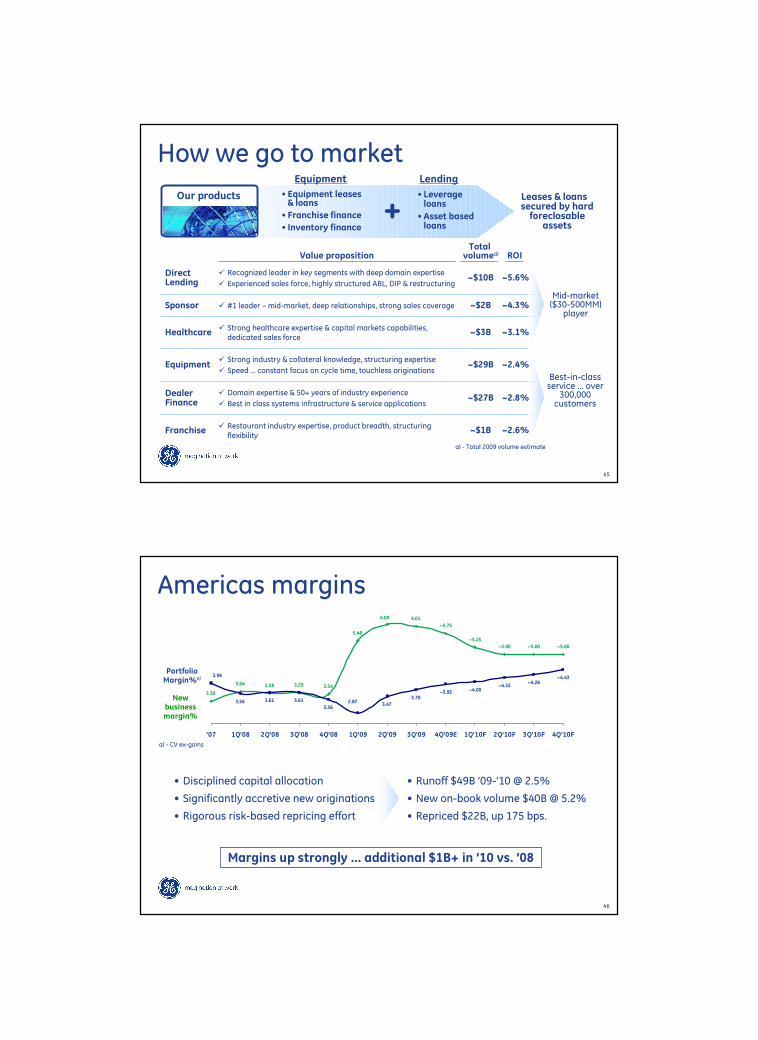
How we go to market
• Equipment leases & loans
• Franchise finance
• Inventory finance
Our products Leases & loans secured by hard foreclosable
assets
• Leverage loans
•Asset based loans
Equipment Lending
+Total
volumea) ROIValue proposition
Direct Lending
� Recognized leader in key segments with deep domain expertise
� Experienced sales force, highly structured ABL, DIP & restructuring~$10B ~5.6%
Sponsor � #1 leader – mid-market, deep relationships, strong sales coverage ~$2B ~4.3%
Healthcare� Strong healthcare expertise & capital markets capabilities,
dedicated sales force~$3B ~3.1%
Equipment� Strong industry & collateral knowledge, structuring expertise
� Speed … constant focus on cycle time, touchless originations~$29B ~2.4%
Franchise� Restaurant industry expertise, product breadth, structuring
flexibility~$1B ~2.6%
Dealer Finance
� Domain expertise & 50+ years of industry experience
� Best in class systems infrastructure & service applications~$27B ~2.8%
Mid-market ($30-500MM)
player
Best-in-class service … over
300,000 customers
a) - Total 2009 volume estimate
CFPA1478 Security Analysts_December 2009_TUES a.m. 46
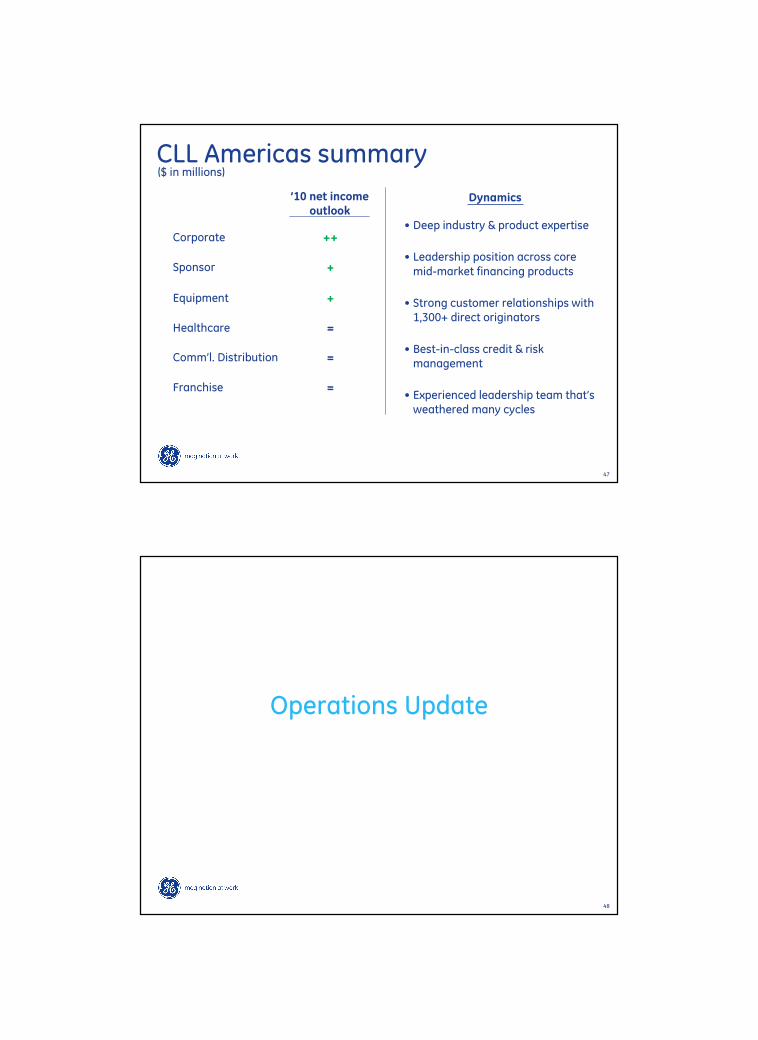
Americas margins
5.48
6.01
3.47
3.70
~5.00 ~5.00 ~5.00
~5.25
~5.75
3.593.583.64
3.30
3.54
6.09
~4.43 ~4.26
~4.15 ~4.00 ~3.92
3.613.613.56
3.94
3.362.87
'07 1Q'08 2Q'08 3Q'08 4Q'08 1Q'09 2Q'09 3Q'09 4Q'09E 1Q'10F 2Q'10F 3Q'10F 4Q'10F
New business margin%
PortfolioMargin%a)
Margins up strongly … additional $1B+ in ’10 vs. ’08
• Runoff $49B ’09-’10 @ 2.5%
• New on-book volume $40B @ 5.2%
• Repriced $22B, up 175 bps.
• Disciplined capital allocation
• Significantly accretive new originations
• Rigorous risk-based repricing effort
a) - CV ex-gains
CFPA1478 Security Analysts_December 2009_TUES a.m. 47
CLL Americas summary
’10 net incomeoutlook
Corporate
Sponsor
Equipment
Healthcare
Comm’l. Distribution
Franchise
($ in millions)
++
+
+
=
=
=
• Deep industry & product expertise
• Leadership position across coremid-market financing products
• Strong customer relationships with 1,300+ direct originators
• Best-in-class credit & risk management
• Experienced leadership team that’s weathered many cycles
Dynamics
CFPA1478 Security Analysts_December 2009_TUES a.m. 48
Operations Update
CFPA1478 Security Analysts_December 2009_TUES a.m. 49
6%
12%
18%
24%
30%
Jan '08 Apr '08 Jul '08 Oct '08 Jan '09 Apr '09 Jul '09 Oct '09
1%
2%
3%
4%
5%
6%
7%
8%
9%
U/E Est.
30+ DQ (LHS)
90+ DQ (LHS)
U/E % (RHS)25.3%
15.9%
8.0%
5.2%
15.1%
7.1%
25.9%
15.8%
7.9%
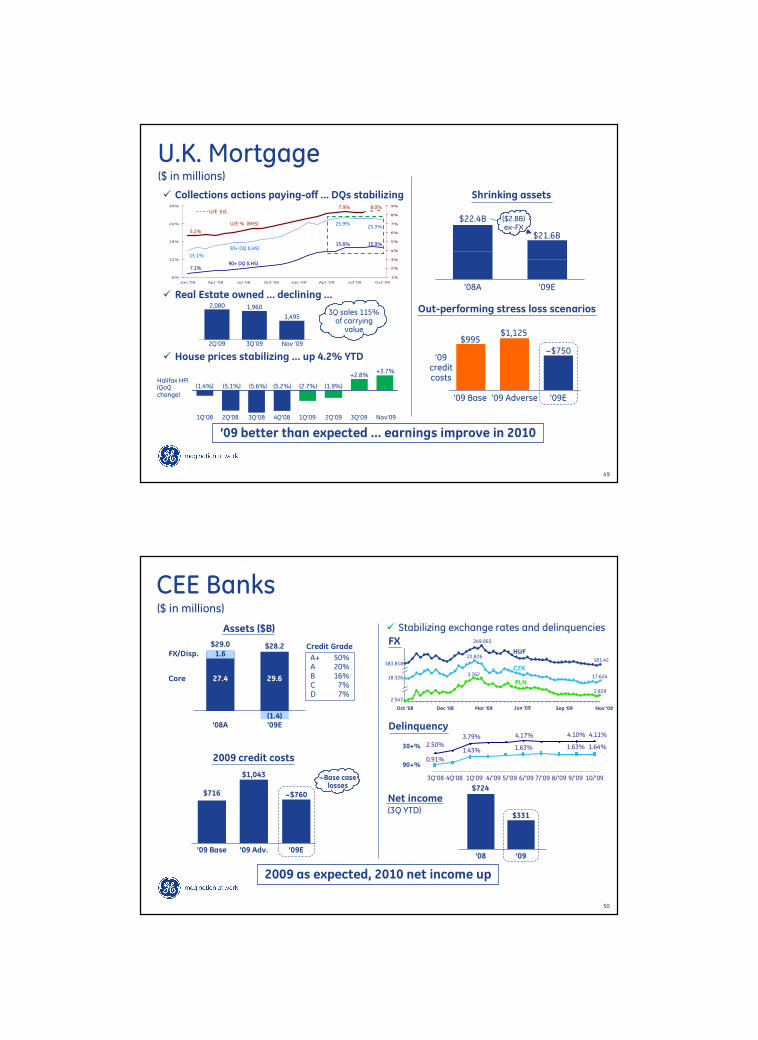
’09 better than expected … earnings improve in 2010
($ in millions)
U.K. Mortgage
Halifax HPI (QoQchange)
1Q’08 2Q’08 3Q’08 4Q’08 1Q’09 2Q’09 3Q’09
(1.4%) (5.1%) (5.6%) (5.2%) (2.7%) (1.9%)
+2.8%
� Collections actions paying-off … DQs stabilizing
� Real Estate owned … declining …2,080 1,960
1,4953Q sales 115% of carrying
value
2Q’09 3Q’09 Nov ’09
� House prices stabilizing … up 4.2% YTD
Shrinking assets
’08A ’09E
$22.4B
$21.6B
($2.8B) ex-FX
Out-performing stress loss scenarios
’09 Base ’09 Adverse
$995
’09credit costs
$1,125
~$750
’09E
+3.7%
Nov’09
CFPA1478 Security Analysts_December 2009_TUES a.m. 50
CEE Banks
2009 as expected, 2010 net income up
($ in millions)
Net income(3Q YTD)
’09
$331
’08
$724
� Stabilizing exchange rates and delinquencies
Delinquency
30+%
90+%
2.50%3.79% 4.17%
0.91%
1.43% 1.63%
3Q’08 4Q’08 1Q’09 4/’09 5/’09 6/’09 7/’09 8/’09 9/’09
4.10%
1.63%
10/’09
4.11%
1.64%
FXCredit Grade
A+ 50%A 20%B 16%C 7%D 7%
’09E
$28.2
’08A
$29.0
Assets ($B)
’09E
~$760
’09 Base
$716
’09 Adv.
$1,043
2009 credit costs
29.6
28.2
(1.4)
FX/Disp.
Core 27.4
1.6
Oct ’08 Dec ’08 Mar ’09 Jun ’09 Sep ’09 Nov ’09
HUF
CZK
PLN18.326
2.547
181.42
17.624
2.839
22.826
249.065
3.762
183.818
~Base caselosses
CFPA1478 Security Analysts_December 2009_TUES a.m. 51
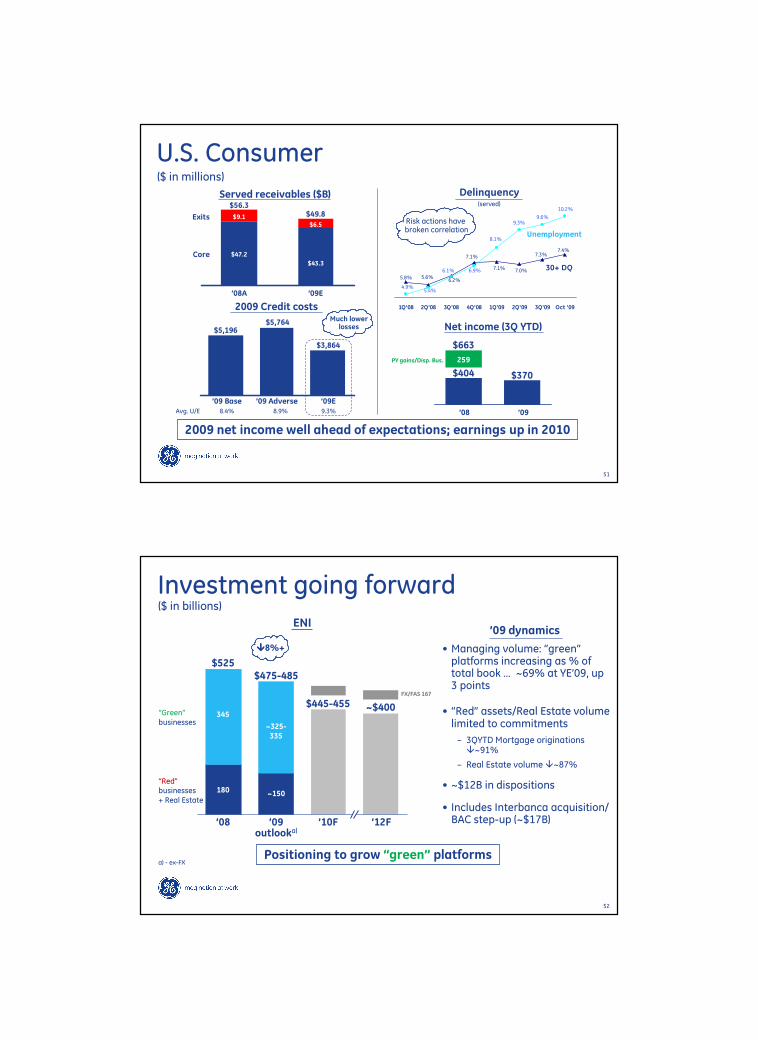
U.S. Consumer
2009 net income well ahead of expectations; earnings up in 2010
Served receivables ($B)
’09E
$43.3
$6.5
$49.8Exits
Core
’08A
$47.2
$9.1
$56.3
2009 Credit costs
5.8% 5.6%6.2%
7.1%
7.1% 7.0%
7.3%7.4%
4.9%5.4%
6.1% 6.9%
8.1%
9.3%9.6%
10.2%
1Q'08 2Q'08 3Q'08 4Q'08 1Q'09 2Q'09 3Q'09 Oct '09
30+ DQ
Unemployment
Delinquency(served)
Net income (3Q YTD)
$3,864
$5,196$5,764
’09E’09 Base ’09 AdverseAvg. U/E 8.4% 8.9% 9.3%
$663
$370
’08 ’09
Risk actions have broken correlation
Much lower losses
($ in millions)
PY gains/Disp. Bus.
$404
259
CFPA1478 Security Analysts_December 2009_TUES a.m. 52
Investment going forward
$525$475-485
����8%+
ENI
($ in billions)
’09 dynamics
Positioning to grow “green” platforms
’08 ’09outlooka)
“Red”businesses+ Real Estate
“Green”businesses
~325-335
~150
345
180
• Managing volume: “green”platforms increasing as % of total book … ~69% at YE’09, up 3 points
• “Red” assets/Real Estate volume limited to commitments
– 3QYTD Mortgage originations �~91%
– Real Estate volume �~87%
• ~$12B in dispositions
• Includes Interbanca acquisition/ BAC step-up (~$17B)
a) - ex-FX
’10F ’12F
$445-455 ~$400
FX/FAS 167
CFPA1478 Security Analysts_December 2009_TUES a.m. 53
Summary/Q&A
CFPA1478 Security Analysts_December 2009_TUES a.m. 54
2010 earnings outlook($ in billions)
CLL $0.6 ++
Consumer 1.4 +
Real Estate (0.9) –
Aviation/Energy 0.9 =
Capital Finance $2.0
3Q’09 YTD 2010F Dynamics
+ Lower losses
+ Improved margins
+ Lower SG&A
+ Improved margins
+ Stabilizing to lower losses
+ Lower SG&A
– Higher losses/impairments
Solid foundation for 2011+
+ Margin improvement
= Manage aviation cycle
CFPA1478 Security Analysts_December 2009_TUES a.m. 55
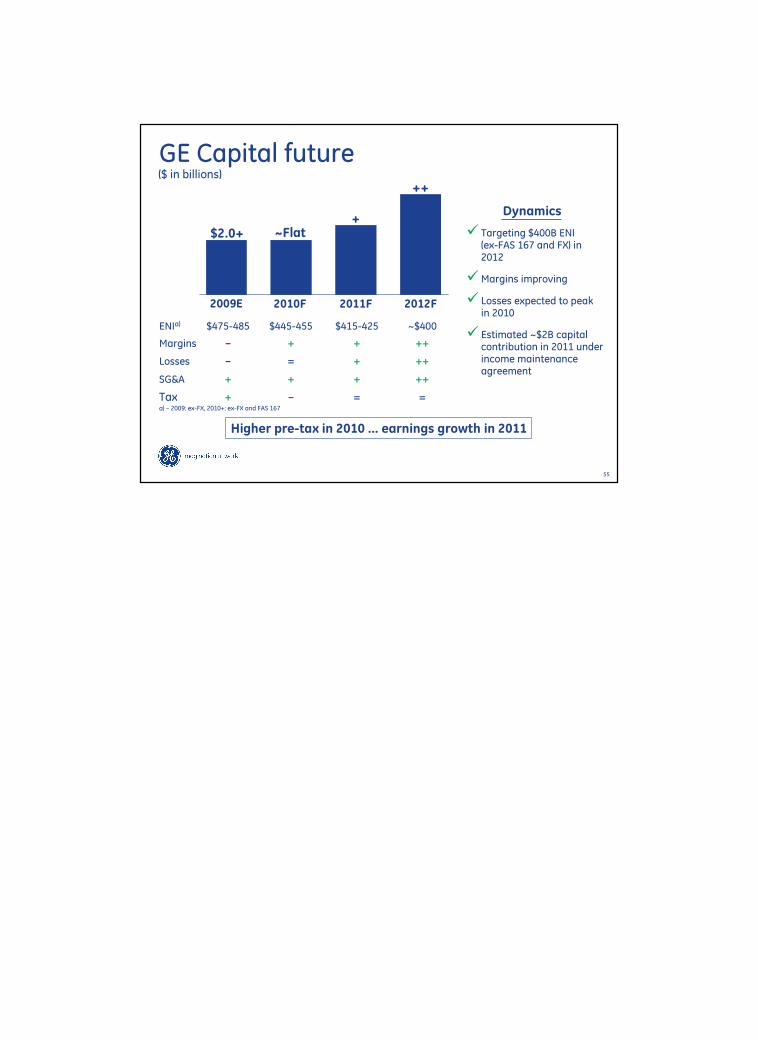
GE Capital future($ in billions)
$2.0+ ~Flat
2009E 2010F
+
2011F
Higher pre-tax in 2010 … earnings growth in 2011
ENIa) $475-485 $445-455 $415-425 ~$400
Margins – + + ++
Losses – = + ++
SG&A + + + ++
Tax + – = =
Dynamics
� Targeting $400B ENI(ex-FAS 167 and FX) in 2012
�Margins improving
� Losses expected to peakin 2010
� Estimated ~$2B capital contribution in 2011 under income maintenance agreement
2012F
++
a) – 2009: ex-FX, 2010+: ex-FX and FAS 167