Embed Size (px)
Citation preview

Singapore Exchange
Morgan Stanley 17th Annual Asia Pacific Summit
28-29 November 2018
Loh Boon Chye, Chief Executive OfficerChng Lay Chew, Chief Financial Officer

Who we are
2

About SGX
High dividends of 30 cents per share in FY2018, an increase from 28 cents from the previous year
Strong cash-flow and high operating margin
A diversified exchange group that runs key market infrastructure including the Singapore securities market and a pan-Asian derivatives exchange covering all major asset classes.
3
Anchored in Singapore, Asia’s only AAA-rated economy

3 Main Business LinesThree business units covering the entire exchange value chain, resulting in diversified and resilient revenue streams.
Derivatives
Pan-Asian derivatives covering equity indices, currencies & commodities
Market data of securities and derivatives
Connectivity to SGX markets and co-location
Development and bespoke calculation of indices
Issuer Services
Listings of equities and bonds
Post-listing issuer services
Securities Trading & Clearing
Cash equities, ETFs, Structured Warrants, REITs, DLCs
Post-Trade Services
Delivery and Settlement of securities
Custody and transfer of securities
FixedIncome
Fixed Income Trading
Equities and Fixed Income Market Data and Connectivity
4

Equities and Fixed
Income
63%
Derivatives
25%
Market Data and
Connectivity
11%
Issuer Services
10%
Securities Trading and
Clearing
39%
Post Trade Services
14%
Revenue $648M
Note: Numbers may be subject to rounding
Successfully achieved diversification of revenues
Equities and Fixed Income
48%Derivatives
40%
Market Data and
Connectivity
12%
Issuer Services
10%
Securities Trading
and Clearing
26%
Post Trade Services
12%
FY2018 Revenue Breakdown
Revenue$845M
Net Profit: $292 million Net Profit: $363 millionSource: SGX
5
Revenue contribution from Derivatives grew from 25% in FY2012 to 40% in FY2018. Total revenue grew 30% during the same period.
FY2012 Revenue Breakdown
Our international footprint
6
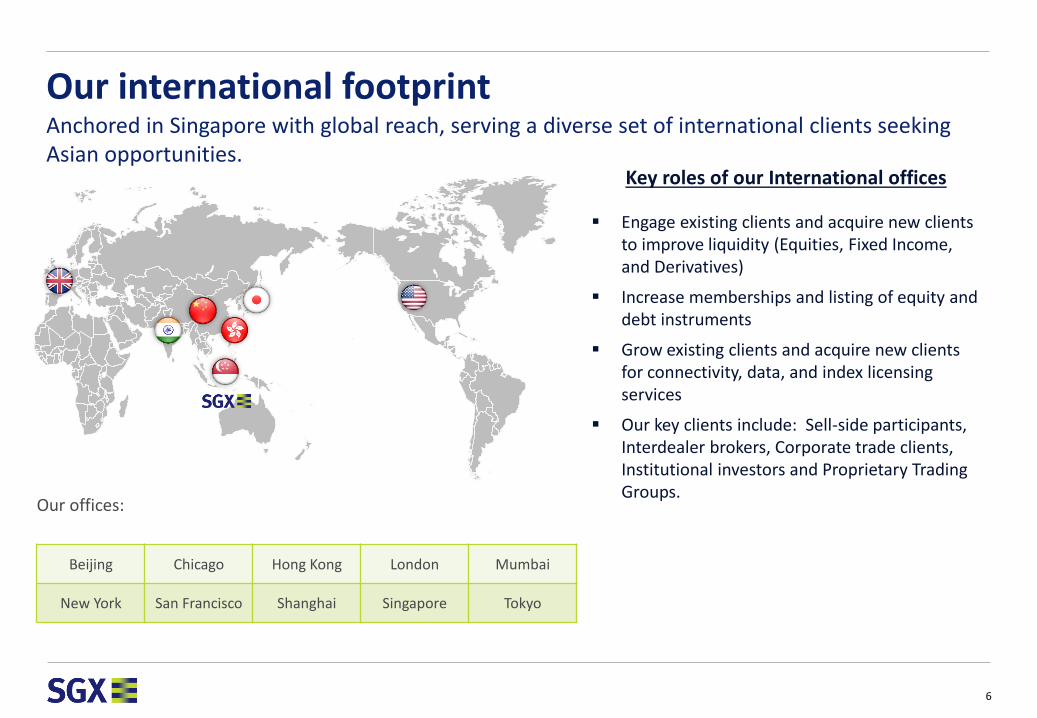
Anchored in Singapore with global reach, serving a diverse set of international clients seeking Asian opportunities.
Key roles of our International offices
Engage existing clients and acquire new clients to improve liquidity (Equities, Fixed Income, and Derivatives)
Increase memberships and listing of equity and debt instruments
Grow existing clients and acquire new clients for connectivity, data, and index licensing services
Our key clients include: Sell-side participants, Interdealer brokers, Corporate trade clients, Institutional investors and Proprietary Trading Groups.
Beijing Chicago Hong Kong London Mumbai
New York San Francisco Shanghai Singapore Tokyo
Our offices:

Robust Risk Management Standards
7
Aligned with the required regulatory standards to service US and European customers Attained Derivatives Clearing Organization (DCO) and Foreign Board of Trade
(FBOT) status from the US Commodity Futures Trading Commission (CFTC).
Recognized by the European Securities and Markets Authority (ESMA) as a third-country central counterparty.
Adopted global Principles for Financial Market Infrastructure (PFMI) Standards One of the first exchanges globally to adopt the PFMI standards, and is certified as
a Qualifying Central Counterparty under the Basel III framework.
Committed to the safety of the Singapore marketplace by contributing an amount equivalent to 25% of the default fund size, one of the highest “skin in the game” among global clearing houses.
Derivatives Exchange of the Year: Asia Risk Awards 2018 Exchange of the Year: Energy Risk Asia Awards 2018
Our Focus
8

FY2019 Strategic Priorities and beyond
9
Expand networks and partnerships
3Grow international presence
21Cement our position as a multi-asset exchange
Strengthen overseas presence in U.S. and London
Grow our base of buy-side clients (AM, HFT & PTG)
Expand FX product suite Enhance Fixed-Income
Trading Platform Develop SGX Cargo and
Freight franchise
Enter into collaborative agreements to grow cross-border flows and enhance service capabilities

2 6 17 24
78 8464 75
10 9 13 15 15 17 21 21 20 22
16 16 16 18 18 18 17 17 19 20
27 28 29 29 37 28 27 27 21 231 4 10 13 116 5 6 9
1415 15
24 2846
58 57 66 76101
104 161183 165
198
FY2009 FY2010 FY2011 FY2012 FY2013 FY2014 FY2015 FY2016 FY2017 FY2018
Growth of Derivatives (volumes and revenue in millions)
China A50 Futures Nifty Futures MSCI Taiwan Futures Nikkei Futures Iron Ore Derivatives Others
147127
139164
204 209
296
325303
340
Revenue (S$M)
Volume +96%
World’s most liquid offshore market for Asian Derivatives
10
Volume +74% Others
Iron Ore
Nikkei
MSCI Taiwan
Nifty
China A50
Broad range of liquid Asian equity index futures Capital efficiencies through margin offsets

FY2016 FY2017 FY2018
14
18 17
Extensive Suite Of Commodities Products
Total Volume of Contracts Traded (M)Price-Discovery Centre For The Steel Value Chain
Coking CoalFOB Australia,
CFR China
SteelHRC Steel (CFR ASEAN)
FreightTime Charter FFA (CV, PV, SV, HV)
Single Routes (C5, 2A, 3A)
Iron OreCFR China
Maritime Indices
11
Complements Singapore’s commodities hub status

A multi-asset exchange – Fixed Income
Size of Market Singapore SGX
Fixed
Income
Asia (ex-Japan) bond
market of US$14 trillion
Shift towards electronic
trading
Strong distribution
network to global investor
base with US$2.4 trillion
of assets under
management in Singapore
US$1.4T notional traded, with
more than 3,000 listed bonds
from 47 countries in 19
currencies
Leading exchange in Asia
Pacific (APAC) with ~40%
market share for listed G3
APAC bonds
Launched SGX Bond Pro, an
electronic platform for Bond
Trading
>3,000 bondslisted by 950 issuers from 47 countries in 19 currencies
Key Highlights
>150Number of
customer sign-ups
Nov 13 –Oct 18
Expanding coverage
Leading Bond listing exchange
in Asia
SGX Bond Pro gaining traction
~40%market share
12
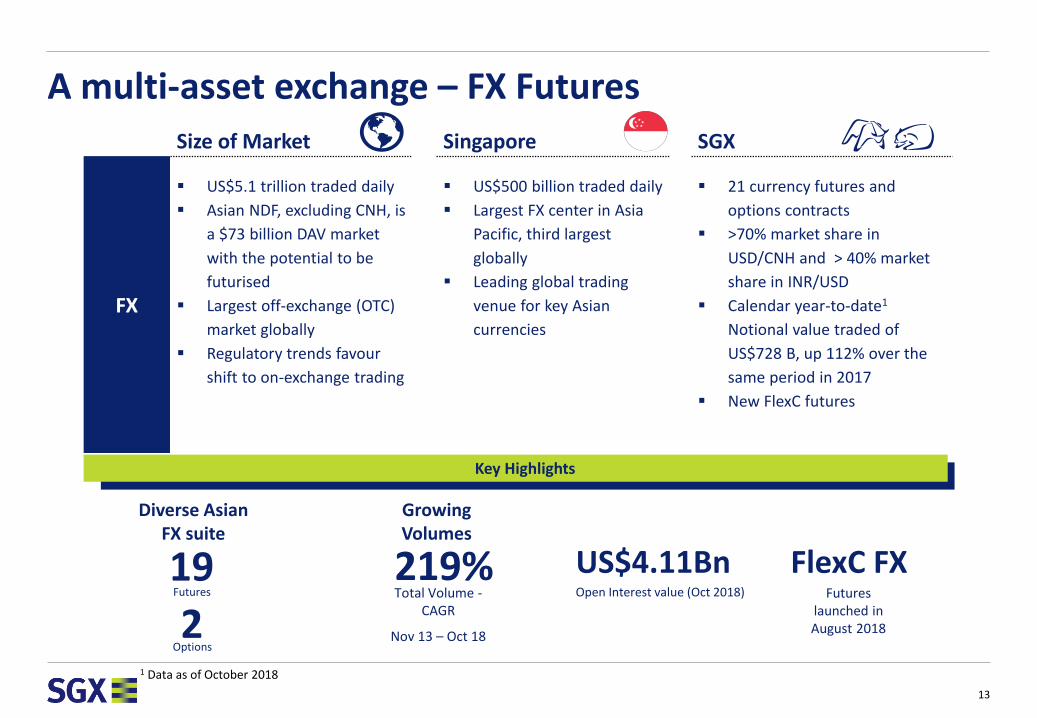
A multi-asset exchange – FX FuturesSize of Market Singapore SGX
FX
US$5.1 trillion traded daily
Asian NDF, excluding CNH, is
a $73 billion DAV market
with the potential to be
futurised
Largest off-exchange (OTC)
market globally
Regulatory trends favour
shift to on-exchange trading
US$500 billion traded daily
Largest FX center in Asia
Pacific, third largest
globally
Leading global trading
venue for key Asian
currencies
21 currency futures and
options contracts
>70% market share in
USD/CNH and > 40% market
share in INR/USD
Calendar year-to-date1
Notional value traded of
US$728 B, up 112% over the
same period in 2017
New FlexC futures
Open Interest value (Oct 2018)
US$4.11Bn 219%Total Volume -
CAGR
Nov 13 – Oct 18
Diverse Asian FX suite
Growing Volumes
19Futures
2Options
13
1 Data as of October 2018
FlexC FX Futures
launched in August 2018
Key Highlights

Insurance
Warehouse
Steel
Iron Ore
Coking Coal
Bank
Rubber
BrokersBuyersSellers
Insurance
Warehouse
Shipping
Air
Road
Rail
Bank
BrokersBuyersSellers
SGX is well positioned to be the Digital Freight Marketplace
14
Dominate a new multi-modal asset class of freight - wet & dry bulk, container & air
Mission: Fortify The Baltic Exchange, leverage SGX cargo & freight franchise, and invest strategically (e.g. Freightos) in market infrastructure & data.
Offer full-stack digital services in spot price discovery, matching & trading, and post-trade risk management.
SGXDigital Marketplace
for the Future of Freight
FreightMarkets
Commodity TradeMarkets

International footprint and partnerships
SGX-TASE Partnership
SGX-Nasdaq CollaborativeListing Agreement
Our offices:
15
• Beijing • Chicago • Hong Kong • London • Mumbai
• New York • San Francisco • Shanghai • Singapore • Tokyo

Financials
16

Financial Year 2018 Highlights
Record Revenue of $845M; Net profit of $363M, at 10-year high
Securities traded value up 12% to $314B. Record Derivatives traded volume, up 20% to 198M contracts
Dividend per share – 30 cents, up 2 cents per share; Earnings per Share – 33.9 cents
17
Revenue
$845M
Up 5%
Expenses
$420M
Up 5%
Operating Profit
$425M
Up 6%
Net Profit
$363M
Up 7%
Securities Trading
$314B total traded value
Up 12%
Derivatives Trading
198M contracts
Up 20%
Earnings Per Share
33.9 cents
Up 7%
Dividend Per Share
30 cents Up 2 cents
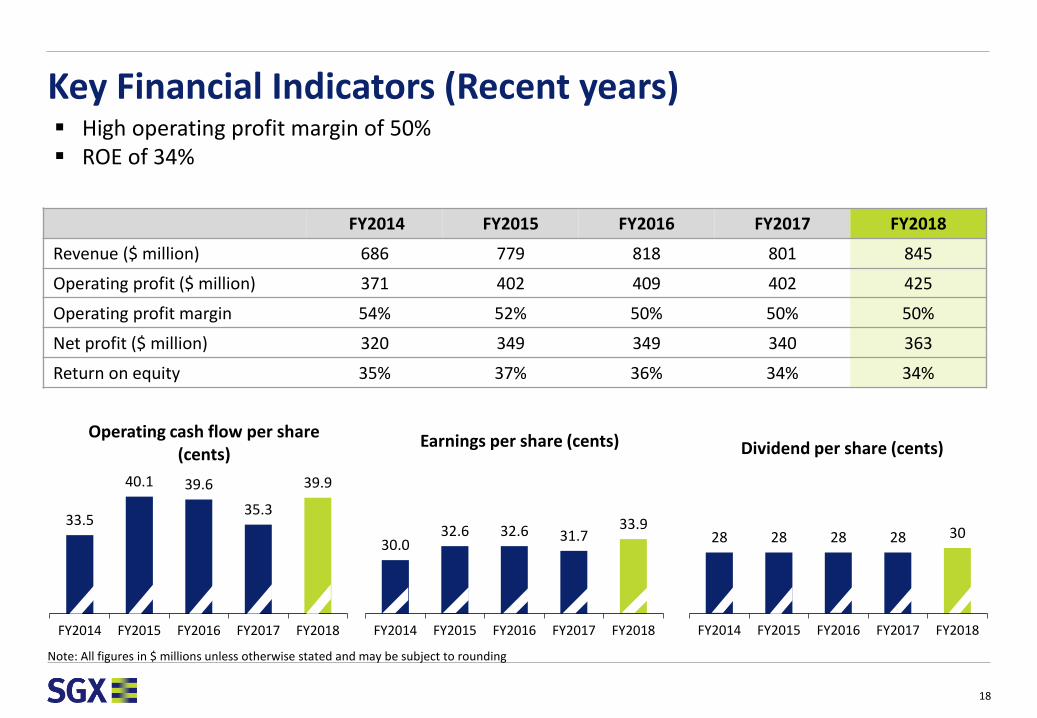
30.032.6 32.6 31.7
33.9
FY2014 FY2015 FY2016 FY2017 FY2018
Earnings per share (cents)
28 28 28 28 30
FY2014 FY2015 FY2016 FY2017 FY2018
Dividend per share (cents)
33.5
40.1 39.6
35.3
39.9
FY2014 FY2015 FY2016 FY2017 FY2018
Operating cash flow per share (cents)
18
Note: All figures in $ millions unless otherwise stated and may be subject to rounding
Key Financial Indicators (Recent years) High operating profit margin of 50% ROE of 34%
FY2014 FY2015 FY2016 FY2017 FY2018
Revenue ($ million) 686 779 818 801 845
Operating profit ($ million) 371 402 409 402 425
Operating profit margin 54% 52% 50% 50% 50%
Net profit ($ million) 320 349 349 340 363
Return on equity 35% 37% 36% 34% 34%

First Quarter FY2019 Highlights Creditable results – Revenue of $209M, up 2%; Net profit of $91M, comparable y-o-y
Strong Derivatives performance— Traded volume up 17% to a record of 54M contracts
Securities traded value down 8% to $68B amidst current weakness in emerging markets
Dividend per share – 7.5 cents, up 2.5 cents; Earnings per share – 8.5 cents
19
Revenue
$209M
Up 2%
Expenses
$102M
Up 4%
Operating Profit
$106M
Comparable
Net Profit
$91M
Comparable
Securities Trading
$68B total traded value
Down 8%
Derivatives Trading
54M contracts
Up 17%
Earnings Per Share
8.5 cents
Comparable
Dividend Per Share
7.5 cents Up 2.5 cents

8.5 8.29.4
7.8 8.5
1Q FY18 2Q FY18 3Q FY18 4Q FY18 1Q FY19
Earnings per share (cents)
5 5 5
15
7.5
1Q FY18 2Q FY18 3Q FY18 4Q FY18 1Q FY19
Dividend per share (cents)
9.67.1
12.211.0
9.2
1Q FY18 2Q FY18 3Q FY18 4Q FY18 1Q FY19
Operating cash flow per share(cents)
Key Financial Indicators (Recent quarters)
20
Note: All figures in $ millions unless otherwise stated and may be subject to rounding
1Q FY2018 2Q FY2018 3Q FY2018 4Q FY2018 1Q FY2019
Revenue ($ million) 204 205 222 213 209
Operating profit ($ million) 106 103 118 98 106
Operating profit margin 52% 50% 53% 46% 51%
Net profit ($ million) 91 88 100 84 91
Return on equity 38% 37% 37% 34% 39%
High operating profit margin of 51% High ROE of 39% Quarterly dividend per share of 7.5 cents per share

Fixed $236M
63%
Variable $105M
28%
Discretionary $36M
9%
Fixed Staff costs24%
Technology31%
Premises6%
Processing & Royalties
13%
Variable Staff Costs15%
Expenses$377M Fixed
$280M67%
Variable $105M
25%
Discretionary $35M
8% Fixed Staff costs28%
Technology30%
Premises 7%
Processing & Royalties
11%
Variable Staff Costs14%
FY2018 Expense Breakdown
Expenses$420M
Investments in building capabilities to support growth FY2018 expense of $420M , up 5% from a year ago FY2019 Operating Expense Guidance: $445M to $455M
21
Disciplined in our expenditure
Fixed costs – 67%Variable costs – 25%Discretionary costs – 8%
Variable costs – Processing & Royalties expenses are volume-related
Discretionary costs – Focused on distribution capabilities and client-related activities.
+11% or $43M
Note: Numbers may be subject to rounding.
FY2015 Expense Breakdown

Delivered new systems and platforms to support growth Invested in enhancing capabilities in Derivatives, Fixed Income and Post Trade FY2018 Technology CAPEX of $65M, in line with guidance FY2019 CAPEX Guidance: $60M to $65M
22
Note: All figures in $ millions unless otherwise stated and may be subject to rounding

Revised Dividend policy to support growth
23
5 Year Dividend History
Aims to provide sustainable and growing returns for shareholders
1 Previous dividend policy: For each financial year, the Board aims to pay, as dividend, an amount which is no less than (a) 80% of the annual net profit after tax; or (b) 20 cents per share, whichever is higher.
Aims to pay a sustainable and growing dividend over time, consistent with the company’s long-term growth prospects. Dividends will be paid on a quarterly basis and will be at the discretion of the Board1
Shareholders will receive returns earlier. Potential growth in dividends when SGX performs well
In 1Q FY2019, we paid a higher dividend of 7.5 cents per share each quarter, up 2.5 cents (50%) from 5 cents per share
Provides flexibility to balance dividend payments with the need to retain earnings to support growth
Equities & Fixed Income Business
24

$86M21%
$221M54%
$99M24%
Issuer Services
Securities Trading and Clearing
Post Trade Services
Revenue$407M
FY2018
OverviewEquities and Fixed Income
25
Issuer Services
revenue
$86M, up 3% y-o-y
Securities Trading and Clearing
revenue
$221M, up 8% y-o-y
Post Trade Services
revenue
$99M, down 14% y-o-y
Note: Numbers may be subject to rounding.
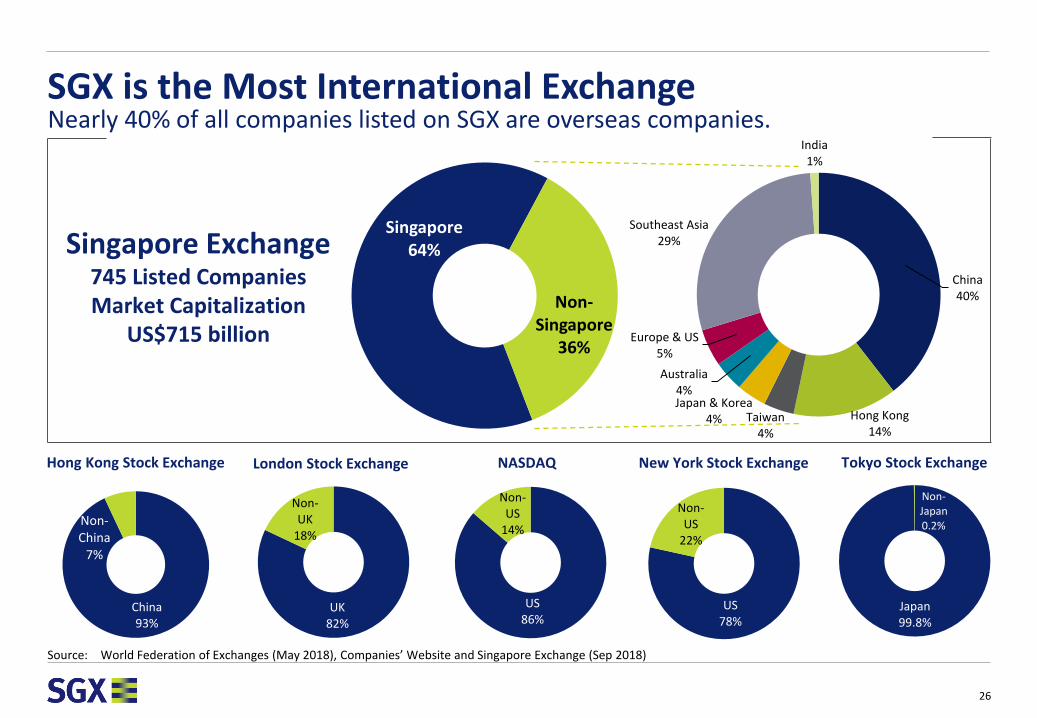
Singapore 64%
Non-Singapore
36%
China40%
Hong Kong14%
Taiwan4%
Japan & Korea4%
Australia4%
Europe & US5%
Southeast Asia29%
India1%
SGX is the Most International Exchange
26
Nearly 40% of all companies listed on SGX are overseas companies.
UK82%
Non-UK
18%
London Stock Exchange
US78%
Non-US
22%
New York Stock Exchange
China 93%
Non-China
7%
Hong Kong Stock Exchange
Japan99.8%
Non-Japan0.2%
Tokyo Stock Exchange
US86%
Non-US
14%
NASDAQ
Singapore Exchange745 Listed CompaniesMarket Capitalization
US$715 billion
Source: World Federation of Exchanges (May 2018), Companies’ Website and Singapore Exchange (Sep 2018)
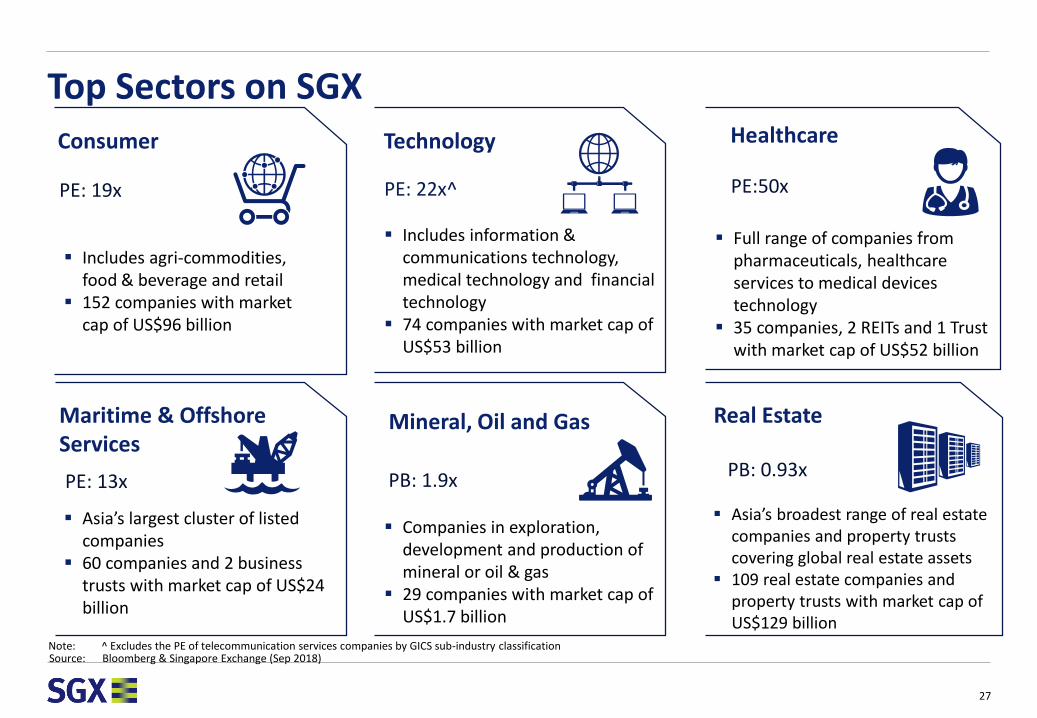
Top Sectors on SGX
27
Includes information & communications technology, medical technology and financial technology
74 companies with market cap of US$53 billion
Asia’s largest cluster of listed companies
60 companies and 2 business trusts with market cap of US$24 billion
Technology
Maritime & OffshoreServices
Includes agri-commodities, food & beverage and retail
152 companies with market cap of US$96 billion
Full range of companies from pharmaceuticals, healthcare services to medical devices technology
35 companies, 2 REITs and 1 Trust with market cap of US$52 billion
Companies in exploration, development and production of mineral or oil & gas
29 companies with market cap of US$1.7 billion
Consumer Healthcare
Mineral, Oil and Gas
PE: 22x^
PE: 13x
Asia’s broadest range of real estate companies and property trusts covering global real estate assets
109 real estate companies and property trusts with market cap of US$129 billion
Real Estate
PB: 0.93xPB: 1.9x
PE:50xPE: 19x
Source: Bloomberg & Singapore Exchange (Sep 2018)Note: ^ Excludes the PE of telecommunication services companies by GICS sub-industry classification

$1.10B $1.10B $1.12B
$1.26B
FY15 FY16 FY17 FY18
32
2023 22
FY15 FY16 FY17 FY18
$11.5B $12.9B $12.2B $12.6B
Growing Listings And Trading ActivitiesHigher funds raised, healthy IPO Pipeline, and Increasing Daily Trading Activity
Equity Listings
22 listings in FY2018, 4% lower YoY
S$12.6B funds raised, 3% higher YoY
Equity Listings1 and funds raised2
Source: SGX
Trading Activities
FY2018 SDAV 12% higher YoY
Total Market Capitalization of $991 Billion
New Single-Stock DLCs introduced on 7 Nov
Securities Daily Average Traded Value (SDAV)
1 Equity listings include Initial Public Offerings (IPOs) and Reverse Takeovers (RTOs) | 2Includes Placement, Rights and Warrants
28

Build Liquidity & Profile CompaniesContinuing our efforts in increasing trading activity
29
Reaching out to 140,000 retail investors each
quarter
More than 30 articles published
per quarter
Connecting ~40 listed companies
with ~200 investorsevery quarter
Corporate Access
Program
Education Outreach
Over 260,000 subscribers
today
SGX MyGateway
SGX Research
2 million online views perquarter
SGX StockFacts
Market Makers & Liquidity Providers
Enhance market quality and lower transaction cost

487 349
8191,154
FY2015 FY2016 FY2017 FY2018
Fixed Income Listings and Funds Raised
Increase In Fixed Income Listings And Market Share
G3 Asia Pac bonds share of issuance
41% in FY2018
Most global bond listing venue in Asia
More than 80% of
listed debt securities are by foreign issuers
SGX Bond Pro platform
1st Over-The-Counter
trading venue dedicated to Asian bonds
$172B
$385B
$185B
30
$482B

Derivatives Business
31

$237M70%
$103M30%
Equity, FX and Commodities
Collateral management, membership and others
OverviewDerivatives
Revenue $340M
32
FY2018
Equity, FX and Commodities
revenue
$237M, up 8% y-o-y
Collateral management, license and membership fees revenue
$103M, up 24% y-o-y
Note: Numbers may be subject to rounding.
Exchange of the Year – Derivatives: FOW Asia Capital Markets Awards 2018 Asia-Pacific Derivatives Exchange of the Year: GlobalCapital 2018

SGX Nifty 50
SGX Nifty IT
SGX Nifty CPSE
SGX Nifty Bank
SGX Nifty Midcap 50
Equity Index Futures & Options
SGX MSCI IndiaEquity Index
Futures
INR/USDFX futures,
options, forwards
The only liquid offshore access to China and India
33
Our Platform
An integrated Trading and Clearing System offering low-latency high-throughput and enhanced risk controls and system safeguards
Round-the-clock trading
Delivering Asia's broadest range of listed derivatives across China, Japan, India, Taiwan and ASEAN
Efficient client connectivity by putting together an ecosystem of users trading and clearing on-exchange or OTC
Capital efficiency through the netting of margins
SGX FTSE China A50Equity Index
Futures
MSCI ChinaEquity Index Futures and
Options
USD/CNH, CNY/USD,
CNY/SGD, EUR/CNH,
SGD/CNH
FX futures
China India
Iron Ore
Commodities, Futures, Swaps, Options
33
Complementary products, margin netting efficiencies
SSFs on 50 Indian stocks
Single Stock Futures

Liquid Currency Futures
34
China(USD/CNH, CNY/USD, CNY/SGD, EUR/CNH,
SGD/CNH)Korea(KRW/USD, KRW/JPY)
Japan(USD/JPY)
Taiwan(TWD/USD)
Thailand(THB/USD)
India(INR/USD)
cv
Singapore(USD/SGD) Australia
(AUD/USD, AUD/JPY)
Note: Data as at 30 Sep 2018
Asia’s Best FX Exchange & Clearing House – by FX Week (2018)
Malaysia(MYR/USD, MYR/SGD)
cv
Philippines(PHP/USD)

Market Data & Connectivity Business
35

38 40 42
4953
56
FY2016 FY2017 FY2018
9398
Market infrastructure business driven by increased use of technology in trading
Supports Securities and Derivatives Trading:
Data: Price data, Company Announcements, Financial Indices
Connectivity: Trading system connections, Network linkages and Data center co-location
OverviewMarket Data And Connectivity
Note: Numbers may be subject to rounding.
Market Data
Connectivity
36
87

SGX Index Edge Index business established to take advantage of global shift to index-based investing
Global Exchange Traded Products (index-based) have AUM of > US$4tn
Index funds (unlisted) has grown >230% to > US$ 6tn since 2007
SGX Proprietary Indices
Domestic Indices- SGX Thematic indices e.g. S-REIT 20- SGX Sustainability index
Regional Indices- SGX Developed Asia Quality Dividend Index- SGX APAC Dividend REIT
Index Calculation Service
Calculating for leading investment banks and asset managers
Flexible index engine for calculating and disseminating wide variety of indices
Strong governance framework to meet regulatory requirements
37
SGX Index Edge – Best Index Provider at Structured Retail Products Asia-Pacific Awards (2018)

Appendix
38

Cross Margining Efficiencies Correlated products, margin netting efficiencies
65% Margin offset
Mini Nikkei 225Index Futures
MSCI
TaiwanIndex Futures
45% Margin offset
FTSE China A50 Index Futures
USD/CNHFX futures
30% Margin offset
Iron OreSwaps
USD/CNHFX futures
Note: Based on Margin Schedule as of 7 September, full schedule available on SGX website
+ correlation
- correlationLong – Long
spread
Long – Shortspread
Note:
39

Cross Margining Example More exposure with the same amount of margins
Note: Based on FX rate as of 21 September Based on Margin Schedule as of 7 September, full schedule available on SGX website
US$100kUSD/CNHFX futures
Issuer Services
US$100kFTSE China A50 Index Futures
Outright Margin
US$7,200~US$1,400* US$8,600
~US$3,800 Margin savingsMore efficient use of capital
~US$1,400* x 55%
≈ US$800US$7,200 x 55%
≈ US$4,000 US$4,800
Cross product margin offset
45%
MarginsExposure
40

High operating margin business
41
Operating Income Margin Trends
Segment FY2016 FY2017 FY2018
Equities and Fixed Income 55.6% 56.0% 55.1%
Derivatives 42.5% 39.7% 43.7%
Market Data and Connectivity 52.0% 58.9% 53.3%
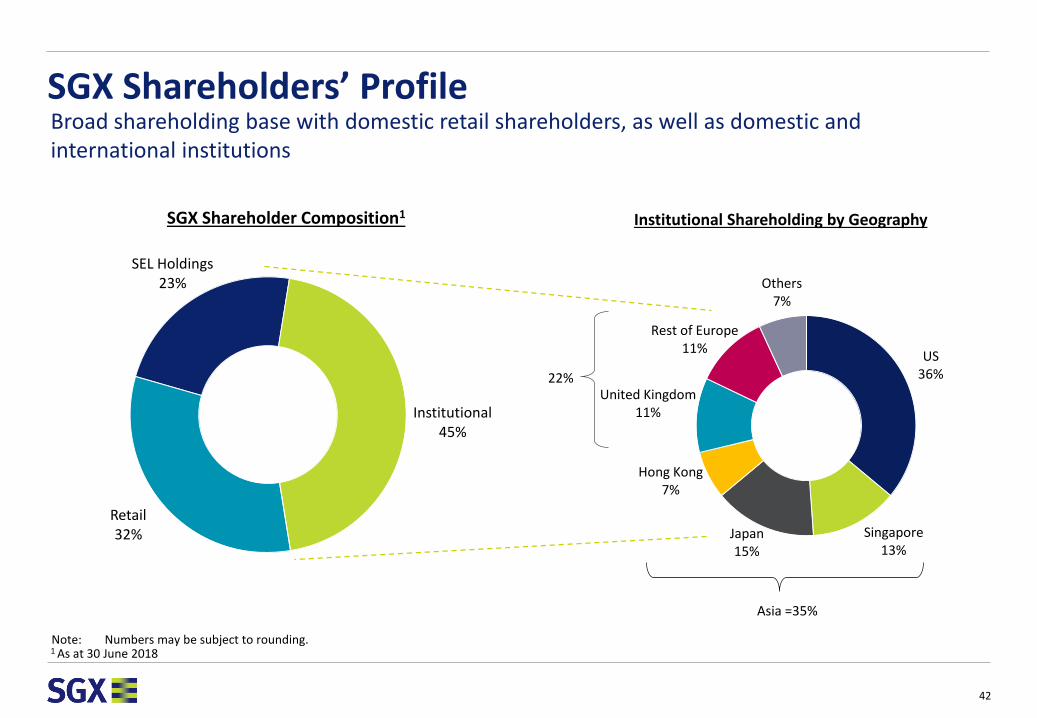
SEL Holdings23%
Institutional 45%
Retail32%
SGX Shareholder Composition1
US36%
Singapore13%
Japan15%
Hong Kong 7%
United Kingdom11%
Rest of Europe11%
Others7%
Institutional Shareholding by Geography
22%
SGX Shareholders’ Profile
42
Broad shareholding base with domestic retail shareholders, as well as domestic and international institutions
Asia =35%
1 As at 30 June 2018Note: Numbers may be subject to rounding.

Consumer19%
Energy7%
Financials 5%
Healthcare4%
Industrials30%
IT9%
Materials6%
Real Estate15%
Telecomms2%
Utilities1%
Diversity of Industries on SGX
43
SGX is the listing venue of choice for companies from varying sectors
Breakdown by Market Capitalisation
US$715 billion in total
Breakdown by Number of Companies
745 companies in total
Note: Companies without GICs Sector Classification not includedSource: Singapore Exchange & Bloomberg (Sep 2018)
Consumer13%
Energy1%
Financials30%
Healthcare7%
Industrials22%
IT1%
Materials1%
Real Estate18%
Telecomms7%
Utilities1%

sgx.com
Singapore ExchangeBeijing Hong Kong London Mumbai New York San Francisco Shanghai Tokyo Chicago
Thank You
Forward Looking Statements
This presentation may contain forward-looking statements that involve assumptions, risks and uncertainties. Statements in this presentation that are not historical facts are statements of future expectations with respect to the financial conditions, results of operations and businesses, and related plans and objectives. These forward-looking statements are based on SGX’s current intentions, plans, expectations, assumptions and views about future events and are subject to risks, uncertainties and other factors, many of which are outside SGX’s control. Because actual results, performance or events could differ materially from SGX’s current intentions, plans, expectations, views and assumptions about the future, such forward-looking statements are not, and should not be construed as a representation as to future performance of SGX. It should be noted that the actual performance of SGX may vary significantly from such statements.
This presentation is being made available to certain authorised recipients for their general information only.
While SGX and its affiliates have taken reasonable care to ensure the accuracy and completeness of the information provided in this presentation, they will not be liable for any loss or damage of any kind (whether direct, indirect or consequential losses or other economic loss of any kind) suffered due to any omission, error, inaccuracy, incompleteness, or otherwise, any reliance on such information. Neither SGX nor any of its affiliates shall be liable for the content of information provided by or quoted from third parties. Examples provided are for illustrative purposes only. The information in this presentation is subject to change without notice.
Any recirculation, transmission or distribution of this presentation or any part thereof by any third party requires the prior written permission of SGX. SGX and its affiliates disclaim all responsibility and liability arising in connection with any unauthorised recirculation, transmission or distribution of this presentation or any part thereof.
© Singapore Exchange Limited
SGX Investor Relations Contact:
Dominic Lim, Head of Investor Relations Joyce Koh, Associate Director, Investor RelationsTel: (65) 6236 5395, Email: [email protected] Tel: (65) 6236 8356, Email: [email protected]