Embed Size (px)
Citation preview

GlobalDevelopmentFinanceHarnessing Cyclical Gains for Development
I: Analysis and Summary Tables
gdf_0i-01.qxd 4/6/04 1:04 PM Page i

gdf_0i-01.qxd 4/6/04 1:04 PM Page ii

T H E W O R L D B A N K
GlobalDevelopmentFinanceHarnessing Cyclical Gains for Development
2004I : A N A L Y S I S A N D S U M M A R Y T A B L E S
gdf_0i-01.qxd 4/6/04 1:04 PM Page iii

© 2004 The International Bank for Reconstruction and Development / The World Bank1818 H Street, NWWashington, DC 20433Telephone 202-473-1000Internet www.worldbank.orgE-mail [email protected]
All rights reserved.
1 2 3 4 07 06 05 04
This volume is a product of the staff of the World Bank. The findings, interpretations, and conclusions expressed herein do not necessarily reflect the views of the Board of Executive Directors of the World Bank or the governments they represent.
The World Bank does not guarantee the accuracy of the data included in this work. The boundaries, colors, denominations, and other information shown on any map in this work do not imply any judgment on the part of the World Bank concerning the legal status of any territory or the endorsement or acceptance ofsuch boundaries.
Rights and Permissions
The material in this work is copyrighted. Copying and/or transmitting portions or all of this work without permission may be a violation of applicable law. The World Bank encourages dissemination of its work and will normally grant permission promptly.
For permission to photocopy or reprint any part of this work, please send a request with complete information to the Copyright Clearance Center, Inc., 222 Rosewood Drive, Danvers, MA 01923, USA; telephone: 978-750-8400; fax: 978-750-4470; www.copyright.com.
All other queries on rights and licenses, including subsidiary rights, should be addressed to the Office of the Publisher, World Bank, 1818 H Street NW, Washington, DC 20433, USA; fax: 202-522-2422; e-mail: [email protected].
Cover photo of women building a road in Indonesia. © Nik Wheeler/CORBIS.Cover design: Fletcher Design.
ISBN 0-8213-5740-9ISSN 1020-5454
The cutoff date for data used in this report was March 12, 2004. Dollars are current U.S. dollars unlessotherwise specified.
gdf_0i-01.qxd 4/6/04 1:04 PM Page iv

Table of Contents
Foreword xi
Acknowledgments xiii
Abbreviations xv
Overview and Policy Messages: Harnessing Cyclical Gains for Development 3
Chapter 1 The Global Upturn and the Need for Adjustment 13Adjustment, recovery, and imbalances in the high-income countries 15Developing countries: a favorable outlook, but risks remain 20Regional prospects 25Advanced-economy policies and the outlook for development finance 33Note 34References 34
Chapter 2 Private Debt Finance for Developing Countries 37Conditions affecting the supply of funds 38Conditions affecting the demand for funds 41Ongoing structural change in financing 44Bond flows responded strongly to the external environment and domestic conditions 45Bank lending picked up 52Progress in reforming the international financial architecture 58Prospects for private debt flows 63Notes 63References 64Annex: Commercial Debt Restructuring 65
Chapter 3 Shifting Forms of Equity Finance for Developing Countries 77Trends in FDI flows in 2003 78The shifting composition of FDI toward services 82Trends in portfolio equity flows to developing countries 90Why portfolio equity flows are so much smaller than FDI and debt flows 94Prospects for 2004–2005 96Annex A FDI Forecasting Model 100Annex B Top 25 International Equity Deals in 2003 101Notes 102References 103
v
gdf_0i-01.qxd 4/6/04 1:04 PM Page v
G L O B A L D E V E L O P M E N T F I N A N C E 2 0 0 4
Chapter 4 The Changing Landscape for Official Flows 107Recent trends in official flows 108Prospects for a rise in official aid 110Strategic considerations and aid flows 113Progress in raising aid effectiveness 115The Heavily Indebted Poor Countries Initiative 119The growing importance of international civil society in development 119Notes 123References 124
Chapter 5 Financing Developing Countries’ Trade 127Evolution in the sources, magnitude, and methods of trade finance 128Access of less creditworthy borrowers to trade finance 137Trade finance in times of crisis 140Notes 144References 145
Chapter 6 The Challenge of Financing Infrastructure in Developing Countries 149The changing balance between the public and private sectors 151Recent developments in private external financing 154Unlocking the potential of the global capital markets 161Notes 165References 166
Appendix A: Enhancing the Developmental Effect of Workers’ Remittances to Developing Countries 169
Appendix B: Summary Statistical Tables 175
Tables1 Net capital flows to developing countries, 1997–2003 42 Net private capital flows to developing countries, 1997–2003 8
1.1 Global outlook in summary, 2002–2006 141.2 Financing of U.S. current account deficit, 1999–2003 181.3 Export revenues of developing countries, 2000–06 221.4 Developing-country growth, 1991–2006 241.5 Growth in Europe and Central Asia, 1991–2006 251.6 Growth in South Asia, 1991–2006 271.7 Growth in East Asia and Pacific, 1991–2006 281.8 Growth in Sub-Saharan Africa, 1991–2006 291.9 Growth in the Middle East and North Africa, 1991–2006 301.10 Growth in Latin America and the Caribbean, 1991–2006 33
2.1 Net debt flows to developing countries by region, 2000–03 372.2 Gross market-based debt flows to developing countries, 2000–03 382.3 Declining severity of contagion over time 402.4 Selected indicators of debt burden, 1997–2003 442.5 Net bank flows to developing countries, 2001–03 522.6 Average spreads on medium- and long-term announced loans, 1999–2003 53
vi
gdf_0i-01.qxd 4/6/04 1:04 PM Page vi

T A B L E O F C O N T E N T S
2.7 International claims of BIS-reporting banks 552.8 Covenants of bond issues with CACs 60
3.1 Net FDI inflows to developing countries, 1997–2003 783.2 Estimates of South-South FDI flows to 30 developing countries, 1995–2001 813.3 Average share of services in FDI flows and in GDP 823.4 FDI in services, by investment climate in selected economies 853.5 Composition of FDI by region, 1995–2002 873.6 Net inward portfolio equity flows to developing countries, 1995–2003 913.7 Forecast for equity flows to developing countries, 2002–05 983A.1 Regression results of FDI forecasting model 100
4.1 Net official development assistance, 1990–2002 1084.2 Net official financing of developing countries, 1990–2003 1104.3 Aid commitments and announcements after the Monterrey Conference, March 2002 1114.4 Net ODA to Afghanistan and neighboring countries, 1998–2002 1134.5 Quality of governance, institutions, and public services during the 1990s 1184.6 Debt indicators for HIPCs that have reached decision point 1194.7 Aid from private voluntary organizations, 2001 120
5.1 Ratio of officially supported export credits to imports 1385.2 Use of trade credit before and after East Asian crisis of 1997–98 143
6.1 International investment in developing countries’ infrastructure as a share of total gross domestic capital formation, 1992–2003 155
6.2 Infrastructure bond issuance, 1994–2003 1576.3 Total global international bank lending and bond issuance, 1990–2003 161
Figures1 Net financial flows to developing countries, 1992–2003 32 Developing countries’ current-account balance, 1997–2003 53 Spreads on emerging-market bonds, January 2002–February 2004 64 Global current-account balances, 2003 6
1.1 Contribution of investment to global GDP growth, 1998–2006 131.2 Corporate profits in Japan and the United States, 2001–04 151.3 Short-term interest rates in the Euro zone, Japan, and the United States, 2001–04 161.4 Long-term interest rates (10-year government bond yields) in the Euro zone, Japan, and the
United States, 2001–04 171.5 Net financial flows to the United States, 2000–03 181.6 GDP growth in low- and middle-income and high-income countries, 2002–03 201.7 Contributors to GDP growth in developing countries by demand component, 2002–03 201.8 Growth in imports and exports of goods and nonfactor services, 2003 221.9 Global import growth and developing countries’ contribution, 1998–2003 221.10 Sub-Saharan African oil production as a share of world oil production, 1994–2003 301.11 Volatility of export growth in Latin America and the Caribbean, 1971–2003 33
2.1 Debt flows to developing countries, 1995–2003 382.2 Yields on debt to developing and developed countries, 1990–2003 392.3 Distribution of daily change in spreads, Jan. 1998–Oct. 2003 39
vii
gdf_0i-01.qxd 4/6/04 1:04 PM Page vii

G L O B A L D E V E L O P M E N T F I N A N C E 2 0 0 4
2.4 U.S. corporate profits, 2000–03 412.5 Spreads on developing countries and on developed-country high-risk debt, 1990–2003 412.6 Quality of developing-country credit, 1998–2003 432.7 International reserves of developing countries, 1993–2003 442.8 Growth in private debt and share of bank lending in private debt, 1971–2002 452.9 Credit default swap spreads for all developing countries and selected regions 462.10 Emerging market spreads, 2002–04 462.11 Episodes of compression in developing-country spreads, 1993–2003 482.12 Decline in developing-country spreads by credit-risk category 482.13 Bond issuance from developing countries, 2002–03 492.14 Sovereign bond issuance, 1997–2003 512.15 Breakdown of bond issues by type of borrower, 2003 512.16 Average spreads on new bond issuance, 1991–2003 512.17 Cross-border claims of BIS-reporting banks, 1995–2003 542.18 Foreign lending of Japanese banks to developing countries, 1983–2003 552.19 Foreign lending of U.S. banks to developing countries, 1983–2003 552.20 Lending of BIS-reporting banks to developing countries, 1983–2003 562.21 Local-currency claims and liabilities in developing countries, 1983–2003 572.22 Spanish banks’ foreign and local currency lending to developing countries, 1985–2003 572.23 International bank lending to Africa, 1983–2003 58
3.1 Net inward FDI flows to developing countries, 1995–2003 783.2 FDI inflows to the world and developing countries, 1997–2003 783.3 Privatization and M&A in developing countries, 1995–2003 793.4 FDI as share of GDP in developing countries, 1995–2003 793.5 Regional shares in FDI 813.6 Sectoral composition of FDI stock in developing countries in 2002 823.7 Indexes of restrictions on FDI in selected sectors of advanced economies 833.8 The recent decline in FDI in the Latin American service sector 843.9 Repatriated earnings and called intercompany loans in Argentina and Brazil 863.10 Composition of FDI flows in developing countries, 1995–2002 863.11 Decline of intercompany loans versus equity component of FDI during financial crises 873.12 Intercompany loans and private debt flows in Brazil, 1990–2002 873.13 U.S. reinvested earnings and income in OPEC mining sector, 1995–2002 883.14 U.S. reinvested earnings and income in selected regions, 1995–2002 903.15 Portfolio equity flows, 1990–2003 913.16 Gross equity flows to developing countries and emerging-market stock prices 913.17 Sectoral composition of gross flows in 2003 923.18 Currency composition of gross flows in 2003 923.19 Number of listed stocks on selected developing-country exchanges, by region 933.20 Stock market performance in the United States, Europe, and Japan 933.21 Equity issuance by public and private sector firms, 1990–2003 943.22 The rise in M&A and the decline in portfolio equity flows, 1994–2002 943.23 Market capitalization as share of GDP 953.24 Annualized volatility in developed- and developing-country stock and bond
markets, 1990–2003 95
4.1 Net official development assistance to developing countries, 1990–2002 1074.2 Geographical distribution of IBRD prepayments, 2002 1104.3 Geographical distribution of official development assistance from the European
Union, 2002 112
viii
gdf_0i-01.qxd 4/6/04 1:04 PM Page viii

T A B L E O F C O N T E N T S
4.4 Possible commitments and disbursement under the International Finance Facility, 2006–32 112
4.5 Reasons for additional aid to a country 1134.6 Distribution of donor pledges made at Madrid Conference, October 2003 1144.7 Full, interim, and potential PRSPs, by country, January 2004 117
5.1 Trade finance from market-based sources, 1980–2002 1285.2 Share of trade finance in total bank lending, 1980–2002 1285.3 Business covered by export credit agencies and private insurers in Berne Union member
countries, exports of 1985–2002 1305.4 Trade finance for developing countries from public sector or guaranteed by official sector,
1980–2002 1315.5 Net cash flow from Berne Union members, 1982–2001 1325.6 Evolution of trade credit as a share of sales in developing countries, 1992–2001 1345.7 Use of trade credit as working capital, by size of firm 1375.8 Trade finance from commercial banks, by investment rating, 1980–2003 1375.9 Countries receiving the most official export credits, 1999–2001 1385.10 Countries with the highest ratios of export credits to imports, 1999–2001 1385.11 Ratio of officially supported export credits to imports, 1991–2001 1395.12 Use of trade credit to finance working capital, by type and size of firm 1395.13 Percentage of sales on credit, by type and size of firm 1395.14 Percentage of sales on credit, by type and size of firm 1405.15 Percentage of sales on credit, by type and size of firm 1405.16 New commitments of export credit agencies in years following crises 142
6.1 Regional composition of international investment in infrastructure, 1992–2003 1496.2 The growth of mobile telecommunications and the Internet, 1995–2003 1526.3 Status of electrical power sector privatization in developing countries, 2001 1536.4 Private financial flows to developing countries’ infrastructure, 1994–2003 1556.5 Bond financing for developing-country infrastructure, 1992–2003 1576.6 Investment in developing-country infrastructure with private participation, 1995–2002 1586.7 Average regional credit quality, 1995–2002 1586.8 Global annual average of debt financing for infrastructure, 1990–2003 1586.9 Risk of investing in telecommunications and electricity, 1995–2003 1586.10 Share in infrastructure-related bank lending 1596.11 Stock market behavior of global telecommunications and electricity industries,
1995–2003 159
Boxes1.1 Reserve accumulation in developing countries 181.2 The fiscal response of low- and middle-income countries to the downturn 211.3. Commodity prices and exchange rates 231.4 The integration dividend in Central Europe 261.5 The benefits and hazards of oil funds 32
2.1 General risk appetite and sentiment toward developing countries 422.2 The developing-country credit-default swap market 462.3 Characteristics of developing-country spread measures 472.4 Evolution of markets for developing-country international bonds 492.5 The impact of Argentine “pesification” on BIS banking statistics 56
ix
gdf_0i-01.qxd 4/6/04 1:04 PM Page ix

G L O B A L D E V E L O P M E N T F I N A N C E 2 0 0 4
2.6 Will experience in Argentina reverse the shift toward local operations? 572.7 Collective action clauses 592.8 How Basel II affects developing-country risk weights 62
3.1 The sharp decline in direct investment in Brazil 803.2 FDI for call centers 833.3 Political risk insurance 853.4 Components of FDI 863.5 Factors affecting dividend repatriation 893.6 Emerging-market stocks—a separate asset class? 963.7 The growing popularity of exchange-traded funds 97
4.1 Defining aid 1094.2 Aid and the challenges of postconflict reconstruction 1144.3 Aid from nongovernmental organizations 121
5.1 The decline in documentation requirements for trade finance loans 1295.2 Social responsibility and export credit agencies 1335.3 Factoring 135
6.1 Growing demand for infrastructure services in developing countries 1506.2 Measuring capital flows to developing countries’ infrastructure 1516.3 Phu My 3—An example of the multisource nature of infrastructure finance 1556.4 Key characteristics of syndicated bank lending to infrastructure 1566.5 Systemic risk associated with investing in telecommunications and electricity 1606.6 Multilateral development bank spending on infrastructure in recent years 164
x
gdf_0i-01.qxd 4/6/04 1:04 PM Page x
Foreword
NEVER BEFORE HAVE DEVELOPEDand developing countries shared such astrong interest in ensuring the stable
growth of international capital flows. Both Southand North stand to benefit from the recovery nowunder way in the global economy, which coincideswith a rebound in financial flows to developingcountries. The key question for policymakers is howto channel these gains into investments that promotedevelopment and sustainable poverty reduction.
The external environment for developingcountries improved in 2003 as global growthgained momentum and as private capital flows re-covered from the subdued levels of the past fiveyears. The recovery in private flows was encour-aged by expansionary monetary policies in the ad-vanced economies and structural improvements inthe developing world. There are, however, impor-tant risks that need to be addressed. High-incomecountries need to adjust toward a more balancedpattern of economic growth and more sustainablefinancing of current account imbalances. The U.S.current account deficit is now more than 5 percentof gross domestic product, and its financing hasimportant implications for the sustainability of theglobal economic recovery. The nature and timingof the necessary adjustments will depend on sev-eral factors, including how fast economic activitypicks up in the rest of the world—particularly inthe Euro area—and the success of policymakers infacilitating orderly adjustments in exchange rates.Should the resolution of imbalances in theadvanced economies eventually require an abruptadjustment in international financial markets, in-cluding a sharp increase in interest rates, the flowof capital to developing countries might be ad-versely affected.
Structural measures to promote stabilityshould continue to be pursued, including length-ening the maturity and depth of markets foremerging-market bonds, enhanced transparencyand adherence to standards and codes, and the in-clusion of collective action clauses in international
xi
.
bond covenants. It will be important for govern-ments in developing countries to maintain prudentmacroeconomic policies and to persevere withreforms designed to consolidate the improvementin credit quality. Maintaining the confidence of in-vestors and creditors, particularly in the face of po-litical uncertainties linked to forthcoming electionsin several countries, will be important, as will beavoiding an accumulation of excessive, especiallyshort-term, debt. Pursuing these measures will re-duce their vulnerability to adverse financial shocks.
To maximize the development impact of thesecyclical gains, capital flows should be channeledinto areas where they can lay the foundation forlong-term economic growth, international compet-itiveness, and the expansion of trade. Increased in-vestment in infrastructure stands out as an urgentneed, with more than a billion people lackingaccess to safe drinking water, 2.4 billion withoutadequate sanitation, and 1.4 billion without accessto power. Promoting new capital investment ininfrastructure requires promoting balanced public-private partnerships, with appropriate risk distrib-ution. International financial institutions can sup-port this process by creating the conditions underwhich unmet needs can be converted into invest-ment opportunities that are attractive to globalcapital markets.
Access to capital flows must be broadened.With the exception of trade finance, private capitalflows remain heavily concentrated in a few coun-tries and regions. In 2003, just ten countries ac-counted for 69 percent of foreign direct investmentin the developing world, while only five accountedfor 60 percent of total bond issuance.
Official development assistance is still an im-portant source of external finance for many coun-tries. But, as private capital flows have rebounded,official aid flows have risen only slightly andremain below the levels needed to achieve theMillennium Development Goals. To meet the goals,along with the expectations raised by the launchingof the World Trade Organization (WTO) Doha
gdf_0i-01.qxd 4/6/04 1:04 PM Page xi
G L O B A L D E V E L O P M E N T F I N A N C E 2 0 0 4
Development Round in 2001, donor countriesmust deliver on their pledges to increase aid andreduce debt owed by the poorest countries, andlower agricultural subsidies and trade barriers. Thefailure to reach agreement at the Cancún WTOtalks in September 2003 makes finding additionalsources of finance for these countries especially ur-gent within the context of broader efforts by theinternational community to shape coherent andmutually reinforcing aid and trade policies.
Global Development Finance is the WorldBank’s annual review of the external financial con-ditions facing developing countries. The current
volume provides analysis and summary tables onselected macroeconomic indicators and financialflows. A separate volume contains detailed, stan-dardized external debt statistics for 136 countries.More information on the analysis, including addi-tional material, sources, background papers, and aplatform for interactive dialogue on the key issuescan be found at www.worldbank.org/prospects.
François BourguignonSenior Vice President and Chief EconomistThe World Bank
xii
gdf_0i-01.qxd 4/6/04 1:05 PM Page xii

Acknowledgments
THIS REPORT WAS PREPARED BY THEInternational Finance Team of the Develop-ment Prospects Group (DECPG) and drew
on resources throughout the Development Econom-ics Vice Presidency, the World Bank operationalregions, the International Finance Corporation, andthe Multilateral Investment Guarantee Agency.
The principal author was Mansoor Dailami,with direction by Uri Dadush. The report wasprepared under the general guidance of WorldBank Chief Economist and Senior Vice PresidentFrançois Bourguignon. The main authors for eachchapter were as follows:
Overview Mansoor Dailami, with contribu-tions from the International FinanceTeam
Chapter 1 Annette I. De Kleine, Mick Riordan,Hans Timmer, Kevin Barnes, andMansoor Dailami
Chapter 2 Himmat Kalsi and Kevin Barnes Chapter 3 Dilip Ratha, Dilek Aykut, and Eung
Ju KimChapter 4 William Shaw and Neil BushChapter 5 William Shaw, Himmat Kalsi, Neil
Bush, and Neeltje Van HorenChapter 6 Mansoor Dailami, with the assis-
tance of Neil Bush and Eung Ju KimAppendix A Dilip Ratha
The statistical appendix was prepared by EungJu Kim, Kevin Barnes, Fernando Martel-Garciaand Abhijeet Dwivedi of DECPG; the FinancialData Team of the Development Data Group(DECDG), led by Ibrahim Levent and includingNevin Fahmy, Shelly Fu, Michael Lewin, andGloria R. Moreno; and Punam Chuhan of theGlobal Monitoring Secretariat. The financial flowand debt estimates were developed in a collabora-tive effort between DECPG and DECDG. Themain macroeconomic forecasts were preparedby the Global Trends Team of DECPG, led byHans Timmer and including John Baffes, Maurizio
xiii
.
Bussolo, Annette I. De Kleine, Betty Dow, RobertKeyfitz, Donald Mitchell, Mick Riordan, ShaneStreifel, and Bert Wolfe. The analysis and forecastswere also prepared in conjunction with the Bank’sregional chief economists: Shantayanan Devarajan(South Asia), Alan Gelb (Sub-Saharan Africa),Homi Kharas (East Asia and Pacific), Pradeep K.Mitra (Europe and Central Asia), Mustapha Nabli(Middle East and North Africa), and GuillermoPerry (Latin America and the Caribbean). RatikaNarag (Consultant) and Heather Milkiewicz(Brookings Institution) provided research assis-tance to appendix A and chapter 2, respectively.Background notes and papers were prepared byJohn Strong, Margaret Osius, Pierre-RichardAgenor, Dhruva Sahai, and Neeltje Van Horen.They are posted in the online version of the report.
The report also benefited from the commentsof the Bank’s Executive Directors made at an in-formal board meeting on March 10, 2004.
Many others from inside and outside the Bankprovided input, comments, guidance, and supportat various stages of the report’s publication.Martin Muhleisen (International Monetary Fund),Barbara Mierau-Klein, Mihir Desai (HarvardBusiness School), Amarendra Bhattacharya, JohnPanzer, and Nemat Shafik were discussants atthe Bank-wide review. In addition, within theBank, comments and help were provided by AsliDemirguc-Kunt, Hossein Razavi, Leora Klapper,Milan Brahmbhatt, Ziad Alahdad, Ajay Chhibber,Ranjit Lamech, Barbara Lee, Clive Harris, MarkDorfman, Shahrokh Fardoust, Coralie Gevers,Norbert Fiess, James Hanson, David Rosenblatt,Luis Serven, Mark Sundberg, Richard Newfarmer,Neil Roger, Mohammad Zia Qureshi, RaymundoMorales, Sergio Schmukler, and Marina Halac.
Outside the Bank, several people contributedthrough meetings, exchanges of views, and shar-ing perspectives on emerging issues. Theseinclude Charles Blitzer and Eliot Kalter (Interna-tional Monetary Fund); Cyrus Ardalan (BarclaysCapital); Robert Phillips (Cameron Mckenna);
gdf_0i-01.qxd 4/6/04 1:05 PM Page xiii

G L O B A L D E V E L O P M E N T F I N A N C E 2 0 0 4
Chris Salmon (Bank of England); Rachel Turner(U.K. Department for International Develop-ment); Kimberley Wiehl, Lenart Skarp, and NicKennedy (Berne Union); Janet West and SimonScott (OECD); Curt Fitzgerald (Exxon MobilCorporation); Deborah Fuhr (Morgan Stanley);and Paul Mielczarski and Nikolette Lekka (Credit-Suisse First Boston).
Steven Kennedy edited the report. MariaAmparo Gamboa and Katherine Rollins providedassistance to the team. Dorota Nowak managedproduction and dissemination activities byDECPG. Book design, editing, and productionwere coordinated by Cindy Fisher, Susan Graham,and Ilma Kramer of the World Bank Office of thePublisher.
xiv
gdf_0i-01.qxd 4/6/04 1:05 PM Page xiv

Selected Abbreviations
ACH Automated clearinghouseADB Asian Development BankADR American depository receiptAfDB African Development BankAGOA African Growth and Opportunity Act BIS Bank for International SettlementsBOT Build-operate-transferCAC Collective action clauseCDS Credit default swapCEEC Central and Eastern European countriesCIDA Canadian International Development
AgencyCIS Commonwealth of Independent StatesCP Currency pool DAC Development Assistance Committee (of the
OECD)DFID Department for International Development
(of the United Kingdom)EBRD European Bank for Reconstruction and
DevelopmentECA Export credit agencyECB European Central BankECLAC Economic Commission for Latin America
and the CaribbeanEIB European Investment BankEMBI Emerging Market Bonds IndexEMBIG Emerging Market Bonds Index—GlobalETF Exchange-traded fundEU European Union FDI Foreign direct investmentFIAS Foreign Investment Advisory Service
(of the World Bank)FPC First principal componentG-5 Group of Five (France, Germany, Japan, the
United Kingdom, and the United States)G-7 Group of Seven (Canada, France, Germany,
Italy, Japan, the United Kingdom, and the United States)
GATS General Agreement on Trade in ServicesGDP Gross domestic product GDR Global depository receiptGNFS Goods and nonfactor services
xv
.
GNI Gross national incomeHIPC Heavily indebted poor countriesIBRD International Bank for Reconstruction and
Development (of the World Bank Group)ICA International Court of ArbitrationICC International Chamber of CommerceICU Investment Climate Unit (of the World
Bank)IDA International Development Association
(of the World Bank Group)IDB Inter-American Development BankIFC International Finance Corporation (of the
World Bank Group)IFF International Finance FacilityIMF International Monetary FundIPO Initial public offeringIRB Internal-ratings-basedIRnet International Remittance NetworkJBIC Japan Bank for International CooperationLCIA London Court of International ArbitrationLCVI Liquidity, Credit, and Volatility Index (J.P.
Morgan)LIBOR London interbank offered rateLMIC Low- and middle-income countries M&A Mergers and acquisitions MCA Millennium Challenge AccountMDGs Millennium Development GoalsMIGA Multilateral Investment Guarantee Agency
(of the World Bank Group)NAFTA North American Free Trade AgreementNEPAD New Partnership for Africa’s DevelopmentNGO Nongovernmental organizationNPV Net present valueODA Official development assistanceOECD Organisation for Economic Co-operation
and DevelopmentOPEC Organization of Petroleum Exporting
Countries PAFTA Pan-Arab Free Trade AreaPPI Private participation in infrastructurePPP Purchasing power parityPRI Political risk insurance
gdf_0i-01.qxd 4/6/04 1:05 PM Page xv

G L O B A L D E V E L O P M E N T F I N A N C E 2 0 0 4
PRSP Poverty Reduction Strategy PaperSAARC South Asian Association for Regional
Cooperation SCP Single currency pool SWIFT Society for Worldwide Interbank Financial
Telecommunications U.N. United Nations UNCTAD United Nations Conference on Trade and
Development
UNDP United Nations Development ProgrammeUNIDO United Nations Industrial Development
OrganizationVAR Value at risk WOCCU World Council of Credit UnionsWTO World Trade Organization
xvi
gdf_0i-01.qxd 4/6/04 1:05 PM Page xvi

gdf_0i-01.qxd 4/6/04 1:05 PM Page 1

gdf_002-011.qxd 4/6/04 1:08 PM Page 2

Overview and Policy Messages: HarnessingCyclical Gains for Development
ASTRONG CYCLICAL RECOVERY INglobal capital flows to developing countriesis underway. Net private flows increased
sharply in 2003, reaching $200 billion—their high-est level since 1998. The rapid turnaround inprivate flows from the subdued levels of the twoprevious years occurred in all regions, exceptthe Middle East and North Africa. Flows toEurope and Central Asia were particularly strong,as eight transition countries approached acces-sion to the European Union in May 2004. Total netcapital inflows, including official flows, reached$228 billion (3.6 percent of developing-countrygross domestic product [GDP]), up from $191 bil-lion in 2002 (3.2 percent of GDP) (figure 1; table 1).At the same time, the credit quality of developingcountries improved markedly, and investor confi-dence is returning.
3
.
The recovery in capital flows is heavily influ-enced by cyclical factors—in particular the boost toliquidity arising from stimulative monetary policyin many advanced economies—but it also reflectsstructural improvements both in developing coun-tries and internationally. The net external liabilityposition of developing countries has strengthened,and the large-scale buildup in developing countries’official reserves—much of which is invested in thefinancial markets of advanced economies—hasintroduced a new dimension to the relationshipbetween the developed and developing worlds.More than ever, global capital flows, trade, andexchange-rate policies are intricately linked.
The challenge for international financial poli-cymakers will be to ensure that the cyclical recoveryin flows can be sustained over the medium term,and that it can be channeled into areas, such asinfrastructure, where it can lay the foundations forsustained growth and poverty reduction, therebyhelping to meet the Millennium DevelopmentGoals. It will be important to maintain investorconfidence, while avoiding the excesses—and in-creased vulnerability—that have accompaniedsurges in lending to developing countries in thepast. At the same time, aid flows have to increase.These are the central themes of this year’s GlobalDevelopment Finance.
The external environment fordeveloping countries has improved—due to the global economic recovery—
The signs of global recovery have becomeincreasingly evident over the past year, im-
proving the external environment for developingcountries. World economic growth accelerated
Figure 1 Net financial flows to developingcountries, 1992–2003
$ billions
0
100
150
200
250
300
350
50
20021996
Net private flows
Net official flows
2000199819941992
Source: World Bank Debtor Reporting System and staff estimates.
gdf_002-011.qxd 4/6/04 1:08 PM Page 3

G L O B A L D E V E L O P M E N T F I N A N C E 2 0 0 4
4
Table 1 Net capital flows to developing countries, 1997–2003$ billions
1997 1998 1999 2000 2001 2002 2003e For more detail
Current account balance �83.7 �102.4 �6.9 56.2 21.0 78.5 75.8 ——➤ Chapter 1as % of GDP �1.4 �1.8 �0.1 1.0 0.4 1.3 1.1
Financed by:Net equity flows 193.7 182.1 194.4 174.8 179.4 152.0 149.5 ——➤ Chapter 3
Net FDI inflows 171.1 175.6 181.7 162.2 175.0 147.1 135.2Net portfolio equity inflows 22.6 6.6 12.6 12.6 4.4 4.9 14.3
Net debt flows 105.3 57.6 13.8 �9.8 �1.2 7.3 44.3Official creditors 13.2 34.2 13.7 �5.9 26.9 4.1 �6.3 ——➤ Chapter 4
World Bank 9.2 8.7 8.8 7.9 7.5 �0.2 �1.9IMF 3.4 14.1 �2.2 �10.6 19.5 14.0 8.0Others 0.6 11.4 7.1 �3.1 �0.1 �9.7 �12.4
Private creditors 92.2 23.4 0.1 �3.9 �28.1 3.2 50.6 ——➤ Chapter 2Net medium- and long-term debt flows 84.2 87.0 22.4 5.2 �5.3 1.8 18.6Bonds 38.2 39.7 29.8 16.5 12.2 12.7 33.1Banks 43.9 52.4 �5.1 �5.8 �10.2 �3.9 �6.6Others 2.0 �5.1 �2.3 �5.5 �7.3 �7.0 �7.9
Net short-term debt flows 8.0 �63.6 �22.3 �9.1 �22.9 1.4 32.0
Balancing itema �162.5 �120.7 �163.1 �168.6 �119.0 �65.0 6.3Change in reserves �52.8 �16.6 �38.1 �52.6 �80.2 �172.9 �276.0 ——➤ Chapter 1(� � increase)
Memo items:Total foreign aid (grants) 25.3 26.7 28.5 28.7 27.9 31.2 34.3 ——➤ Chapter 4(excluding technical cooperation grants)
Net private flows (debt�equity) 285.8 205.5 194.5 170.9 151.3 155.3 200.2Net official flows (aid�debt) 38.4 60.9 42.2 22.8 54.8 35.3 28.0Total net capital flows (private�official) 324.3 266.5 236.7 193.7 206.1 190.6 228.2Infrastructure financeb 89.7 70.3 72.1 77.0 53.8 44.7 50.5 ——➤ Chapter 6Trade financec 24.2 16.1 17.0 21.4 19.3 21.1 23.7 ——➤ Chapter 5Workers’ remittances 66.1 62.9 67.6 68.4 77.0 88.1 93.0 ——➤ Appendix A
Note: e � estimate.a. Combination of errors and omissions and net acquisition of foreign assets (including FDI) by developing countries. Over the past two years,there has been a marked reduction in the net accumulation of international assets, other than official reserves, by developing-country residents.These flows are captured in the “balancing item.” One explanation for the reduction may lie in a—possibly temporary—reversal of such out-flows from China amid speculation about an adjustment in exchange-rate policy.b. The total volume of capital raised internationally through bank loans, bonds, and equity offering for developing countries’ infrastructure.c. The trade finance figures refer to gross publicly announced commitments from international banks for trade-related purposes. Thus, onlythe commercial bank lending component of trade finance is included.Sources: World Bank Debtor Reporting System and staff estimates; IMF, Balance of Payments Yearbook; and Dealogic Bondware and Loanware.
from an annual rate of 1.8 percent in 2002 to2.6 percent in 2003. It is forecast to jump to3.7 percent in 2004. With profit margins rising—and interest rates low—global investment is recov-ering strongly, laying the foundation for continuedgrowth. The recovery also reflects the strong stim-ulus created by the easing of fiscal and monetarypolicies in the advanced economies, notably in theUnited States, where the budget moved from a sur-plus equivalent to 1.6 percent of GDP in 2000 to adeficit of 4.6 percent of GDP in 2003. Low inter-est rates in many of the advanced economieshelped propel the growth in capital flows todeveloping countries; modest recent increases inlong-term interest rates so far have not sapped thatgrowth.
World commodity markets have moved in tan-dem with recovery in global economic activity.Non-energy U.S. dollar commodity prices in 2003averaged 10 percent above their 2002 levels, whilemetal prices—traditionally a reliable leadingindicator—surged toward the end of 2003, drivenpartly by the interest of fund investors.
—and an improvement in their net liabilitypositions—Seeking to avoid excessive reliance on external fi-nancing, developing countries, as a group, haverun large current account surpluses in recentyears. In 2003, the surplus in the developing worldamounted to $76 billion—about 1.1 percent ofGDP (figure 2). The pickup in growth during the
gdf_002-011.qxd 4/6/04 1:08 PM Page 4

O V E R V I E W A N D P O L I C Y M E S S A G E S : H A R N E S S I N G C Y C L I C A L G A I N S
year resulted in smaller current account surplusesin several countries, although these were largelyoffset by Brazil’s move into surplus.
Increased reliance on equity finance—togetherwith current account surpluses—has improved theexternal liability positions of developing countries.By 2003, the total external debt of developingcountries had declined to about 37 percent of theirGDP, compared with 44 percent in 1999. Despitethe recent increase in short-term lending, short-term external debt was about 15 percent of thetotal debt stock in 2003, down from 19 percent in1997. Meanwhile, the costs of external debt ser-vice have fallen with lower global interest rates—the ratio of debt service to exports for developingcountries fell to 15 percent in 2003 from 19 per-cent in 1997—and many developing-country bor-rowers have taken the opportunity to restructuretheir debt to take advantage of the low rates.
—with structural measures to enhancestability—Structural influences behind the recovery in flowsinclude the increasing maturity and depth ofmarkets for emerging-market bonds and impor-tant progress in improving transparency and ad-herence to standards and codes. The presence ofcollective action clauses (CACs) in internationalbond issues—including those of several LatinAmerican issuers—is a welcome further step, andit is encouraging that such clauses have achieved
such rapid and widespread acceptance in interna-tional capital markets. By making future bondrestructurings—should they be necessary—more manageable and predictable, CACs shouldencourage capital flows in the near term. But theyare not a panacea. A large outstanding stock ofbonds does not include such clauses. And the han-dling of the Argentine debt restructuring will havean important influence on investor attitudes—andhence potentially on capital flows. The upswing inbank lending is predominantly short term—netmedium-term flows remain negative. Neverthelessstructural changes—including strengthened riskmanagement—likely mean that it is more soundlybased than in previous upswings.
—furthermore, the credit quality of developingcountries has improved, reducing the cost ofcapital—One of the most important factors behind the recov-ery in private flows has been an improvement in thecredit quality of developing countries. To some ex-tent, the improvement reflects the favorable externalenvironment, with many developing countries bene-fiting from strong commodity prices and briskgrowth in world trade, much of it between develop-ing countries. But many countries also have under-gone significant adjustments in recent years, includ-ing a move toward market mechanisms andincreased openness to international trade and in-vestment. Fiscal policies have generally been moreprudent, although concern persists about the sus-tainability of public debt in several countries. Flexi-ble exchange-rate systems have become much moreprevalent, reducing the possibility that an exchange-rate crisis will turn into a debt crisis—and forcing in-creased awareness of the risks inherent in currencymismatches. Relatively low inflation rates have be-come established, and many developing countriesare showing strong growth in productivity.
The improved credit quality has translated intoimproved credit ratings, with the average sovereigncredit rating of developing countries reaching itshighest level since the beginning of 1998. Severaldeveloping countries, including India, the RussianFederation, and Turkey, all received upgrades fromthe major credit rating agencies in 2003.
Investor perceptions that credit risk has fallenhave contributed to a major decline in bondspreads. The average spread on emerging-marketbonds (EMBIG) fell from more than 725 basis
5
1997 1998 1999 2001 2002 20032000
Sources: IMF, International Financial Statistics, 2004, andWorld Bank staff estimates.
�2.0
1.5
1.0
0.5
0.0
�0.5
�1.0
�1.5
80
60
40
20
0
�20
�40
�60
�80
�100
�120
Figure 2 Developing countries’ current accountbalance, 1997–2003
$ billions Percent
Current account asshare of GDP
(right axis)
gdf_002-011.qxd 4/6/04 1:08 PM Page 5

G L O B A L D E V E L O P M E N T F I N A N C E 2 0 0 4
points at the end of 2002 to just 390 basis points inearly January 2004, before rebounding to 420basis points by mid-February 2004 (figure 3). Av-erage emerging-market bond spreads for LatinAmerica were halved from more than 1,000 basispoints at the end of 2002 to just 535 basis pointsover the same period, reflecting a more favorableassessment of prospects for Brazil. Although creditquality has clearly improved, the compression inemerging-market spreads may have outstrippedimprovements in fundamental credit quality, leav-ing some scope for a future correction. The spreadcompression has boosted the returns investors havereceived on emerging-market debt over the pastyear—and investors will not be able to match thesegains in the future.
—but there is no room for complacencyFurther increases in interest rates in some ad-vanced economies could dampen flows, and somecorrection in spreads is possible. Renewed volatil-ity in the financial markets—likely stemming fromimbalances in advanced economies—might alsohave an adverse impact on flows. The string ofcrises since the mid-1990s exposed vulnerablespots in developing-country debt markets.Together, the countries that experienced thosecrises account for almost 60 percent of the out-standing debt stock of developing countries. Bor-rowers in developing countries should bear in mindthe lessons of recent years and remain prudentabout incurring additional external liabilities.
Particular care should be taken to ensure thatforeign-currency liabilities are appropriatelyhedged. Moreover, borrowers should remain waryof possible fluctuations in the availability of finance,particularly in light of the renewed pickup in short-term financing.
Developing countries should also maintainprudent macroeconomic policies and perseverewith needed reforms to foster sustainable growth,consolidate the improvement in credit quality, andmaintain the confidence of investors and creditors,particularly in the face of political pressures fromforthcoming elections in several countries.
To keep the recovery on track,imbalances in advanced economiesneed to be addressed
The macroeconomic policies of high-incomecountries must be adjusted toward more
balanced global economic growth and more sus-tainable financing of existing current account im-balances (figure 4). The same developed-countrypolicies that helped prevent the 2001 downturnfrom deepening pose substantial medium-termchallenges. The U.S. current account deficit, to takethe most prominent example, is now more than5 percent of GDP, and the reluctance of private in-vestors to finance that deficit at the prevailing ex-change rate has already led to a sharp fall in thevalue of the dollar against most major currencies.The nature and timing of the necessary adjustments
6
Figure 3 Spreads on emerging-market bonds,January 2002–February 2004
Basis points
1,500
1,100
1,300
300
500
700
900
2,600
1,800
1,400
1,000
200
600
2,200
Source: J.P. Morgan Chase.
Jan. 2002 Jan. 2003 Jan. 2004
Brazil(right axis)
All developingcountries(left axis)
Basis points
Japan
3.2
Europeanunion
0.2
United States
�5.1
Developingcountries
1.1
Source: World Bank staff estimates.
4
3
2
1
0
�1
�2
�3
�4
�5
�6
Figure 4 Global current account balances, 2003
% of GDP
gdf_002-011.qxd 4/6/04 1:08 PM Page 6
O V E R V I E W A N D P O L I C Y M E S S A G E S : H A R N E S S I N G C Y C L I C A L G A I N S
will depend on several factors, including howfast economic activity picks up in the rest of theworld—particularly in the euro area—and on thesuccess of policymakers in facilitating orderly ad-justments in exchange rates. Also important is thewillingness of foreign central banks to continue tofinance the U.S. current account through the use ofaccumulated reserves. This policy can continue aslong as the surplus countries see higher benefits fromtrade expansion than costs from reserve accumula-tion, among them risks of monetary expansion.
Since 2000, the developing world has been a netexporter of capital to the advanced economies. Fordeveloping countries as a whole, foreign-exchangereserves rose about $276 billion in 2003, bringingtotal reserves to $1,227 billion—equivalent tonearly four times their short-term external debt.This buildup reflects a precautionary reaction to thecostly crises of the 1990s, as well as broader factorsrelated to trade and exchange rates. It underlinesthe strong financial interdependence betweendeveloped and developing countries. That interde-pendence, intensified in recent years, gives the devel-oped and developing economies a common interestin addressing the macroeconomic imbalances andlong-term risks discussed here.
As the global economic recovery gathers mo-mentum, the phase of generalized easing of mone-tary policy appears to be coming to an end. TheBank of England and Reserve Bank of Australia re-cently increased interest rates, and the U.S. FederalReserve has suggested that it is likely, in time, toreturn to a more neutral monetary stance, thoughconcerns persist about job creation. Fiscal deficits inhigh-income countries have widened every yearsince 2000—from 0.1 percent of GDP to 3.7 of GDPin 2003. If uncorrected, fiscal imbalances couldpush real interest rates higher globally, potentiallydampening capital flows to developing countries asthe public sector in advanced economies competeswith developing countries for global savings.
As foreign direct investment moves into the service sector, thelocal investment climate becomesmore important
Flows of foreign direct investment (FDI) to devel-oping countries declined in 2003 for the second
consecutive year. At $135 billion, they were 23 per-cent below the level reached in 2001. The equity
component of FDI was somewhat more resilientthan intercompany debt and reinvested earnings.Much of the decline is attributable to weaker service-sector FDI, which, being largely location bound andgenerating local-currency earnings that are vulnera-ble to devaluation risk, is particularly sensitive to thelocal investment climate and vulnerable to financialcrisis. FDI inflows in services rose during the secondhalf of the 1990s to overtake FDI in manufacturing,but in the past two years, in particular, there was asignificant drop in Brazil—where investment intelecommunications and energy has fallen steeply,and where the privatization cycle has wound down.
FDI flows are expected to recover in 2004, inline with the global economic recovery. The paceof recovery will depend on the liberalization ofservice sectors in the developing world, on therestoration of investors’ confidence after recentcrises, and on the availability of political risk in-surance, for which demand remains high. Concernover regulatory risks may have a particular impacton FDI in the banking and utilities industries.
Flows of portfolio equity capital to developingcountries topped $14 billion in 2003, up from$5 billion in 2002, as growth strengthened and eq-uity markets rebounded globally. Nevertheless,these flows remain small relative to other sourcesof capital, reflecting the volatility of emerging-market economies, concerns over corporate gover-nance, limited diversification benefits because ofstrong correlations with advanced-country equitymarkets, and a continuing “home bias” on the partof investors. Additional constraints on growth in-clude the technological underdevelopment of stockmarkets in developing countries and the uncertainquality of their supervisory institutions. Stock ex-changes in Latin America and the Caribbean, andin Europe and Central Asia, continue to experiencestock delisting, as companies migrate to majorglobal stock exchanges in industrial countries.
The improvement in private capitalflows has benefited most regions—but broader access would be desirable—
The increase in private capital flows has af-fected all regions, with the exception of the
Middle East and North Africa (table 2).
• Net private flows to Sub-Saharan Africastrengthened slightly in 2003, due mainly to
7
gdf_002-011.qxd 4/6/04 1:08 PM Page 7

G L O B A L D E V E L O P M E N T F I N A N C E 2 0 0 4
stronger debt flows to South Africa. FDI to theregion remained steady—and concentrated incountries rich in petroleum and minerals.
• Flows to many countries in Europe and CentralAsia were particularly strong in 2003, as eighttransition countries approached accession tothe European Union. Effective implementationof EU-related structural reforms and past FDIshould contribute to a step-up in productivitygrowth, although mounting fiscal deficits arelikely to pose an increasing challenge.
• South Asia saw a marked strengthening inportfolio equity investment, bank lending, andFDI in 2003, although this was offset in partby a substantial bond repayment by India.
However, private capital flows (except for tradefinance) are heavily concentrated on specific coun-tries and regions. For example, East Asia and LatinAmerica accounted for two-thirds of internationalinvestment in developing-country infrastructurebetween 1992 and 2003, while Latin America andEastern and Central Europe continue to dominateinternational bond issuance. Ten countries ac-counted for 68 percent of FDI in 2003, down froma peak concentration of 78 percent in 2000, butstill significant. There is an important role formultilateral agencies in promoting broader, sus-tained access to capital and in facilitating higherlevels of official aid for countries that do not haveaccess to international capital flows.
—and efforts should be taken to reduce thetransaction costs of workers’ remittancesWorkers’ remittances have become a major sourceof external development finance for many devel-oping countries. Remittances to developing coun-tries increased by more than 20 percent during2001–03, reaching an estimated $93 billion in
2003. More remittances were diverted to formalchannels from alternatives—a result of efforts tocurb money laundering. Also, the increased focuson remittances resulted in better reporting of datain many developing countries.
The development community should view re-mittances as a welcome source of external financeand strive to improve the financial infrastruc-ture supporting them. Steps should be taken toreduce remittance costs, which remain high. Appro-priate policies include improving competitionamong money transfer agents, increasing access tobanking services for migrant workers in sourcecountries and households in recipient countries, andimproving the investment climate (by liberalizingexchange restrictions, for example) in the receivingcountries.
The landscape for official flows isimproving, but increases are notenough to reach the MDGs
Political developments and changes in attitudesare dramatically altering the landscape for offi-
cial flows. Net official development assistance(ODA) did increase to $58 billion in 2002 but re-mains well below historical levels and what isrequired to meet the Millennium DevelopmentGoals. Moreover, half the $6 billion increase innominal ODA reflects debt relief and a further$1 billion higher aid to Afghanistan and Pakistan.
In light of discussions surrounding the 2002Monterrey Conference, donors have made pledgesto increase aid, although actual disbursementswill be subject to future decisions and the nor-mal legislative process of each donor country. Theinternational community should do its utmostto ensure that the existing commitments are met
8
Table 2 Net private capital flows to developing countries, 1997–2003$ billions
1997 1998 1999 2000 2001 2002 2003e
East Asia and Pacific 85.8 7.1 27.5 24.3 38.0 55.2 71.0Europe and Central Asia 52.9 64.2 47.2 51.5 32.2 55.2 62.9Latin America and the Caribbean 114.1 98.8 95.0 78.0 58.1 25.6 47.3Middle East and North Africa 7.8 16.3 4.2 �0.7 7.7 6.1 �3.8South Asia 8.2 5.3 3.5 9.2 4.0 8.0 10.4Sub-Saharan Africa 17.0 13.8 17.0 8.6 11.3 5.2 12.4
Note: e � estimate.Sources: World Bank Debtor Reporting System and staff estimates.
gdf_002-011.qxd 4/6/04 1:08 PM Page 8

O V E R V I E W A N D P O L I C Y M E S S A G E S : H A R N E S S I N G C Y C L I C A L G A I N S
and new ones made. The failure to reach agree-ment at the Cancún talks on reducing agriculturalsubsidies and trade barriers makes finding addi-tional sources of finance for the world’s poorestcountries especially urgent.
Aid donors and recipients are taking steps tochange the means of allocating and using aid. Majordonors are providing more funds for global publicgoods and paying more attention to the policyframework in recipient countries when making aid-allocation decisions. The Poverty Reduction Strat-egy Papers and the New Partnership for Africa’sDevelopment are aimed at strengthening policies inrecipient countries and ensuring greater ownershipof development programs, thereby increasing aideffectiveness. Those steps should be encouraged. Inthe light of recent international conflicts, which haveincreased the role of strategic factors in allocatingaid, the message of aid effectiveness must not be lost.
In recent years, there has been a sharp declinein nonconcessional net lending. Bilateral noncon-cessional lending declined from �$8.8 billion in2002 to �$11.8 billion in 2003 as donors contin-ued to reduce their lending in favor of grants—andas some developing countries continued to makerepayments to the Paris Club under past resched-uling agreements. The sharp decline in nonconces-sional lending from multilateral sources partly re-flects the decline in emergency financing packagesfrom the International Monetary Fund, particu-larly in comparison with the large net disburse-ment in 2001. But lower multilateral lending alsoreflects the prepayment of loans to the World Bank,particularly by China, India, and Thailand.
Trade finance facilitates internationaltrade and provides access to foreigncapital for less creditworthy countries
Developing countries’ international trade isequivalent to about one-half of their gross na-
tional income. Trade finance supplies the liquidityneeded to conduct trade, and governments cansupport it by ensuring a sound and efficient finan-cial system.
Trade finance to developing countries increasedstrongly before the East Asian crisis, in response tothe growth of developing countries’ internationaltrade and in conjunction with their growing partic-ipation in the international financial system. Trade
finance fell sharply with the crisis but resumed itsupward trend thereafter.
Trade finance is particularly important in facili-tating finance for firms in less creditworthy coun-tries, in part because traded goods are availableas security for lenders. In addition, relationshipsbuilt with foreign trading partners often easeaccess to credit, for example, in the form of extendedpayment terms offered by suppliers. Moreover,developing-country firms involved in internationaltrade, and foreign-owned firms, can serve as inter-mediaries that pass on credit to firms (particu-larly in poor countries) that lack direct access tointernational finance.
Trade finance remains vulnerable to episodesof financial crisis, when commercial banks may re-duce their exposure by failing to renew short-termfacilities. Nonetheless, finance linked to tradetransactions may hold up better than other formsof foreign borrowing—for several reasons. Lenderscan rely on security arrangements linked to tradedgoods. Suppliers’ information on their borrowersmay limit contagion. Suppliers have an incentive tosupport their customers during cyclical downturns.And in some cases governments have providedpreferential treatment to trade finance in the con-text of rescheduling agreements. Trade credit fromsuppliers and customers, in particular, appears tohave held up better during crises than bank lending.
Steps governments can take to strengthentrade finance include providing legal standing forelectronic documents (to facilitate more efficientletters of credit) and for the assignment of receiv-ables (to encourage factoring).
Channeling capital to long-terminfrastructure requires a balancedpublic-private approach
Infrastructure needs in developing countries re-main largely unmet—1.1 billion people lack ac-
cess to safe drinking water, 2.4 billion are affectedby inadequate sanitation, 1.4 billion have nopower, and telecommunication links are five timesless dense than in the developed world. World-wide, future demand for infrastructure is likely tocome mainly from the developing world. The chal-lenge is to translate this demand into viable invest-ment opportunities that are accessible to privateinvestors and creditors, and to unlock the potential
9
gdf_002-011.qxd 4/6/04 1:08 PM Page 9

G L O B A L D E V E L O P M E N T F I N A N C E 2 0 0 4
of the global capital markets to finance them.From 1992 to 2003, total international investmentin developing countries’ infrastructure is estimatedto have been $622 billion—an average of $52 bil-lion a year and 3.8 percent of total gross domesticinvestment in the developing world.
Since the 1980s, the global infrastructureindustry has undergone unprecedented changes,including a technological revolution in the telecom-munications industry, deregulation and competitionin mature markets, and liberalization in the devel-oping world. The importance of private ownershipand finance in electrical power, transport, water,and telecommunications is now well recognized. Itis also well recognized that public providers of in-frastructure services will continue to play a signifi-cant role in infrastructure development, ownership,and operation—at least for the next few years. Thechallenge, therefore, is to achieve stable investmentenvironments and creditworthy public and privateinfrastructure enterprises that can access theseglobal capital markets.
The issues to be addressed in tapping globaland domestic capital markets to meet the infrastruc-ture financing needs of developing countries arethree. First, a strong institutional framework for theprotection of creditors’ rights, effective covenants,and reliable avenues of legal enforcement and rem-edy. Second, growth, maturation, and stability inlocal capital markets—these markets provide bothlong-term local-currency financing and hedgingagainst exchange-rate risk. Third, a renewed effortto improve the creditworthiness of public infra-structure providers—both to facilitate their accessto capital markets and to make private equityinvestment in public-private ventures less risky.
As multilateral institutions incorporate theMillennium Development Goals into their targetsand strategic vision, they have come increasinglyto view infrastructure financing within the broadercontext of financing for development. They canhelp meet infrastructure needs in developing coun-tries through their own lending and by leveragingprivate capital.
10
gdf_002-011.qxd 4/6/04 1:08 PM Page 10

gdf_002-011.qxd 4/6/04 1:08 PM Page 11

gdf_012-035.qxd 4/6/04 1:07 PM Page 12

1The Global Upturn and the Need for Adjustment
TH E G L O B A L E C O N O M I C environment affecting capital flows todeveloping countries improved appreciably
in 2003. Global growth gained momentum in thesecond half of 2003 as the locus of economicactivity shifted towards business investmentspending. Renewed confidence in internationalfinancial markets led to a considerable decline inrisk spreads in bond markets and fueled a strongrally in equity prices. Worldwide, GDP growth in-creased from 1.8 percent in 2002 to 2.6 percentduring 2003; it is projected to rise to 3.7 percent in2004 (table 1.1). Echoing the message of globalrecovery, key markets around the world rebounded.Nonenergy commodity prices in 2003 averaged10 percent above their 2002 levels, while metalprices—traditionally a reliable leading indicator—surged at the end of 2003. A further 10 percentgain in commodity prices is expected this year.Global trade posted 4.5 percent growth in 2003and should climb to 8.7 percent in 2004.
The recent global economic downturn—andnow the recovery—has been strongly influencedby the business investment cycle. In response tothe sharp drop in investment that followed thebursting of equity bubbles in mid-2000, govern-ments in high-income countries quickly easedmacroeconomic policies, and monetary policydrove global interest rates to historic lows. Firmsstarted to work off excess capacity and cut costs.By 2003 profits began to rise, and with them sodid investment. A step-up in capital spending, orin some countries a reduced rate of decline in in-vestment, accounts more than all other factors forthe acceleration of global GDP growth in 2003(figure 1.1). The upturn in investment will likely
13
.
gain strength in 2004 as recoveries in leading re-gional economies spread to lagging ones.
Another characteristic of the global recoveryis that developing countries as a group aremarkedly outperforming the high-income coun-tries. Developing countries’ GDP grew 4.8 percentin 2003, compared to a 2.1 percent advance in thehigh-income countries. The low- and middle-income countries are on track this year to surpassthe record 5.2 percent growth achieved in 2000,before the global slowdown. Trade performance,in particular, shows that developing countries havebecome an increasingly important pillar for globaleconomic activity. In 2003 the volume of develop-ing countries’ imports and exports increased by13.4 percent, more than five times the 2.5 percent
Figure 1.1 Contribution of investment to globalGDP growth, 1998–2006
Percent
Note: f � forecast.Source: World Bank.
1998 1999 2000 2001 2002 2003 2004f 2005f 2006f
0.0
�0.5
�1.0
0.5
1.0
1.5
2.0
2.5
3.0
3.5 GDP growth
4.0
Other contributionsContribution of investment
gdf_012-035.qxd 4/6/04 1:07 PM Page 13

G L O B A L D E V E L O P M E N T F I N A N C E 2 0 0 4
14
Table 1.1 Global outlook in summary, 2002–2006% change from previous year, except interest rates and oil price
GEP 2004 forecasts
2002 2003e 2004f 2005f 2006f 2003 2004
Global conditionsWorld trade volumea 3.5 4.6 8.7 7.9 7.1 4.6 7.9Consumer prices
G-7 countriesb,c 1.3 2.0 1.4 1.7 1.9 1.4 0.9United States 1.6 2.3 1.5 2.3 2.7 1.9 1.2
Commodity prices ($ terms)Non-oil commodities 5.1 10.0 10.4 �2.9 �2.8 6.9 1.0
Oil price (OPEC average) 24.9 28.9 26.0 23.0 20.0 26.5 22.0Oil price (% change) 2.4 16.0 �10.0 �11.5 �13.0 6.3 �17.0
Manufactures unit export valued �1.3 6.5 4.3 �1.7 �0.8 4.0 �0.4Interest rates
$, 6-month (%) 1.8 1.2 1.5 3.5 3.7 1.0 2.0€, 6-month (%) 3.3 2.3 2.0 2.4 3.4 2.1 2.1
Real GDP growthe
World 1.8 2.6 3.7 3.1 3.0 2.0 3.0Memo item: World (PPP weights)f 2.9 3.7 4.6 4.1 3.9 3.1 3.9High income 1.4 2.1 3.3 2.6 2.5 1.5 2.5
OECD countries 1.4 2.0 3.1 2.6 2.4 1.5 2.5Euro area 0.9 0.4 1.7 2.3 2.3 0.7 1.7Japan �0.3 2.7 3.1 1.4 1.2 0.8 1.3United States 2.2 3.2 4.6 3.2 2.9 2.2 3.4Non-OECD countries 2.3 2.6 5.0 4.5 4.2 2.1 4.1
Developing countries 3.4 4.8 5.4 5.2 5.0 4.0 4.9East Asia and Pacificg 6.7 7.7 7.4 6.7 6.3 6.1 6.7Europe and Central Asia 4.6 5.5 4.9 4.8 4.7 4.3 4.5Latin America and the Caribbean �0.6 1.3 3.8 3.7 3.5 1.8 3.7Middle East and N. Africa 3.3 5.1 3.7 3.9 4.0 3.3 3.9South Asia 4.3 6.5 7.2 6.7 6.5 5.4 5.4Sub-Saharan Africa 3.3 2.4 3.4 4.2 3.9 2.8 3.5
Memo items:Developing countries
excluding transition countries 3.3 4.6 5.5 5.2 5.0 3.9 4.9excluding China and India 2.1 3.4 4.4 4.5 4.2 3.0 4.1
Note: PPP � purchasing power parity; GEP 2004 � Global Economic Prospects and the Developing Countries, World Bank, January 2004; e � estimate; f � forecast.a. Goods and non-factor services.b. Canada, France, Germany, Italy, Japan, the United Kingdom, and the United States.c. In local currency, aggregated using 1995 GDP weights.d. Unit value index of manufactured exports from major economies, expressed in U.S. dollars.e. GDP in 1995 constant dollars; 1995 prices and market exchange rates.f. GDP measured at 1995 PPP weights.g. Now excludes the Republic of Korea, which has been reclassified as high-income OECD.Source: World Bank data and staff estimates.
increase for high-income countries. The importantrole that the official foreign-exchange reserve as-sets of countries, such as China, are now playing inthe financing of the U.S. current account deficit isyet another example of the growing role of devel-oping countries in the global economy. And stronggrowth performance underscores the fact thatmany structural improvements in developingcountries over the last decade are paying off.
But the global economy is emerging from thepervasive slowdown of recent years facing major
macroeconomic challenges, which could have acritical bearing on the outlook for developingcountries and the availability of external capitalto finance their development. A growing share ofthe large and persistent current account deficitin the United States has been financed by the in-vestment of foreign reserves that foreign centralbanks—particularly from Asia—have accumu-lated as a result of their trade and exchange-rate-management policies. Policy adjustments will berequired—in high-income countries, to ensure an
gdf_012-035.qxd 4/6/04 1:07 PM Page 14
T H E G L O B A L U P T U R N A N D T H E N E E D F O R A D J U S T M E N T
orderly resolution of imbalances—and in develop-ing countries, to guard against potential downsiderisks. Moreover, an end to the generalized easingin monetary policies—which has played some rolein the recent strength of capital flows to develop-ing countries—is likely. Policy challenges in twomain areas are identified in this chapter:
• Macroeconomic policies in high-income coun-tries—including fiscal adjustment in the UnitedStates, easier monetary policy in Europe, andflexible exchange-rate-management policies—could contribute to an orderly adjustment ofcurrent account imbalances. Fiscal adjustmentis also necessary if real interest rates are not torise, potentially crowding out the availabilityof capital to finance development.
• Developing countries should recognize thethreat that these imbalances pose to the sus-tainability of the recent strengthening of capitalflows and the risk of continuing fluctuationsin the availability of external finance. Strongerinflows can help lay the foundation for sus-tained growth and poverty reduction if usedeffectively, but developing countries should becautious of accumulating excessive debt, par-ticularly short-term. And they should take theopportunity to manage their external liabili-ties, consolidate fiscal positions, and intensifyongoing reform efforts—including efforts tomobilize domestic savings—to further reducetheir vulnerability to adverse financial shocks.
Adjustment, recovery, and imbalancesin the high-income countries
After three years of below-potential growth,GDP in the high-income countries is likely to
expand at a rate of 3.3 percent in 2004, well abovethe 1990s annual average of 2.5 percent. Theshape of the recovery reflects the character of theslowdown that started in 2000, the macro policystimulus that immediately followed the slowdown,and the adjustments made by the private sector inthe last three years.
An investment-led recovery The global economic slowdown of 2001 cameafter a decade of exuberant expectations andoverinvestment—especially in high-tech markets.After equity markets collapsed, and investors
reassessed the long-term profitability of new—often Internet-related—activities, the magnitude ofexcess capacity became apparent. Adjustment inthe private sector was needed to reverse the sharpdecline in capital spending.
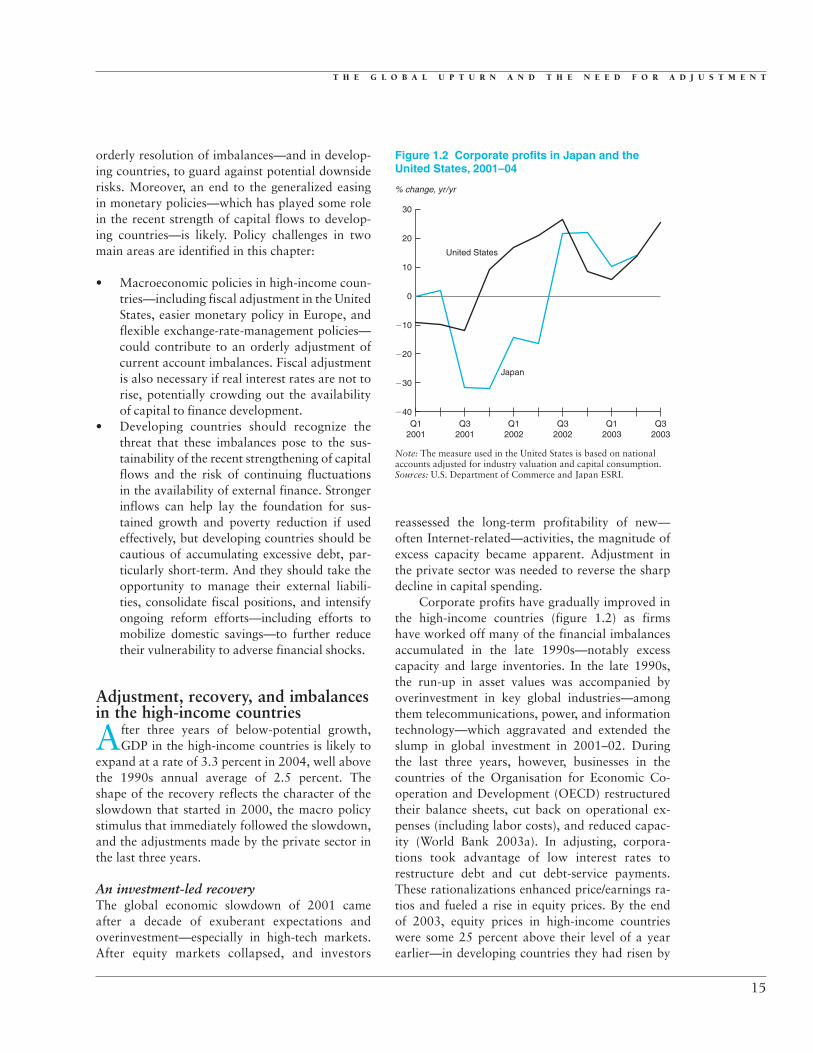
Corporate profits have gradually improved inthe high-income countries (figure 1.2) as firmshave worked off many of the financial imbalancesaccumulated in the late 1990s—notably excesscapacity and large inventories. In the late 1990s,the run-up in asset values was accompanied byoverinvestment in key global industries—amongthem telecommunications, power, and informationtechnology—which aggravated and extended theslump in global investment in 2001–02. Duringthe last three years, however, businesses in thecountries of the Organisation for Economic Co-operation and Development (OECD) restructuredtheir balance sheets, cut back on operational ex-penses (including labor costs), and reduced capac-ity (World Bank 2003a). In adjusting, corpora-tions took advantage of low interest rates torestructure debt and cut debt-service payments.These rationalizations enhanced price/earnings ra-tios and fueled a rise in equity prices. By the endof 2003, equity prices in high-income countrieswere some 25 percent above their level of a yearearlier—in developing countries they had risen by
15
�40
�30
�20
10
0
20
30
�10
Figure 1.2 Corporate profits in Japan and theUnited States, 2001–04
% change, yr/yr
Note: The measure used in the United States is based on nationalaccounts adjusted for industry valuation and capital consumption.Sources: U.S. Department of Commerce and Japan ESRI.
Q12001
Q32001
Q12002
Q32002
Q12003
Q32003
Japan
United States
gdf_012-035.qxd 4/6/04 1:07 PM Page 15

G L O B A L D E V E L O P M E N T F I N A N C E 2 0 0 4
40 percent (see chapter 3)—suggesting a return ofinvestor confidence.
The pickup in investment is likely to gainstrength in 2004, as recovery in leading regionaleconomies spreads to other countries. Europe isfollowing the United States and Japan with a lagof approximately six months, mirroring condi-tions at the beginning of the slowdown, when in-vestment declined first in the United States andJapan—the locus of many high-tech activities—and later in Europe.
The upturn in investment is likely to bringboth Japan and the United States above their long-term potential growth in 2004. The GDP growthforecast of 4.6 percent for the United States and of3.1 percent for Japan is in both cases more than1 percentage point above the average growth rateof the last 10 years. Although it is impossible todetermine potential growth exactly, and the pre-diction of turning points is similarly difficult, itis likely—as forecast—that growth will slow after2004 in these two large economies. Japanesegrowth is increasingly tied to import demand inChina and other developing countries in the re-gion. As Chinese imports grew at an annualized rateof 40 percent in the last quarter of 2003, JapaneseGDP was estimated to have advanced at an annu-alized rate of 7 percent, the highest since 1990.An expected return to more sustainable rates oftrade expansion in the region in 2005 adds to theexpected moderation of Japanese growth. For theEuro area, the picture is different. Entering recov-ery later, and constrained by the strong euro, GDPgrowth (expected to be 1.7 percent) is likely to re-main below potential in 2004, before acceleratingin subsequent years.
This growth pattern, combined with a gradualnarrowing of budget deficits and some furtherweakening of the U.S. dollar, would allow a reduc-tion of the U.S. current account deficit in the com-ing years. However, the key risks to the outlook lieprecisely in these areas. Large budget deficits tendto persist long after fiscal stimulus has done itsjob of boosting growth in the economy. If the dete-rioration is not reversed, higher interest ratesbecome more probable, and policymakers lack akey weapon to use against potential new shocksto the economy. Global current account imbal-ances generate risk, because it is unclear howlong—and under what conditions—internationalinvestors will remain willing to finance the
shortfalls. In some circumstances, an abruptchange in that willingness may trigger disorderlycurrency fluctuations.
Macroeconomic policies were instrumental in reinvigorating growth Policymakers in the advanced economies havepursued expansive fiscal and monetary policies inrecent years as they have sought to reverse theslowdown in economic activity that followed thecorrection in global equity markets in mid-2000.Even in Japan, which entered a recession with afiscal deficit exceeding 6 percent of GDP and policyinterest rates at 0.5 percent—and so had limitedroom for further traditional measures—effortshave been made to stimulate the economy throughmonetary ease. The United States, in particular,eased monetary policy very aggressively; thefederal funds rate was reduced 13 times from theend of 2000 to mid-2003, from 6.5 percent to 1 per-cent (figure 1.3). The reductions buoyed con-sumer spending and housing-related activity. TheEuropean Central Bank (ECB), fearing inflation,was more cautious than the U.S. Federal Reserveat the outset of the crisis. Even so, it reduced itsrepurchase rate from 4.75 percent in late 2000 to2 percent in early 2004.
Long-term interest rates fell noticeably as theglobal economy slowed, but they have reboundedsomewhat from their lows of mid-2003 as fearsof deflation have receded. In early 2004, 10-year
16
Figure 1.3 Short-term interest rates in theEuro zone, Japan, and the United States,2001–04
Percent
Source: Datastream.
0
6
5
4
2
1
3
7
Jan.2002
Jan.2001
July2002
Jan.2003
July2003
Jan.2004
July2001
Japan
Euro zone
United States
gdf_012-035.qxd 4/6/04 1:07 PM Page 16

T H E G L O B A L U P T U R N A N D T H E N E E D F O R A D J U S T M E N T
government bond rates in Europe and the UnitedStates stood at 4.1 percent, compared with 3.6 per-cent and 3.3 percent in mid-2003 (figure 1.4). As aconsequence of the turnaround in interest rates,the substantial boost to consumption that resultedfrom the wave of mortgage refinancing in theUnited States has apparently begun to wane.
As the global economy recovers, the phase ofgeneralized easing of monetary policy appears tobe coming to an end. The Bank of England andReserve Bank of Australia recently increased inter-est rates and indicated that further rises werelikely. The U.S. Federal Reserve has suggested thatit will, in time, return to a more neutral monetarystance, although the disappointing rate of new jobcreation still causes worry. Further easing is possi-ble in some countries and regions. Most notably,the recent strength of the euro against the dollaramid continuing sluggish domestic conditions inthe Euro area, as well as the easing of inflation inthe zone to rates below central bank targets, maygive the ECB some room to reduce interest rates.
Fiscal deficits in high-income countries havewidened every year since 2000—from 0.1 percentof GDP to 3.7 percent of GDP in 2003. The shifthas been most pronounced in the United States,where the budget moved from a surplus of 1.6 per-cent of GDP in 2000 to a 4.6 percent deficit in2003. But fiscal relaxation was the rule elsewhereas well. Fiscal deficits in the Euro area averaged2.8 percent in 2003 compared to an average bal-anced budget in 2000, with France and Germanybreaching the deficit limit of 3 percent of GDP set
by the EU Stability and Growth Pact. In Japan thedeficit was nearly 8 percent of GDP in 2003, 1.5 per-centage points worse than in 2000. The budgetgaps are not wholly the result of recession-induceddeclines in revenue.
Countercyclical fiscal policies helped preventthe recession from deepening, but they have cre-ated substantial medium-term challenges. Growingdeficits in the United States foreshadow higherlong-term real interest rates, as U.S. governmentborrowing competes for available finance withborrowers not only from the private sector, butalso from developing countries. Recent simulationsby the International Monetary Fund (Muhleisenand Towe 2004) suggest that, without correctivepolicies, a possible 15 percent increase in the ratioof U.S. public debt to GDP could eventually causeaverage real interest rates in the industrializedcountries to increase by 50 to 100 basis points.
Financing of the U.S. current account deficit is a key vulnerabilityOn current trends, the U.S. current account deficitis likely to widen to about $590 billion—5 percentof GDP—in 2004, the fifth consecutive year inwhich the deficit has exceeded the previous high of3.4 percent of GDP reached in the late 1980s. Thedeterioration in the U.S. fiscal balance since 2000(6 percentage points of GDP) has played an impor-tant role in widening the country’s current accountdeficit, more than offsetting an adjustment in thebalance of private sector saving and investmentequivalent to 5 percentage points of GDP. Oncethe financing of the U.S. external shortfall becamemore difficult, the current account deficit came torepresent a substantial global imbalance.
Beginning in late 2002, demand began to falteramong private overseas investors for dollar-denominated assets—at least at the prevailing ex-change rate. Since then the dollar has fallen againstnearly all major currencies, depreciating 30 percentagainst the euro and 20 percent against the yen byearly 2004. The dollar’s decline has reduced thecompetitiveness of European and Japanese ex-porters, while stimulating U.S. trade. The thirdquarter of 2003 saw a substantial fall in foreign pri-vate investment in U.S. assets, although this waslargely offset by a reversal in the rate at whichU.S. private investors accumulated assets abroad(table 1.2). Foreign demand for U.S. assets re-bounded during the fourth quarter, however, as net
17
Figure 1.4 Long-term interest rates (10-yeargovernment bond yields) in the Euro zone,Japan, and the United States, 2001–04
Percent
Source: Datastream.
0
6
5
4
2
1
3
Jan.2002
Jan.2001
July2002
Jan.2003
July2003
Jan.2004
July2001
Euro zone
United States
Japan
gdf_012-035.qxd 4/6/04 1:07 PM Page 17

G L O B A L D E V E L O P M E N T F I N A N C E 2 0 0 4
flows into U.S. private assets increased by some$115 billion.
With the decline in demand for U.S. assetsamong private investors, a growing share of theburden of financing the U.S. current accountdeficit has been shouldered by official institutionsin developing countries that have invested reservesaccumulated through good trade performance,effective exchange-rate management, and thestrengthening in capital flows (see figure 1.5 andbox 1.1). Inflows of foreign official assets to theUnited States amounted to $208 billion during2003, compared with $95 billion for the wholeof 2002, financing almost 40 percent of the U.S.current account deficit. Foreign official institutionspurchased a net $150 billion of U.S. long-termsecurities in 2003, compared with $40 billion in2002. Traditionally invested chiefly in Treasury
18
Table 1.2 Financing of U.S. current account deficit, 1999–2003$ billions
1999 2000 2001 2002 2003
Current account balance �290.8 �411.5 �393.7 �480.9 �541.8Financing requirement 282.1 411.8 398.7 484.5 540.3
Net foreign official assets 43.5 37.7 5.1 94.9 207.7As share of financing requirement 15.4 9.2 1.3 19.6 38.4
Net flows in FDI and Banking 42.5 131.1 15.0 �28.4 �3.0Net flows in FDI 64.5 162.1 31.6 �98.2 �72.8Net flows in banking �22.0 �31.0 �16.6 69.8 69.8
As share of financing requirement 15.1 31.7 3.7 �5.9 �0.5
Net flows in portfolio assets 178.3 302.0 326.8 419.2 339.3Corporate bonds 140.9 151.2 226.5 193.5 276.7Corporate equities �1.4 85.8 10.4 37.5 �54.1Other long-term securities 43.1 96.4 85.2 76.3 �48.1U.S. government securities �4.3 �31.4 4.7 111.9 164.8
As share of financing requirement 63.2 73.3 82.0 86.5 62.8
Other (including statistical discrepancy) 17.8 �59.0 51.9 �1.2 �3.7
Source: U.S. Department of Commerce and World Bank staff estimates.
Figure 1.5 Net financial flows to the UnitedStates, 2000–03
$ billions
Sources: U.S. Department of Commerce and World Bankstaff estimates.
�25
150
175
125
100
50
75
25
0
2000 200320022001
Private Official
The rate of reserve accumulation in the developingcountries surged to $276 billion in 2003 from
$173 billion in 2002 and $78 billion in 2001. Reserves in China increased by $117 billion to reach $403 billion in 2003. Other countries also saw notable increases in reserves: India’s rose by $26 billion to $97 billion; Russia’s
by $30 billion to $73 billion; and Brazil’s by $12 billion to $49 billion. Developing countries have been steadilybuilding reserves in reaction to the costly crises of the1990s—precautionary motives may therefore explain someof the increase, particularly in countries such as Brazil andTurkey, which are emerging from crises. However, the
Box 1.1 Reserve accumulation in developing countries
gdf_012-035.qxd 4/6/04 1:07 PM Page 18

T H E G L O B A L U P T U R N A N D T H E N E E D F O R A D J U S T M E N T
19
recent acceleration in reserve accumulation is above whatwould be expected based on precaution alone.
In some countries, including those with the largest accumulations, the rise in reserves is the result of exchange-rate-management policies operating in a context of strongtrade performance and high capital inflows. The reservesof some advanced economies—particularly in Asia—alsoincreased strongly for similar reasons. Japan’s reserves roseby about $200 billion over 2003 to stand at $650 billion,as a result of intervention to limit the appreciation of theyen against the dollar, and Korea’s reserves also increasedsignificantly.
Although just a few countries account for the bulk ofthe increase in reserves, most have seen some rise in recentyears. In aggregate, developing countries’ total reserveswere approximately $1.2 trillion at the end of 2003,75 percent above the level of three years ago. Since 2000, reserves have risen in all six World Bank regions. Of the132 developing countries that reported data for 2003, 102 increased reserves.
The rise in international reserves is substantial relativeto indicators typically used to measure the adequacy of reserves. The ratio of reserves to imports of goods andnonfactor services for developing countries as a group rosefrom 42 percent in 2000 to 59 percent in 2003. Over thesame period, developing countries’ reserves increased fromtwice to almost four times the size of short-term debt.
Higher reserves come at a cost. Reserves are typicallyinvested in liquid, low-risk instruments that are easily
converted into cash at a known value. Some three-quartersof global foreign exchange reserves are held in U.S. dollars,with a large share in Treasury securities (McCauley andFung 2003). In many countries, the monetary authoritieshave issued securities in an effort to sterilize the impact ofrising reserves on domestic monetary conditions; they payinterest on those securities at rates that are sometimesmuch higher than those they earn on their reserves. Moreover, instead of holding reserves, governments couldreduce their debt in international capital markets (atspreads that may be several hundred basis points aboveLIBOR). Thailand has indicated that it will repay publicexternal debt over the coming year rather than increase reserves. In December 2003, China used $45 billion of itsforeign-exchange reserves in the recapitalization of theBank of China and China Construction Bank. Other countries may seek to limit the cost of holding reserves by choosing to hold a portion in higher yielding assets, accepting some increase in risk.
Given the critical role that foreign official assets areplaying in financing the U.S. current account deficit and in the market for U.S. securities, the portfolio choices ofreserve managers in developing countries could have a significant impact on these markets. Portfolio managersmay need to balance their desire for higher returns against the risk of triggering shifts in asset prices, includingexchange rates.
Box 1.1 (continued)
1984 1987 1990 1996 1999 200219930
50
100
150
200
250
300
350
400
45070
30
20
10
40
50
60
0
Ratios of reserves to imports and reserves toshort-term debt, 1984–2003
Percent Percent
Reserves/imports(left axis)
Reserves/short-term debt(right axis)
Source: World Bank data.
20021990 1992 1994 1998 20001996
1,400
600
400
200
800
1,000
1,200
0
International reserves in developing countries,1990–2003
$ billions
Note: Estimates for 2003 refer to end-December for most countries.Where not, the most recent available data are used.Source: International Financial Statistics.
Europe and Central AsiaSub-Saharan AfricaSouth AsiaMiddle East and North AfricaLatin America and the CaribbeanEast Asia and Pacific
gdf_012-035.qxd 4/6/04 1:07 PM Page 19

G L O B A L D E V E L O P M E N T F I N A N C E 2 0 0 4
securities, a growing share of U.S.-dollar reserveshas been invested in other securities, particularlybonds of U.S. government agencies, as reservemanagers have sought to increase returns andlimit quasi-fiscal losses. For example, as ofDecember 2003, the U.S. Federal Reserve washolding $232 billion of government agency bondson behalf of foreign central banks. Heavy pur-chases of such securities by central banks, espe-cially from Asia, have helped keep Treasury bondyields relatively low, particularly for securities ofrelatively short maturity.
The timing and extent of any future adjust-ment in the U.S. current account remains highlyuncertain. Equally uncertain is how foreign in-vestors’ appetite for U.S. assets will respond toexchange-rate changes and developments in thereal economy and asset markets in the UnitedStates and elsewhere. But the critical role of for-eign official assets, including those of developingcountries such as China, in the financing ofthe U.S. current account deficit and in the mar-ket for U.S. government securities underlines theinterdependence of developed and developingcountries and their common interest in resolvingexisting imbalances. As the current configurationof financing is unlikely to be sustained indefinitely,a combination of dollar depreciation and slowergrowth in U.S. domestic demand relative to thegrowth of demand abroad will be required. Agradual tightening of U.S. fiscal policy could reducethe possibility of a severe and abrupt correctionbrought about by market forces.
Developing countries: a favorableoutlook, but risks remain
As a group, developing countries grew muchfaster than the industrial countries in 2003,
although the accomplishments of individualeconomies varied widely. GDP per capita in thelow- and middle-income countries increased by3.5 percent during the year, compared with a1.6 percent advance in the high-income group.With faster population growth in the developingworld, the differential in real GDP growth waslarger: 4.8 percent versus 2.1 percent (figure 1.6).Developing-country growth is likely to pick upto 5.4 percent in 2004—the strongest in twodecades—before easing back toward 5 percent
gains over 2005–06. In East Asia, which is leadingthe global cycle, economies may begin to coolsomewhat sooner than in other regions.
Capital spending is driving growthDeveloping countries have not missed out on therevival of global investment, with capital spendingaccelerating broadly from 4.9 percent growth in2002 to 10.8 percent in 2003. The accelerationmore than doubled investment’s contribution tooutput, making it the principal driving force forgrowth (figure 1.7). Capital spending has beenspurred by the boom in China, where investmentincreased by 23 percent in 2003; by an 11.7 per-cent surge in South Asian spending, where foreigndirect investors eye India’s growth potential; by arebound in the EU accession countries of Central
20
Figure 1.6 GDP growth in low- and middle-incomeand high-income countries, 2002–03
Source: World Bank.
53 40 1 2
Percent
High income
3.4
2.1
1.4
4.8Low and
middle income
2003 2002
Figure 1.7 Contributors to GDP growth indeveloping countries by demand component,2002–03
Note: Excludes statistical discrepancies.Source: World Bank.
31.5
2.6
2.1
1.4
0.5
0.4
0.3
0.6
1.2
2 2.50 0.5 1
Percent change
Publicconsumption
Net exports
Privateconsumption
Fixedinvestment
2003 2002
gdf_012-035.qxd 4/6/04 1:07 PM Page 20

T H E G L O B A L U P T U R N A N D T H E N E E D F O R A D J U S T M E N T
Europe (5.9 percent growth in 2003), which arealready reaping positive effects from their immi-nent integration; and by strong capital outlaysamong oil-exporting countries following severalyears of elevated oil prices. Oil exporters inthe Middle East and North Africa saw growth of13.5 percent; and in the Commonwealth of Inde-pendent States, 14.2 percent. Latin American invest-ment outlays continued to contract during 2003,but the 1 percent decline was less sharp than the7 percent fall in 2002. Indeed, the bottoming outof capital-stock adjustments has contributed to apickup in GDP growth in the region, while signal-ing nascent recovery in fixed investment. Sub-Saharan Africa appears not to have shared fully inthe acceleration of investment, with capital spend-ing near 6 percent growth in 2002–03, although
recent observations are insufficient to justify firmconclusions.
Public sector spending grew steadily acrossdeveloping countries—in line with GDP. In additionto reflecting the more prudent macroeconomic poli-cies of recent years, the steady growth also suggeststhat fiscal policy, on average, is not as cyclicallyinfluenced as in the high-income group (box 1.2).Improved fiscal policies have helped to avoidfurther widening of budget and current accountdeficits, while supporting local currencies andmuting inflationary tendencies. Despite the strongcyclical rebound in economic activity, median local-currency inflation (GDP deflator) for developingcountries as a group dropped to 4.2 percent in 2003,much better than the average of 5.5 percent over thelast three years and 8.9 percent over the last decade.
21
The 2001 recession prompted countercyclical fiscal action in many industrial countries but in just a few
of the low- and middle-income groups. As a result of automatic stabilizers (increased social benefits and reduced tax payments) and active policies (tax cuts and additional spending, especially in the United States), the fiscal balance in high-income countries as a groupshifted from a surplus of 0.1 percent of GDP in 2000 to a deficit of 3.7 percent in 2003. Over the same periodthe fiscal deficit of low- and middle-income countries together slipped by less than half a percentage point (see figure).
Why are developing countries less likely to adoptcountercyclical fiscal policies?
• Automatic fiscal stabilizers such as a progressive tax system and social safety nets are not as commonin low- and middle-income countries as in high-income ones. Some social policies in developing countries (for example, consumer subsidies whenglobal commodity prices are high) are even procyclical.
• Fiscal stimulus often kicks in too late to make countercyclical policies effective (often true in high-income countries as well).
• Many developing countries entered the slowdownwith higher public debt and deficits than high-income countries, and are more vulnerable to loss of confidence in financial markets.
Box 1.2 The fiscal response of low- and middle-income countries to the downturn
0 106 842
High-income
Low- andmiddle-income
Latin Americaand the Caribbean
East Asiaand Pacific
South Asia
Europe andCentral Asia
Middle East andNorth Africa
Sub-SaharanAfrica
Percentage of GDP
2000 2003
Fiscal deficits in high-income and developing countriesas a percentage of GDP, 2000 and 2003
Sources: IMF and World Bank.
• Numerous governments depend on external financing,and capital inflows into developing countries tend tobe procyclical.
In view of the cautious fiscal policies of developingcountries, the rebound of domestic demand is all the moreencouraging.
Sources: IMF 2003 and Talvi 2000.
gdf_012-035.qxd 4/6/04 1:07 PM Page 21

G L O B A L D E V E L O P M E N T F I N A N C E 2 0 0 4
Rapid growth of developing-country tradeThe performance differential between the low- andmiddle-income countries and their high-incomecounterparts was even greater in internationaltrade than in output growth. This was true for de-veloping countries in Asia and Europe particularly,which experienced double-digit growth in bothexport and import volumes (goods and services),against 1.8 percent growth for high-income OECDcountries (figure 1.8).
In 2003, growth in import demand of develop-ing countries (13.3 percent) matched growth in ex-ports (13.5 percent)—implying that the expansionin foreign markets did not come at the cost of high-income countries. In other words, increased com-petition from developing-country exports was off-set by the developing countries’ increased demandfor imports. Import demand in East Asia, in partic-ular, spurred Japanese export growth to 10 percentin 2003. And within East Asia, China has emerged
as a powerhouse for trade, with a surge of 40 per-cent in import volumes in 2003, suggesting that ac-cession to the World Trade Organization was morethan just an administrative change. Although tradedevelopments during 2003 did not contribute sig-nificantly to developing-country GDP growth—inan accounting sense—the continued rapid integra-tion of developing countries into global markets islikely to spur long-term productivity by improvingallocative efficiency and stimulating competitionand innovation. It is worth noting that while devel-oping countries accounted for some 24 percent ofworld trade in 2003, their import demand was re-sponsible for more than half of the year’s growth intrade volumes (figure 1.9).
For commodity exporters, recovery hasmeant more than larger trade volumes: substantialgains in prices have multiplied export revenues(table 1.3). During 2003, energy and nonenergycommodity prices (in U.S. dollar terms) advanced
22
0 2515 20105
East Asiaand Pacific
South Asia
Europe andCentral Asia
Latin Americaand the Caribbean
Middle East andNorth Africa
Sub-SaharanAfrica
High-incomeOECD
1.15.4
Percent growth
23.621.1
13.216.4
14.113.5
6.47.3
2.21.3
4.31.7
Exports Imports
Figure 1.8 Growth in imports and exports of goodsand nonfactor services, 2003
Source: World Bank. Source: World Bank data and projections.
Figure 1.9 Global import growth and developingcountries’ contribution, 1998–2003
�2
4
2
0
8
6
10
12
14
% growth
Originated in low-and middle-incomeOriginated in high-income
Global importgrowth
1998 1999 2000 2001 2002 2003
Table 1.3 Export revenues of developing countries, 2000–06% growth in U.S.-dollar revenues
2000 2001 2002 2003 2004f 2005f 2006f
Low- and middle-income 20.9 �0.1 8.1 18.6 14.3 10.6 10.0East Asia and Pacific 21.9 �1.7 13.8 22.0 18.8 17.2 14.3Europe and Central Asia 20.0 4.9 9.5 27.1 17.4 7.1 6.3Latin America and the Caribbean 19.2 �3.6 0.3 7.0 8.6 8.7 8.7Middle East and North Africa 28.6 4.7 0.2 11.6 8.1 3.3 7.4South Asia 18.0 1.9 14.5 19.2 14.7 8.0 8.7Sub-Saharan Africa 17.8 �4.6 7.3 15.5 �0.1 0.9 4.7
Note: f � forecast.Source: World Bank staff estimates.
gdf_012-035.qxd 4/6/04 1:07 PM Page 22

T H E G L O B A L U P T U R N A N D T H E N E E D F O R A D J U S T M E N T
by 16 and 10 percent above 2002 levels. Thestrongest gains were seen for metals, the mostcyclical of all commodities, which gained 28 per-cent over the year. In large measure, the dollarprice increases of 2003 reflected the weakening ofbase currencies, and commodity prices rose onlyslightly relative to domestic prices of other goodsfor buyers and sellers around the world (box 1.3).However, further gains in 2004 are expected totranslate into genuinely stronger real commodityprices in many importing and exporting countries.
Other factors underpinning the recoveryFor 2004 and beyond, the outlook for developingcountries is positive. Further improvement in the
external environment is likely to combine withincreasingly favorable domestic conditions. Themain risk to this propitious scenario is the possibil-ity of a sudden rise in international interest rates,which, as discussed earlier, could result from a dis-orderly unwinding of current account imbalancesand associated volatile movements in exchangerates. The challenge for policymakers in develop-ing countries is to be prepared for the contingencyof higher rates in the short to medium terms. Pur-suing prudent fiscal policies and avoiding overex-posure to short-term external debt could reduceoverall vulnerability to such potential shocks.
Improvements in the external environment areexpected in the form of stronger import demand in
23
Primary commodity prices are notoriously volatile, reflecting a barrage of supply and demand shocks.
From 1995 to 2001, the World Bank’s index of dollar-denominated commodity prices fell by more than 35 per-cent, before rebounding by 14 percent over the next twoyears. In real terms (deflated by the U.S. GDP deflator), thedownturn was an even steeper 42 percent. However, theseprice swings reflect not only market forces, but also the arbitrary choice of the dollar as the currency in whichprices are expressed. What part of the price volatility reflects demand and supply factors and what part the chosen currency?
Sellers and buyers of commodities base their actionson relative prices (commodity prices deflated by a domesticdeflator). Yet outside the United States those real prices are not necessarily the deflated dollar prices. German con-struction firms pay for copper and wood with euros; cocoafarmers in Côte d’Ivoire receive CFA francs. For theseagents, dollar prices may be quite misleading. For instance,in 2001 the price of gold fell by 2.9 percent in dollars butrose 35 percent in South African rands. Prices expressed in a basket of currencies weighted with country shares inworld trade would give a better indication of the experi-ence of typical commodity buyers and sellers. Changes insuch a weighted index of real commodity prices may be interpreted as the impact of demand or supply shocks.
The figure at right decomposes changes in real, dollar-denominated commodity prices into real exchange-rate effects of the dollar against a commodity-trade-weightedbasket of currencies and a residual reflecting market forces (which is relevant for typical buyers and sellers).The sharp declines in dollar prices in the late 1990s
Box 1.3. Commodity prices and exchange rates
1971
2003
1983
1987
1979
1991
1995
1999
1975
50
40
30
20
10
0
�10
�20
�30
Decomposition of changes in real U.S.-dollar commodityprices, 1971–2003
Percentage points
Source: World Bank staff estimates.
Due to exchange rate
Due to fundamentals
following the Asian crisis are seen to be mainly due tomarket forces (that is, real declines for the average sellerand buyer), and to a lesser extent to the weakening of the dollar. By contrast, the rebound in dollar prices in recentyears barely compensated for the weakening of the dollarand did not translate into higher real prices for the averageseller and buyer. The real commodity price index was unchanged in 2003, compared to an average 0.6 percentdecline historically.
gdf_012-035.qxd 4/6/04 1:07 PM Page 23

G L O B A L D E V E L O P M E N T F I N A N C E 2 0 0 4
high-income countries, additional firming ofnon-oil commodity prices, and continued rise incapital flows to developing countries. Imports ofgoods and services by high-income countries areprojected to accelerate from a 2.7 percent rate ofgrowth in 2003 to 6.8 percent in 2004. As GDPgrowth within this group converges over the com-ing years, and as current account positions reversegradually, import demand in Europe and Japan islikely to outpace that of the United States—from2005 onward.
Building on the robust 10 percent advance of2003, the rally in non-oil commodity prices is an-ticipated to continue, with an additional 10.4 per-cent gain in 2004. Firming demand, relatively tightsupplies, low stocks levels, and continued weaknessof the dollar are key supporting factors. The com-bination of these factors and improving externaldemand should lead to continued robust growth innominal export revenues (see table 1.3). Agricul-tural prices are projected to increase by 5.1 per-cent, with the strongest rise in fat and oil prices dueto tight supplies and robust demand in East Asia.Beverage prices remain at extremely modest levelsby historic standards, as supplies from new low-cost coffee producers, notably Vietnam and Brazil,cut short a cycle of sharply rising prices. Metalprices, in contrast, are anticipated to surge nearly26 percent during 2004—double the increase of2003. Many markets already have moved intodeficit due to declining stocks, earlier supply cuts,and broadening of demand growth in areas outsideChina. Non-oil commodity prices are likely to peakin 2004, before declining by around 3 percent in2005, as higher prices bring on new supplies and,in the case of metals, reactivation of idled capacity.
Oil prices are anticipated to average $26 abarrel in 2004, down from about $29 in 2003,
assuming that OPEC manages production suf-ficiently to keep its prices in the upper half of itstarget band. Oil prices began 2004 above $30 abarrel, due to very low stocks and strong investment-fund demand. Some of the major OPEC producersjustify higher prices because the decline in the U.S.dollar has eroded their purchasing power, whichmay have prompted the organization’s decisionin February to cut production quotas further. Oilprices are expected to decline in 2005 and beyond,as large non-OPEC supplies come on stream—from the Caspian, the Russian Federation, and WestAfrica—and as many OPEC countries, includingIraq, develop new capacity. Price risks remain ifOPEC maintains its resolve to keep oil priceshigh—or to move its band higher because of thedollar—even in the face of declining market share.
For the immediate future, the global recoveryin economic activity, the high degree of liquidity ininternational capital markets resulting from stimu-lative monetary policies, and the general im-provement in perceived credit quality in developingcountries appear to be sufficiently strong to supportrobust capital flows to developing countries. Aidedby the relaxation of foreign-ownership restrictionsin China, India, and elsewhere, flows of foreigndirect investment (FDI) are expected to reversetheir decline of the last two years. Moreover, thestrengthening of domestic demand in many devel-oping countries is likely to increase demand for ex-ternal finance. Firm oil prices will likely increase theexternal financing requirements of oil importers.
Against the background of the improving ex-ternal environment, GDP growth for all low- andmiddle-income countries is likely to acceleratefrom 4.8 percent in 2003 to 5.4 percent in 2004(table 1.4). If it does, it will exceed the 20-yearrecord of 5.2 percent set in 2000. Growth of capital
24
Table 1.4 Developing-country growth, 1991–2006Percentage growth rates, points, ratios
1991–2000 2000 2001 2002 2003e 2004f 2005f 2006f
Real GDP growth 3.4 5.2 3.0 3.4 4.8 5.4 5.2 5.0Contribution to growth (points)
Private consumption 2.1 2.6 1.8 1.4 2.1 2.9 3.0 2.8Fixed investment 0.6 1.7 0.8 1.1 2.6 2.3 1.8 1.8Net foreign balance 0.4 �0.2 0.2 0.6 0.3 �0.3 �0.1 0.2
Current account balance (share of GDP) �1.4 1.0 0.4 1.3 1.1 0.5 0.1 0.1Fiscal balance (share of GDP) �7.1 �3.4 �3.6 �4.0 �3.6 �3.4 �3.3 �3.1
Note: e � estimate; f � forecast.Source: World Bank data and staff estimates.
gdf_012-035.qxd 4/6/04 1:07 PM Page 24

T H E G L O B A L U P T U R N A N D T H E N E E D F O R A D J U S T M E N T
spending in the developing countries is likely tohave peaked at 10.8 percent in 2003; it shouldnow slow to single-digit gains, easing the pace ofGDP growth to still robust advances of 5 percentover 2005–06. Such growth performance shouldenable a further narrowing of fiscal deficits fromthe peak levels of 2002. As part of the global re-balancing of external positions, current accountsurpluses—one percentage point of GDP in2003—should dissipate gradually over the nextfew years.
Regional prospectsEU accession and oil shape the outlook for Europe and Central Asia The economies of the Europe and Central Asia re-gion grew by 5.5 percent in 2003, up from 4.6 per-cent the year before. As was the case for manyregions, the pickup in growth was led by a firmingof capital spending. Investment’s contribution toGDP growth tripled to 1.8 percentage points in2003 from 0.6 points in 2002 (table 1.5). Determi-nants of growth in the region have differed no-tably between Central and Eastern Europe, wherelinks with the Euro area are growing closer, andthe Commonwealth of Independent States (CIS),where trends in the oil and gas sector predomi-nate. Despite sluggish activity in the Euro area,growth in Central and Eastern Europe (excludingTurkey) accelerated from 3 percent in 2002 to4.1 percent in 2003, as several countries increasedexport-market shares in the European Union aspart of the broader integration process. Shipments
to the European Union, for example, now accountfor 30–33 percent of the national incomes ofHungary and the Czech Republic. Growth in theBaltic States continued on a robust track, with aGDP advance of 7 percent, up from 6.3 percent in2002. Investment was a key driving factor in thisoutturn, rising by 13.2 percent in the year. Fiscalstimulus also played a broader role in the upturn inCentral European demand. The Russian Federationand other countries of the CIS expanded fromgrowth of 4.7 percent in 2002 to 6.6 percent in2003, powered by a 8.6 percent advance in con-sumer spending and investment growth of 12.5 per-cent. The underpinnings for domestic growth con-tinue to be strong oil revenues. For the RussianFederation, this yielded a fiscal surplus in 2003—for the fourth year in succession—amounting to1.4 percent of GDP, and a massive current accountsurplus of $42 billion, or 9.9 percent of GDP.
The outlook for 2004 and beyond is for con-tinued robust growth in the region as a whole,again characterized by distinct driving forces,risks, and policy challenges in the major countrygroups. Growth in Central and Eastern Europe isexpected to approach 4.5 percent, as effective im-plementation of EU-related structural reforms pro-vides a stronger foundation for expansion. NetFDI inflows declined from 3 percent of GDP in2002 to 2.1 percent in 2003, as the privatizationprocess in several accession countries neared com-pletion. But large stocks of FDI accumulated overrecent years, together with the EU accessionprocess, should offer favorable conditions for pro-ductivity growth (box 1.4). The main risks andpolicy challenges are mounting fiscal deficits and
25
Table 1.5 Growth in Europe and Central Asia, 1991–2006Percentage growth rates, points, ratios
1991–2000 2000 2001 2002 2003e 2004f 2005f 2006f
Real GDP growth �1.4 6.8 2.4 4.6 5.5 4.9 4.8 4.7Contribution to growth (points)
Private consumption 0.0 2.9 2.0 3.2 3.7 3.3 3.1 2.9Fixed investment �2.2 2.5 �0.7 0.6 1.8 1.6 1.7 1.7Net foreign balance 1.3 �1.4 1.1 �1.2 �0.1 �0.5 �0.6 �0.4
Current account balance (share of GDP) �0.7 1.9 1.9 0.8 0.7 �0.4 �0.8 �0.9Fiscal balance, share of GDP �11.4 �2.5 �3.7 �3.7 �3.8 �3.5 �3.4 �3.2
Memo items: real GDP growthCentral and Eastern Europe 1.7 4.8 �0.4 4.4 4.4 4.5 4.6 4.4
Excluding Turkey 0.9 3.6 3.0 3.0 4.1 4.3 4.6 4.5Commonwealth of Independent States �3.9 9.2 5.7 4.7 6.6 5.4 5.1 5.1
Note: e � estimate; f � forecast.Source: World Bank staff estimates.
gdf_012-035.qxd 4/6/04 1:07 PM Page 25

G L O B A L D E V E L O P M E N T F I N A N C E 2 0 0 4
26
The European Union will expand dramatically in May2004, when eight transition countries—Czech Republic,
Estonia, Hungary, Latvia, Lithuania, Poland, the SlovakRepublic, and Slovenia—along with Cyprus and Malta,come into the fold. Per capita income in 2002 in the accession countries, measured in purchasing power parity,ranged from 36 percent of the EU average in Latvia to 71 percent in Slovenia (see first box figure). How quickly,and to what extent, will the new members narrow the gapwith EU living standards?
Lessons from Portugal, Spain, and Greece point to policies as key—The accession experiences of three recently joined memberssuggest that market access alone will not narrow the incomegap. Instead, the pace of convergence will largely depend onthe policy environment. In the first five years after joiningthe European Union in 1986, Portugal and Spain consoli-dated their budget deficits, introduced new value-addedtaxes, and tightened money growth, triggering significantincreases in FDI inflows. In contrast, in the first five yearsfollowing its accession in 1981, Greece’s budget deficit rosesharply and money growth remained expansionary, atnearly 25 percent a year. After rising markedly just beforeaccession, FDI inflows to Greece shrank in the first fiveyears of membership. The culmination of these develop-ments led to a narrowing of the income gap in Portugal andSpain but to a widening of the gap in Greece (box table).
Per capita GDP for Greece, Portugal, and Spain as ashare of the European Union average, various yearsPercentage
5 years after 15 years after Accession year accession accession
Greece 77 72 65Portugal 58 66 71Spain 73 78 82
Source: World Bank staff estimates.
The eight transition countries are more oriented to-ward the European Union than were their three southernEuropean counterparts at a similar stage in the accessionprocess. The eight, for example, have already witnessed amassive reorientation in trade to EU markets, as a group,and to a country have been receiving more significant inflows of FDI as a share of GDP and have narrower inflation differentials to the present European Union thandid the three earlier candidates (box second figure). In addition, the eight already have adopted much of the acquis communautaire (EU body of law). On the otherhand, once the new members enter the union, they can expect significantly lower EU aid flows (from cohesion andstructural funds) as a share of GDP than those received by Greece, Portugal, and Spain, which amounted to 2–3 percent of GDP.
Box 1.4 The integration dividend in Central Europe
0 8030 4020 50 60 7010
Slovenia
Czech Republic
Hungary
Slovak Republic
Estonia
Poland
Lithuania
Latvia
Percent
Per capita GDP for accession countries as a share ofthe European Union average, 2002
Source: World Bank.
40
36
41
47
50
52
60
71
0 2015105
Pre-accession 5-year percentage averages(year of accession minus 2 years to minus 6 years)
CPI inflation differential (vs Germany) and FDI as a shareof GDP
Source: World Bank.
Greece
Portugal
Spain
Czech Republic
Estonia
Hungary
Latvia
Lithuania
Poland
Slovak Republic
Slovenia FDI/GDP
Inflation
gdf_012-035.qxd 4/6/04 1:07 PM Page 26

T H E G L O B A L U P T U R N A N D T H E N E E D F O R A D J U S T M E N T
vulnerability to increases in global interest rates.Fiscal deficits increased in a number of countries—notably in Poland and Hungary, to 6 and 9.4 per-cent of GDP in 2003, respectively—reflectingcountercyclical policies and structural increases inoutlays for civil service wages, healthcare, andpensions. Fiscal adjustment in the accession coun-tries will become an increasing challenge, as EUresources will only partially fund the spending re-quirements of the new members. To benefit morefully from the accession process, governmentsshould rein in fiscal deficits, while avoiding spikesin short-term debt flows. For the region as a whole,short-term debt increased sharply from $1.5 bil-lion in 2002 to $17 billion in 2003.
In the CIS, growth is projected to ease fromthe 6.6 percent registered in 2003 toward 5 per-cent by 2005–06, due in large measure to moder-ating oil prices and lower tax revenues. For theRussian Federation principally (but also forAzerbaijan, Kazakhstan, and Turkmenistan), highoil prices since 2000 helped shore up fiscal bal-ances, reduced interest-rate risk, and, combined
with structural reforms, notably in the RussianFederation, improved business sentiment. For ex-ample, rising investor confidence resulted in adoubling of international lending flows to theRussian corporate sector during 2003. The pri-mary policy challenge for the oil-rich countries ofthe CIS is to broaden the capacity and efficiency ofsectors outside of oil and gas, and to preparefor lower oil prices in the future. Although themedium-term outlook suggests relatively high oilprices—$26 a barrel in 2004 and $23 in 2005—the secular trend in price remains downward, andsudden sharp declines will remain a risk factor.
Strong growth in South Asia with intensifiedfinancial linksLed by buoyant growth in India (accounting for75 percent of regional GDP), South Asia achieved aGDP advance of 6.5 percent in 2003, a sharppickup from the 4.3 percent registered in 2002(table 1.6). Domestic demand provided the impetusfor growth during the year—with the contributionof consumption to regional GDP growth ratcheting
27
Table 1.6 Growth in South Asia, 1991–2006Percentage growth rates, points, ratios
1991–2000 2000 2001 2002 2003e 2004f 2005f 2006f
Real GDP growth 5.2 4.2 4.7 4.3 6.5 7.2 6.7 6.5Contribution to growth (points)
Private consumption 2.9 1.9 3.2 2.4 4.0 4.0 3.7 3.6Fixed investment 1.3 1.1 0.8 1.9 2.7 2.7 2.6 2.5Net foreign balance �0.1 1.7 0.6 1.7 0.8 0.2 0.1 0.3
Current account balance (share of GDP) �1.5 �0.7 0.5 1.4 0.7 0.5 0.3 0.3Fiscal balance (share of GDP) �11.0 �9.1 �8.5 �9.7 �9.3 �9.1 �8.9 �8.6
Memo items: real GDP growthSouth Asia excluding India 4.4 5.1 3.1 3.4 5.4 5.9 5.8 5.7
Note: e � estimate; f � forecast.Source: World Bank staff estimates.
—and prospects for catching up are promisingWhile these factors are not readily quantifiable, theoutlook for convergence between the present EuropeanUnion and its newest members is good. Significant FDI in-flows are expected to continue—fueled by falling trade andtransactions costs, coupled with a positive policy environ-ment, attractive relative labor costs, and reduced risk. The
only likely countervailing factor is likely to be slower growthrelated to privatization. The timing of accession in mid-2004is auspicious, given an expected upward trend in growth inthe core EU countries. The accession could well turn out toenhance the prospects for the European Union as a whole,especially as transitional restrictions on labor movement—set to last seven years after accession—are lifted.
Box 1.4 (continued)
gdf_012-035.qxd 4/6/04 1:07 PM Page 27

G L O B A L D E V E L O P M E N T F I N A N C E 2 0 0 4
up from 2.4 percentage points in 2002 to 4 pointsin 2003, and that of fixed investment from 1.9 to2.7 points. In Pakistan, government consumptionwas sustained at low double-digit rates supportedby foreign assistance flows. Relief from droughtwas an important element in the region’s growthpicture during the year, as rural incomes and con-sumption rebounded sharply. Yet acceleration indomestic demand was also tied to intensified in-flows of international funds. Workers’ remittancesto the region—which increased from $13 billion in2001 to $17 billion during 2002, and further to$18.2 billion in 2003—have been key contributorsto the vibrancy of private consumption. FDI, stillnegligible a decade ago, increased to $5.1 billionin 2003 from $4.1 billion the preceding year. Andportfolio equity flows jumped to $7 billion from$1 billion in 2002. These signs of increased inter-national confidence—India, for the first time, wasupgraded to investment-grade status—providedsupport for recovery in domestic investment. AndSouth Asia’s exports of goods and services—led bya 25 percent rise in Pakistan, in part due to an ex-pansion of textile exports—continued the double-digit gains begun in 2002, enabling countries toimport at a similar pace without substantial deteri-oration of external balances.
Sources of growth for South Asia are likely tobecome more diversified—with burgeoning ser-vices exports from locations such as Bangalore,India, and the growing practice of outsourcingfrom the OECD economies. Peace talks betweenIndia and Pakistan, coupled with the regionaltrade initiatives of the South Asian Association forRegional Cooperation may further boost interna-tional confidence. Grounded in these developments,
the strength of the South Asian economy is antici-pated to endure, with output rising to peak growthof 7.2 percent in 2004, followed by a degree ofmoderation. To maintain an accelerated pace ofgrowth, however, policymakers face several chal-lenges. Inflexibility in labor markets, weak bank-ruptcy frameworks, and infrastructure bottlenecksremain a constraint to economic performance andinternational competitiveness. And the impendingphaseout of the international multifiber arrange-ment in 2005 poses a challenge, especially for thesmaller countries of South Asia. But the principalpolicy challenge is India’s large general governmentdeficit of more than 10 percent of GDP, whichthreatens to push up interest rates while crowdingout private investment and limiting policy options.Fiscal consolidation has reduced deficits in SriLanka, while Bangladesh, Nepal, and Pakistanhave considerably smaller deficits—though in thesecountries as well, further consolidation would pro-tect the economies from potential downside risks.
Growth in East Asia propelled by China and the high-tech upturnThe developing countries of East Asia and thePacific are leading the global turnaround in invest-ment, with an 18.6 percent advance in capitalspending in 2003 (table 1.7). Capital formationhas underpinned GDP growth, which acceleratedto 7.7 percent last year, up from 6.7 percent in2002 and 5.6 percent the year before. Healthy in-vestment spending was supported by sanguinefinancial-market sentiment, which translated intolower interest-rate spreads and a partial revival ofportfolio flows. FDI flows, on the other hand,have been slow to rebound, except in China. East
28
Table 1.7 Growth in East Asia and Pacific, 1991–2006Percentage growth rates, points, ratios
1991–2000 2000 2001 2002 2003e 2004f 2005f 2006f
Real GDP growth 7.8 7.2 5.6 6.7 7.7 7.4 6.7 6.3Contribution to growth (points)
Private consumption 3.6 3.5 2.5 2.7 3.1 3.0 3.7 3.5Fixed investment 2.9 3.2 3.2 4.3 6.4 4.3 2.5 3.0Net foreign balance 0.3 �0.2 �0.5 0.8 �0.1 �1.0 �0.5 0.2
Current account balance (share of GDP) 0.4 3.4 2.5 3.6 2.7 2.0 1.4 1.4Fiscal balance (share of GDP) �1.0 �3.3 �3.3 �3.4 �2.9 �3.1 �2.9 �2.7
Memo items: real GDP growthEast Asia & Pacific excluding China 4.7 5.8 2.4 4.4 5.0 5.9 6.5 4.9
Note: e � estimate; f � forecast.Source: World Bank staff estimates.
gdf_012-035.qxd 4/6/04 1:07 PM Page 28

T H E G L O B A L U P T U R N A N D T H E N E E D F O R A D J U S T M E N T
Asian industrial production and export growth—up 20 percent for the year—benefited smartlyfrom the upturn in global demand for high-techproducts.
The engine of regional growth continues to beChina, both through its direct impact on aggregateGDP (amounting to two-thirds of the region) and,increasingly, as an important export market forother regional economies. China’s output grewby 9.1 percent in 2003, with capital spending up23 percent and trade flows rising 35–40 percent. Itis likely that during 2003, exports from the rest ofEast Asia to China overtook—for the first time—exports from these economies to Japan. This de-velopment is offsetting some concerns among EastAsian countries about competitive pressures fromChinese exports in third markets.
Robust near-term momentum in world high-tech demand, healthy gains in East Asian ruralincomes due to higher prices for agricultural com-modities, and improving balance sheets of banksand corporations in several postcrisis economiesshould prove sufficient to sustain stronger growth(74 percent) in 2004. Yet output gains are forecastto moderate over the period to 2006, as cyclicalhighs may indeed have been reached in late 2003.And there are further risks to the generally buoy-ant view. On the domestic front, the ability to re-strain credit creation, to monitor developments inspecific sectors in danger of overheating, and tofoster improved political stability could provechallenging for policymakers. In the internationalcontext, risks stemming from efforts to reverse theU.S. current account deficit, volatile exchange-ratemovements, and rising protectionist tendencies
could adversely affect the region’s prospects. Capi-tal inflows are contributing to a substantial accu-mulation of foreign reserves above conventionalbenchmarks, and in turn to a strong expansion ofdomestic credit, with implications for potentialoverheating in already fast-growing economies.Strengthened financial-sector regulation and super-vision, in addition to greater exchange-rate flexi-bility, among other responses, could help mitigaterisks from credit expansion and runaway growth.Against this background, and with robust GDPoutturns, policymakers in China are seeking to pre-vent overheating and to engineer a soft landingfrom the current investment boom.
Sub-Saharan Africa—continuing to lag In contrast with accelerating growth in other devel-oping regions, GDP growth in Sub-Saharan Africaslowed to 2.4 percent in 2003 from 3.3 percent in2002 (table 1.8). However, these aggregate devel-opments mask divergent trends. The West Africanenergy sector continued to boom, thanks toresilient oil prices and strong investor interest, al-though linkages to other sectors of these economiesremain weak. With steady new discoveries of oilreserves, African oil accounts for a growing shareof global production (figure 1.10). In many othercountries, however, adverse weather conditionsdampened agricultural production and slowed do-mestic demand, while a falloff in export growth,due to sluggish conditions in Europe, caused acompression of imports. In South Africa, exportgrowth was further restrained by sharp apprecia-tion of the rand in response to higher gold pricesand tighter monetary policy to curb inflation. The
29
Table 1.8 Growth in Sub-Saharan Africa, 1991–2006Percentage growth rates, points, ratios
1991–2000 2000 2001 2002 2003e 2004f 2005f 2006f
Real GDP growth 2.2 3.1 3.1 3.3 2.4 3.4 4.2 3.9Contribution to growth (points)
Private consumption 1.3 0.4 2.2 2.3 1.5 1.9 2.1 2.3Fixed investment 0.6 0.7 1.4 1.3 1.1 1.2 1.0 0.9Net foreign balance �0.3 0.5 �0.7 �0.9 �0.9 0.5 0.8 0.6
Current account balance (share of GDP) �1.9 �0.1 �2.6 �2.5 �2.6 �3.8 �3.5 �3.0Fiscal balance (share of GDP) �3.7 �0.4 �1.3 �2.3 �2.6 �2.1 �1.9 �1.8
Memo items: real GDP growthOil exporters 2.1 4.0 3.0 4.0 3.8 3.8 4.8 4.4Excluding oil exporters & South Africa 3.0 2.0 3.8 2.7 2.5 4.6 4.7 4.5
Note: e � estimate; f � forecast.Source: World Bank staff estimates.
gdf_012-035.qxd 4/6/04 1:07 PM Page 29

G L O B A L D E V E L O P M E N T F I N A N C E 2 0 0 4
volatility of domestic performance across Africa isreflected in international capital flows to the re-gion, with the stock of debt fluctuating around$210 billion, roughly equivalent to two-thirds ofGDP. Net flows of long-term debt, either negativeor slightly positive over the 1998–2001 period, in-creased by 0.4 percent of GDP in 2002 and 1.5 per-cent in 2003. Portfolio equity contracted from anet inflow amounting to 2.8 percent of GDP in1999, to a net outflow of 0.1 percent of GDP in2002, before rallying somewhat in 2003. And FDIinflows appear to have narrowed slightly from2.3 percent of GDP in 2002 to 2.1 percent in 2003.
Over the next two years, the region shouldbe able to maintain GDP growth at over 4 per-cent. For non-oil-producing countries, currency
realignments and increased demand should con-tinue to support global commodity prices, whileoil prices are expected to moderate but to remainat still high levels relatively. This would imply re-gional per capita income growth of 1.4 percentin 2004 and near 2 percent thereafter, comparedto 0.5 percent per year for the previous 10 years.Significant structural reforms—in addition togood weather and greater political stability—areneeded to achieve this potential. The downsiderisks to these projections are large and multiple.Intractable problems of disease and poor infra-structure will persist over the forecast period, andwhile policy is moving broadly in the right direc-tion, investment risks remain high and businessenvironments generally poor. Taxation, laborlaws, and excessive regulation have been identifiedas particular problems (World Bank 2003b).Finally, despite genuine progress in resolvingsome of the region’s most egregious civil con-flicts (Angola and Liberia), the situation in theDemocratic Republic of Congo, Somalia, Sudan,and Zimbabwe remains unstable.
Buoyant oil sector boosts growth in theMiddle East and North Africa Despite severe disruption in the Middle East andNorth Africa—tied in large measure to the Iraqconflict—GDP growth jumped from 3.3 percent in2002 to 5.1 percent in 2003, the strongest eco-nomic performance since 1991 (table 1.9). Under-pinning the advance was a sharp upturn in growthfor the region’s oil-exporting economies, to5.7 percent from 3.6 percent during 2002. Higher
30
Table 1.9 Growth in the Middle East and North Africa, 1991–2006Percentage growth rates, points, ratios
1991–2000 2000 2001 2002 2003e 2004f 2005f 2006f
Real GDP growth 3.3 4.4 3.5 3.3 5.1 3.7 3.9 4.0Contribution to growth (points)
Private consumption 1.2 1.8 2.6 1.8 1.0 1.7 1.8 1.6Fixed investment 0.8 0.7 1.3 0.2 2.3 0.9 1.2 1.0Net foreign balance 1.1 1.6 �0.1 �1.2 0.6 0.6 0.2 1.3
Current account balance (share of GDP) �1.7 7.1 4.4 4.6 4.2 2.6 2.0 2.8Fiscal balance (share of GDP) �1.5 �1.1 �1.9 �2.9 �1.1 �3.3 �3.3 �3.0
Memo items: real GDP growthResource poor, labor abundant countries 3.8 3.8 4.5 2.9 4.2 3.9 4.2 4.3Resource rich, labor abundant countries 3.5 4.4 4.0 5.7 5.9 5.0 4.8 5.0Resource rich, labor importing countries 3.2 6.2 2.0 1.1 4.7 2.6 2.7 2.8
Note: e � estimate; f � forecast.Source: World Bank staff estimates.
Figure 1.10 Sub-Saharan African oil production asa share of world oil production, 1994–2003
Percent
Source: World Bank data.
4.4
5.4
4.9
5.0
5.4
5.5
5.2 5.25.3
5.4
5.6
5.7
5.6
5.2
5.0
4.6
4.8
5.8
1994 1995 20032002200120001999199819971996
gdf_012-035.qxd 4/6/04 1:07 PM Page 30

T H E G L O B A L U P T U R N A N D T H E N E E D F O R A D J U S T M E N T
oil prices and a ramp-up in crude oil productionprovided substantial revenue gains, supportingincreased public current and capital spending. Apickup in growth among the diversified exporters(from 3 to 3.9 percent in the year) reflected arebound from severe drought in the Maghreb, in-cluding a strong 6.0 percent advance in Tunisiafrom 1.7 percent in 2002, which additionally re-flected a pickup in its tourism. Other countries—the Arab Republic of Egypt, Jordan, and theSyrian Arab Republic—witnessed a stabilizationor moderate slowing of output. Despite securitytensions throughout the year, capital spendingexpanded by 10 percent, providing a 2.3 per-centage point fillip to growth in 2003, up from0.2 points during 2002. Robust advances weremade in Algeria, the Islamic Republic of Iran, andSaudi Arabia, supported by rising petroleum rev-enues. Soaring oil receipts maintained the region’saggregate current account surplus near $25 billion,or 4.2 percent of regional GDP.
The regional outlook hinges on internationaland domestic developments affecting groups ofcountries in the heterogeneous region. As crude-oilproduction is scaled back once again (with OPECquota reductions expected in 2004), growth amongkey oil exporters is expected to ease to 3.7 percentin 2004 and to maintain a similar pace of expan-sion through 2005. Current account surplusesshould remain sizeable, however, providing re-sources that could be effectively channeled towardstructural reforms. In the case of Iraq, however,the continued recovery in oil production will sup-port the recovery in GDP growth, as the interimgovernment focuses on building capacity for essen-tial services, reconstruction, and job growth withthe assistance of international donors. The soften-ing of growth among the economies of the re-source-rich and labor-importing countries (GulfCooperation Council), in particular, should bemore than offset by firming activity among the morediversified economies, as well as continued stronggrowth among the resource-rich, labor-abundantcountries of the region—notably Algeria and theIslamic Republic of Iran. Gradual recovery inWestern Europe will be critical in stimulating ex-ports from the Maghreb, as well as enhancingprospects for tourism and remittance revenuesacross the region. The balance of these factors sug-gests that regional growth should achieve 4 percentby 2006.
This outlook requires enduring efforts towardstructural reform. Oil producers must managevolatile oil revenues (box 1.5). Others must re-duce their reliance on the public sector. Many ofthe region’s countries have initiated measures tosupport expansion of the private sector and tradein an effort to improve growth prospects. Invest-ment reforms and gradual opening of economiesto trade have been pursued to varying degrees inJordan and Tunisia, two early reformers, and inthe Arab Republic of Egypt and Morocco, as wellas in the resource-based economies of Algeriaand the Islamic Republic of Iran. Among otherinitiatives, countries have been pursuing strength-ened trade ties with Europe through the Euro-Med trade agreements, while intraregion trade isbeing promoted through the Pan Arab Free TradeArea. While gains have been achieved, reformstargeted at the investment climate and at tradehave lagged in comparison to other developing re-gions. Geopolitical tensions form the principalbackdrop of risk to the outlook, which maythreaten steps toward freer trade and constrainthe free movement of labor and, in turn, workerremittances.
A return to growth in Latin America and the Caribbean Growth recovery in the region has been slow, partlydue to uneven performance across countries.Regional GDP advanced by 1.3 percent in 2003, fol-lowing contraction of 0.6 percent during 2002. Ex-cluding countries recovering from acute crises, suchas Argentina, Uruguay, and República Bolivarianade Venezuela, the strongest performers were in theAndean group, where Chile, Colombia, and Perurecorded growth above 3 percent for the year.
Diverging patterns have also been recordedfor the Caribbean and Central American countrygroups. Recent growth performance and prospectsare below average for the former group, whereasa positive 3.1 percent growth rate was achievedby Central America in 2003 and, thanks to therecently signed CAFTA agreements, sustained eco-nomic growth in a 3 percent range is expected forthe near future. In contrast with the situation inother developing regions, output gains in LatinAmerica and the Caribbean relied more onstronger net exports in 2003, which contributed1 percentage point to growth. Domestic demandprovided a net drag on regional dynamics, as both
31
gdf_012-035.qxd 4/6/04 1:07 PM Page 31

G L O B A L D E V E L O P M E N T F I N A N C E 2 0 0 4
private consumption and fixed investment sapped0.2 percentage points from GDP growth. Duringthe first three quarters of 2003, export growthoutpaced that of imports for most countries, whiletrade surplus positions became common.
In the continuing process of adjustment afterfinancial difficulties, Latin American domesticspending was dramatically curtailed, cutting theaggregate current account deficit from $53 billionin 2001 to $2.6 billion by 2003. In mirror image,net financial-resource flows into the region
32
Pitfalls of oil funds—
The ability of oil-and-gas-exporting economies to effectively use export revenues as catalysts for stronger
economic growth and poverty reduction has been, at best,mixed. Several factors play a role:
• Windfall profits and high export revenues in times ofhigh oil prices damage prospects in other tradable sec-tors because of real exchange-rate appreciation: theso-called Dutch disease.
• Energy-based revenues are volatile and unpredictable.Because government budgets depend heavily on the oil revenues, such volatility can easily lead to fiscal instability.
• Energy resources will eventually become exhausted.The prospect does not create a natural investment climate for long-term sustainable development.
—can be managedOil funds, delinked from the current budget and investedabroad, potentially help alleviate these problems. Further,compared to the imbalances associated with petrodollar recycling during the 1970s, creation of oil funds suggestsimprovement in the management of oil rents. Delinking the volatile part of oil revenues from current budgets contributes to fiscal stability. By investing oil revenuesabroad, instead of spending them domestically, the hazardsof exchange-rate appreciation can be mitigated in the event of temporarily high oil prices. Long-term funds may help prepare a country for the depletion of resources.They are usually administered separately from othergovernment accounts, and without the protections of adequate transparency, good governance, and institutionalcontrols, these funds can be subject to the influence of the politically powerful. At the extreme, this can mean
Box 1.5 The benefits and hazards of oil funds
0
10
30
50
40
20
Price of oil and the creation of oil funds in selectedcountries, 1970–2003
$/bbl
1985 1988 1991 1994 1997 2000 20031970 1973 1976 1979 1982
Source: Davis 2001.
25
45
35
5
15
Oman
Alaska (USA),Alberta (Canada),
KuwaitR. B. de Venezuela
Mexico,Iran, Islamic
Rep. of
Colombia
Norway
Azerbaijan,Chad
Kazakhstan,Algeria
Russia
outright theft, but a more common danger is raiding thefunds to finance current expenditures without necessarychecks and balances. Therefore, complete transparencyand clear rules guiding contributions and withdrawals areneeded if the funds are to be a catalyst for long-termgrowth.
Given the potential benefits, an increasing number of oil exporters have created some form of oil fund, particularly since the 1990s. This trend partly reflects therelatively recent firming of oil prices since 1998 and thesubsequent need to manage windfall revenues. Severalcountries have adopted oil funds as part of a broader effortto reorganize and revitalize their hydrocarbon sectors andto make the transition from centrally planned systems (figure), and new oil exporters are emerging, for exampleKazakhstan.
dropped sharply over the period from a peak of$138 billion in 1998 to $38 billion in 2002—orfrom 6.9 percent of GDP to 2.3 percent—thelargest swing for any region. Flows stabilized at anestimated $46 billion in 2003. The evolution offinancial flows reflects a weakening in FDI inflowfrom 5 percent of GDP in 1998 to just over 2 per-cent in 2003, due to the end of the privatizationboom and the economic difficulties in Brazil andArgentina. Net flows of long-term debt declinedfrom 3.2 percent of GDP in 1998 to an outflow
gdf_012-035.qxd 4/6/04 1:07 PM Page 32
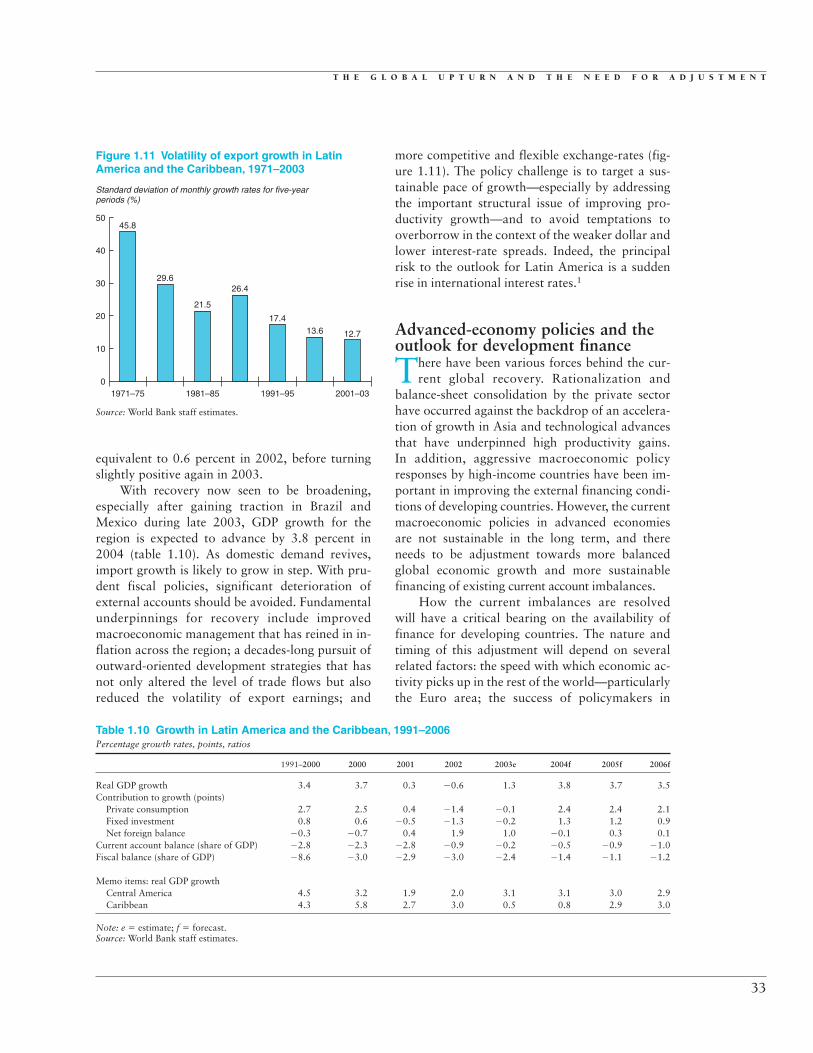
T H E G L O B A L U P T U R N A N D T H E N E E D F O R A D J U S T M E N T
equivalent to 0.6 percent in 2002, before turningslightly positive again in 2003.
With recovery now seen to be broadening,especially after gaining traction in Brazil andMexico during late 2003, GDP growth for theregion is expected to advance by 3.8 percent in2004 (table 1.10). As domestic demand revives,import growth is likely to grow in step. With pru-dent fiscal policies, significant deterioration ofexternal accounts should be avoided. Fundamentalunderpinnings for recovery include improvedmacroeconomic management that has reined in in-flation across the region; a decades-long pursuit ofoutward-oriented development strategies that hasnot only altered the level of trade flows but alsoreduced the volatility of export earnings; and
more competitive and flexible exchange-rates (fig-ure 1.11). The policy challenge is to target a sus-tainable pace of growth—especially by addressingthe important structural issue of improving pro-ductivity growth—and to avoid temptations tooverborrow in the context of the weaker dollar andlower interest-rate spreads. Indeed, the principalrisk to the outlook for Latin America is a suddenrise in international interest rates.1
Advanced-economy policies and theoutlook for development finance
There have been various forces behind the cur-rent global recovery. Rationalization and
balance-sheet consolidation by the private sectorhave occurred against the backdrop of an accelera-tion of growth in Asia and technological advancesthat have underpinned high productivity gains.In addition, aggressive macroeconomic policyresponses by high-income countries have been im-portant in improving the external financing condi-tions of developing countries. However, the currentmacroeconomic policies in advanced economiesare not sustainable in the long term, and thereneeds to be adjustment towards more balancedglobal economic growth and more sustainablefinancing of existing current account imbalances.
How the current imbalances are resolvedwill have a critical bearing on the availability offinance for developing countries. The nature andtiming of this adjustment will depend on severalrelated factors: the speed with which economic ac-tivity picks up in the rest of the world—particularlythe Euro area; the success of policymakers in
33
Figure 1.11 Volatility of export growth in LatinAmerica and the Caribbean, 1971–2003
Standard deviation of monthly growth rates for five-yearperiods (%)
Source: World Bank staff estimates.
0
40
30
10
20
5045.8
29.6
21.5
26.4
17.413.6 12.7
1971–75 1981–85 1991–95 2001–03
Table 1.10 Growth in Latin America and the Caribbean, 1991–2006Percentage growth rates, points, ratios
1991–2000 2000 2001 2002 2003e 2004f 2005f 2006f
Real GDP growth 3.4 3.7 0.3 �0.6 1.3 3.8 3.7 3.5Contribution to growth (points)
Private consumption 2.7 2.5 0.4 �1.4 �0.1 2.4 2.4 2.1Fixed investment 0.8 0.6 �0.5 �1.3 �0.2 1.3 1.2 0.9Net foreign balance �0.3 �0.7 0.4 1.9 1.0 �0.1 0.3 0.1
Current account balance (share of GDP) �2.8 �2.3 �2.8 �0.9 �0.2 �0.5 �0.9 �1.0Fiscal balance (share of GDP) �8.6 �3.0 �2.9 �3.0 �2.4 �1.4 �1.1 �1.2
Memo items: real GDP growthCentral America 4.5 3.2 1.9 2.0 3.1 3.1 3.0 2.9Caribbean 4.3 5.8 2.7 3.0 0.5 0.8 2.9 3.0
Note: e � estimate; f � forecast.Source: World Bank staff estimates.
gdf_012-035.qxd 4/6/04 1:07 PM Page 33

G L O B A L D E V E L O P M E N T F I N A N C E 2 0 0 4
facilitating orderly adjustments in exchange rates;the continued willingness of private investors—andofficial institutions—to finance existing currentaccount imbalances without sharp adjustments inasset prices and exchange rates; and the willingnessof policymakers to reevaluate stimulative policiesas the recovery in activity gathers strength. A grad-ual tightening of fiscal policies in high-incomecountries—particularly in the United States—couldcontribute to an orderly resolution of the currentimbalances and stability in the flows of capital tothe developing world.
Note1. When on January 27, 2004, the U.S. Federal Re-
serve Board noted that increases in interest-rate spreads hadmade many Latin American economies more vulnerable,currencies depreciated and stock markets fell, reversing thesteady improvements of 2003.
References
Davis, Jeffrey, Rolando Ossowski, James Daniel, andSteven Barnett. 2001. “Stabilization and SavingsFunds for Nonrenewable Resources.” IMF Occa-sional Paper 205. International Monetary Fund,Washington, D.C.
IMF (International Monetary Fund). 2003. “Public Debt inEmerging Markets: Is It Too High?” World EconomicOutlook (September).
McCauley, Robert, and Ben S. C. Fung. 2003. “ChoosingInstruments in Managing Dollar Foreign-ExchangeReserves.” BIS Quarterly Review (March).
Muhleisen, Martin, and Christopher Towe, eds. 2004. “U.S.Fiscal Policies and Priorities for Long-Run Sustainabil-ity.” IMF Occasional Paper 227. International Mone-tary Fund, Washington, D.C. January.
Talvi, Ernesto. 2000. “How Should Fiscal Policy Be Set overthe Business Cycle?” PREM Note 47, World Bank,Washington, D.C. November.
World Bank. 2003a. Global Development Finance 2003.Washington, D.C.
World Bank. 2003b. “Doing Business in 2004: Understand-ing Regulation.” Washington, D.C. October.
34
gdf_012-035.qxd 4/6/04 1:07 PM Page 34

gdf_012-035.qxd 4/6/04 1:07 PM Page 35

gdf_036-075.qxd 4/6/04 1:06 PM Page 36

2Private Debt Finance for Developing Countries
IN 2003, NET PRIVATE DEBT FLOWS TOdeveloping countries strengthened markedly.The 2003 net inflow of $51 billion compares fa-
vorably with the net inflow of $3 billion in 2002and a net outflow of $28 billion in 2001 (table 2.1).The recovery in net debt flows mirrored an increasein gross debt financing from bonds and syndicatedloans, which was 34 percent higher in 2003 than2002. It was led by a jump in new bond issuance,from $56 billion in 2002 to $86 billion in 2003(figure 2.1 and table 2.2). Short-term lending, in-cluding from commercial banks, also increasedstrongly, but this increase was heavily concen-trated in a few countries, mainly in Europe andCentral Asia.
Low yields on alternative investments in devel-oped countries—coupled with better credit qualityin emerging markets and a keener appetite for riskamong investors for much of the year—encourageda greater supply of external financing in 2003.Moreover, 2003 saw none of the major financialcrises that in the past have precipitated a sudden
37
.
contraction in bank lending or an interruption inbond issuance. Structural changes in the bankingindustry continued to exert a moderating influenceon lending, although bank lending was probablyparticularly sensitive to improved perceptions ofcredit quality.
Demand for external finance continued to berestrained by improved saving-investment bal-ances in many emerging-market countries. Thatrestraint reflects a desire in developing countries tolimit leverage. But it also reflects the developmentof domestic sources of finance, including deeperdomestic capital markets. This has been mirroredin the large current account surpluses run by sev-eral developing countries and further increases inalready high rates of reserve accumulation. Over-all these adjustments have resulted in significantimprovements in the external liability positions ofdeveloping countries, which have been a factor inrecent credit-rating upgrades.
Strong liquidity and only modest increases indemand for capital lie behind the major decline inthe premiums demanded by investors for taking ondeveloping-country credit risk. The average spreadon emerging-market bonds (EMBIG) fell from 725basis points at the end of 2002 to just 390 basispoints at the end of January 2004—its lowest levelsince 1997—before climbing again to 420 basispoints by mid-February. This compression inemerging-market spreads may, however, have out-stripped the fundamental improvement in creditquality. It will be difficult for investors in emerging-market debt to match the very strong returns theyhave achieved recently. There are signs thatemerging-market bond spreads have recently be-come very sensitive to expectations about the courseof monetary policy, particularly in the United States.
Table 2.1 Net debt flows to developing countriesby region, 2000–03$ billions
2000 2001 2002 2003
Total �3.9 �28.1 3.2 50.6Disbursements 194.0 198.3 202.8 210.3Amortizations 188.8 203.6 201.0 191.7Short-term, net �9.1 �22.9 1.4 32.0
East Asia and Pacific �24.7 �11.3 �3.1 9.4Europe and Central Asia 21.1 0.1 22.7 36.0Latin America and the Caribbean 1.4 �14.1 �20.6 9.3Middle East and N. Africa �3.4 2.0 3.8 �5.7South Asia 2.9 �2.8 2.8 �1.7Sub-Saharan Africa �1.3 �2.0 �2.2 3.4
Source: World Bank Debtor Reporting System.
gdf_036-075.qxd 4/6/04 1:06 PM Page 37

G L O B A L D E V E L O P M E N T F I N A N C E 2 0 0 4
There was some progress in 2003 in strength-ening the overall financial architecture, with thewidespread acceptance of collective action clausesin new bond issues. But a substantial stock ofbonds remains without such clauses. Efforts alsocontinued to revise the Basel Capital Accord tobring the capital that internationally active banksmust hold into better alignment with the risks in-herent in different types of lending.
The recovery in private debt flows and nar-rowing of bond spreads continued amid increasing
evidence of a turnaround in the business cycle inindustrialized countries. The turnaround pushedlong-term interest rates higher, potentially reducingthe attraction of investing in developing-countrydebt. This suggests that private debt financingis likely to grow only moderately in 2004. At thesame time, the availability of funds is likely to bestrongly influenced, as in the past, by investors’perceptions of developing countries’ credit risk.Countries’ demand for funds should rise withstronger economic activity.
But important risks remain. Further increasesin interest rates in advanced economies coulddampen flows, and some correction in spreadsis possible. Renewed volatility in the financialmarkets—likely stemming from imbalances in theadvanced economies—may also have an adverseimpact on flows. And the handling of the restruc-turing of Argentine debt could have an importantinfluence on investor attitudes.
The recent improvement in the terms onwhich financing is available to developing-countryborrowers provides an opportunity for refinancingand debt management. Some developing-countryborrowers have already taken advantage of thatopportunity. But it is important that borrowersheed the lessons of recent years and remain pru-dent about incurring additional external liabilities.Particular care should be taken to ensure thatforeign-currency liabilities are appropriatelyhedged. Moreover, borrowers should beware ofpossible future fluctuations in the availability of fi-nance, particularly in light of the renewed pick-upin short-term financing.
Conditions affecting the supply of funds
Acombination of low yields in developed coun-tries and greater appetite for risk among
investors in 2003 played a significant role in aug-menting the supply of capital and in channelingmore of that capital to developing countries. Inparticular, bond issuance jumped an impressive55 percent over 2002. The increase in bond is-suance accounted for all of the increase in netlong-term private-source debt flows and 43 per-cent of the increase in total private debt flows (in-cluding short-term) in 2003. Moreover, changes inthe external financing environment had more of animpact on bond financing than on bank lending,
38
Table 2.2 Gross market-based debt flows to developing countries, 2000–03$ billions
2003
2000 2001 2002 Year H1 H2
Total 170 143 135 181 83 98
Bonds 60 63 56 86 44 42East Asia and Pacific 5 7 12 11 4 8Europe and C. Asia 15 11 16 26 16 10Latin America 36 38 22 41 20 21Mid. East and N. Africa 2 5 3 1 1 0South Asia 0 0 0 0 0 0Sub-Saharan Africa 1 2 2 6 3 3
Banks 111 80 79 95 39 56East Asia and Pacific 21 9 21 24 11 13Europe and C. Asia 23 15 17 29 9 20Latin America 46 38 20 22 11 12Mid. East and N. Africa 7 7 12 7 2 5South Asia 4 3 2 4 1 3Sub-Saharan Africa 9 7 6 8 4 3
Note: H � half.Sources: Dealogic Bondware and Loanware and World Bank staffcalculations.
Figure 2.1 Debt flows to developing countries,1995–2003
$ billions
�40
20
80
140
200
260
1997 19991995 2001 2003
Sources: World Bank Debtor Reporting System and DealogicBondware and Loanware.
Gross flows
Net flows
gdf_036-075.qxd 4/6/04 1:06 PM Page 38

P R I V A T E D E B T F I N A N C E F O R D E V E L O P I N G C O U N T R I E S
as bonds are tradable assets and thus provide in-vestors flexibility to adjust their risk exposuremore easily and swiftly than in other sectors ofcapital markets.
Average long-term yields in Europe, Japan,and the United States, which had been edging downin 2002 due to economic weakness, declined fur-ther in the first half of 2003, reaching their lowestlevel in 50 years before beginning to turn aroundlate in the year (figure 2.2). The decline provided anincentive for investors to allocate funds into higheryielding developing-country debt, as previous de-clines had done over the past decade. Increasinglydeveloping-country investments have joined themainstream. Investors have moved funds in and outof developing countries opportunistically, substi-tuting assets in developed countries for developing-country investments, rather than remaining faithfulto the asset class. Though most investors in theclass have a relatively long investment horizon,emerging-market debt funds thus remain poten-tially volatile. In 2003, the average long-term(10-year) government yields on developed-countrydebt declined to 2.9 percent from an average of3.5 percent in 2002. Yields on developing-countrydebt declined as well, but, at an average rate of9.1 percent, they continued to provide investors anopportunity for substantial returns over developed-country debt, albeit at a higher risk.
Debt flows to developing countries have sel-dom been motivated purely by nominal rates ofreturn, particularly since the mid-1990s. Creditrisk concerns—or perceptions of risk, which are in-fluenced by the overall risk sentiment in capitalmarkets—have had an important influence aswell (see Global Development Finance 2003).Developing-country debt, for much of its history,has been highly sensitive to events, positive andnegative. The value of that debt has fluctuatedwidely, as demonstrated by a statistical analysis ofthe distribution of daily changes in benchmarkrisk premiums (figure 2.3). A significant part ofthe distribution of developing-country spreads liesfar outside the boundaries of a normal distributionthat might be achieved with the same mean andvariance. In other words, it has a “fat-tailed” dis-tribution. This implies that developing-countrydebt is inherently more risky than the usual alter-natives. Accordingly, changes in risk perceptionsin the external financing environment have playeda disproportionately strong role in influencingcapital flows to developing countries.
Alongside the incentive of higher returns, cru-cial factors shaping investors’ portfolio-allocationdecisions have been the perception of the credit riskassociated with developing countries and investors’overall appetite for risk. Both improved in 2003.The perception of lower credit risk has come aboutas investors have lowered their expectation of
39
Figure 2.2 Yields on debt to developing anddeveloped countries, 1990–2003
Percent
2
5
8
11
14
17
20
23
1990 1993 1996 1999 2002
Note: Developing-country yields refer to yields on benchmarkemerging-market bond indexes and developed-country yields referto average of long-term (10-year) benchmark government yieldsfor the United States, Europe, and Japan.Sources: Bloomberg, J.P. Morgan Chase, and World Bank staffcalculations.
Developing countries
Developed countries
Figure 2.3 Distribution of daily change in spreads,Jan. 1998–Oct. 2003
Frequency of observation
0.1
1
10
100
1,000
10,000
100,000
�1,
350
�1,
050
�75
0�
450
�15
015
01,
350
1,05
075
045
0
Source: World Bank staff calculations based on J.P. MorganChase data.
Developing-countrydistribution
Normal distribution(with same mean
and variance)
Spread change (basis points)
gdf_036-075.qxd 4/6/04 1:06 PM Page 39

G L O B A L D E V E L O P M E N T F I N A N C E 2 0 0 4
systemic risk associated with developing-countrydebt. The investor base for developing countriesis now more diversified, keeping in check the herdmentality. More investors now treat developing-country investments as part of a more diversifiedportfolio that provides a better buffer during timesof stress—in part due to the depth, breadth, andliquidity of the mature markets in which such port-folios can be traded. Increasing mainstreaming ofdeveloping-country investments also reducesvolatility, as investment allocations are made morestrategically (for example, by risk-allocation com-mittees of investment funds) and with a long-terminvestment horizon. In the early 1990s, by contrast,the investor base consisted mainly of specializedinvestors who focused primarily on developingcountries. Those investors aimed to minimize themisalignment of their own portfolio’s performanceagainst those of their peers, an effort that oftenled to a simultaneous and extreme fluctuation ofexpectations that greatly affected the availabilityof capital for developing countries.
Joint efforts by the international financial in-stitutions, capital market participants, and devel-oping countries to strengthen the overall financialarchitecture and the flow of information also havehelped to support investor confidence. Those ef-forts have resulted in the adoption of sounder eco-nomic policies, as well as in greater transparencyin the liability positions of many developing coun-tries. More research is being done by investors andpromoters of developing-country debt. Manymore developing countries currently carry ratingsby independent credit rating agencies than duringthe early 1990s. Moreover, changes in the ratingshave become much more congruent with changesin countries’ economic fundamentals and theirprospects for external financing.
The string of crises since the mid-1990s exposedvulnerable spots in developing-country debt mar-kets. Together, the countries that have experiencedcrises have accounted for almost 60 percent of theoutstanding private-capital debt stock of developingcountries. That market-based financing continues tobe available to developing countries indicates thatinvestors have acknowledged the risky nature ofthose investments and are finding ways to cover theirexposure—for example, through the credit deriva-tive market. Finer distinctions among countries’creditworthiness, in great part due to better researchand information, have reduced the probability of
shocks rippling with the same intensity through theentire credit spectrum and across countries. Theprobability that investors’ asset values will be pre-served has therefore increased. The impact of succes-sive shocks on developing-country debt prices andthe quantity of new debt acquisition both have beenlower in recent years than in the late 1990s, whenspikes in risk premiums were typically more intenseand interruptions to capital-market access morefrequent and prolonged. The average of the peaks inthe developing-country risk premium during thecrises in Turkey (2000), Argentina (2001), and Brazil(2002) was about 900 basis points, much lower thanthe average of about 1,550 basis points during theMexican (1994) and Russian (1998) crises.
Further statistical analysis indicates thatepisodes of contagion resulting from a simulta-neous deterioration of investors’ expectations (asopposed to that warranted by countries’ macro-economic fundamentals), and the severity ofthose episodes, have declined over time (table 2.3).
40
Table 2.3 Declining severity of contagion over timeProportion of variance in daily changes in spreads explained by thefirst principal component
VariationCrisis Analysis period explained
Argentina Jan. 2001 Jun. 2001 0.27Oct. 2000 Dec. 2001 0.41
Brazil Nov. 1998 Apr. 1999 0.54Dec. 1998 Sep. 2000 0.45
Brazil/Turkey Jan. 2002 Aug. 2002 0.27Sep. 2002 Sep. 2003 0.29
East Asia Sep. 1997 Feb. 1998 0.70Mexico Dec. 1994 May 1995 0.69Russian Federation Jul. 1998 Dec. 1998 0.65
Note: Developing-country spreads have often shown systematic co-movements, especially around shocks. Statistical characteristicsof the spread data for various countries taken as a set can be used toanalyze market conditions and the impact of shocks. Increases inspreads across the board after an adverse localized shock thatshould not warrant ripple effects across countries suggest signs ofcontagion. The statistical technique of principal component analysisenables an estimation of the impact of the implicit underlying variables that are assumed to influence the joint dynamics of the dependent variable (in this case the set of spreads). This techniquetransforms a set of systematically correlated variables (spreads) intoa set of uncorrelated variables that possess explanatory power forthe dependent variable and are ranked by reducing variability. Thefirst principal component (FPC) explains the greatest amount ofvariation, or dispersion from the mean, in the dependent variable. Inthe above analysis, the declining value of variation being explainedby the FPC over time suggests that an increasingly smaller portionof variation in the change in spreads can be attributed to one combination of implicit underlying explanatory variables. Instead,the explanatory power is being increasingly spread out over a variety of factors. This suggests that the severity of contagion from a particular event may be declining, as investors increasinglydifferentiate risk across countries.Source: World Bank staff calculations.
gdf_036-075.qxd 4/6/04 1:06 PM Page 40

P R I V A T E D E B T F I N A N C E F O R D E V E L O P I N G C O U N T R I E S
The proportion of variance in daily changes indeveloping-country spreads that can be attributedto particular shocks (measured by first-principal-component analysis) is much lower in recentyears than it was until the late 1990s.
In 2003, the recovery in corporate profitabil-ity and economic growth in developed countrieshelped ease investors’ risk aversion (figure 2.4). Areduction in the overall level of uncertainty associ-ated with the future course of business and theeconomic environment has often helped spur in-vestor appetite for risky assets. One implicit mea-sure of risk appetite, the Liquidity, Credit, andVolatility Index (LCVI) (box 2.1), indicated ahigher investor tolerance for risk in 2003 than in2002. Its components showed that liquidity in themarkets improved more or less continuouslythroughout 2003. Despite periods of volatility incapital markets due to interest-rate uncertaintiesin the United States, the heightened liquidity pro-vided high-risk borrowers, including developingcountries, with fertile fields for new financing.
Of particular importance was the improve-ment in investor sentiment toward developed-country high-yield debt, as investors in such debtare also a significant source of funds for develop-ing countries’ debt (figure 2.5). Although spreadson high-yield debt historically stayed below thedeveloping-country spreads, investor sentiment inthis sector had suffered since 2000 due to highrates of bankruptcy, corporate failures, and lowprofitability, all of which drove up the high-yieldrisk premium in 2002 to its highest levels since the
early 1990s—nearly 1,100 basis points. Combinedwith reduced fears of contagion and systemic cri-sis in developing-country debt, the improved atti-tude toward risk has reinforced the incentive ofyield differentials between developed and devel-oping countries and encouraged investments indeveloping-country bonds.
Conditions affecting the demand for funds
Since the crises of the late 1990s, several adjust-ments to domestic economic balances have re-
duced demand for external finance. These adjust-ments in many cases reflect a reduction in debtleverage, particularly in the corporate sector, andincreasing reluctance of borrowers to exposethemselves to the risks of borrowing in foreigncurrency. Domestic investment rates have alsofallen in some regions.
Of equal importance has been the developmentin recent years of deeper domestic capital marketsin countries such as Brazil, Chile, Hungary, India,the Democratic People’s Republic of Korea,Malaysia, Mexico, Poland, South Africa, andTurkey. Apart from helping reduce their depen-dency on external finance—and thus their exposureto exchange-rate and liability mismatches—thedevelopment of local bond markets serves sev-eral functions—among them mobilizing domesticsavings, providing an operational tool for economicmanagement policies, and setting benchmarks for a
41
Figure 2.4 U.S. corporate profits, 2000–03
$ billions
550
600
650
700
750
800
850
2000 2001 2002
Source: Bloomberg.
2003
Figure 2.5 Spreads on developing countries andon developed-country high-risk debt, 1990–2003
Basis points
0
300
600
900
1,200
1,500
1990 19961993 1999 2002
Sources: Bloomberg and J.P. Morgan Chase.
Developing countries
Developed-country high-risk
gdf_036-075.qxd 4/6/04 1:06 PM Page 41
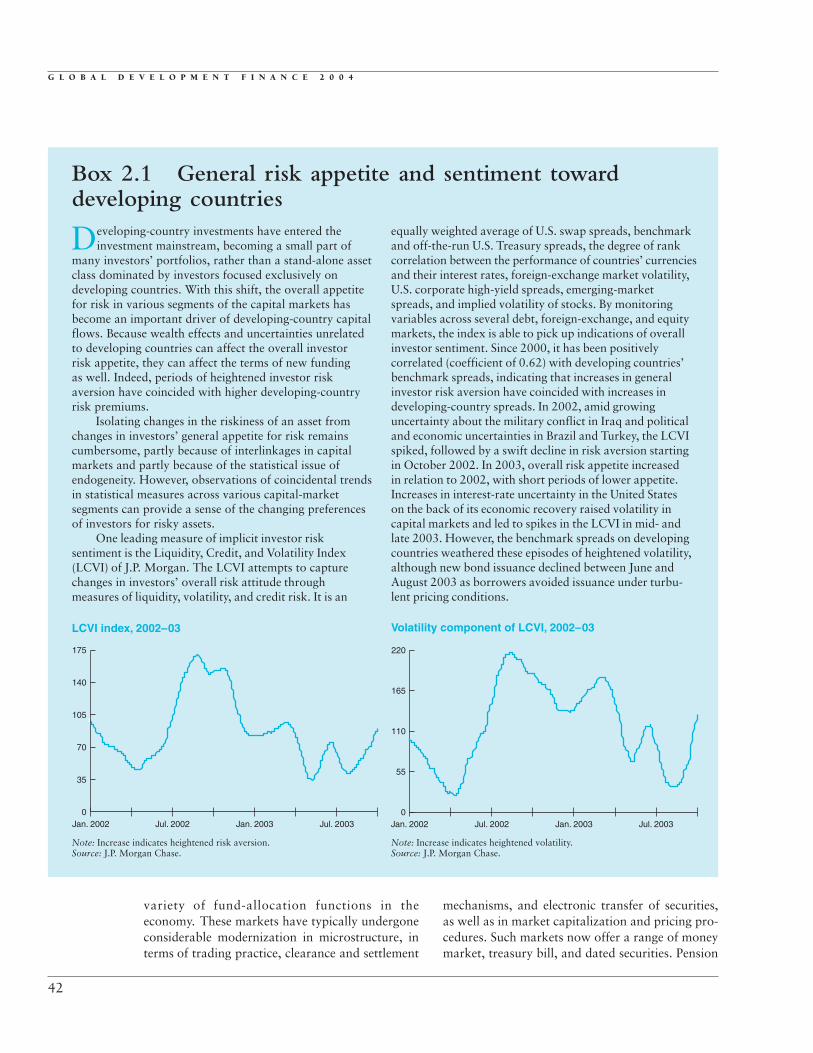
G L O B A L D E V E L O P M E N T F I N A N C E 2 0 0 4
variety of fund-allocation functions in theeconomy. These markets have typically undergoneconsiderable modernization in microstructure, interms of trading practice, clearance and settlement
mechanisms, and electronic transfer of securities,as well as in market capitalization and pricing pro-cedures. Such markets now offer a range of moneymarket, treasury bill, and dated securities. Pension
42
Developing-country investments have entered the investment mainstream, becoming a small part of
many investors’ portfolios, rather than a stand-alone assetclass dominated by investors focused exclusively on developing countries. With this shift, the overall appetitefor risk in various segments of the capital markets has become an important driver of developing-country capitalflows. Because wealth effects and uncertainties unrelatedto developing countries can affect the overall investor risk appetite, they can affect the terms of new funding as well. Indeed, periods of heightened investor risk aversion have coincided with higher developing-countryrisk premiums.
Isolating changes in the riskiness of an asset fromchanges in investors’ general appetite for risk remains cumbersome, partly because of interlinkages in capitalmarkets and partly because of the statistical issue of endogeneity. However, observations of coincidental trendsin statistical measures across various capital-market segments can provide a sense of the changing preferencesof investors for risky assets.
One leading measure of implicit investor risksentiment is the Liquidity, Credit, and Volatility Index(LCVI) of J.P. Morgan. The LCVI attempts to capturechanges in investors’ overall risk attitude throughmeasures of liquidity, volatility, and credit risk. It is an
equally weighted average of U.S. swap spreads, benchmarkand off-the-run U.S. Treasury spreads, the degree of rankcorrelation between the performance of countries’ currenciesand their interest rates, foreign-exchange market volatility,U.S. corporate high-yield spreads, emerging-marketspreads, and implied volatility of stocks. By monitoringvariables across several debt, foreign-exchange, and equitymarkets, the index is able to pick up indications of overallinvestor sentiment. Since 2000, it has been positivelycorrelated (coefficient of 0.62) with developing countries’benchmark spreads, indicating that increases in generalinvestor risk aversion have coincided with increases indeveloping-country spreads. In 2002, amid growinguncertainty about the military conflict in Iraq and politicaland economic uncertainties in Brazil and Turkey, the LCVIspiked, followed by a swift decline in risk aversion startingin October 2002. In 2003, overall risk appetite increasedin relation to 2002, with short periods of lower appetite.Increases in interest-rate uncertainty in the United Stateson the back of its economic recovery raised volatility incapital markets and led to spikes in the LCVI in mid- andlate 2003. However, the benchmark spreads on developingcountries weathered these episodes of heightened volatility,although new bond issuance declined between June andAugust 2003 as borrowers avoided issuance under turbu-lent pricing conditions.
Box 2.1 General risk appetite and sentiment towarddeveloping countries
0
35
70
105
140
175
Jul. 2003Jan. 2002 Jul. 2002 Jan. 2003
LCVI index, 2002–03
Note: Increase indicates heightened risk aversion.Source: J.P. Morgan Chase.
0
55
110
165
220
Volatility component of LCVI, 2002–03
Jul. 2003Jan. 2002 Jul. 2002 Jan. 2003
Note: Increase indicates heightened volatility.Source: J.P. Morgan Chase.
gdf_036-075.qxd 4/6/04 1:06 PM Page 42

P R I V A T E D E B T F I N A N C E F O R D E V E L O P I N G C O U N T R I E S
reform has played an important role in developingdomestic markets in several countries, particularlyin developing a large local institutional investorbase. Domestic markets have provided borrowerswith access to financing in local currency, impor-tant for borrowers operating in the nontradablesectors and for sovereign issuers seeking to avoidcurrency risk. In 2003, companies such as Mexico’sCoca-Cola, FEMSA, and Cemex found it advanta-geous and possible to raise even quite large loansby issuing bonds in domestic markets, reducingtheir need to draw on international markets.
Improved external liability positions andrating upgrades bolster investor sentimentBetter credit quality in developing countries in2003 translated into better credit-risk ratings. Rat-ing upgrades (and improved economic prospects) incertain developing countries that had experiencedsubstantial economic and financial difficulties re-cently (Brazil, Pakistan, the República Bolivarianade Venezuela, the Russian Federation, and Turkey),were particularly important in influencing investorsentiment. As upgrades exceeded downgrades, theoverall creditworthiness of developing countries,proxied by their sovereign ratings on Moody’s rat-ing scale, increased to its highest level since the be-ginning of 1998 (figure 2.6). Average credit qualitybased on ratings of countries on the Standard andPoor’s rating scale also showed an improvement in2003. However, overall creditworthiness measuredon Standard and Poor’s ratings was more conserva-tive, and the improvement in credit quality some-what lower, than those based on Moody’s ratings,as has generally been the case since 1998. Changesin ratings reflect progress on several domesticfronts, including the ability to service external debt,stability in the political and economic climate,prospects for economic growth, and increasingresilience of several countries to external shocks.But concern over the sustainability of public-debtpositions in some countries continues. In contrastto developing countries, global credit quality wasdown for most of 2003, although the pace of de-cline eased as the year progressed. It is not clearthat the general trend toward rating upgrades willbe maintained. Standard and Poor’s recently indi-cated that it expected downgrades to exceed up-grades over the coming year in Latin America.
Credit quality varied across regions. The aver-age rating for Latin America (B1) remained the
lowest of all regions—almost two notches belowthe developing-country average of Ba2. By contrast,average credit quality in Europe and Central Asia(Ba1) reached its highest point since 1997. Creditquality in East Asia (Baa3, the investment-gradethreshold on the ratings scale) continued to nudgeup, building on improvements since 2001.
One factor contributing to the improvementin investor sentiment and the tendency toward rat-ings upgrades is the fall in net external debt of de-veloping countries since the late 1990s. Many de-veloping countries have also built up substantialreserves (figure 2.7).
Despite a jump of almost $93 billion in totaldeveloping-country debt in 2003 (in part due tocross-currency valuation effects due to the declinein the exchange rate of the U.S. dollar againstother major world currencies), the total externaldebt of developing countries declined to about37 percent of their gross national income (GNI),compared with 44 percent in 1999.
Short-term debt, against which countries mustmaintain adequate liquidity, fell from 19 percent in1997 to about 14 percent of the total outstandingdebt in 2002, before increasing again to 15 percentin 2003 (table 2.4). Over the same period, the level
43
1998 1999 2000 2002 20032001
Note: The average credit quality is calculated based on weightedaverages of long-term foreign-currency credit ratings of countriesby Moody’s Investor Service. The weights applied are the totaloutstanding foreign-currency debt as reported by the World Bank.The ratio of actions refers to all credit-rating actions carried outin relation to emerging markets, namely upgrades, downgrades,changes in outlooks, reviews, and credit watches.Source: World Bank staff calculations based on Moody’s InvestorService and J.P. Morgan Chase.
�70
70
50
30
10
�10
�30
�50
Ba1
Ba2
Ba3
Figure 2.6 Quality of developing-country credit,1998–2003
Moody’s rating Ratio of rating actions
Ratio of actions
Average credit quality
gdf_036-075.qxd 4/6/04 1:06 PM Page 43

G L O B A L D E V E L O P M E N T F I N A N C E 2 0 0 4
of developing-country international reserves, mea-sured as a ratio of their outstanding short-term debt,jumped from about 1.5 to 3.5—a much thickerbuffer to deal with potential external shocks. In2003, international reserves were high enough tocover imports for six months, compared with fourmonths in 1997. Overall, the sources of foreign-exchange revenue, critical to servicing external debt,are better matched with the total debt burden ofdeveloping countries. For example, the total debtstock as a percentage of developing-country exportsof goods and services was around 98 percent in2003, compared with 130 percent in 1997.
External liability positions, however, varywidely by developing region. The total externaldebt of East Asia declined to 26 percent of the re-gion’s GNI in 2003 from 40 percent in 1998. Asa whole the region is maintaining internationalreserves worth nearly five times its short-term
debt, compared with an average of three and ahalf times for all developing countries. By con-trast, the total debt stock of Latin America and theCaribbean and of Europe and Central Asia has in-creased from the late 1990s. However, these re-gions are maintaining higher international reservesto cover their short-term liabilities.
Although the net external liability positionsof many developing countries have improvedmarkedly in recent years, the issue of public debthas been receiving increasing attention from ana-lysts and investors. Public debt has increasedmarkedly across a broad range of emerging-market economies in recent years, largely reflect-ing movements of interest and exchange rates onexisting debt, the recognition of off-balance sheetand contingent liabilities, and the recapitalizationof banking systems in some countries. Primary fis-cal balances have typically weakened somewhatsince the 1990s in most regions and have not offsetthe impact of other factors on public debt-to-GDPratios. Public debt now averages about 70 percentof GDP in emerging-market economies, with theprogress made as a result of large privatizationprograms in the first half of the 1990s having beenreversed in many regions (IMF 2003). There havebeen defaults, or restructurings of distressed publicdebt, in Argentina, Ecuador, Pakistan, the RussianFederation, Ukraine, and Uruguay. In the light ofthe typically low level and high volatility of publicrevenues and the structure of public debt—with arelatively high proportion of debt external orlinked to foreign exchange rates and domestic debttypically relatively short-term—the sustainableratio of public debt-to-GDP in emerging marketsmay be somewhat lower than is normal in devel-oped countries.
Ongoing structural change infinancing
The pattern of external financing for developingcountries has changed greatly over time and
especially in recent years, following a string offinancial and economic crises in the 1990s. Bond fi-nancing has grown from its roots in distressed com-mercial bank debt to become a major, albeit volatile,source of financing. In addition, structural—andstrategic—changes in the international bankingsystem have occurred during the same period.
44
Table 2.4 Selected indicators of debt burden,1997–2003Percent
1997 2000 2001 2002 2003
Short-term debt/total debt 18.6 14.1 14.5 13.9 15.0
Total debt stock/exports 130.1 117.0 116.5 111.4 98.2Total debt service/exports 18.2 19.4 19.4 17.8 15.0International reserves/
total debt stock 29.8 31.8 35.8 42.6 51.4International reserves/
months of imports 4.4 4.5 5.0 5.8 6.1
Source: World Bank Debtor Reporting System.
Figure 2.7 International reserves of developingcountries, 1993–2003
$ billions
0
200
400
600
800
1,000
1,200
20031997 1999 200119951993
Source: International Monetary Fund.
East Asia
Latin America
Mid. East & N. Africa
Europe & Central Asia
South Asia
Sub-Saharan Africa
gdf_036-075.qxd 4/6/04 1:06 PM Page 44

P R I V A T E D E B T F I N A N C E F O R D E V E L O P I N G C O U N T R I E S
Since the financing pattern in 2003 reinforcedthese changes, a brief historic review helps put intoperspective the recent developments in bond andbank flows to developing countries.
Historically, bank lending and bond financinghave alternated in providing financing for develop-ing countries. After cycles of default on externaldebt (primarily bond debt) during the 1820s,1870s, and 1930s, growth in debt financing duringthe 1970s was driven primarily by bank lending.Faced with high crude oil prices, most developingcountries ran sizeable current account deficits(averaging 1.2 percent of GDP during the 1970s, ex-cluding the Middle East and North Africa). At thetime, commercial banks were awash with liquidityfrom the revenues of oil-exporting countries. Sloweconomic growth in developed countries amplifiedthe attraction of the higher returns available indeveloping countries, leading banks to take onsizeable exposures there. However, as real interestrates in major developed countries increased andcommodity prices (a key determinant of foreignexchange revenue for many developing countries)declined, bank debt burdens in many countries be-came unsustainable, beginning a cycle of declinein credit growth in developing countries. Net long-term bank lending to developing countries fell dra-matically during the 1980s.
A second downturn in the credit growth cycleoccurred after a period of credit expansion in the1990s that was fueled by bond financing. The
average annual rate of growth in the stock of bonddebt in the 1990s was 23 percent, compared with2 percent for bank lending (figure 2.8). Bond financ-ing continues to fuel the current credit growth cyclefor developing countries, as it did in the 1990s.
Bond flows responded strongly to theexternal environment and domesticconditions
Bond financing in 2003 was very responsive tochanges in investor sentiment, as reflected in
both the price and quantity of such financing. Banklending, on the other hand, remained relativelysubdued and stable.
A sharp rally in bond spreadsThe combination of the stimulus from the externalfinancing environment and the effects of domesticeconomic conditions in developing countriesmanifested itself strongly in a sharp decline inbenchmark spreads for developing countries. Thecredit-default swap (CDS) spreads, which reflect themarket-clearing premium for insurance againstthe probability of a country defaulting on its debt,dropped sharply in 2003, indicating an improve-ment in risk perception of developing countries(box 2.2). In a CDS contract the buyer is obligatedto make to the seller periodic payments in exchangefor the right to sell the underlying security at a pre-established value should a credit event occur duringthe life of the contract. Overall, CDS spreads fordeveloping countries declined by almost 490 basispoints in 2003—to 250 basis points from their peakof 736 in August 2002—indicating a significantdrop in the implied probability of default (fig-ure 2.9). The decline in spreads was accompaniedby an equally strong drop in the volatility of CDSspreads to 13 percent in September 2003, fromclose to 50 percent in August 2002. CDS spreads forAsia, at 120 basis points, were the lowest of allregions, declining from 225 in August 2002. Incomparison, spreads for Latin America were al-most four times higher, at around 460 basis points.However, these spreads had contracted sharplyfrom more than 2,000 basis points at the height ofthe uncertainty surrounding Brazil in 2002.
Apart from the CDS market, which reflectstransactions (as opposed to indicative prices some-times used to estimate conventional spreads) and alonger term assessment of risk, investors’ strong
45
1971
1976
1981
1986
1991
1996
2001
Source: World Bank Debtor Reporting System.
100
80
60
40
20
0
40
25
10
�5
Figure 2.8 Growth in private debt and share ofbank lending in private debt, 1971–2002
Percent Percent
Share of banklending in private
debt stock(right axis)
Growth in stockof private debt
(left axis)
gdf_036-075.qxd 4/6/04 1:06 PM Page 45

G L O B A L D E V E L O P M E N T F I N A N C E 2 0 0 4
appetite for exposure to tradable developing-country debt was evident in the secondary marketfor international bonds. That increased appetitefueled the sharpest and longest rally ever seen indeveloping-country secondary-market benchmarkspreads, which tumbled from a peak of almost 950basis points in September 2002 to close to 390basis points by the end of January 2004, the lowestlevel since mid-1997 (figure 2.10 and box 2.3). Thecompression was led by Brazil, whose spreadsdropped by almost 2,000 basis points during thesame period. (Brazilian spreads had increased byabout 1,750 basis points between March andSeptember of 2002, in the face of uncertainties overgeneral elections and economic difficulties in thecountry.)
Several features in the spreads’ rally pointed toincreasing sophistication of investors with regard
to developing-country risk and a more seasonedapproach by borrowers in contracting new debt.
The decline in developing-country spreads wasspectacular on its own and by historic standards.Apart from the current rally, three other majorepisodes of spread compression can be identifiedsince the early 1990s, when developing-countrybond financing began to evolve. The decline inspreads through April 2003 (the first seven monthsof the rally) was by about 475 basis points, morethan double the average degree of spread compres-sion in the previous three episodes (figure 2.11). Thefact that spreads declined sharply despite consider-able uncertainty over global economic growth, theIraq war, and volatile equity markets at the begin-ning of 2003 made the rally even more impressive.
Furthermore, the decline in spreads occurredfor countries across all regions and across the
46
Figure 2.9 Credit default swap spreads for alldeveloping countries and selected regions
Basis points
a. CDS spreads for Latin America reached a peak of more than2,000 basis points.Source: J.P. Morgan Chase.
0
300
600
900
All Asia
736
250 225
120
400
194
�2,000
460
Eastern Europe Latin Americaa
Peak in Aug. 2002 Sep. 2003
1,500
1,100
1,300
300
500
700
900
2,600
1,800
1,400
1,000
200
600
Figure 2.10 Developing country spreads, 2002–04
Basis points
2,200
Source: J.P. Morgan Chase.
2002 2003 2004
Brazil(right axis)
All developingcountries(left axis)
Basis points
Trading in the market in sovereign credit-default swapsincreased markedly in 2003, after falling in 2002, as
Argentina, which had been the second most active countryin 2000, became inactive following its default in 2001.Emerging-market countries dominate the market for sovereign credit default swaps, with more than 90 percentof trading activity linked to such credits (Packer andSuthiphongchai 2003). Brazil, Mexico, the Philippines, and South Africa are the most active credits, followed by
China and Colombia. The availability of an increasinglyliquid credit derivative market has provided investors and lenders with greater flexibility to manage their risk exposures and ensure risks are borne by those most willingto do so. However, given the relative novelty of the marketand the relatively light supervisory framework for some institutions, such as insurance companies, which are sellingcredit protection, concerns about the potential systemicconsequences of a major credit event or events remain.
Box 2.2 The developing-country credit-default swap market
gdf_036-075.qxd 4/6/04 1:06 PM Page 46

P R I V A T E D E B T F I N A N C E F O R D E V E L O P I N G C O U N T R I E S
47
The most commonly used data on secondary-marketspreads for developing countries comes from several
emerging-market bond index (EMBI) series compiled byJ.P. Morgan Chase. These market-capitalization-weightedindexes include U.S. dollar–denominated Brady bonds,Eurobonds, traded loans, and sovereign or quasi-sovereignlocal-market debt instruments for a range of emergingmarkets. The proportionality of instruments used in the indexes varies according to the overall composition ofemerging-market debt at various points in history. Thesedata provide a comprehensive picture of developing-country spreads but have some distinct characteristics:
• Expanding country coverage. As the universe ofdeveloping countries accessing capital markets hasexpanded over the years, various index series haveevolved as well. The countries included in each succes-sive index increased, rising from 8 in the early 1990s to33 in 2002, before declining to 31 in 2003 (see timelinein the first figure below). Starting out with EMBI in1990, the index evolved into EMBI�. EMBIG (forEMBI Global) was introduced in 1998. The credit riskembodied in various indexes has changed over time.
• Reweighting. The weights assigned to individual coun-tries and instruments are reshuffled frequently due tochanging country coverage, changing recommendationsby the investment bank to investors on how to allocateportfolios most efficiently, and changes in the outstand-ing debt of countries. Occasionally the reweighting canhave a significant impact on the overall level of spreadsfor developing countries, as when Argentina’s weight
in EMBIG dropped from close to 16 percent beforedefault (December 2001) to about 2 percent by 2003(see second figure below).
• Instrument coverage. The mix of securities included in various indexes varies. For example, the recentEMBIG, apart from including international bonds (its largest component), also includes certain local-currency bonds and tradable loans. The original EMBI was composed primarily of Brady bonds.
• Representative prices. Occasionally, indicative prices have to be used. The prices recorded for various trades may not necessarily be an adequate representation of overall investor sentiment toward a particular country at a particular point in time.
These characteristics, apart from posing other limitations, complicate historical comparison of spreads at the aggregate level, as not all indexes go back to thesame point in history. For example, by early October2002, emerging-market spreads had widened to their second highest point since early 1999. It would appear at first glance that the rise in spreads was nowhere as high as it had been in previous episodes. However, amongother things, the changes in weights assigned to countriesincluded in the overall developing-country spread indexshould be kept in mind when comparing movements inspreads over time. A better perspective can be obtained by also comparing spreads for individual countries,preferably holding constant the financial securities whoseprices make up the spreads for that country, as well asother variables.
Box 2.3 Characteristics of developing-country spread measures
Developing-country spreads, 1990–2003
Number of countriesin index
Basis points
0
400
800
1,200
1,600
1990
Source: J.P. Morgan Chase.
19961993 1999 2002
8 14 33 31
Basis points
Comparison of spreads using fixed versus variableweights, 1998–2003
0
1,000
500
1,500
2,000
2,500
1998 20001999 2001 20032002
Developing-country spreadsbased on fixed weights
Developing-country spreadsbased on variable weights
Sources: J.P. Morgan Chase and World Bank staff calculations.
gdf_036-075.qxd 4/6/04 1:06 PM Page 47

G L O B A L D E V E L O P M E N T F I N A N C E 2 0 0 4
48
entire spectrum of credit risk, albeit raising ques-tions about the widespread effect of market liquid-ity (figure 2.12). Commensurate with credit riskpatterns, spreads continued to differ across regions.Average spreads for Asia declined to 210 basispoints by the end of 2003 from close to 300 basispoints at the beginning of the year, while spreadsfor Latin America halved to around 500 basispoints from almost 1,000 basis points. In terms ofcredit risk classification, spreads on investment-grade-rated countries declined from 272 to 185basis points from the start to the end of 2003, whilethose for countries rated at the bottom of the creditspectrum dropped from 3,555 to 2,600 basispoints.
The limited demand for new funds by borrow-ers, especially earlier in 2003, reinforced the rallyin spreads. Because new bond issuance did not keepup with the sharp and swift increase in the supplyof capital, investors sought to acquire developing-country debt through secondary-market trading inexisting debt, driving up prices and further narrow-ing spreads.
And an incremental buildup in bond issuanceSince the late 1990s, borrowers have generallyremained cautious about contracting new debt.Following the financial crisis of 1997–98, the EastAsian countries adjusted their financing require-ments to work with less debt; they have purposelyavoided issuing bonds to the same extent as they
did before the crisis. Borrowers in other regionshave been periodically reminded of the risks ofhigh international debt by the experience of coun-tries that were major borrowers in the mid- to late1990s and became victims of financial problems inrecent years. The volatility in external financingconditions helped hasten the development of localbond markets, as did pension reforms. Most of thegrowth occurred after 1997, on the heels of theturbulent period experienced by developing coun-tries in the international bond markets. Domesticcapital markets have become an important sourceof corporate finance in East Asia and in somecountries in Latin America.
Nevertheless, the decline in benchmark spreadsprovided enticing opportunities for all categoriesof borrowers to lock in new international debt atcompetitive terms, since secondary-market spreadsinfluence pricing of new bond issues. Developingcountries, however, did not immediately respondto the sharp decline in spreads with a flood of newbonds. Although new bond volume increasedstrongly in early 2003, the jump reflected pent-updemand from the interruption in issuance in late2002 as the political uncertainties in Brazil andTurkey played out, as well as tarnished investorsentiment in the high-yield corporate sector in de-veloped countries. Instead of a barrage of issues,which could have occurred given the strong in-vestor interest, heightened liquidity, and decliningrisk aversion, bond flows to developing countries
Figure 2.11 Episodes of compression indeveloping-country spreads, 1993–2003
Decline in first seven months of episode; basis points
�500
�200
�100
�300
�400
0
Source: World Bank staff calculations based on J.P. MorganChase data.
Feb. toSep. 1993
Mar. toOct. 1995
Jan. toAug. 1999
Sep. 2002 toApr. 2003
�202
�333
�472
�125
Figure 2.12 Decline in developing-country spreads by credit-risk category
Basis points
4,000
3,000
2,000
1,000
0
Source: World Bank staff calculations based on J.P. Morgan Chasedata.
Investmentgrade
334185
634
340
1,841
445
3,891
2,540
BB-rated B-rated Below-B
Sep. 2002 Dec. 2003
gdf_036-075.qxd 4/6/04 1:06 PM Page 48

P R I V A T E D E B T F I N A N C E F O R D E V E L O P I N G C O U N T R I E S
increased gradually over 2003 (figure 2.13). Evenmore significant, borrowers lower down on thecredit spectrum, those particularly vulnerable toshifts in investor sentiment, tapped bond financingunder well-established market trends that gener-ally favored borrowers.
Overall for 2003, bond financing for both sov-ereign and corporate-sector borrowers rose over2002. Sovereign borrowers led the recovery inbond flows, accounting for almost two-thirds ofthe $44 billion bond issues by developing countriesin the first half of 2003. But even sovereign borrow-ers showed a certain degree of prudence in acquir-ing new debt. Almost 60 percent of the sovereignborrowing was done by investment-grade-ratedborrowers, those having the greatest capacity toadapt to changes in external financing conditions.Bond issuance by Mexico accounted for almost half
49
The now-thriving developing-country bond marketswere born from distressed commercial bank debt.
Led by Mexico in 1982, many developing countries hadsuspended payment on unsustainable bank debt by the late 1980s. In 1989, the U.S. Treasury, with the help of the International Monetary Fund and the World Bank, advanced the Brady plan. The idea was to restructure bank debt into liquid, tradable, and safe securities, the repayment of which (principal and sometimes interest) was secured against U.S. Treasury zero-coupon bonds that were to be held in a trust until the restructured bonds matured. In addition, countries were to undertakeeconomic reform to work their way out of economic andfinancial stress. The restructuring resulted in Brady bondsworth $155 billion. Mexico was the first to issue them. By the mid-1990s, 17 countries, mostly in Latin America,had implemented Brady-style debt exchanges. The debt restructuring of each country resulted in a unique array of Brady bonds, with two features in common. Creditorscould exchange their loans for either “par” or “discount”bonds. The par bonds carried below-market interest butpreserved the principal value of the debt. The discountbonds provided a floating interest rate but reduced thevalue of the principal by 30 to 50 percent.
Following the establishment of a liquid Brady bondmarket in 1989, investor confidence in developing countriesgradually started to recover and grow, thus making possible
the modern era of developing countries’ access tointernational bond markets and development of theirdomestic bond markets. Over time, those markets havegrown in depth, breadth, and sophistication under the in-fluence of the domestic economic situation in each country,the composition of their investor base, and internationalfinancial policies and frameworks. Although bond issuanceby developing countries dates back to the early 1800s, itsimportance in the 1980s was minimal, averaging onlyabout $3 billion per year between 1980 and 1989. Afterbond-market access for most Latin American countries wascurtailed for a decade following the bank-debt crisis, themajority of issues came from East Asian countries. Chinaand Malaysia accounted for almost 82 percent of theregional bond volume between 1983 and 1989. Hungary,the Russian Federation, and Turkey accounted for thebulk of the remaining developing-country bond market.As investor confidence was still low, bond issuance wasdominated by sovereign and public-sector borrowers,which accounted for almost 90 percent of bond issuanceduring that period.
The currency composition of bonds issued during1983–89 suggests that Japanese and European investorswere instrumental in supporting bond-market developmentfor developing countries. While the U.S. market did absorba significant portion of developing-country bonds until1984, bond issuance in Japanese and European currencies
Box 2.4 Evolution of markets for developing-countryinternational bonds
Figure 2.13 Bond issuance from developingcountries, 2002–03
$ billions Basis points
30
20
10
0
900
600
300
0Q1
Sources: Dealogic Bondware and World Bank staff calculations.
Q2 Q3 Q42002 2003
Q4Q1 Q2 Q3
Launch spread(right axis)
Bond issuance(left axis)
gdf_036-075.qxd 4/6/04 1:06 PM Page 49

G L O B A L D E V E L O P M E N T F I N A N C E 2 0 0 4
50
accounted for almost 60 percent of the total developing-country bond issues during the 1980s. Most of the issuesin the U.S. market were by borrowers that possessed animage of lower credit risk, especially those from Asia. Declining interest rates in the United States worked infavor of investors and borrowers, who capitalized heavilyon floating-rate notes in expectation of further declines in interest rates. The U.S. role waned after 1989, asinvestors were saturated with exposure through Bradybonds and continued to smart from losses suffered onbank loans.
As more investors joined the ranks of the banks thatwere major holders of developing-country bonds in theearly 1990s, developing-countries’ international bond issues gathered pace. Issuance increased from $4 billion in 1990 to a peak of $99 billion in 1997, with the numberof countries issuing bonds increasing four times over thesame period. The share of bond financing in developingcountries’ total net private debt flows increased from6 percent in 1990 to 46 percent in 1997. Many countries in Latin America re-established their access to bond
markets, with the region as a whole accounting for almost 60 percent of developing-country bond issuanceduring 1990–97. With the growth in international bondmarkets, the size of the Brady bond market has been declining since the mid-1990s. Countries have been retiring their Brady bonds for the purposes of cost-effectiveness and liability management through swaps or buyback operations. Almost two-thirds of the originalstock of Brady bonds—including all of Mexico’s—hadbeen retired by the end of 2003 (see figure).
Between 1998 and 2002, developing-country grossbond issuance declined to an annual average of $60 billion(compared with a peak of $99 billion in 1997). A series ofcrises beginning with Thailand in 1997, followed by theRussian Federation (1998), Brazil (1999), Turkey (2000),and Argentina (2001), took a heavy toll. Periods of creditsqueeze alternated with periods of abundance, often in reaction to short-term developments. The relative inexperi-ence of investors with developing-country bonds, and theinherent riskiness of such investments, worsened shocksthrough contagion.
Box 2.4 (continued)
Stock of Brady bonds issued and outstanding
$ billions
0
10
20
30
40
50
Latin America
Brazil
Mex
ico
Argen
tina
R. B. d
e Ven
ezue
la
Ecuad
orPer
u
Panam
a
Urugu
ay
Domini
can
Repub
lic
Costa
Rica
Europe
2
4
6
Poland
0
Bulgar
ia
Croat
ia
Mac
edon
ia
Sloven
ia
Other
0
2
4
Nigeria
Philipp
ines
Ivory
Coa
st
Jord
an
Vietna
m
$ billions $ billions
Amount of original issueAmount outstanding, end 2003
Sources: Bloomberg and various central banks.
of the total investment-grade issuance by sovereignsin the first half, with most of the remainder beingfrom Chile, Hungary, Poland, and South Africa. Anoticeable exception to the overall investment-grade setting was the return of Brazil, rated B2(five levels below the investment-grade threshold),to bond markets after being shut out since earlyin 2002. Reportedly, institutional investorsshowed keen interest in Brazil’s bond issues.Strong participation by institutional investors in
other countries’ bonds was also reported. Suchinvestors typically have long-term investmenthorizons, which contribute to a relatively stablefinancing environment.
As signals of investor confidence becamestronger, despite the economic uncertainties indeveloped countries, sovereign borrowers ratedbelow investment grade came to account for amuch larger share of total sovereign bond flows.The share of such borrowers jumped to nearly
gdf_036-075.qxd 4/6/04 1:06 PM Page 50

P R I V A T E D E B T F I N A N C E F O R D E V E L O P I N G C O U N T R I E S
Bond financing for private sector borrowersgrew gradually as a share of total developing-country bond issuance in 2003 (figure 2.15).Borrowers from Europe and Central Asia, LatinAmerica, and South Africa accounted for almostall of the doubling in private sector bond financingin 2003 over 2002. Benign financing conditionsfacilitated access for corporate borrowers fromseveral small and infrequent market partici-pants, such as Bulgaria, Colombia, Estonia, andKazakhstan. In addition, access conditions for theprivate sectors of Brazil, the Philippines, and theRussian Federation (countries recovering fromfinancial crises) also improved. Corporate borrow-ing from Russia reached an all-time high, whilethat from the Philippines was close to its peaklevels of the mid-1990s.
Despite the easing of the corporate sector’saccess to bond financing in 2003, markets main-tained a distinct tiering for credit risk, which wasreflected in the pricing of new bonds. The differ-ence in the average risk premium (the spreadcharged over the risk-free rate in primary marketswhen new issues are priced) between sovereignand public-sector bonds compared with private-sector bonds remained among the highest since1995. While the average primary-market spreadfor sovereign borrowers (365 basis points) reachedits lowest level since 1998, the average spread forprivate sector borrowers (near 500 basis points)was close to the 1990s peak (figure 2.16).
51
Figure 2.16 Average spreads on new bond issuance,1991–2003
Basis points over U.S. Treasury rate
Source: World Bank staff calculations based on DealogicBondware data.
150
250
350
450
550
650
1991 1993 1995 1997 1999 2001 2003
Private sector
Sovereign & public sector
Figure 2.15 Breakdown of bond issues by type ofborrower, 2003
$ billions
Sources: Dealogic Bondware and World Bank staff calculations.
0
5
10
15
20
25
Other public sector SovereignPrivate sector
Q4Q3Q2Q1
Figure 2.14 Sovereign bond issuance, 1997–2003
$ billions
0
2
4
6
8
1997 1998 1999 2000 2001 2002 2003
Sources: Dealogic Bondware and World Bank staff calculations.
Brazil
TurkeyPhilippines
R. B. de Venezuela
70 percent in the second half of 2003. There wasa particularly large jump in issuance from Brazil,the Philippines, and the República Bolivariana deVenezuela, which accounted for more than half ofall sovereign issuance from non-investment-grade-rated countries in the second half of 2003. Turkey,which had been an active borrower in the firsthalf of 2003, remained active in the second half.Sovereign bond financing from these countries,all of which underwent financial and economicpressures not very long ago, was back up to levelsclose to the peaks of the 1990s (figure 2.14).Pakistan regained access to international capitalmarkets with a $500 million bond issue inFebruary 2004, less than five years after beingforced to restructure previous bonds.
gdf_036-075.qxd 4/6/04 1:06 PM Page 51

G L O B A L D E V E L O P M E N T F I N A N C E 2 0 0 4
Bank lending picked up
Announced new international bank loans in-creased slightly in 2003, compared with sub-
dued levels in the previous two years. In 2003,new loans reached $95 billion, compared with$79 billion in 2002. The pickup in deals occurredmainly in Central Asia and Eastern Europe, withgross new lending at $29 billion in 2003, comparedwith $17 billion in 2002.
New loans to East Asia picked up only slightlyto $24 billion from $21 billion in 2002. Even then,the 2003 figures were boosted by a $2.6 billionpackage to restructure the debt of a power projectin Indonesia. New bank lending to Latin Americaedged up to about $22 billion.
Syndicated bank lending to the Middle Eastand North Africa was modest at just $7 billion in2003, compared with an unusually strong $12 bil-lion in 2002, when large loans for Saudi Arabiaand Iran boosted the total. New loans to bor-rowers in Sub-Saharan Africa increased slightlyto $8 billion in 2003, up from $6 billion in 2002.This was concentrated on borrowers from Angola,Ghana, Nigeria, and South Africa.
In Latin America, the public sector increased itsshare of new loans to 39 percent of the regional totalin 2003 from 26 percent in 2002 and just 16 percentin 2001. The $9 billion raised by the Latin Americanpublic sector in 2003 included a $2 billion loan con-tracted by the Mexican government to help financethe retirement of its Brady bonds.
Net bank lending turns positiveNew syndicated loans account for only a proportionof total bank lending, however, and not all of thecommitments are typically disbursed immediately.Using a more comprehensive measure, includingshort-term flows, net bank lending turned positivein 2003 (table 2.5). Despite the increase in commit-ments, net medium-term bank lending continuedto contract. The turnaround followed a contractionin bank claims in 2002 associated with the crisesin Argentina and Brazil, and concentrated on thesecountries.
There was no significant rebound in bank lend-ing to Brazil in 2003, despite the marked recoveryin creditor sentiment. This reflected weak demand,partly due to the availability of alternative sourcesof financing. Lending to Argentina, too, was stag-nant in 2003, although the pullback in lendingassociated with the country’s financial crisis seems
to have been completed in 2002. Internationallending to Mexico contracted in 2003, in partreflecting weaker demand for external finance dueto the development of local capital markets as analternative source of finance.
Net repayments to banks in the East Asia andPacific region moderated in 2003, after substantialnet repayments in 2002. While borrowers fromIndonesia and the Philippines continued to reducetheir liabilities to banks, outflows from Thailandmoderated. Lending to borrowers in South Asia,which previously had been contracting, started toincrease again in 2003, possibly in response to aperception of improved credit quality, as reflectedin the upgrade of India’s credit rating early in2003.
Bank lending to Eastern Europe and CentralAsia increased further in 2003, with lending to theRussian Federation particularly strong. This likelyreflected the generally high, and improving, creditquality in the region, as several countries nearedaccession to the European Union. Moreover, manyEuropean banks boosted lending in support ofmultinational companies active in Eastern Europeand in support of their local operations. The in-crease in short-term flows was particularly strong.Borrowers in Sub-Saharan Africa continued tomake moderate net repayments to commercialbanks in 2003, as has been the pattern in recentyears.
Overall, banks have recently reduced corpo-rate lending in both developed and developingcountries, across all regions. The shift was mostpronounced in Latin America. By the third quarterof 2003, bank claims on the nonbank private sec-tor in Latin America accounted for 61 percent ofclaims on Latin America, down from 69 percent in
52
Table 2.5 Net bank flows to developing countries,2001–03$ billions
2001 2002 2003
All developing countries �40.4 �10.0 17.5East Asia and Pacific �11.9 �4.4 3.6Europe and Central Asia �1.7 18.5 22.1Latin America and the Caribbean �17.7 �21.1 �4.0Middle East and North Africa �2.4 �1.3 �4.9South Asia �2.8 3.2 2.5Sub-Saharan Africa �3.9 �5.0 �1.8
Note: Includes short-term and other non-bond private flows.Source: World Bank Debtor Reporting System.
gdf_036-075.qxd 4/6/04 1:06 PM Page 52

P R I V A T E D E B T F I N A N C E F O R D E V E L O P I N G C O U N T R I E S
the third quarter of 2002. Over the same period,bank claims on public sector entities increasedslightly in the major emerging-market economies.
Decline in bank margins relatively modestUnlike the sharp decline in bond-market premi-ums, the average pricing margin charged onnew syndicated loans in 2003 was virtually un-changed from the previous year at 165 basis points(table 2.6). Margins for bank lending are relativelyless affected by short-term developments in thecapital markets because such lending is morerelationship-based. Average margins edged up,however, for medium-term loans in most regions.Margins remain very tight for the majority of bor-rowers in Eastern Europe and East Asia, but someborrowers face significantly wider margins. Typi-cal margins for trade-related lending to privateborrowers in the Russian Federation were about300 basis points. The average maturity of newsyndicated loans recovered to 49 months in 2003,from 45 months in 2002, but it remained slightlybelow the level of earlier years. Some 17.9 percentof new syndicated loans had a maturity of one yearor less, compared with 15 percent in 2002.
The changing strategies of international banks The moderate recovery in bank lending in 2003comes against a background of a general retrench-ment of banks from cross-border bank lendingsince 1997. Several factors account for that re-trenchment, and their continuing influence is likelyto keep international bank lending moderate overthe medium term.
International bank lending has been dispropor-tionately affected by the reduction in demand forexternal borrowing, since many of the emerging-market borrowers, particularly in Asia, that havesought to reduce their leverage previously borrowedpredominantly from international banks. Theability of domestic financial institutions in somecountries to access international capital markets ac-counts for some of the reduction in the demand forbank lending. Top-tier Brazilian banks, for example,have used structured bond issues, secured byremittance transfers, to raise funds on internationalmarkets and have on-lent the proceeds.
The experience of successive financial crisesafter the mid-1990s sensitized commercial banksto the risks of lending to developing countries andprompted managements to review their risk strate-gies. As a result, the risk-management techniquesand procedures used by internationally active bankshave been greatly strengthened in recent years, withthe widespread adoption of value-at-risk modelsand a greater emphasis on stress-testing. Enhancedscrutiny of risky lending, including to developingcountries, typically remains in place.
Banks have reduced the risk profile of theirlending by reducing their lending to emergingmarkets in general—and to riskier countrieswithin these emerging markets in particular.According to figures from the Bank for Interna-tional Settlements (BIS), the share of reportingbanks’ international claims on developing coun-tries as a proportion of their total internationalclaims fell from 12.9 percent in mid-1999 to just8.6 percent in September 2003. Within each ofthe major regions there has been a shift in theproportion of lending toward relatively highlyrated countries, and away from countries with rel-atively low credit ratings. According to BIS calcu-lations, the average credit rating of the emerging-market lending portfolio of reporting banksimproved from about B in mid-1999 to over B�
in March 2003, holding the credit rating ofindividual countries constant at 1999 ratings(McGuire 2003).
There has also been a more general strategicchange in the operations of many internationallyactive banks. That change has typically involveda move toward business lines that generate feeincome—such as market-making, bond- and equity-underwriting, and asset management—and awayfrom traditional interest-earning activities. In 2002,
53
Table 2.6 Average spreads on medium- and long-term announced loans, 1999–2003Basis points
East Mid. East Asia & Europe & Latin Am. & North Sub.-S.
Year All Pacific C. Asia & Carib. Africa Africa
1999 186 165 196 343 96 1812000 156 134 182 246 104 2102001 170 179 250 222 80 1962002 166 113 264 247 104 1632003 165 146 286 237 69 175
Note: Spreads are taken from Dealogic Loanware and cover onlyloans for which the spread is quoted relative to Libor. They do notmake allowance for other arrangements, such as commitment orunderwriting fees. Average spreads reflect the specific compositionof loans in a given region and year; changes may reflect changes inthat composition.Source: World Bank staff calculations based on Dealogic Loanwaredata.
gdf_036-075.qxd 4/6/04 1:06 PM Page 53

G L O B A L D E V E L O P M E N T F I N A N C E 2 0 0 4
for example, only about 30 percent of DeutscheBank’s revenue derived from interest-earning activi-ties, although a figure of 50–60 percent was moretypical for international banks. Some banks areseeking to combine the provision of traditionalbanking services with other financial services, in-cluding insurance, hoping to benefit from thecross-selling of services. In mid-2003, holdingsof securities accounted for 25 percent of BIS-reporting banks’ cross-border claims, comparedwith 11.5 percent in 1995. Similarly, 18.9 percent ofbank claims on developing countries consistedof securities’ holdings in 2003, compared with7.4 percent in 1995 (figure 2.17).
The wide range of strategies followed by in-ternationally minded banks have had an impacton their lending to developing countries. Nearlyall large banks seek to provide their domestic cus-tomers with international services, and many aimto provide corporate and investment banking ser-vices globally to these clients. Some of the largestbanks are seeking to establish a global presence,including local retail banking in many countries.Others have sought to supplement their domesticactivities with a local presence concentrated inspecific regional markets. British-based StandardChartered is one bank that is targeting its futuregrowth on building on an established presence inemerging markets, rather than on competing in thedeveloped-country markets.
Nevertheless, some banks that formerly werevery internationally active have decided to review
the countries and business lines in which they areactive and to be much more selective about theirinvestment choices and deployment of resources.In markets where a wider distribution network isan immediate priority, such institutions are nowemphasizing joint ventures with local partners,rather than acquisitions. Some banks, particularly inGermany, have been trying to reduce the size of theirbalance sheets by reducing risk-weighted assets.
Banks have also taken advantage of advancesin capital markets and improved technology tofree up their balance sheets by converting pools ofloans they have originated into securities that canbe traded in capital markets. According to thispractice, a portfolio of assets is transferred fromthe balance sheet of the originating bank to a spe-cial purpose vehicle, which refinances itself byissuing securities on the reference portfolio tocapital markets at a margin. Cross-border lendingto developing countries may have become rela-tively less attractive for international banks to theextent that it is less amenable to securitization thanother forms of lending, for example, because it isless homogenous than credit card or mortgagelending.
Changing regional patterns of internationalbank financeThere have been important regional influences onthe pattern of bank lending. In particular, cross-border bank lending has been the predominantform of international external finance for EastAsia, and regional demand for such financing hasfallen significantly since the East Asian crisis.
North American and, most strikingly, Japanesebanks have sharply reduced their cross-borderlending to developing countries since the Asian cri-sis of 1997 (table 2.7). By September 2003, lendingby Japanese banks to developing countries was justone-third of its level in June 1997. This change, ofcourse, reflects the weakened state of the Japanesebanking system, as well as reduced demand fromJapanese companies operating in other countries(figure 2.18). Over the same period, cross-borderlending by North American banks to developingcountries fell by 24 percent (figure 2.19). Europeanbanks, which accounted for a little over one-half ofbank lending to developing countries in 1997, in-creased their exposure, particularly between 1997and 2000. They now account for nearly two-thirdsof such lending.
54
16,000
14,000
12,000
10,000
2,000
0Q4
1995Q4
1997Q4
1999Q4
2001
Figure 2.17 Cross-border claims of BIS-reportingbanks, 1995–2003
$ billions
8,000
6,000
4,000
Q42003
Source: Bank for International Settlements.
Total cross-border claims
Total loans
Loans to developing countries
gdf_036-075.qxd 4/6/04 1:06 PM Page 54

P R I V A T E D E B T F I N A N C E F O R D E V E L O P I N G C O U N T R I E S
that Japanese banks are again willing to participatein international syndicated loans in the region.
International claims on Latin American coun-tries expanded between 1997 and 2000, but sincehave fallen back, at least partly in response to thecrises in Argentina and Brazil. It is noteworthy thatmuch of the expansion and subsequent contractionin lending to Latin America was on the part ofEuropean banks, with Spanish banks particularlyprominent. American and Japanese banks have re-duced their exposure to Latin America since 1997.
Another striking development is the extent towhich international bank lending to “emerging
55
Q41983
Q41987
Q41991
Q41995
Q41999
Q42003
Figure 2.18 Foreign lending of Japanese banks todeveloping countries, 1983–2003
$ billions
0
20
40
60
140
180
80
100
120
160
Local claims
Total claims
International claims
Source: Bank for International Settlements.
Figure 2.19 Foreign lending of U.S. banks todeveloping countries, 1983–2003
$ billions
0
200
300
50
100
150
250
Local claims
Total claims
Internationalclaims
Source: Bank for International Settlements.
1983 1987 1991 1995 1999 2003
Table 2.7 International claims of BIS-reportingbanks$ billions
U.S. and Total Canada Japan Europe Residual
All developing countriesJun. 1997 711.1 115.4 120.6 368.3 106.8Dec. 2000 749.4 99.7 60.2 479.7 109.8Sep. 2003 735.1 88.1 44.9 475.0 127.0
East Asia and PacificJun. 1997 232.9 20.7 92.5 94.2 25.6Dec. 2000 171.7 12.2 39.5 78.2 41.8Sep. 2003 151.5 13.7 25.6 82.9 29.3
Europe and Central AsiaJun. 1997 118.6 12.2 3.9 81.7 20.8Dec. 2000 178.9 6.9 4.8 138.0 29.1Sep. 2003 222.0 11.1 4.4 174.2 32.4
Latin America and the CaribbeanJun. 1997 251.1 70.1 14.5 127.1 39.3Dec. 2000 285.5 67.9 10.4 183.2 23.9Sep. 2003 222.7 54.7 8.8 126.8 32.4
Middle East and North AfricaJun. 1997 47.9 3.4 2.8 31.1 10.6Dec. 2000 51.9 4.5 1.5 36.8 9.0Sep. 2003 56.2 1.8 1.2 38.2 14.9
South AsiaJun. 1997 26.1 3.1 4.6 12.3 6.1Dec. 2000 28.0 3.0 2.6 17.2 5.2Sep. 2003 30.4 3.2 1.1 16.7 9.4
Sub-Saharan AfricaJun. 1997 34.6 6.0 2.2 21.8 4.6Dec. 2000 33.5 5.1 1.3 26.1 1.0Sep. 2003 52.2 3.7 3.7 36.2 8.7
Note: Figures derived from BIS consolidated banking statistics. International claims include both cross-border claims and localclaims denominated in foreign currencies. Changes in coverage andthe reporting practices of reporting countries have occurred over theperiod. Figures have been adjusted to the World Bank’s current coverage of developing countries. The comparison of stocks in different periods is affected by changes in the valuation of lendingdenominated in currencies other than the U.S. dollar.Sources: Bank for International Settlements and World Bank staffcalculations.
Important structural changes also have oc-curred in the regional pattern of borrowing. Thesehave both affected and been affected by the will-ingness of banks in different regions to lend todeveloping countries. International claims on EastAsia and the Pacific, for example, declined from$233 billion in 1997 to $152 billion in 2003 asAsian borrowers sought to “deleverage” and re-duce their exposure to international lending.Japanese bank lending in Asia fell by 72 percentbetween June 1997 and September 2003; it nowaccounts for just 17 percent of internationalclaims on the region, compared with 40 percentin 1997.
More recently there have been signs of an incip-ient revival in bank lending to Asia, including signs
gdf_036-075.qxd 4/6/04 1:06 PM Page 55
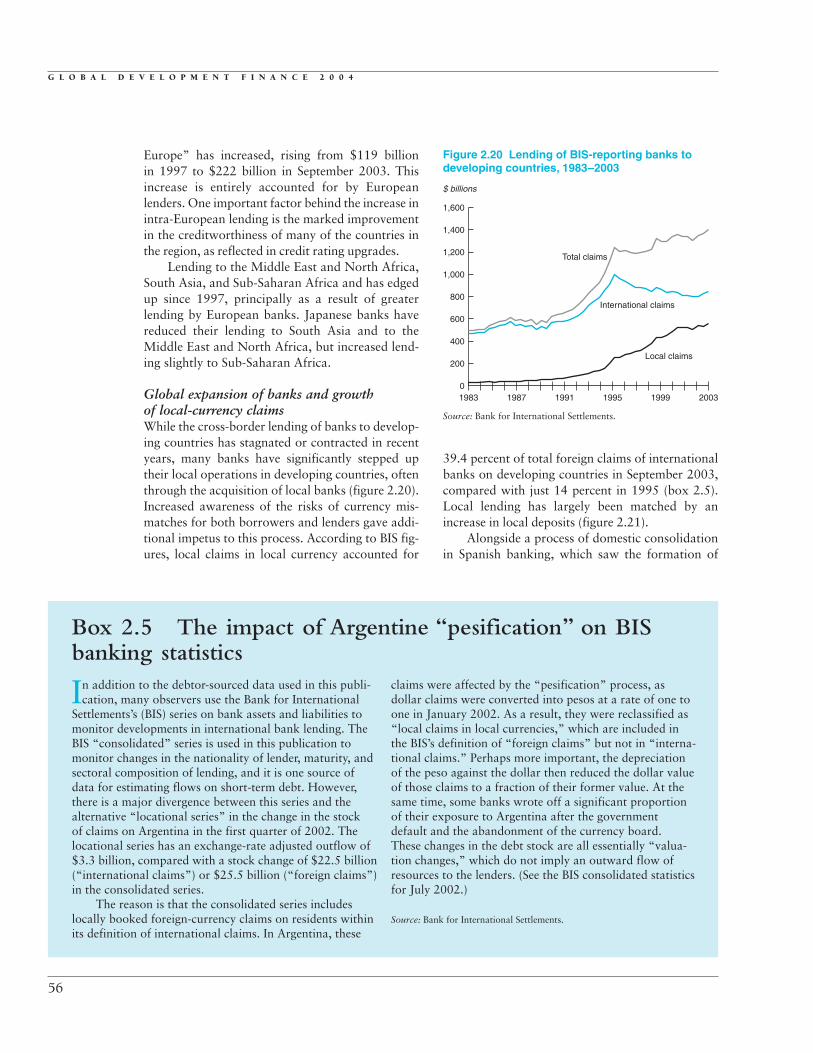
G L O B A L D E V E L O P M E N T F I N A N C E 2 0 0 4
Europe” has increased, rising from $119 billionin 1997 to $222 billion in September 2003. Thisincrease is entirely accounted for by Europeanlenders. One important factor behind the increase inintra-European lending is the marked improvementin the creditworthiness of many of the countries inthe region, as reflected in credit rating upgrades.
Lending to the Middle East and North Africa,South Asia, and Sub-Saharan Africa and has edgedup since 1997, principally as a result of greaterlending by European banks. Japanese banks havereduced their lending to South Asia and to theMiddle East and North Africa, but increased lend-ing slightly to Sub-Saharan Africa.
Global expansion of banks and growth of local-currency claimsWhile the cross-border lending of banks to develop-ing countries has stagnated or contracted in recentyears, many banks have significantly stepped uptheir local operations in developing countries, oftenthrough the acquisition of local banks (figure 2.20).Increased awareness of the risks of currency mis-matches for both borrowers and lenders gave addi-tional impetus to this process. According to BIS fig-ures, local claims in local currency accounted for
39.4 percent of total foreign claims of internationalbanks on developing countries in September 2003,compared with just 14 percent in 1995 (box 2.5).Local lending has largely been matched by anincrease in local deposits (figure 2.21).
Alongside a process of domestic consolidationin Spanish banking, which saw the formation of
56
Figure 2.20 Lending of BIS-reporting banks todeveloping countries, 1983–2003
$ billions
0
1,200
1,600
200
400
600
800
1,000
1,400
Local claims
Total claims
International claims
Source: Bank for International Settlements.
1983 1987 1991 1995 1999 2003
In addition to the debtor-sourced data used in this publi-cation, many observers use the Bank for International
Settlements’s (BIS) series on bank assets and liabilities tomonitor developments in international bank lending. TheBIS “consolidated” series is used in this publication tomonitor changes in the nationality of lender, maturity, andsectoral composition of lending, and it is one source ofdata for estimating flows on short-term debt. However,there is a major divergence between this series and the alternative “locational series” in the change in the stock of claims on Argentina in the first quarter of 2002. The locational series has an exchange-rate adjusted outflow of$3.3 billion, compared with a stock change of $22.5 billion(“international claims”) or $25.5 billion (“foreign claims”)in the consolidated series.
The reason is that the consolidated series includeslocally booked foreign-currency claims on residents withinits definition of international claims. In Argentina, these
claims were affected by the “pesification” process, as dollar claims were converted into pesos at a rate of one toone in January 2002. As a result, they were reclassified as“local claims in local currencies,” which are included inthe BIS’s definition of “foreign claims” but not in “interna-tional claims.” Perhaps more important, the depreciationof the peso against the dollar then reduced the dollar valueof those claims to a fraction of their former value. At thesame time, some banks wrote off a significant proportionof their exposure to Argentina after the government default and the abandonment of the currency board. These changes in the debt stock are all essentially “valua-tion changes,” which do not imply an outward flow of resources to the lenders. (See the BIS consolidated statisticsfor July 2002.)
Source: Bank for International Settlements.
Box 2.5 The impact of Argentine “pesification” on BISbanking statistics
gdf_036-075.qxd 4/6/04 1:06 PM Page 56

P R I V A T E D E B T F I N A N C E F O R D E V E L O P I N G C O U N T R I E S
two dominant banking groups—Banco SantanderCentral Hispano and Banco Bilbao VizcayaArgentaria (BBVA)—the country’s banks havefollowed a distinctive strategy of looking to LatinAmerica to expand outside their domestic market,primarily through a series of acquisitions. As a re-sult, the local-currency claims of local affiliates ofSpanish-headquartered banks increased from just$1.7 billion in 1994 to a peak of $130 billion inthe first quarter of 2002 (figure 2.22). However,
events in Argentina have caused at least somebanks to reexamine their strategy. In January2003, BBVA sold its Brazilian bank to Bradesco,although it maintains a presence in eight otherLatin American countries and recently took fullcontrol of BBVA Bancomer (box 2.6). Partly inconsequence, local-currency claims have fallenfrom their peak.
Deregulation and the challenges created bybanking crises have played an important role in
57
Figure 2.21 Local-currency claims and liabilities indeveloping countries, 1983–2003
$ billions
0
400
600
100
200
300
500
Note: Local-currency claims and liabilities of local affiliates ofBIS-reporting banks.Source: Bank for International Settlements.
Claims
Liabilities
1983 1987 1991 1995 1999 2003
Seeking to capitalize on their risk management andtechnological expertise, international banks have
significantly expanded their local operations in developingcountries, often at the expense of traditional cross-borderlending. However, the heavy losses of foreign banks inArgentina, where dollar assets and liabilities were con-verted into pesos at unfavorably asymmetric rates, andwhere banks were pressured to hold government bonds,have brought this strategy into question.
To date, however, the effect appears muted. Local-currency claims of local operations of foreign banks con-tinued to expand to $560 billion in June 2003, from $524 billion at the end of 2001 and just $226 billion at the end of 1997.
There have been no large-scale disinvestments fromLatin America, although a few banks have sold or scaledback their Latin American operations. Local-currencyclaims on Latin America have fallen back to $250 billionfrom their peak of $286 billion at the end of 2001. Local-currency claims of BIS-reporting banks on Brazil fell from$66.1 billion in the third quarter of 2001 to $51.4 billionin mid-2003. Even after adjusting for the effect of changesin the exchange rate, this amounts to a 16 percent contrac-tion in local-currency claims in Brazil, partly reflecting thedisinvestment of BBVA. In Argentina itself, local-currencyclaims fell to $13.4 billion in June 2003, from $20.1 bil-lion in September 2001.
Box 2.6 Will experience in Argentina reverse the shifttoward local operations?
1985 1988 1991 1994 1997 2000
Figure 2.22 Spanish banks' foreign and localcurrency lending to developing countries,1985–2003
$ billions
0
120
200
40
80
160
2003
Source: Bank for International Settlements.
Total claims
Local claims
International claims
gdf_036-075.qxd 4/6/04 1:06 PM Page 57

G L O B A L D E V E L O P M E N T F I N A N C E 2 0 0 4
the entry of international banks into the localmarkets of developing countries. The difficulties ofthe Mexican financial system in the aftermath ofthe 1994–95 tequila crisis brought a significantincrease in foreign ownership in the Mexicanbanking system, assisted by a relaxation of restric-tions on foreign involvement. Mexico’s largestbanks were among those acquired, with mergersbetween Bancomer and BBVA and between Serfinand Santander. The process culminated in theCitigroup-Banamex merger of 2001. Canadianbanks, encouraged by the North American FreeTrade Agreement, also made acquisitions ofMexican financial institutions.
In the mid-1990s, the Brazilian authoritiesused their powers to license foreign operations tohelp resolve the difficulties that some Brazilianbanks encountered as very high rates of inflation—from which they had profited—were broughtunder control. Foreign banks were also importantplayers in the privatization of banks owned by thestates, notably through Banco Santander’s acquisi-tion of Banespa, the state bank of Sao Paulo.
Second-tier banks from some European coun-tries, including Austria, Belgium, Germany, andItaly, have sought to expand in Central and EasternEurope ahead of the enlargement of the EuropeanUnion in 2004. This process has been aided by theprivatization of state-owned banks in several coun-tries. Some 93.9 percent of local currency claims oflocal affiliates of BIS-reporting banks in EasternEurope are now attributable to banks headquar-tered in Europe. Examples include the GermanHVB and its affiliate, Bank Austria; KBC fromBelgium; and San Paolo-IMI from Italy. A leadingPolish bank, Bank Handlowy w Warszawie, withassets of $7.25 billion, was acquired by Citibank in2001, but otherwise the direct involvement of U.S.banks in Eastern Europe is relatively limited.
Bank lending to Africa has not been exemptfrom the general trend toward greater direct localinvolvement, with local currency claims reaching$22 billion in 2003, compared with just $5 bil-lion in 1992 (figure 2.23). Most of that amount isaccounted for by banks based in Britain (StandardChartered), France (BNP Paribas), and the UnitedStates (Citibank).
Japanese banks have not built up a significantlocal presence in developing countries. Local-currency local claims of Japanese banks amountedto just $10 billion in 2003, almost entirely in Asia.
Progress in reforming theinternational financial architecture
The official community, developing countries,and market participants are continuing their
efforts to reduce the severity and frequency of fi-nancial crises, particularly those likely to be ac-companied by contagion. In 2003, covenants andguidelines intended to improve the sustainabilityand management of developing-country debt madesignificant progress.
Collective action clauses The most notable of developments was the swifttransition from debate to implementation of col-lective action clauses (CACs) under New York law.The use of CACs in bonds governed by U.K. andJapanese law has been a longstanding practice(box 2.7) . However, bonds issued under New Yorklaw, which account for a large share of developing-country bonds, previously included only majorityenforcement provisions (one of the features ofCACs) and not majority restructuring provisions,which were adopted by developing countries in2003. The inclusion of the latter provisions, whichwere being discussed as an option alongside IMF’ssovereign debt restructuring mechanism, is in-tended to contribute to orderly and rapid work-outs of distressed sovereign debt. These provisionslimit the ability of minority bondholders to disruptor slow down debt restructuring proceedings byenforcing their claims through litigation. They alsobind all investors holding debt covered by CACs
58
Figure 2.23 International bank lending to Africa,1983–2003
$ billions
0
80
120
20
40
60
100Total claims
Source: Bank for International Settlements.
International claims
Local claims
1983 1987 1991 1995 1999 2003
gdf_036-075.qxd 4/6/04 1:06 PM Page 58

P R I V A T E D E B T F I N A N C E F O R D E V E L O P I N G C O U N T R I E S
to the terms of the restructuring agreed by a super-majority of bondholders.
In 2003, several developing-country sovereignborrowers included CACs in their internationallyissued bonds, which were rapidly accepted in in-ternational capital markets. The practice was ledby Mexico, with a bond issue in February 2003.Although the country was not the first sovereignto adopt such a clause, it was the first to employ italong the lines recommended by the G-10 coun-tries. Mexico’s transaction drew much public in-terest, as it came to the markets at a time when theofficial response to improvements in sovereigndebt restructuring procedures was a central topicof discussion in both official and private circles.Following Mexico, Brazil, which had been shutout of international bond markets since early2002, was able to return with a global bond that
included a CAC. Thereafter, the use of CACscaught on swiftly, becoming the norm in sovereignbond issues. Borrowers with varied credit risks,such as Belize, Guatemala, the Democratic People’sRepublic of Korea, and South Africa, all issuedbonds with CACs in 2003.
The covenants used in CACs have differed(table 2.8). Of particular interest has been thepercentage of investors required to amend the termsof a bond issue—that is, to carry out collectiveaction. The debate on this topic continues betweenthe official and private sectors. Mexico’s 12-year,$1 billion global bond issue employed as a thresh-old a 75 percent super-majority of investors. Thecovenants used by Brazil in its $1 billion, 10-yearglobal bond were more stringent (perhaps becauseBrazil’s debt, unlike Mexico’s, is not rated as in-vestment grade). The terms of Brazil’s bond were
59
Collective action clauses (CACs) enable a qualified ma-jority of bondholders to make decisions that become
binding on all holders of a particular bond issue, therebyencouraging a more orderly and prompt restructuring ofdistressed bond debt. CACs could also help governmentsavoid the large macroeconomic costs they might incur ifthey were unable to restructure unsustainable debts in anorderly and predictable way. There are two importantfeatures of CACs:
The majority restructuring provision. This provisionenables a qualified super-majority of bondholders to bindall bondholders within the same issue to the financialterms of a restructuring agreement, either before or aftera default. Thresholds that have been used for amendingpayment terms have ranged from 66-2/3 percent to 85 per-cent of either the outstanding principal or of the claims of bondholders present at a duly convened meeting.Majority restructuring provisions have long been found in bonds governed by English, Japanese, and Luxembourglaw, whereas bonds governed by New York law did notinclude them until very recently.
The majority enforcement provision. This provision isdesigned to limit the ability of a minority of bondholdersto disrupt the restructuring process by enforcing theirclaims after a default but before a restructuring agreement.Two such provisions can be found in bonds governed byU.K. and New York law: (a) an affirmative vote of a mini-mum percentage of bondholders (typically representing25 percent of the outstanding principal) is required to
accelerate claims after a default; and (b) a simple or quali-fied majority can reverse such an acceleration after the de-fault on the originally scheduled payments has been cured.An even more effective type of majority enforcement provi-sion can be found in trust deeds governed by English law,according to which the right to initiate legal proceedingson behalf of all bondholders is conferred upon the trusteesubject to certain limitations. However, it is up to issuersand investors to decide whether the use of trust deeds iscost-effective.
In addition, the G-10 Working Group (set up at therecommendation of the G-10 ministers and governors in2002) made specific recommendations that would help in designing CACs. These were (a) a disenfranchisement provision, which would exclude, for quorum and votingpurposes, bonds owned or controlled, directly or indi-rectly, by the issuer or its public sector instrumentalities;(b) an engagement provision, which would promote dialogue between the sovereign and the bondholders; and(c) transparency provisions, which would require the sov-ereign to provide certain information to bondholders overthe life of the bond, and additional information followingan event of default. These recommendations could be in-corporated immediately into sovereign bonds governed byEnglish, French, and New York law and in bonds governedby Japanese law with some modifications.
Source: IMF and World Bank, Guidelines for Public Debt Management.
Box 2.7 Collective action clauses
gdf_036-075.qxd 4/6/04 1:06 PM Page 59

G L O B A L D E V E L O P M E N T F I N A N C E 2 0 0 4
closer to those preferred by creditors representedby the Emerging Market Creditors Association, in-cluding an 85 percent super-majority. Other sover-eigns, such as Belize and Venezuela, also used the85 percent threshold.
Direct comparison of the price impact of in-cluding CACs in bonds is limited by the availabil-ity of adequate pricing benchmarks particular toeach sovereign, as well as differences in bond-market conditions over time. However, marketparticipants have indicated that the inclusion ofsuch clauses has had almost no effect on the pricingof bonds. Instead, almost all bond issues reportedlyreceived strong investor interest.
The use of CACs provides a useful tool in theevent a sovereign is forced to restructure its debt.However, progress still must be made on issues notcovered by CACs, especially in relation to the ag-gregation of debt. Generally, the use of CACs in aparticular bond binds creditors to procedures andcovenants related to that issue alone. They do notprovide for aggregation of claims by creditors ofother bonds and cannot facilitate collective actionby a super-majority of investors across differentbond issues or types of creditors. Thus, it will takeconsiderable time to bring all outstanding bonddebt under the realm of CACs. One provision maypartially address the issue of aggregation: if two ormore bonds are restructured, a majority of allbondholders may opt in favor of aggregated vot-ing. Undue influence by governments on debtrestructuring may be prevented by the disenfran-chisement provisions of CACs, which would pre-vent bonds owned or controlled by governmententities to be counted or voted.
Additionally, efforts must continue to bringCACs up to par with the provisions envisaged orig-inally by the G-10 countries and financial industry
associations. The majority amendment provision,which allows restructuring with a super-majorityof creditors, and the collective enforcement provi-sion, which allows restructuring to be acceleratedfollowing a default by a minimum percentage ofbondholders, are already operational. However,the engagement provision, which spells out proce-dures for communication between debtor andcreditors, and the information provision, whichspecifies the information that borrowers mustprovide throughout the life of the bond and in theevent of a default, still require further progression.
Code of conductEfforts to strengthen the international financialarchitecture also include discussions among devel-oped and developing countries, internationalfinancial institutions, and various capital marketparticipants aimed at formulating a code of con-duct to be voluntarily followed by private and offi-cial creditors, as well as sovereign borrowers, insituations in which debt sustainability is in ques-tion, thus enhancing the stability of the inter-national financing environment. First proposed atthe G-20 ministerial meeting in October 2002,these efforts were endorsed by the G-7 financeministers and central bank governors in February2003. So far discussions have produced a consen-sus that the code should be voluntary and flexible,and that it should balance the interests of debtorsand creditors. A balance remains to be achievedconcerning other features of the code, including itsscope.
Standards and codes Increased recognition and monitoring of standardsand codes has been an important part of the insti-tutional response to the shortcomings revealed bythe emerging market crises of the late 1990s. In-creased scrutiny by the official sector of adherenceto standards and codes increases awareness ofrisks and is also likely encouraging greater adher-ence to the standards. Private investors and credi-tors also seem to be increasingly aware of theseissues and of how particular countries perform inrelation to these codes, using the information toimprove risk management.
The IMF and the World Bank have recognized12 areas and associated standards as useful for theoperational work of the Fund and the WorldBank, and which they are monitoring compliance
60
Table 2.8 Covenants of bond issues with CACs
Issue Bench-Size Coupon Term CAC Spread mark Rating
Country ($mn) (%) (Yr/m) majority (bp) spread (Moody’s)
Belize 100 9.750 12 85 662 — Ba3Brazil 1,000 10.000 3.08 85 n/a 902 B2Mexico 1,000 6.625 12 75 313 323 Baa2R. B. deVenezuela 700 10.750 10 85 819 1,270 Caa1
South Africa 1,409 5.250 10 — 142 166 Baa2
Note: — � not available.Sources: Dealogic Bondware and Moody’s Investor Service.
gdf_036-075.qxd 4/6/04 1:06 PM Page 60

P R I V A T E D E B T F I N A N C E F O R D E V E L O P I N G C O U N T R I E S
with. These comprise accounting, auditing, anti-money laundering and countering the financing ofterrorism, banking supervision, corporate gover-nance, data dissemination, fiscal transparency,insolvency and creditor rights, insurance supervi-sion, monetary and financial policy transparency,payments systems, and securities regulation. Re-ports summarizing countries’ observance of thesestandards are used to help sharpen IMF andWorld Bank policy discussions with nationalauthorities, and by the private sector (includingby rating agencies) for risk assessment.
Basel IIThe proposed new Basel Capital Accord (Basel II)is likely to exert a strong influence on the behaviorof internationally active banks—and hence ontheir lending to developing countries. The revisionis designed to enhance the safety and soundness ofthe banking industry worldwide by closely align-ing regulatory capital with banks’ credit, market,and operational risks. The new accord replacesand in many ways improves the original Basel ac-cord, which had a crude system of weighting assetsaccording to risk categories. That system has longbeen inconsistent with the increasingly sophisti-cated risk-management practices of major banks.The Basel Committee on Banking Supervision(BCBS) plans to finalize the revised accord by mid-2004 and to implement it by the end of 2006 inBCBS member countries.
Basel II is based on three “pillars”:
• Minimum capital requirements, with a sensi-tive weighting of the riskiness of different assetsin calculating the denominator of this ratio.
• A strengthened role for supervisory review, asa result of which a bank may be required tohold additional capital.
• Greater public disclosure to enable other finan-cial institutions to exercise stronger “marketdiscipline.”
Under the first pillar no changes in the minimumcapital ratio are planned. Banks will be able toadopt one of three options for calculating risk-weighted assets:
• The “standardized” approach, where the riskweights for sovereign, interbank, and corpo-rate exposures are differentiated according
to external credit ratings. For sovereign ex-posures, credit assessments developed byOrganisation for Economic Co-operation andDevelopment (OECD) export credit agenciesmay also be used.
• Two “ in te rna l - ra t ings -based” ( IRB)approaches—under which banks are permit-ted to use their own credit-risk models to de-termine risk weights, subject to demandingvalidation requirements.
The revised accord incorporates some incentives tomove to the IRB approaches so as to encouragethe use of advanced risk-management techniques.It also extends the coverage of minimum capitalrequirements to cover operational risk—the riskof losses from inadequate or failed internal pro-cesses, people, and systems, or from externalevents. And it recognizes a wider range of “creditrisk mitigants” such as collateral, guarantees, andcredit derivatives.
In October 2003, members of the BCBSreached a compromise on issues that had sharplydivided bank regulators in the United States andEurope and threatened to unravel the proposed re-vision of the accord after four years of work. Thestandardized approach will continue to be cali-brated to cover “unexpected losses” and “expectedlosses.” But for those banks implementing the ad-vanced approaches, using their own internal riskmodels, minimum capital requirements will nowcover only unexpected losses. In the latter case, theadequacy of provisions for losses will be taken intoaccount through modifications to the definition ofcapital.
Work has begun in a number of countries ondraft rules to integrate Basel capital standards withnational capital regimes. In early 2003, U.S. regu-lators indicated that they would require only thelargest 10 U.S. banks to comply with the new ac-cord, with perhaps another 10 large regional banksalso likely to choose to do so. However, thesebanks currently together account for some 99 per-cent of the cross-border lending of U.S. banks.
Although the accord is a clear improvementover its predecessor, there are some drawbacks.The new accord is substantially more complex thanits predecessor and will involve significant compli-ance costs for financial institutions. Some also fearthat implementation of the accord may further dis-courage bank lending to developing countries. In
61
gdf_036-075.qxd 4/6/04 1:06 PM Page 61

G L O B A L D E V E L O P M E N T F I N A N C E 2 0 0 4
particular, a number of critics believe that the pro-posed accord pays insufficient attention to the ben-efits of diversification and thus may overstate therisk of lending to developing countries.
The accord may also accelerate the process ofdisintermediation, encouraging an increasing pro-portion of lending to originate from financial insti-tutions not subject to the regulatory requirementsof the accord. Relatively lightly regulated institu-tions, such as insurance companies and pensionfunds, are bearing an increasing proportion of therisk of lending to emerging markets through bondholdings and the sale of credit derivatives.
There is also a risk that implementation of thenew accord will amplify the procyclicality of banklending. That is, lending is likely to be reduced fur-ther at times when activity is turning down, sinceassessments of risk are influenced by the cyclicalposition. In principle, external credit ratings are in-tended to apply “through the cycle,” but in practicethe evidence suggests that initial ratings and ratingchanges are sensitive to the state of the business
cycle (Amato and Furfine 2003).1 This is also likelyto apply to internal models, which typically have arelatively short time horizon.
It is not clear that the accord will fully achieveits central aim of establishing a level playing fieldfor internationally active banks. Differences be-tween the standardized and IRB approaches meanthat banks adopting one approach or the otherwill be advantaged or disadvantaged in certaincircumstances (box 2.8). Inconsistent implementa-tion of Pillar II is another area that may lead banksbased in different countries to face different regu-latory burdens. Under Pillar II, individual countrysupervisors may require a bank to hold additionalcapital, beyond that required by the standardratio, on the basis of supervisory review. The qual-ity and intensity of supervisory review will likelyvary from country to country, and banks will bemore likely to be subject to additional capital re-quirements in some countries than in others.
The original accord became a global standardand had been adopted in more than 100 countries
62
Key differences in the risk weightings of the existing international banking accord and Basel II include:
• For all but the most highly rated OECD debtors, the risk weight of lending to banks and sovereign borrowers will increase.
• For corporate exposures, the risk weighting for highlyrated borrowers will be lower, and that for lower-rated borrowers somewhat higher, than at present.
• Under the standardized approach, lending to OECDbanks below the highest rating category would gener-ally attract a higher risk weighting than at present.
• Lending to highly rated non-OECD banks willtypically attract a lower risk weighting than atpresent. But those in the very lowest rating categorywill have a higher weighting. For short-term lendingto banks, the weighting will not change for lending tohighly rated banks, but it will increase for middle- andlower-rated banks.
• The risk-weighting curve to be used in the basic internal-ratings-based approach implies substantiallyhigher risk weightings for the lowest rating categories
than does the standardized approach. As a result, thedifferences between the two approaches provide a regulatory incentive for sophisticated banks usingtheir own internal models to concentrate on less risky lending and for those banks using the standardizedapproach to lend to riskier borrowers.
• For project finance loans, banks using the advancedinternal-ratings-based approach and having sufficientdata to validate may now simply use weightings thatapply to corporate borrowing.
A simple comparison of the existing risk weights withthose proposed under the accord inevitably overstates thelikely change in bank incentives and behavior, however.Most banks already hold an additional cushion of capitalbeyond the minimum regulatory requirement. As a result,the existing minimum regulatory capital requirements aretypically not “binding.” Moreover, banks’ own internalcapital budgeting procedures may already reflect theirassessment of the risks inherent in lending, rather thansimply the regulatory requirements.
Box 2.8 How Basel II affects developing-country risk weights
gdf_036-075.qxd 4/6/04 1:06 PM Page 62

P R I V A T E D E B T F I N A N C E F O R D E V E L O P I N G C O U N T R I E S
by the mid-1990s. The new framework is intendedto be suitable not only within the G-10 countriesrepresented on the BCBS, but also as an optionthat countries around the world might apply totheir banking systems. Many developing countriesare likely to implement the accord in some form,although not necessarily by the end-2006 date tar-geted for implementation by BCBS members.
Most analyses suggest that implementing theBasel accord in developing-country banking systemswould require substantial increases in regulatorycapital. A particular concern for the implementa-tion of the standardized approach in emerging-market countries is that relatively few companieshave external credit ratings. As a result, the newaccord is likely to result in relatively undifferentiatedrisk weights for developing-country banks. This islikely to result in incentives for foreign banks(which are able to use the more advanced and risk-sensitive systems) to focus on less risky borrowers,while domestic bank lending concentrates on lowborrowers of lower quality, with potential risks forthe health of the domestic banking system.
Equator Principles and the ExtractiveIndustries Transparency InitiativeIn 2003, major international banks,2 collectivelyaccounting for more than 70 percent of the world-wide project loan market, adopted the EquatorPrinciples, a voluntary set of guidelines to be ap-plied to their project finance activities, based on theenvironmental and social guidelines and safeguardpolicies of the International Finance Corporation.
In December 2003 the World Bank Group an-nounced its formal endorsement of the ExtractiveIndustries Transparency Initiative and pledged towork with developing nations and companies onways to publish revenues accruing from oil, gas, andmining sectors.
Prospects for private debt flows
Strong debt flows are likely to continue into2004, driven by buoyant liquidity conditions
and the global economic recovery. There were sub-stantial inflows from retail, high-net-worth, andEuropean institutional investors in late 2003. Thedemand for external finance will likely be influencedpositively by the stronger growth—particularly in
investment—foreseen for the developing countries.Adjustments to earlier changes in the desired stockof borrowing and lending—for example, in Asia—seem to have largely run their course and will nolonger depress demand significantly. Moreover, anumber of countries that have had limited marketaccess so far—in some cases because they are recov-ering from financial crises—are gradually recover-ing market access.
The possibility that the large and rapid declinein spreads on emerging-market debt has run aheadof the underlying improvement in credit quality nev-ertheless raises the prospect of some correction inspreads. Investors are therefore unlikely to be ableto match the very strong returns that they achievedover the past year—and they may even struggle toachieve positive returns on emerging-market debtthis year. The handling of the restructuring ofArgentina’s defaulted debt also could influence theattitude of investors to emerging market debt.
Several developing countries face elections inthe near future. It will be important for govern-ments in developing countries to maintain prudentmacroeconomic policies and persevere withneeded reforms to foster sustainable growth, toconsolidate the improvement in credit quality, andto maintain the confidence of investors and credi-tors, particularly in the face of political pressures.
Higher interest rates in the advanced economiesmay dampen flows as they provide more attractivealternatives for investors and raise borrowing costsfor developing countries. And if the resolution ofimbalances in the advanced economies eventuallyrequires abrupt adjustments in the international fi-nancial markets, lending to developing countriesmay be adversely affected. The concentration oflending among a relatively small number of banksand major institutional investors raises the riskthat strategic changes by a single institution couldhave a noticeable impact on overall flows.
Notes1. This may reflect the influence of market discipline,
with higher capital required for access to critical markets,such as the swaps market.
2. ABN Amro, Barclays, CIBC, Citigroup, Credit Su-isse Group, Credit Lyonnais, Dexia, Dresdner Bank, HSBC,HVB Group, ING, Mediocredito Centrale, Mizuho Corpo-rate Bank, Rabobank, Royal Bank of Canada, Royal Bankof Scotland, WestLB, and Westpac.
63
gdf_036-075.qxd 4/6/04 1:06 PM Page 63

G L O B A L D E V E L O P M E N T F I N A N C E 2 0 0 4
References
Amato, J., and C. Furfine. 2003. “Are Credit RatingsProcyclical?” BIS Working Paper 129. Bank for Inter-national Settlements.
International Monetary Fund. 2003. “Public Debt inEmerging Markets: Is It Too High?” World EconomicOutlook (September).
McGuire, P. 2003. “The International Banking Market.”Quarterly Review: International Banking and Finan-cial Market Developments (September).
Packer, F., and C. Suthiphongchai. 2003. “Sovereign CreditDefault Swaps.” Quarterly Review: InternationalBanking and Financial Market Developments (Decem-ber). http://www.bis.org/publ/quarterly.htm.
64
gdf_036-075.qxd 4/6/04 1:06 PM Page 64

65
THIS ANNEX PROVIDES A TABULATIONof commercial debt restructuring activitiesof developing countries since the 1980s. It
does not include restructuring undertaken volun-tarily for the purpose of liability management bysovereigns, such as exchanging previously existingdebt with issuance of new fixed income securitiesfor cost effectiveness, among other benefits. How-ever, it does include debt buybacks by countries,undertaken to preempt formal restructuring ofdebt or reduce debt hangovers, and which werealso aided by official financing.
In 2003, there was one debt-restructuringoperation undertaken through a debt swap, andtwo countries remained in process to restructuretheir previously defaulted debt. In May, Uruguaycompleted its debt exchange operation, swappingabout $5.4 billion of debt. The eligible debt in-cluded $3.8 billion of external debt, $1.6 billionin domestic debt, and $256 million of Samuraibonds (denominated in yen). This operationaimed at extending maturity without any reduc-tion in principal or interest. All investors wereoffered extensions on maturity, as well as the op-portunity to swap into new benchmark bonds.Following the largest sovereign default in history,Argentina formally proposed its debt-restructur-ing plan in 2003. The government’s proposalenvisages three new bonds, with maturities rang-ing from 8 years to 42 years, and carrying inter-est rates as low as 0.5 percent to 5 percent. In
addition, it is offering to pay no interest arrearsthat have been accumulated since the default.However, as of February 2004, formal negotia-tions with creditors had not commenced. Serbiaand Montenegro was in negotiations to restruc-ture about $2.7 billion of its debt owed to theLondon Club of commercial creditors. The coun-try was at an advanced stage of the restructuringprocedure as of February 2004.
The International Development Association(IDA) created a Debt Reduction Facility in 1989 tohelp low-income countries manage their commer-cial debt burdens. Since its inception, the facilitycompleted 22 operations for 21 countries. In 2003,there was only one IDA-sponsored debt buybackoperation, and four in progress. In August 2003Cameroon completed a debt buyback operationto retire $266 million of principal, equivalent to79 percent of eligible principal debt, and about$530 million in interest arrears. The buybackprice for the operation was set at 14.5 cents perdollar of principal. The operation was fundedby the IDA Debt Reduction Facility and thegovernments of France, Norway, and Cameroon.Tanzania’s second buyback operation, scheduledfor April 2004, would extinguish about $20 mil-lion of principal and $18 million of associated inter-est. In addition, three operations for Mozambique,Madagascar, and Nicaragua are being prepared.These operations would extinguish about $680million in eligible debt (including interest arrears).
Annex: Commercial DebtRestructuring
gdf_036-075.qxd 4/6/04 1:06 PM Page 65

G L O B A L D E V E L O P M E N T F I N A N C E 2 0 0 4
66
AlbaniaBank debt restructuringsJuly 1995 Restructuring of $501 million due to commercial banks. Of the total, $371 million bought back for $96.5 million funded
by grants from International Development Association (IDA) Debt Reduction Facility (DRF) and other donor countries, and $130 million was converted into long-term bonds.
AlgeriaBank debt restructuringsFeb. 1992 1991–93 Financing Facility, designed to refinance liabilities due between October 1991 and March 1993. Tranche A covered debts
with a maturity of two years or more and was repayable in eight years including three years’ grace bearing interest at London interbank offered rate (LIBOR) � 1-1�2 percent. Tranche B covered debts with a maturity of more than 360 days and less thantwo years, and was repayable in five years including three years’ grace.
June 1995 Rescheduling of $3.2 billion in maturities starting March 1994.
ArgentinaBank debt restructuringsJan. 1983 Bridge loan ($1.3 billion).Aug. 1983 New money loan ($0.5 billion).Aug. 1985 Rescheduling agreement of maturities in January 1982–January 1986 ($9.8 billion); new long-term money ($3.6 billion);
maintenance of short-term credit lines ($3.1 billion).Aug. 1987 Revised restructuring agreement covering amounts under 1983 and 1985 agreements and loans falling due subsequent to those
arrangements ($24.3 billion); new long-term money ($1.3 billion); maintenance of short-term credit lines ($3.5 billion).Brady dealApril 1993 Outstanding stock of $19.3 billion exchanged for either (i) 30-year bonds yielding a market interest rate (LIBOR � 13�16 per-
cent) at a 35 percent discount, or (ii) 30-year par front-loaded interest reduction bonds—FLIRBs (first-year interest rate 4 percent,rising to 6 percent in year seven and remaining there until maturity). Both bonds were collateralized for principal and containedrolling 12-month interest guarantees. Agreement also included $9.3 billion of past-due interest; $0.7 billion was paid in cash atclosing; $400 million was written off; the remainder was exchanged for bonds (17-year maturity), repayable in rising installmentsand yielding LIBOR � 13�16 percent.
Bond market defaults and restructuringsJan. 2002 Announcement of a moratorium on public foreign debt in December 2001. In January 2002, formalization of default on
$95 billion of foreign currency bonds and default on $2.2 billion of local currency bonds. The local currency bonds wereexchanged for new debt, which carried covenants less favorable than the original debt. Bonds maturing before 2010 wereextended by three years, and the coupon was reduced to 7 percent or less. As of January 2003, the foreign currency bonds were still to be restructured. Stand-by credit facility ($2.98 billion) by the IMF for transitional financial support until August 2003.
BoliviaBank debt restructuringsDec. 1980 Deferment of $200 million of maturities (including short-term debt) in August 1980–March 1981.April 1981 Rescheduling of $411 million of maturities (including debt deferred in 1980) in April 1981–April 1983.July 1988 Commercial bank debt retired through a buyback ($272 million) and a local currency bond exchange ($72 million). This was a
rolling program and applied only to previously deferred loans.May 1993 Buyback of $170 million commercial bank debt, funded by grants from IDA DRF and other donor countries.Brady dealJuly 1992 (i) Cash buyback at 84 percent discount; (ii) Collateralized interest-free 30-year bullet-maturity par bonds; (iii) short-term
discount bonds (84 percent) convertible on maturity into local currency assets at a 1:1.5 ratio, exchangeable into investments forspecial projects. Past-due interest canceled under all options. Value recovery clause was based on price of tin.
Notes on how to use these tablesThe dates shown are those of agreements, not when the original payments due were missed. Defermentrefers to short-term rollover of current maturities. Rescheduling refers to consolidation of debt into newlong-term obligations; may include arrears as well as future maturities; interest and short-term debtincluded only if indicated in country notes. New money refers to loans arranged for budgetary or balanceof payments support in conjunction with debt rescheduling, usually in proportion to each creditor bank’s exposure; sometimes referred to as concerted lending. Short-term credit maintenance refers to understanding by banks to maintain the size of existing trade or other short-term credit facilities, arrangedin conjunction with debt rescheduling. The figures for Brady deals include face value of buybacks and of all debt exchanges. The Brady deals were also known as officially supported debt and debt service reduction agreements.
gdf_036-075.qxd 4/6/04 1:06 PM Page 66

P R I V A T E D E B T F I N A N C E F O R D E V E L O P I N G C O U N T R I E S
67
Bosnia and HerzegovinaBank debt restructuringsDec. 1997 London Club Agreement to restructure $1.3 billion of principal and past-due interest owed to commercial banks. Past-due interest
of $700 million was written off. Eligible principal of $600 million was exchanged for $400 million of uncollateralized discountbonds. 37.5 percent of the new bonds carried a 20-year maturity, including seven years’ grace and stepped-up interest rates risingfrom 2.0 percent in years 1–4 to LIBOR � 13�16 in years 11–20. Servicing on 62.5 percent of the new bonds was linked to economic performance. The country was not required to make principal or interest payments for the first 10 years. After that thecountry was required to make debt service payments if per capita income exceeded $2,800 for two consecutive years. Per capitaincome in 1997 was estimated at $1,079.
BrazilBank debt restructuringsFeb. 1983 Rescheduling agreement of $4.8 billion of maturities in January 1983–January 1984; new long-term money ($4.2 billion);
maintenance of short-term credit lines ($15.7 billion).Jan. 1984 Rescheduling agreement of $5.9 billion of maturities in January 1984–January 1985; new long-term money ($6.5 billion);
maintenance of short-term credit lines ($15.1 billion).July 1986 Deferment of $9.6 billion and rescheduling agreement of $6.6 billion of maturities in January 1985–January 1986; maintenance
of short-term credit lines ($14.7 billion).Nov. 1988 Rescheduling agreement of $61.5 billion of maturities in January 1987–January 1994; new long-term money ($5.2 billion);
maintenance of short-term credit lines ($14.8 billion). Also included a broad package of creditor options.July 1992 Clearance of interest arrears as of December 31, 1990. Cash payment during 1992: $863 million. When term sheet concluded for
long-term debt, the balance was to be converted into 10-year bonds (three years’ grace), bearing market interest rates.Brady dealApril 1994 Four components of debt were restructured totaling $48 billion: (i) debt to foreign banks under the 1988 multiyear deposit
facility agreement—MDFA ($32.5); (ii) debt to Brazilian banks under the MDFA; (iii) debt resulting from the 1988 new money facilities ($8.1 billion); and (iv) interest arrears accruing from 1991–94 ($6.0 billion). The first category of debt was restructuredfollowing a six-choice menu: (i) discount bonds, 35 percent discount, 30-year bullet maturity yielding LIBOR � 13�16 percentwith principal collateral and a 12-month rolling interest guarantee ($11.2 billion); (ii) par bonds with a reduced fixed-rate interest (yielding 4 percent in the first year and gradually rising to 6 percent in year seven), 30-year bullet maturity, also with principal collateral and a 12-month rolling interest guarantee ($10.5 billion); (iii) FLIRBs ($1.7 billion), with interest rising from a fixed rate of 4 percent in year one to 6 percent in years five and six and then reverting to LIBOR � 13�16 percent fromyear seven to maturity, 15 years’ maturity including 9 years’ grace, 12-month rolling interest guarantee; (iv) C-bonds, par-reducedinterest rate bonds with capitalization of interest ($7.1), with repayment terms of 20 years’ maturity including 10 years’ grace, interest beginning at 4 percent and the applicable rates in the first 6 years being capitalized, no collateral; (v) conversion bonds($1.9 billion) combined with new money bonds in a 1:5.5 ratio, interest is LIBOR � 7�8 percent, terms are 18 years’ maturity including 10 years’ grace for the conversion bonds and 15 years including 7 years’ grace for the new money bonds, no collateral;(vi) interest reduction loan with capitalization, maturity of 20 years including 10 years’ grace, interest rising from 4 percent inyear one to 5 percent in year six to LIBOR � 13�16 from year seven to maturity.
BulgariaBrady dealJuly 1994 Creditors agreed to restructure $8.3 billion in public external debt, including about $2.1 billion in PDI. The menu for the original
debt included: (i) buyback at 0.25 cent per U.S. dollar ($0.8 billion); (ii) discount bond, 50 percent discount on face value(30 years’ bullet maturity, market rate, $3.7 billion); the discount bonds were collateralized for principal; (iii) FLIRBs. 18 years’maturity, 8 years’ grace interest beginning at 2 percent, rising to 3 percent in the seventh year and thereafter LIBOR � 13�16($1.7 billion). The FLIRBs have one year’s interest rolling interest guarantee. Interest arrears were cleared with a cash paymentof about 3 percent, a buyback ($0.2 billion), a write-off of $0.2 billion, and the issuance of PDI par bonds ($1.6 billion) with a17-year maturity, including 7 years’ grace and a yield of LIBOR �13�16 percent.
CameroonBank debt restructuringsAug. 2003 Buyback of $796 million (including interest arrears) of commercial bank debt under the IDA DRF at 14.5 cents per U.S. dollar,
financed by IDA DRF and other donor countries.
ChileBank debt restructuringsJuly 1983 Rescheduling agreement of $2.1 billion of maturities in January 1983–January 1985; new long-term money ($1.3 billion);
maintenance of short-term credit lines ($1.7 billion).Jan. 1984 Consolidation of short-term debt of $1.2 billion.June 1984 Provision of new long-term money ($0.8 billion).Nov. 1984 Short-term debt rolled over to June 30, 1985.Nov. 1985 Short-term trade credit rolled over to 1990. Rescheduling agreement of $3.9 billion of maturities in January 1985–January 1988;
new long-term money ($1 billion); maintenance of short-term credit lines ($1.7 billion).June 1987 Rescheduling agreement of $9.7 billion of maturities in January 1988–January 1992; maintenance of short-term credit lines
($1.7 billion).Aug. 1988 Interest spread reduced to 13�16 percent. Also cash buybacks ($439 million).Dec. 1990 Rescheduling agreement of $4.2 billion of maturities in January 1991–January 1995, including previously rescheduled debt; new
long-term money ($0.3 billion). New money bonds not tied to existing banks’ exposure.
gdf_036-075.qxd 4/6/04 1:06 PM Page 67

Congo, Republic ofBank debt restructuringsOct. 1986 Agreement in principle, but never concluded, to restructure 1986–88 maturities, repayable in nine years including three years’
grace, bearing interest at LIBOR � 2-7�8 percent. Approximately $200 million of debt would have been restructured. In additionthere was a new money provision of $60 million.
Costa RicaBank debt restructuringsSept. 1983 Rescheduling agreement of $0.7 billion of maturities (including principal arrears) in January 1983–January 1985; new long-term
money ($0.2 billion); maintenance of short-term credit lines ($0.2 billion).May 1985 Rescheduling agreement of $0.5 billion of maturities, including deferment of revolving credit ($2 million) due in
January 1985–January 1987; new long-term money ($75 million).Brady dealMay 1990 Cash buyback at 84 percent discount ($992 million), debt-for-bond-exchange ($579 million), and write-off of $29 million of past-
due interest.
Côte d’IvoireBank debt restructuringsMar. 1985 Rescheduling agreement of $0.5 billion of maturities in December 1983–January 1985; new long-term money ($0.1 billion).Nov. 1986 Multiyear rescheduling agreement (MYRA) of $0.9 billion of maturities in January 1986–January 1990.April 1988 Agreement designed to replace the MYRA. Included new money to refinance interest. Interest on the new money portion was
LIBOR � 1-1�2 percent. Agreement was not put into effect because interest arrears were not cleared, and current interestpayments were suspended in April 1988.
Brady dealMay 1997 Agreement for restructuring $6.5 billion of principal and past-due interest. For eligible principal of $2.3 billion, creditors agreed
to (i) exchange $159 million for discount bonds (50 percent discount) subject to stepped-up interest rising from 2.5 percent in years 1–2 to LIBOR � 13�16 in years 11–30; (ii) exchange $1.4 billion for FLIRBs with a maturity of 20 years, including 10 years’ grace, and stepped-up interest rising from 2.0 percent in years 1–7 to LIBOR � 13�16 in years 14–20; (iii) buy back $0.7 billion at 24 cents per dollar. Principal was collateralized with 30-year U.S. Treasury zero-coupon bonds for the discountbonds, but not for the FLIRBs. A six-month rolling interest guarantee was required for the FLIRBs, but not for the discountbonds. For past-due interest of $4.2 billion, $30 million was settled in cash at closing, $0.9 billion was exchanged for bonds witha 20-year maturity (half a year of grace period) repayable on a graduated amortization schedule, and $3.3 billion was written off.
CubaBank debt restructuringsDec. 1983 Rescheduling agreement of $0.1 billion of maturities in September 1982–December 1984; maintenance of short-term credit lines
($0.5 billion).Dec. 1984 Rescheduling agreement of $0.1 billion of maturities in January 1984–December 1985; maintenance of short-term credit lines
($0.5 billion).July 1985 Rescheduling agreement of $0.1 billion of maturities in January 1985–December 1986; maintenance of short-term credit lines
($0.5 billion).
Dominican RepublicBank debt restructuringsDec. 1983 Rescheduling agreement of $0.5 billion of maturities in December 1982–December 1983 (including short-term debt).Feb. 1986 MYRA of $0.8 billion of maturities in January 1985–December 2000 (including arrears as of December 31, 1984).Brady dealAug. 1994 Agreement covering principal and interest past due ($1.2 billion). The agreement had a menu consisting of (i) buybacks
($.4 billion); (ii) discount exchange bonds ($.5 billion) at 35 percent discount, to be repaid in 30 years, bullet maturity, interestrate LIBOR � 13�16 percent; (iii) past-due interest bonds ($171 million) bearing interest at LIBOR � 13�16 percent, with 3 years’ grace and 15 years’ maturity. The accord also included a write-off of $112 million of past-due interest, and $52 millionpaid in cash at closing.
EcuadorBank debt restructuringsOct. 1983 Rescheduling agreement of $2.8 billion of maturities in November 1982–December 1983; new long-term money ($0.4 billion);
maintenance of short-term credit lines ($0.7 billion).Dec. 1985 MYRA of $4.2 billion of maturities in January 1985–January 2000. New long-term money ($0.2 billion); maintenance of short-
term credit lines ($0.7 billion).Nov. 1987 Replaces the MYRA.Brady dealFeb. 1995 Agreement restructuring $7.8 billion of principal and past-due interest. For principal, creditors agreed to exchange $2.6 billion
for discount bonds (45 percent discount) yielding LIBOR � 13�16 percent and $1.9 billion for par reduced-interest-rate bonds.Both bonds had a 30-year bullet maturity and were collateralized for principal and had a 12-month rolling interest guarantee. The interest rate on the par bonds was 3 percent for the first year, rising to 5 percent in year 11. For past-due interest, $75 billionwas to be settled in cash at closing, $2.3 billion was exchanged for bonds with a 20-year maturity (no grace period) repayable on a graduated amortization schedule, $191 million was exchanged for interest equalization bonds, and $582 million was written off.
G L O B A L D E V E L O P M E N T F I N A N C E 2 0 0 4
68
gdf_036-075.qxd 4/6/04 1:06 PM Page 68

P R I V A T E D E B T F I N A N C E F O R D E V E L O P I N G C O U N T R I E S
69
Bond market defaults and restructuringsAug. 2000 Agreement to exchange about $5.9 billion in defaulted Brady bonds and eurobonds for $3.9 billion in new 12- and 30-year global
bonds. The new 12-year issue was priced to yield 12 percent, and the new 30-year issue carried the multi-coupon with the initialcoupon rate of 4 percent. This operation resulted in a 40 percent reduction in principal for the bondholders.
EthiopiaBank debt restructuringsJan. 1996 Debt buyback at 8 cents per U.S. dollar of $226 million owed to commercial banks. Funding for the operation provided by the
IDA DRF.
GabonBank debt restructuringsDec. 1987 Rescheduling agreement of $27 million of maturities in September 1986–December 1987.Dec. 1991 Rescheduling agreement of $75 million of maturities in January 1989–December 1992.May 1994 Rescheduling of $187 million of maturities. Principal due through 1994 on debt contracted prior to September 20, 1986 (debt
covered by the 1991 agreement, which had not been implemented) was rescheduled. Terms: 10-year maturity including 2-1�2years’ grace. Interest: LIBOR � 7�8 percent. Arrears of interest and arrears of post cut-off maturities as of July 1, 1994, were tobe repaid between 1994 and 1996.
April 2002 Default on $30 million of bank loans, which had been restructured in 1994.
Gambia, TheBank debt restructuringsFeb. 1988 Rescheduling of debt outstanding as of December 18, 1986; new long-term money ($19 million).
GuineaBank debt restructuringsApril 1988 Rescheduling of short-term debt of $28 million.Dec. 1998 Buyback of $130 million under the IDA DRF at 13 cents per U.S. dollar, financed by IDA DRF and other donor countries.
GuyanaBank debt restructuringsAug. 1982 One-year deferment of $14 million of maturities in March 1982–April 1983.June 1983 Extension of $12 million due in July 1983–December 1983, previously deferred in 1982.July 1984 Extension of $11 million due in August 1984–August 1985, previously deferred.July 1985 Extension of $15 million due in August 1985–December 1986, previously deferred.July 1988 Deferment of $8 million.Nov. 1992 Buyback of $69 million under the IDA DRF at 14 cents per U.S. dollar.Dec. 1999 Buyback of $55.9 million under the IDA DRF at 9 cents per U.S. dollar, financed by IDA DRF and the Switzerland government.
HondurasBank debt restructuringsJune 1987 Rescheduling agreement of $248 million of maturities due April 1987–December 1989. As two previous agreements (in 1983 and
1984) were not implemented, this agreement incorporated 1981–85 maturities as well, although it too was not signed.Aug. 1989 Bilateral rescheduling of $101 million, including interest arrears, due to two commercial banks.Aug. 2001 Buyback of $13 million under the IDA DRF. The buyback price was set at 18 cents per dollar of the principal amount. The IDA
and the governments of the Netherlands, Norway, and Switzerland provided funding for the operation.
IndonesiaBank debt restructuringsJune 1998 Agreement on a framework for restructuring $80 billion of the Indonesian private debt. The interbank loans were extended into
new government-guaranteed loans with maturities of one to four years, at interest rates of 2.75, 3, 3.25, and 3.5 percent overLIBOR. The corporate debts were to be rescheduled over eight years, including a three-year grace period for repayment ofprincipal. Over the eight-year rescheduling period, the real interest rate was set to be 5.5 percent, but it would decline to 5 percentfor debtors who agree to repay in five years. There was also an agreement to pay off trade financing arrears to maintain tradefinancing from foreign creditor banks.
Sept. 2002 Completion of restructuring of $1.5 billion in syndicated bank credits, as required under the agreement with Paris Club.
Iran, Islamic Republic ofBank debt restructuringsMar. 1993 Rescheduling of $2.8 billion of debt outstanding as of March 1993.Dec. 1994 Rescheduling of $10.9 billion of debt outstanding as of December 1994.
JamaicaBank debt restructuringsApril 1981 Rescheduling of $126 million of maturities in April 1979–April 1981.June 1981 Rescheduling of $89 million of maturities in July 1981–March 1983; new long-term money ($89 million).June 1984 Rescheduling of $164 million of maturities in July 1983–March 1985.Sept. 1985 Rescheduling of $359 million of maturities in April 1985–March 1987.
gdf_036-075.qxd 4/6/04 1:06 PM Page 69

May 1987 Rescheduling of $366 million of maturities in January 1987–March 1990; included reduced spreads on earlier rescheduling.June 1990 Rescheduling of $315 million of maturities in January 1990–December 1991. Also, reduced spreads on earlier rescheduling.
JordanBank debt restructuringsSept. 1989 Rescheduling agreement in principal of $580 million of maturities in January 1989–June 1991.Nov. 1989 Provision of new long-term money ($50 million); short-term credit ($50 million) to meet obligations due between
January 1989–June 1990.Brady dealDec. 1993 Agreement restructuring $736 million of principal and $153 million of past-due interest. For restructured principal, a small
amount was repurchased at 39 cents per U.S. dollar, $243 million was exchanged for discount bonds (35 percent discount) and $493 million was exchanged for par fixed interest bonds. Both bonds had a 30-year bullet maturity with principal collateral and a six-month rolling interest guarantee. The discount bonds yielded LIBOR � 13�16 percent interest; the yields on par bonds began at 4 percent in the first year, rising to 6 percent in year seven. Regarding past-due interest, $29 million was paid atclosing, $91 million was exchanged for non-collateralized bonds with a 12-year maturity including 3 years’ grace and yieldingLIBOR � 13�16 percent, and $33 million was written off. Up-front costs totaled $147 million, all of which was provided fromJordan’s own resources.
LiberiaBank debt restructuringsDec. 1982 Rescheduling of $29 million of maturities in July 1981–June 1982.June 1983 Consolidation of $26 million of oil facility debt.
MauritaniaBank debt restructuringsAug. 1996 Debt buyback of $53.0 million, at a 90 percent discount, owed to commercial banks. Funding for the operation provided by the
IDA DRF.
MadagascarBank debt restructuringsNov. 1981 Arrears ($155 million) on overdrafts consolidated into long-term debt.Oct. 1984 Restructuring of entire stock of debt ($379 million), including arrears.June 1987 Modification of the terms of the October 1984 restructuring agreement.May 1990 Rescheduling agreement in principal of $49 million of maturities in April 1990–August 1995.Jan. 2002 Default on $200 million in local currency debt, in addition to continuing default on foreign currency commercial
bank loans.
MalawiBank debt restructuringsMar. 1983 Rescheduling of $59 million of maturities in September 1982–August 1984.Oct. 1988 Rescheduling of balances as of August 21, 1987 ($36 million).
MexicoBank debt restructuringsAug. 1983 Rescheduling of $23.3 billion of maturities in April 1982–August 1984; new long-term money ($5 billion).April 1984 New long-term money ($3.8 billion).Mar. 1985 MYRA of $28 billion, including previously rescheduled debt, maturing in January 1987–December 1991.Aug. 1985 MYRA of $20.3 billion of maturities (not previously rescheduled) in January 1985–December 1990.Oct. 1985 Deferment of first payment ($0.9 billion) under the March 1985 agreement.Mar. 1987 Modification of terms of earlier agreements covering $44.2 billion of maturities; new long-term money ($7.4 billion).Aug. 1987 Rescheduling of $9.7 billion of private sector debt maturing in January 1988–December 1991.Mar. 1988 Exchange of debt for 20-year zero-coupon collateralized bonds ($556 million).Brady dealMar. 1990 Agreement restructuring $48.2 billion of debt. In addition to new money of $1 billion, the agreement provided for the exchange
of $20.5 billion of debt for bonds at a 35 percent discount, an exchange of $22.4 billion of debt at par for reduced interest ratebonds, and conversion bonds totaling $5.3 billion. The latter were not collateralized and had a tenor of 15 years’ maturity, includ-ing 7 years’ grace, and an interest rate of LIBOR � 13�16. The total base also included $693 million not committed to any option.
MoldovaBond market defaults and restructuringsJune 2002 Second default on $75 million foreign currency bond (privately placed) originally issued in 1997. Outstanding amount of the
bond reduced to $40 million after the initial default. This time around the maturity of the bond, due in June 2002, was extendeduntil 2009.
MoroccoBank debt restructuringsFeb. 1986 Agreement in principle (initiated August 1983) rescheduling $531 million maturing in September 1983–December 1984;
short-term credit maintenance ($610 million).
G L O B A L D E V E L O P M E N T F I N A N C E 2 0 0 4
70
gdf_036-075.qxd 4/6/04 1:06 PM Page 70

P R I V A T E D E B T F I N A N C E F O R D E V E L O P I N G C O U N T R I E S
71
Sept. 1987 Rescheduling of $2.4 billion of maturities in January 1985–December 1988.Brady dealJune 1990 Rescheduling of $3.2 billion of maturities outstanding as of December 1989. Phase one of this agreement restructured
debt; phase two was a Brady deal that would take effect if Morocco had signed an EFF (extended fund facility) agreement withthe IMF by December 31, 1991.
MozambiqueBank debt restructuringsMay 1987 Rescheduling of outstanding stock of debt ($253 million), including interest arrears.Dec. 1991 Buyback of $124 million of outstanding commercial bank debt at a 90 percent discount, funded by grants from the IDA DRF and
from France, the Netherlands, Switzerland, and Sweden.
NicaraguaBank debt restructuringsDec. 1980 Rescheduling of government debt ($582 million), all maturities, including arrears.Dec. 1981 Rescheduling of nationalized bank debt ($192 million), all maturities, including arrears.Mar. 1982 Rescheduling of debts of non-financial enterprises ($100 million), all maturities, including arrears.Feb. 1984 Deferment of service on rescheduled debt ($145 million) due between July 1983–June 1984.Dec. 1995 Buyback of $1.1 billion of outstanding commercial bank debt at 8 cents per U.S. dollar.
NigerBank debt restructuringsMar. 1984 Rescheduling of $29 million of maturities in October 1983–March 1986.April 1986 Rescheduling of $36 million of maturities in October 1985–December 1988.Mar. 1991 Buyback of all commercial bank debt at 82 percent discount ($107 million). Resources provided by grants from the DRF for
IDA-only countries ($10 million), Switzerland ($3 million), and France ($10 million).
NigeriaBank debt restructuringsNov. 1987 Rescheduling of $4.7 billion of maturities, including short-term debt, due between April 1986–December 1987.Mar. 1989 Rescheduling of $5.7 billion of short-term debt, including arrears on line of credit.Brady dealJan. 1992 Agreement rescheduling $5.3 billion of debt. The terms provided for a cash-back at 60 percent discount on $3.3 billion, and debt
exchanges on $2 billion for collateralized 30-year bullet maturity par bonds with reduced interest rates: 5.5 percent for the firstthree years, 6.25 percent thereafter. Creditor selections: 62 percent for the buyback; 38 percent for the debt-reduction bond. Athird option, new money combined with conversion bonds, was not selected by participating creditor banks.
PanamaBank debt restructuringsSept. 1983 Provision of new long-term money ($278 million); short-term credit ($217 million).Oct. 1985 Rescheduling of $578 million in maturities in January 1985–December 1986; new long-term money ($60 million); maintenance of
short-term credit lines ($190 million).Brady dealMay 1996 Creditors agreed to restructuring of $3.9 billion in public external debt, including $2.0 billion in past-due interest. The
menu for the principal included: (i) discount bonds at a 45 percent discount of face value (30 years’ bullet maturity, market rate, $87.8 million); (ii) par bonds with reduced interest rates and a 30-year bullet repayment ($268.0 million); and (iii) FLIRBsfor $1,612.2 million with a tenor of 18 years’ maturity including 5 years’ grace period. The discount and the par bonds are collateralized with respect to the principal by U.S. Treasury zero-coupon bonds, and with respect to interest in the form of a 9-month rolling interest rate guarantee in the first year rising to 12 months in two to three years. The FLIRBs do not require guarantee for the capital, but include a six-month rolling interest guarantee. PDI settlement included progress payments of $30 million, a payment at closing of $100 million, a write-off of $590.4 million arising from the recalculation of penalty interestat a lower interest rate, and PDI par bonds of $1,247.6 million with 20 years’ maturity, including 7 years’ grace, and interest rateof LIBOR � 13�16 percent. Neither principal nor interest was guaranteed. Moreover, Panama could capitalize for the first sixyears, the difference was positive between LIBOR � 13�16 and 4.0 percent per year.
PeruBank debt restructuringsJan. 1980 Rescheduling of $364 million of maturities in January 1980–December 1980.July 1983 Rescheduling of $432 million of maturities in March 1983–February 1984; new long-term money ($650 million); maintenance of
short-term credit lines ($2 billion).Brady dealNov. 1996 Creditors agreed to restructuring of $8 billion in public external debt, including $3.8 billion in PDI. The menu for the principal
included (i) discount bonds at a 45 percent discount of face value (30 years’ bullet maturity, market rate, $947 million); (ii) parbonds with reduced interest rates and a 30-year bullet repayment ($189 million); (iii) FLIRBs for $1,779 million with a tenor of20 years’ maturity including 8 years’ grace period; and (iv) a buyback of $1,266 million at 38 cents per U.S. dollar. The discountand the par bonds were collateralized with respect to the principal by U.S. Treasury zero-coupon bonds, and with respect to interest in the form of a six-month rolling interest rate guarantee secured by cash or permitted investments. The FLIRBs did notrequire guarantee for the capital, but included a six-month rolling interest guarantee. PDI settlement included progress payments
gdf_036-075.qxd 4/6/04 1:06 PM Page 71

of $83 million, a payment at closing of $225 million, a buyback of $1,217 million at 38 cents per U.S. dollar, and PDI par bonds of $2,284 million with 20 years’ maturity, including 10 years’ grace, and interest rate of LIBOR � 13/16 percent. Neitherprincipal nor interest was guaranteed. Moreover, Peru could capitalize for the first six years, the difference was positive between LIBOR � 13�16 and 4.0 percent per year.
PhilippinesBank debt restructuringsJan. 1986 Rescheduling of $5.9 billion in maturities in October 1983–December 1986; new long-term money ($925 million); maintenance
of short-term credit lines ($2,974 million).Dec. 1987 Rescheduling of $9 billion in maturities in January 1987–December 1992; maintenance of short-term credit lines ($2,965 million).Brady dealJan. 1990 Agreement provided for $1.3 billion of buybacks at a 50 percent discount.Dec. 1992 Following implementation of a cash buyback of $1.3 billion on May 14, 1992, banks selected debt exchanges from three options:
(i) front-loaded interest-reduction par bonds yielding LIBOR � 13�16 percent from year seven to maturity (15 years for series A and 15-1�2 year for series B, both including 7 years’ grace); (ii) collateralized step-down/step-up interest reductionbonds yielding 6.5 percent from year six to maturity (25-year bullet maturity for series A and 25-1�2 year for series B); and (iii) new money combined with conversion bonds in a 1:4 ratio, with both bonds attaining 17-1�2 (series A) or 17-year (series B)maturity, including 5 years’ grace and yielding LIBOR � 13�16 percent. Interest payments on both interest-reduction bondscovered by a rolling 14-month guarantee. Creditor choices (total, $4.4 billion, 96 percent total eligible debt): buybacks, $1.3 billion (27.5 percent): option (a), $0.8 billion (46.3 percent); option (b), $1.9 billion (41.1 percent); option (c), $0.5 billion,(11.7 percent).
PolandBank debt restructuringsApril 1982 Rescheduling of $1.9 billion of maturities in March 1981–December 1981.Nov. 1982 Rescheduling of $2.2 billion of maturities in January 1982–December 1982.Nov. 1983 Rescheduling of $1.3 billion of maturities in January 1983–December 1983.July 1984 Rescheduling of $1.5 billion of maturities, including some short-term trade credits, due in January 1984–December 1987.Sept. 1986 Rescheduling of $1.9 billion of maturities, including debt rescheduled in 1982, due in January 1986–December 1987.July 1988 Multiyear rescheduling agreement of $8.3 billion of maturities due in January 1988–December 1993; maintenance of short-term
credit lines ($1 billion). Also improved the terms of earlier agreements.June 1989 Agreement in principal to defer principal due May 1989–December 1990 ($206 million) until December 1991; and in October,
the interest due in the fourth quarter of 1989, $145 million, was deferred until the second quarter of 1990.Brady dealOct. 1994 Creditors restructured $14.4 billion. Three categories of debt were affected: (i) long-term debt covered by the 1988 restructuring
agreement ($8.9 billion); (ii) debt due under the Revolving Short-Term Arrangement—RSTA—($1.2 billion); (iii) past-due interestnot otherwise restructured ($4.3 billion). The first category was subject to a menu approach: $2.1 billion of long-term debt wasrepurchased at 41 cents per U.S. dollar, and $0.3 billion of RSTA debt was repurchased at 38 cents per U.S. dollar. For the remaining long-term, creditors chose between (i) discount bonds—45 percent discount ($5.4 billion); (ii) par reduced fixed interest bonds ($0.9 billion); (iii) conversion bonds combined with new money bonds equal to 35 percent of the amount converted($0.4 billion). The discount bonds and par bonds had 30-year bullet maturities and featured collateralization of principal only. Interest on the discount bonds was LIBOR � 13�16 percent. Interest on the par bonds was 2.75 percent for the first year, rising to 5 percent for year 21. The conversion bonds had a 25-year maturity, including 20-year grace. Their yield in year one was 4.5 percent, rising to 7.5 percent in year 11. The new money bonds had a 15-year maturity, including 10-year grace and yield LIBOR � 13�16 percent. The new money and conversion bonds are not collateralized. The RSTA debt not repurchased($0.9 billion) was exchanged for 30-year bullet maturity fixed interest bonds, with similar (but slightly different) step-down/step-up arrangements as the par bonds, starting at 2.75 percent in year one and gradually rising to 5 percent in year 21. For past-due interest, $0.8 billion was repurchased with related long-term and RSTA principal. A portion was to be settled with cashpayments at closing ($63 million). A portion was written off ($0.8 billion), and the remainder ($2.7 billion), was converted intofixed-interest rate bonds yielding 3.25 percent in year one, rising to 7 percent in year nine. Maturity was 20 years, including 7 years’ grace. Amortization was graduated.
RomaniaBank debt restructuringsDec. 1982 Rescheduling of $1.6 billion of maturities in January 1982–December 1982.June 1983 Rescheduling of $0.6 billion of maturities in January 1983–December 1983.Sept. 1986 Rescheduling of $0.8 billion in previously rescheduled debt maturing in January 1986–December 1987.Sept. 1987 Agreement in principal to reschedule $0.8 billion of maturities in January 1986–December 1987.
Russian FederationBank debt restructuringsDec. 1991 Deferment of principal due in December 1991–March 1992 on pre-1991 debt. The deferment was extended for each consecutive
quarter until the end of 1993.July 1993 Rescheduling of the stock of FSU debt contracted prior to January 1, 1991 ($24 billion), to be repaid with 15-year maturity
including 5 years’ grace. In the fourth quarter of 1993, $500 million was to be paid on interest accruing during 1993. At the end of 1993, all remaining unpaid interest (estimated at $3 billion) was then to be consolidated and repaid at a 10-year maturity,including 5 years’ grace. The 1993 interest payments were not made; the agreement was not implemented, mainly because
G L O B A L D E V E L O P M E N T F I N A N C E 2 0 0 4
72
gdf_036-075.qxd 4/6/04 1:06 PM Page 72

P R I V A T E D E B T F I N A N C E F O R D E V E L O P I N G C O U N T R I E S
73
Russia refused to accept bankers’ requirement that sovereign immunity be waived. However, an understanding was reached onOctober 5, 1994, that the banks would drop their insistence on a waiver of sovereign immunity and that the Vneshekonombank(or another public entity) would guarantee the debts.
Nov. 1995 Agreement in principle to comprehensively reschedule $33 billion in debt outstanding as of November 15, 1995. Heads of termswere signed for rescheduling debt of the former USSR in the amount of $25.5 billion of principal outstanding and $7.5 billion inaccrued interest due. The eligible principal was to be repaid over 25 years, with 7 years of grace, beginning December 15, 1995, in37 semi-annual payments on a graduated schedule at LIBOR � 13�16 percent per year. It was further agreed that an interest notefor $6 billion would be issued with a 20-year maturity and 7 years’ grace from December 15, 1995, that would be the sameinterest rate, listed on the Luxembourg Stock Exchange. The remaining $1.5 billion in interest arrears was paid over 1995–96. By September 1996, the minimum subscribership by commercial banks of $20 billion in outstanding principal was reached whichtriggered the Russian agreement to the rescheduling package.
Nov. 1998 Outline of an agreement to restructure $13.5 billion of defaulted Treasury bills (GKOs and OFZs). Under the restructuringplan, 10 percent of the defaulted bills was to be redeemed in cash rubles, and 20 percent of the debt was to be exchanged forthree-year zero-coupon bonds. The remaining 70 percent of the debt was to be restructured into four-year and five-year variablecoupon bonds.
Feb. 2000 Agreement to restructure $31.8 billion Soviet-era debts owe to the London Club of commercial banks. The London Club’s creditors agreed to write off $11.6 billion of the principal and a 7-year grace period for principal repayments, and swapping the rest of its defaulted debts (PRINs [principal notes] and IANs [interest arrears notes]) for a new 30-year eurobonds. Theinterest rate on a new eurobond was set at 2.25 percent for the first six months, 2.5 percent for the second six months, and 5 percent for years two and seven—yielding 7.5 percent a year.
São Tomé and PrincipeBank debt restructuringsAug. 1994 Buyback under the IDA DRF at 10 cents per U.S. dollar. $10.1 million of principal was extinguished (87 percent of
eligible debt).
SenegalBank debt restructuringsFeb. 1984 Rescheduling of $96 million of maturities in May 1981–June 1984.May 1985 Rescheduling of $20 million of maturities in July 1984–June 1986.Jan. 1989 Rescheduling of $37 million.Dec. 1996 Debt buyback at 8 cents per U.S. dollar of $80.0 million owed to commercial banks. Funding for the operation provided by the
IDA DRF.
Sierra LeoneBank debt restructuringsJan. 1984 Rescheduling of principal arrears ($25 million) outstanding as of December 31, 1983.Aug. 1995 Buyback, at 13 cents on average per U.S. dollar, of $235 million due to commercial banks funded by grants from IDA DRF and
other donor countries.
South AfricaBank debt restructuringsSept. 1985 Deferment of $13.6 billion maturing in August 1985–Decemebr 1985.Mar. 1986 Rescheduling of $650 million of maturities in August 1985–June 1987.Mar. 1987 Rescheduling of $4.5 billion of maturities in July 1987–June 1990.Oct. 1989 Rescheduling of $7.5 billion of maturities in October 1989–December 1993.Sept. 1993 Rescheduling of $5 billion, including interest arrears.
SudanBank debt restructuringsNov. 1981 Rescheduling of $593 million of maturities due in January 1980–March 1982, including principal arrears and some
short-term debt.Mar. 1982 Rescheduling of $3 million of interest arrears and modification of 1981 agreement.April 1983 Rescheduling of $702 million of interest arrears and modification of 1981 agreement.Oct. 1985 Rescheduling of $1,037 million (including interest arrears).
SurinameBank debt restructuringsDec. 2001 Clearing of $36 million in principal arrears owed to commercial banks.
TanzaniaBank debt restructuringsApril 2001 Buyback of $76.6 million of eligible principal debt and about $79.2 million of associated interest under the IDA DRF. The
buyback price was set at 12 cents per dollar of the principal amount with a 5 percent of foreign exchange risk margin. The IDAand the governments of Germany and Switzerland provided funding for the operation.
gdf_036-075.qxd 4/6/04 1:06 PM Page 73

TogoBank debt restructuringsMar. 1980 Rescheduling of $69 million of debts owed to French banks, including arrears of principal. Interest rates varied by currency.Oct. 1983 Rescheduling of $84 million of debts owed to all commercial bank debt, including previously rescheduled debt.May 1988 Rescheduling of $48 million restructuring in 1983.Dec. 1997 Debt buyback at 12.5 cents per dollar of $46.1 million owed to commercial banks. Funding for the operation was provided by
the IDA DRF.
Trinidad and TobagoBank debt restructuringsDec. 1989 Rescheduling of $473 million of maturities in September 1988–August 1992.
TurkeyBank debt restructuringsMar. 1982 Improvement on the terms of the August 1979 agreement, affecting $2.3 billion of debt.
UgandaBank debt restructuringsFeb. 1993 Buyback of $153 million commercial bank debt funded by grants from the IDA DRF and other donor countries.
UkraineBond market defaults and restructuringsJuly 1999 Agreement to restructure a 10-month $163 million eurobond (including principal and interest). Instead of making the
$163 million repayment due in June 1999, Ukraine was to repay 20 percent of bond in cash and swap the remaining 80 percentinto a D-mark-denominated eurobond with a maturity of 3 years and coupon yield of 16 percent.
Feb. 2000 Agreement to restructure $2.7 billion of the short-term debt obligations. No debt forgiveness or reduction in principal was required from bondholders, and all accrued interest on existing eligible bonds was to be paid in full and in cash; all accepting investors were to be offered a new seven-year eurobond, denominated in either euros or U.S. dollars, at an interest rate of 10 per-cent for euro-denominated bonds and 11 percent for dollar-denominated bonds.
Mar. 2001 About $21.5 million of the external debt was exchanged for a six-year eurobond, denominated in either euros at an interest rateof 10 percent or U.S. dollars at an interest rate of 11 percent. Bonds eligible for the exchange were deutsche mark 16 percent eurobond due in February 2001, euro 10 percent amortizing notes due in March 2007, U.S. dollar 11 percent amortizing notesdue in March 2007, and U.S. dollar 11 percent amortizing notes due in March 2007.
UruguayBank debt restructuringsJuly 1983 Rescheduling of $555 million of maturities in January 1983–December 1984; new long-term money ($240 million).July 1986 Multiyear rescheduling agreement of $1.7 billion of maturities due in January 1985–December 1989.Mar. 1988 Rescheduling of $1.5 billion of maturities in January 1990–December 1991, including improvement of terms of the July 1986
agreement.Brady dealFeb. 1991 The agreement provided for cash buyback at a 44 percent discount ($628 million), collateralized debt reduction bonds ($535
million), and new money ($89 million) combined with debt conversion notes ($447 million). The repayment terms were 30-year bullet maturity and 6.75 percent fixed interest for the interest reduction bonds, 16-year maturity including 7 years’ grace withLIBOR � 7�8 percent interest for the conversion notes, and 15-year maturity including 7 years’ grace with LIBOR � 1 percent interest for the new money notes.
Bond market defaults and restructuringsMay 2003 Swapping of about $5.4 billion of the public debt. The exchange operation created 15 maturity extension bonds and 3 new U.S.
dollar–denominated benchmark bonds. The new international bonds included Collective Action Clauses. Overall participationwas about 93 percent of eligible bonds.
República Bolivariana de VenezuelaBank debt restructuringsFeb. 1986 Multiyear rescheduling agreement of $21 billion of maturities due in January 1983–December 1989.Nov. 1987 Reduction of spread and extension of maturities on the 1986 agreement. New long-term money ($100 million).Sept. 1988 Interest spread reduced on February 1986 agreement, affecting $20.3 billion in debt.Dec. 1988 Exchange of debt for bonds outside the framework of the main negotiations.Brady dealDec. 1990 Agreement featured buybacks in the form of 91-day collateralized short-term notes ($1,411 million), exchange for bonds at
30 percent discount ($1,810 million), exchange at par for reduced fixed-rate interest bonds ($7,457 million), exchange for bonds at par with temporary step-down interest rates ($3,027 million), and new money combined with debt conversion bonds($6,022 million).
VietnamBrady dealDec. 1997 Agreement restructuring $310.9 million of principal and $486.2 million of past-due interest. For restructured principal,
$20.4 million was repurchased at 44 cents per U.S. dollar, $51.6 million was exchanged for discount bonds (50 percent discount), and $238.9 million was exchanged for par fixed-interest bonds. Both bonds had 30-year maturity, but the discount
G L O B A L D E V E L O P M E N T F I N A N C E 2 0 0 4
74
gdf_036-075.qxd 4/6/04 1:06 PM Page 74
P R I V A T E D E B T F I N A N C E F O R D E V E L O P I N G C O U N T R I E S
75
bond was repayable in a bullet payment on year 30 while the par bond had a step-up amortization schedule beginning on year 15.Also, 50 percent of the face value due of the par bond was due at maturity. The discount bond was subject to an interest rate ofLIBOR � 13�16 while the par bond was subject to step-up interest rates rising from 3 percent in years 1 and 2 to 5.5 percent inyears 21–30. One hundred percent of the discount bonds and 50 percent of the par bonds were guaranteed by U.S. Treasuryzero-coupon bonds, and the discount bonds had a six-month rolling interest guarantee. Regarding past-due interest, $15 millionwas paid at closing, $294.8 million was exchanged for non-collateralized bonds with a 18-year maturity including 7 years’ graceand step-up interest rates, $21.8 million was repurchased at 44 cents per dollar, and $154.6 million was written off.
Yemen, Republic ofBank debt restructuringsJune 2001 Buyback of $362 million of principal and $245 million of associated interest under the IDA DRF. The buyback price was set at
2.94 cents per dollar of the principal amount. The IDA and the governments of the Netherlands, Norway, and Switzerland provided funding for the operation.
Yugoslavia, Federal Republic ofBank debt restructuringsOct. 1983 Rescheduling of $1.3 billion of maturities, including an one-year rollover of short-term bonds, due in January 1983–December
1983; new long-term money ($600 million); maintenance of short-term credit lines ($800 million).May 1984 Rescheduling of $1.3 billion of maturities due in January 1984–March 1985.Dec. 1985 Multiyear rescheduling agreement of $4 billion of maturities in January 1985–December 1988.Sept. 1988 Rescheduling of $7 billion of maturities due in January 1988–December 1989.
ZaireBank debt restructuringsApril 1980 Rescheduling of $402 million of debt outstanding as of end-1979, including arrears.Jan. 1983 Deferment of principal due in January 1983–December 1983 ($58 million), rescheduled under the April 1980 agreement.June 1984 Deferment of principal due in January 1984–April 1985 ($64 million), rescheduled under the April 1980 agreement.May 1985 Deferment of principal due in May 1985–April 1986 ($61 million), rescheduled under the April 1980 agreement.May 1986 Deferment of principal due in May 1986–April 1987 ($65 million), rescheduled under the April 1980 agreement.May 1987 Deferment of principal due in May 1987–April 1988 ($61 million), rescheduled under the April 1980 agreement.June 1989 Deferment of principal to finance monthly payments on outstanding claims, mainly interest on arrears.
ZambiaBank debt restructuringsDec. 1984 Rescheduling of $74 million of maturities, including arrears as of February 28, 1983.
gdf_036-075.qxd 4/6/04 1:06 PM Page 75

gdf_076-105.qxd 4/6/04 1:05 PM Page 76

3Shifting Forms of Equity Finance for Developing Countries
FOREIGN DIRECT INVESTMENT (FDI)and portfolio equity together make up thelargest component of capital flows to devel-
oping countries. After registering a second consec-utive year of decline—to $149.5 billion in 2003from $152 billion in 2002 and $179.4 billion in2001—equity flows are expected to recover signif-icantly in 2004–05, buoyed by the growing globaleconomy. The decline was due entirely to FDI,which dropped to $135.2 billion in 2003 from$147.1 billion in 2002 and $175 billion in 2001.In contrast, net portfolio equity flows increasedsharply, to $14.3 billion in 2003 from $4.9 billionin 2002 and $4.4 billion in 2001.
The first part of this chapter is devoted to adiscussion of FDI trends; the second, to portfolioequity flows. In the first half, we show that the de-cline in FDI was largely confined to middle-incomecountries and, geographically, to Latin Americaand the Caribbean, which attracted the lion’s shareof direct investment in the 1990s, especially in theservices sector. In other regions, and especially inlow-income countries, FDI continued to be resilientdespite global economic uncertainties.1
The decline in FDI in Latin America and theCaribbean is rooted in changes in the sectoral pat-tern of FDI since the late 1990s. Unlike manufac-turing or natural resource–based FDI, service-sector FDI is largely location bound; it generateslocal currency earnings that are vulnerable todevaluation risk. In banking and infrastructure,FDI is vulnerable to regulatory risks. And invest-ment in banks can reverse quickly, because financialassets can be disposed of rapidly if an internationalbank decides to reduce exposure in a developingcountry. Compounding the effects of these changes,currency devaluation in Argentina and Brazil (and
77
.
in other countries) hurt service-sector FDI in theregion.
Both North-South and South-South FDI wereweak in 2003. Direct investors reduced their FDIexposure in developing countries by calling back in-tercompany loans and increasing repatriated earn-ings. In some cases they also disinvested outrightby selling equity holdings. Nevertheless, the equitycomponent of FDI generally remained more resilientthan intercompany debt and reinvested earnings.
The revival of the global economy is expectedto spur recovery in FDI flows—including service-sector FDI. Nevertheless, direct investors hurt inrecent crises are likely to remain cautious, and thedemand for political risk insurance will remain high.
The second part of this chapter is devoted toportfolio equity—the smallest component of capi-tal flows to developing countries. In contrast tothe decline in FDI, portfolio equity flows to devel-oping countries recovered sharply in 2003. Afterlanguishing for much of the period since the Asiancrisis, emerging-market stocks climbed more than50 percent in 2003, helped by low interest rates,stable exchange rates, and incipient recovery inmany emerging-market economies. But stock ex-changes in Latin America and the Caribbean andin Europe and Central Asia continue to suffer fromdelisting, as companies migrate to major globalstock exchanges in industrial countries.
Portfolio equity flows to developing countriessurged in the early 1990s but began falling after1995; as noted, they remained modest after theAsian crisis. FDI, meanwhile, exhibited an opposingtrend: mergers and acquisitions (M&A) were few inthe early 1990s but more frequent after 1995. Theseopposing trends are due in part to the wave of priva-tization in the early 1990s. After the first round of
gdf_076-105.qxd 4/6/04 1:05 PM Page 77

G L O B A L D E V E L O P M E N T F I N A N C E 2 0 0 4
privatization, shares of privatized enterprises, espe-cially in the utilities and energy sectors, were pur-chased by multinational companies. Thus, portfolioflows collapsed as M&A-related flows began to rise.
The modesty of portfolio equity flows sincethe Asian crisis may be attributed to underdevel-oped stock markets, their high volatility, the sub-ordinate status of equity compared to debt, and“home bias” in industrial countries. Increasedscrutiny of capital-market institutions followingrecent corporate accounting scandals and im-proper trading practices in some U.S. mutualfunds is likely to dampen investor enthusiasm foremerging-market equity, as it may focus attentionon corporate governance and investment climatein the developing countries.
Trends in FDI flows in 2003
FDI flows to developing countries fell in 2003 forthe second consecutive year. Net FDI flows are
estimated to have been $135 billion in 2003, a de-cline of 9 percent from 2002 and 26 percent fromthe peak level reached in 1999 (table 3.1). As a pro-portion of developing countries’ GDP, FDI contin-ued to decline—from 2.3 percent in 2002 to about1.9 percent in 2003 (figure 3.1). This decline is a
78
1995 1997 1999 2001 2003
FDI as a share of GDP
Sources: World Bank, GDF, various years; World Bank, WDI,various years; and World Bank staff estimates for 2003.
0.0
3.5
3.0
2.5
2.0
1.5
1.0
0.5
0
200
180
160
140
120
100
80
60
40
20
Figure 3.1 Net inward FDI flows to developingcountries, 1995–2003
$ billions Percent
Sources: World Bank, GDF, various years; IMF; UNCTAD; andWorld Bank staff estimates for 2003.
Figure 3.2 FDI inflows to the world and developingcountries, 1997–2003
$ billions
Global FDI flows(left axis)
�100
100
300
500
700
900
1,100
1,300
1,500
1997 1998 1999 2000 2001 2002 2003
100
120
140
160
180
200
Developingcountries’FDI flows(right axis)
$ billions
Table 3.1 Net FDI inflows to developing countries,1997–2003$ billions
1997 1998 1999 2000 2001 2002 2003e
Total 171 176 182 162 175 147 135East Asia and
Pacific 62 58 50 44 48 55 57Europe and
Central Asia 23 26 28 29 32 33 26Latin America
and the Caribbean 67 74 88 77 70 45 37Middle East and
North Africa 6 7 3 2 6 3 2South Asia 5 4 3 3 5 4 5Sub-Saharan Africa 8 7 9 6 14 8 9
Memo items:Middle-income
countries 152 162 171 156 164 134 121Low-income
countries 19 14 11 6 11 13 14Least developed
countries 3 4 6 4 6 5 6
Note: e � estimate. Numbers may not add up due to rounding.Sources: World Bank, GDF, various years, and World Bank staffestimates for 2003.
marked contrast to the sharp improvement in port-folio equity and debt flows in 2003—and it is takingplace at a time when global FDI is rising. Global FDIflows rose 6 percent in 2003 to an estimated$690 billion, mostly because of the substantial surgein flows to the United States (figure 3.2).2 As a result,developing countries’ share in global FDI droppedto 19.6 percent in 2003 from 22.6 percent in 2002.
The downturn in FDI flows to developingcountries reflects a sharp decline in flows to a few
gdf_076-105.qxd 4/6/04 1:05 PM Page 78

S H I F T I N G F O R M S O F E Q U I T Y F I N A N C E F O R D E V E L O P I N G C O U N T R I E S
middle-income countries, where privatization andcross-border M&A slowed further followingfinancial crises in 2000 and 2001, especially inthe service sector (figure 3.3). In contrast, FDI tolow-income countries remained stable. It alsoappears that the Iraq conflict and the epidemic ofsevere acute respiratory syndrome (SARS) hadlimited impact on FDI in 2003.
The concentration of FDI flows continued todissipate in 2003 (as it has since 2001) despite thecontinuing rise in the share of FDI accounted forby China. The top 10 developing-country recipi-ents of FDI are (in descending order) China, Brazil,Mexico, Argentina, Poland, the Czech Republic,Chile, the República Bolivariana de Venezuela,Thailand, and India.3 These 10 accounted forabout 69 percent of total FDI flows to developingcountries in 2003, down sharply from the peak of78 percent in 2000. FDI as a share of GDP in thetop 10 recipients also fell to 2.4 percent in 2003from 2.8 percent in 2002, but it was still higherthan the average for developing countries (figure3.4). A decline in the concentration of FDI largelyreflects changes in some of the large FDI recip-ients. Four of the top 10 recipient countries—Argentina, Brazil, the Czech Republic, andMexico—experienced a decline in FDI flows of12 percent or more from the previous year. In con-trast, the Russian Federation attracted more FDI—it emerged as the top FDI recipient in Europe and
Central Asia but still was not one of the top 10recipients worldwide.
FDI flows to low-income countries are esti-mated to have been $14 billion in 2003, equivalentto about 1.1 percent of their GDP, up slightly from$13 billion in 2002. The rise can be attributedlargely to the strong performance of India. As a re-sult, the share of the low-income countries in FDIflows to developing countries rose to about 11 per-cent in 2003. Among low-income countries, FDI inthe least developed countries (47 countries as de-fined by the United Nations4) held steady in 2003at an estimated $5.5 billion. Three countries5 thatattract FDI in petroleum and minerals accountedfor much of the rise in FDI flows to this group.
Changes in the regional pattern of FDIThe regional composition of FDI has changed inrecent years. For the third consecutive year, LatinAmerica and the Caribbean accounted for much ofthe fall in FDI flows to the developing world. Theregion’s share in FDI to developing countries fellto one-third during 2001–03 from 43 percent in1997–99 (figure 3.5). Much of the decline in 2003can be ascribed to a significant drop in Brazil(box 3.1) and, to a lesser extent, Argentina. Thepersistent slump in privatization and cross-borderM&A limited FDI in the region, which received noprivatization-related FDI flows in 2003, a signifi-cant slowing from the pace seen in 1998–2000,
79
Privatization
Mergers and acquisitions
Figure 3.3 Privatization and M&A in developingcountries, 1995–2003
$ billions
0
20
40
60
80
100
120
140
1995 19971996 1998 1999 2000 2001 2002 2003
Sources: World Bank, GDF, various years; World Bank, WDI,various years; UNCTAD, World Investment Report, various years;and World Bank staff estimates for 2003.
Figure 3.4 FDI as share of GDP in developingcountries, 1995–2003
Percent
0.0
4.0
3.5
3.0
2.5
2.0
1.5
1.0
0.5
4.5
1995 19971996 1998 1999 2000 2001 2002 2003
Sources: World Bank, GDF, various years; World Bank, WDI,various years; UNCTAD, World Investment Report, various years;and World Bank staff estimates for 2003.
Middle-income countries
Low-income countries
Top 10 recipient countries
gdf_076-105.qxd 4/6/04 1:05 PM Page 79

G L O B A L D E V E L O P M E N T F I N A N C E 2 0 0 4
when the annual average of privatization flowsexceeded $30 billion. But the main reason behindthe slowdown in FDI appears to be the vulnerabil-ity to financial crisis of service-sector FDI (moreon this in the next section).
In contrast to the decline in Latin Americaand the Caribbean, FDI flows into East Asia andthe Pacific remained strong at around $57 billionin 2003. As a result, the East Asia region’s share
of FDI to the developing world rose slightly from38 percent in 2002 to 42 percent in 2003. FDI toChina continued to surge in spite of the SARS epi-demic in early 2003.6 China’s share in regional FDIrose further, to about 94 percent in 2003 from90 percent a year earlier.
FDI flows into Europe and Central Asia fellsharply in 2003 to an estimated $26 billion—although compared to 1997–99 the region’s share
80
Brazil has experienced a sharp decline in FDI inflowsover the past few years. After peaking at $33 billion
in 2000, FDI dropped to $17 billion in 2002 and to$10 billion in 2003. The decline is even more dramaticif the contribution of debt conversion to FDI is excluded(figure at left). Although other countries in Latin Americahave also experienced the decline, the downturn isparticularly marked for Brazil.
Several factors have accounted for the decline in FDIflows to Brazil. The winding down of large-scale privati-zation has been a significant factor. Privatization peakedduring 1997–2000 as the bulk of the telecommunicationand energy companies were sold by the government(figure at right), but an energy crisis in 2001 and electionsin 2002 sharply slowed privatization activities. Between2001 and 2003, privatization proceeds plummeted to$2 billion from an annual average of $19 billion during1997–2000. Weak economic growth has also affectedFDI inflows to Brazil. The growth rate of the Brazilianeconomy slowed to 1.2 percent between 2001 and 2003,
from an average annual rate of more than 4 percentduring 1993–97.
The source of M&A transactions shifted from multi-national companies to local investors.a Local investorshave driven M&A deals in recent years, with local compa-nies buying up the operations of multinationals. In 2003,M&A transactions involving domestic buyers totaled $3.2 billion, about two-thirds of total M&A volumes inBrazil.b For instance, the Brazilian operation of Spanishbank BBVA was purchased in February by Banco Bradesco,the second largest Brazilian bank, for $789 million. Thisshift has resulted in a sharp drop in M&A-related foreigninvestments. Diminished multinationals’ involvement withM&A was in part caused by Brazil’s sluggish economicgrowth, with the global economic slowdown and corpo-rate credit retrenchments contributing as well.
a. See Latin Finance (2003).b. Through mid-October.
Box 3.1 The sharp decline in direct investment in Brazil
35
30
25
20
15
10
5
01999 2000 2001 2002 2003
FDI and privatization inflows to Brazil, 1996–2003
$ billions
40
35
30
25
20
15
10
5
01996
6.2
10.8
26.3
19.0
35.7
28.9
4.2
28.6
10.2
32.8
2.8
22.5
2.2
16.6
10.1
0.0
4.3
1.7
24.3
31.1
4.2
18.3
8.5 8.1
5.2 4.9
1997 1998 1999 2000 2001 2002 2003
Source: Central Bank of Brazil. Source: Central Bank of Brazil.
FDIPrivatization
FDI (excluding conversion)Debt conversion
Brazil’s FDI and debt conversion, 1999–2003
$ billions
gdf_076-105.qxd 4/6/04 1:05 PM Page 80

S H I F T I N G F O R M S O F E Q U I T Y F I N A N C E F O R D E V E L O P I N G C O U N T R I E S
in total FDI to developing countries increased during2001–03. There was a sharp surge in FDI to theRussian Federation and a steady increase in green-field investments. Few major privatization dealswere completed, however, reflecting the end of theprivatization boom for some countries in the region.Flows to the first four EU accession countries (theCzech Republic, Hungary, Poland, and the SlovakRepublic) dropped, mostly due to the unsustainablyhigh flows that were helped by asset sales in theCzech Republic and the Slovak Republic in 2002.
The surge in flows to South Asia was ledmostly by a significant rise in FDI to India.7 India’sshare of FDI flows to the region rose further toabout 80 percent in 2003 from 72 percent a yearearlier. The continued easing of foreign investmentrestrictions in the automobile, private banking,power, and telecommunications sectors con-tributed to the increase. In Pakistan, FDI flows in2003 remained at about the level of 2002. Thebulk of FDI flows to the country was concentrated
in a few preferred sectors such as oil and gas ex-ploration and financial services.
Sub-Saharan Africa experienced a slight in-crease in FDI, receiving an estimated $9 billionin 2003, but FDI flows relative to GDP fell to2.2 percent from 2.5 percent in 2002. Much of therise was due to the continued surge in FDI flows tothe oil sector. Three major oil-exporting coun-tries—Angola, Nigeria, and Sudan—receivedabout half of the FDI flows to the region in 2003.FDI flows to the Middle East and North Africaamounted to an estimated $2 billion in 2003,down by about 24 percent from a year earlier. Theregion received the lowest level of FDI of allregions, accounting for only 1.5 percent of totalFDI flows to developing countries.
A decline in South-South FDIEven though most foreign investment still originatesin developed countries,8 developing countries havebecome active investors in other developingcountries. In 2001 developing countries’ direct in-vestments in other developing countries (known asSouth-South FDI) were estimated at $41 billion,28 percent of total FDI inflows to 30 developingcountries and a significant decline from $49 billionin 2000 (table 3.2).9 FDI outflows from devel-oping countries are notoriously underreported(World Bank 2003); as reported, they declinednearly by half, led by outflows from Brazil, Chile,and South Africa.10 In contrast, Chinese firms—mostly state-owned—invested nearly $7 billionabroad in 2001 in natural resources and services.The Chinese government also is encouragingChinese firms to invest in other Asian countries.Of late, restrictions on outward investments havebeen relaxed, partly to ease the pressure of risinginternational reserves on China’s fixed currencyregime (UNCTAD 2003a). The Russian Federation
81
Figure 3.5 Regional shares in FDI
Percent
Source: World Bank staff estimates.
0
5
10
15
40
35
30
20
25
45
Latin America &the Caribbean
43
33
East Asia& Pacific
3235
Others
1012
Europe &Central Asia
15
20
1997–992001–03
Table 3.2 Estimates of South-South FDI flows to 30 developing countries, 1995–2001$ billions
1995 1996 1997 1998 1999 2000 2001p
From all countries (1) 92.5 111 145.1 145.1 155.2 141.8 146.8From high-income OECD countries (2) 50.7 58.6 69.9 71.6 89.9 83.3 83.5From other than high-income OECD countries (1)�(2) 41.8 52.5 75.2 73.5 65.3 58.5 63.3From high-income non-OECD countries (3) 26.5 27.1 19.2 20.2 18.5 9.9 22.5South-South FDI (1)�(2)�(3) 15.3 25.3 56 53.2 46.9 48.6 40.8Share of total (percent) 16.5 22.8 38.6 36.7 30.2 34.3 27.8
Note: p � projection. The South-South estimates are based on 30 developing countries that account for more than 85 percent of total FDIflows to developing countries. Source: Aykut and Ratha 2003.
gdf_076-105.qxd 4/6/04 1:05 PM Page 81

G L O B A L D E V E L O P M E N T F I N A N C E 2 0 0 4
output is tradable, services are mostly nontradableand require close proximity between producers andconsumers. That is, they are “location-bound.”11
This characteristic makes FDI in services especiallyvulnerable to currency and regulatory risks; itplayed an important role in the decline of FDI overthe last two consecutive years.
Countries have made considerable progress intheir investment and trade policies, opening up theservice sector to foreign participation and provokinga significant shift toward services in the compositionof FDI. That shift came in tandem with significantdevelopments in the service sector during the 1990s,which boosted its share of world GDP to almost70 percent in 2002 from 60 percent in 1990.Among the changes that expanded the share ofservices in global economic activity were incomegrowth in developing countries, technologicalprogress, developments in the financial sector, andchanges in investment and trade policy.
Income growth. The sectoral composition ofFDI mirrors that of GDP in most developing anddeveloped countries (table 3.3). As the demand forservices rose with income level, FDI grew to meetdemand. In Africa, however, service-sector FDI haslagged behind the sector’s share in GDP.
Technological progress in the 1990s helpedincrease services FDI in two ways. First, advancesin transportation and communication technologymade it easier for companies to manage and con-trol geographically dispersed production networksand supply chains. Advanced global productionnetworks raised the demand for business-relatedservices such as distribution networks, transport,
82
Note: Estimated by accumulating available FDI flows by sector.Sectoral FDI data for countries in South Asia are not available.Data taken from country sources. Data definitions may varyaccording to the country’s classification system.a. FDI flows to Africa were approximated by the outflows of thecontinent’s major investors, including France, the Netherlands,the United Kingdom, and the United States.Sources: World Bank staff calculations based on data collectedfrom the U.N. Economic Commission for Latin America and theCaribbean based on country sources for Latin American countries;National Bureau of Statistics of China, various years; ASEAN forother Asian countries; and OECD, UNCTAD, and country sourcesfor East Europe and Central Asia.
0
10
20
30
40
50
60
70PrimaryManufacturing
Services
Developingcountries
14
39
47
Latin America& the
Caribbean
18
27
54
Europe &Central Asia
9
33
58
East Asia& Pacific
5
62
34
Africaa
53
19
29
Figure 3.6 Sectoral composition of FDI stock indeveloping countries in 2002
Percent
Table 3.3 Average share of services in FDI flowsand in GDPPercent
FDI GDP
Services share in:East Asia and Pacific 32 37Europe and Central Asia 58 55Latin America and the Caribbean 55 62Africa 29 52
Memo item:High-income OECD 69 70
Note: Data cover Argentina, Bolivia, Brazil, Bulgaria, Chile,China, Colombia, Costa Rica, the Czech Republic, Ecuador, Estonia, Honduras, Hungary, Indonesia, Kazakhstan, Lao PDR,Malaysia, Mexico, Nicaragua, Paraguay, Peru, the Philippines,Poland, the Russian Federation, the Slovak Republic, Thailand,Trinidad and Tobago, Turkey, the República Bolivariana deVenezuela, and Vietnam.Sources: See figure 3.6.
is the other major source of South-South FDI;Russian FDI is concentrated in the naturalresources and transportation sectors of the coun-tries of the former Soviet Union (UNCTAD 2003b).
The shifting composition of FDItoward services
FDI flows in services rose during the second halfof the 1990s to overtake FDI in manufactur-
ing. By 2002 services accounted for nearly half ofthe FDI stock in developing countries (figure 3.6).As conventionally defined, the service sector in-cludes electricity, gas, water, transport, communi-cation, construction, wholesale and retail tradeand repairs, hotels and restaurants, transport,storage and communications, finance and insur-ance, real estate, renting, business services, publicadministration, defense, education, health, socialservices, social and personal service activities, andrecreational, cultural, and sporting activities. Un-like the primary and manufacturing sectors, where
gdf_076-105.qxd 4/6/04 1:05 PM Page 82

S H I F T I N G F O R M S O F E Q U I T Y F I N A N C E F O R D E V E L O P I N G C O U N T R I E S
storage and communications, and financial ser-vices. Firms that provide those services followedtheir multinational clients into overseas marketsby creating or acquiring subsidiaries (Esperanca1992; Roberts 2001). Second, advances in telecom-munication increased the tradability of some ser-vices, as many multinational companies began tooutsource business to low-wage countries (WorldBank 1994; World Bank 2002b; box 3.2).
Progress in the financial sector. Several devel-opments in the late 1980s and early 1990s encour-aged multinational companies in banking andfinance to move into developing countries. Achange in U.S. law to permit mergers between U.S.commercial and investment banks was one suchdevelopment. Improved instruments for securitiza-tion and hedging helped banks better manage theirinternational risk exposure. And technologicalprogress brought automated teller machines, di-rect funds transfer at points of sale, and remotebanking on a real-time basis; it also helped im-prove both the efficiency and the scope of financialservices (United Nations 2003).
Changes in investment and trade policy. Thecomposition of FDI is influenced by restrictionson ownership, entry, and performance.12 In the1980s developing countries with abundant natural
resources but insufficient capital and technologyencouraged FDI in the primary sector (UNCTAD1998). Other developing countries, especially inAsia, tried to attract export-oriented FDI throughfree-trade zones and export-performance require-ments (UNCTAD 2002). During the last decade,impediments, including restrictions on forms ofinvestment and the degree of foreign ownership,have been gradually eased through unilateral liber-alization policies, bilateral and regional investmentagreements, and commitments under the WorldTrade Organization and the General Agreementon Trade in Services.13
In developed and developing countries alike,services have been liberalized more slowly thanmanufactures (figure 3.7). Government policieswith respect to FDI in services have been influ-enced by considerations of national security andindependence, consumer protection, and ensuringthe provision of public goods.14 In some areas, for-eign participation is constitutionally prohibited orlimited, as in the case of the transmission, distribu-tion, and supply of electricity in Mexico. Becauseof the monopolistic structure of many service mar-kets, designing the necessary regulatory systems hasbeen difficult and costly (World Bank 2001).
Infrastructure and the financial sector at-tracted almost 15 percent of total FDI flows todeveloping countries between 1990 and 2002—more than $215 billion. Almost 70 percent of thatamount went to Latin America, primarily in largeprivatization and M&A deals. Privatization and
83
FDI can flow from business decisions to out-source services. A good example is FDI in in-
formation technology (IT) and business processservices in India. During 1996–2002, India—with its low-cost, English-speaking, and IT-savvy labor force—attracted almost $1 billionin FDI, some of which went into setting up callcenters. In recent years, similar outsourcingby U.S. companies has also benefited LatinAmerica, where the attractiveness of such operations lies in low labor cost, improvedtelecommunication infrastructure, the same timezone, and, in some cases, a language advantagefor companies that serve Spanish-speakingcustomers. Call centers have significant job-creation impact in developing countries. By thesame token, they are attracting opposition fromlabor unions in developed countries.
Box 3.2 FDI for callcenters
Figure 3.7 Indexes of restrictions on FDI inselected sectors of advanced economies
Note: The indicator is calculated based on limits on foreignownership, restrictions on foreign personnel and operationalfreedom, and screening requirements in OECD countries.It ranges from 0 (least restrictive) to 1 (most restrictive).Source: Golub 2003.
0.0
0.1
0.2
0.3
0.4
0.5
0.8
0.9
0.6
0.7
1.01981 1991 1998
Banking ManufacturingTele-communications
0.90
0.72
0.32
0.53
0.30
0.17
0.74
0.61
0.48
0.190.14
0.11
Air transport
gdf_076-105.qxd 4/6/04 1:05 PM Page 83

G L O B A L D E V E L O P M E N T F I N A N C E 2 0 0 4
liberalization of infrastructure services, detailed inchapter 6, began in most developing countries inthe early 1990s, as governments sought to attractcapital and technology and to improve quality andcost-efficiency. The 1990s also saw considerableprogress in capital-account liberalization andfinancial-market reforms in most developing coun-tries. Countries in Latin America, Eastern Europe,and elsewhere removed barriers to entry and otherimpediments for foreign banks as part of theprocess of liberalizing their financial markets.15 InAsia such changes were especially rapid after thefinancial crisis of 1997–98.
FDI in wholesale and retail trade also pickedup during the last decade as developing countriesliberalized their import regimes and eliminatedprice controls and restrictions on foreign partici-pation. Highly populated areas with increasingpurchasing power have become attractive destina-tions for firms operating in mature markets.
In some cases, ownership restrictions had un-expected effects on sectoral FDI flows. In China, forexample, more than 10 percent of all FDI receivedduring 1997–2002 went into real estate. One rea-son is that foreigners are prohibited from owningland, all of which belongs to the state or the collec-tives. Foreign investors may obtain land-use rightsonly by buying B-shares in China’s real estate com-panies or by providing finance to joint ventureswith local partners (Tse 2001; Zhang 1999). Be-cause of the restrictions, the real estate expenses offoreign individuals and companies in China arecounted as FDI.
Recent declines in FDI flows to the service sector Just as the rise in FDI flows in the late 1990s wasdriven by investments in services, its decline overthe past two years has been due largely to develop-ments in the service sector—primarily in LatinAmerica and the Caribbean. FDI flows to theregion’s service sector fell by 53 percent in 2002(figure 3.8). The decline was especially sharp ininfrastructure (37 percent) and financial services(65 percent). Although precise sectoral data arenot available, anecdotal evidence suggests that thetrend in the service sector continued in 2003.
In addition to the winding down of privatiza-tion, service-sector FDI in Latin America was af-fected by deterioration of the investment climatein the region. First, starting with Argentina and
Brazil, almost all currencies in the region suffereddepreciation. Lower local-currency earnings fromdirect investments in the service sector severelyaffected foreign firms, which had financed theirexpansion using foreign-currency debt. More im-portant, the policy changes in Argentina followingthe almost 200 percent devaluation of the pesobetween 2001 and 2002 prompted many directinvestors in banking and infrastructure to revisittheir business strategies toward the region (IMF–World Bank 2003). Following the crisis, theArgentine government enforced an asymmetricconversion of U.S. dollar–based assets and liabili-ties into pesos (pesification) and a mandatoryrescheduling of term deposits. In addition, thegovernment converted U.S. dollar–denominatedcontracts of private and public utilities into pesosat an exchange rate of 1 peso per U.S. dollar, whilenot allowing public utility rates to rise. Followingthese policies, most foreign companies cut backfinancial support to their affiliates in the country,postponed new investments, repatriated profits,and paid back intercompany loans. Some compa-nies tried to find new strategic partners, while afew others sold off their assets.16
In contrast to the service sector, FDI in the pri-mary and manufacturing sectors did not decline asmuch following the devaluation in Argentina andBrazil. Indeed, many auto companies increasedFDI in these countries as they reoriented their salestoward exports (United Nations 2003). Even in theservice sector, investment in the software industry
84
Figure 3.8 The recent decline in FDI in the LatinAmerican service sector
$ billions
Sources: See figure 3.6.
0
10
20
30
40
50
60
70
802001 2002
Services ServicesManu-facturing
Primary PrimaryManu-facturing
Developing countries Latin America & the Caribbean
17.612.8
51.2
58.4
71.7
50.5
8.9 6.713.3 13.4
39.8
18.6
gdf_076-105.qxd 4/6/04 1:05 PM Page 84

S H I F T I N G F O R M S O F E Q U I T Y F I N A N C E F O R D E V E L O P I N G C O U N T R I E S
picked up in Argentina to take advantage of lowercosts following the currency devaluation.
Because it relies primarily on domestic de-mand, FDI in services is highly sensitive to changesin the investment climate (for example, regulatoryenvironment or the exchange rate), whereas theprimary and manufacturing sectors have the bene-fit of exporting to international markets. Accord-ing to data for 1999–2002, countries with a betterinvestment climate attracted not only more FDI,but also more FDI in services. For example, theshare of services FDI in total FDI was 61 percent incountries with a better-than-average investmentclimate, compared to 34 percent in countries witha below-average investment climate (table 3.4).According to a recent IMF–World Bank survey(2003), companies concerned about the recentdeterioration of investment climate in some devel-oping countries plan to rely more on local-currency
borrowing as a way of hedging against exchange-rate fluctuations.17 To hedge against regulatoryrisks, many companies are trying to obtain inter-national arbitrage agreements or political riskinsurance (box 3.3).
85
Table 3.4 FDI in services, by investment climate inselected economiesPercent
Services FDI Services FDI Total FDIInvestment as share of as share of as share ofclimate total FDI GDP GDP
High 61 3.9 6.4Average 42 1.5 3.6Low 34 0.6 1.6
Note: All averages are weighted averages for 1999–2002. Whereavailable, ratings from the 2000 Country Policy and InstitutionalAssessment are used to measure the investment climate in 30 devel-oping countries in Asia, Eastern Europe, and Latin America.Source: World Bank staff calculations.
Recent financial crises in several developing countriesonce again have underscored the importance of politi-
cal risk insurance (PRI) for foreign direct investment. Thedemand for political risk insurance in countries such as Indonesia and Philippines increased significantly followingthe Asian crisis (Wagner 2002). Demand for PRI also hassimilarly risen recently in several Latin American countriesfollowing the Argentine crisis (IMF–World Bank 2003).
Political risk insurance typically covers risks ofexpropriation, currency inconvertibility, war and civil dis-turbance, and breach of contract. Private insurers accountfor 50 to 60 percent of the market. The rest is dividedamong national export agencies and the Multilateral Investment Guarantee Agency (MIGA), which has a smallbut growing share of the PRI market (4–6 percent). Inaddition to insurance, export credit agencies providegovernment-backed loans and guarantees to corporationsfrom their home countries that seek to do business indeveloping countries. MIGA, on the other hand, does notprovide loans but supports investments from its membercountries in developing countries belonging to MIGA.
Major private insurers include Lloyd’s of London,AIG, and Sovereign. Major national agencies (in terms ofpremium generation) include OPIC in the United States,NEXI in Japan, EDC in Canada, COFACE in France, andHERMES in Germany.
The advantages that public agencies offer include longperiods of coverage (up to 20 years), wide country coverage,
and stable premia and capacity. Multilateral agencies suchas MIGA may sometimes use their good offices to mediatedisputes between host-country governments and foreign direct investors. Also, private PRI insurers usually do not offer coverage in high-risk countries without the involvement of public insurers. On the other hand, theprocessing time in public agencies can be quite long.
The key advantage of private insurers is their under-writing flexibility. Many underwriting criteria (such as nationality of the insured, development impact of the investment, and status of investment) used in government-sponsored insurance programs do not apply to commercialmarket placements. Instead, private insurers may tailor expropriation coverage to clients’ needs, covering licenserestrictions and sanctions, forced withdrawal orders by the home government, forced divestiture, and implementa-tion of domestic content or other trade restrictions notnormally insurable under government-sponsored programs.
Private providers of PRI collect an annual premiumranging from 0.25 to 3 percent. Coverage for currencyinconvertibility is usually the most expensive. The coststructure of public issuers varies with the type and locationof the project, as well as its duration and sector. Nationalagencies are often preferred where available, indicatingthat their prices are competitive.
Over the past few years, capacity of private PRIproviders seems to have diminished following severalcatastrophic events worldwide.
Box 3.3 Political risk insurance
gdf_076-105.qxd 4/6/04 1:05 PM Page 85

G L O B A L D E V E L O P M E N T F I N A N C E 2 0 0 4
The composition of FDI financingEven if direct investors seek to maximize returnsover the long run, they may change their exposureto a country in the short run by altering the compo-sition of their investment (box 3.4). In Asia, multi-national companies adjusted their investmentsfollowing the financial crises of 1997–98. Interna-tional banks and infrastructure companies recentlyreduced their exposure to Argentina and Brazil bycalling back intercompany loans and increasingrepatriated earnings. In some cases they divested byselling out their equity holdings. Nevertheless, by
86
According to the International MonetaryFund’s Balance of Payments Manual (1993)
and the Organisation for Economic Co-operationand Development’s Benchmark Definition ofForeign Direct Investment (1999), FDI comprisesequity investment, reinvested earnings (earningsnot distributed as dividends and earnings ofbranches not remitted to the direct investor), andintercompany debt transactions. Intercompanydebt transactions include the borrowing andlending of funds, including debt securities andtrade credits, between parent and subsidiariesand among subsidiaries. Unfortunately, manycountries do not compile the data according to the official guidelines, and there has been significant underreporting of FDI in developingcountries (World Bank 2003).a Some countriesreport only total equity capital and reinvestedearnings without further breakdown.
For 32 developing countries that reportdata, equity capital contributed more than two-thirds of FDI flows to developing countries, andreinvested earnings and intercompany loanscontributed about 15 percent each during1995–2002. Reinvested earnings are most likelyunderestimated in some large recipient countriessuch as Brazil and India, however. In fact, ac-cording to U.S. data, almost 45 percent of U.S.investments in developing countries are in theform of reinvested earnings.
a. Countries compile the FDI composition data through annualsurveys (Falzoni 2000). In the IMF’s balance-of-payments data-base, out of 140 developing countries in 2000, the number thatreported equity capital, reinvested earnings, and intercompanyloans were 97, 62, and 71, respectively.
Box 3.4 Components of FDI
Figure 3.9 Repatriated earnings and calledintercompany loans in Argentina and Brazil
$ billions
�5
0
20
15
10
5
Inter-company
loans
Inter-company
loans
Equitycapital
Equitycapital
Reinvestedearnings
Argentina Brazil
Reinvestedearnings
Source: IMF Balance of Payments Statistics Database.
2001 2002
4.5
1.0
18.817.1
3.7
�2.5
�0.5
4.2
�3.3
�0.9
Figure 3.10 Composition of FDI flows indeveloping countries, 1995–2002
$ billions
Source: IMF Balance of Payments Statistics Database.
0
20
40
120
60
80
140
160
180
100
1995 1996 1997 1998 1999 2000 2001 2002
Intercompanyloans
Reinvestedearnings
Equity capital
and large, equity proved more resilient than inter-company debt and reinvested earnings (figure 3.9).18
An examination of the composition of FDI interms of equity, reinvested earnings, and intercom-pany debt reveals that in 1990–2002, more thantwo-thirds of FDI flows to developing countriescame in the form of equity capital; the rest wasalmost equally divided into reinvested earningsand intercompany loans (figure 3.10). The propor-tions differ, however, across sectors and regions;
gdf_076-105.qxd 4/6/04 1:05 PM Page 86

S H I F T I N G F O R M S O F E Q U I T Y F I N A N C E F O R D E V E L O P I N G C O U N T R I E S
intercompany loans, for example, were notablyhigher in the extractive sector.
The composition of FDI varies among differ-ent regions (table 3.5). Equity capital flows domi-nated other components of FDI in Latin Americabecause most of these flows came in through M&Aactivity. On the other hand, in East Asia and thePacific, where data are skewed toward China, rein-vested earnings were significant. In regions whereextractive industries receive a considerable amountof FDI, the share of intercompany loans is higher.
The resilience of FDI can be traced to itsequity component, which reflects the long-termstrategic behavior of foreign direct investors. Incontrast to the relatively stable equity component,intercompany loans and reinvested earnings wereoften used in 1990–2002 as a means to adjust FDIexposure; they were nearly as volatile as debtflows.19 During a crisis in a host country, repayingloans or repatriating earnings is often easier thanwinding down direct equity. Also, a direct equityholding usually reflects a long-term strategic com-mitment and may not change immediately follow-ing a crisis—although it may change if the crisis isprolonged. This can be seen from the experienceof some countries that recently faced financialcrises, where the decline in intercompany loansfollowing the crisis was significantly larger thanthe decline in the equity component of FDI (fig-ure 3.11). In the case of Thailand, intercompanyloans fell 85 percent between 1997 and 1999, butthe equity component of FDI actually rose 62 per-cent during the same period. Data on retainedearnings are hard to obtain, but available datasuggest that in Latin America, excluding Mexico,intercompany loans fell to �$1.3 billion in 2002(that is, loans were repaid) from $7 billion in2001, a decline of nearly 118 percent. In contrast,
87
Table 3.5 Composition of FDI by region, 1995–2002Percent
Equity Reinvested IntercompanyRegion capital earnings loans
All 71 15 14East Asia and Pacific 65 25 10Europe and Central Asia 65 12 23Latin America and the Caribbean 75 11 14Middle East and North Africa 69 2 29Sub-Saharan Africa 74 10 16
Note: All averages are weighted averages for 1995–2002. FDI com-position data for countries in South Asia are not available.Source: IMF Balance of Payments Statistics Database.
Figure 3.11 Decline of intercompany loans versusequity component of FDI during financial crises
Percent
�500
�400
�300
�200
�100
0
100
Indonesia(1997–99)
�119
�64
�3
�464
�43�54
Thailand(1997–99)
Argentina(2000–02)
Brazil(2000–02)
Mexico(1994–96)
Intercompany loans
Equity capital
Source: IMF Balance of Payments Statistics Database.
�330
�63�85
62
�10
�5
0
10
5
15
20
Figure 3.12 Intercompany loans and private debtflows in Brazil, 1990–2002
$ billions
N ote : Long-term private debt includes nonguaranteed debt onlySources : IMF Balance of Payments Statistics Database andWorld Bank 2003.
1990 1992 1994 1996 1998 2000 2002
Intercompanyloans
Long-termprivate debt
equity capital fell only 20 percent and retainedearnings by half.
Indeed, the intercompany loans component ofFDI may be subject to the same degree of volatilityas international debt flows. For example, in Brazil afairly strong correlation between the intercompanyloan component of FDI and international debtflows (bonds and bank loans) has been observed inrecent years (figure 3.12). Also, in Indonesia, the
gdf_076-105.qxd 4/6/04 1:05 PM Page 87
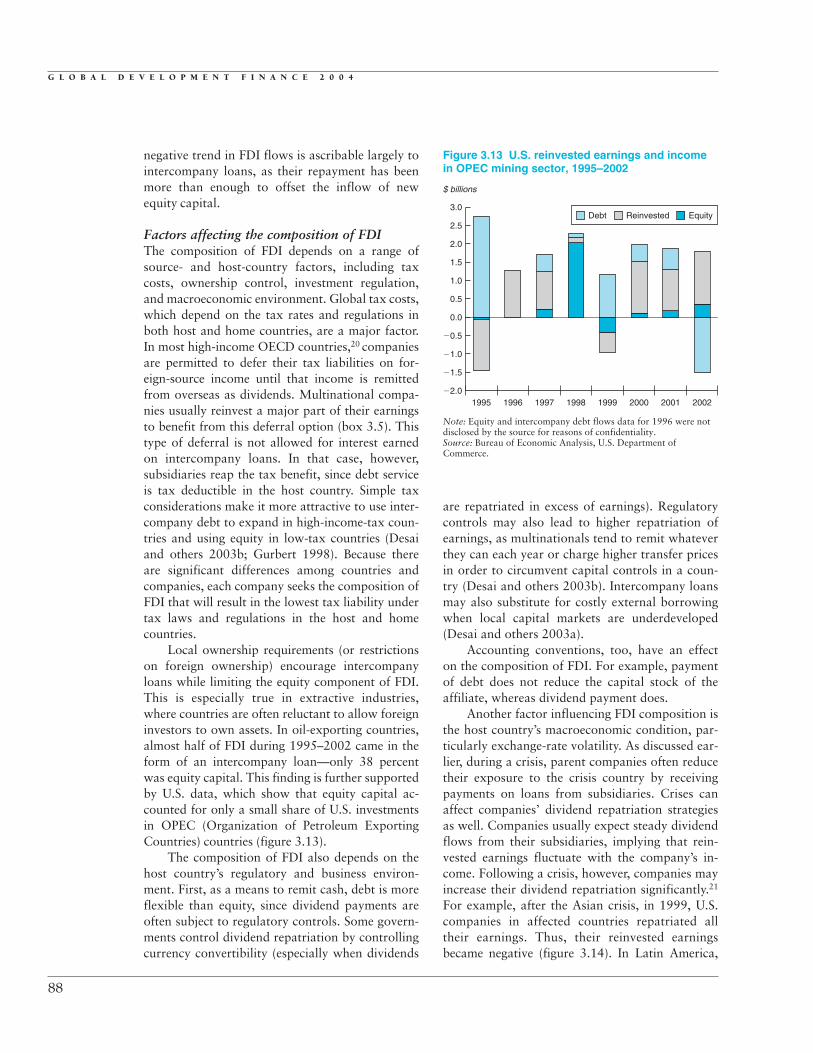
negative trend in FDI flows is ascribable largely tointercompany loans, as their repayment has beenmore than enough to offset the inflow of newequity capital.
Factors affecting the composition of FDIThe composition of FDI depends on a range ofsource- and host-country factors, including taxcosts, ownership control, investment regulation,and macroeconomic environment. Global tax costs,which depend on the tax rates and regulations inboth host and home countries, are a major factor.In most high-income OECD countries,20 companiesare permitted to defer their tax liabilities on for-eign-source income until that income is remittedfrom overseas as dividends. Multinational compa-nies usually reinvest a major part of their earningsto benefit from this deferral option (box 3.5). Thistype of deferral is not allowed for interest earnedon intercompany loans. In that case, however,subsidiaries reap the tax benefit, since debt serviceis tax deductible in the host country. Simple taxconsiderations make it more attractive to use inter-company debt to expand in high-income-tax coun-tries and using equity in low-tax countries (Desaiand others 2003b; Gurbert 1998). Because thereare significant differences among countries andcompanies, each company seeks the composition ofFDI that will result in the lowest tax liability undertax laws and regulations in the host and homecountries.
Local ownership requirements (or restrictionson foreign ownership) encourage intercompanyloans while limiting the equity component of FDI.This is especially true in extractive industries,where countries are often reluctant to allow foreigninvestors to own assets. In oil-exporting countries,almost half of FDI during 1995–2002 came in theform of an intercompany loan—only 38 percentwas equity capital. This finding is further supportedby U.S. data, which show that equity capital ac-counted for only a small share of U.S. investmentsin OPEC (Organization of Petroleum ExportingCountries) countries (figure 3.13).
The composition of FDI also depends on thehost country’s regulatory and business environ-ment. First, as a means to remit cash, debt is moreflexible than equity, since dividend payments areoften subject to regulatory controls. Some govern-ments control dividend repatriation by controllingcurrency convertibility (especially when dividends
are repatriated in excess of earnings). Regulatorycontrols may also lead to higher repatriation ofearnings, as multinationals tend to remit whateverthey can each year or charge higher transfer pricesin order to circumvent capital controls in a coun-try (Desai and others 2003b). Intercompany loansmay also substitute for costly external borrowingwhen local capital markets are underdeveloped(Desai and others 2003a).
Accounting conventions, too, have an effecton the composition of FDI. For example, paymentof debt does not reduce the capital stock of theaffiliate, whereas dividend payment does.
Another factor influencing FDI composition isthe host country’s macroeconomic condition, par-ticularly exchange-rate volatility. As discussed ear-lier, during a crisis, parent companies often reducetheir exposure to the crisis country by receivingpayments on loans from subsidiaries. Crises canaffect companies’ dividend repatriation strategiesas well. Companies usually expect steady dividendflows from their subsidiaries, implying that rein-vested earnings fluctuate with the company’s in-come. Following a crisis, however, companies mayincrease their dividend repatriation significantly.21
For example, after the Asian crisis, in 1999, U.S.companies in affected countries repatriated alltheir earnings. Thus, their reinvested earningsbecame negative (figure 3.14). In Latin America,
G L O B A L D E V E L O P M E N T F I N A N C E 2 0 0 4
88
1995 1996 1997 1999 2000 2001 20021998
Note: Equity and intercompany debt flows data for 1996 were notdisclosed by the source for reasons of confidentiality.Source: Bureau of Economic Analysis, U.S. Department ofCommerce.
3.0
2.5
2.0
1.5
1.0
0.5
0.0
�0.5
�1.0
�1.5
�2.0
Figure 3.13 U.S. reinvested earnings and incomein OPEC mining sector, 1995–2002
$ billions
Debt Reinvested Equity
gdf_076-105.qxd 4/6/04 1:05 PM Page 88

S H I F T I N G F O R M S O F E Q U I T Y F I N A N C E F O R D E V E L O P I N G C O U N T R I E S
89
Three sets of factors affect the dividend behavior ofmultinational companies: corporate governance, tax
implications, and host-country factors. There is a vastamount of literature on the sensitivity of the optimaldividend-payout ratio (the ratio of dividends to earnings)to corporate governance and international tax rates.Studies that cast these issues in an international macro-economic context, however, are limited.
Corporate governance: The literature on corporategovernance implies that dividends tend to persist from one year to the next. Two lines of reasoning are fol-lowed to identify the optimal dividend. First, in an environment where managers know more than others doabout the firm’s profitability and prospects (asymmetricinformation), the dividend reveals that information to the market (Miller and Rock 1985; John and Williams1985). Several studies show that a positive change in dividends is usually associated with positive stock returns (Healy and Palepu 1988; Asquith and Mullins1983; Aharony and Swary 1980). Because of this, Lintner(1956) argues that managers try to smooth out the dividend payments because they fear that cuts will sendnegative signals. In fact, Fama and Babiak (1968) find empirical support for dividend smoothing. There is a foreign bias, however, in the link between the dividendand stock returns. Investors do not value the foreign operations of multinational companies as highly as thedomestic (Christophe and Pfeiffer 2002; Denis and others 2001). In addition, Christophe (2002) shows thatinvestors often penalize a negative change in dividendsfrom foreign operations more harshly than domesticoperations, partly because investors believe that foreignoperations have higher sunk costs.
A second line of reasoning regards discipliningmanagers, who have incentives to cause firms to growbeyond an optimal size (agency conflict) so as to gainpower over increased resources (Jensen 1986) and toincrease compensation, which is usually associated withthe size of firms (Murphy 1985). When subsidiaries arepartially owned or the host country has a weak judicialsystem, U.S. firms tend to repatriate more as controlbecomes more problematic (Desai and others 2003c).A steady dividend payment implicitly determines theproportion of FDI earnings to be reinvested and thereforeunderlines the sensitivity of reinvested earnings to incomefluctuations.
Repatriation tax: A vast literature—mainly usingdata on U.S. multinational firms—demonstrates thatdividend payments are sensitive to repatriation taxes.Desai and others (2002) show that U.S. repatriation taxesreduced aggregate dividends by more than 13 percentbetween 1982 and 1997. In most high-income OECDcountries, companies are permitted to defer their taxliabilities on foreign-source income until that income isremitted as dividends from overseas. In addition, somecountries also permit companies to claim tax credits fortaxes paid to the foreign governments. Multinationalcompanies have developed various strategies to reducetheir global tax costs. In essence, they tend to reinvesttheir earnings to benefit from the deferral option.Then, they use this capital either in affiliates’ operationsor in their global operations by transferring it throughvarious financial channels (Altshuler and Grubert 2003).Because of a large account deficit and a slowdown in FDIinflows last year, the U.S. Congress is now considering atemporary break on repatriation taxes (the HomelandInvestment Act). If the act passes, it is expected to bringback significant amounts of capital as dividends. U.S.reinvested earnings abroad are estimated at $500 billiondollars for the companies making up the S&P 500(mostly manufacturing and pharmaceutical companies).According to a J.P. Morgan survey (2003), the HomelandInvestment Act could bring back earnings, in the form ofdividends, ranging from $265 billion to $375 billion.
Host-country factors: The literature on host-countryfactors affecting the repatriation of dividends is very lim-ited. In a recent study, Lehmann and Mody (2004) showthat payout ratios can be sensitive to host-country factorssuch as political risk, tax rates, and country growth rates,although reactions vary with the nationality of the in-vestors. Their analysis of the data from Germany, theUnited Kingdom, and the United States indicates that U.K.firms have the highest payout ratio of the three countries,and the ratio declines as a country becomes politically safer.Also, the U.K. payout ratio increases with higher growthand higher income. In contrast, German and U.S. investorsare less likely to change their payout ratios with politicalrisk, tending instead to view growth as an opportunity toretain earnings for further investment in the host country.In addition, higher host-country tax rates raise payout ra-tios for Germany and the United Kingdom, but not for U.S. investors.
Box 3.5 Factors affecting dividend repatriation
gdf_076-105.qxd 4/6/04 1:05 PM Page 89

G L O B A L D E V E L O P M E N T F I N A N C E 2 0 0 4
starting in 2001, U.S. companies again increasedtheir dividend flows, although their incomestayed almost the same (figure 3.14, lower panel).In fact, for the last two years all multinationals inArgentina repatriated dividends drastically inexcess of their earnings, leading to nearly $2 billionin repatriation of capital from the country.
Trends in portfolio equity flows todeveloping countries
Portfolio equity flows are distinct from FDIflows in that they are motivated not by a long-
term interest in controlling the destination firmbut by financial returns.22 FDI investors are multi-national companies, whereas the main investors inemerging-market equity are large mutual fundsand privately held hedge funds. Portfolio equityinvestment takes place when investors purchaseshares of a company through an internationalpublic offering (IPO), or buy American or globaldepositary receipts (ADRs or GDRs).23 To a lesserextent, venture capital investments and convertiblebonds that give investors an option to convert toequity at a later date are used as vehicles for port-folio equity flows.24
Net portfolio equity flows to developingcountries—comprising gross flows through IPOs,ADRs, and GDRs, and net purchases of stocks inthe secondary market—rose sharply in 2003 toan estimated $14.3 billion from $4.9 billion in2002 (table 3.6 and figure 3.15). The top 20 coun-tries received $16.1 billion of portfolio equityflows in 2003, compared to $7.1 billion in 2002.The surge in flows in 2003 was driven largely by adramatic increase in flows to India (and, to a lesserextent, China). This increase was offset partly byan outflow of nearly $2 billion from Ukraine forthe second year in row.25
The significant expansion in 2003 was com-mensurate with the rise of more than 50 percentin emerging-market stock indexes from their de-pressed 2002 levels (figure 3.16). A general recov-ery in the emerging-market economies, therefore,stimulated portfolio equity flows—helped by lowinterest rates worldwide. Portfolio equity flows toArgentina, Brazil, South Africa, and Turkey alsowere helped by the stabilization of exchange rates,following recent devaluation. Investor sentimenttoward emerging-market equity remains cautious,
90
Distribution of U.S. earnings in East Asia and the Pacific
$ billions
Distribution of U.S. earnings in Latin America and the Caribbean
$ billions
Figure 3.14 U.S. reinvested earnings and incomein selected regions, 1995–2002
Proportion of FDI earnings reinvested by U.S. firms, by region,1995–2002
Percent
�10
0
10
20
30
40
50
60
70
1995 1996 1997 1998 1999 2000 2001 2002
1995 1996 1997 1998 1999 2000 2001 2002
Latin America &the Caribbean
East Asia & Pacific
0
2
4
6
8
10
12
14
16
1995 1996 1997 1998 1999 2000 2001 2002�1
0
1
2
3
4
5
6
7
Source: Bureau of Economic Analysis, U.S. Department of Commerce.
Dividend Reinvested
Dividend Reinvested
Developingcountries
gdf_076-105.qxd 4/6/04 1:05 PM Page 90

S H I F T I N G F O R M S O F E Q U I T Y F I N A N C E F O R D E V E L O P I N G C O U N T R I E S
but less so than in recent years. Two majorevents—the Iraq war and the SARS outbreak inAsia—had little effect on flows.
Net portfolio equity flows to South Asia rosedramatically in 2003, mainly in response to opti-mism about growth in India. Flows to East Asiaand the Pacific also rose sharply because of a sharpincrease in activity to China—notably the ChinaLife transaction, valued at more than $3 billion.Latin America and the Caribbean received aboutthe same amount of portfolio equity in 2003 as lastyear. Flows appear to have increased in Argentinaand Chile from negative levels last year, and to
have remained unchanged in Brazil,26 reflectingthe effects of interest rate cuts, stabilization of theexchange rate, and incipient recovery in the econ-omy. The stabilization in portfolio equity flows toBrazil also reflects a pause in the migration of localcompanies to international exchanges (see the fol-lowing section). Net portfolio equity flows toEurope and Central Asia rose only modestly, dueto a sharp fall in flows to the Russian Federation.The Yukos controversy in the last quarter of the
91
Table 3.6 Net inward portfolio equity flows to developing countries, 1995–2003$ billions
1995 1996 1997 1998 1999 2000 2001 2002 2003e
All developing countries 17.3 32.9 22.6 6.6 12.6 12.6 4.4 4.9 14.3Top 20 countriesa 15.8 31.4 20.7 5.2 12.1 12.2 4.6 7.1 16.1
East Asia and Pacific 6.3 9.7 �3.9 �3.4 2.3 4.8 1.0 3.5 4.8China 0.4 1.9 5.7 0.8 0.6 6.9 0.8 2.2 3.0
Europe and Central Asia 1.7 4.3 4.0 4.0 2.0 1.2 0.3 �0.4 0.7Top 5 countries 0.5 3.5 2.9 2.5 1.4 0.8 0.3 1.6 2.4
Latin America and the Caribbean 4.8 12.2 13.3 �2.2 �3.6 �0.5 2.3 1.5 1.4Brazil 2.8 5.8 5.1 �1.8 2.6 3.1 2.5 2.0 2.2
South Asia 1.6 4.1 2.9 �0.6 2.4 2.8 1.9 1.0 7.0India 1.6 4.0 2.6 �0.6 2.3 2.8 2.0 1.0 7.0
Sub-Saharan Africa 3.0 2.5 5.6 8.7 9.0 4.1 �1.0 �0.4 0.5South Africa 2.9 2.4 5.5 8.6 9.0 4.2 �1.0 �0.4 0.5
Middle East and North Africa 0.0 0.2 0.6 0.1 0.7 0.2 �0.1 �0.2 0.0
Note: e � estimate. Numbers may not add up due to rounding.a. Argentina, Brazil, Chile, China, Colombia, the Arab Republic of Egypt, Hungary, India, Indonesia, Lithuania, Malaysia, Mexico, Morocco,Philippines, Poland, the Russian Federation, South Africa, Thailand, Turkey, and the República Bolivariana de Venezuela.Source: World Bank data based on information from IMF Balance of Payment Statistics Database, national sources, and market sources.
Figure 3.15 Portfolio equity flows, 1990–2003
$ billions
0
10
20
30
40
50
1990 1992 1994 1996 1998 2000 2002
Sources: Dealogic Bondware, Morgan Stanley, and World Bank staffestimates.
Gross flows
Net flows
Note: The discontinuity in the gross flows data is intentional. Twohuge deals involving China Mobile in 2000 are treated as outliersin this representation of the relationship between portfolio equityflows and stock prices.Sources: Dealogic Bondware, Morgan Stanley, and World Bankstaff estimates.
Figure 3.16 Gross equity flows to developingcountries and emerging-market stock prices
Three-month moving average (dollars) MSCI
5,000
4,500
4,000
3,500
3,000
2,500
2,000
1,500
1,000
500
0
600
500
400
300
200Jan. 1995 Jan. 1997 Jan. 1999 Jan. 2001 Jan. 2003
MSCI(right axis)
Gross flows(left axis)
gdf_076-105.qxd 4/6/04 1:05 PM Page 91

G L O B A L D E V E L O P M E N T F I N A N C E 2 0 0 4
year raised concerns about government interfer-ence in the privatized entities, sapping interna-tional portfolio equity. Net portfolio equity flowsto Sub-Saharan Africa benefited from a markedeconomic recovery in South Africa. The MiddleEast and North Africa continued to rely on debtfinancing.
Gross portfolio equity flowsGross international equity placements in developingcountries rose to $19 billion in 2003 from $11 bil-lion in 2002 (see figure 3.15). Thus, the increase innet flows described above seems to have occurredthrough both primary and secondary markets. His-torically, gross equity flows and stock prices havebeen strongly correlated (see figure 3.16). The recentrise in stock prices in emerging markets implies,therefore, that gross flows may rise further in com-ing months. Indeed issuance activity increasedsharply in December 2003, following buoyant stockmarket activity.
Firms in the service sector accounted forabout half of the gross flows in 2003 (figure 3.17).Some of the top deals in terms of volume of is-suance were by insurance companies and banks(see annex B). Firms in the telecommunicationsand information technology sectors also came tothe market to benefit from the rise in the tech-dominated NASDAQ. Interestingly, U.S. dollarissues accounted for less than 15 percent of totalissuance in 2003. Equity issuance in Hong Kongamounted to 34 percent of the total, as Chinesecompanies raised financing through the HongKong stock exchange (figure 3.18). Issues were de-nominated in several other currencies as well, indi-cating significant cross-listing of emerging-marketfirms in foreign stock exchanges.
Cross-listing and delisting of stocksIn any given year, it is common to find many in-stances of emerging-market firms listing in largerand better-regulated stock exchanges, either bycross-listing or delisting from smaller exchanges.Gaining access to a wider investor base—andcheaper capital—is one of the major incentives be-hind the practice. Another is low trading costs inexchanges that have efficient trading and clearingsystems (Pulatkonak and Sofianos 1999). Becauseinternational stock exchanges have stringent re-quirements for reporting and for protection ofminority shareholder rights, listing abroad gives
firms a mark of quality and hence greater access tointernational equity funds.
Whether a firm chooses to access the interna-tional market by issuing depositary rights, cross-listing in more than one exchange, or migrating toanother exchange, the result is an increase in inter-national portfolio equity flows to the country wherethe firm is domiciled. The effect on local equityflows may vary, however. Issuing ADRs or cross-listing may not affect local market flows, but migra-tion to another exchange (which involves delistingfrom one’s own exchange and listing elsewhere)decreases liquidity in the local market (Levine andSchmukler 2003). For example, in Brazil interna-tional flows were inversely related to local flows inthe last four years. Local flows were negative during2000–02 and turned positive in 2003, whereas in-ternational flows were positive but declined duringthis period. The decrease in liquidity may adversely
92
Figure 3.17 Sectoral compositionof gross flows in 2003
Source: Dealogic Bondware.
Metals andmining 4%
Telecomsand IT21%
Energy, oil,and gas 2%
Engineering andelectrical 9%
Others42%
Banking andfinance
22%
Figure 3.18 Currency compositionof gross flows in 2003
Source: Dealogic Bondware.
Sterling 1%
Singaporedollar 2%
Thai baht9%
U.S.dollar14%
Others40%
Hong Kong dollar34%
gdf_076-105.qxd 4/6/04 1:05 PM Page 92

S H I F T I N G F O R M S O F E Q U I T Y F I N A N C E F O R D E V E L O P I N G C O U N T R I E S
93
100
187
400
319
100
184
546
309
100 8358 42
Source: Bloomberg.
S&P 500 DJ Stoxx 50 Nikkei
Figure 3.20 Stock market performance in theUnited States, Europe, and Japan
Indexed, 1990 � 100
0
200
100
400
300
500
6001990 2000
1995 2003
affect small firms’ ability to raise funding in thedomestic stock market. That can, in turn, reduceinternational equity flows to these firms.
An examination of historical stock listing datareveals an interesting pattern: stock delisting con-tinued in Latin America and the Caribbean andEurope and Central Asia, but not in East Asia andthe Pacific (figure 3.19). The reason appears to bethe proximity of the first two to buoyant Americanand European stock markets, which performedwell over the 1990s, attracting firms in nearbyemerging markets.27 Exchanges in Tokyo, however,and to a lesser extent, Hong Kong, the naturalcandidates for migration in Asia, have not donewell in recent years (figure 3.20).28
Another reason behind delisting in Europe andCentral Asia (especially in the Czech Republic andthe Slovak Republic) is the effect of voucher privati-zation in the early 1990s, which suddenly gave riseto a large number of firms—in excess of 1,000—being listed in the local stock exchanges. The stocksof most of these companies did not trade for years;by the mid-1990s, many companies delisted fromthe Prague and Bratislava stock exchanges.
Privatization and portfolio equity flowsPrivatization, commonly associated with FDIflows, also has sizeable effects on portfolio equityflows. Indeed, privatization-related portfolioequity flows have always been large (figure 3.21).During 1990–96, gross equity issuance by publicsector companies exceeded that of private firms.
Argen
tina
Brazil
Chile
Colom
bia
Mex
icoPer
u
R. B. d
e
Vene
zuela
Figure 3.19 Number of listed stocks on selecteddeveloping-country exchanges, by region
Note: Figures are end-of-year values. For 2003, data are as ofNovember. Data for 1990 for Hungary and Poland correspondto 1991. Data for 1995 for Russia, the Slovak Republic, andSlovenia correspond to 1996.Source: Emerging Markets Database.
0
200
100
300
400
500
6001990 2000
1995 2003
China
Indo
nesia
Mala
ysia
Philipp
ines
Korea
, Rep
. of
Thaila
nd
South and East Asia
0
300
600
900
1,200
1,500
Czech
Repub
lic
Hunga
ry
Poland
Russia
n
Fede
ratio
nSlov
ak
Repub
licSlov
enia
Turk
ey
Eastern Europe
0
200
400
600
800
1,000
Latin America
gdf_076-105.qxd 4/6/04 1:05 PM Page 93
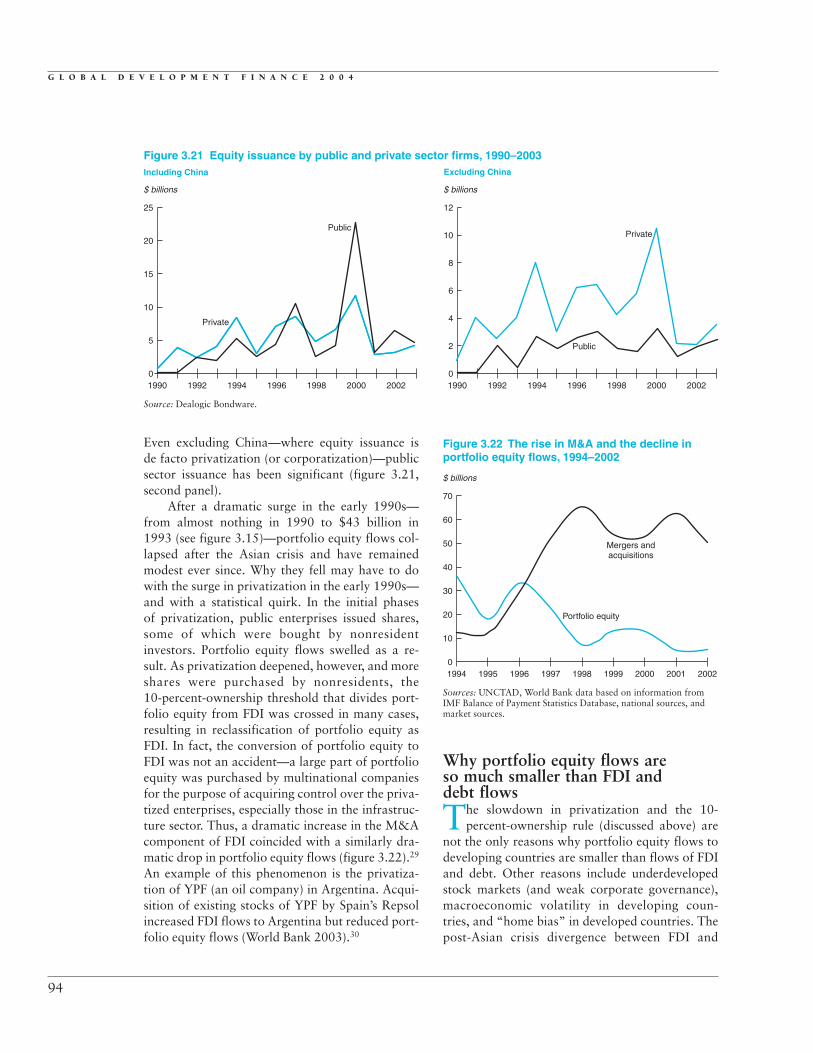
G L O B A L D E V E L O P M E N T F I N A N C E 2 0 0 4
Even excluding China—where equity issuance isde facto privatization (or corporatization)—publicsector issuance has been significant (figure 3.21,second panel).
After a dramatic surge in the early 1990s—from almost nothing in 1990 to $43 billion in1993 (see figure 3.15)—portfolio equity flows col-lapsed after the Asian crisis and have remainedmodest ever since. Why they fell may have to dowith the surge in privatization in the early 1990s—and with a statistical quirk. In the initial phasesof privatization, public enterprises issued shares,some of which were bought by nonresidentinvestors. Portfolio equity flows swelled as a re-sult. As privatization deepened, however, and moreshares were purchased by nonresidents, the10-percent-ownership threshold that divides port-folio equity from FDI was crossed in many cases,resulting in reclassification of portfolio equity asFDI. In fact, the conversion of portfolio equity toFDI was not an accident—a large part of portfolioequity was purchased by multinational companiesfor the purpose of acquiring control over the priva-tized enterprises, especially those in the infrastruc-ture sector. Thus, a dramatic increase in the M&Acomponent of FDI coincided with a similarly dra-matic drop in portfolio equity flows (figure 3.22).29
An example of this phenomenon is the privatiza-tion of YPF (an oil company) in Argentina. Acqui-sition of existing stocks of YPF by Spain’s Repsolincreased FDI flows to Argentina but reduced port-folio equity flows (World Bank 2003).30
94
Source: Dealogic Bondware.
1990 1992 1994 1996 1998 2000 2002
Public
Public
Private
Private
Figure 3.21 Equity issuance by public and private sector firms, 1990–2003Including China
$ billions
0
5
15
10
20
25
1990 1992 1994 1996 1998 2000 2002
Excluding China
$ billions
0
4
2
8
6
10
12
Sources: UNCTAD, World Bank data based on information fromIMF Balance of Payment Statistics Database, national sources, andmarket sources.
20021994 1995 1996 1997 1998 1999 2000 2001
Mergers andacquisitions
Portfolio equity
Figure 3.22 The rise in M&A and the decline inportfolio equity flows, 1994–2002
$ billions
0
10
50
40
30
20
60
70
Why portfolio equity flows are so much smaller than FDI and debt flows
The slowdown in privatization and the 10-percent-ownership rule (discussed above) are
not the only reasons why portfolio equity flows todeveloping countries are smaller than flows of FDIand debt. Other reasons include underdevelopedstock markets (and weak corporate governance),macroeconomic volatility in developing coun-tries, and “home bias” in developed countries. Thepost-Asian crisis divergence between FDI and
gdf_076-105.qxd 4/6/04 1:05 PM Page 94

S H I F T I N G F O R M S O F E Q U I T Y F I N A N C E F O R D E V E L O P I N G C O U N T R I E S
Macroeconomic volatilityThat developing countries are prone to macroeco-nomic shocks is a matter of concern for investorsin portfolio equity. An analysis of volatility of an-nual returns since 1990 reveals emerging-marketstocks as the most volatile asset class. During1990–2003, the standard deviation of returns onemerging-market portfolio equity exceeded 24 per-cent annually, compared to a standard deviationof under 7 percent for developed-country bonds(figure 3.24). And emerging-market equity ismore volatile than emerging-market bonds, re-flecting in part the seniority of debt over equity in
95
Sources: International Financial Corporation and Standard &Poor’s.
High income OECD
39
88
14
39
11
23
Middle income Low income
Figure 3.23 Market capitalization as share of GDP
Percent
0
20
60
40
80
1001990 2003
70
60
50
40
30
20
0
10
Figure 3.24 Annualized volatility in developed- and developing-country stock and bond markets, 1990–2003
Annualized volatility (percent)
Note: Most assets from 1990; some emerging assets start at 1993.Source: Wilmot and Mielczarski 2003.
us-bsw-b
ger-b ital-b
pl-baus-s
us-s
jp-b
brz-bjp-s
fr-sger-s
rus-b
arg-b
swd-ssaf-s hk-s
mex-sfin-s
kor-s
indo-stur-s
rus-s
Developed stocksEmerging stocksDeveloped bondsEmerging bonds
portfolio equity flows also owes something to thespecial resilience of FDI, which derives from theability of direct investors (usually multinationalcorporations with established brand names) towithstand market risks through global productionand marketing networks.
Underdeveloped stock marketsA major constraint to the growth of foreign equityinvestment is the small size of stock markets indeveloping countries. Market capitalization as ashare of GDP in low-income countries is aboutone-sixth of that in high-income countries. Evenin the middle-income countries, the share is onlyabout one-third of that in industrial countries (fig-ure 3.23). Stock exchanges in developing countriesalso tend to lag technologically behind developedmarkets. Technology plays a major role in the trad-ing, clearance, and settlement processes; prob-lems in those areas can discourage sophisticatedinvestors. Institutions that supervise and supportthe operation of the stock exchange also tend to beweaker in developing countries. Recent scandals inthe U.S. fund management industry and at the NewYork Stock Exchange have highlighted the vulnera-bility of institutions and regulations in the world’smost sophisticated markets.31 Developing-countryinstitutions are even more vulnerable to suchrisks.32 Regulations such as limits on foreign own-ership33 and restrictions on profit remittances34
also impede the inflow of portfolio equity to devel-oping countries.
gdf_076-105.qxd 4/6/04 1:05 PM Page 95

G L O B A L D E V E L O P M E N T F I N A N C E 2 0 0 4
bankruptcy—another reason why investors mayprefer debt over equity.
Although emerging-market stocks are morevolatile, their returns are not necessarily higherthan those on developed-country stocks. More-over, a strong correlation between returns fromemerging-market and developed-country stockshas been observed recently, reducing the perceivedbenefits of portfolio diversification to the detri-ment of emerging-market equity (box 3.6).
High transaction costs also discourage in-vestors in emerging-market equity. Fund man-agement fees for investing in emerging-marketequity may be as high as 1.9 percent for activelymanaged funds. Recent scandals in the U.S. fundmanagement industry have focused attention on ex-pense ratios of mutual funds, and investors are nowlooking for less costly and more transparent alter-natives, such as exchange-traded funds (ETFs).
ETFs on emerging-market equity are relativelyscarce, but their popularity is increasing (box 3.7)
Home biasThe tendency of individuals in developed countriesto hold too little emerging-market equity—a phe-nomenon known as home bias—constrains thegrowth of portfolio equity flows. In a world port-folio consisting of a U.S. fund invested in the S&P500 and a Europe, Australia, and Far East fund(not including emerging markets), the optimal(minimum-variance) share of foreign equities isaround 40 percent (Lewis 1999); but the observedshare is only about 8 percent. Home bias is also ev-ident in the practices of Japanese, German, British,and French investors (French and Poterba 1991).Some argue that home bias arises when the costs ofinternational diversification exceed the benefits(Portes and Rey 2002). Such costs may arise frominternational taxes, barriers to trade, limits onforeign ownership, information costs, and marketinefficiencies. The existence of home bias in andbetween industrial countries, however, implies thatcross-border capital flows—and in particular, thelevel of capital flows to developing countries—willfail to reach their full potential, underscoring theneed for developing countries to nurture their owndomestic equity markets, as well as to undertakereforms to reduce the costs of international diversi-fication as outlined above.
Prospects for 2004–2005
After two consecutive years of decline, FDIflows to developing countries are expected to
recover in 2004 and 2005, to $152 billion and$165 billion (table 3.7). As global economicgrowth recovers (as discussed in chapter 1) andinvestor sentiment improves, FDI in developingcountries—especially China, India, Mexico,Poland, and the Russian Federation—is expectedto recover.35 Service sector FDI also is expected torise in all regions, but the recovery is expected toremain modest in Latin America.
FDI in East Asia and the Pacific is expected torise to $65 billion in 2004 from $57 billion in 2003.Led by China, the region is once again expected toreceive the highest share of FDI flows to developingcountries. Although the manufacturing sector willremain the major sector in 2004, China’s service
96
Because emerging-market equity is morevolatile than debt or developed-country
assets, it is usually considered a separate assetclass. Capital market reforms, however, andrelaxation of foreign ownership restrictions haveresulted in a greater integration of developedand emerging markets (Henry 2000; Bekaert,Harvey, and Lumsdaine 1999). As a result, thecorrelation between emerging- and developed-market stock returns has risen in recent years,indicating convergence toward a single assetclass. Saunders and Walters (2002) show thatthe correlation was more significant in 1994–99than in 1988–93. They argue that “gains fromsimple country-by-country diversification wereunambiguously lower in the 1994–99 periodover all risk-return ranges except the verylowest.” Other studies argue that the risk-returncharacteristics of emerging-market indexes canbe achieved in the U.S. market by, for example,holding portfolios of U.S. domestic stock,American depository receipts, closed-endcountry funds, and stocks of multinationalcorporations (Errunza, Hogan, and Hung 1999).
Box 3.6 Emerging-market stocks—aseparate asset class?
gdf_076-105.qxd 4/6/04 1:05 PM Page 96

S H I F T I N G F O R M S O F E Q U I T Y F I N A N C E F O R D E V E L O P I N G C O U N T R I E S
97
Exchange-traded funds (ETFs) are index-based fundsthat are listed on an exchange and traded like shares.
They have attracted increasing attention in the aftermathof scandals involving U.S. mutual funds in fall 2003. The first ETF, indexed to the S&P 500, began trading on the American Stock Exchange in January 1993. Sincethen, both the number and the assets of ETFs have grown exponentially (see figure at left). By the end ofOctober 2003, the value of assets under management of 340 ETFs listed on 28 exchanges had reached $187 bil-lion (see table). ETFs listed in U.S. exchanges dominate the market—some 117 U.S.-listed ETFs have $129 bil-lion in assets under management. Almost half of ETFs track global indexes. Their exposure to emerging Asian markets is about 6 percent, and to Latin America, 2 percent. Although the most extensive markets for ETFs are in developed countries, India and South Africarecently launched their own ETFs (see table). ETFs also have evolved in terms of their underlying indexes.Now, four U.S. ETFs are indexed to fixed-income investments.
A major reason for the growth of ETFs is their lowexpense ratio—around 0.4 percent—in contrast to expenseratios of equity funds (see figure at right). Although subjectto other implicit costs of trading stocks, including brokerfees and bid-ask spreads, ETFs are cost-efficient comparedto even passively managed mutual funds. Other reasons fortheir growing popularity are potential savings on capital
Box 3.7 The growing popularity of exchange-traded funds
Source: Morgan Stanley Research, London.
Assets managed by ETFs, 1993–2003
$ billions
Average expense ratios for mutual funds and ETFs
0
50
100
150
200
19971996199519941993 1998 1999 2000 2001 2002 2003 0 2.01.51.00.50
200
100
300
400
Source: Morningstar, Morgan Stanley 2003.
Actively managedequity funds
Actively managed domesticequity funds
Passive domesticequity funds
International equity ETFs
All equity ETFs
U.S. sector ETFs
U.S. major market ETFs
Fixed-income ETFs 0.15
0.18
0.34
0.40
0.41
0.75
1.40
1.94Number of ETFs
Percent
Number(right axis)
Assets undermanagement
(left axis)
Global ETFsOn October 31, 2003
Assets under Average daily Average daily Country Total management volume volume (number of managers) listings ($ billions) (million shares) ($ billions)
U.S. (8) 117 129.4 147 8.20Europe (14) 158 17.3 14 0.40Japan (4) 18 27.8 5 0.10Canada (2) 16 4.9 1 0.04Korea, Republic of (4) 5 0.5 2 0.02Australia (2) 4 0.6 1 0.01South Africa (2) 4 0.7 . . . .Hong Kong (2) 4 4.3 6 0.01India (3) 5 0.1 . . . .Israel (1) 2 0.5 . . . .Singapore (1) 6 0.2 . . . .
Total (35) 340 186.7 183 8.7
Note: . . � negligible.Source: Morgan Stanley Research.
gains tax, due to low trading of underlying stocks, and theflexibility of trading ETFs at intra-day prices instead of atend-of-the-day prices. Finally, ETFs have strict transparencyguidelines.
Unlike mutual funds, ETFs also can be used for hedg-ing portfolio risks. They can be sold short using borrowedshares, bought on margin using borrowed money, or boughtthrough limit orders (that is, orders to buy or sell at aspecific price).
gdf_076-105.qxd 4/6/04 1:05 PM Page 97

sector (especially finance, telecommunications,and utilities) is expected to receive larger amountsof FDI when it opens to foreign investment in2005 to meet World Trade Organization (WTO)requirements. Malaysia, Thailand, and Vietnamalso are expected to receive higher levels of FDI inthe medium term. Thailand is expected to benefitfrom improved growth prospects and its accessionto the WTO. And Malaysia’s efforts to attract FDIby further liberalizing foreign ownership restric-tions are expected to pay off. Although infrastruc-ture and regulatory problems remain in Vietnam,increased economic integration among Associationof South East Asian Nations (ASEAN) countriesmay draw significant flows into its mining andlight manufacturing sectors (AT Kearney 2003). Incontrast, security concerns are expected to keepIndonesia’s FDI flows at modest levels.
The recovery in FDI in Eastern and CentralEurope is expected to be led by the EU accessioncountries. The Czech Republic, Hungary, andPoland are expected to receive more FDI in ser-vices as their competitive cost structure encouragesinvestors to set up headquarters and R&D facili-ties. Even though privatization activities are ex-pected to be slow in these countries, FDI throughM&A is expected to remain robust as domestic in-vestors in privatized companies look for foreignpartners to increase their capital (UNCTAD2003b). Although heavy manufacturing companiesmay prefer countries with highly skilled labor andgood infrastructure, such as the Czech Republic andPoland, light manufacturers may move to lower-cost accession countries such as Romania.
In contrast, the improvement in business sen-timent in the Russian Federation in the first halfof 2003 seems to have waned in the wake of theYukos scandal, which raised concerns about thesustainability of the country’s privatization pro-gram. Early in the year, Russia was ranked as thesecond most attractive investment location afterChina for first-time investors (AT Kearney 2003).Firm oil prices and growth recovery attracted FDIproposals in the energy sector. That interest is likelyto continue in the medium-term, although in-vestors are closely watching the developments fol-lowing the Yukos controversy. Recent political andeconomic stability are expected to help FDI toTurkey, although its proximity to Iraq and recentsecurity problems may limit new investments.
FDI flows to Latin America and the Caribbeanare expected to improve modestly in 2004.Mexico is expected to receive larger flows in thenext two years, in line with the recovery of growthin the United States. The country also shows somepotential for privatization-related FDI flows. LatinAmerica also is attracting FDI related to call cen-ters being set up by multinational companies toserve Spanish-speaking customers in the UnitedStates. FDI flows to Argentina and Brazil, how-ever, are expected to remain modest, because anincrease in FDI in manufacturing (in response toweak currencies) may be offset by a continued dis-investment in infrastructure and banking. TheRepública Bolivariana de Venezuela is expected tosuffer a further decline in FDI flows because of itsuncertain political environment.
FDI flows to South Asia are expected to risein 2004–05. Policy reforms, especially ownershipderegulation in financial services, are likely toattract FDI to India, already the largest recipient inthe region. Low costs and an English-speakingpopulation make the region, especially India,attractive for investments in services (such as callcenters) and manufacturing. Compared to EastAsian countries (especially China), however, theinvestment climate in India is still perceived as bu-reaucratic, with burdensome restrictions on owner-ship. Security remains a major concern in the rest ofthe region.
The prospect for FDI in Africa remains lim-ited, reflecting modest growth potential, under-developed infrastructure, political risks, and lowlabor productivity. Nevertheless, firm oil prices andstrategic considerations in some source countries
G L O B A L D E V E L O P M E N T F I N A N C E 2 0 0 4
98
Table 3.7 Forecast for equity flows to developingcountries, 2002–05 $ billions
2002 2003 2004 2005
FDI (net) 147 135 152 165East Asia and Pacific 55 57 65 74Europe and Central Asia 33 26 31 32Latin America and the Caribbean 45 37 38 40Middle East and North Africa 3 2 2 2South Asia 4 5 6 7Sub-Saharan Africa 8 9 10 10
Portfolio equity (gross) 11 19 22 27
Note: FDI forecasts are based on an econometric model described inthe methodological annex. The forecasts for portfolio equity flowsare based on a vector autoregression (VAR) model. See World Bank(2002a), annex 2.1.Source: World Bank staff estimates.
gdf_076-105.qxd 4/6/04 1:05 PM Page 98

S H I F T I N G F O R M S O F E Q U I T Y F I N A N C E F O R D E V E L O P I N G C O U N T R I E S
(including China) may increase FDI in the oil sectorin Africa. South Africa will remain the preferreddestination for FDI (IMF-World Bank 2003).Countries in North Africa and Middle East mayattract new oil-related investments, but securityproblems remain a major issue.
Gross portfolio equity flows are expected torise steadily from $19 billion in 2003 to $22 billionin 2004 and $27 billion in 2005 (see table 3.7)36
Two major factors behind this outlook are rekin-dled growth and relaxation of foreign ownership
restrictions in major emerging markets, particularlyChina and India. Portfolio equity flows to Brazillikewise are expected to increase significantly withthe country’s improved growth outlook, aided by re-ductions in interest rates. The surge in equity is-suance in the last month of 2003 is likely to carryforward to the first two quarters of 2004. However,a risk to this outlook may arise from the recent scan-dals in the U.S. fund management industry, whichmay dampen investor enthusiasm for the relativelyriskier emerging-market stocks.
99
gdf_076-105.qxd 4/6/04 1:05 PM Page 99

100
THE FORECASTS OF FDI FLOWSpresented in this chapter are based on aneconometric model that uses the following
explanatory variables: three-year moving averageof the GDP growth rate of the top seven indus-trial countries, the major suppliers of FDI; thedifference between the GDP growth rate of devel-oping countries (three-year moving average) andthat of the G-7 countries as a proxy for investors’expectations about excess rates of return in themedium term from investments; the growthrate of exports of goods and services (laggedone year) to reflect a country’s attractiveness toexport-oriented, efficiency-seeking investors; therating of Institutional Investor magazine as aproxy of the investment climate; the price of oilto capture oil-related foreign investment; thevolatility of oil prices (represented by their one-year rolling standard deviation) as a proxy forglobal economic uncertainty; and the laggeddependent variable (FDI/GDP) representing thepersistence of FDI flows over time. The modeluses panel data for 1991–2002 for 30 developingcountries that accounted for more than 80 percentof FDI flows to developing countries in 2002.
Regression results are summarized in table 3A.1.Predictions of FDI/GDP for the 2004–05 periodwere obtained by forecasting growth rates of FDIas implied by the model and applying the ob-tained growth rates to estimated FDI figures for2003. The model is the same as that used in lastyear’s edition of Global Development Finance(World Bank 2003).
Annex A FDI Forecasting Model
Table 3A.1 Regression results of FDI forecastingmodel
Explanatory variable Coefficient
G7 growth rate (3-year moving average) 0.089Growth rate � G7 growth rate (3-year moving averages) 0.018Growth of exports of goods and services 0.006Institutional Investor rating 0.018Oil price 0.011Volatility of oil price �0.043FDI as % GDP (lagged 1 year) 0.503Unweighted adjusted R2 0.557Weighted adjusted R2 0.582Durbin Watson 2.002Number of observations 353
Note: The dependent variable is FDI as a percentage of GDP. Coeffi-cients computed using White heteroskedasticity-consistent standarderrors are significant at 1 percent level.Source: World Bank Staff.
gdf_076-105.qxd 4/6/04 1:05 PM Page 100

101
Annex B Top 25 International Equity Deals in 2003
Amount Issuer Rank Issuer or group ($ mn) Share type Exchange type Sector Currency
1 People’s Insurance Co of China 802 IPO Hong Kong Public Insurance HK dollar2 Telekomunikacja Polska 561 Privatization, Warsaw, London Public Telecom/ PZL
SA-TPSA GDR communications3 China National Foreign Trade 540 Privatization Hong Kong Public Transport & HK dollar
Transportation (Sinotrans) Corp shipping(Sinotrans Group)
4 Telecom SA Ltd 502 IPO, Johannesburg, Private Telecom/ SA Randprivatization, NY communicationsADR
5 Cemex SA de CV 497 ADR NY Private Construction US dollar6 Krung Thai Bank pcl 397 Privatization Thailand Public Banking and Thai Baht
financial services
7 Astro All Asia Networks pcl 348 IPO Kuala Lumpur Private Media and M dollarpublishing
8 Weiqiao Textile Co Ltd 347 IPO Hong Kong Private Textile and HK dollarclothing
9 China Resources Power 313 IPO Hong Kong Public Energy/utility HK dollarHolding Co Ltd
10 Infosys Technologies Ltd 294 IPO NSE (India), Private Computers/ US dollarNasdaq software
11 China Aviation Industry Corp I 270 IPO Hong Kong Public Aerospace HK dollar(AVIC I)
12 PT Bank Rakyat Indonesia 262 IPO, Jakarta, Public Banking and Indo Rupiah(Persero) privatization Surabaya financial
services13 Thai Airways International pcl 261 Privatization Thailand Public Airline Thai Baht14 PT Bank Mandiri (Persero) 254 IPO, Jakarta, Public Banking and Indo Rupiah
privatization Surabaya financial services
15 Mobile Telesystems OAO-MTS 205 Bought deal/ London Private Telecom/ US dollarblock trade communications
16 Gold Fields Ltd 194 Accelerated Johannesburg, Private Mining SA Randbook building NY
17 PT Astra International 161 Rights Jakarta, Private Trading and Indo RupiahSurabaya dealing
18 Steinhoff International 156 Institutional Johannesburg, Private Retailing and SA RandHoldings Ltd offering NY consumer goods
19 Commerce Asset-Holding Bhd 154 Accelerated Kuala Lumpur Private Banking and M dollarbook building financial
services20 PT Bank Danamon Indonesia 141 Privatization, Jakarta, Private Banking and Indo Rupiah
Tbk Accelerated Surabaya financial book building services
21 Bank of Ayudhya pcl 134 Accelerated Thailand Private Banking and Thai Bahtbook building financial
services22 TPV Technology Ltd 134 Bought Hong Kong, Private Electronics/ HK dollar
deal/block trade Singapore electricals23 Beijing Capital Land Ltd 131 IPO, Hong Kong Public Real estate HK dollar
privatization24 Unibanco—Uniao de Bancos 128 GDR Sao Paulo, NY Private Banking and BRE
Brasileiros SA financial services
25 Globe Telecom Holdings Ltd 127 Bought Philippines Private Telecom/ Pesodeal/block trade communications
Source: Dealogic Bondware.
gdf_076-105.qxd 4/6/04 1:05 PM Page 101

G L O B A L D E V E L O P M E N T F I N A N C E 2 0 0 4
102
Notes1. The year-to-year variation in FDI flows is modest in
comparison to other flows.2. The United States is expected to regain its position
as the top destination of FDI in the world (excludingLuxembourg, where FDI flows are mostly pass-throughs).
3. Based on the average volume of FDI flows for1999–2002. The top 10 in terms of FDI as a share of GDPare Equatorial Guinea, St. Kitts and Nevis, Angola, Chad,Lesotho, the Czech Republic, The Gambia, Grenada,Azerbaijan, and Kazakhstan.
4. Among the 47 least developed countries, 7 are clas-sified as middle-income countries by the World Bank.
5. Including Angola, Nigeria, and Sudan.6. China’s monthly statistics show that FDI flows
dropped in July and August by 19 percent and 28 percentyear-on-year. The decline may indicate a residual impact ofSARS (severe acute respiratory syndrome), but one cannotbe sure, given that China’s monthly FDI series tends to bevolatile.
7. India has recently modified its FDI statisticsmethodology by including reinvested earnings and inter-company loans.
8. In 2001, North-South investments from Spain and theUnited Kingdom plunged by 40 percent. The United Statesand France were the two leading North-South investors in2001, with $20 billion and $13 billion, respectively.
9. Estimates for the period have been adjusted to ac-count for reclassification of South Korea as a high-incomecountry.
10. FDI outflows from South Africa declined becauseof the unbundling of cross-shares of London-based AngloAmerican and South African De Beers (UNCTAD 2002).
11. Not all services are nontradable or require physicalproximity. For example, some information-technology ser-vices (software programming, database and customer sup-port) and business process services (call centers) are notlocation-bound and can be provided without proximity tocustomers. However, with exceptions in mind, services areconventionally portrayed as intangible, invisible, and per-ishable, requiring simultaneous production and consump-tion (World Bank 2001).
12. Performance requirements often specify local em-ployment and local content levels (Davies and Ellis 2001).
13. Between 1990 and 2002 developing countries signed1,380 bilateral investment agreements. During the sameperiod, 113 developing countries became WTO members.
14. Some services are labor intensive, and governmentsare concerned that foreign participation may harm domesticskilled workers. In fact, 32 countries (mostly in Africa andLatin America) have included domestic labor requirementsfor FDI in their GATS (General Agreement on Trade in Ser-vices) schedules (Markusen and others 2000).
15. During the 1990s, most Latin American countriesintroduced a series of financial reforms to dismantle statecontrols over the sector and to stem barriers to entry of for-eign banks. As a result, the share of foreign banks increased to61 percent in 2001 from 13 percent in 1995 and 8 percent in1990 (United Nations 2003). In Eastern and Central Europe,foreign firms were heavily involved in the privatization of
banks, telecommunications companies, and utilities. Coun-tries in Asia and Africa also have gradually reduced barriersagainst foreign firms, although more slowly than in LatinAmerica and Eastern and Central Europe.
16. Banks that left Argentina following the crisis includeCanada’s Bank of Nova Scotia, France’s Credit Agricole, theItalian financial group Intesa Bci, and Korea’s Kookmin.
17. The Capital Markets Consultative Group Survey isa joint survey report by the IMF and the World Bank (IMF-World Bank 2003).
18. Brazil stopped compiling reinvested earnings dataafter 1998.
19. Coefficients of variation for reinvested earnings andintercompany loans are higher than that of equity capital inmore than half of the countries in the sample; for almost70 percent of those cases intercompany loans show thehighest variation.
20. These countries include Canada, Denmark, France,Germany, Japan, Norway, the United Kingdom, and theUnited States (Desai and others 2002b).
21. Lehmann and Mody 2004 show that repatriationstrategies of companies during a crisis in a host country mayvary by investors’ nations.
22. A 10-percent-ownership rule is applied in distin-guishing FDI from portfolio equity.
23. Depositary receipts are issued by internationalbanks. They represent stocks of an emerging-market com-pany, for example, that are deposited with a local custodian.These dollar-denominated securities are traded in the sameway as stocks.
24. During 1990–2003, of nearly 1,200 equity issuancedeals that reported relevant data, 527 (or 44 percent) wereIPOs, 378 (32 percent) ADRs and GDRs, and 290 (24 per-cent) privatization deals.
25. Ukraine experienced an outflow of portfolio equityof $1.98 billion in 2002. The outflow continued in 2003. Inthe first half of the year, there was an outflow of $736 mil-lion, higher than the $504 million recorded in the first halfof 2002.
26. Total portfolio equity flows to Brazil in the firstnine months of 2003 were up only slightly from 2002($1.4 billion versus $1.2 billion). Flows arising from inter-national listings, which averaged $3.5 billion a year be-tween 1997 and 2002, reached only $0.55 billion in the firstnine months of 2003, compared with $2.44 billion in thecorresponding period of 2002. In contrast, local listingsturned positive after three consecutive years of decline.
27. Pulatkonak and Sofianos (1999) show thatemerging-market firms’ decisions to list in New York de-pend largely on the time-zone distance from the UnitedStates and the level of trading costs.
28. A sharp increase in listings on the Korean stockexchange occurred after 1997, presumably because someconglomerates split and listed on their own.
29. Claessens, Djankov, and Klingebiel (2000) discussthe role of privatization in the development of stock mar-kets in transition economies.
30. The converse also may occur. That is, withdrawingFDI by selling off stocks may increase portfolio equityflows.
gdf_076-105.qxd 4/6/04 1:05 PM Page 102
S H I F T I N G F O R M S O F E Q U I T Y F I N A N C E F O R D E V E L O P I N G C O U N T R I E S
103
31. The latter half of 2003 brought charges of fraudand wrongdoing in the U.S. mutual fund industry (and morerecently in foreign-exchange trading). The charges center onlate trading, market timing, and high fund-managementfees. Late trading is illegal because, by allowing trades afterthe markets have closed, it gives these traders (usually largemutual and hedge funds) the unfair advantage of reacting tolate-breaking news. Market timing allowed some investorsto trade before others to take advantage of differences be-tween the price of a fund (set once a day) and those of theunderlying securities, which change throughout the day.High-fund management fees came into focus when an in-vestment bank’s mutual fund paid higher brokerage fees toits own brokerage arm than to other brokers. These costswere borne by investors in the mutual fund.
32. Aggarwal and others (2003) find that strong share-holder rights, legal institutions, and accounting standardsare associated with greater U.S. mutual fund investment inemerging-market equities. This is in line with La Porta andothers (1997), who find that strong investor-protection lawsand good accounting practices are key to capital-marketdevelopment.
33. Claessens and Rhee (1994) found that legal barri-ers curtailing foreigners’ access to emerging markets tendedto raise the cost of capital of listed firms. This result wasbased on an analysis of 16 emerging markets for the period1989–92. As a measure of the degree of foreigners’ accessi-bility to emerging-market stocks, Claessens and Rhee usedthe investability index created by the Emerging MarketsData Base of the International Finance Corporation.Bekaert (1995), however, argues that formal ownershiprestrictions are often not binding or are circumvented.
34. Demirguc-Kunt and Huizinga (1995) discuss taxbarriers to equity investments.
35. A recent AT Kearney survey (2003) of direct in-vestors found that the top 10 destination countries for FDIinclude 6 emerging-market economies.
36. Note that we have used gross issuance of equity ingenerating model-based forecasts, because high-frequencydata required for this purpose are not available for net flows.The trends in net and gross portfolio equity flows, however,are positively correlated, as can be seen in figure 3.15.
References
Aggarwal, Reena, Leora Klapper, and Peter D. Wysocki.2003. “Portfolio Preferences of Foreign InstitutionalInvestors.” Policy Research Working Paper 3101,World Bank, Washington, D.C. July.
Aharony, Joseph, and Itzhak Swary. 1980. “Quarterly Divi-dend and Earnings Announcements and StockholdersReturns: An Empirical Analysis.” Journal of Finance35(March): 1–12.
Altshuler, Rosanne, and Harry Grubert. 2003. “Repatria-tion Taxes, Repatriation Strategies and MultinationalFinancial Policy.” NBER Working Paper 8144,National Bureau of Economic Research, Cambridge,Mass.
Asquith, Paul, and David W. Mullins. 1983. “The Impactof Initiating Dividend Payments on Shareholders’Wealth.” Journal of Business 56(1): 77–96.
AT Kearney. 2003. “FDI Confidence Index.” AT Kearney,Inc., Alexandria, Virginia.
Aykut, Dilek, and Dilip Ratha. 2003. “South-South FDIFlows in the 1990s.” Development Finance Group,World Bank, Washington, D.C. Processed.
Bekaert, G., C. Harvey, and R. L. Lumsdaine. 1999. “Dat-ing the Integration of World Equity Markets.” NBERWorking Paper W6724, National Bureau of EconomicResearch, Cambridge, Mass. September.
Bekaert, Geert. 1995. “Market Integration and InvestmentBarriers in Emerging Equity Markets.” World BankEconomic Review 9(1): 75–107.
Christophe, Stephen E. 2002. “The Value of U.S. MNCEarnings Changes from Foreign and Domestic Opera-tions.” Journal of Business 75(1): 67–94.
Christophe, Stephen, and Ray J. Pfeiffer, Jr. 2002. “The Val-uation of MNC International Operations During the1990s.” Review of Quantitative Finance and Account-ing 18(2): 119–38.
Claessens, Stijn, Simeon Djankov, and Daniela Klingebiel.2000. “Stock Markets in Transition Economies.”Financial Sector Discussion Paper 5. Social ScienceResearch Network. http://ssrn.com/abstract�240703.
Claessens, Stijn and Moon-Whoan Rhee. 1994. “The Ef-fects of Barriers on Equity Investment in DevelopingCountries.” World Bank Policy Research WorkingPaper 1263. Washington, D.C. March.
Davies, Ronald B., and Christopher J. Ellis. 2001. “Compe-tition in Taxes and Performance Requirements for -Foreign Direct Investment.” Economics DepartmentWorking Papers 2001-4. University of Oregon, Eugene.
Demirguc-Kunt, Asli, and Harry Huizinga. 1995. “Barriersto Portfolio Investment in Emerging Stock Markets.”Journal of Development Economics 47(August).
Denis, D., D. Denis, and K. Yost. 2001. “Global Diversifica-tion, Industrial Diversification, and Firm Value.”Working paper, Krannert Graduate School of Manage-ment, Purdue University, West Lafayette, Ind.
Desai, Mihir A., C. Fritz Foley, and James R. Hines, Jr.2002. “Repatriation Taxes and Dividend Distortions.”National Tax Journal 54(4): 829–51.
———. 2003a. “A Multinational Perspective on CapitalStructure Choice and Internal Capital Markets.”NBER Working Paper 9715, National Bureau of Eco-nomic Research, Cambridge, Mass. May.
———. 2003b. “Chains of Ownership, Regional Tax Com-petition, and Foreign Direct Investment.” In HeinzHerrmann and Robert Lipsey, eds., Foreign Direct In-vestment in the Real and Financial Sector of IndustrialCountries. Berlin: Springer-Verlag.
———. 2003c. “Dividend Policy Inside the MultinationalFirm.” NBER Working Paper 8698. National Bureauof Economic Research, Cambridge, Mass.
Errunza, V., K. Hogan, and M.-W. Hung. 1999. “Can theGains from International Diversification Be Achievedwithout Trading Abroad?” Journal of Finance 54:2075–3007.
gdf_076-105.qxd 4/6/04 1:05 PM Page 103

Esperanca, J. P. 1992. “International Strategies in theEuropean Service Sector: A Comparative Study.” InM. Casson, ed., International Business and GlobalIntegration: Empirical Studies. London: Macmillan.
Falzoni, Anna. 2000. “Statistics on Foreign Direct Invest-ment and Multinational Corporations: A Survey.”Center for Economic Policy Research Working Paper,London. http://www.cepr.org/research/networks/fdimc/Papers/Data.pdf.
Fama, Eugene F., and Harvey Babiak. 1968. “Dividend Pol-icy: An Empirical Analysis.” Journal of the AmericanStatistical Association 63(24): 1132–61.
French, Kenneth R., and James M. Poterba. 1991. “Interna-tional Diversification and International Equity Mar-kets.” American Economic Review 81(2): 222–26.
Fuhr, Deborah A. 2003. “Exchange Traded Funds, GlobalSummary.” Morgan Stanley Equity Research, Europe,January.
Golub, Stephen S. 2003. “Measure of Restrictions on In-ward Foreign Direct Investment for OECD Countries.”OECD Economics Department Working Paper 357.Organisation for Economic Co-operation and Devel-opment, Paris.
Gurbert, Harry. 1998. “Taxes and the Division of ForeignOperation Income Among Royalties, Interest, Divi-dends and Retained Earnings.” Journal of Public Eco-nomics 68(2): 269–90.
Healy, Paul, and Krishna Palepu. 1988. “Earnings Informa-tion Conveyed by Dividend Initiations and Omis-sions.” Journal of Financial Economics 21(2): 149–75.
Henry, P. B. 2000. “Stock Market Liberalization, EconomicReform, and Emerging Market Equity Prices.” Journalof Finance 55: 529–46.
IMF (International Monetary Fund). 1993. Balance of Pay-ments Manual. 5th ed. Washington, D.C.
IMF (International Monetary Fund) Balance of PaymentsStatistics Database (2003).
IMF-World Bank (International Monetary Fund and WorldBank). 2003. Foreign Direct Investment in EmergingMarket Countries. Washington, D.C.
Jensen, Michael J. 1986. “Agency Cost of Free Cash Flow,Corporate Finance, and Takeovers.” American Eco-nomic Review 76(2): 323–39.
John, Kose, and Joseph Williams. 1985. “Dividends, Dilu-tion, and Taxes: A Signaling Equilibrium.” Journal ofFinance 40: 1053–69.
J. P. Morgan Securities. 2003. “Introducing the HomelandInvestment Act.” Economic and Policy Research, NewYork.
La Porta, Rafael, Florencio Lopez de Silanes, AndreiShleifer, and Robert W. Vishny. 1997. “Legal Determi-nants of External Finance.” Journal of Finance 52(3):1131–50.
Latin Finance. 2003. Latin Finance 2003. Miami: LatinFinance Publications.
Lehmann, Alexander and Ashoka Mody. 2004. “Interna-tional Dividend Repatriations.” IMF Working Paper04-05, International Monetary Fund, Washington, D.C.
Levine, Ross, and Sergio Schmukler. 2003. “Migration,Spillovers, and Trade Diversion: The Impact of Inter-nationalization on Domestic Stock Market Activity.”
NBER Working Paper 9614, National Bureau ofEconomic Research, Cambridge, Mass.
Lewis, Karen K. 1999. “Trying to Explain Home Bias in Equi-ties and Consumption,” Journal of Economic Literature(June): 571–608.
Lintner, John. 1956. “Distribution of Incomes of Corpora-tions among Dividends, Retained Earnings, andTaxes.” American Economic Review 46: 97–113.
Markusen, James, Thomas F. Rutherford, and David Tarr.2000. “Foreign Direct Investment in Services and theDomestic Market for Expertise.” NBER WorkingPaper 7700, National Bureau of Economic Research,Cambridge, Mass.
Miller, Merton, and Kevin Rock. 1985. “Dividend Policyunder Asymmetric Information.” Journal of Finance40: 1031–51.
Morgan Stanley. 2003. “U.S.-Listed Index-Linked ETFProduct Overview and Applications.” Equity ResearchReport. New York.
Murphy, Kevin J. 1985. “Corporate Performance and Man-agerial Remuneration.” Journal of Accounting andEconomics 7: 11–42.
National Bureau of Statistics of China. Various years. ChinaStatistical Yearbook. Beijing.
OECD (Organisation for Economic Co-operation and De-velopment). OECD Benchmark Definition of ForeignDirect Investment. 3rd ed. Paris.
Portes, Richard, and Helene Rey. 2002. “The Determinantsof Cross-Border Equity Transaction Flows.” NBERWorking Paper 7336, National Bureau of EconomicResearch, Cambridge, Mass. July.
Pulatkonak, M. and G. Sofianos. 1999. “The Distributionof Global Trading in NYSE-Listed Non-U.S. Stocks.”NYSE Working Paper 99-03. New York.
Roberts, Joanne. 2001. “Challenges Facing Service Enter-prises in a Global Knowledge-Based Economy: Lessonsfrom the Business Services Sector.” PREST DiscussionPaper 01-03, University of Manchester, U.K. http://les .man.ac.uk/PREST/Publ icat ions/DP_PDFs/PRESTDP01-03.pdf.
Saunders, Anthony, and Ingo Walters. 2002. “Are EmergingMarket Equities a Separate Asset Class?” Journal ofPortfolio Management 28(3).
Tse, Raymond Y. C. 2001. “China’s Real Estate Market andthe Asian Financial Crisis.” Emerging Markets Quar-terly 4(4): 51–59.
UNCTAD. Various years. World Investment Report. NewYork.
———. 1998. World Investment Report. New York.———. 2002. World Investment Report. New York.———. 2003a. “China: An Emerging FDI Outward Investor.”
Research Note, New York. http://r0.unctad.org/en/subsites/dite/fdistats_files/pdfs/China_Researchnote.pdf.
———. 2003b. “Outward FDI from Central and EasternEuropean Countries.” Research Note, New York.http://r0.unctad.org/en/subsites/dite/pdfs/CEE_outward_en.pdf.
United Nations. 2001. “Investment and Economic Reformin Latin America.” Economic Commission for LatinAmerica and the Caribbean, Santiago, Chile.
G L O B A L D E V E L O P M E N T F I N A N C E 2 0 0 4
104
gdf_076-105.qxd 4/6/04 1:05 PM Page 104

S H I F T I N G F O R M S O F E Q U I T Y F I N A N C E F O R D E V E L O P I N G C O U N T R I E S
105
———. 2003. “Foreign Investment In Latin America andthe Caribbean 2002.” Economic Commission for LatinAmerica and the Caribbean, Santiago, Chile.
Wagner, Daniel. 2002. “Political Risk Insurance in Asia:Who Purchases It, Where and Why.” InternationalRisk Management Institute, Dallas, Texas. http://www.IRMI.com/expert/articles/wagner009.asp
Wilmot, Jonathan, and Paul Midezarski. 2003. “Global Mar-kets Outlook.” Credit Suisse First Boston.
World Bank. Various years. Global Development Finance.Washington, D.C.
———. Various years. World Development Indicators.Washington, D.C.
———. 1994. Global Economic Prospects 1995. Washington,D.C.
———. 2001. Global Economic Prospects 2002. Washington,D.C.
. 2002a. Global Development Finance 2002.Washington, D.C.
. 2002b. Global Economic Prospects 2003.Washington, D.C.
. 2003. Global Development Finance 2003.Washington, D.C.
Zhang, Xiaoyang. 1999. “Real Estate Investment in China—Legal Review and Analysis of Foreign Investors’ Partic-ipation.” Murdoch University Electronic Journal of Law6(2). http://www.murdoch.edu.au/elaw/issues/v6n2/zhang62_text.html.
gdf_076-105.qxd 4/6/04 1:05 PM Page 105

gdf_106-125.qxd 4/6/04 1:04 PM Page 106

4The Changing Landscape for Official Flows
CHANGES IN GLOBAL POLITICS, efforts to reach the Millennium DevelopmentGoals, and the rise of civil society are altering
the landscape for official flows in important ways.Aid flows rose in 2002 (figure 4.1), and in 2003the United States announced an Emergency Plan forAIDS relief, while pledges by EU governmentswould raise official development assistance (ODA)to 0.44 percent of gross national income (GNI) by2010, from 0.35 in 2002. Aid, however, currently re-mains low relative to historical levels—and wellbelow levels required to meet the MDGs. Substantialincreases in disbursements will be required over thenext few years to meet the pledges for higher aidmade at the 2002 Monterrey Conference. The failureof the international community to reach agreementon reducing agricultural subsidies and trade barriersat the World Trade Organization talks in Cancún in
107
.
September 2003—reductions that would have gen-erated much greater gains for developing countriesthan envisioned increases in aid—places even morepressure on finding additional sources of finance forthe world’s poorest countries. Coherent aid andtrade policies are vital in promoting development.Moreover, recipient countries have improved theirpolicies, raising their capacity to absorb and use aideffectively—strengthening the call for more aid.
Recent international conflicts have reinforcedthe importance of considerations other than povertyreduction in allocating aid. Aid to Afghanistan hasrisen sharply, and at the October 2003 MadridConference, donors pledged $33 billion in newcommitments for the reconstruction of Iraq. Thesecountries face enormous challenges in making thetransition to peace and in rebuilding their physi-cal, economic, and social infrastructure. Despitethe urgency of those concerns, the allocation of aidbased on national security concerns may reducethe impact of aid on reducing poverty.
Civil society groups are helping to changethe landscape for official flows. In addition toboosting development resources by providing anestimated $12–13 billion annually in aid, interna-tional nongovernmental organizations (NGOs) aretaking a more prominent role in the debate overdevelopment policies.
These issues form the basis for this chapter.The main messages are:
• Aid flows increased in 2002 but remain wellbelow historical levels and what is required tomeet the Millennium Development Goals.Moreover, half of the $6 billion rise in thenominal value of aid reflects debt relief anda further $1 billion of the increase represents
1990 1992 1994 1998 2000 200219960.1
0.4
0.3
0.2
65
45
50
55
60
40
Figure 4.1 Net official development assistance todeveloping countries, 1990–2002
$ billions Percent
Net ODA(left axis)
Net ODA as percent of donors’ grossnational income
(right axis)
Source: OECD Development Assistance Committee.
gdf_106-125.qxd 4/6/04 1:04 PM Page 107
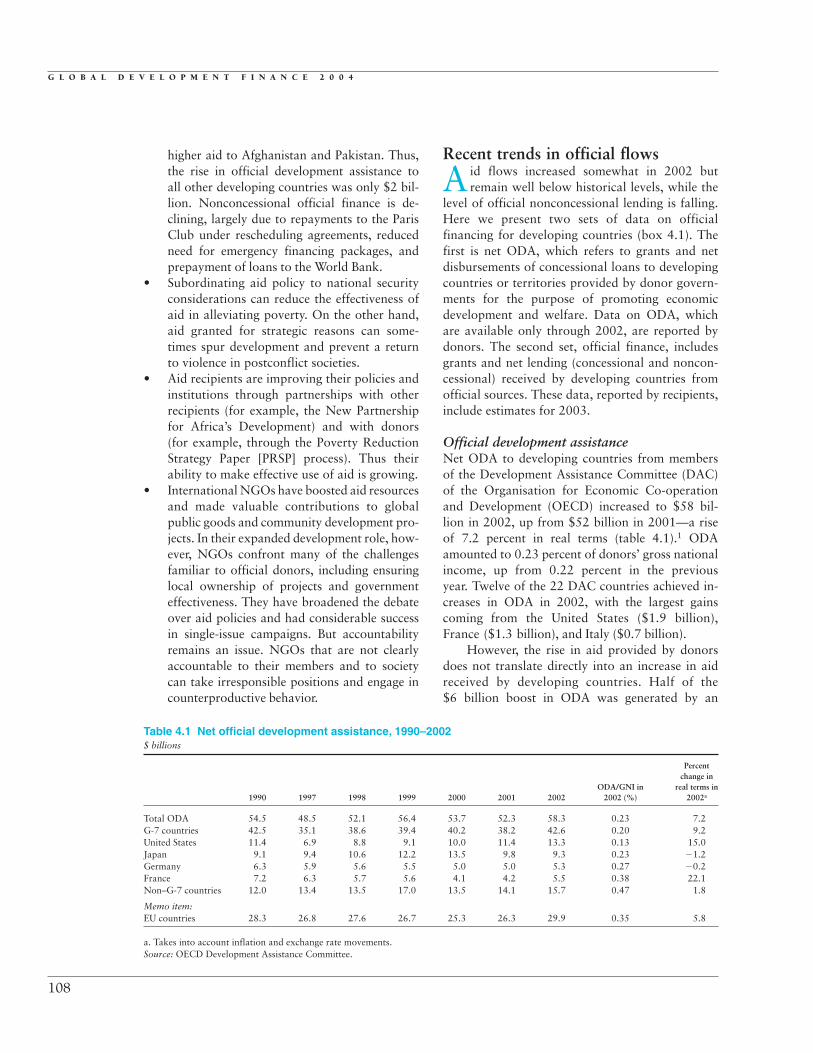
G L O B A L D E V E L O P M E N T F I N A N C E 2 0 0 4
higher aid to Afghanistan and Pakistan. Thus,the rise in official development assistance toall other developing countries was only $2 bil-lion. Nonconcessional official finance is de-clining, largely due to repayments to the ParisClub under rescheduling agreements, reducedneed for emergency financing packages, andprepayment of loans to the World Bank.
• Subordinating aid policy to national securityconsiderations can reduce the effectiveness ofaid in alleviating poverty. On the other hand,aid granted for strategic reasons can some-times spur development and prevent a returnto violence in postconflict societies.
• Aid recipients are improving their policies andinstitutions through partnerships with otherrecipients (for example, the New Partnershipfor Africa’s Development) and with donors(for example, through the Poverty ReductionStrategy Paper [PRSP] process). Thus theirability to make effective use of aid is growing.
• International NGOs have boosted aid resourcesand made valuable contributions to globalpublic goods and community development pro-jects. In their expanded development role, how-ever, NGOs confront many of the challengesfamiliar to official donors, including ensuringlocal ownership of projects and governmenteffectiveness. They have broadened the debateover aid policies and had considerable successin single-issue campaigns. But accountabilityremains an issue. NGOs that are not clearlyaccountable to their members and to societycan take irresponsible positions and engage incounterproductive behavior.
Recent trends in official flows
Aid flows increased somewhat in 2002 butremain well below historical levels, while the
level of official nonconcessional lending is falling.Here we present two sets of data on officialfinancing for developing countries (box 4.1). Thefirst is net ODA, which refers to grants and netdisbursements of concessional loans to developingcountries or territories provided by donor govern-ments for the purpose of promoting economicdevelopment and welfare. Data on ODA, whichare available only through 2002, are reported bydonors. The second set, official finance, includesgrants and net lending (concessional and noncon-cessional) received by developing countries fromofficial sources. These data, reported by recipients,include estimates for 2003.
Official development assistanceNet ODA to developing countries from membersof the Development Assistance Committee (DAC)of the Organisation for Economic Co-operationand Development (OECD) increased to $58 bil-lion in 2002, up from $52 billion in 2001—a riseof 7.2 percent in real terms (table 4.1).1 ODAamounted to 0.23 percent of donors’ gross nationalincome, up from 0.22 percent in the previousyear. Twelve of the 22 DAC countries achieved in-creases in ODA in 2002, with the largest gainscoming from the United States ($1.9 billion),France ($1.3 billion), and Italy ($0.7 billion).
However, the rise in aid provided by donorsdoes not translate directly into an increase in aidreceived by developing countries. Half of the$6 billion boost in ODA was generated by an
108
Table 4.1 Net official development assistance, 1990–2002$ billions
Percentchange in
ODA/GNI in real terms in1990 1997 1998 1999 2000 2001 2002 2002 (%) 2002a
Total ODA 54.5 48.5 52.1 56.4 53.7 52.3 58.3 0.23 7.2G-7 countries 42.5 35.1 38.6 39.4 40.2 38.2 42.6 0.20 9.2United States 11.4 6.9 8.8 9.1 10.0 11.4 13.3 0.13 15.0Japan 9.1 9.4 10.6 12.2 13.5 9.8 9.3 0.23 �1.2Germany 6.3 5.9 5.6 5.5 5.0 5.0 5.3 0.27 �0.2France 7.2 6.3 5.7 5.6 4.1 4.2 5.5 0.38 22.1Non–G-7 countries 12.0 13.4 13.5 17.0 13.5 14.1 15.7 0.47 1.8
Memo item:EU countries 28.3 26.8 27.6 26.7 25.3 26.3 29.9 0.35 5.8
a. Takes into account inflation and exchange rate movements.Source: OECD Development Assistance Committee.
gdf_106-125.qxd 4/6/04 1:04 PM Page 108

T H E C H A N G I N G L A N D S C A P E F O R O F F I C I A L F L O W S
increase in debt relief, which more than doubled in2002.2 Administrative costs involved in managingdonor agencies, also classified as ODA, remainedat about $3 billion in 2002. Thus aid received bydeveloping countries (net of debt relief) increasedby only $3 billion. Afghanistan and Pakistan ac-counted for $1 billion of the increase; in the case ofAfghanistan a large amount came as emergency as-sistance. Thus, the rise in ODA excluding these two
countries was only $2 billion. Substantial increaseswill be required over the next few years to meetthe commitments for higher aid made at the 2002Monterrey Conference.
Moreover, the rise in ODA remains even fur-ther below the level required to meet the Millen-nium Development Goals. Analyses performed atthe global and sectoral levels indicate that at least$50 billion annually in additional aid, or a doubling
109
The international forum for defining aid is the Develop-ment Assistance Committee (DAC) of the Organisa-
tion for Economic Co-operation and Development(OECD).a DAC members provided more than 95 percentof international aid flows in 2000. DAC compiles statisticson aid and other official flows on the basis of informationprovided by bilateral and multilateral agencies.b
DAC donors provide two categories of aid—officialdevelopment assistance (ODA) and official aid. The twoforms are similar, except that only developing countrieslisted on Part I of the DAC “List of Aid Recipients” are eligible to receive ODA. Only ODA may be counted byDAC countries as part of their “aid effort,” the donorcountry’s aid budget relative to its GNI.
ODA comprises loans or grants to developing coun-tries and territories provided by donor governments andtheir agencies for the purpose of promoting economic de-velopment and welfare. If the assistance is provided in theform of a loan it must be extended on concessional finan-cial terms, that is, with a grant element of 25 percent ormore, calculated as the net present value of the futurepayment stream discounted at 10 percent.
Countries on Part II of the DAC list—which includescountries in Eastern and Central Europe, the Russian Federation, other independent republics of the former
Soviet Union, and a few high-income countries (FrenchPolynesia, Israel, New Caledonia)—receive official aid.
Aid flows to developing countries can be presentedfrom two perspectives, the donors’ or the recipients’. Table 4.1 reports ODA provided by DAC donors—bilateral disbursements of concessional financing to developing countries plus concessional financing providedby bilateral donors to multilateral institutions (for exam-ple, IDA). By contrast, table 4.2 reports disbursements ofconcessional finance received by developing countries fromboth bilateral and multilateral sources. The two measureswill not be the same, in part because some middle-incomecountries receive official aid, but mostly because fundingreceived from donors by multilateral institutions does notmatch those institutions’ disbursements to developingcountries in any given year.
As reported in the text, a portion of what is countedas ODA does not represent funds disbursed directly to de-veloping countries. This includes debt relief on nonconces-sional loans and the administrative costs of running donoragencies. In addition, a portion of technical assistancefunds is paid directly to consultants from industrial coun-tries, rather than to developing-country governments.These three categories of net ODA amounted to $23.9 bil-lion in 2002, or 40 percent of net ODA (box table).
Box 4.1 Defining aid
a. The members of DAC are Australia, Austria, Belgium, Canada, Denmark, Finland, France, Germany, Greece, Ireland, Italy, Japan, Luxembourg, the Netherlands, New Zealand, Norway, Portugal, Spain, Sweden, Switzerland, the United Kingdom, and the United States.b. The data discussed here appear in OECD 2003. DAC will publish data for 2003 in May 2004.
ODA by DAC donors, 1996–2002$ billions
1996 1997 1998 1999 2000 2001 2002
Official development assistance 55.6 48.5 52.1 56.4 53.7 52.3 58.3of which:
Technical cooperation 14.1 12.9 13.1 13.0 12.8 13.6 15.5Debt relief 3.4 3.1 3.0 2.3 2.0 2.5 5.3Administrative costs 2.9 2.7 2.8 3.0 3.1 3.0 3.1
Source: OECD Development Assistance Committee.
gdf_106-125.qxd 4/6/04 1:04 PM Page 109

G L O B A L D E V E L O P M E N T F I N A N C E 2 0 0 4
of current aid levels, will be required to meet thegoals (World Bank 2003a). Analysis at the countrylevel shows that countries with relatively good poli-cies could effectively use substantial increases in aid.
Net official financeNet official financing to developing countries isestimated at $28 billion in 2003, a drop of $7 bil-lion from the previous year and just over half thelevel of 2001 (table 4.2). The sharp decline is due toa steep decrease in the use of emergency financingpackages by the International Monetary Fund(IMF), particularly in comparison with large netdisbursements in 2001, and to prepayments ofloans to the World Bank. Net bilateral lendingremained negative, as bilateral donors continued toreduce their lending in favor of grants and somedeveloping countries made further repayments tothe Paris Club under past rescheduling agreements(World Bank 2003d). Grants increased, reflecting astep-up in donors’ efforts to increase developmentassistance in general and to boost resources tocountries affected by recent international conflicts.3
Net lending from the World Bank fell from�$4.1 billion in 2002 to �$6.4 billion in 2003,largely due to $7.2 billion in prepayments of out-standing International Bank for Reconstructionand Development (IBRD) loans. This followed pre-payments of $3.2 billion in 2002—led by China,India, and Thailand (figure 4.2)—and $0.3 billionin 2001. Most of the loans being repaid are SingleCurrency Pool loans and Currency Pool loans. Theprepayments have been made possible by the steadyrise in developing-country reserves in recent years(see chapter 1) and the simultaneous decline ininterest rates. Most creditworthy countries can nowborrow at lower rates than the 4–5 percent charged
on pooled loans. LIBOR (the London interBank of-fered rate, the base used for many emerging-marketloans) stands at less than 2 percent, and the spreadover LIBOR paid by the most creditworthy devel-oping countries can be as low as 100 basis points.
Prospects for a rise in official aid
While aid flows remain well below the levelsof a decade ago, major donors have pledged
to increase them and vowed to improve aid effec-tiveness (table 4.3). The United States and theEuropean Union agreed to expand their aid pro-grams in the context of discussions surroundingthe International Conference on Financing for De-velopment in Monterrey, Mexico (March 18–22,2002). Those pledges express the intent of OECDgovernments, although actual disbursements willbe subject to future decisions and the normallegislative processes of each donor country. TheOECD estimates that if all DAC countries were tomeet their expressed commitments, aid would rise
110
Table 4.2 Net official financing of developing countries, 1990–2003 $ billions
1990 1997 1998 1999 2000 2001 2002 2003a
Total 54.2 38.4 60.9 42.2 22.8 54.8 35.3 28.0Grants 27.7 25.3 26.7 28.5 28.7 27.9 31.2 34.3Net lending 26.5 13.2 34.2 13.7 �5.9 26.9 4.1 �6.3Multilateralb 15.5 19.8 37.4 15.9 0.9 34.6 14.7 6.5Concessional 6.7 7.6 7.4 7.0 5.6 7.3 7.5 6.4Nonconcessional 8.8 12.3 30.0 8.8 �4.7 27.3 7.2 0.1
Bilateral 11.0 �6.6 �3.2 �2.2 �6.8 �7.7 �10.6 �12.8Concessional 8.5 0.2 2.0 5.0 0.7 1.6 �1.8 �1.0Nonconcessional 2.4 �6.9 �5.2 �7.2 �7.5 �9.3 �8.8 �11.8
a. Estimate.b. Includes IMF.Source: OECD Development Assistance Committee.
Figure 4.2 Geographical distribution of IBRDprepayments, 2002
Estonia
Chile
ThailandIndia
OthercountriesChina
Source: World Bank.
gdf_106-125.qxd 4/6/04 1:04 PM Page 110

T H E C H A N G I N G L A N D S C A P E F O R O F F I C I A L F L O W S
by 31 percent by 2006 and the ratio of ODA toGNI would increase to 0.26 percent. Even this levelwould remain well below the ratio of 0.33 percentconsistently achieved until 1992, but would repre-sent a substantial rise from current levels. Somecountries have made further commitments toincrease ODA beyond 2006. The internationalcommunity should do its utmost to ensure thatthese existing commitments are met.
Aid commitments from the United StatesThe United States has proposed an increase inforeign aid through two channels. The MillenniumChallenge Account (MCA) should provide $5 bil-lion per year in additional aid to developing coun-tries, with funding based on 16 economic andpolitical indicators, including control of corruption,rule of law, primary education completion rate,country credit rating, and trade policy. Accordingto the U.S. Department of State (2003a), if theallocations were made today, 10 to 20 countries
would likely be presented for Board review. Thereare concerns about the geographical distribution ofaid under the MCA. Brainard and Driscoll (2003)argue that, under the proposal, only three Africancountries would qualify for aid in the second year,due to their poor performance on governance andpolicy indicators. They advocate grading the per-formance of African governments relative to othercountries in the region. Data are likely to be scarce,particularly for the poorest countries. For exam-ple, only 63 of 115 potentially eligible MCA coun-tries have data for “days to start a business.” Thefinal recommendation on country allocations isto be made by a board, which should provide forflexibility in cases where data are unavailable.
Additionally, the U.S. government (Office ofthe President 2003) has pledged $15 billion overfive years to 14 countries in Sub-Saharan Africaand the Caribbean to prevent new HIV infections,provide antiretroviral treatment to those infected,and offer care for sufferers and AIDS orphans.4
World Bank staff estimates suggest that ifMCA and HIV/AIDS commitments are honored,U.S. aid could increase from 0.13 percent of GNIin 2002 to 0.21 percent by 2006. Realizing thisincrease depends, however, on the willingness ofthe U.S. Congress to allocate funds. Even given suf-ficient appropriations, the timetable for disbursingfunds may be optimistic, given the difficulties inmaking such programs operational (Birdsall,Shapiro, and Deese 2003).
Planned increases in European aidParticipants in the Barcelona Summit in March2002 agreed to increase ODA as a proportion ofGNI for the entire European Union to 0.39 per-cent by 2006 (up from 0.35 percent in 2002), withno member state contributing less than 0.33 per-cent. The pledge is estimated to provide an addi-tional $7 billion a year. According to the EuropeanCommissioner for Development and Humanitar-ian Aid, Poul Nielson (2003), the EU remainscommitted to reaching the U.N. goal of 0.7 per-cent. Since Barcelona, member states have madeadditional ODA pledges. The OECD estimatesthese new commitments, if honored, would raiseODA from the European Union in 2010 to $44 bil-lion, or 0.44 percent of GNI. These estimates arebased on the current EU membership; that is, theydo not reflect the accession of Eastern Europeancountries.
111
Table 4.3 Aid commitments and announcementsafter the Monterrey Conference, March 2002 Additional aid as % GNI
ODA/GNI in Recent Year to beCountry 2002 announcement attained
Australia 0.26 0.26 2003–04Austria 0.26 0.33 2006Belgium 0.43 0.70 2010Canada 0.28 8% annual increase To 2010Denmark 0.96 0.70 n.a.Finland 0.35 0.44 (0.70 by 2012) 2007France 0.38 0.50 2007Germany 0.27 0.33 2006Greece 0.21 0.33 2006Ireland 0.40 0.70 2007Italy 0.20 0.33 2006Japan 0.23 1998–2002 average In 2006
level ($10.5 bn)Luxembourg 0.77 1.00 2005Netherlands 0.81 0.80 n.a.New Zealand 0.22 Future level under n.a.
reviewNorway 0.89 1.00 2005Portugal 0.27 0.33 2006Spain 0.26 0.33 2006Sweden 0.83 Long-term goal 1% n.a.
(at least 0.87% in 2006)Switzerland 0.32 0.40 2010United Kingdom 0.31 0.40 2005–6United States 0.13 $7bn increase 2006
Memo item:European Union 0.35 0.44 2010
Note: n.a. � not applicable. Excludes reconstruction spending onIraq and Afghanistan.Source: OECD Development Assistance Committee.
gdf_106-125.qxd 4/6/04 1:04 PM Page 111

G L O B A L D E V E L O P M E N T F I N A N C E 2 0 0 4
Sub-Saharan Africa will likely be a major recip-ient of increased European aid. It received 41 per-cent of EU member states’ aid in 2001 (figure 4.3),and G-8 countries pledged at the Kananaskis sum-mit in 2002 (reaffirmed at the 2003 Evian summit)to spend at least 50 percent of new resources fordevelopment on African countries.
In January 2003, the British governmentlaunched a proposal to establish an InternationalFinance Facility (IFF). If approved by the interna-tional community, the IFF would require partici-pating donors to state their commitments to aidover the next 30 to 35 years. Bonds will be issued ininternational capital markets on the back of thesepledges, resulting in the aid becoming availableimmediately. The benefit of providing resources upfront to aid recipients, many of whom desperatelyneed funds to meet current consumption needs,would greatly exceed the interest cost of the bonds.Assuming that commitments by donors rise overtime, as envisioned under the Monterrey Consen-sus, commitments and possible disbursementsunder the IFF may follow the pattern of figure 4.4.
The precise legal framework and the details ofthe covenants of IFF-issued bonds have yet to bedetermined. But the proposal suggests that theindividual donors will bear the ultimate responsibil-ity for repaying the bonds. The international capitalmarkets will likely view any failure to honor com-mitments to the IFF as a default by the donor inquestion. Under this initiative, however, as the donorcountries are likely to be DAC members, creditwor-thiness risk is likely to be low; it is envisaged thebonds will receive a triple-A rating (DFID 2003b).
While the IFF bonds would be repaid bymoney disbursed by the donor countries, thebonds are structured so that they would be contin-gent liabilities and thus not counted as increasingthe fiscal deficit or national debt. Given the fiscalproblems of many donors, treating the bondsas contingent, rather than direct, liabilities couldease acceptance of the proposal. To be excludedfrom national debt, the bonds must meet twoconditions:
• The obligation of the donor to make commit-ted annual payments to the IFF must not beautomatic, but instead conditional on thebehavior of the aid recipients. The UnitedKingdom has proposed two conditions underwhich donors would fail to provide pledgedcontributions with respect to a recipient: ifthe recipient falls into prolonged arrears tothe IMF or becomes subject to United Nationssanctions (DFID 2003a). This approach intro-duces some tension into how the IFF wouldwork. Investor confidence in repayment of thebonds, and hence the interest rate charged,will depend on there being little risk that recip-ients would not meet the conditions. However,there must also be some probability that theconditions would not be satisfied or else theIFF commitments would be viewed as directliabilities of the donor governments.
• There must be a transfer of some decision-making control over disbursements of fundsto an organization other than the donor. It isnot clear what organization—an existing
112
Source: OECD Development Assistance Committee.
South andCentral Asia
Middle East andNorth Africa
Latin Americaand the Caribbean
South East Asia
Sub-SaharanAfrica
Figure 4.3 Geographical distribution of officialdevelopment assistance from the EuropeanUnion, 2002
Europe
Figure 4.4 Possible commitments and disbursementunder the International Finance Facility, 2006–32
$ billions
Source: DFID 2003a, 2003b.
0
10
20
30
40
50
2012
2016
2014
2018
2020
2024
2022
2026
2028
2030
2032
2010
2008
2006
CommitmentsIFF disbursements
gdf_106-125.qxd 4/6/04 1:04 PM Page 112

T H E C H A N G I N G L A N D S C A P E F O R O F F I C I A L F L O W S
international institution or a new one?—mightfulfill this role.
The IFF is designed to increase aid flows inthe run-up to 2015, the date set for achieving theMillennium Development Goals. Presumably, theincrease in aid prior to 2015 would be balanced bya decline in aid afterward, as aid budgets wereused to pay off IFF debts. Donor countries mayagree, however, to an increase in their aid budgetsafter 2015, offsetting some of the debt repaymentsunder the Facility.
Strategic considerations and aid flows
Since the tragic events of September 11, 2001,and recent international conflicts, strategic con-
siderations have figured prominently in the chang-ing landscape of official flows. According to theU.S. Department of State (2003b), 134 acts of ter-rorism were committed in 22 developing countriesin 2002, many of which had pledged support forthe U.S. stance on terrorism. Strategically directedforeign aid is one means of helping countries trackterrorist organizations, choke off their access tofunding, and destroy their networks. The events ofSeptember 11 are believed to have been decisive ingalvanizing donor commitments to increase ODAin the run-up to the Monterrey Conference of 2002(Nielson 2002).
Strategic considerations—such as the ColdWar, voting rights in the United Nations, and colo-nial relationships—historically have been influen-tial in determining bilateral aid flows (Alesina andDollar 1998). Strategic considerations are moreimportant than policy (such as democratic ac-countability and openness to trade) in determiningthe amount of aid a country receives above the av-erage (figure 4.5). And they vastly outweigh moti-vations based on the need of the recipient, such asbalance of payments imbalances and the level ofabsolute poverty (McKinlay and Little 1979).
Recent data indicate that strategic considera-tions may be affecting the allocation of aid. Aid toAfghanistan and bordering countries—Pakistan,Tajikistan, Turkmenistan, and Uzbekistan—increased from $1.1 billion in 2000 to $3.7 billionin 2002 (table 4.4). In mid-2003 the Bush adminis-tration sought a new aid package for Pakistan($3 billion) and asked for $21.1 billion for fiscalyear 2004 for reconstruction efforts in Iraq and
Afghanistan.5 The immense development chal-lenges facing these countries, which would requireincreased aid regardless of their strategic position,are discussed in box 4.2.
Substantial resources will be required forIraq’s reconstruction. The World Bank, UnitedNations, and Coalition Provisional Authority esti-mate that Iraq will require a total of $55 billionfrom donors for 2004–07. Infrastructure projects—electricity, water and sanitation, solid waste, trans-port, telecommunications—account for almosthalf the total. This estimate assumes a stablesecurity situation, a rise in oil revenues, and aneconomic recovery that generates substantial taxrevenues. At the International Donors’ Conferencefor the reconstruction of Iraq, held in Madrid inOctober 2003, more than $33 billion was pledgedthrough 2007 in the form of loans, grants, andexport credits. The largest pledges were from theUnited States ($20.3 billion), Japan (up to $5 bil-lion), the World Bank ($3–5 billion), and the IMF($2.5–4.25 billion) (figure 4.6). These pledgesleave an estimated shortfall of $22 billion in meeting
113
Figure 4.5 Reasons for additional aid to a country
Source: Alesina and Dollar 1998.
80
20
37
70
600 20 40
Aid per capita, % increase
Being relativelyopen to trade
Being relativelydemocratic
Having longercolonial past
Table 4.4 Net ODA to Afghanistan and neighboringcountries, 1998–2002$ millions
1998 1999 2000 2001 2002
Afghanistan 154 142 141 403 1,261Pakistan 1,057 732 702 1,934 2,099Tajikistan 160 122 124 167 167Turkmenistan 16 21 16 40 32Uzbekistan 144 134 151 124 174
Total 1,531 1,151 1,133 2,668 3,733
Source: OECD Development Assistance Committee.
gdf_106-125.qxd 4/6/04 1:04 PM Page 113

G L O B A L D E V E L O P M E N T F I N A N C E 2 0 0 4
114
Postconflict economies face enormous challengesin making the transition to peace. Spurring develop-
ment in Afghanistan, the Democratic Republic of Congo,Iraq, Liberia, Solomon Islands, and Timor-Leste requiresreconstructing physical, economic, and social infrastruc-ture as well as building institutions that maintain security,promote reconciliation, and are seen as legitimate in theeyes of the local population. Some argue that conflictresolution, as a global public good, should be borne bythe entire international community (Kaul, Grunberg, andStern 1999).
Many postconflict societies remain vulnerable torelapsing into violence. Providing additional resources(through ODA or debt relief) helps finance broad-basedpublic spending to redress grievances—and therebymay tip the balance toward peace (Addison and Murshed2001). This is particularly true if international supportis coordinated (Michailof, Kostner, and Devictor 2002).Collier and Hoeffler (2002) find evidence that in the first10 years of peace, postconflict countries have twice the absorptive capacity for aid as in normal times. Many havegreat need for additional aid resources to address specialproblems. The under-five mortality rate in Afghanistan, for example, is 260 per 1,000 live births—far more thanthe average of 121 for the poorest countries. The primary-education completion rate in Yemen and Pakistan is 58 and 59 percent respectively—far below the average of78 percent for the low-income countries. In a few cases,however, aid may exacerbate conflict by encouraging
competition for resources (Hannington 1992 cites the example of Somalia).
Beyond the immediate humanitarian concern ofproviding sustenance, shelter, and emergency medical treatment to those in need, postconflict societies face four main challenges:
• The reconstruction of government and legal struc-tures. The collapse of a regime often leaves a powervacuum, not only giving rise to looting, but also creating a risk of social fragmentation. The estab-lishment of functioning institutions of law and order is a prerequisite to poverty reduction and economic development (Michailof, Kostner, and Devictor 2002).
• The reconstruction of physical infrastructure. Con-flicts lead to the destruction of bridges, roads, schools,and hospitals while disrupting electricity and watersupplies. They also can create additional hazards forthe civilian population. For example, land mines are a severe problem in countries such as Angola, Bosnia-Herzegovina, Eritrea, and Somalia.
• The reconstruction of the monetary and financialsystem. Conflicts often weaken or destroy a currency,severely damage financial infrastructure, deplete mar-kets, and halt productive activity. Economic recoveryis vital to stabilize an often fragile peace, requiring areliable medium of exchange, a functioning financialsystem, resolution of the outstanding debt position,
Box 4.2 Aid and the challenges of postconflict reconstruction
Iraqi reconstruction needs. The Madrid conferencealso agreed to address Iraq’s heavy burden of ex-ternal debt, estimated at more than $120 billionby the Paris Club. As yet, no agreement has beenreached on the terms of debt restructuring. There isgreat uncertainty about how and when pledges willmaterialize, and about whether, in some cases, theyreflect pre-existing allocations.
The allocation of aid according to strategic con-siderations can impair aid effectiveness. Where aidis provided to corrupt, repressive, or incompetentgovernments it can strengthen their legitimacy,encourage poor governance, and prolong the dura-tion of the regime, as occurred with the distributionof aid to Zaire during the Cold War (Lancaster1999). Trade, fiscal, and monetary policies in Zairedeteriorated almost continually from the early1970s to the late 1980s, as aid flows as a percentage
Figure 4.6 Distribution of donor pledges made atMadrid Conference, October 2003
SpainOthers
Europe
Italy
United KingdomKuwait
Saudi Arabia
IMF
WorldBankWorldBank
Japan
United States
Note: The World Bank and IMF pledged $3–5 billion and$2.55–4.25 billion, respectively. The above chart showsthe mean for both institutions.Source: World Bank estimates.
gdf_106-125.qxd 4/6/04 1:04 PM Page 114

T H E C H A N G I N G L A N D S C A P E F O R O F F I C I A L F L O W S
of the country’s GDP rose from around 2 percent toaround 6 percent (Burnside and Dollar 1997).
Aid allocated for strategic reasons is not alwaysused inefficiently. The Marshall Plan, designed tofacilitate a European economic recovery in the after-math of World War II, had additional objectives—among them resisting the global expansion ofcommunism. Over several years, the Marshall Planprovided $100 to $200 per inhabitant per year toWestern Europe (in 2001 prices). The cumulativetotal was almost $1,000 per person. By contrast, aidper capita to Sub-Saharan Africa was $21 in 2001.6
Did the aid to Europe work? In postwarWestern Europe, GDP growth averaged 4 percentper year from 1950 to 1973, compared with 1 per-cent for 1913–1950. However, economic policies(such as trade liberalization and effective demandmanagement) and the boost provided by recoveryfrom the devastation of the war were the main rea-sons behind the impressive GDP growth in postwar
Western Europe. Nevertheless, the Marshall Planprovided vital international finance for the impor-tation of capital goods needed in reconstruction.
Progress in raising aid effectiveness
The Monterrey Consensus called for more aidto developing countries and better policies in
those countries to improve the effectiveness of re-sources. The two parts of the consensus are obvi-ously connected—it is easier to justify additionalresource flows if aid is shown to be effective.Improving aid effectiveness requires actions bydonors and recipients to strengthen their policies.Here we focus on selected recent proposals, andprogress in ongoing programs, that contributed toor may contribute to aid effectiveness.
Proposals for new aid initiatives from majordonors, aimed at raising the volume of aid, hold
115
creation of jobs, and payment of civil servants(Michailof, Kostner, and Devictor 2002).
• The reconstruction of social capital. Wars oftenweaken the productive element of the population,increase numbers of refugees, and cause elites to flee,leaving a shortage of trained personnel and little insti-tutional capacity for reconstruction. On top of thesechallenges, ex-combatants often need to be reintegratedinto society through education and work programs andthe reestablishment of trust between communities.
These challenges require a variety of skills—notablylogistical abilities to arrange immediate food relief, butalso engineering, policing, economic management, andrefugee repatriation and resettlement. Because agenciesvary in their comparative advantages, reconstruction mustbe a collaborative process. The mistakes made in countriessuch as Cambodia, where competing donor interests andpolicies and a lack of coordination among agencies dimin-ished the effectiveness of aid, need to be avoided in thefuture (Karim and Hess 2001).
For a sample of 17 postconflict countries in the 1990sand early 2000s, aid more than doubled immediately afterthe conflict, dropped by almost 40 percent in the next year, and then gradually returned to preconflict levels bythe sixth year (see figure). ODA to postconflict countries is dominated by bilateral donors, which mainly provide
Box 4.2 (continued)
Distribution of official aid following the onset of peace intime t � 0
ODA, base year � t � 1
Sources: World Bank staff estimates using data from OECD DevelopmentAssistance Committee and GDF, various years.
0
50
100
150
200
250
300
Other multilateralsBilaterals
IDARegional development banks
t � 1 t � 1 t � 2 t � 3 t � 4 t � 5 t � 6t � 0
emergency assistance, while contributions from the Inter-national Development Association are relatively stable. Initially, humanitarian assistance dominates aid; after thefirst year, reconstruction assistance takes over (Demekasand others 2002).
gdf_106-125.qxd 4/6/04 1:04 PM Page 115

G L O B A L D E V E L O P M E N T F I N A N C E 2 0 0 4
some potential for increasing the effectiveness ofthat aid, in part by making it more stable and pre-dictable. The evidence is mixed on whether aidin fact has been more volatile than other sourcesof government revenues.7 It does appear that aidcommitments provide insufficient information toreliably predict disbursements (Bulir and Hamman2003). In any event, it is clear that large, unex-pected shifts in the volume of aid can disruptmacroeconomic management and erode the effec-tiveness of aid-financed expenditures. Commit-ments by donors concerning the overall volume ofaid, combined with more transparent mechanismsfor allocating some aid expenditures (for example,under the U.S. Millennium Challenge Account),may provide some further information to aid re-cipients concerning likely aid levels. Relying onmultiyear commitments to obtain aid resourcesfrom the capital markets (rather than basing eachyear’s disbursements on government appropria-tions), as proposed under the IFF, also would in-crease the predictability of aid expenditures.
Strong governance and effective economicpolicies are essential for aid effectiveness. The allo-cation of funds according to economic and polit-ical indicators, proposed under the MillenniumChallenge Account, should help channel fundsto good performers and thus raise the effectivenessof aid. Other donors also are stressing the impor-tance of policy performance in their aid allocation.A recent survey indicates that donors increasinglyare emphasizing selectivity in aid allocation, favor-ing recipients with stronger governance, programimplementation, and absorptive capacity (DFID2002). Supporting good performers is one of theBritish government’s fundamental determinantsfor allocating aid. Recipients of aid from theNetherlands are selected on the basis of poverty—and the degree to which they are well governed(Droeze 2002).
Greater emphasis on performance in aid allo-cation does not imply, however, that the better per-formers will necessarily be overwhelmed by in-creases in aid, beyond their ability to use the fundsproductively. First, aid allocations change slowly.Donors are often involved in multiyear programsand have long-term commitments to their aid part-ners. Shifting aid at the margin to better perform-ers is unlikely to result in massive increases indisbursements. Second, the move toward usingthe quality of the policy regime in deciding aid
allocations does not mean that other motivationsfor aid are ignored. Indeed, recent internationalconflicts are likely to reinforce strategic motivationsfor aid in some donor programs.
Most important, the better performing recipi-ents are better able to absorb increased aid re-sources effectively. While the productivity of aidis subject to the law of diminishing returns, it de-pends most closely on the policy and institutionalenvironment of the recipient country. A study of18 aid recipients that have improved their policiesover the past decade, continue to use aid produc-tively, and have significant unmet developmentneeds, shows that all could benefit from substan-tial increases in aid beyond current levels (WorldBank 2003a).
Poverty Reduction Strategy Papers More focused aid allocations to the better perform-ers have been helped by the adoption of the PovertyReduction Strategy Papers. Prepared by developingcountries, PRSPs set out a program of action to re-duce poverty with help from development partners.Considerable progress has been made in the PRSPprocess.8 As of January 2004, 35 countries hadcompleted their full PRSPs, and 12 countries hadbeen implementing the strategy for at least oneyear and produced a PRSP Progress Report. Anadditional 19 countries had embarked on thePRSP process, after finalizing their interim PRSPs(figure 4.7). The PRSP process is helping to improvedonors’ and recipients’ policies although progresshas been limited in some areas:
• More open and participatory processes areoften being sustained during implementation.Several NGOs have praised efforts to broadenparticipation, although many remain dissatis-fied with the process.
• Government ownership has improved, asshown by more engagement by parliaments andimproved dialogue between PRSP teams andline ministries, but further progress is requiredin integrating the PRSP with other planningdocuments and agencies.
• There are signs of a shift in spending prioritiestoward poverty-reducing spending. In the 14PRSP countries where data are available,poverty-reducing expenditures increased onaverage by 1.4 percent of GDP and 3.9 per-cent of total expenditures from 1999 to 2001.9
116
gdf_106-125.qxd 4/6/04 1:04 PM Page 116

T H E C H A N G I N G L A N D S C A P E F O R O F F I C I A L F L O W S
The increase was most rapid among AfricanPRSP countries.
• The principle that donor support shouldbe aligned around country-owned poverty-reduction strategies is now widely accepted,and PRSPs are enhancing donor coordination.However, donors’ progress in harmonizing as-sistance has been limited by national systems ofprocurement and financial management that donot meet international good practice standards.
• The PRSP process continues to be time consum-ing, with the time from interim PRSP to fullPRSP averaging 20 months. These long prepa-ration times stem from the need to broadenparticipation, obtain adequate technical assis-tance, and adjust to political changes or recoverfrom disruption. They also reflect capacity con-straints, particularly in postconflict countries.
• Particular attention is required to ensure thatthe PRSP process supports the general growthof the economy, a key ingredient for sustained
poverty reduction. Further work is needed torelate macroeconomic targets to the PRSPs’broader goals (for example, to analyze theimplications of achieving debt sustainabilityfor the fiscal path and other policy choices),and to strengthen the links between the sectoralpolicies envisaged in the PRSP and the budget.However, performance has been strong: coun-tries that have completed PRSPs have aver-aged real GDP growth of nearly 5 percent sincethe mid-1990s, a marked improvement overperformance in the 1980–95 period.
New Partnership for Africa’s DevelopmentAfrican countries have engaged in a far-reachingprocess to improve their policy and institutions—and thus to strengthen aid effectiveness. The NewPartnership for Africa’s Development (NEPAD),adopted in July 2001 by African heads of stateas the development plan for the African Union, isintended to enhance regional integration and
117
Figure 4.7 Full, interim, and potential PRSPs, by country, January 2004
Source: World Bank.
IBRD 32914January 2004
Potential PRSFull PRS Interim PRS
Full PRS countries with progress report
BhutanNepalPakistan
Afghanistan
Sri Lanka
Bangladesh
Myanmar
Cambodia
Vietnam
Indonesia
Zimbabwe
Lesotho
Mozambique
MalawiZambia
Burundi
Somalia
Ethiopia
Sudan
Liberia
Nigeria
Togo
Ghana
Coted’Ivoire
Benin
Rep. of YemenEritrea
Armenia
Moldova
Uzbekistan
Honduras
Nicaragua
Bolivia
Madagascar
Uganda
Cameroon
Central AfricanRepublic
Congo
Guyana
Haiti
Bhutan
Mongolia
NepalPakistan
Afghanistan
TajikistanTajikistan
Kyrgyzstan Rep.Kyrgyzstan Rep.
Sri Lanka
Bangladesh
Myanmar
Cambodia
Vietnam
Lao P.D.R.Lao P.D.R.
Indonesia
Timor-Leste
Kiribati
Solomon Is.
Samoa
Vanuatu
Tonga
PapuaNew Guinea
PapuaNew Guinea
Zimbabwe
Lesotho
Madagascar
Mozambique
Malawi
Comoros
RwandaUganda
AngolaZambia
KenyaKenya
Burundi
Tanzania
Somalia
Ethiopia
SudanChad
Mali
BurkinaFaso
BurkinaFaso
Mauritania
GuineaGuineaGuinea BissauSierra LeoneSierra Leone
Liberia
Niger
Nigeria
Togo
Ghana
Coted’Ivoire
Benin
Rep. of Yemen
DjiboutiDjibouti
Eritrea
Armenia
Moldova
Bosnia andHerzegovinaBosnia and
HerzegovinaSerbia & Mont.Serbia & Mont.
AlbaniaAlbania
GeorgiaGeorgia Uzbekistan
AzerbaijanAzerbaijan
Cameroon
Central AfricanRepublic
CongoD.R. ofCongo
Guyana
Haiti DominicaSt. Lucia
GrenadaThe Gambia
St. Vincent and the GrenadinesHonduras
Nicaragua
Bolivia
Cape Verde
SenegalSenegal
Maldives
FYR MacedoniaFYR Macedonia
São Tomé and Principe
gdf_106-125.qxd 4/6/04 1:04 PM Page 117

G L O B A L D E V E L O P M E N T F I N A N C E 2 0 0 4
coordination. Given the secretariat’s limited re-sources, the main thrust of NEPAD’s project activi-ties is to overcome political and administrativeobstacles to development projects (for example,by getting different administrative bodies to worktogether and helping to resolve disagreements bybringing issues to heads of state).
This focus on coordination reflects the mutualdependence of many African economies, includingseveral landlocked countries that must rely onneighbors for the bulk of their international trade.Many of the continent’s major waterways crosstwo or more countries. Diseases such as malariaand AIDS, which have had catastrophic effects onthe African people and their economies, are easilytransmitted across boundaries. The size of manyAfrican economies (21 countries have populationsof fewer than 5 million) means that regional (orcontinental) cooperation has the potential forgreatly reducing costs through economies of scale,as well as for facilitating mutually beneficial tradein natural resources. For example, low-cost sourcesof hydropower have gone unused because ofthe problems involved in producing energy in onecountry for consumption in another, often withtransmission across a third. And physical incompat-ibilities between transport systems (rail lines may beof different gauges or may not link at borders), cou-pled with long delays at customs and other costsinvolved in crossing borders, impede trade amongAfrican economies (World Bank 2000).
One especially important focus for NEPAD isto strengthen governance through the African PeerReview (APR) mechanism. The voluntary APRis designed to focus on economic and corporategovernance—including budget management, auditand accounting procedures, and financial-sectorsupervision. Some political issues also would be
included, such as a review of the capacity of legis-latures and effective anticorruption measures.Presently, Africa compares unfavorably with othercountries on indexes of the quality of governance,institutions, and public services (table 4.5).
A panel of eminent Africans, reporting to theAPR implementation committee, is appointed tooversee the review and select teams to carry out thework. The United Nations Economic Commissionfor Africa will conduct the technical assessment ineconomic governance and management, while theAfrican Development Bank will consider bankingand financial standards (NEPAD 2003). As of July2003, 15 countries had signed up to be reviewed (allAfrica 2003).10 Ultimately, the peer-review processcould serve as a common mechanism of assessmentfor donors as well, thus reducing the administrativedemands on African governments. Donors’ relianceon the APR process would also reduce their owncosts and encourage greater ownership of reformprograms based on the findings of the review.
The APR reflects the African Union’s depar-ture from the principle of noninvolvement in othercountries’ domestic policies. Members of theunion realize with increasing urgency that violenceand abuses of power in individual countries tendto adversely affect neighboring countries—in partthrough reputational effects spilling over nationalborders, as investors may not adequately distin-guish among some countries, but also because vio-lence in one country can indeed spread to others.Further, to the extent that African developmentdepends on regional cooperation (as arguedabove), African countries have an interest in re-ducing instability and improving economic poli-cies across the continent. The APR represents apromising step toward an African mechanism foraddressing these concerns.
118
Table 4.5 Quality of governance, institutions, and public services during the 1990sIndex, 0–10
Government Democratic Quality of Investmentstability accountability Ethnic tensions bureaucracy Law & order Corruption profile
Asian NIEsa 6.8 6.0 8.3 8.2 8.1 6.8 6Asia 6.0 5.5 6.3 5.9 6.5 5.3 5.1Western hemisphere 5.7 6.1 7.4 4.1 5.3 4.9 5.3Africa 5.5 4.4 5.3 3.8 4.8 4.5 4.6World 6.1 6.1 6.8 5.5 6.5 5.6 5.2
Note: NIE � newly industrialized economy. Index runs from 0 to 10, representing averages of annual scores in 1990s. High scores indicatebetter quality. For all groupings, the unweighted average of countries for which information is available. Indicators have been rescaled from 0to 10.a. Hong Kong (China), Republic of Korea, Singapore, and Taiwan (China).Source: Funke and Nsouli 2003.
gdf_106-125.qxd 4/6/04 1:04 PM Page 118

T H E C H A N G I N G L A N D S C A P E F O R O F F I C I A L F L O W S
The Heavily Indebted Poor CountriesInitiative
In 1996 the World Bank and IMF launched theHIPC Initiative to mitigate the debt crisis that
had affected some of the world’s poorest countriesin the 1980s and 1990s. Enhanced in 1999, the ini-tiative aims to provide a permanent exit from debtrestructuring, to promote growth, and to allowresources to be redirected to poverty reduction.
The initiative has made substantial progress inreducing the debt burden of the poorest developingcountries. Twenty-seven heavily indebted poorcountries, or more than two-thirds of the 38 coun-tries that potentially qualify for assistance underthe initiative, have reached the “decision point,”when donors commit to the amount of debt reliefrequired to reach sustainable levels.11 More than$31 billion of debt relief in net present value(NPV) terms has been committed to these 27 coun-tries, making up 85 percent of the total expectedrelief for the 34 HIPCs for which data are available.Most of the HIPCs that have not reached a deci-sion point are constrained by domestic conflict orunsettled transitions from postconflict situations.Also, in some of these countries a concerted inter-national effort would be needed to resolve out-standing arrears.
In the 27 countries that have reached the deci-sion point, the HIPC Initiative has led to a sub-stantial decline in debt stocks and debt service.The NPV of debt for these countries was estimatedat $77 billion before traditional debt-relief mecha-nisms (stock of debt operations involving a 67 per-cent reduction in NPV terms), but only $32 billionafter the full delivery of traditional debt relief andassistance under the HIPC Initiative (further de-clining to $26 billion after additional bilateral re-lief committed by several creditors). Indicators ofdebt sustainability, such as debt-to-exports ratiosand debt-service ratios, are forecast to be cut by50 percent or more after debt relief, to levels com-parable to, or below, those of other low-incomecountries (table 4.6).
The decline in debt-service payments in the27 HIPCs that have reached the decision point,coupled with policy reforms, has made possiblereallocations of funds to address social goals.Poverty-reducing expenditures in the 27 countriesincreased from $6.4 billion in 1999 to $8.4 billionin 2002, or about twice the annual savings in debtservice. The rise in poverty-reducing expenditures
was supported by an increase in donor assistance.Gross official flows to the 27 countries increasedfrom about $8 billion in 1997 to almost $12 bil-lion in 2002, with half of the increase due to HIPCrelief. While it is impossible to know what donorassistance would have been in the absence of theinitiative, the rise in official assistance providessome indication that HIPC Initiative resources maybe additional to other aid, and indeed that theHIPC Initiative, by encouraging policy reform, maybe helping to attract donor finance.
The growing importance of international civil society in development
The growing presence of private groups in in-ternational meetings (around the table and on
the street), the success of major human-developmentcampaigns, and the growing resources allocated byNGOs all reflect the rise of civil society as a majorforce in international development.12
The rise of NGOsPrivate organizations dedicated to political, reli-gious, or charitable causes are not a new phenom-enon. Philanthropic activity in China was strength-ened under Buddhism from at least the eighthcentury, and the Western religious missionarymovements date back to the sixteenth century. Themodern, secular NGO movement has its originsin the Red Cross, begun in the 1860s. AdvocacyNGOs may trace their antecedents to theantislavery movement of the nineteenth century.
NGOs have various goals, activities, posi-tions, and structures. The main sectors of civil
119
Table 4.6 Debt indicators for HIPCs that havereached decision point
Before enhanced HIPC relief atHIPC reliefa completion pointb
NPV of debt-to-exports ratioc 274 128NPV of debt-to-GDP ratio 61 30Debt service-to-exports ratiod 16 8
a. Debt stocks are after traditional Paris Club relief, but before theHIPC decision point. Data refer mostly to end-1998 and 1999 (fordebt service, average of 1998 and 1999).b. Forecast for 2005.c. Exports are defined as the three-year average exports of goodsand services up to the date specified.d. Exports are defined as goods and services in the current year.Source: World Bank.
gdf_106-125.qxd 4/6/04 1:04 PM Page 119

G L O B A L D E V E L O P M E N T F I N A N C E 2 0 0 4
society involved in global development finance aredevelopment NGOs, environmental NGOs, orga-nized labor, policy research institutes, and reli-gious bodies (principally Protestant and RomanCatholic churches). This diversity makes it difficultto define the universe of NGOs, and thus to mea-sure their size and impact. But despite this lack ofprecision, there is little doubt that the number ofpeople and organizations involved in internationaldevelopment activities has grown substantially.
In the 1970s, NGOs had only a marginal rolein development (Fowler 2000). NGOs becamemore important with the debt crisis of the 1980s,and their numbers have mushroomed in thepast decade (Edwards 2001; Zaidi 1999). TheYearbook of International Organizations (Union ofInternational Associations 2001) reports that thenumber of international NGOs increased by about50 percent from the early 1990s. Increases havebeen particularly steep in groups working on globalissues, such as human rights, the rights of women,the environment, and poverty. Several forcesexplain the growth of international NGOs. Global-ization has heightened concern among citizens ofindustrial countries regarding events in the devel-oping world—an altruistic response to better andmore timely news from abroad and a reflection ofthe growing importance of developing countries inthe global economy.
The NGO movement also gained from growingconcern over the effectiveness of aid and state-leddevelopment. Failed aid programs led donors tochannel more resources through nonstate actors(Smillie and others 1999). More broadly, the col-lapse of state-led, one-party systems in EasternEurope and the failure of state direction of the econ-omy in many developing countries—followed bythe direct reduction in the capacity of the state fromthe debt crisis of the 1980s—encouraged donors tochannel funds through NGOs. These developmentsalso stimulated the intense reconsideration of devel-opment policies. Greater emphasis was placed onsocial capital, partnership, and shared ownership askeys to sustainability (Edwards 2001). NGOs wereviewed as closely in touch with the needs of the poor(Tvedt 1998),13 so international NGOs became avehicle for improving aid effectiveness through theircontacts with local NGOs in developing countries.
The end of the Cold War and the global expan-sion of democratic political systems have increasedgovernments’ acceptance of NGOs as legitimate
international actors. During the Cold War, thepotential for civil society groups to have an appre-ciable impact on the development debate waslimited—disputes between communist countriesand the West dominated international discussions,and autocratic regimes repressed dissent in devel-oping countries. But the number of countries withopen political systems has increased significantlyover the past three decades (Freedom House 2003)as the Soviet Union broke up and political systemsin Africa, Asia, and Latin America were trans-formed. Of the 139 countries with ratings from theearly 1970s, 44 moved toward greater freedom asdefined in the ratings; only 17 deteriorated. As in-ternational bodies and domestic politics moved to-ward allowing freer debate, NGOs have naturallygained a greater opportunity to participate.
Technological innovations also have sup-ported the increasing influence of NGOs. TheInternet has facilitated an explosion of informa-tion, greatly expanding the ability of groups withlimited resources to communicate with like-mindedorganizations and the general public. E-mail andthe Internet have greatly eased the challenge oforganizing mass demonstrations.
NGOs allocate a growing amount of assistanceto developing countries, using their own resourcesand those of donors. Although they providedonly 0.2 percent of aid in 1970 (Atack 1999), theynow provide, from their own resources, about$7 billion—roughly one-seventh of DAC ODA(table 4.7). NGOs in the United States providedmore than one-half of the total and (along withGermany) had the highest level of aid relative togross national income. Grants by NGOs tend to be
120
Table 4.7 Aid from private voluntary organizations, 2001
Country $ millions % of GNI
Canada 116 0.02France — —Germany 808 0.04Italy 32 . .Japan 235 0.01United Kingdom 327 0.02United States 4,569 0.04Total DAC countries 7,289 0.03
Memo item:DAC ODA 52,336 0.22
Note: — � not available; . . � negligible. Includes only aid providedfrom organizations’ own resources. Source: OECD Development Assistance Committee.
gdf_106-125.qxd 4/6/04 1:04 PM Page 120
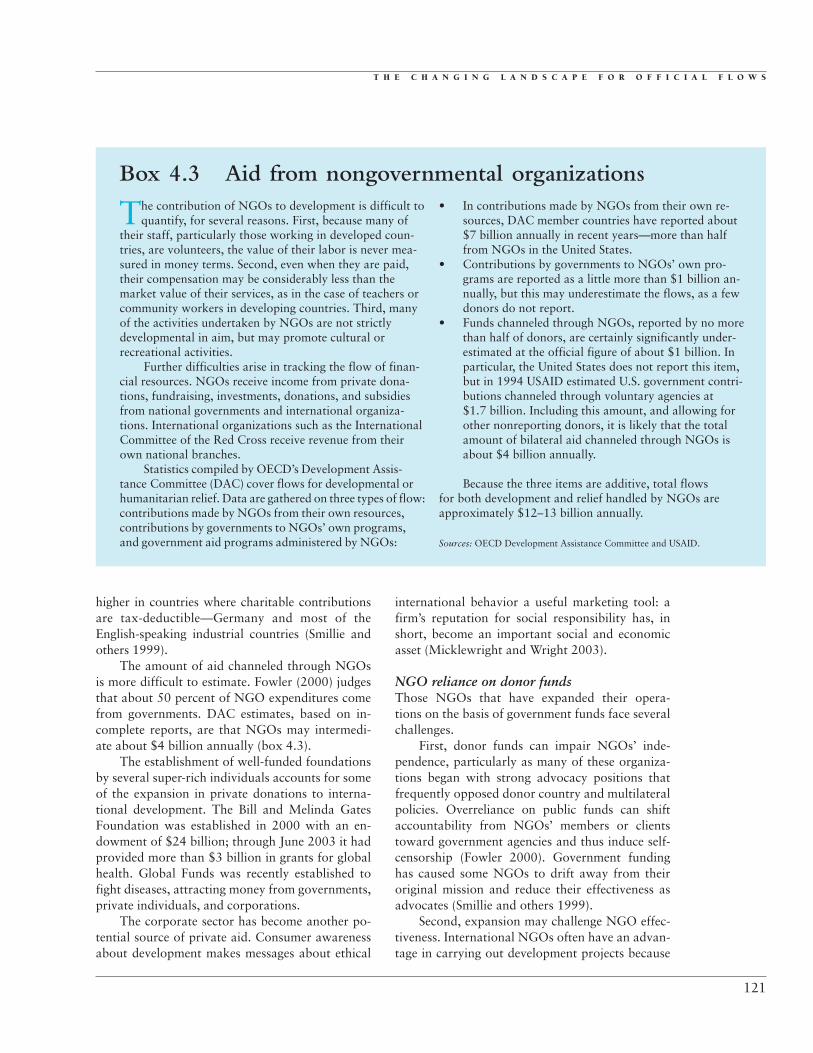
T H E C H A N G I N G L A N D S C A P E F O R O F F I C I A L F L O W S
higher in countries where charitable contributionsare tax-deductible—Germany and most of theEnglish-speaking industrial countries (Smillie andothers 1999).
The amount of aid channeled through NGOsis more difficult to estimate. Fowler (2000) judgesthat about 50 percent of NGO expenditures comefrom governments. DAC estimates, based on in-complete reports, are that NGOs may intermedi-ate about $4 billion annually (box 4.3).
The establishment of well-funded foundationsby several super-rich individuals accounts for someof the expansion in private donations to interna-tional development. The Bill and Melinda GatesFoundation was established in 2000 with an en-dowment of $24 billion; through June 2003 it hadprovided more than $3 billion in grants for globalhealth. Global Funds was recently established tofight diseases, attracting money from governments,private individuals, and corporations.
The corporate sector has become another po-tential source of private aid. Consumer awarenessabout development makes messages about ethical
international behavior a useful marketing tool: afirm’s reputation for social responsibility has, inshort, become an important social and economicasset (Micklewright and Wright 2003).
NGO reliance on donor fundsThose NGOs that have expanded their opera-tions on the basis of government funds face severalchallenges.
First, donor funds can impair NGOs’ inde-pendence, particularly as many of these organiza-tions began with strong advocacy positions thatfrequently opposed donor country and multilateralpolicies. Overreliance on public funds can shiftaccountability from NGOs’ members or clientstoward government agencies and thus induce self-censorship (Fowler 2000). Government fundinghas caused some NGOs to drift away from theiroriginal mission and reduce their effectiveness asadvocates (Smillie and others 1999).
Second, expansion may challenge NGO effec-tiveness. International NGOs often have an advan-tage in carrying out development projects because
121
The contribution of NGOs to development is difficult toquantify, for several reasons. First, because many of
their staff, particularly those working in developed coun-tries, are volunteers, the value of their labor is never mea-sured in money terms. Second, even when they are paid,their compensation may be considerably less than the market value of their services, as in the case of teachers orcommunity workers in developing countries. Third, manyof the activities undertaken by NGOs are not strictlydevelopmental in aim, but may promote cultural or recreational activities.
Further difficulties arise in tracking the flow of finan-cial resources. NGOs receive income from private dona-tions, fundraising, investments, donations, and subsidiesfrom national governments and international organiza-tions. International organizations such as the InternationalCommittee of the Red Cross receive revenue from theirown national branches.
Statistics compiled by OECD’s Development Assis-tance Committee (DAC) cover flows for developmental orhumanitarian relief. Data are gathered on three types of flow:contributions made by NGOs from their own resources,contributions by governments to NGOs’ own programs,and government aid programs administered by NGOs:
• In contributions made by NGOs from their own re-sources, DAC member countries have reported about$7 billion annually in recent years—more than halffrom NGOs in the United States.
• Contributions by governments to NGOs’ own pro-grams are reported as a little more than $1 billion an-nually, but this may underestimate the flows, as a fewdonors do not report.
• Funds channeled through NGOs, reported by no morethan half of donors, are certainly significantly under-estimated at the official figure of about $1 billion. Inparticular, the United States does not report this item,but in 1994 USAID estimated U.S. government contri-butions channeled through voluntary agencies at$1.7 billion. Including this amount, and allowing forother nonreporting donors, it is likely that the totalamount of bilateral aid channeled through NGOs isabout $4 billion annually.
Because the three items are additive, total flowsfor both development and relief handled by NGOs areapproximately $12–13 billion annually.
Sources: OECD Development Assistance Committee and USAID.
Box 4.3 Aid from nongovernmental organizations
gdf_106-125.qxd 4/6/04 1:04 PM Page 121
G L O B A L D E V E L O P M E N T F I N A N C E 2 0 0 4
of their close association with community-level or-ganizations in developing countries. Their historicadvantage is at risk, however, as the scope of theirinterventions increases and as NGOs are encour-aged to expand the scale of projects beyond theirnative capacities (Zaidi 1999). NGOs have alsobeen heavily involved in community-level institu-tional development—a time-intensive process.This focus can be lost when donors require short-term results.
Third, the receipt of donor funds forces NGOsto become more professional in their programplanning, accounting, and reporting results. Atthe same time, their credibility with members andother private donors requires that they keep theiradministrative costs low. As a result, some NGOshave been forced to take contracts simply to coveradministrative costs or have engaged in dramaticfund-raising tactics that impair their credibility(Smillie and others 1999).
NGO impact on local projectsFunds provided by international NGOs have had amajor role in the explosive growth of local NGOsin developing countries. Some observers claim thatthe burgeoning number of local NGOs has beenentirely driven by foreign funding, giving birth tothousands of NGOs in a matter of a few years(Zaidi 1999). Stiles (2002) notes that internationalNGOs were largely responsible for the creationof an NGO community in Bangladesh, and Levine(2002) describes the important role of interna-tional NGOs in funding Tanzanian conservationprograms.
The role of international NGOs in providingand intermediating funds has been subject to someof the same criticisms that have been addressed toofficial aid. Dependence on international NGOscan stifle debate, as local NGOs fail to object tointernational NGOs’ views for fear of losingfunds. Local organizations often must spend anenormous amount of time dealing with demandsfrom international NGOs for reports and evalua-tions (Smillie and others 1999). Moreover, wherethe state is weak, NGO activities can weaken gov-ernment structures by siphoning off competentlocal professionals and by channeling resources tothe provision of services that typically are the gov-ernment’s responsibility (Van Rooy 2002). Reusse(2001) claims that NGOs in Sudan tended to
circumvent inefficient state institutions by work-ing directly with beneficiaries, contributing to theerosion of the authority and legitimacy of localgovernment structures. Of course, it is hard toargue that a poorly served population should bedenied benefits from NGOs because of the poten-tial impact on already ineffective governmentagencies. And the provision of services by NGOs,if properly designed and coordinated, can help tostrengthen the management of government healthservices (see Van Rooy 2002 for an example fromZimbabwe). But this experience does underline thepotential for dependency on international NGOs.
NGO advocacyNGOs have played an important advocacy rolefor decades. Some writers describe a significantexpansion in their influence dating from the earlyto mid-1990s, when NGOs were able to generatepublic pressure to push through an agreement ongreenhouse gases at the 1992 Earth Summit inRio (Hudock 2000). Thereafter, NGOs sought tomobilize public opinion and to influence decision-makers from the 1995 World Summit for SocialDevelopment in Copenhagen (Wildeman 2000).They grabbed headlines with colorful and some-times violent demonstrations during the 1998annual meeting of the World Bank and IMF inBerlin and the 1999 World Trade Organizationmeeting in Seattle (Dawson and Bhatt 2001). It isdifficult to gauge the impact of street protests onspecific agreements; in some cases the violence ofradical groups is seen to have damaged the repu-tation of the movement as a whole. But there islittle doubt that the mass protests have had an ap-preciable impact on the debate over developmentissues.
More measurable success has come in single-issue campaigns, through public advocacy and byexerting influence on government and intergovern-mental organizations. Jubilee 2000 successfullylobbied for reducing the debt burden of the poor-est countries, and hundreds of NGOs workedwith the Canadian government to outlaw land-mines. In fact, the coordinating NGO won aNobel Prize for its efforts. NGOs helped to dis-mantle apartheid in South Africa (Spiro 1995) andplayed a central role in improving conditions forchild laborers in Bangladesh (Edwards 2001).Aston (2001) describes the positive role that NGOs
122
gdf_106-125.qxd 4/6/04 1:04 PM Page 122
T H E C H A N G I N G L A N D S C A P E F O R O F F I C I A L F L O W S
have played in the United Nations by raisingemerging issues, providing expertise, and con-tributing to the consensus-building process. Theyhave met with considerable success in pushing theWorld Bank and IMF to increase the transparencyof their operations (Birdsall 2002).
The success of NGOs in influencing an arrayof development issues inevitably raises the issue ofwhether they are accountable to a broad-based con-stituency. Several observers criticize the limited ac-countability of many NGOs to their members. Thegrowing professionalism of NGO staff and theiraccess to information may confer greater autonomyon leaders vis-à-vis boards or members (Tvedt1998), although this development is common tomost organizations. Nuscheler (2001) notes thatseveral major NGOs have hierarchical structuresthat limit member influence. Many are nonmem-bership organizations, with even fewer constraints(Spiro 1995).14 Nevertheless, leadership activitiesare clearly circumscribed. Outside boards and advi-sory committees can discipline NGO leadership.Some of the larger NGOs have adopted a strictinternal governance structure to reduce or managedisputes. Since the costs of exit are low and noNGO has a monopoly over any issue, members canleave if they object to the leadership. Members ofNGOs that are focused on a small set of issues areprobably in a better position to monitor and disci-pline leadership than are voters in democratic states(Wapner 2002).
The issue of accountability to society ismurkier. Effective advocacy requires coordinationand compromise with other groups (Keck andSikkink 1998). NGOs involved in or associatedwith activities that the broader public finds objec-tionable can see their influence decline. Violencein Seattle and in Washington, D.C., eroded publicsupport for campaigns against the WTO and themultilateral organizations.
NGOs’ growing expertise and public recogni-tion have raised their visibility by earning thema voice in U.N. meetings, World Bank decision-making, and various international negotiations.Such connections—like those with fellow NGOsand the broader public—open NGOs to greaterscrutiny and evaluation. The most influential de-pend on an extensive network of members anddonors. They are thus likely to be responsive to ahost of outside pressures.
Notes1. OECD will publish data for 2003 in May 2004. 2. External debt relief can improve the macroeconomic
environment and free resources to be directed toward devel-opment. However, in some cases the debt service forgivenwould not have been paid in any event, limiting the benefitsin terms of increased resources. The Monterrey Conferenceurged donors to ensure that resources provided for debt re-lief do not detract from ODA resources.
3. The data for developing countries as a group do notinclude Afghanistan or Iraq, for which we lack sufficient in-formation to estimate net flows or the stock of debt. Thesecountries are discussed separately.
4. The countries that will benefit under the EmergencyPlan for AIDS Relief are Botswana, Cote d’Ivoire, Ethiopia,Guyana, Haiti, Kenya, Mozambique, Namibia, Nigeria,Rwanda, South Africa, Tanzania, Uganda, and Zambia.
5. These figures include security-related expendi-tures that are not counted as ODA under the OECD/DACdefinition.
6. Aid flows to the Marshall Plan countries were prob-ably smaller relative to per capita income than aid flows toSub-Saharan Africa are today.
7. See Global Development Finance 2002 for a discus-sion. Bulir and Hamann (2003) provide further evidence ofthe volatility, and to some extent the pro-cyclicality, of aid.
8. Except where other citations are specifically given,this overview of the PRSP process relies on World Bank(2003c).
9. The definition of poverty-reducing expendituresvaries across countries, although many countries includeprimary education and basic health, as well as expendituresfor rural development. Country-specific definitions can befound in World Bank (2003b), appendix table 5.
10. These include Algeria, Burkina Faso, Cameroon,the Democratic Republic of the Congo, Ethiopia, Gabon,Ghana, Kenya, Mali, Mozambique, Nigeria, Rwanda,Senegal, South Africa, and Uganda. Ghana and South Africawill be the first to be reviewed.
11. The 27 countries include 19 that have yet to reachthe completion point (Cameroon, Chad, Democratic Re-public of the Congo, Ethiopia, The Gambia, Ghana,Guinea, Guinea-Bissau, Guyana, Honduras, Madagascar,Malawi, Nicaragua, Niger, Rwanda, Sao Tome andPrincipe, Senegal, Sierra Leone, and Zambia) and 8 thathave reached the completion point (Benin, Bolivia, BurkinaFaso, Mali, Mauritania, Mozambique, Tanzania, andUganda). See World Bank (2003b) for a description of theHIPC Initiative process.
12. We use the term “nongovernmental organizations”to refer to foundations, advocacy groups, and agencies ad-ministering development programs. See Vakil (1997) for adiscussion of alternative definitions.
13. Tvedt (1998) also finds mixed evidence of the abil-ity of NGOs (compared with government, for example) toreach the poor.
14. Here, as elsewhere in discussing NGOs, it is hardto generalize. For example, some membership NGOs doelect their leadership, including Amnesty International andthe Sierra Club.
123
gdf_106-125.qxd 4/6/04 1:04 PM Page 123

G L O B A L D E V E L O P M E N T F I N A N C E 2 0 0 4
References
Addison, Tony, and S. Mansoob Murshed. 2001. “FromConflict to Reconstruction: Reviving the Social Con-tract.” WIDER Discussion Paper 2001/48. World In-stitute for Development Economics Research, UnitedNations University, Tokyo.
Alesina, Alberto, and David Dollar. 1998. “Who GivesForeign Aid to Whom and Why?” NBER WorkingPaper 6612. National Bureau of Economic Research,Cambridge, Mass. June.
allAfrica. 2003. “SA, Ghana First to Be Reviewed byNEPAD.” South African Press Association. July 25.
Aston, Jurij Daniel. 2001. “The United Nations Committeeon Non-Governmental Organizations: Guarding theEntrance to a Politically Divided House.” EuropeanJournal of International Law 12(5): 943–62.
Atack, Iain. 1999. “Four Criteria of Development NGOLegitimacy.” World Development 27(5): 855–64.
Birdsall, Nancy. 2002. “Global Finance: RepresentationFailure and the Role of Civil Society.” In Jan AartScholte with Albrecht Schnabel, eds., Civil Society andGlobal Finance. Warwick Studies in Globalization.London: Routledge.
Birdsall, Nancy, Isaac Shapiro, and Brian Deese. 2003.“How Significant Are the Administration’s ProposedIncreases in Foreign Development Aid?” Center forGlobal Development/Center on Budget and PolicyPriorities, Washington, D.C.
Brainard, Lael, and Allison Driscoll. 2003. “Making theMillennium Challenge Account Work for Africa.”Brookings Institution, Washington, D.C.
Bulir, Ales, and A. Javier Hamann. 2003. “Aid Volatility:An Empirical Assessment.” IMF Staff Paper 50(1).International Monetary Fund, Washington, D.C.
Burnside, Craig, and David Dollar. 1997. “Aid SpursGrowth—in a Sound Policy Environment.” Finance &Development. December.
Collier, Paul, and Anke Hoeffler. 2002. “Aid, Policy, andGrowth in Post-Conflict Societies.” World Bank PolicyResearch Working Paper 2902. Washington, D.C.October.
Dawson, Thomas C., and Ghita Bhatt. 2001. “The IMF andCivil Society: Striking a Balance.” IMF Policy Dis-cussion Paper 01/2. International Monetary Fund,Washington, D.C. September.
Demekas, Dimitri G., Jimmy McHugh, and TheodoraKosma. 2002. “The Economics of Post-Conflict Aid.”IMF Working Paper 02/198. International MonetaryFund, Washington, D.C.
DFID (U.K. Department for International Development).2002. Results of the Survey of Bilateral Donors.Mimeo. London.
———. 2003a. “International Finance Facility.” London.January.
———. 2003b. “International Finance Facility—A Techni-cal Note.” London. February.
Droeze, F. H. 2002. “Selectivity and Allocation Policies forDutch Bilateral Aid.” Policy Planning Unit, Ministryof Foreign Affairs, Government of the Netherlands.Processed.
Edwards, Michael. 2001. “Edwards Urges Building Con-structive Dialogue between IMF and Nongovernmen-tal Organizations.” IMF Survey 30.
Fowler, Alan. 2000. “NGO Futures—Beyond Aid: NGDOValues and the Fourth Position.” Third World Quar-terly 21(4): 589–603.
Freedom House. 2003. “Freedom in the World CountryRatings.” www.freedomhouse.org.
Funke, Norbert, and Saleh M. Nsouli. 2003. “The New Part-nership for Africa’s Development (NEPAD): Opportu-nities and Challenges.” IMF Working Paper 03/69.International Monetary Fund, Washington, D.C. Origi-nally published in “International Country RiskGuide.” Political Risk Services.
Hannington, Brian. 1992. “Food for Guns.” In RobertMiller, ed., Aid as Peacemaker: Canadian Develop-ment Assistance and Third World Conflict. Ottawa:Carleton University Press.
Hudock, Ann C. 2000. “NGOs’ Seat at the Donor Table:Enjoying the Food or Serving the Dinner?” IDSBulletin 31(3): 14–18.
Karim, Farahnaz, and Gregory Hess. 2001. “Thinking aboutAid Management and Peacebuilding in Afghanistan.”Peacepath Discussion Paper. Peacepath Consulting,Rome. November.
Kaul, Inge, Isabelle Grunberg, and Marc A. Stern. 1999.Global Public Goods: International Cooperation inthe 21st Century. New York and Oxford: OxfordUniversity Press.
Keck, Margaret E., and Kathryn Sikkink. 1998. ActivistsBeyond Borders. Ithaca, N.Y.: Cornell University Press.
Lancaster, Carol. 1999. “Aid Effectiveness in Africa: TheUnfinished Agenda.” Journal of African Economies8(4): 487–503.
Levine, Arielle. 2002. “Convergence or Convenience? Interna-tional Conservation NGOs and Development Assistancein Tanzania.” World Development 30(6): 1043–55.
McKinlay, R. D., and R. Little, 1979. “The U.S. Aid Rela-tionship: A Test of the Recipient Need and the DonorInterest Models.” Political Studies 27(2).
Michailof, Serge, Markus Kostner, and Xavier Devictor.2002. “Post-Conflict Recovery in Africa: An Agendafor the African Region.” Africa Region Working PaperSeries 30. World Bank, Washington, D.C.
Micklewright, John, and Anna Wright. 2003. “Private Do-nations for International Development.” U.N.-WideProject on Innovative Sources for Development Fi-nance, New York.
NEPAD. 2003. “African Peer Review Mechanism Organiza-tion and Processes.” NEPAD Secretariat, Pretoria.
Nielson, Poul. 2002. Extracts of a Conversation in Rollnick,Roman, and Jay Newton-Small. “US-EU: A MajorCommitment.” Earth Times. March 18.
———. 2003. “Financing for Development—the Role of theEuropean Union in Development Assistance and inIncreasing ODA.” United Nations Chronicle no. 2.http://www.un.org/Pubs/chronicle/2003/issue2/0203p66.html.
Nuscheler, Franz. 2001. “NGO Scene in the Twilight Zone:Is the Honeymoon Over?” Development and Coopera-tion 6 (November–December): 8–13.
124
gdf_106-125.qxd 4/6/04 1:04 PM Page 124

T H E C H A N G I N G L A N D S C A P E F O R O F F I C I A L F L O W S
OECD (Organisation for Economic Co-operation and De-velopment). 2003. Annual Report on DevelopmentCooperation. Paris.
Office of the President. 2003. “Fact Sheet: The President’sEmergency Plan for AIDS Relief.” http://www.whitehouse.gov/news/releases/2003/01/20030129-1.html. January.
Reusse, Eberhard. 2001. “NGOs at the Crossroads: A Pro-posal for a Future NGO Strategy.” Development andCooperation 6 (November–December): 18–20.
Smillie, Ian, and Henny Helmich, with Tony German andJudith Randel. 1999. Stakeholders: Government-NGOPartnerships for International Development. Paris:OECD.
Spiro, Peter J. 1995. “New Global Communities: Nongovern-mental Organizations in International Decision-MakingInstitutions. Washington Quarterly 118(1): 45–56.
Stiles, Kendall. 2002. “International Support for NGOs inBangladesh: Some Unintended Consequences.” WorldDevelopment 30(5): 835–46.
Tvedt, Terje. 1998. Angels of Mercy or Development Diplo-mats? NGOs and Foreign Aid. Oxford: James Curry.
U.S. Department of State. 2003a. “Millennium ChallengeAccount: Frequently Asked Questions.” http://www.mca.gov/.
U.S. Department of State. 2003b. “Patterns of Global Ter-rorism.” http://www.state.gov/s/ct/rls/pgtrpt/2002/.
Union of International Associations. 2001. Yearbook ofInternational Organizations. Munich: K.G. Saur.
Vakil, Anna C. 1997. “Confronting the ClassificationProblem: Toward a Taxonomy of NGOs.” WorldDevelopment 25(12): 2057–70.
Van Rooy, Alison. 2002. “What Next? Civil Society’sProspects in a World of Global Finance.” In Jan AartScholte with Albrecht Schnabel, eds., Civil Societyand Global Finance. Warwick Studies in Globalisation.London: Routledge.
Wapner, Paul. 2002. “Defending Accountability in NGOs.”Chicago Journal of International Law 3(1).
Wildeman, Caroline. 2000. “The Missing Link: The Roleof Civil Society in the Development Process.” Develop-ment 43(2): 36–39.
World Bank. 2000. Can Africa Claim the 21st Century?Washington, D.C.: World Bank.
———. 2003a. “Supporting Sound Policies with Adequateand Appropriate Financing.” World Bank, Washington,D.C.
———. 2003b. “Heavily Indebted Poor Countries (HIPC)Initiative—Status of Implementation.” World Bankand IMF, Washington, D.C.
———. 2003c. “Poverty Reduction Strategy Papers: Progressin Implementation.” IDA/SecM2003-0468. Washington,D.C.
———. 2003d. Global Development Finance. Washington,D.C.
Zaidi, S. Akbar. 1999. “NGO Failure and the Need to BringBack the State.” Journal of International Development11, 259–71.
125
gdf_106-125.qxd 4/6/04 1:04 PM Page 125

gdf_126-147.qxd 4/6/04 1:03 PM Page 126

5Financing Developing Countries’Trade
TRADE FINANCE—OR LOANS TIEDdirectly to international trade transactions—make an important contribution to devel-
opment. Developing countries’ international trade(exports plus imports) is equivalent to about one-half of their gross national income; finance andrelated services (document preparation, manage-ment of transactions, risk insurance) play a criticalrole in supporting that trade. These services areperhaps even more important for internationalthan domestic trade, because lack of familiaritywith foreign firms and legal systems tends to raisethe risk of international trade.
Trade finance supplies the liquidity necessaryfor efficient trade. Traded goods stand as securityfor banks and other firms, thus enabling less cred-itworthy and poorer countries to expand their ac-cess to international loans. Trade finance also canhelp countries grow rapidly out of crises by ex-porting. Indeed, the World Trade Organizationwas directed at its Fifth Ministerial Meeting inCancún to contribute to efforts to maintain tradefinance during crises.
A host of intermediaries and guarantors areactive in supporting trade finance, including com-mercial banks, goods-producing firms, official ex-port credit agencies, multilateral developmentbanks, private insurers, and specialized firms.
Trade finance is provided in various forms.Direct forms include loans to finance purchases,prepayments by buyers, and delayed payment bysellers. Indirect support comes in the form of in-surance, guarantees, and lending with accountsreceivable as collateral.
In this chapter we discuss the growing impor-tance of trade finance, showing how less credit-worthy countries have increased their access to
127
.
finance by linking transactions to internationaltrade. The main messages that arise from thisanalysis are:
• Participation in international trade can helpless creditworthy countries and firms expandtheir access to finance. Banks are more willingto lend when traded goods are available as se-curity. Suppliers and customers are more wil-ling to extend credit to firms with which theyhave a commercial relationship, because theinformation gained through commercial inter-actions is useful in evaluating creditworthi-ness. Firms involved in international trade,and foreign-owned firms, serve as intermedi-aries that pass on credit to firms (particularlyin poor countries) that lack direct access to in-ternational finance—a fact that underscoresthe importance of open trade and investmentregimes to widening access to finance.
• Trade finance to developing countries rosesharply during the 1990s—for the most partbefore the Asian economic crisis of 1997–98.Commitments from commercial banks mayhave increased fourfold; the exposure of ex-port credit agencies and private insurers roseby a third; and trade credit from firms wasrelatively stable.
• Trade credit from suppliers and customerswas more resilient during crises than wastrade finance from banks. Export credit agen-cies’ exposure declined after crises, probablydue to a drop in demand, but recoveredrapidly.
• Governments can support trade finance by en-suring a sound and efficient financial system.Steps governments can take to strengthen
gdf_126-147.qxd 4/6/04 1:03 PM Page 127

G L O B A L D E V E L O P M E N T F I N A N C E 2 0 0 4
trade finance include providing legal standingfor electronic documents (to facilitate more ef-ficient letters of credit) and for the assignmentof receivables (to encourage factoring).
Evolution in the sources, magnitude,and methods of trade finance
Trade finance is provided by commercial banks,official export credit agencies, multilateral
development banks, insurance firms, suppliers, andpurchasers. While the sources of trade finance areplain enough, the data available from each sourcesuffer from limitations that make it impossible toestimate the global amount of external trade fi-nance provided to developing countries. For com-mercial banks, for example, only a subset of devel-oping countries’ external borrowing is identifiedby purpose, and of that, only data on commit-ments (not disbursements, repayments, or thestock of debt) are reported. Official export creditagencies and private insurers report their expo-sure, but these data have some overlap with banklending, since it is impossible to distinguish be-tween bank loans that are guaranteed or insuredand those that are not. The data on trade creditfrom suppliers and purchasers are taken from in-complete surveys that do not distinguish betweeninternational and domestic sources of finance.Therefore, rather than attempt to provide an esti-mate of trade finance to developing countries, wefocus on the evolution over time of each of the dif-ferent sources.
All in all, it appears that trade finance pro-vided by commercial banks, and trade credit fromsuppliers and creditors, expanded significantlyprior to the East Asian crisis of 1997–98. Tradefinance collapsed with the crisis; thereafter tradefinance from banks and support from exportcredit agencies and private insurers resumed theirupward trend with the expansion of developingcountries’ trade, while trade credit from firmsstagnated.
Trade finance from commercial banksThe available data on trade finance from commer-cial banks, based on publicly reported transac-tions, have mirrored trends in overall bank lendingsince the early 1980s.1 Trade finance commitmentsroughly tripled from the mid-1980s to the early
1990s, peaking immediately before the East Asiancrisis (figure 5.1). In part, this experience reflectedthe overall surge in developing countries’ tradeand in commercial bank lending until 1997; inpart, a shift in bank lending toward trade finance.The share of trade finance in bank lending com-mitments has been subject to considerable cyclicalfluctuation; on average it has risen by 11 percent ayear since the early 1980s (figure 5.2).
Trade finance commitments reported byLoanware were $21 billion in 2002, or about25 percent of total commitments. The Loanwaredatabase provides a sense of the growth of trade
128
1980 1984 1988 1992 1996 20000
5
10
15
20
25
Figure 5.1 Trade finance from market-basedsources, 1980–2002
$ billions
Sources: World Bank and Dealogic Loanware.
1980 1984 1988 1992 1996 20005
10
15
20
25
30
Figure 5.2 Share of trade finance in total banklending, 1980–2002
Percent
Sources: World Bank and Dealogic Loanware.
Growth trend(average 11%)
gdf_126-147.qxd 4/6/04 1:03 PM Page 128

F I N A N C I N G D E V E L O P I N G C O U N T R I E S’ T R A D E
129
finance to developing countries, but it does not in-clude all trade finance transactions. For example,bilateral financing arrangements that are not pub-licly announced are not captured. Thus the dataunderstate the actual level of trade finance.2 Also,the Loanware database includes information oncommitments but not on actual disbursements orrepayments, making it impossible to reliably calcu-late stocks or flows. If the share of trade financein Bank for International Settlements claims ondeveloping countries is the same as the share oftrade finance in Loanware commitments to devel-oping countries, then the stock of outstandingbank claims on developing countries related totrade finance would be on the order of $300 bil-lion, or about one-sixth of developing-country im-ports. As far as the coverage of imports is con-cerned, this would exclude direct loans from
official agencies and trade credit provided by sup-pliers and purchasers.
The average spread on trade finance trans-actions has declined significantly over the past20 years in response to general trends in developingcountries’ borrowing and structural changes intrade finance. Spreads hit a peak of more than 700basis points in the mid-1980s, when major develop-ing-country borrowers were mired in debt. Spreadsfell to 400–450 basis points in 1990–92, and to alow of about 150 basis points with the boom incommercial bank lending to developing countriesbefore the East Asian crisis. The fall in spreads mayalso have been in response to the decline in the useof letters of credit and other forms of documenta-tion (box 5.1). Spreads on trade finance transactionsdo not appear to differ greatly from spreads onother bank lending. For a sample of 10 countries
One incentive for tying financial transactions to trade,as opposed to general lines of credit or unsecured
bonds, is that the traded goods can provide some securityfor the loan. Complicated arrangements have evolved overthe past centuries to balance the lender’s desire for securityin trade finance transactions with the borrower’s need forliquidity. The principal vehicle used is the documentary let-ter of credit, which accounts for 45 percent of all import-export fulfillment transactions (Handal 2001). Under theletter-of-credit system, the importer requests a local bank(the issuing bank) to open a letter of credit in favor of theexporter. A bank in the exporter’s country (the nominatedbank) pays the exporter on the strength of documentsshowing that the goods have been shipped and conform tothe terms of sale. The nominated bank then sends the doc-uments to the issuing bank for reimbursement. The im-porter then collects the documents, presents them to thecarrier, and takes delivery of the goods. Letters of creditprovide liquidity, allow each party to deal with counter-parts in its own jurisdiction, reduce the exporter’s expo-sure to the risk of the importer’s insolvency or nonpay-ment, and reduce the importer’s risk of paying for goodsthat do not meet the contract specifications. On the otherhand, the time required for the shipping and review of doc-uments can be substantial: one-half to two-thirds of docu-ments tendered are inconsistent with the credit terms andare rejected when first presented (Laryea 2001). And any
process that relies on documentary evidence is subject tofraud, such as counterfeiting of documents.
Globalization is reducing the use of cumbersome doc-umentation in trade finance. The share of world trade oc-curring through cross-border production networks, wheremultinationals produce each stage of a final good in a dif-ferent location, has grown significantly (World Bank2003). The long-term relationships required for networkproduction reduce the need for many of the securityarrangements, such as letters of credit, historically usedin trade finance. Trade finance transactions relying on conventional documentary procedures have fallen from91 percent of all transactions in the late 1980s to 32 percentover the past five years (see box table).
Moreover, where letters of credit are still necessary,there is substantial potential for shifting to automated sys-tems. Simple transfer of documentation from paper to theInternet is estimated to save exporters up to 10 days onpreparation and delivery of documents—leading to fasterpayment, earlier access to funds, and reduced administra-tive costs (Anonymous 1999). Even more promising is thepotential to use the Internet to provide a mirror image ofthe physical supply chain (Ivey 2002). Through the Inter-net, banks, traders, and transport companies could be tiedinto a seamless, automated, end-to-end business process(Kreitman 2001) in which credit would be granted andrepaid at precisely the moment of shipment and receipt
Box 5.1 The decline in documentation requirements for trade finance loans
gdf_126-147.qxd 4/6/04 1:03 PM Page 129

G L O B A L D E V E L O P M E N T F I N A N C E 2 0 0 4
130
of goods. Such a system could reduce substantially thehuge amount of working capital tied up in the inventorysupply chain. It also could squeeze costs—just as resource-planning systems did for internal business processes during the 1980s and 1990s.
However, significant barriers confront the transfer to online systems: (a) trade finance documentation is notstandardized, reducing the potential savings from switch-ing to online systems; (b) in some developing countries,government regulations require that documents need astamp in order to have legal standing (Marlin 2003);(c) encryption technologies, and the procedures guardingaccess to passwords, would have to be adequate to ensurethe authenticity of documents; (d) telephone line stabilityand transmission speed, and the availability of Internet ser-vice providers, may not be adequate in many developingcountries (Loong 2002); and (e) the process of education inusing electronic letters of credit is likely to take some time
and result in steady growth rather than immediate, wide-spread adoption (Taylor 2002).
Several companies have offered Internet-based systemsto replace trade documentation, to help evaluate creditrisk, and to support the provision of trade credit at variouspoints in the supply chain (Gamble 2001). And progress isbeing made in defining standard documents. For example,the International Chamber of Commerce has issued asupplement to its Uniform Customs and Practices, calledeUCP, defining the rules for issuance and acceptance ofelectronic trade documents (Marlin 2003). Nevertheless,the extent to which online systems are supplanting papertransactions is unclear. Lee (2001) anticipated that lettersof credit would be replaced, perhaps totally, in a very shorttime. On the other hand, Gamble (2001) believed it wastoo early for Internet-based trade finance providers to havesignificant market penetration, and Ivey (2002) viewedtheir market share as negligible.
Box 5.1 (continued)
Modes of commercial-bank trade finance, 1980–2002 Percent
Mode 1980–85 1986–90 1991–95 1996–2002
Conventional documentation 77 91 62 32Term loans 12 8 33 62Revolving credits 9 1 5 5Other 2 0 0 1
Source: Dealogic Loanware.
where comparable transactions could be identified,trade finance spreads averaged 28 basis points lowerthan spreads on other bank loans over 1996–2002.3
However, this data excludes fees, which may be par-ticularly significant in trade finance.
Trade finance from export credit agencies andthe private insurance marketThe stock of trade finance from export credit agen-cies (including guarantees, insurance, and govern-ment-backed loans) and from the private insurancemarket increased over the 1990s. The InternationalUnion of Credit and Investment Insurers (BerneUnion) reports that the stock of loans and guaran-tees by member organizations rose from $375 bil-lion in 1990 to $500 billion in 20024—a declinefrom about 11 percent of member countries’ ex-ports in 1990 to 7 percent by 2001 (figure 5.3).5
Of this amount, the role of export credit agencies
Figure 5.3 Business covered by export creditagencies and private insurers in Berne Unionmember countries, exports of 1985–2002
% exports
0
10
8
6
4
2
Source: World Bank staff estimates using Berne Union data.
1985 1987 1989 1991 1993 19971995 1999 2001
Short-term
Medium- and long-term
gdf_126-147.qxd 4/6/04 1:03 PM Page 130

F I N A N C I N G D E V E L O P I N G C O U N T R I E S’ T R A D E
has declined relative to the private insurance com-panies. Private insurance companies account fornearly half of new commitments by internationalcredit and investment insurers ($6.7 billion in2002), from a base of close to zero in the early1990s. The apparent rise of private insurers is bol-stered by data showing that the share of developingcountries’ trade finance covered by creditor govern-ment guarantees, and the share going to the publicsector, have fallen by more than 50 percent since1990 (figure 5.4). While the Berne Union does notreport exposure by country, the Organisation forEconomic Co-operation and Development (OECD)reports export credit agencies’ coverage of medium-and long-term flows to developing countries, whichaveraged $36 billion from 1990 to 2001.6
The growth in private insurance in the 1990s.As the private insurance market has become in-creasingly sophisticated in analyzing and mitigatingpolitical risk, the need for guarantees from officialexport credit agencies has diminished (Stephens1999). At the same time, a wave of privatizationsin emerging markets has shifted export risks froma sovereign to a commercial footing. The Interna-tional Monetary Fund (IMF 2001) estimates thatbetween 85 and 95 percent of short-term credit in-surance business within and beyond the EuropeanUnion is now underwritten by private insurers—without the involvement of governments. Thebig players, including AIG, Lloyd’s of London,Sovereign Risk Insurance Ltd, Zurich EmergingMarket Solutions, and Chubb, are now offering
longer policy terms and increased project capacity.The increase in the number of foreign insurers in do-mestic insurance markets in developing countries,such AIG in China, provides these large insurancecompanies with on-the-ground information aboutmarket conditions and improved risk assessment.
Private insurers may have an advantage overofficial export credit agencies in being able to re-spond quickly, providing quotes in days and insur-ing against large risks within weeks, as opposedto months or years for official agencies (Mackie2003). While export credit agencies are believed tobe cheaper on ratings in certain categories, theymay be more expensive in pricing a package ofrisks or a multicountry program (James 2001).This is because the private insurers are in a betterposition to offer discounts for large volumes andfor diversified exporters. In addition, private in-surers generally are better able to offer coveragefor a wide variety of risks (such as business inter-ruption, license-cancellation coverage, and contin-gency risks) than are export credit agencies.
However, the private insurance sector is stillheavily skewed toward short-term export credit. Inthe medium- to long-term business, private insurersconstitute only 0.2 percent of new commitments byBerne Union members. Also, for the large privateinsurers, growth over the past decade has beenaffected by a range of developed-country shocks(such as substantial claims from September 11, thecollapse of equity prices, and low interest rates) thathave affected both claims and investments but havenot affected export credit agencies as directly.
The decline of export credit agencies.The rela-tive decline in the activity of export credit agencieshas been due to several factors. In the 1980s andearly 1990s, export credit agencies experiencedconsiderable losses on their portfolios in develop-ing countries. As a result, the total net cash flowsof Berne Union members was strongly negativeduring the period. Subsequent initiatives and inter-national agreements (including the World TradeOrganization’s Agreement on Subsidies and Coun-tervailing Measures and the 1999 Knaepen Pack-age7 ) have attempted to strengthen the solvency ofthese agencies, factoring in requirements such asminimum country-risk-premium ratios. This, to-gether with the entry of private insurers, has led toa rise in net cash flow for Berne Union membersfrom �$4 billion in 1990 to $11 billion by 2001(figure 5.5). At the same time, pressures to eliminate
131
Figure 5.4 Trade finance for developing countriesfrom public sector or guaranteed by official sector,1980–2002
Percent share in developing-country total
0
100
80
60
40
20
Source: World Bank staff estimates based on Dealogic Loanware data.
1980 1984 1988 1992 1996 2000
From public sector
Guaranteed byofficial sector
gdf_126-147.qxd 4/6/04 1:03 PM Page 131

G L O B A L D E V E L O P M E N T F I N A N C E 2 0 0 4
tied aid and to prevent lending from having unde-sirable economic consequences have restrictedthe type of activities export credit agencies cansupport (box 5.2).
Trade finance from multilateral organizations The multilateral development banks have soughtways to support trade finance transactions andhelp insulate developing-country trade from theparalyzing effects of financial crises. They under-take a host of projects related to internationaltrade, including research, advice on trade policy,assistance with trade negotiations, loans to financetrade-related infrastructure, and technical assis-tance to strengthen institutions that support trade.Here we are concerned only with finance for inter-national, private sector trade transactions by themajor multilaterals lenders. Their trade finance op-erations take various forms, among them guaran-tees of trade instruments issued by local banks andloan facilities on-lent through commercial banks.
In the 1980s, the World Bank was heavilycommitted to trade finance loans, primarily linesof credit to private sector firms engaged in interna-tional trade, with state-owned development banksas intermediaries. This lending peaked in the sec-ond half of the 1980s at $700 million. However,poor financial sector development and repaymentrecords by enterprises have since caused a substan-tial decline. The Bank’s trade finance projects nowsupport insurance schemes to foster the devel-opment of domestic financing capacity, such as
132
�15
�10
�5
0
5
10
15
20
Figure 5.5 Net cash flow from Berne Unionmembers, 1982–2001
$ billions
1982
1984
1986
1988
1990
1992
1994
1996
1998
2000
Source: Berne Union.
Netcash flow
Total recoveries receivedPremium receivedTotal claims paid
regional trade facilitation projects for sevencountries in Sub-Saharan Africa (Tang 2003).
The International Finance Corporation (IFC)provides trade finance facilities to boost long-termeconomic development and to increase foreign-exchange liquidity during crises. Various interven-tions are used, depending on country circumstances.For example, IFC may guarantee a percentage ofinternational banks’ exposure related to confirm-ing letters of credit, booking acceptances, or pur-chasing trade-related notes issued or guaranteedby local banks. Or IFC may extend credit lines fortrade finance directly to local banks, or providefinancing to exporters (backed by receivables orsecuritized exports). IFC-supported trade financepackages to countries hit by crisis totaled about$1 billion in 2003 (Brujis 2003).
The Trade Facilitation Programme of the Euro-pean Bank for Reconstruction and Development(EBRD) provides guarantees against the politicaland commercial risk of transactions undertaken byissuing banks. Among other instruments, guaran-tees cover letters of credit, advance payment guaran-tees and bonds, bills of exchange and trade-relatedpromissory notes, and bid and performance bonds.The program can be used for trade transactionsassociated with exports from, or imports to, theEBRD’s countries of operation. More than 70 issu-ing banks in these countries participate, togetherwith 440 cooperating banks throughout the world.The EBRD also extends to banks short-term loansthat are on-lent to local companies to provide theworking capital necessary to fulfill foreign tradecontracts. Since the relaunch of its Trade Facilita-tion Programme in 1999, the EBRD has guaran-teed and financed approximately 1,300 tradetransactions totaling more than 900 million euros(EBRD 2003).
The Asian Development Bank’s (ADB) TradeFinance Facilitation Program provides guaranteesto facilitate local banks’ access to short-term tradefacilities from international banks, including instru-ments such as letters of credit, standby letters ofcredit, and bankers’ acceptances. The programalso provides short-term loans to local banks thaton-lend funds to private sector firms involved ininternational trade (ADB 2003).
The multilateral development banks haveused these facilities to support emerging marketsin crisis. For example, in 1998 the ADB providedfinance to the Thai Export-Import Bank, including
gdf_126-147.qxd 4/6/04 1:03 PM Page 132

F I N A N C I N G D E V E L O P I N G C O U N T R I E S’ T R A D E
a $50 million loan and a partial guarantee for a$950 million syndicated loan from internationalbanks. Draw-down of the funds was modest,partly due to the high margins charged by the in-termediating banks and partly because the liquid-ity of the banking system improved faster thanexpected. The EBRD program was used to sup-port the Russian Federation’s recovery from its1998 crisis. IFC has supported trade financing, invarious forms, to banks lending to the Republic ofKorea, to Brazilian banks, and to Indonesian and
Argentinian exporters. During the recent crisis inBrazil, IFC provided $630 million in trade creditto leading Brazilian banks, which supported$1 billion of export activity and helped to restoreconfidence during a period when trade lines wereshrinking. In 2003 the Inter-American Develop-ment Bank lent $110 million to Banco Bradescoto improve access to trade finance for Braziliancompanies. These initiatives increased liquidityand may have helped to ease risk perceptions (IMFforthcoming).
133
In the past decade export credit agencies have moveddecisively to limit corruption, guard against adverse
environmental impacts, and avoid financing nonproductiveprojects. The move has come in response to increased public scrutiny of their activities and to demands from nongovernmental organizations that the agencies increasetransparency and adopt binding environmental and socialguidelines and standards (Maurer and Bhandari 2000;ECA Watch 2003).a These efforts have helped ensure thatlending by export credit agencies contributes to borrowers’growth, a prerequisite for sustainable borrowing. Theyalso have contributed to the decline in commitments. Export credit agencies have taken steps in the followingareas to improve the social responsibility of their guaranteeprograms:
• Tied aid. Tied aid—trade-related aid credits providedby donor governments for public sector projects in developing countries, conditioned on the purchase ofequipment from suppliers in donor countries—fellfrom 15 percent of net official development assistancein 1991 to 3 percent in 2000 ($1.8 billion, a 20-yearlow). The 1991 Helsinki Package placed constraintson export credit agencies by limiting the provision oftied aid to “non-commercially viable” projects withgenuine development objectives and characteristics,and by mandating that at least 35 percent of tied aidbe provided on concessional terms.b
• Transparency. Export credit agencies have been criti-cized for their lack of transparency in decision-making(Maurer and Bhandari 2000). Some export creditagencies are now setting out their business principlesand reporting publicly on their comparative positionin terms of coverage, pricing, and products offered(ECGD 2003). Many now publish on their Web sitesinformation about the exports and projects theysupport (Godier 2003).
• Anti-corruption and good governance. In May 2003,the OECD Working Group on Export Credits andCredit Guarantees proposed measures to stamp outbribery in transactions supported by official exportcredits. The OECD proposals would require exportcredit agencies to inform all applicants requesting export credits of the legal consequences of bribery ininternational business transactions. They also wouldoblige applicants to declare that neither they nor anyone acting on their behalf have been engaged in or will engage in bribery.
• Environmental and social impact. Most members of the OECD’s Export Credits and Credit Guaranteesgroup agreed in 2001 to implement common ap-proaches to environmental issues. Members are nowrequired to screen and review the environmental impact of exported capital goods and projects sup-ported by export credits, including their potential impact on the generation of significant air emissions,effluents, waste, or noise; significant use of natural resources; and the resettlement of indigenous and vulnerable groups. The new requirements are mostlikely to affect projects supported by export creditagencies, but support for “nonproductive” exports—notably armaments—also has become an importantissue. The G-7 has called for stronger measures by the OECD against the practice of using exportcredits to help poor countries buy arms and othernonproductive items (de Jonquieres, Tett, and Fidler 2000).
a. See chapter 4 for a discussion of the increasing influence of nongovern-mental organizations on development activities, and UNIDO (2002) for adiscussion of the growth of corporate social responsibility. b. The requirement of noncommercially viable projects was included to ensure that tied aid would be additional to otherwise available external re-sources; in other words, that bilateral funds would be used for projects thatoffered potentially large external benefits but lacked the ability to generatesufficient financial returns to make them eligible for commercial financing.
Box 5.2 Social responsibility and export credit agencies
gdf_126-147.qxd 4/6/04 1:03 PM Page 133
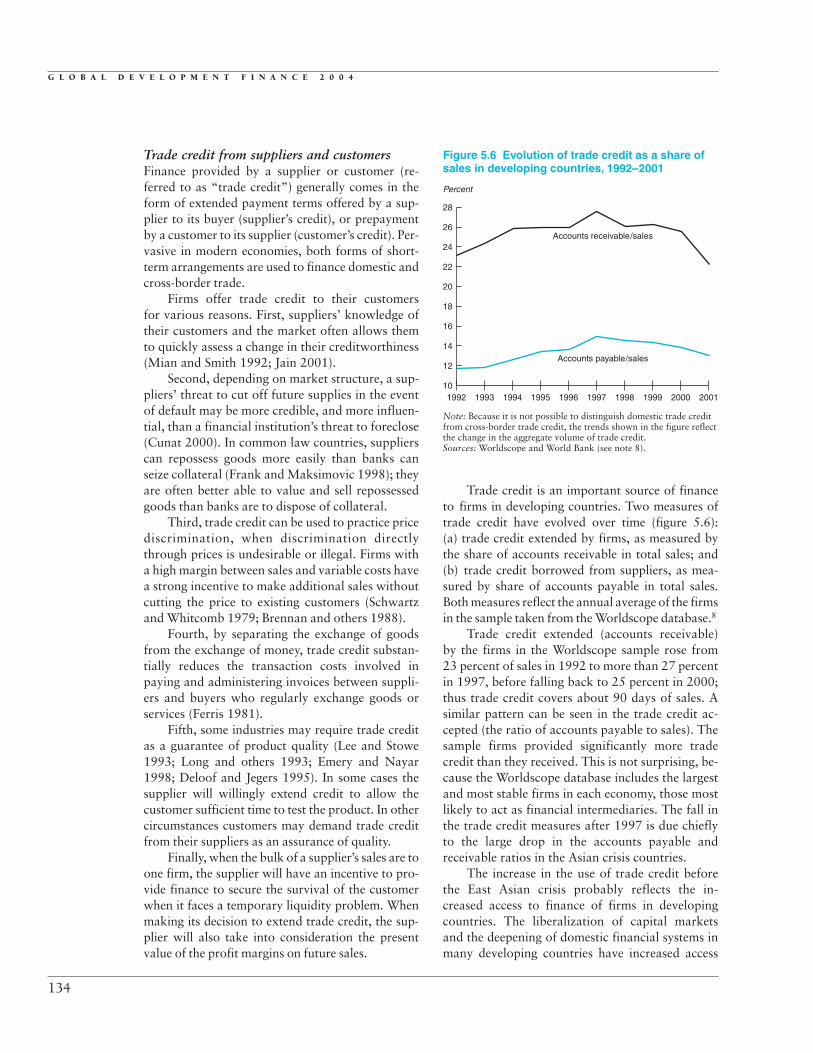
G L O B A L D E V E L O P M E N T F I N A N C E 2 0 0 4
Trade credit from suppliers and customersFinance provided by a supplier or customer (re-ferred to as “trade credit”) generally comes in theform of extended payment terms offered by a sup-plier to its buyer (supplier’s credit), or prepaymentby a customer to its supplier (customer’s credit). Per-vasive in modern economies, both forms of short-term arrangements are used to finance domestic andcross-border trade.
Firms offer trade credit to their customersfor various reasons. First, suppliers’ knowledge oftheir customers and the market often allows themto quickly assess a change in their creditworthiness(Mian and Smith 1992; Jain 2001).
Second, depending on market structure, a sup-pliers’ threat to cut off future supplies in the eventof default may be more credible, and more influen-tial, than a financial institution’s threat to foreclose(Cunat 2000). In common law countries, supplierscan repossess goods more easily than banks canseize collateral (Frank and Maksimovic 1998); theyare often better able to value and sell repossessedgoods than banks are to dispose of collateral.
Third, trade credit can be used to practice pricediscrimination, when discrimination directlythrough prices is undesirable or illegal. Firms witha high margin between sales and variable costs havea strong incentive to make additional sales withoutcutting the price to existing customers (Schwartzand Whitcomb 1979; Brennan and others 1988).
Fourth, by separating the exchange of goodsfrom the exchange of money, trade credit substan-tially reduces the transaction costs involved inpaying and administering invoices between suppli-ers and buyers who regularly exchange goods orservices (Ferris 1981).
Fifth, some industries may require trade creditas a guarantee of product quality (Lee and Stowe1993; Long and others 1993; Emery and Nayar1998; Deloof and Jegers 1995). In some cases thesupplier will willingly extend credit to allow thecustomer sufficient time to test the product. In othercircumstances customers may demand trade creditfrom their suppliers as an assurance of quality.
Finally, when the bulk of a supplier’s sales are toone firm, the supplier will have an incentive to pro-vide finance to secure the survival of the customerwhen it faces a temporary liquidity problem. Whenmaking its decision to extend trade credit, the sup-plier will also take into consideration the presentvalue of the profit margins on future sales.
Trade credit is an important source of financeto firms in developing countries. Two measures oftrade credit have evolved over time (figure 5.6):(a) trade credit extended by firms, as measured bythe share of accounts receivable in total sales; and(b) trade credit borrowed from suppliers, as mea-sured by share of accounts payable in total sales.Both measures reflect the annual average of the firmsin the sample taken from the Worldscope database.8
Trade credit extended (accounts receivable)by the firms in the Worldscope sample rose from23 percent of sales in 1992 to more than 27 percentin 1997, before falling back to 25 percent in 2000;thus trade credit covers about 90 days of sales. Asimilar pattern can be seen in the trade credit ac-cepted (the ratio of accounts payable to sales). Thesample firms provided significantly more tradecredit than they received. This is not surprising, be-cause the Worldscope database includes the largestand most stable firms in each economy, those mostlikely to act as financial intermediaries. The fall inthe trade credit measures after 1997 is due chieflyto the large drop in the accounts payable andreceivable ratios in the Asian crisis countries.
The increase in the use of trade credit beforethe East Asian crisis probably reflects the in-creased access to finance of firms in developingcountries. The liberalization of capital marketsand the deepening of domestic financial systems inmany developing countries have increased access
134
1992 1993 1994 1995 1996 1997 1998 1999 2000 200110
12
14
16
18
20
22
24
26
28
Figure 5.6 Evolution of trade credit as a share ofsales in developing countries, 1992–2001
Percent
Note: Because it is not possible to distinguish domestic trade creditfrom cross-border trade credit, the trends shown in the figure reflectthe change in the aggregate volume of trade credit.Sources: Worldscope and World Bank (see note 8).
Accounts receivable/sales
Accounts payable/sales
gdf_126-147.qxd 4/6/04 1:03 PM Page 134

F I N A N C I N G D E V E L O P I N G C O U N T R I E S’ T R A D E
to capital, especially for large, publicly tradedcompanies. This finding of increased access isconsistent with a study by Demirguc-Kunt andMaksimovic (2002), which showed that the devel-opment of trade credit arrangements betweenfirms complements the development of the bank-ing system. In addition, increased openness totrade may have raised the supply of trade credit indeveloping countries by increasing trading withfirms in more developed financial systems thathave greater access to capital than most domesticfirms. Finally, the rise in trade credit may be linkedto the increased ability of firms in developing coun-
tries to sell their accounts receivable for short-termfinancing, a process known as factoring (box 5.3).
Firms use trade credit when they are not eligi-ble for loans from financial institutions (Petersenand Rajan 1997), and the interest rates on tradecredit often are much greater than on loans fromcommercial banks. Above some level, banks tendto ration credit rather than charge an interest ratethat fully compensates it for the risk incurred.Banks do this for two reasons. First, they oftenfind it difficult to judge firms’ risk, and, second,charging a very high interest rate will tend to at-tract risky firms with a high probability of default.
135
Factoring is the sale of accounts receivable or invoicesto a separate company that will collect the debts. The
seller immediately receives from the factor a percentage(often 80 percent) of the face value of receivables, speedingup cash flow. The remaining balance minus interest on the80 percent and the fees to be paid to the factor are trans-ferred to the company once the customer has paid. In addi-tion to finance, factors also provide credit insurance and financial management services.
Factoring can be an attractive source of credit. It isdifficult to use accounts receivable as collateral for bankloans in many emerging markets, owing to the absence oflaws allowing lenders to secure intangible or floating assetsand the inability of judicial systems to enforce such con-tracts quickly and efficiently. Furthermore, most emergingmarkets do not have the technological infrastructure oraccess to commercial credit information necessary to allowthis type of financing. However, almost all middle-incomecountries allow the assignment or sale of accounts receiv-able to a third party. In addition, factors specializing in aparticular industry may be able to pool information oncustomers from different clients and thus get a better ideaof customers’ creditworthiness than the producing firm.This role of the factor can be particularly important inreducing risk for firms selling to overseas markets, wherethey may know little about customers’ creditworthiness.
The factor may retain the right to seek full recoursefrom the client if a customer does not pay its invoice(recourse factoring), or it may assume the credit risk (nonrecourse factoring). The nonrecourse variant is more common. Due to the dearth of historical credit information, however, and the potential for fraudulentbehavior (for example, false accounts receivable ornonexistent customers), nonrecourse factoring in emerg-ing markets often poses substantial risk for the factor. An
appealing alternative in such countries can be “reverse factoring,” where the factor purchases only receivablesfrom high-quality customers. Because the factor’s risk islow, it can do without recourse. In effect, reverse factoringenables the company to borrow on the credit risk of itscreditworthy customers.
Total worldwide factoring involving internationaltrade receivables increased by 70 percent in 1997–2001, to almost $50 billion.a One reason is that more business is now done on open account, increasing the volume of accounts receivable available for financing. Exporters turn to factoring to avoid the expense and burdensome paperwork associated with letters of credit, while continu-ing to compete for business using attractive trade creditterms. Factoring remains a relatively minor source of credit in emerging markets, however, averaging about 4 percent of exports in the 26 emerging markets for which data are available (see figure). By contrast, in the G-7 countries (France, Germany, Italy, Japan, the United Kingdom, and the United States), factoring averaged 16 percent of exports.
An efficient legal system that protects creditors’ rightsis important for the development of a factoring industry(Klapper 2000). For example, countries that permit the assignment of receivables and have secured-transactionlaws have a greater factoring volume. Making factoring alegally recognized financial product can strengthen itscredibility in the eyes of the public, make it easier forcourts to enforce contracts, and remove the disadvantagethat factoring firms often face compared to banks (value-added taxes are charged on prepayment interest to factors,but not on the interest received on bank loans). Also im-portant for factoring are good credit information andpayments systems and the absence of administrative obsta-cles to obtaining foreign exchange. Credit insurance for
Box 5.3 Factoring
gdf_126-147.qxd 4/6/04 1:03 PM Page 135

G L O B A L D E V E L O P M E N T F I N A N C E 2 0 0 4
By contrast, suppliers are in a better position toevaluate risk and can thus afford to lend to riskierfirms, while charging a high rate of interest.
Suppliers often provide trade credit in the formof a discount for early payment (Wilner 1997; Ngand others 1999). A common contract is a “2–10 net30” contract, meaning that a customer who payswithin 10 days of delivery qualifies for a 2 percentdiscount. Failure to enjoy the discount for earlypayment can be considered the interest chargefor late payment. If a firm pays on day 30, it haseffectively borrowed money for 20 days at anannual interest rate of about 44 percent.9
Some firms use trade credit to improve theircredit standing, as the seller’s extension of creditcan signal to a bank that the buyer is creditworthy(Biais and Gollier 1997). Finally, firms using tradecredit also benefit from lower transaction costs be-cause the exchange of goods and the exchange ofmoney occur in tandem.
Information from surveys of developing-country firms conducted by the World Bank’sInvestment Climate Unit between 1998 and 2002provides further information on the distribution oftrade credit during the period.10 Firms in middle-income countries use trade credit equal to 7.5 per-cent of their working capital (defined as cash,inventories, and accounts receivable), whereasfirms in low-income countries receive trade creditequal to just 5 percent of working capital (fig-ure 5.7). Financial systems in middle-income coun-tries tend to be deeper than those in low-incomecountries, so firms in the middle-income countriesare in a better position to trade with other firmsthat can provide trade credit. Moreover, in bothlow- and middle-income countries large firms havemore access to trade credit than do small firms, afinding reinforced by evidence from U.S. data thatsmall firms use less trade credit than large ones(Petersen and Rajan 1997). Both findings are
136
factored trade receivables, where available, enables thefactor in effect to subcontract risk assessment and credit-risk management. Thus cooperation between factors andexport credit agencies can be beneficial for the develop-ment of a well-functioning factoring industry.
a. These estimates are from Factor Chain International, established in 1968as the umbrella organization for independent factoring companies aroundthe world. The members of Factor Chain International represent nearly60 countries and handle more than 52 percent of international factoringvolumes and 44 percent of the total factoring volume.
Box 5.3 (continued)
South
Afri
ca
Brazil
Chile
Baltic
coun
tries
Turk
ey
Panam
a
Poland
Mex
ico
Argen
tina
El Salv
ador
Czech
Rep
ublic
Costa
Rica
Sri La
nka
Tunis
ia
Hunga
ry
Thaila
nd
Slovak
Rep
ublic
India
Mala
ysia
Roman
ia
Sloven
ia
Mor
occo
China
Korea
, Rep
. of
Bulgar
ia
Indo
nesia
0
4
2
Source: Factor Chain International.
8
6
12
10
16 15.8714.69
13.72
9.66
7.386.49
5.79
3.622.96 2.78 2.74 2.71
1.79 1.63 1.56 1.47 1.42 1.00 0.74 0.72 0.61 0.45 0.38 0.04 0.02 0.00
14
18
International factoring as a percentage of exports in selected countries
Percent
gdf_126-147.qxd 4/6/04 1:03 PM Page 136

F I N A N C I N G D E V E L O P I N G C O U N T R I E S’ T R A D E
consistent with the view that small firms tend to beless creditworthy than larger firms, and that the vol-ume of trade credit is rationed.
Unfortunately the survey does not provide in-formation about the source of trade credit receivedor the destination of that provided. As such it isimpossible to make a distinction between domestictrade credit and cross-border trade credit.
Access of less creditworthy borrowersto trade finance
Participation in cross-border trade has helpedless creditworthy borrowers expand their access
to international finance, aided by security arrange-ments that reduce creditors’ risk, by the effortsof official export credit agencies to widen marketaccess for creditworthy countries, and by informa-tional advantages that enable customers and sup-pliers to extend credit where banks are reluctant.
Access to commercial bank loansMany low-income and less creditworthy develop-ing countries lack reliable access to commercialbanks for many transactions but still can borrowfor trade finance.11 Firms that have established areputation for reliability in foreign trade may beperceived as more creditworthy than firms sellingsolely in the domestic market. And internationalbanks are likely to be more familiar with suchfirms. The rise in outsourcing and in foreign direct
investment by multinationals has meant that morefirms in low-income countries are either owned byor closely related to multinationals, which can pro-vide references and security for loans. In addition,exporters in low-income countries often enjoy pref-erential access to foreign exchange and thus may beviewed as better able to service foreign-currencydebts than firms producing for the local market.
Another reason why less creditworthy coun-tries may rely more on trade finance than on otherforms of bank lending is that trade finance trans-actions can be structured so that the goods providesecurity for the loan. Credit may be extended onlyonce goods are received or after the buyer has paidinto an offshore escrow account that the lendercan access (Coetzee 2003).
Trade finance has thus been able to serve mar-kets that investment bankers have shunned (Kennyand Weston 2003). The new Basel capital accordrecognizes the effect of collateral in mitigating therisk of trade finance: short-term, self-liquidatingletters of credit arising from the movement ofgoods are assigned the same risk weighting asshort-term claims on investment-grade banks.
Available data indicate that tying borrowingto specific trade transactions can help increasehigh-risk customers’ access to commercial bankloans. In almost every year since 1980, the shareof trade finance commitments in total bank lend-ing has been higher for noninvestment-grade orunrated developing countries than for investment-grade countries (figure 5.8). Between 1980 and
137
Figure 5.7 Use of trade credit as working capital,by size of firm
% of working capital supplied by trade credit
Note: Results are based on more than 9,000 responses from firmsin 38 countries. Small firms are firms with fewer than 150employees. As not all firms in the sample disclose the number oftheir employees, the average use of trade credit by all firms does notnecessarily fall between the average of the small and the large firms.Source: World Bank, Investment Climate Surveys.
10
0
2
4
64.83
7.38
6.49
7.93
5.335.86
8
Low-income countries Middle-income countries
All firmsSmall firmsLarge firms
Figure 5.8 Trade finance from commercial banks,by investment rating, 1980–2003
% of trade financing in total bank lending
Sources: Dealogic Loanware and World Bank staff estimates.
0
20
40
60
80
100
1980
1984
1988
1992
1996
2000
Investment grade
Noninvestmentgrade and nonrated
gdf_126-147.qxd 4/6/04 1:03 PM Page 137

G L O B A L D E V E L O P M E N T F I N A N C E 2 0 0 4
2003, trade financing accounted for only 13 per-cent of the total bank commitments of investment-grade countries, about 26 percent of bank com-mitments for noninvestment-grade countries, andalmost 40 percent for countries that carried nocredit risk rating. Interestingly, investment-gradecountries have experienced a gradual decline intheir share of trade finance commitments in banklending, perhaps reflecting their improved accessto credit and reduced need to tie borrowing to spe-cific transactions.
Access to export credit guaranteesExport credit agencies are an important source offinance for low-income countries. As measured bygross disbursements covered, the middle-incomeeconomies have dominated official export creditguarantees to developing countries (figure 5.9).12
However, considering official export credits as apercentage of imports, noninvestment-grade coun-tries (as defined by their Moody’s rating) hadthe greatest access from 1999 to 2001 (figure 5.10).In relation to the size of their imports, countriessuch as Bangladesh, the Lao People’s DemocraticRepublic, Turkmenistan, and Uzbekistan weremajor recipients of loans and guarantees fromexport credit agencies during that period. In somecountries this phenomenon reflects the participa-tion of export credit agencies in projects that arelarge relative to the size of these economies. Butmore broadly, it reflects an important missionof export credit agencies—to help their nationalsexport to high-risk countries.
138
Figure 5.9 Countries receiving the most officialexport credits, 1999–2001
Source: World Bank estimates using OECD data.
Turkey
Indonesia
Philippines
Mexico
Malaysia
Russian Federation
Bangladesh
R. B. de Venezuela
China
Brazil
Amount extended, $ millions
200
117.08
128.04
162.96
176.50
220.36
425.64
494.56
532.17
630.12
676.48
400 600 8000
Figure 5.10 Countries with the highest ratios ofexport credits to imports, 1999–2001
Sources: World Bank staff estimates using OECD data and Moody’s credit rating.
Indonesia
Lao PDR
Iran, IslamicRep. of
Bangladesh
Pakistan
Philippines
Uruguay
Peru
Turkmenistan
Uzbekistan
Export credits/imports
10 20
7.42
7.76
8.67
8.81
9.85
10.23
12.24
14.61
30.29
42.43
30 40 500
Table 5.1 Ratio of officially supported export credits to importsPercent
Export credits/imports
Investment-grade countries 2.22Noninvestment-grade countries 3.98Nonrated countries 2.41Low-income countries 4.02Middle-income countries 2.78
Source: World Bank staff estimates using OECD Development Assistance Committee and World Bank data.
There is some evidence that export credit agen-cies tend to widen access to credit for less credit-worthy countries. Noninvestment-grade countriessaw 4 percent of their imports covered by exportcredit guarantees, compared with only about 2 per-cent of imports for the investment-grade countries(table 5.1). And noninvestment-grade countriesconsistently accounted for more than 50 percent ofexport credits over the 1990s (figure 5.11).
Trade credit and indirect access to theinternational capital marketsTrade credit from suppliers and customers can helpfirms in developing countries increase their access tothe international capital markets. First, developing-country firms involved in international tradereceive trade credit from foreign firms that tapthe capital markets for finance. The developing-country firms, in turn, provide trade credit to otherfirms, thus providing indirect access to finance
gdf_126-147.qxd 4/6/04 1:03 PM Page 138

F I N A N C I N G D E V E L O P I N G C O U N T R I E S’ T R A D E
from the international capital markets. Similarly,foreign-owned firms in developing countries faceless severe financing constraints than domesticfirms; they use their preferential access to financeto provide trade credit to other firms.
Firms involved in international trade use moretrade credit than firms that trade only domesti-cally (figure 5.12). The difference between tradersand nontraders is much more pronounced amonglarge firms, especially in low-income countries. Inlow-income countries, for example, large compa-nies involved in international trade finance morethan 8 percent of their working capital with trade
credit, whereas firms not involved in internationaltrade finance only 2.5 percent of their workingcapital in that manner. It is not possible to knowhow much of the trade credit these traders receiveis cross-border credit. It is likely that a portion isreceived from abroad.
To determine whether the link to internationalcapital markets is extended to other firms in thecountry, we need to focus on importers, as theyreceive cross-border suppliers’ credit while poten-tially extending trade credit domestically. (Ex-porters, on the other hand, will extend a largepart of their trade credit to foreign firms.) In thelow- and middle-income countries alike, importerssmall and large provide substantially more tradecredit than do firms that are not involved in inter-national trade (figure 5.13). Small importers inlow-income countries make 27 percent of theirsales on credit, compared with 18 percent forsmall firms not involved in international trade.However, because 52 percent of the importers inour sample also export, we cannot conclude withcertainty that trade credit is being extended todomestic firms unless we divide the importers intoone group that also exports and another that sellsonly domestically. Doing this, we see that bothgroups provide more trade credit compared to thefirms that are not involved in international trade(figure 5.14).13
Foreign ownership of domestic firms also canprovide indirect access to international finance.Firms that have a foreign company as owner or
139
Figure 5.11 Ratio of officially supported exportcredits to imports, 1991–2001
Percent
Sources: World Bank staff estimates using OECD data andMoody’s credit ratings.
0
60
50
40
20
10
30
70
19951991 1997 1999 20011993
Noninvestment grade
Investment grade
Not rated
Figure 5.13 Percentage of sales on credit, by typeand size of firm
Percent
0
35
25
3026.88 26.01
33.64
37.58
27.5326.11
19.7117.8620
15
5
10
40Importers Nontraders
Source: World Bank, Investment Climate Surveys, 1998–2002.
Small firmsSmall firms Large firmsLarge firms
Low-income countries Middle-income countries
Figure 5.12 Use of trade credit to finance workingcapital, by type and size of firm
% of working capital represented by trade credit
Source: World Bank, Investment Climate Surveys, 1998–2002.
0
10
8 7.278.15
7.37
9.72
6.886.94
2.67
4.986
2
4
12
Small firmsSmall firms Large firmsLarge firms
Traders Nontraders
Low-income countries Middle-income countries
gdf_126-147.qxd 4/6/04 1:03 PM Page 139

G L O B A L D E V E L O P M E N T F I N A N C E 2 0 0 4
largest shareholder extend more trade credit thando domestic firms in both low- and middle-incomecountries (figure 5.15). Small foreign-owned firmsin low-income countries make, on average, 26 per-cent of their sales on credit, whereas domesticfirms sell just 20 percent on credit. For small firmsin middle-income countries these percentages are36 percent against 27 percent. The results arecomparable for the large firms.
The idea that foreign ownership can alleviatethe financing constraints of firms in developingcountries is confirmed by other questions in theInvestment Climate Unit (ICU) firm-level survey.
Of domestic firms, 22 percent in middle-incomeand 24 percent in low-income countries reportthat access to financing is a major obstacle forthe operation and growth of their business. Bycontrast, only 11 percent of the foreign-ownedfirms in the low-income countries and 13 percent inthe middle-income countries report that they lackaccess to financing. Among small firms, foreign-owned firms have better access to financing thando domestic firms.
Trade finance in times of crisis
Finance linked to international trade has insome cases been more resilient during crises
than other forms of debt finance, owing to variousreasons already discussed—the existence of secu-rity arrangements linked to traded goods, sup-pliers’ information on their borrowers, suppliers’incentives to support customers during cyclicaldownturns, and government policies directed atmaintaining international trade ties. The degree ofresilience, however, has varied from crisis to crisisand from one source of trade finance to another.Complicating the picture is the difficulty of deter-mining whether a decline in trade finance duringa crisis reflects creditors’ decisions or reduced de-mand. These issues are explored below with refer-ence to the principal sources of trade finance andrelated support.
Commercial banksBanks may be more willing to maintain trade-finance credit lines than other loans during a crisis.First, as stated above, the security arrangementsunderlying many trade finance transactions reducerisk. Second, because governments are so con-cerned about maintaining trade ties in times ofcrisis, the central bank may treat trade financedebt more favorably than general bank credit,allowing firms to service trade finance loans whileotherwise blocking access to foreign exchange, orby providing better terms to trade finance loansduring debt negotiations. Some early debt restruc-turing agreements—for example, the Philippines’debt restructuring of the late 1970s and theMexican and Brazilian crises of the 1980s—excluded short-term lending and provided for themaintenance of trade lines. Although this repre-sented a loss of liquidity for creditors—and al-though the trade lines were maintained on terms
140
Figure 5.14 Percentage of sales on credit, by typeand size of firm
Percent
0
35
25
30 29.44
37.65 38.2036.25
27.5330.28
26.1126.8525.35
19.71
25.23
17.8620
15
5
10
45
40Importers that exportImporters that do not exportNontraders
Source: World Bank, Investment Climate Surveys, 1998–2002.
Small firmsSmall firms Large firmsLarge firms
Low-income countries Middle-income countries
Figure 5.15 Percentage of sales on credit, by typeand size of firm
Percent
0
35
25
3025.93
31.58
36.36
42.51
30.4227.36
20.06
26.57
20
15
5
10
45
40Foreign firms
Domestic firms
Source: World Bank, Investment Climate Surveys, 1998–2002.
Small firmsSmall firms Large firmsLarge firms
Low-income countries Middle-income countries
gdf_126-147.qxd 4/6/04 1:03 PM Page 140

F I N A N C I N G D E V E L O P I N G C O U N T R I E S’ T R A D E
less favorable than those lenders might havepreferred—creditors did not typically experience aloss of principal on such lending. This historicalprecedent could encourage banks to maintaintrade credit lines during crises, even when they cutoff other forms of lending.
Other factors may work against trade financeduring crises. Its risks do rise during crises, due tothe costs of litigation (and weaknesses in develop-ing countries’ legal systems) if disputes arise afterinsolvency, as well as the costs of reselling goods.And it may not be favored in a particular situa-tion, just as it was not always given preference indebt restructurings in the 1990s. When it was, thepreference was narrowly drawn and typically didnot apply to all measures taken to deal with thecrisis. For example, in Argentina businessesengaged in foreign trade were more likely to bepermitted to transfer funds abroad, but were notassured of being able to do so, and could buy andsell foreign exchange at the official rate. TheRussian Federation excluded some, but not all,trade loans from the 90-day moratorium on for-eign exchange payments following the 1998 de-fault. But trade finance enjoyed no preference atall in the Mexican peso crisis (Samberg 2002). TheMay 1998 Frankfurt Agreement between Indonesiaand its international private creditors providedfor the payment on $1.4 billion of trade financearrears, in return for which banks agreed to main-tain trade lines in Indonesia. On the other hand,no distinction was made between trade financeand other loans in the government-guaranteedagreement by commercial banks to restructurebank debt in Korea or in the banks’ agreement tomaintain credit lines to Brazil between Februaryand August 1999.
One reason that trade credit was not always af-forded differential treatment in the 1990s was thatthe easing of capital controls (under which tradefinance transactions often enjoyed preferential ac-cess to scarce foreign exchange) and the movementaway from detailed documentation requirementsunderlying trade finance transactions have blurredthe lines between trade credit and other forms ofshort-term financing (IMF forthcoming).
The inconsistent treatment may be one reasonwhy trade finance has not held up in recent crises.In Argentina, export and import financing linesbroke down in the run-up to the crisis of late2001, with many credit lines cancelled, both for
international banks operating in Argentina and fordomestic banks. In Brazil, trade financing declinedin both 1998 and 2002. In 1998, trade finance hadrisen thanks to its privileged position in the capitalcontrol regime and the strong incentive to borrowabroad, which was due to the large differential be-tween domestic and international interest ratesand the de facto crawling exchange rate. As a re-sult, trade credit rose strongly in 1995–98, butthese positions unwound rapidly as the crisis ap-proached.14 Trade lines to Brazil also contractedsharply in 2002, as lenders became increasinglyconcerned about Brazilian prospects and futurepolicies. Outstanding credit lines connected totrade fell from $24 billion in March 2002 to just$16 billion by the end of the year. By contrast,other credit lines rose marginally. In addition,maturities on remaining facilities plummeted,while interest rate spreads rose from about 100 to600 basis points (IMF forthcoming). As confi-dence has recovered since, trade lines have pickedup—but only moderately.
Trade finance also dropped sharply toIndonesia, Malaysia, and Thailand following theEast Asian crisis. Many banks failed to distinguishbetween trade finance and other loans when re-ducing country exposure. In part this reflectedconcern over the solvency of local banks. It wasreported that international banks refused to con-firm or underwrite letters of credit opened bylocal Indonesian banks at the peak of the crisis(Auboin and Meier-Ewert 2002). Unfortunately,the balance-of-payments reports from these coun-tries do not distinguish between bank finance de-voted to trade and lending for other purposes.Data from publicly announced transactions, how-ever, do reflect a collapse of trade finance to thethree countries, from $1.6 billion in commit-ments in 1997 to $150 million in 1998. This de-cline reflected both creditors’ concerns about theirexposure, and the fall in demand as exchange-ratedepreciation and the severe recession reduced im-ports. Even after the crisis, banks that continuedto lend for trade finance returned to the use of let-ters of credit and other documentary requirementsthat had largely been abandoned (Power 1999;Anonymous 1999).
Export credit agenciesNew commitments by export credit agencies havefallen to countries facing financial crises. Taking
141
gdf_126-147.qxd 4/6/04 1:03 PM Page 141

the median of a sample of eight countries affectedrecently by crisis, new commitments fell by 60 per-cent relative to imports in the year following thecrisis (figure 5.16).15 New export credit commit-ments to these countries moved in line with for-eign direct investment, falling less sharply thandisbursements on nonguaranteed loans from pri-vate sources.
Thus, the decline in new commitments fol-lowing crises did not necessarily represent arun for the exit by export credit agencies. Indeed,industrial-country governments often wish tokeep lines of trade credit open to support allies,sustain market confidence to reduce contagion,and avoid the need for expensive bailouts(Stephens 1998). For example, during the Koreancrisis, the Export-Import Bank of the United Statesprovided short-term insurance for more than$1 billion in U.S. sales to Korea (Auboin and Meier-Ewert 2002). Also, Japan’s export credit agencyprovided financing through the Bank of Indonesiato guarantee payment of letters of credit issued bylocal banks, although the facility was hardly used(IMF forthcoming).
Rather than reluctance on the part of exportcredit agencies, it is more likely that the decline innew commitments to East Asia (relative to imports)represents decreased demand from exporters inindustrialized countries (Cline 2001).
Trade credit from suppliers and purchasersTrade credit may be more stable during crises thanbank lending or bond flows for two reasons. First,
relationships between customers and suppliersnormally involve considerable sunk costs (Cunat2000), so suppliers in industrial countries may bereluctant to cut off their customers during crises.Second, suppliers’ informational advantages maylead them to maintain credit lines during crises inwhich contagion is playing a part; that is, where aparticular firm’s (or country’s) fundamentals arestrong, but investors are blindly cutting off creditbecause they cannot distinguish effectively amongfirms (or countries). Under such circumstances,suppliers are less likely to suffer from myopia.
Studies of industrial countries indicate thattrade credit is more resilient than bank lendingduring a credit crunch. For example, Nilsen (2002)shows that during monetary contraction small andlarge firms without a bond rating react by borrow-ing more from their suppliers. Mateut and others(2002) find that the absolute level of trade credittaken up by manufacturing firms in the UnitedKingdom increases by 19 percent during a periodof monetary tightening, while the ratio of banklending to trade credit decreases from 1.19 to0.66. Furthermore, they show that it is mostly thesmall, financially weaker firms that are excludedfrom bank lending and thus resort to trade credit.
The impact of financial crises on trade creditin developing countries has been mixed. Duringthe Mexican and Asian crises, stronger firmsextended more and took less credit, while finan-cially constrained firms took more credit fromtheir suppliers (Love and others 2003). By con-trast, Love and Zaidi (2003) found no evidence ofresilience of trade credit for small- and medium-sized enterprises in countries affected by the Asiancrisis. Both the percentage of output sold on creditand the percentage of input bought on credit werelower after the crisis. The decrease was even morepronounced for firms with only limited access tobank lending.16 Using the same database as Loveand Zaidi (2003), we also find a fall in the use oftrade credit in Indonesia, Korea, and Thailandafter the crisis.17 On average, the share of inputsfinanced by trade credit fell by 10 percent. Inaddition, credit terms deteriorated: the averagelength of loans fell by 7 percent, while the implicitinterest rate rose by 40 basis points. Although lessthan a third of the firms were affected by the dete-rioration in the volume and terms of trade credit,all major sectors covered by the survey showed amarked deterioration.
G L O B A L D E V E L O P M E N T F I N A N C E 2 0 0 4
142
Source: World Bank staff estimates using Berne Union data.
t � 1 t � 0 t � 1 t � 2 t � 3 t � 4
Figure 5.16 New commitments of export creditagencies in years following crises
Index numbers, base year t � 1 � 100
0
20
60
40
80
100
120Commitments/imports
Disbursements on private,nonguaranteed long-term debt
Inflows of FDI
gdf_126-147.qxd 4/6/04 1:03 PM Page 142

F I N A N C I N G D E V E L O P I N G C O U N T R I E S’ T R A D E
Nevertheless, the decline in the volume ofcredit and deterioration in its terms during theEast Asian crisis were much more pronouncedfor bank lending than for trade credit. The shareof bank lending in finance external to the firmdropped by 15 percent after the crisis, comparedwith 10 percent for trade credit (table 5.2), withalmost half the firms experiencing a deteriora-tion. Moreover, while the survey does not pro-vide the interest rate paid on bank lending, thereis no doubt that bank interest rates increasedby much more than the 40 basis point rise intrade credit. The rise in the money market rate(one indicator of financial conditions) from June1997 to March 1998 was 44 percentage pointsin Indonesia, 9 percentage points in Thailand,and 12 percentage points in Korea. The greaterdrop in bank finance, relative to trade credit, isalso apparent from the fact that of firms thatfaced an output decline after the crisis (72 per-cent of the firms in our sample), 45 percent con-sidered insufficient bank credit to be a major rea-son for the decline, while only 34 percentidentified insufficient suppliers’ credit as a majorreason.
Unlike the finding in a previous section—thatfirms involved in international trade had greater ac-cess to trade credit than other firms—internationaltrade did not help firms maintain access to tradecredit after the East Asian crisis. Thirty-sevenpercent of importers experienced a fall in tradecredit use, compared to 36 percent of exportersand 33 percent of the firms that bought and soldonly on the domestic market. While importersmay have had access to trade credit from foreignfirms that were less affected by the crisis thandomestic suppliers, the creditworthiness of im-porters was hit hard by crisis-induced currencydevaluation. While exporters benefited from thedevaluation, a significant share of their supplierswere probably domestic firms that experienced
a deterioration in their ability to extend credit.Moreover, many of the suppliers to both exportersand importers may have been from other Asiancountries affected by the crisis and hence alsowere less able to supply trade credit.18 It also is pos-sible that the foreign-exchange exposure of firmsinvolved in the survey was higher than normalbefore the crisis.
The earlier finding that foreign-owned firmsenjoy better access to trade credit than do do-mestically owned firms is confirmed by the dataon the East Asian crisis. Less than 20 percent offoreign-owned firms showed a drop in the provi-sion of trade credit after the crisis, versus more than30 percent of the firms without foreign equity.19
This suggests that foreign investment in domesticfirms can provide an extra benefit—trade creditfrom these firms will be less affected by turmoilthan will credit from domestically owned firms.
Clearly, we are at the early stages of investi-gating the relationship between developing-countrycrises and trade credit from suppliers and pur-chasers. The survey data now becoming availableshould support further research in this and otherareas. For the moment, however, the data are in-sufficient to answer with certainty some of the keyquestions addressed in this chapter. Future re-search will benefit greatly from information thatdistinguishes between domestic and externalsources of trade credit provided to developing-country firms. Eventually, larger surveys, or morecomprehensive reporting requirements, will benecessary to estimate the total volume of tradecredit more reliably. In general, one lesson fromthis chapter is that expanding the data availablefor each of the major sources of trade finance—commercial banks, export credit agencies, privateinsurers, multilateral development banks, andother firms—would greatly improve our under-standing of the impact of trade finance on devel-oping countries.
143
Table 5.2 Use of trade credit before and after East Asian crisis of 1997–98Percent
Before crisis After crisis % change % of firms with deterioration
Share of input financed by trade credit 77.7 69.7 �10.3 32.3Length of trade credit (days) 69.1 54.2 �7.1 27.3Discount terms 8.5 8.9 4.7 32.7
Source: World Bank, Asian Corporate Crisis and Recovery Firm-Level Survey. See Dwor-Frecaut, Colaco, and Hallward-Driemeier (2000).
gdf_126-147.qxd 4/6/04 1:03 PM Page 143
G L O B A L D E V E L O P M E N T F I N A N C E 2 0 0 4
Notes1. The data on trade finance provided by commercial
banks are taken from the Loanware database, which reportsthe purpose of each loan, including “trade finance.” Thesetransactions are reported by the trade financing desks of in-ternational banks.
2. Because the database of the Bank for InternationalSettlements does not include a breakdown by the purpose ofthe loan, it is impossible to say whether trade finance trans-actions are more under-reported than other transactions.The estimated stocks of syndicated loans (assuming thatnew facilities are fully drawn and no early repayments aremade) in the Loanware database are equal to about half ofthe outstanding loans reported by the Bank for Interna-tional Settlements to Latin America and developing Europe,but to about 100 percent of loans to Asia, Africa, and theMiddle East (Gadanecz and von Kleist 2002).
3. The 10 countries are Brazil, India, Indonesia, theIslamic Republic of Iran, Mexico, Pakistan, the RepúblicaBolivariana de Venezuela, the Russian Federation, Thailand,and Turkey.
4. The Berne Union is a collection of 51 export creditagencies and insurance companies from 42 countries. It in-cludes the World Bank Group’s Multilateral InvestmentGuarantee Agency. A portion of the business covered by ex-port credit agencies includes interest payments due, so thatthe stock of business covered is not the same concept as thestock of debt.
5. Although short-term business generally provides abetter indication of trade finance from Berne Union mem-bers, medium- to long-term business includes capital goodsimports and longer-term trade contracts, which are impor-tant lines of trade business.
6. The OECD reports data on export credit disburse-ments with a repayment term of one year or more. The dataare aggregated; that is, they are not broken down by transac-tion. It also reports data on officially supported export creditswith a repayment term of five years or more, on a transaction-specific basis. Comparing OECD and Berne Union data isproblematic, as the former refers to the stock of business cov-ered, and the latter to the flows covered. The two databasesalso differ in populations, methodology, and type of businesscovered. However, the OECD is the only known source ofdata on flows from export credit agencies.
7. The Knaepen Package was a set of measures incor-porated into the OECD’s Arrangement on Guidelines forOfficially Supported Export Credits, covering minimumcountry-risk-premium rates and standards for determiningcountry risk categories.
8. The Worldscope database includes information onpublicly traded firms of significant interest to internationalinvestors. Firms in the financial and service sectors, andcountries with only a small number of firms providing infor-mation on use and provision of trade credit, were excludedfrom our sample. The measures of accounts receivable rela-tive to total sales and accounts payable relative to total salesexclude credit extended by customers through prepayments.The data are taken from the yearly financial statements ofthe firms in the sample.
9. In some cases no discount for early payment is of-fered; in other words, the firm receives an interest-free loan.
Often no penalty is charged for late payments, which canreduce the aforementioned rates by two-fifths (Wilner1997). However, even with this reduction the annual inter-est rates paid on trade-credit loans far exceed the interestrates paid on bank loans.
10. The firm-level surveys of the World Bank’s Invest-ment Climate Unit (conducted between 1998 and 2002) in-clude quantitative indicators such as sales, supplies, owner-ship, and sources of finance and employment levels, alongwith qualitative questions about the business environmentand the motivation to do business. Currently data are avail-able for 38 countries. Excluded from consideration here arecountries with no information on the use and provision oftrade credit by their firms. The number of survey respondentsranges from nine to ten thousand, depending on the question.Only a subset of these firms made data available on their size,their trading behavior, and their ownership, reducing the num-ber of firms on which the estimates in the main text are based.
11. Middle-income countries can also expand their ac-cess to capital through trade finance. For example, emergingEastern European countries have used structured tradefinance to expand the amount and extend the term of financ-ing beyond what was available in the capital markets(Lennkh and Schoeller 2003).
12. The data on gross disbursements covered are takenfrom the OECD and differ from the Berne Union data (usedin figure 5.3), which reflect the stock of business covered.
13. The higher trade credit provided by importers thatalso export may be a sign that firms that trade with compa-nies from developing countries demand a guarantee of thequality of products they buy before they pay, as they realizeit could be very difficult to obtain a refund from firms incountries with a slow judicial system. This is confirmed bythe fact that firms that export provide on average moretrade credit than their nontrading counterparts in both thelow- and middle-income countries.
14. It is not clear to what extent the rise in trade fi-nance reflected commercial bank loans or suppliers’ credits.
15. The eight countries are Argentina, Brazil, Indonesia,Malaysia, the Philippines, the Russian Federation, Thailand,and Turkey.
16. Love and Zaidi (2003) use five measures to deter-mine access to bank lending: declined loan applications, re-liance on bank loans, restrictiveness in bank credit, sustain-ability in loan repayments, and constraints in short-termbank loans for working capital.
17. The Asian Corporate Crisis and Recovery Firm-Level Survey, conducted by the World Bank in Indonesia,Korea, the Philippines, and Thailand between November1998 and February 1999, covers about 3,000 mainly smalland medium-sized enterprises in the manufacturing sector(Dwor-Frecaut, Colaco, and Hallward-Driemeier 2000). Thesurvey suffers from a survivorship bias. As the survey was car-ried out after the crisis, those firms that were most vulnerableat the onset of the crisis are not represented. We have excludedfirms in the Philippines due to some inconsistencies in the data.
18. The survey does not provide information about thecountry from which the firm imports its inputs.
19. Information on foreign ownership is not availablefor Indonesian firms. The foreign-owned firms include firmsthat have a foreign majority shareholder.
144
gdf_126-147.qxd 4/6/04 1:03 PM Page 144

F I N A N C I N G D E V E L O P I N G C O U N T R I E S’ T R A D E
References
ADB (Asian Development Bank). 2003. Trade Finance Facil-itation Program. www.adb.org/PrivateSector/Finance/trade_fin.asp.
Anonymous. 1999. “Taking the Pain out of Trade Docu-mentation.” Asiamoney (London) 10 (June): 50–51.
Auboin, Marc, and Moritz Meier-Ewert. 2002. “Improv-ing the Availability of Trade Finance during Finan-cial Crises.” World Trade Organization, Lausanne,Switzerland. Processed.
Berne Union (International Union of Credit and InvestmentInsurers). Various years. The Berne Union Yearbook.Berne.
Biais, Bruno, and Christian Gollier. 1997. “Trade Creditand Credit Rationing.” Review of Financial Studies10: 903–37.
Brennan, Michael, Vojislav Maksimovic, and Josef Zechner.1988. “Vendor Financing.” Journal of Finance 43:1127–41.
Brujis, Marcos. 2003. “Trade Finance Facilities: EffectiveLiquidity Crisis Intervention.” Presentation to theGlobal Export Finance Corporate Conference inMadrid. October 29.
Cline, William R. 2001. “Ex-Im Exports and Private Capital—Will Financial Markets Squeeze the Bank?” In G. C.Hufbauer and R. M. Rodriguez, eds., The Ex-Im Bank inthe 21st Century—A New Approach? Washington, D.C.:Institute for International Economics.
Coetzee, Deon. 2003. “Best Practices for African Trade andInvestment.” In Lisa Paul, ed., Global Export andTrade Finance Review 2002/2003. Colchester, Essex,U.K.: Euromoney Yearbooks.
Cunat, Vicente. 2000. “Trade Credit: Suppliers as DebtCollectors and Insurance Providers.” Financial Mar-kets Group Discussion Paper 365, London School ofEconomics.
de Jonquieres, Guy, Gillian Tett, and Stephen Fidler. 2000.“G7 Calls for Arms Credits Clampdown.” FinancialTimes. August 1.
Deloof, Marc, and Marc Jegers. 1995. “Trade Credit, Prod-uct Quality, and Intragroup Trade: Some EuropeanEvidence.” Working Paper, Free University of Brussels,Belgium.
Demirguc-Kunt, Asli, and Vojislav Maksimovic. 2002.“Firms as Financial Intermediaries: Evidence fromTrade Credit Data.” World Bank, Washington, D.C.Processed.
Dwor-Frecaut, Dominique, Francis X. Colaco, and MaryHallward-Driemeier. 2000. “Asian Corporate Re-covery, Findings from Firm-Level Surveys in FiveCountries.” World Bank, Washington, D.C.Processed.
EBRD. 2003. EBRD’s Trade Facilitation Program. www.ebrd.com/tfp.
ECA Watch. 2003. “Unusual Suspects—Unearthing theShadowy World of Export Credit Agencies.” www.eca-watch.org
ECGD. 2003. “Report on the Comparison of Export CreditAgencies.” Export Credits Guarantee Department.London. February.
Emery, Gary W., and Nandkumar Nayar. 1998. “ProductQuality and Payment Policy.” Review of QuantitativeFinance and Accounting 10: 269–84.
Ferris, J. Stephen. 1981. “A Transactions Theory of TradeCredit.” Quarterly Journal of Economics 96: 243–70.
Frank, Murray, and Vojislav Maksimovic. 1998. “TradeCredit, Collateral, and Adverse Selection.” UBC Work-ing Paper, University of Maryland, College Park.
Gadanecz, Blaise, and Karsten von Kleist. 2002. “Do Syndi-cated Credits Anticipate BIS Consolidated BankingData?” BIS Quarterly Review (Basel, Switzerland).March.
Gamble, Richard H. 2001. “Beyond Letters of Credit: Inno-vations in Trade Finance.” Business Credit 103(10): 16.
Godier, Kevin. 2003. “A High Priority.” In InternationalUnion of Credit and Investment Insurers, The BerneUnion Yearbook, pp.108–09.
Handal, J. 2001. “Are On-line Letters of Credit in YourFuture?” World Trade 14(1): 68.
IMF (International Monetary Fund). 2001. Official Financ-ing for Developing Countries. Washington, D.C.
———. Forthcoming. “Trade Finance in Financial Crises:Assessment of Key Issues.” Washington, D.C.
Ivey, Jamie. 2002. “Promise of a Paperless Future forTrade Finance.” Corporate Finance (London) 206: 10.
Jain, Neelam. 2001. “Monitoring Cost and Trade Credit.”Quarterly Review of Economics and Finance 41:89–110.
James, David. 2001. “Political Risk Insurance in the PrivateMarket.” Brochbank Syndicate Management London.
Kenny, Michael, and Rubin Weston. 2003. “Trade and Com-modity Finance: Challenges and Solutions.” In Lisa Paul,ed., Global Export and Trade Finance Review 2002/2003. Colchester, Essex, U.K.: Euromoney Yearbooks.
Klapper, Leora. 2000. “The Determinants of Global Factor-ing.” World Factoring Yearbook 2000. Bromley, Kent,U.K.: BCR Publishing.
Kreitman, Roger. 2001. “The New Trade Finance.” Busi-ness Credit 103(10): 58.
Laryea, Emmanuel T. 2001. “Payment for Paperless Trade:Are There Viable Alternatives to the DocumentaryCredit?” Law and Policy in International Business33(1): 3.
Lee, Joy. 2001. “The LC Goes On-line.” Asiamoney 12(1): 72.Lee, Yul W., and John D. Stowe. 1993. “Product Risk,
Asymmetric Information, and Trade Credit.” Journalof Financial and Quantitative Analysis 28: 285–300.
Lennkh, Peter, and Erwin Schoeller. 2003. “Advantages ofCooperating with a Banking Network Group in Cen-tral and Eastern Europe and Asia.” In Lisa Paul, ed.,Global Export and Trade Finance Review 2002/2003.Colchester, Essex, U.K.: Euromoney Yearbooks.
Long, Michael S., Ileen B. Malitz, and S. Abraham Ravid.1993. “Trade Credit, Quality Guarantees, and ProductMarketability.” Financial Management 22: 117–27.
Loong, Pauline. 2002. “Reality Bytes in the Shift to E-trade.” Asiamoney (London) 13(9): 42.
Love, Inessa, Lorenzo A. Preve, and Virginia Sarria-Allende.2003. “Trade Credit and Bank Credit, Evidence fromthe Recent Financial Crises.” World Bank, Washington,D.C. Processed.
145
gdf_126-147.qxd 4/6/04 1:03 PM Page 145

G L O B A L D E V E L O P M E N T F I N A N C E 2 0 0 4
Love, Inessa, and Rida Zaidi. 2003. “Trade Credit andFinancing Constraints: Evidence from the East AsianCrisis.” World Bank, Washington, D.C. Processed.
Mackie, Alan. 2003. “Changing Face of Trade Insurance.”In International Union of Credit and Investment Insur-ers, The Berne Union Yearbook, pp. 48–49.
Marlin, Steven. 2003. “Charting a New Course.” BankSystems and Technology (New York) 40(5): 32.
Mateut, Simona, Spiros Bougheas, and Paul Mizen. 2002.“Trade Credit, Bank Lending, and Monetary PolicyTransmission.” Discussion Papers in Economics 02/11,University of Nottingham, U.K.
Maurer, Crescencia, and Ruchi Bhandari. 2000. “TheClimate of Export Credit Agencies.” Climate Notes,World Resources Institute, Washington, D.C. May.
Mian, Shehzad L., and Clifford W. Smith. 1992. “AccountsReceivable Management Policy: Theory and Evidence.”Journal of Finance 47: 169–200.
Ng, Chee K., Janet K. Smith, and Richard L. Smith. 1999.“Evidence on the Determinants of Credit Terms Usedin Interfirm Trade.” Journal of Finance 54: 1109–29.
Nilsen, Jeffrey H. 2002. “Trade Credit and the Bank Lend-ing Channel.” Journal of Money, Credit, and Banking34: 226–53.
Petersen, Mitchell A., and Raghuran G. Rajan. 1997.“Trade Credit: Theories and Evidence.” Review ofFinancial Studies 10: 661–91.
Power, Brian. 1999. “Coping with Illiquidity.” Asiamoney(London) (June): 6.
Samberg, Gilbert. 2002. “Debt Restructuring: Trade Fi-nance Falls from Favor.” International Financial LawReview 21(11): 21.
Schwartz, Robert A., and David Whitcomb. 1979. “TheTrade Credit Decision.” In James L. Bicksler, ed., Hand-book of Financial Economics. Amsterdam: North-Holland.
Stephens, Malcolm. 1998. “Export Credit Agencies, TradeFinance, and South East Asia.” IMF Working Paper98/175, International Monetary Fund, Washington,D.C.
———. 1999. The Changing Role of Export Credit Agen-cies. Washington, D.C.: International Monetary Fund.
Tang, Helena. 2003. “World Bank Activities on Trade.”International Trade Department Trade Note, WorldBank, Washington, D.C. May.
Taylor, Dan. 2002. Interview published on Web site of Inter-national Chamber of Commerce. www.iccwbo.org/home/news_archives/2002/stories/interview-Dan%20Taylor.asp.
UNIDO (United Nations Industrial Development Organi-zation). 2002. “Corporate Social Responsibility—Implications for Small and Medium Enterprises inDeveloping Countries.” Vienna.
Wilner, Benjamin S. 1997. “Paying Your Bills: An EmpiricalStudy of Trade Credit.” Unpublished paper, Universityof Iowa.
World Bank. 2003. Global Economic Prospects. Washington,D.C.
146
gdf_126-147.qxd 4/6/04 1:03 PM Page 146

gdf_126-147.qxd 4/6/04 1:03 PM Page 147

gdf_148-167.qxd 4/6/04 1:01 PM Page 148
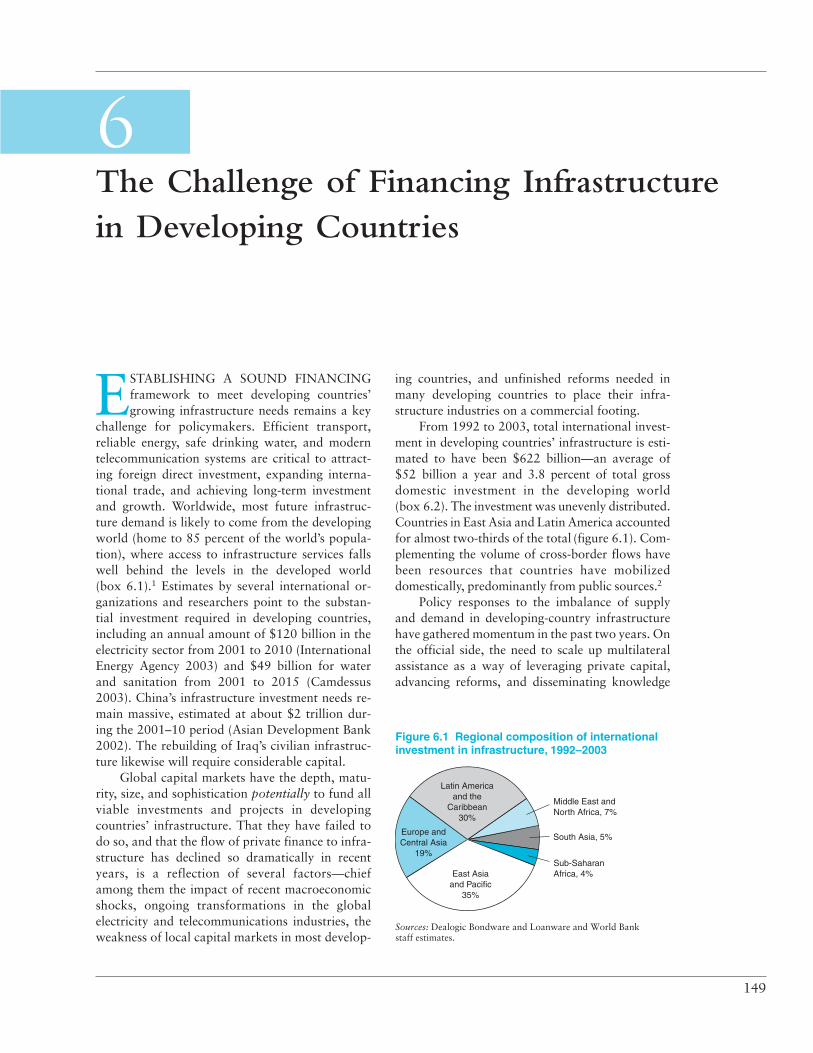
6The Challenge of Financing Infrastructure in Developing Countries
ESTABLISHING A SOUND FINANCINGframework to meet developing countries’growing infrastructure needs remains a key
challenge for policymakers. Efficient transport,reliable energy, safe drinking water, and moderntelecommunication systems are critical to attract-ing foreign direct investment, expanding interna-tional trade, and achieving long-term investmentand growth. Worldwide, most future infrastruc-ture demand is likely to come from the developingworld (home to 85 percent of the world’s popula-tion), where access to infrastructure services fallswell behind the levels in the developed world(box 6.1).1 Estimates by several international or-ganizations and researchers point to the substan-tial investment required in developing countries,including an annual amount of $120 billion in theelectricity sector from 2001 to 2010 (InternationalEnergy Agency 2003) and $49 billion for waterand sanitation from 2001 to 2015 (Camdessus2003). China’s infrastructure investment needs re-main massive, estimated at about $2 trillion dur-ing the 2001–10 period (Asian Development Bank2002). The rebuilding of Iraq’s civilian infrastruc-ture likewise will require considerable capital.
Global capital markets have the depth, matu-rity, size, and sophistication potentially to fund allviable investments and projects in developingcountries’ infrastructure. That they have failed todo so, and that the flow of private finance to infra-structure has declined so dramatically in recentyears, is a reflection of several factors—chiefamong them the impact of recent macroeconomicshocks, ongoing transformations in the globalelectricity and telecommunications industries, theweakness of local capital markets in most develop-
149
.
ing countries, and unfinished reforms needed inmany developing countries to place their infra-structure industries on a commercial footing.
From 1992 to 2003, total international invest-ment in developing countries’ infrastructure is esti-mated to have been $622 billion—an average of$52 billion a year and 3.8 percent of total grossdomestic investment in the developing world(box 6.2). The investment was unevenly distributed.Countries in East Asia and Latin America accountedfor almost two-thirds of the total (figure 6.1). Com-plementing the volume of cross-border flows havebeen resources that countries have mobilizeddomestically, predominantly from public sources.2
Policy responses to the imbalance of supplyand demand in developing-country infrastructurehave gathered momentum in the past two years. Onthe official side, the need to scale up multilateralassistance as a way of leveraging private capital,advancing reforms, and disseminating knowledge
Sources: Dealogic Bondware and Loanware and World Bankstaff estimates.
East Asiaand Pacific
35%
Middle East and North Africa, 7%
South Asia, 5%
Sub-SaharanAfrica, 4%
Europe andCentral Asia
19%
Latin Americaand the
Caribbean30%
Figure 6.1 Regional composition of internationalinvestment in infrastructure, 1992–2003
gdf_148-167.qxd 4/6/04 1:01 PM Page 149

G L O B A L D E V E L O P M E N T F I N A N C E 2 0 0 4
infrastructure financing, on the other. The keymessages are:
• The bottlenecks in ensuring a healthy flowof capital from international markets todeveloping-country infrastructure are relatedto policies, institutions, and regulation. Multi-laterals can play a crucial role in providingrisk-mitigation instruments (including guaran-tees and political risk insurance) and promot-ing the development of local capital markets.However, no single solution will fit all sectorsand all countries.
• Emerging modes of infrastructure financing,based on private finance and ownership, havenot proven resilient in the face of recent do-mestic macroeconomic shocks and interna-tional financial crises. Indeed, such shockshave had a more enduring impact on in-vestors’ confidence than did the downwardmovement in the global telecommunications
150
Demand for infrastructure services is likely to growmore quickly in developing countries than in the
developed economies for the foreseeable future. Infrastruc-ture stocks and service access are relatively low in thedeveloping world (see table). Currently, per capita electric-ity consumption is 1,054 kilowatt hours in developingcountries, compared with 8,876 kilowatt hours in developed
countries. Telecommunication links are five times lessdense than in the developed world. Demand for infrastruc-ture increases with per capita income, and growth is fasterat lower income levels. A long-standing literature has established a close relationship between infrastructure andeconomic growth (World Bank 1994; Philippe, Aghion,and Schankerman 1999; Nadiri and Mamuneas 1996).
Box 6.1 Growing demand for infrastructure services in developing countries
Stock of infrastructure in developing countries
Installed capacity Electricity Average telephone Road density Access to improvedper 1,000 consumption mainlines per (km/sq. km water source (% of
persons (kW) per capita (kWh) 1,000 persons of land) population)2001 2001 2001 2000a 2000
Developing countries 272 1,054 95 0.15 78East Asia 223 921 59 0.15 71Europe and Central Asia 992 3,425 217 0.11 88Latin America and the Caribbean 431 1,709 150 0.15 88Middle East and North Africa 338 1,411 86 0.08 84South Asia 99 426 31 0.94 76Sub-Saharan Africa 105 394 29 0.08 62
Developed Countries 2,044 8,876 501 0.58 99
a. Data are for the latest year available during the period 1996–2000.Sources: Electricity—U.S. Energy Information Administration 2003; Telephone mainlines—World Bank, World DevelopmentIndicators 2003; Roads—International Road Federation 2002.
and best practice is now well recognized. That recog-nition culminated in the launching of the WorldBank’s Infrastructure Action Plan in 2003 (seewww.worldbank.org/infrastructure). On the privateside, too, there is a recognition of the need for a morebalanced public-private approach to financing andfor innovative risk-sharing mechanisms.
This chapter focuses on the financing ofdeveloping-country infrastructure. Finance mat-ters for infrastructure development not only forthe usual reason of allocative efficiency, but alsobecause of certain distinctive economic character-istics of infrastructure—a high capital intensity,elements of natural monopoly, and location-specificinvestments—all of which affect private sector in-centives to commit long-term capital. We adoptan eclectic approach, because of the vast scope ofthe subject matter and its multisectoral nature,and highlight the interface between governmentpolicy and investor behavior, on the one hand,and the intricate structure of developing-country
gdf_148-167.qxd 4/6/04 1:01 PM Page 150

T H E C H A L L E N G E O F F I N A N C I N G I N F R A S T R U C T U R E I N D E V E L O P I N G C O U N T R I E S
and electricity industries. This poor resiliencyunderscores the importance of macroeconomicstability and measures to prevent future finan-cial crises.
• Public entities, such as municipal utilities andparastatal corporations, will remain majorplayers in the financing, development, and de-livery of infrastructure services in many devel-oping countries. Fundamental improvements intheir creditworthiness will be essential to facili-tate their access to global and domestic capitalmarkets, as well as to bring in private equityinvestments to a range of public-private part-nerships. Corporate-level and sector-specificreforms will have to be pursued. At the cor-porate level, investment planning, financialreporting, and corporate governance will haveto meet commercial standards. At the sectorlevel, reforms in the complementary regulatoryenvironment will be essential to minimizeregulatory risk.
• Substantial investments in developing-countryinfrastructure are unlikely to materialize un-
less there is a strong institutional frameworkfor protecting creditors’ rights, effectivecovenants, and reliable avenues of legal en-forcement and remedy. Bond investors respondto a strong institutional framework by loweringthe cost of capital.
The changing balance between the public and private sectors
Participation by the private sector in infrastruc-ture has a long history. The procurement of
public infrastructure facilities can be traced to the“master contractor model” of Roman times. Proj-ect financing dates back to the Middle Ages,when, in 1299, the English Crown financed thedevelopment of a silver mine in Devon throughan off-balance-sheet loan from a leading Italianmerchant bank, assuming much of the operationaland market risks. The concession structure datesback to sixteenth-century France, where the stategranted a private company a concession to build
151
The analysis in this chapter draws on three measures ofcapital flows to developing-country infrastructure:
• International investment in developing-country infra-structure is defined as the total volume of capitalraised internationally through bank loans, bonds, andequity offerings for the core economic infrastructuresectors of telecommunications (all types of communi-cation infrastructure and services), transport (allmodes of transport infrastructure and services, as wellas transport companies, such as airline and railwayoperators), power (including electricity generation andelectric and gas utilities), and water and sanitation (allactivities regarding water supply and treatment andwaste management infrastructure and services) in de-veloping countries. Data on debt volumes cover trans-actions on international loan syndications and bondissues reported by capital-market sources, includingDealogic Bondware and Loanware. Information onequity flows is based on World Bank staff estimates,using estimated debt-equity ratios that range from42/58 for mobile telecommunications to 78/22 for
road transportation, with those ratios being based ona study by Foreign Investment Advisory Services(Sader 2000).
• Private participation in infrastructure (PPI) comesdirectly from the World Bank PPI Project Database,which tracks information on total infrastructureinvestment with private involvement in developingcountries. The database covers projects in the energy,telecommunications, transport, and water sectors thatare owned or managed by private companies in devel-oping countries and that directly or indirectly servethe public. Only projects that have reached financialclosure are included. In general, investments arerecorded on a commitments basis in the year of finan-cial closure; actual disbursements are not tracked.
• Project finance for infrastructure refers to transac-tions for nonrecourse and limited recourse project finance through international capital markets, but excludes export credit agency facility financing, which is considered trade finance. Such information is compiled from deals reported in Dealogic’s Projectware database.
Box 6.2 Measuring capital flows to developing countries’infrastructure
gdf_148-167.qxd 4/6/04 1:01 PM Page 151

G L O B A L D E V E L O P M E N T F I N A N C E 2 0 0 4
the Canal du Midi in 1514. In the United States,the need to finance railroads and canals in thenineteenth century helped foster the developmentof the national debt market.
Despite this long history, infrastructure has,relative to other capital-intensive industries, un-dergone sharp shifts in government policy, publicattitude, and the intellectual environment. Twenty-five years ago, infrastructure services in virtuallyall developing countries, and in most developedones, were controlled by the state, through owner-ship of vertically integrated utilities and otherinfrastructure entities. In the Philippines, forexample, the government-owned National PowerCorporation maintained a monopoly on the gener-ation and wholesale distribution of electricity, asdid Kazakhenergo in Kazakhstan and the OfficeNational de l’Electricite in Morocco. In the telecom-munications industry, government-owned monop-olies were normally dominant, including Telefonosde Mexico SA de CV, Telecom Egypt, and Nitel inNigeria. Similar examples abound.
In countries where infrastructure assets wereprivately owned, as in the United States, the domi-nant institutional structure was that of the “verti-cally regulated monopoly utility,” under whichutilities enjoyed local franchise monopolies in re-turn for allowing their rates to be regulated andagreeing to serve the interests of the public.3
Financing for infrastructure reflected the sta-bility of both the public ownership model and thereliance on regulated utilities. Under the firstmodel, investors and creditors could count on theexplicit backing of governments. State-owned util-ities were dependent upon the fiscal budget fornew investments and often for meeting shortfallsin operating revenues. In the latter model, that ofthe vertically regulated monopoly, stability camefrom the utilities’ income stream—which was pre-dictable because charges were regulated.
Charges were based on a transparent calcula-tion of return on fixed assets or price-cap regulationwith the incentive for enhanced return throughcost savings. The main burden was borne by tax-and ratepayers, who implicitly underwrote theinvestment risks and sometimes suffered from theinefficiency of state-owned utilities. Operating inef-ficiencies in developing-country infrastructure areestimated to have caused losses of $55 billion ayear, equivalent to 1 percent of developing-countryGDP (World Bank 1994).
Over the past three decades, the global in-frastructure markets have undergone unprece-dented change and institutional reorganization.Rapid technological advances, particularly in thetelecommunications sector, and conscious changesin public policy brought deregulation and compe-tition in mature markets and liberalization in thedeveloping world.
The telecommunications industry, once reliantupon fixed-line voice service, now boasts a varietyof new products and services, from videoconfer-encing to third-generation mobile telephones.Since 1995, worldwide mobile phone subscrip-tions have soared by 1,360 percent, compared to76 percent for fixed-line services (figure 6.2). With1.3 billion subscribers, mobile phones are now themain form of telecommunication. Internet connec-tions ballooned from 4 million in 1995 to 665 mil-lion by 2003. With innovations such as broadbandtransmission and wireless technologies, telecom-munications infrastructure is set to undergo fur-ther changes. Many developing countries, espe-cially those in which geography is an impedimentto fixed telecommunication infrastructure, are ex-pected to skip the deployment of wired technologyin favor of wireless. In the power sector, recenttechnological advances have led to reductions inthe capital costs of power plants using new or re-newable fuel sources. Technological change canencourage competition by lowering sunk costs andreducing the natural monopoly elements of infra-structure industries.
152
Source: International Telecommunication Union.
1995 1996 1997 1998 1999 2000 2001 2002 2003
Figure 6.2 The growth of mobile telecommunications and the Internet, 1995–2003
Billions of subscribers
0.0
0.2
0.6
0.4
0.8
1.0
1.2
1.4
Fixed-line
Mobile
Internet
gdf_148-167.qxd 4/6/04 1:01 PM Page 152
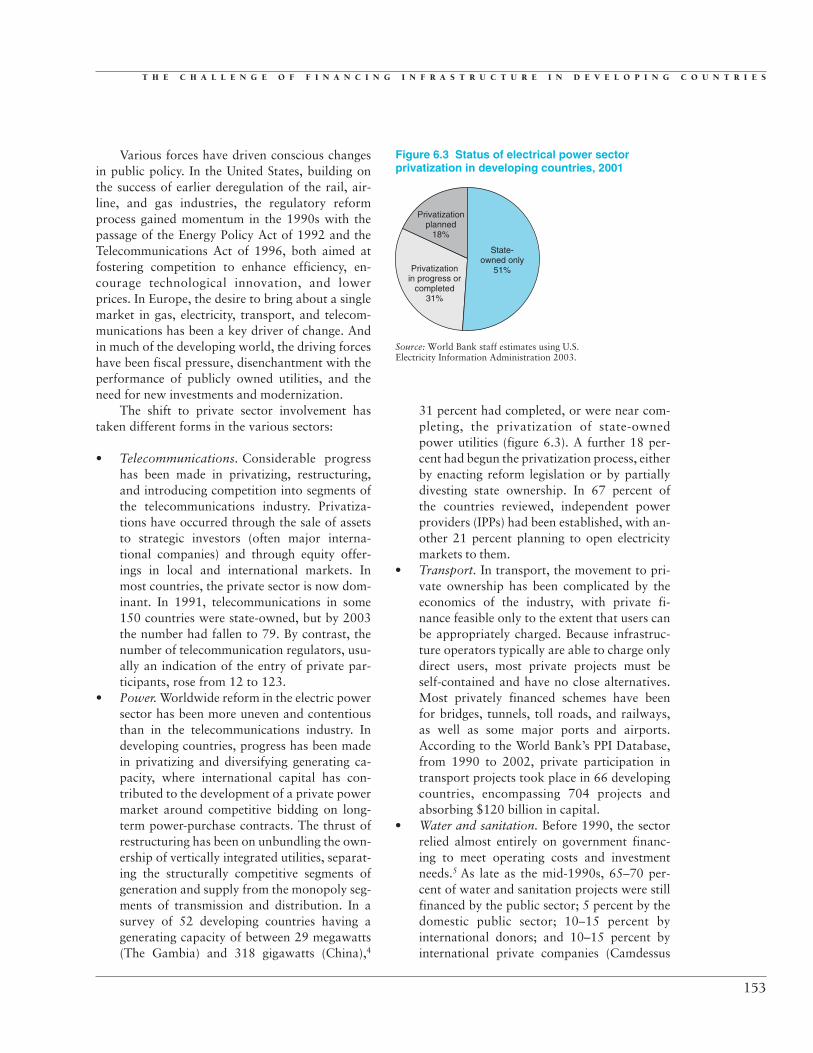
T H E C H A L L E N G E O F F I N A N C I N G I N F R A S T R U C T U R E I N D E V E L O P I N G C O U N T R I E S
Various forces have driven conscious changesin public policy. In the United States, building onthe success of earlier deregulation of the rail, air-line, and gas industries, the regulatory reformprocess gained momentum in the 1990s with thepassage of the Energy Policy Act of 1992 and theTelecommunications Act of 1996, both aimed atfostering competition to enhance efficiency, en-courage technological innovation, and lowerprices. In Europe, the desire to bring about a singlemarket in gas, electricity, transport, and telecom-munications has been a key driver of change. Andin much of the developing world, the driving forceshave been fiscal pressure, disenchantment with theperformance of publicly owned utilities, and theneed for new investments and modernization.
The shift to private sector involvement hastaken different forms in the various sectors:
• Telecommunications. Considerable progresshas been made in privatizing, restructuring,and introducing competition into segments ofthe telecommunications industry. Privatiza-tions have occurred through the sale of assetsto strategic investors (often major interna-tional companies) and through equity offer-ings in local and international markets. Inmost countries, the private sector is now dom-inant. In 1991, telecommunications in some150 countries were state-owned, but by 2003the number had fallen to 79. By contrast, thenumber of telecommunication regulators, usu-ally an indication of the entry of private par-ticipants, rose from 12 to 123.
• Power. Worldwide reform in the electric powersector has been more uneven and contentiousthan in the telecommunications industry. Indeveloping countries, progress has been madein privatizing and diversifying generating ca-pacity, where international capital has con-tributed to the development of a private powermarket around competitive bidding on long-term power-purchase contracts. The thrust ofrestructuring has been on unbundling the own-ership of vertically integrated utilities, separat-ing the structurally competitive segments ofgeneration and supply from the monopoly seg-ments of transmission and distribution. In asurvey of 52 developing countries having agenerating capacity of between 29 megawatts(The Gambia) and 318 gigawatts (China),4
31 percent had completed, or were near com-pleting, the privatization of state-ownedpower utilities (figure 6.3). A further 18 per-cent had begun the privatization process, eitherby enacting reform legislation or by partiallydivesting state ownership. In 67 percent ofthe countries reviewed, independent powerproviders (IPPs) had been established, with an-other 21 percent planning to open electricitymarkets to them.
• Transport. In transport, the movement to pri-vate ownership has been complicated by theeconomics of the industry, with private fi-nance feasible only to the extent that users canbe appropriately charged. Because infrastruc-ture operators typically are able to charge onlydirect users, most private projects must beself-contained and have no close alternatives.Most privately financed schemes have beenfor bridges, tunnels, toll roads, and railways,as well as some major ports and airports.According to the World Bank’s PPI Database,from 1990 to 2002, private participation intransport projects took place in 66 developingcountries, encompassing 704 projects andabsorbing $120 billion in capital.
• Water and sanitation. Before 1990, the sectorrelied almost entirely on government financ-ing to meet operating costs and investmentneeds.5 As late as the mid-1990s, 65–70 per-cent of water and sanitation projects were stillfinanced by the public sector; 5 percent by thedomestic public sector; 10–15 percent byinternational donors; and 10–15 percent byinternational private companies (Camdessus
153
State-owned only
51%
Privatizationplanned
18%
Privatizationin progress or
completed31%
Figure 6.3 Status of electrical power sectorprivatization in developing countries, 2001
Source: World Bank staff estimates using U.S.Electricity Information Administration 2003.
gdf_148-167.qxd 4/6/04 1:01 PM Page 153

G L O B A L D E V E L O P M E N T F I N A N C E 2 0 0 4
2003). The predominance of the public sectoris expected to continue for the foreseeable fu-ture. However, with the introduction of variousforms of public-private partnership in projectdesign, development, finance, production, andservice provision, private participation inwater and sanitation has grown. Between1990 and 2001, the private sector invested$40 billion in 203 water and sanitation projectsin developing countries.
The transition to private participation in infra-structure has not yet settled; consequently, thefinancing environment for developing-countryinfrastructure is not clearly defined. In manydeveloping countries, the agenda of market liberal-ization, regulatory reform, and the restructuringof state-owned monopoly utilities remains unfin-ished. Furthermore, given the characteristics ofcertain infrastructure industries, including thehuge sunk costs involved, elements of natural mono-poly, and their political saliency, there remains astrong rationale for state intervention, even incases where privatization has been completed.Also, investors must factor in ongoing transforma-tions of the global infrastructure industry, such ashow to accurately price and gauge demand fornew products resulting from rapid technologicalchange.
Together with a series of recent financialcrises, these developments have taken their toll,presenting a hierarchy of risks at the industry,country, and project levels. Those risks raise thecost of capital and make investors and creditorsaverse to long-term investments in developing-country infrastructure.
Recent developments in privateexternal financing
The investment opportunities that came withthe wave of privatization and liberalization in
the early 1990s encouraged major internationalproject operators and contractors facing poorergrowth prospects in their home countries to investin power plants, roads, and telecommunication fa-cilities in the developing world. The entry of multi-nationals in the infrastructure sectors, which hadtraditionally been closed to international competi-tors and private participation, implied a process oflearning, experimentation, and bargaining by
firms and host governments. Firms had three com-parative advantages in overcoming the barriers toentry in developing-country infrastructure. First,the utilization of modern technology, particularlyin the telecommunications sector. Second, accessto capital at a lower cost than that available to hostcountries’ governments. And third, a capacity to op-erate at a global level, implying, among other things,an ability to draw on synergies involved in struc-turing business relationships in the form of jointventures, consortia, and special-purpose vehicles.6
Expansion was initially fuelled by optimisticexpectations about demand, the commitment ofgovernments to contractual terms, the credit qual-ity of project off-takers, consumers’ ability to pay,and, above all, the stability of macroeconomicconditions. In the transport sector, for example,Standard and Poor’s studied 32 toll roads world-wide, finding that traffic forecasts were too highin 28 cases—actual traffic volumes averaged only73 percent of the forecast (Bain and Wilkins 2002).In the power sector, state-owned enterprises com-monly entered into long-term power-purchaseagreements on the understanding that those agree-ments would be guaranteed by a tariff indexed tohard currencies, such as the dollar, over the con-tract’s entire life, backstopped by governmentguarantees. As those expectations proved over-optimistic, capital flows to developing-countryinfrastructure began to decline. Meanwhile, capi-tal flows to infrastructure remain concentrated ina small number of countries.
Growth in the 1990s The total volume of infrastructure finance raisedinternationally through commercial bank syndica-tions, bond issuance, and equity participation rosefrom $23 billion in 1994 to $90 billion in 1997.Infrastructure investment with private participa-tion in developing countries rose from $38 billionin 1994 to $114 billion in 1997, and the volume ofproject finance deals rose from $8 billion to $52 bil-lion over the same period (figure 6.4). As a shareof total gross domestic capital formation, interna-tional investment in developing-country infrastruc-ture grew from 1.5 percent in 1992 to 6.2 percentin 1997 (table 6.1).
The financing of most forms of infrastructureinvolves a combination of project promoters,lenders, multilaterals, and export credit agencies,each with its own objectives but tied together
154
gdf_148-167.qxd 4/6/04 1:01 PM Page 154

T H E C H A L L E N G E O F F I N A N C I N G I N F R A S T R U C T U R E I N D E V E L O P I N G C O U N T R I E S
through a nexus of contracts (box 6.3). Of these dif-ferent players, the greatest source of finance tradi-tionally has been commercial banks, often in con-nection with officially backed export credit agenciesand multilateral organizations. The internationalsyndicated loan market has accounted for 62 per-cent of international investment in developing-country infrastructure in the past decade. Inthe 1990s, the rise was led by banks domiciled inJapan, the United States, and Europe (primarilyFrance, Germany, the Netherlands, and the UnitedKingdom), which together accounted for aboutthree-quarters of all commercial bank infrastruc-ture finance for developing countries in 1990–97,when such financing grew nearly nine-fold. Box 6.4provides information on the key characteristics ofsyndicated bank lending to infrastructure.
155
Table 6.1 International investment in developing countries’ infrastructure as a share of total gross domestic capital formation, 1992–2003Percent
1992 1993 1994 1995 1996 1997 1998 1999 2000 2001 2002 2003
Total 1.5 2.5 2.1 3.8 3.8 6.2 5.1 5.6 5.4 3.7 2.9 3.4East Asia & Pacific 2.8 5.1 3.5 4.7 4.6 4.7 5.1 3.1 4.4 1.7 3.1 4.2Europe & Central Asia 0.6 0.8 1.3 4.3 3.2 5.9 7.0 8.3 8.1 4.3 4.9 5.5Latin America & the Caribbean 1.3 1.4 1.2 2.7 4.2 8.1 5.9 5.9 7.5 7.8 2.8 1.7Other regions 0.8 1.5 1.6 3.2 2.2 5.8 2.4 7.0 3.0 2.6 1.1 2.1
Note: Data for 2003 are from January through November.Sources: Dealogic Bondware, Loanware, and Projectware, and World Bank staff estimates.
Note: Data for 2003 are from January through November.Sources: Dealogic Bondware, Loanware, and Projectware, andWorld Bank staff estimates.
1994 1995 1996 1997 1998 1999 2000 2001 2002 2003
Figure 6.4 Private financial flows to developingcountries’ infrastructure, 1994–2003
$ billions
0
40
20
60
80
100
120
Investment withprivate participation
Internationalinvestment
Project finance
Most infrastructure finance deals draw on an array oflocal and international funding sources, including
syndicated commercial bank loans, bond issuances, equip-ment leasing, multilateral and export credit agency loansor guarantees, and equity commitments by project pro-moters and dedicated equity funds.
Vietnam’s first international Build-Operate-Transferpower project, Phu My 3, with a generating capacity of717 megawatts, reached financial closure in June 2003.Three-quarters of the funding took the form of debt,$40 million of which came from the Asian DevelopmentBank; $99 million from the Japanese export credit agency,JBIC; and $170 million from a syndicate of internationalbanks (Bank of Tokyo-Mitsubishi, Credit Agricole Indosuez,Credit Lyonnais, Fortis Bank, and Mizuho Corporate
Bank). The equity component of $103 million wasprovided by the main sponsors (Electricite de France,Sumitomo Corporation, and Tokyo Electric PowerCompany), as shareholders’ capital. The extended politicalrisk insurance supporting the commercial tranche isprovided by the Asian Development Bank, the MultilateralInvestment Guarantee Agency, and Nippon Export andInvestment Insurance.
The financing structure of Phu My 3, with severaltypes of debt, equity, and credit enhancements, is notunique to Vietnam or the power sector. It satisfies twoneeds: to ensure access to international capital marketsand to enhance efficiency by reducing overall financingcosts, and extending debt maturity to match the project’sunderlying economics.
Box 6.3 Phu My 3—An example of the multisourcenature of infrastructure finance
gdf_148-167.qxd 4/6/04 1:01 PM Page 155

G L O B A L D E V E L O P M E N T F I N A N C E 2 0 0 4
156
Banks engage in syndicated lending to diversify theirportfolio, both as a matter of commercial prudence
and to comply with capital-adequacy requirements. Syndicated lending benefits the borrowers in several ways. First, it offers a wide range of maturities—from 364 days of revolving credit to 10-year project financeloans. Second, it provides necessary flexibility in loandrawdown during project construction. Third, bank loanscan usually be repaid without penalty, creating flexibilityfor later refinancing.
Almost by definition, such syndicated bank loans arepriced at a floating rate, at a spread or margin (expressedin basis points) over a benchmark rate such as LIBOR orEuribor; nearly all are denominated in major currencies.In addition, they share three notable characteristics:
• Syndicated bank loans for infrastructure are closelylinked with overall bank lending to developing coun-tries (see figure below at left). As total new bank loansincreased from close to $20 billion in the mid-1980sto almost $170 billion in 1997, infrastructure financefrom commercial banks rose from about $3 billion toalmost $50 billion. Since, it has dipped back to lessthan $30 billion.
• Infrastructure-related instruments have longermaturities than those for other activities (see figure atright). However, the average tenure for infrastructure finance declined from around 8.5 years in the 1980s to7 years in the 1990s, decreasing further in 2000–03.The decline can be explained by the composition of
0
30
60
90
120
150
180
Infrastructure financing and total bank lending,1980–2003
$ billions
2000 20031980 1984 1988 1992 1996
Sources: Dealogic Loanware and World Bank staff estimates.
Total bank lending
Infrastructurefinance
0
50
100
150
Average size of transactions, 1980–2003
$ millions
2000 20031980 1984 1988 1992 1996
Sources: Dealogic Loanware and World Bank staff estimates.
Infrastructure finance
Other bank lending
0
100
50
200
300
250
150
Average margin over benchmark rates, 1980–2003
Basis points
2000 20031980 1984 1988 1992 1996
Sources: Dealogic Loanware and World Bank staff estimates.
Infrastructure finance
Other banklending
Box 6.4 Key characteristics of syndicated bank lendingto infrastructure
borrowers. Average maturity was higher when EastAsia dominated such financing, with maturities aver-aging eight years in East Asia between 1980 and2003, compared with six in Latin America.
• Pricing has followed the overall structure for marginsin bank lending (see lower right figure). Particularlynoteworthy is the jump in pricing since 1998, asbanks’ risk aversion increased. The average margin on infrastructure finance increased from an average of 160 basis points in 1995–97 to 220 basis points in 2000–03, compared with an increase in the marginon general bank lending over the same period from142 basis points to about 200 basis points.
gdf_148-167.qxd 4/6/04 1:01 PM Page 156

T H E C H A L L E N G E O F F I N A N C I N G I N F R A S T R U C T U R E I N D E V E L O P I N G C O U N T R I E S
157
A nascent bond market has also developed,driven by the economic reforms, market liberaliza-tion, and financial innovations of the early 1990s.New issuance amounted to about $4 billion in2000–03, with most of the activity occurring intelecommunications (figure 6.5). The main issuingcountries have been Argentina, Brazil, Chile, China,Colombia, India, Indonesia, Malaysia, Mexico,the Philippines, Qatar, the República Bolivarianade Venezuela, and Thailand. As the market hasgained maturity, it has delivered a series of high-profile transactions—among them the $1.2 billionbond issued by Qatar for the Laffan Liquified Nat-ural Gas project, $1 billion issued by theRepública Bolivariana de Venezuela for thePetrozuarta oil project, and $125 million issued bythe Philippines for the Quezon power project—and has encompassed a broad range of projecttypes, issue sizes, and seniority.
Compared to the bank market, bond marketsoffer some advantages in terms of longer maturities,tradability, and back-weighted repayment structuresthat help to support equity returns. Infrastructureproject bonds appeal in particular to institutional in-vestors, such as insurance companies and pensionfunds, for which the long-term nature of investmentprojects is an advantage, as they can generate stable,long-term cash flows to match long-termliabilities.
During the mid-1990s, spreads on projectbonds were 200–400 basis points, and maturitiesaveraged more than 10 years (table 6.2). A sample of
105 emerging-market project bonds issued betweenJanuary 1993 and March 2002 found that, on aver-age, project bonds were rated barely below invest-ment grade—between BBB� and BBB according toStandard and Poor’s rating classifications. Thespread on project bonds typically was lower than onthe sovereign bonds of the corresponding countries.
Infrastructure finance in the wake ofmacroeconomic and industry shocksSince 1997, every important measure of infrastruc-ture finance to developing countries—total exter-nal finance, project finance, and investment withprivate participation—has declined by at least50 percent (see figure 6.4). The downturn wasled by a series of crises affecting emerging-marketeconomies, notably the East Asian countries, theRussian Federation, and Brazil. In recent years, thetrend has been accentuated by a retrenchment bymajor commercial banks and a weakening of theglobal infrastructure industry.
Two factors suggest that the initial downturnwas most influenced by an increase in host-country-related risks (country and project risks) rather thanglobal industry-specific risk:
• The significant drop in investments with pri-vate participation between 1997 and 2000was highly correlated with the increase in sen-sitivity to country risks due to financial crises.In 1997–98, investments in East Asia and inEurope and Central Asia dipped dramatically(figure 6.6), coinciding with a sharp fall insovereign credit ratings in those regions (fig-ure 6.7). Investments and credit ratings inLatin America followed a year later.7
Figure 6.5 Bond financing for developing-countryinfrastructure, 1992–2003
$ billions
Note: Data for 2003 are from January through November.Source: Dealogic Bondware.
0
2
1
3
4
5
6
7
1992 1996 1998 2000 20021994
TelecomTransport Water & seweragePower
Table 6.2 Infrastructure bond issuance, 1994–2003
Number of Maturity Amount Launch spreads bond issued (years) ($ billions) (basis points)
1994 16 7.9 2.8 2461995 17 10.8 2.5 2311996 31 10.9 5.8 3131997 31 10.2 6.0 3541998 22 8.5 4.5 4181999 25 6.8 6.0 4432000 17 5.9 4.3 4092001 15 6.3 4.3 3842002 21 7.7 3.4 6702003 13 8.8 3.7 —
Note: — � not available. Data for 2003 are from January throughNovember.Source: Dealogic Bondware.
gdf_148-167.qxd 4/6/04 1:01 PM Page 157

G L O B A L D E V E L O P M E N T F I N A N C E 2 0 0 4
• From 1997 to 2000, as capital flows to devel-oping countries declined, the global infra-structure industry remained robust (figure 6.8).Industry risk indicators, as measured by thevolatility of their stock market prices relativeto world stock market prices, remained stable(figure 6.9).8 During this period, it appearsthat investors shifted from investments indeveloping countries’ infrastructure to invest-ments in countries that had opened theirinfrastructure sectors to new public-private
partnership models—notably developed coun-tries in Western Europe.
The susceptibility of infrastructure finance to per-ceived host-country risks suggests the importanceof measures to prevent financial crises and to en-sure macroeconomic stability in developing coun-tries, including the pursuit of sound monetary andfiscal policies.
The commercial bank retrenchment from in-frastructure finance was part of a more general
158
1995 1996 1997 1998 1999 2000 2001 20020
10
30
20
50
40
70
60
80
Figure 6.6 Investment in developing-countryinfrastructure with private participation, 1995–2002
$ billions
Source: PPI Project Database.
Latin America andthe Caribbean
Europe andCentral Asia
East Asiaand Pacific
1995 1996 1997 1998 1999 2000 2001 2002
B1
Ba2
Ba3
Baa3
Ba1
Baa1
Baa2
A3
Figure 6.7 Average regional credit quality,1995–2002
Credit rating (Moody’s)
Sources: Moody’s Investor Service and World Bank staff estimates.
East Asia and Pacific
Latin America andthe Caribbean
Europe andCentral Asia
Figure 6.8 Global annual average of debt financingfor infrastructure, 1990–2003
$ billions
Source: Dealogic Bondware.
0
100
200
99.41
268.25
540.09
436.00
300
400
500
600
1990–1993 1994–1997 1998–2001 2002–2003
Figure 6.9 Risk of investing in telecommunicationsand electricity, 1995–2003
Volatility in stock market price indexes
Note: The volatility of the telecommunications and electricitysectors is defined as the standard deviation of the stock pricereturns measured over the preceding quarter.Sources: Morgan Stanley and World Bank staff estimates.
0
0.005
0.010
0.015
0.020
0.030
0.035
0.025
0.040
Mar. 1995 Mar. 1997 Mar. 1999 Mar. 2001 Mar. 2003
Electricity (U.S.)
Telecommunications
Electricity World
gdf_148-167.qxd 4/6/04 1:01 PM Page 158

T H E C H A L L E N G E O F F I N A N C I N G I N F R A S T R U C T U R E I N D E V E L O P I N G C O U N T R I E S
retrenchment of banks, particularly U.S. andJapanese banks (figure 6.10), from lending to de-veloping countries, due to increased sensitivity tocountry risk (see chapter 2).
The decline in infrastructure financing inrecent years has been accentuated by weaknessin the telecommunications and power sectors.Telecommunications and power both have experi-enced financial strain, as indicated by a steep de-cline in share prices (figure 6.11). In power, the com-panies that drove the 1990s boom in the sector
159
(mainly those in the United States) experienced, onaverage, an 88 percent fall in stock prices betweenJune 2001 and October 2002, the most seriouslyaffected being AES, Calpine, CMS, El Paso Energy,Enron, Mirant, and Reliant. In telecommunica-tions, share prices of major firms have fallen bysome 70 percent since January 2000. Furthermore,the decline in infrastructure financing coincidedwith a sharp increase in risk measures associatedwith investments in these sectors, as reflected bythe substantial increase in the volatility of stockmarket price indices (see figure 6.9), and the sig-nificant increase in the sensitivity of sector returnsto global returns (box 6.5).
Part of the reason for the weakness of the sec-tors was the revelation of accounting irregularities,with Adephia Communications, Enron, Qwest,and WorldCom now under criminal investigationin the United States. But in telecommunications,technological change also played a part in thedecline. While creating new opportunities for largetransnational players, rapid change has creatednew difficulties, particularly in accurately gaugingdemand and pricing new products. The balancesheets of telecommunications companies wereseverely hit by two investments—the 100-foldincrease in the fiber-optic transmission capacitysince 1998 (demand grew four-fold), and the highbids (up to $125 billion) for third-generation mo-bile licenses in European markets, which have notyet generated significant returns.
Since the middle of 2003, there has been evi-dence of a recovery in the financial health of theglobal telecommunications and electricity indus-tries. Stock prices in both sectors have increasedslowly, volatility has fallen (dramatically in thethird quarter of 2003), balance-sheet consolida-tion has progressed, and growth has resumed.The telecommunications industry is expected toshow growth of 10.1 percent in 2003, reversingdeclines in 2001 and 2002 (TelecommunicationsIndustry Association 2003). Many electricityfirms are seeking a better position in the marketthrough domestic and cross-border mergers andacquisitions.
Regional differences in infrastructure flowsInternational investment in developing countries’infrastructure is spread unevenly across regions.Over the past decade, most external financing wentto East Asia and Latin America. East Asia alone
Figure 6.10 Share in infrastructure-related banklending
% of developing-country total
Sources: Dealogic Loanware and World Bank staff estimates.
0
10
20
3030
23
1210
96 6
77
14
6
11
United
State
sFra
nce
Japa
n
Germ
any
Nethe
rland
s
United
Kingdo
m
1990–1997 1998–2003
Figure 6.11 Stock market behavior of globaltelecommunications and electricity industries,1995–2003
Stock market index
0
20
40
60
80
100
120
140
160
180
1995 1997 1999 2001 2003
Sources: Morgan Stanley and World Bank staff estimates.
Telecommunications
Electricity
Electricity(U.S.)
gdf_148-167.qxd 4/6/04 1:01 PM Page 159

G L O B A L D E V E L O P M E N T F I N A N C E 2 0 0 4
captured about 44 percent of total developing-country infrastructure finance in 1990–96, led byChina, Malaysia, and, to a lesser extent, Indonesia,the Philippines, and Thailand. But the region’sshare was cut in half in 1997–2001 in the wake ofthe East Asian crisis. Despite a slight recovery in2002–03, memories of failed projects still block arapid resumption of foreign investment.
After the East Asian crisis, Latin America be-came a relatively more important borrower ofexternal infrastructure funds, led by Argentina,Brazil, Chile, and Mexico. The region’s share ofdeveloping-country infrastructure finance morethan doubled, from an average of 24 percent in theearly 1990s to 33 percent during 1997–2001. Muchof the rise can be ascribed to a sharp increase inprivatization-related financing (especially in thetelecommunication and electricity sectors) andbank lending. Between 2002 and 2003, however,as new commercial bank deals to infrastructureprojects in Latin America plummeted to $3 billionfrom $11 billion in 2001, the region’s share in totalinfrastructure financing dropped correspondingly.
Short-term liquidity became a concern in Chile,while utilities in Brazil struggled with the effects ofa 2001 drought that required unprecedented energyconservation measures. In Argentina, many public-service providers of infrastructure services defaultedon their obligations, openly questioning the com-mercial viability of their enterprises under prevail-ing political conditions. República Bolivariana deVenezuela suffered the aftershocks of general strikesin late 2002 and 2003, during which capital con-trols were imposed and demand for electricity fell.
External financing for infrastructure in theMiddle East and North Africa, South Asia, and Sub-Saharan Africa was small throughout the 1990s,with most externally financed projects concentratedin just a few countries. However, in the Middle East,the ability of national and regional banks to providemedium- to long-term local funding (includingthrough Islamic financing instruments) has beeninstrumental in financing an array of desalinationand independent water and power projects. Theseinclude the Barha project in Oman and the $1.8 bil-lion Umm Al-Nar project in Abu Dhabi.
160
It is possible to test whether systemic risk, referred to asbeta risk in the Capital Asset Pricing Model, increased in
the telecommunications and electricity sectors during theperiod of the global downturn, by deploying the followingregression model:
Return on a particular sector index � a � b*return on world index � c*dummy
� d*(dummy)*(return on world index) � error term.
The model was estimated using daily observationsfrom January 1, 1995, to November 11, 2003. The dummyequals 1 in the period March 1, 2000, to March 1, 2003,and zero otherwise; b reflects the beta for each sector between January 1, 1995, and March 1, 2000 (the boomperiod in global infrastructure finance); and d measures the change in beta during the decline. A positive and statistically significant value of d indicates an increase in systemic risk during the downturn. The results are summarized in the box table and indicate that the beta significantly increased in both sectors, with the increase
Regression results: Increase in systemic risk during the downturn
Return Return Return telecom electricity electricity index U.S. index index
Constant a 0.00 0.00 0.00(1.40) (0.19) (0.09)
Return world index b 0.94* 0.37* 0.50*(34.68) (8.78) (20.76)
Dummy c 0.00* 0.00 0.00(�3.11) (�0.96) (�1.25)
(Dummy)*(return world index) d 0.23* 0.35* 0.08*(6.21) (5.96) (2.29)
R-squared 0.59 0.15 0.32Number of observations 2,312 2,312 2,312
Note: Figures in parentheses indicate t-statistics; * indicates significance at the5-percent level. Model is estimated using ordinary least squares methodology.Sources: Morgan Stanley and World Bank staff estimates.
Box 6.5 Systemic risk associated with investing intelecommunications and electricity
in risk in the electricity sector almost entirely driven byU.S.-based companies.
gdf_148-167.qxd 4/6/04 1:01 PM Page 160
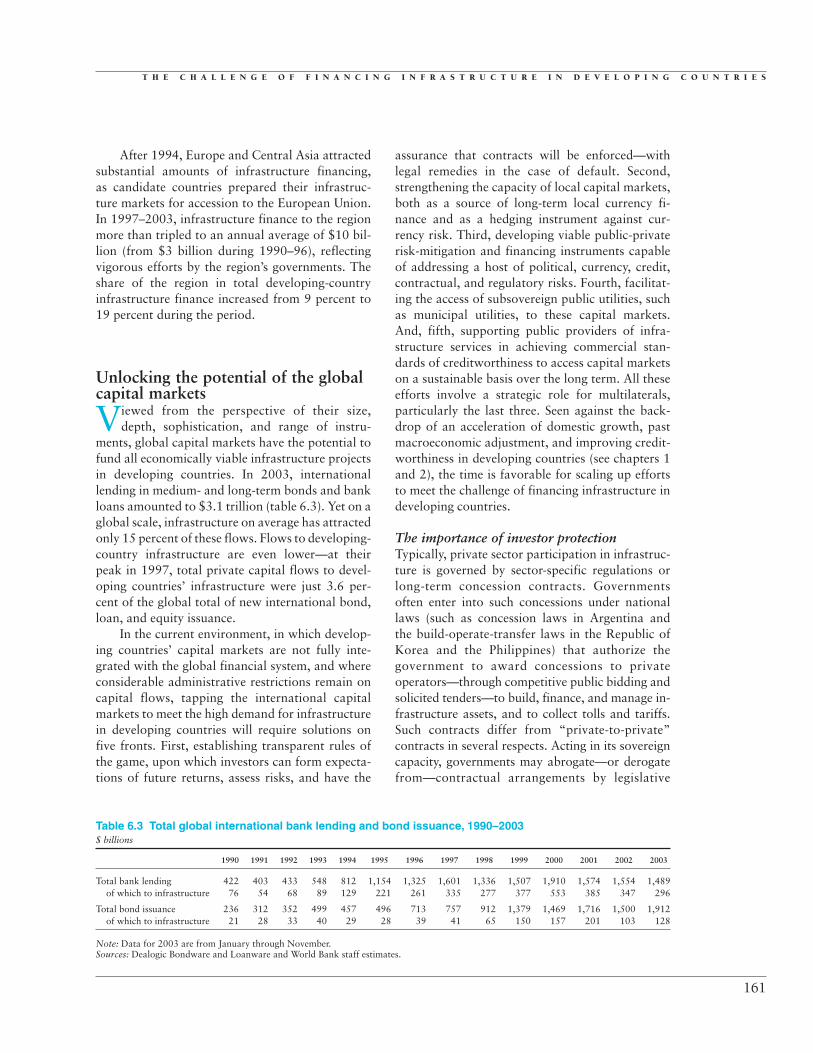
T H E C H A L L E N G E O F F I N A N C I N G I N F R A S T R U C T U R E I N D E V E L O P I N G C O U N T R I E S
After 1994, Europe and Central Asia attractedsubstantial amounts of infrastructure financing,as candidate countries prepared their infrastruc-ture markets for accession to the European Union.In 1997–2003, infrastructure finance to the regionmore than tripled to an annual average of $10 bil-lion (from $3 billion during 1990–96), reflectingvigorous efforts by the region’s governments. Theshare of the region in total developing-countryinfrastructure finance increased from 9 percent to19 percent during the period.
Unlocking the potential of the globalcapital markets
Viewed from the perspective of their size,depth, sophistication, and range of instru-
ments, global capital markets have the potential tofund all economically viable infrastructure projectsin developing countries. In 2003, internationallending in medium- and long-term bonds and bankloans amounted to $3.1 trillion (table 6.3). Yet on aglobal scale, infrastructure on average has attractedonly 15 percent of these flows. Flows to developing-country infrastructure are even lower—at theirpeak in 1997, total private capital flows to devel-oping countries’ infrastructure were just 3.6 per-cent of the global total of new international bond,loan, and equity issuance.
In the current environment, in which develop-ing countries’ capital markets are not fully inte-grated with the global financial system, and whereconsiderable administrative restrictions remain oncapital flows, tapping the international capitalmarkets to meet the high demand for infrastructurein developing countries will require solutions onfive fronts. First, establishing transparent rules ofthe game, upon which investors can form expecta-tions of future returns, assess risks, and have the
assurance that contracts will be enforced—withlegal remedies in the case of default. Second,strengthening the capacity of local capital markets,both as a source of long-term local currency fi-nance and as a hedging instrument against cur-rency risk. Third, developing viable public-privaterisk-mitigation and financing instruments capableof addressing a host of political, currency, credit,contractual, and regulatory risks. Fourth, facilitat-ing the access of subsovereign public utilities, suchas municipal utilities, to these capital markets.And, fifth, supporting public providers of infra-structure services in achieving commercial stan-dards of creditworthiness to access capital marketson a sustainable basis over the long term. All theseefforts involve a strategic role for multilaterals,particularly the last three. Seen against the back-drop of an acceleration of domestic growth, pastmacroeconomic adjustment, and improving credit-worthiness in developing countries (see chapters 1and 2), the time is favorable for scaling up effortsto meet the challenge of financing infrastructure indeveloping countries.
The importance of investor protectionTypically, private sector participation in infrastruc-ture is governed by sector-specific regulations orlong-term concession contracts. Governmentsoften enter into such concessions under nationallaws (such as concession laws in Argentina andthe build-operate-transfer laws in the Republic ofKorea and the Philippines) that authorize thegovernment to award concessions to privateoperators—through competitive public bidding andsolicited tenders—to build, finance, and manage in-frastructure assets, and to collect tolls and tariffs.Such contracts differ from “private-to-private”contracts in several respects. Acting in its sovereigncapacity, governments may abrogate—or derogatefrom—contractual arrangements by legislative
161
Table 6.3 Total global international bank lending and bond issuance, 1990–2003$ billions
1990 1991 1992 1993 1994 1995 1996 1997 1998 1999 2000 2001 2002 2003
Total bank lending 422 403 433 548 812 1,154 1,325 1,601 1,336 1,507 1,910 1,574 1,554 1,489of which to infrastructure 76 54 68 89 129 221 261 335 277 377 553 385 347 296
Total bond issuance 236 312 352 499 457 496 713 757 912 1,379 1,469 1,716 1,500 1,912of which to infrastructure 21 28 33 40 29 28 39 41 65 150 157 201 103 128
Note: Data for 2003 are from January through November.Sources: Dealogic Bondware and Loanware and World Bank staff estimates.
gdf_148-167.qxd 4/6/04 1:01 PM Page 161

G L O B A L D E V E L O P M E N T F I N A N C E 2 0 0 4
means. Governments also have legitimate public-policy goals and concerns, such as affordability,universal access, and the regulation of monopolypractices. These differences expose the vulnerabil-ity of privately financed infrastructure projects to ahost of contractual, political, and regulatory risks.Sustainable private financing of infrastructure re-quires enhancing the credibility of governments’ re-form and regulatory commitments. This can occurby institutional and legal development, as well asby more transparent procedures for project selec-tion, appraisal, and the awarding of concessions.9
The legal documents governing virtually allinfrastructure finance projects include provisionsrequiring the host country to submit to interna-tional commercial arbitration—the InternationalCourt of Arbitration of the International Chamberof Commerce, the London Court of InternationalArbitration, or the Arbitration Institute of theStockholm Chamber of Commerce—as a mech-anism of dispute resolution and enforcement.Arbitration is a binding, nonjudicial means of dis-pute resolution and—because a majority of coun-tries have ratified the New York Convention on theRecognition and Enforcement of Foreign ArbititralAwards of 1958—widely enforceable around theworld, in contrast to litigation, which is enforce-able only under bilateral treaties (Mattli 2001;Thompson Financial 2004).
For creditors, covenants to mitigate risk andprovide contractual protection have gained impor-tance as a mechanism to increase investor interestin developing-country infrastructure. Becausedebtholders are exposed to the usual problems ofagency, moral hazard, and adverse incentives in-herent in all debt transactions, well-crafted andenforceable debt covenants are crucial for tappingexternal markets for financing. They can protectthe safety and seniority of debtholders’ claims, en-sure repayment of principal, and provide legalremedies in the event of default. Covenant provi-sions are enforced by making their violation anevent of default. The specific covenants includedin a particular debt agreement, and the extent towhich they protect the interests of creditors, willdepend on other attributes, such as collateral, thegoverning law, and the legal and institutionalframeworks underpinning contract formation andenforcement. Given that the writing, negotiation,and monitoring of specific provisions are costly,two sets of considerations become relevant—the
ease with which the stipulated covenants can bemonitored and the scope for potential opportunis-tic behavior that could lead to a transfer of wealthfrom bondholders to shareholders. While most in-frastructure loans and bonds issued internationallyare governed by contracts and covenants basedon United States (New York) or United Kingdom(English) law, enforcement of debt terms dependson the legal system of host countries (Esty andMegginson 2000).
For project bondholders, covenants typicallyoffer security that is less stringent than that attachedto bank loans but greater than that of corporatebonds. A sample of 27 project bonds for which de-tailed covenant information was available indicatesthat project-bond indentures contain provisions,usual in corporate bonds, aimed at mitigating com-mon shareholder-bondholder conflicts.10 Covenantprovisions typically take the form of restrictionson dividends, mergers and acquisition transac-tions, asset disposals, limitations on indebtedness,requirements of third-party guarantees, mainte-nance of good regulatory standing, and, in somecircumstances, the establishment of offshore anddebt-service reserve accounts. In addition, they con-tain two further categories of clauses that arise fromthe very specific nature of project finance:
• Incentive provisions for contractors, operators,and sponsors, such as performance targets,mandatory penalties, and equity participationin the project. For instance, if a project opera-tor fails to meet certain performance targets,then the equity holders would have to injectadditional funds.
• Institutional environment provisions that, incase of changes in the ambient regulatory, legal,or tax environment, would trigger changes inproject control or mandatory redemption ofdebt. For instance, a material change in theterms of agreement for concessions would trig-ger early repayment of the project bond.
Increasing local-currency financing Currency risk, traditionally, has been a critical fea-ture of infrastructure project investment. With theexception of international airports and seaports,most transport infrastructure is domestically ori-ented, with project revenues generated in localcurrencies. But servicing foreign debt and equityinvolves payment in foreign currency. So when
162
gdf_148-167.qxd 4/6/04 1:01 PM Page 162

T H E C H A L L E N G E O F F I N A N C I N G I N F R A S T R U C T U R E I N D E V E L O P I N G C O U N T R I E S
foreign financing flows to projects with only a lim-ited ability to generate such funds, currency risksarise. Hedging can occur, but contracts are usuallylimited to the short term. Investors are exposednot only to fluctuations in the exchange rate, butalso to changes in capital controls, which may af-fect currency convertibility and profit repatriation.
Recently, however, prospects for currency con-vertibility and transferability have improved inmany developing countries, with the liberalizationof capital accounts and the move to more flexibleexchange-rate regimes. At the same time, local-currency fixed-income markets have witnessed con-siderable growth and modernization, particularly inBrazil, Chile, Hungry, India, the Republic of Korea,Malaysia, Mexico, Poland, South Africa, andTurkey. Notably, in countries with a large local in-stitutional investor base (such as Chile, the Republicof Korea, and Malaysia), local debt markets havesignificantly expanded the domestic capacity tomeet needs for long-term infrastructure investment.
A strategic role for multilaterals As they incorporate the Millennium DevelopmentGoals into their targets and strategic vision, multi-laterals have come increasingly to view infrastruc-ture financing within the broader context of fi-nance for development. Their strategy is predicatedon three points of consensus—the pivotal role ofinfrastructure in development; its direct and indi-rect contribution to achieving the MillenniumDevelopment Goals11; and the recognition thatpublic sector support, including well-targeted gov-ernment subsidies, will remain crucial in attractingprivate capital, particularly in sectors such as waterand road transport.
At the same time, the unique role of multilater-als in promoting infrastructure finance, includingtheir years of experience, their capacity to providelong-term loans, and their focus on poverty allevia-tion, is well recognized (Goldin, Dailami, andWallich 2003). However, lending from multilater-als, particularly the World Bank, fell during the1990s—decreasing by 47 percent between fiscalyear 1993 and fiscal year 2002. Trends in multilat-eral development bank spending from 1995 areshown in box 6.6.12
The strategic agenda to promote infrastructurefinancing must focus on three elements. First, mul-tilaterals need to expand their current offering ofloans and guarantee instruments to facilitate access
to global and local capital markets by both privateand public providers of infrastructure services.Political, contractual, regulatory, and foreign-exchange risks will have to be dealt with. Politicalrisk mitigation has advanced in recent years andnow includes a private political-risk insurancemarket and new programs by export credit agen-cies. But instruments to mitigate the other risksremain less developed. The challenge is to achievean appropriate allocation of risks between the pri-vate and public sector, without inducing moralhazard—which implies not having the governmentor public sector shouldering excessive risk. Apartfrom infrastructure loans to public and privateproviders, most multilaterals are able to providepartial credit guarantees, political risk insurance,and partial risk guarantees. Instruments that re-quire further evaluation and development are thoserelating to local-currency lending and guarantees,and liquidity backstopping to mitigate exchange-devaluation risk.
The second item on the agenda for promotinginfrastructure finance is to apply the new financingand risk-mitigation instruments to subsovereignproviders of infrastructure services, such as munici-pal utilities. Facilitating the access of subsovereignentities to capital markets complements the widereconomic reform agenda of fiscal decentralization,wherein local entities assume responsibility for pro-viding infrastructure services. However, carefullystructured incentives will be required to encouragefiscally responsible behavior by these subsovereigninfrastructure providers. Some multilaterals, suchas the European Bank for Reconstruction andDevelopment and the Inter-American DevelopmentBank, have been able to engage at the subsovereignlevel without a government counter-guarantee. TheWorld Bank, including the International FinanceCorporation, is working on similar facilities.
The third element is to work with publicproviders of infrastructure services to fundamen-tally improve their creditworthiness. Corporate-level reforms in investment planning, financialreporting, and corporate governance will have to bepursued, in addition to enhancing investor protec-tion (as discussed above). Although the focus on im-proving the creditworthiness of public enterprises isnot entirely new, there is a need to renew capabili-ties to deliver advisory and implementation supportto achieve this transformation. Ultimately, the infra-structure financing requirements of most developing
163
gdf_148-167.qxd 4/6/04 1:01 PM Page 163
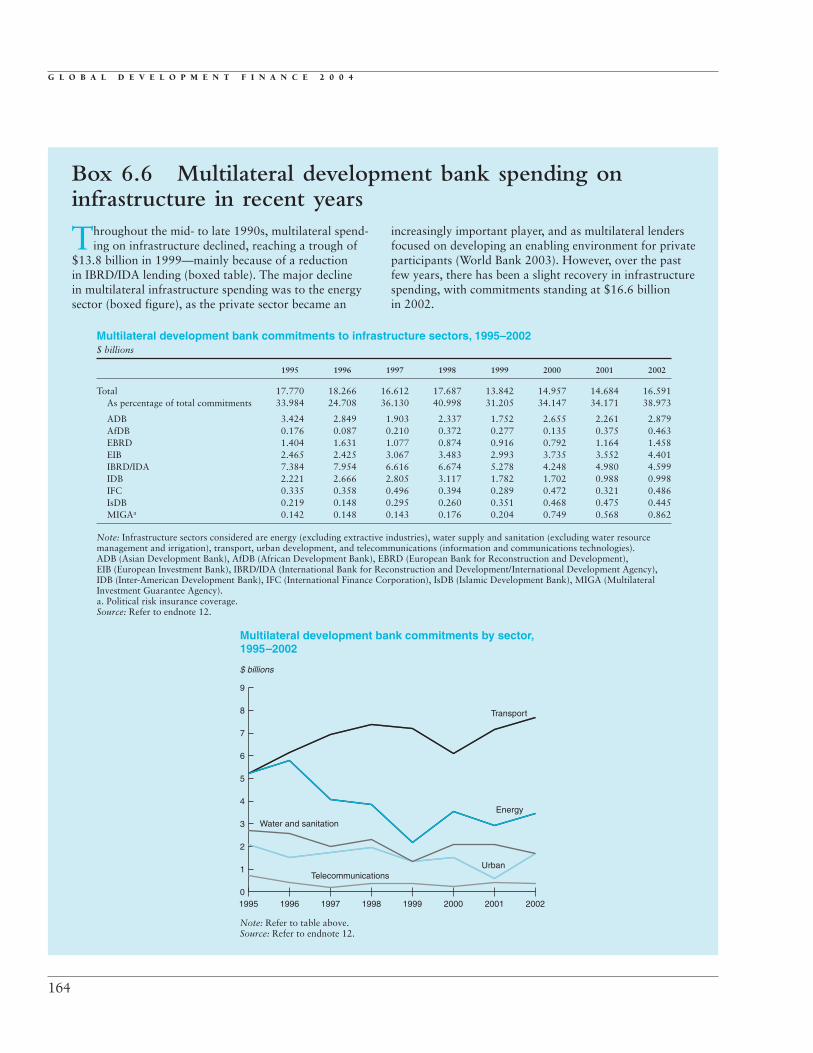
G L O B A L D E V E L O P M E N T F I N A N C E 2 0 0 4
164
Throughout the mid- to late 1990s, multilateral spend-ing on infrastructure declined, reaching a trough of
$13.8 billion in 1999—mainly because of a reduction in IBRD/IDA lending (boxed table). The major decline in multilateral infrastructure spending was to the energy sector (boxed figure), as the private sector became an
increasingly important player, and as multilateral lendersfocused on developing an enabling environment for privateparticipants (World Bank 2003). However, over the pastfew years, there has been a slight recovery in infrastructurespending, with commitments standing at $16.6 billion in 2002.
Box 6.6 Multilateral development bank spending oninfrastructure in recent years
Multilateral development bank commitments by sector,1995–2002
$ billions
Note: Refer to table above.Source: Refer to endnote 12.
0
2
1
3
4
6
5
8
7
9
1995 1997 1998 1999 2000 2001 20021996
Transport
Urban
Energy
Telecommunications
Water and sanitation
Multilateral development bank commitments to infrastructure sectors, 1995–2002$ billions
1995 1996 1997 1998 1999 2000 2001 2002
Total 17.770 18.266 16.612 17.687 13.842 14.957 14.684 16.591As percentage of total commitments 33.984 24.708 36.130 40.998 31.205 34.147 34.171 38.973
ADB 3.424 2.849 1.903 2.337 1.752 2.655 2.261 2.879AfDB 0.176 0.087 0.210 0.372 0.277 0.135 0.375 0.463EBRD 1.404 1.631 1.077 0.874 0.916 0.792 1.164 1.458EIB 2.465 2.425 3.067 3.483 2.993 3.735 3.552 4.401IBRD/IDA 7.384 7.954 6.616 6.674 5.278 4.248 4.980 4.599IDB 2.221 2.666 2.805 3.117 1.782 1.702 0.988 0.998IFC 0.335 0.358 0.496 0.394 0.289 0.472 0.321 0.486IsDB 0.219 0.148 0.295 0.260 0.351 0.468 0.475 0.445MIGAa 0.142 0.148 0.143 0.176 0.204 0.749 0.568 0.862
Note: Infrastructure sectors considered are energy (excluding extractive industries), water supply and sanitation (excluding water resourcemanagement and irrigation), transport, urban development, and telecommunications (information and communications technologies). ADB (Asian Development Bank), AfDB (African Development Bank), EBRD (European Bank for Reconstruction and Development), EIB (European Investment Bank), IBRD/IDA (International Bank for Reconstruction and Development/International Development Agency),IDB (Inter-American Development Bank), IFC (International Finance Corporation), IsDB (Islamic Development Bank), MIGA (Multilateral Investment Guarantee Agency).a. Political risk insurance coverage.Source: Refer to endnote 12.
gdf_148-167.qxd 4/6/04 1:01 PM Page 164

T H E C H A L L E N G E O F F I N A N C I N G I N F R A S T R U C T U R E I N D E V E L O P I N G C O U N T R I E S
countries cannot be met without reaching commer-cially defensible standards of creditworthiness.
Over the longer term, enhancing the access ofdeveloping-country infrastructure to the interna-tional capital markets will also require developingan international mechanism to deal with cross-border investment regulation, competition rules,and consistency between national regulatoryregimes. As technology increasingly interacts witheconomic pressures to globalize infrastructure in-dustries and open them to international competi-tion, consistency and compatibility of nationalcompetition laws and policies will become moreimportant for achieving gains. Where elements ofcompetition and natural monopoly co-exist andare complementary, the regulation of third-partyaccess to essential facilities is vital. In recent years,the issue has generated a considerable amount ofacademic interest and research.13 It has found itsmost immediate practical expression, as well as themost substantial challenges, in the EuropeanUnion. In the context of implementing the singlemarket, common rules have been prescribedfor the progressive liberalization of networkedindustries in telecommunications and other sec-tors (Newbery 2001). At the global level, in thetelecommunications industry, the World TradeOrganization’s Agreement on Trade in Telecom-munications, reached in 1998, committed 78nations, representing 90 percent of the global mar-ket, to liberalization and open-market policies,providing a necessary international framework. Inother sectors, arrangements are less formal,14 butsteady movement toward common regulatoryschemes can be detected and is likely to gain speedas globalization proceeds.
Notes1. Some 1.1 billion people lack access to safe drinking
water, 2.4 billion are affected by inadequate sanitation, and1.4 billion have no power.
2. In the 1990s, an estimated 70 percent of infrastruc-ture investment in developing countries came from govern-ments or public utilities, 22 percent from the private sector,and 8 percent from official development assistance (WorldBank staff estimates). Country data on infrastructure invest-ment are scarce and fragmented, but available informationreveals considerable variation across countries as well as re-gions. Infrastructure investment in Mexico in the late 1990swas 1 percent of GDP, for example; in Columbia, 7 percent(Serven and Easterly 2003). In India, it was 4.5 percent in2000–01 (Reserve Bank of India 2003).
3. In the U.S. electricity sector, this organizational struc-ture came to be known as the “utility consensus” (Hirsch1999), which prevailed from the 1920s to the 1970s.
4. Data were obtained by analyzing the U.S. ElectricityInformation Administration’s Country Analysis Briefs for2003 of 54 developing countries in East Asia, Europe andCentral Asia, Middle East and North Africa, South Asia,and Latin America and the Caribbean.
5. Between 1984–90 developing countries awardedonly eight water and sewerage projects to private companiesfor a total capital investment of $297 million.
6. The project company, as a separate legal entity, isincorporated under host country company law. The projectcompany has ownership rights over project assets and futurecash flows and, typically, is structured as a “bankruptcyremote” special-purpose vehicle. This allows it to enter intoa contract with other stakeholders, as well as to raise debtcapital in the international and local financial markets.
7. The average regional credit quality is based onMoody’s long-term foreign currency credit rating of the coun-tries in the region. The credit qualities of each month are calcu-lated as weighted averages of the credit ratings, with the weightof each country equal to its outstanding foreign-currency debt(composed of long-term, short-term, and IMF credit) relativeto the total outstanding foreign-currency debt of the region.
8. The volatility of the telecom and electricity sector isdefined as the standard deviation of the stock price returnsmeasured over the preceding quarter. For the telecom sector,the returns of the Morgan Stanley Capital International Inc.(MSCI) sector index are used. For the power sector, because asimilar index with a long enough history does not exist, thevolatility measure is based on returns to the average stockprice of the main global companies in this sector. As private in-vestment in the power sector is concentrated in U.S.-basedcompanies, a separate index has been created for these compa-nies. The following companies are included: the U.S.-basedcompanies American Electric Power, Texas Utility Company,Dynegy, El Paso Energy, AES, Reliant, Williams, Calpine,Enron, Duke Energy, Entergy, Mirant, Allegheny Energy,CMS Energy; and the non-U.S.–based companies British En-ergy, Scottish & Southern, Scottish Power, EDF, E.ON, RWE,Endesa, Iberdrola, Union FENOSA, Enel, Edison, Electrabel,Electricidade de Portugal, Empresa Nacional de Chile.
9. See Daniels (2003) for a more in-depth discussion ofthe role of legal instruments in enhancing the stability of pri-vate participation in public infrastructure projects.
10. See Dailami and Hauswald (2003) for a moredetailed analysis of project bond covenant provisions.
11. Directly, the provision of services such as cleandrinking water, sanitation, electricity, and roads are eithergoals on their own (Goal 7, Ensuring Environmental Sus-tainability, calls for halving the proportion of people withoutaccess to safe drinking water) or have obvious effects ongoals such as combating infectious diseases, reducing childmortality, and achieving universal primary education. Forexample, the distribution of vaccines requires an effectivetransportation infrastructure, with vaccines such as thatagainst hepatitis A being very sensitive to temperature(World Health Organization 2003). Water-related diseasesrank as one of the top killers of children, and roads in ruralareas can increase the practicality of children attending
165
gdf_148-167.qxd 4/6/04 1:01 PM Page 165

G L O B A L D E V E L O P M E N T F I N A N C E 2 0 0 4
school. Indirectly, infrastructure affects the MillenniumDevelopment Goals by enhancing economic growth.
12. The data were collected from various sources.—ADB: data from ADB annual reports, based on cal-
endar year recording. Exclude private sector loans catego-rized in the ADB annual reports as “social infrastructure.”
—AfDB: data from AfDB annual reports, based on cal-endar year recording. Conversion rates (1 unit of account[UA]: US$): 1995—1.48649, 1996—1.43796, 1997—1.34925, 1998—1.40803, 1999—1.37095, 2000—1.30291, 2001—1.25673, 2002—1.35952. Data do not in-clude the African Development Fund (ADF) nor the NigeriaTrust Fund (NTF), the concessional and private windows ofthe AfDB Group. “Energy” includes oil and gas.
—EBRD: Data from EBRD annual reports, based oncalendar year recording. Conversion rates (1 Euro/ECU:US$): 1995—1.307, 1996—1.277, 1997—1.164, 1998—1.1115, 1999—1.0845, 2000—0.94785, 2001—0.8937,2002—0.9343. Figures under “urban” here correspond toEBRD category of “municipal and environmental infra-structure,” which includes water supply and sanitation aswell. “Energy” here corresponds to EBRD’s categories of“energy efficiency” and “power and energy.” Similarly,“telecommunications” here corresponds to “telecommuni-cations, informatics, and media.” Figures include acquisi-tions of and investments in private companies.
—EIB: Data from EIB annual reports, based on calen-dar year recording. The same conversion rate is used as forEBRD. Figures refer to commitments to “(pre)accession andpartner countries” only. Figures recorded here under “trans-port” reflect the broader EIB category of “communications.”
—IBRD/IDA: Data from IBRD/IDA central databasesystem, based on fiscal year recording. Do not includeIFC/MIGA commitments. “Energy” excludes extractive in-dustries (oil, gas, and mining). “Water supply and sanita-tion” excludes water resource management and irrigation.
—IDB: Data from IDB annual reports, based on fiscalyear recording. “Transport” reflects here the IDB categoryof “transport and communications,” which covers bothtransport and telecommunications. Data include loans,technical cooperation operations ($1 million and above),and Multilateral Investment Fund operations (when applic-able to infrastructure sectors).
—IFC: Data from institutional internal database.—IsDB: Data from IsDB central database system, ad-
justed from the lunar calendar. Figures include operationsby IsDB and Unit Investment Fund, an IsDB subsidiary. Fig-ures do not include the Emerging Markets Partnership(EMP)–managed IsDB Infrastructure Fund nor the IslamicBank’s Portfolio (IBP), another IsDB subsidiary, which pro-vides both short- and long-term finance. Similarly, figuresdo not include operations approved by the Islamic Corpora-tion for the Development of the Private Sector (ICD), theprivate sector arm of the IsDB Group.
13. For a comprehensive review of key issues see Yoo(2002) and Posner (1979); for telecommunications, see Valetti(2003) and Grout (2001); and for water see Hern (2001)and Aitman (2001).
14. In transport, the International Air Transport Asso-ciation has served as the authority to set fares and terms ofservice in the international aviation industry (Richards
2001). In water and electricity, outside the European Union,international agreements have been limited to what can bedescribed as “soft legal arrangements,” in the terminology ofinternational-relations scholars (Koremenons, Lipson, andSnidal 2001).
References
Aghion, Philippe, and Mark Schankerman. 1999. “Compe-tition, Entry, and the Social Returns to Infrastructurein Transition Economies.” Economics of Transition(March): 545–76.
Aitman, D. 2001. “Competition Law Constraints on AccessCharges in the England and Wales Water Industry.”Utilities Policy (Denver, Colo.) 10(3–4): 129.
Asian Development Bank. 2002. “PRC: Strengthening Pub-lic Infrastructure Investment Policy in China.” Manila.
Bain, R., and M. Wilkinson. 2002. “Road Risk.” ProjectFinance (September supplement): 2–5.
Camdessus, Michel. 2003. Financing Water for All. Reportof the World Panel on Financing Water Infrastructure,James Winpenny, ed. World Water Council, Marseilles,France.
Dailami, Mansoor, and Robert Hausewald. 2003. “TheEmerging Project Bond Market: Covenant Provisionsand Credit Spreads.” Policy Research Working Paper3095. World Bank, Washington, D.C.
Daniels, R. 2003. “Contracting for Infrastructure: CreatingDurable Projects and Durable Institutions.” Unpub-lished paper available at http://www.worldbank.org/prospects/gdf2004.
Energy Information Administration. 2001. U.S. Departmentof Energy. www.eia.doe.gov/pub/international/iealf/table64.xls.
Esty, B. C., and W. L. Megginson. 2000. Syndicate Structureas a Response to Political Risk in the Project FinanceLoan Market. Harvard Business School, Cambridge,Mass. Processed.
Goldin, Ian, Mansoor Dailami, and Christine Wallich.2003. “Role of the World Bank Group in Infrastruc-ture.” Unpublished paper available at http://www.worldbank.org/prospects/gdf2004.
Grout, Paul A. 2001. “Competition Law in Telecommuni-cations and Its Implications for Common Carriageof Water.” Utilities Policy (Denver, Colo.) 10(3–4):137.
Hern, R. 2001. “Competition and Access Pricing in the U.K.Water Industry.” Utilities Policy (Denver, Colo.)10(3–4): 117.
Hirsch, Richard F. 1999. “Power Loss: The Origins of Dereg-ulation and Restructuring in the American Electric Util-ity System.” MIT Press, Cambridge, Mass.
International Energy Agency. 2003. World Energy Invest-ment Outlook. Paris.
International Road Federation. 2002. World Road Statistics.Geneva and Washington, D.C.
Koremenos, Barbara, Charles Lipson, and Duncan Snidal.2001. “The Rational Design of International Institu-tions.” International Organization 55(4): 761.
166
gdf_148-167.qxd 4/6/04 1:01 PM Page 166

T H E C H A L L E N G E O F F I N A N C I N G I N F R A S T R U C T U R E I N D E V E L O P I N G C O U N T R I E S
Mattli, Walter. 2001. “Private Justice in a Global Economy:From Litigation to Arbitration.” International Organi-zation 55(4): 919.
Nadiri, Ishaq, and Theofanis Mamuneas. 1996. “The Ef-fects of Public Infrastructure and R&D Capital on theCost Structure and Performance of U.S. Manufactur-ing Industries.” NBER Working Paper 3887.
Newbery, David M. 2001. “Economic Reform in Europe:Integrating and Liberalizing the Market for Services.”Utilities Policy (Denver, Colo.) 10(2): 85.
Posner, R. A., 1979. “The Chicago School of AntitrustAnalysis.” University of Pennsylvania Law Review127: 925–52.
Reserve Bank of India. 2003. RBI Annual Report 2002–03.Mumbai, India.
Richards, John E. 2001. “Institutions for Flying: HowStates Built a Market in International Aviation Ser-vices.” International Organization 55(4): 993.
Sader, F. 2000. “Attracting Foreign Direct Investment intoInfrastructure: Why Is It So Difficult?” Foreign In-vestment Advisory Services Occasional Paper 12,World Bank and International Finance Corporation,Washington, D.C.
Serven, Luis, and William R. Easterly, eds. 2003. The Limits ofStabilization: Infrastructure, Public Deficits, and Growthin Latin America. Washington, D.C.: World Bank.
Telecommunications Industry Association. 2003. TIA’s2004 Telecommunications Market Review and Fore-cast. Arlington, Virginia.
Thompson Financial. 2004. “English and New York LawCompared.” Project Finance International, no. 280.
U.S. Energy Information Administration. 2003. OfficialEnergy Statistics. http://www.eia.doe.gov/pub/international/iealf/table64.xls.
Valetti, Tommaso M. 2003. “The Theory of Access Pricingand Its Linkage with Investment Incentives.” Telecom-munications Policy 27 (10–11): 659–68.
World Bank. 1994. World Development Report. Washington,D.C.
———. 2003. “Private Sector Development in the ElectricPower Sector: A Joint OED/OEG/OEU Review of theWorld Bank Group’s Assistance in the 1990s.” Opera-tions Evaluation Department, World Bank, Washington,D.C.
World Health Organization. 2003. “Fact Sheet: Hepatitis A.”http://www.who.int/vaccines/en/hepatitisa.
Yoo, Christopher S. 2002. “Vertical Integration and MediaRegulation in the New Economy.” Yale Journal ofRegulation 19: 170–300.
167
gdf_148-167.qxd 4/6/04 1:01 PM Page 167

gdf_168-173.qxd 4/6/04 12:59 PM Page 168

Appendix A: Enhancing the Developmental Effect of Workers’Remittances to Developing Countries
Trends in developing countries’remittance receipts
Worker’s remittances continued to rise in 2003to an estimated $93 billion, up from $88.1 bil-
lion in 2002, when remittances equaled 5 percentof developing-country imports and 8 percent of do-mestic investment (table A.1).1 Remittances remainthe second-largest financial flow to developingcountries after foreign direct investment, more thandouble the size of net official finance (figure A.1). In2002, remittances were larger than both officialand private flows in 36 developing countries. LatinAmerica and the Caribbean continued as the regionreceiving the most remittances—it received $30 bil-lion, nearly a third of remittance flows to all devel-oping countries (table A.2). South Asia and EastAsia and Pacific each received $18 billion. Sub-Saharan Africa received $4 billion.
Remittances increased more rapidly than fore-cast in last year’s Global Development Finance
169
.
(World Bank 2003, chapter 7). Weak labor mar-kets and the tightening of border controls in theindustrial countries after the terrorist attacks ofSeptember 11, 2001, were expected to slow thegrowth of remittances in 2002 and 2003. Instead,remittances increased by more than 20 percent, es-pecially in the countries that faced heightenedsecurity. More remittance flows were diverted fromalternative channels to formal channels as a resultof efforts to curb money laundering (box A.1).Also, the increased focus on remittances resultedin better reporting of data in many developingcountries. And the fear of being deported or inves-tigated may have prompted some migrant workersto remit their entire savings to their home country(box A.2).
The main sources of remittances were theUnited States and Saudi Arabia, with 2002 pay-ments of $31.4 and $15.9 billion, respectively. Re-mittance payments increased sharply from both
Table A.1 Remittances received and paid by developing countries in 2002$ billions
Lower-middle- Upper-middle-All developing Low-income income income High-income
Total remittance receipts 88.1 25.7 44.5 17.9 44.4as % of GDP 1.5 2.9 1.3 1.0 0.2as % of imports 5.1 12.1 4.9 3.2 1.2as % of domestic investment 8.0 14.6 5.9 14.0 35.7as % of FDI inflows 66.2 388.9 49.2 51.3 8.4as % of net official finance 250.0 — — — —
Other current transfersa 38.0 9.0 22.0 7.0 83.0Remittance receipts and other current transfers 126.1 40.2 66.6 24.6 127.4Total remittance payments 28.0 1.5 3.1 23.4 77.2
excluding Saudi Arabia 12.1 1.5 3.1 7.5 77.2
Note: — � not available.a. Other current transfers include gifts, donations to charities, pensions received by currently retired expatriate workers, and so on. They mayalso include personal transfers by migrant workers to families back home. See World Bank 2003, chapter 7, data annex.Sources: IMF 2002 and World Bank 2002 and 2003.
gdf_168-173.qxd 4/6/04 12:59 PM Page 169

G L O B A L D E V E L O P M E N T F I N A N C E 2 0 0 4
170
Because a large share of remittances goes unrecorded,the data reported in the main text, which are based
on official statistics, underestimate the actual size of remittance flows. One can only speculate about the size of unrecorded remittances. Officials in major fund-transferagencies argue, based on the volume of funds flowingthrough their system, that unrecorded remittances may be larger than recorded remittances. A portion of the rise
in remittances over the past two years may reflect a switch to more formal channels due to the tightening of controls on informal transfer agents following the September 11, 2001, attacks on the United States. For example, remittances to Pakistan nearly tripled from thefiscal year ending June 2001 to the fiscal year ending June 2003. Similar increases have occurred in other developing countries.
Box A.1 Informal transfers
Table A.2 Regional distribution of remittances,2001–03$ billions
Increase during Region 2001 2002 2003 2001–03 (%)
East Asia & Pacific 13.7 17.0 17.6 28.9Europe &
Central Asia 10.2 10.3 10.4 1.9Latin America &
the Caribbean 22.9 26.8 29.6 29.3Mid. East &
N. Africa 13.2 13.0 13.0 �1.2South Asia 13.1 16.9 18.2 38.7Sub-Saharan Africa 3.9 4.1 4.1 3.5
Total 77.1 88.1 93.0 20.7
Source: IMF, Balance of Payments Yearbook, various years, andWorld Bank staff estimates.
Sources: IMF, Balance of Payments Yearbook, various years, andWorld Bank staff estimates.
Figure A.1 Resource flows to developingcountries, 1988–2003
$ billions
�20
0
20
40
60
80
100
120
140
160
180
1988 1991 1994 1997 2000 2003
FDI
Remittances
Officialflows
Capital marketflows
children’s education, medical expenses, and hous-ing. Remittances, therefore, tend to be stable overtime and may even rise in times of economic dif-ficulty in the recipient country (Ratha 2003).Remittances are also person-to-person flows, welltargeted to meet the needs of the recipient.
At the macro level, remittances are believed tohave a favorable effect on growth to the extent thatthey are used to finance education (Cox Edwardsand Ureta 2003) and health expenses. Even whenthey are used for consumption, remittances gener-ate multiplier effects, especially in poor countrieswith high unemployment. However, the debateover the macroeconomic effects of remittances isjust beginning and will be an important area of fu-ture research. Some authors argue that remittancesmay reduce recipients’ motivation to work andthus slow down growth (Chami and others 2003).Others argue that remittances may raise incomeinequality in the receiving society. Also, as with allforeign-currency inflows, too great a volume of
countries from the mid-1970s to the mid-1990s(figure A.2). Since 1995, however, remittancesfrom Saudi Arabia have stagnated, as economicactivity has slowed, and also because the countrymade a decision to slow the growth of the foreignpopulation. By contrast, remittances from theUnited States since 1995 have nearly doubled, driv-en by the economic boom and the liberalization oftemporary migration (especially in the technologysector, through the H-1B visa).
The impact of remittances
At the individual level, remittances augment theincome and reduce the poverty of the recipi-
ent (Adams and Page 2003). They are largely altru-istic, the goal of the sender being to help therecipient meet financial needs for food and clothing,
gdf_168-173.qxd 4/6/04 12:59 PM Page 170

A P P E N D I X A : E N H A N C I N G T H E D E V E L O P M E N T A L E F F E C T
remittances can result in currency appreciation,which may affect the competitiveness of exports.
Reducing remittance costs
While remittance fees have declined somewhatsince 2001, fees charged by money-transfer
agents remain high compared to the actual cost oftechnology, labor, and currency-exchange commis-sion. It is not uncommon, for example, for remit-tance costs to be as high as 20 percent for smalltransfers (figure A.3). Developments that may leadto lower remittance costs include:
• Greater competition among money-transferagents
• Better access to banking services for migrantworkers in remittance-source countries andhouseholds in recipient countries
• Harmonization of the financial infrastructuresupporting remittances
• Better investment climate in the remittance re-ceiving country, for example, though removalof foreign-exchange restrictions.
Competition among money-transfer agentsThe high costs of remittance reflect the large in-vestments required to enter the formal money-transfer market, including a widespread branchnetwork in both source and recipient countries.High fixed costs impede new entrants to the mar-ket, allowing money-transfer agents to chargeabove the marginal cost of transactions.
Nevertheless, there is some evidence thatcompetitive forces are having an impact on reduc-ing remittance fees. Some nonprofit credit unionsaffiliated with the World Council of Credit Unions
171
Saudi Arabia
United States
Figure A.2 Sources of remittance payments,1971–2002
$ billions
0
5
10
15
20
25
30
1971
1981
1976
1986
1991
1996
2001
Source: IMF, Balance of Payments Yearbook, various years.
20
25
$100 $200 $300 $400 $500 $600 $700 $800 $900 $1,000
15
0
5
10
Figure A.3 Remittance costs from the UnitedStates to Mexico and other countries
% of principal amount
Source: www.westernunion.com. Fees exclude exchangecommission.
Mexico Others
Temporary migrant workers tend to remit a larger proportion of their income than immigrants who plan
to settle down in their new country of residence. Ties with families left behind in the home country tend to bestronger for recent migrants and for migrants who areplanning to return soon. Also, families or relatives leftbehind need more financial help in the beginning. Thepropensity to remit (remittances as a share of income) is
believed to decline with time, perhaps as the migrantworker is joined by family. Anecdotal evidence also sug-gests that the remittance behavior of migrant workersvaries with skill and gender. While a skilled worker mayearn more and send a larger nominal amount than anunskilled worker, the latter may send a larger share of income. Also, women are believed to remit a larger proportion of income—and more regularly—than men.
Box A.2 Remittance behavior
gdf_168-173.qxd 4/6/04 12:59 PM Page 171

G L O B A L D E V E L O P M E N T F I N A N C E 2 0 0 4
and International Remittance Network are ableto provide the same service—for example, sending$1,000 to Mexico from the United States—at a sub-stantially lower fixed fee of $10–$15, as opposedto the $50–$76 charged by major commercialmoney-transfer agents. South Africa’s Teba Bankand Canada’s Meli Melo Transfert are able to sendcross-border transfers at a fixed fee of $3 foramounts up to $400. In Hong Kong, cutthroatcompetition among money-transfer agents hasbrought the cost of sending remittances to thePhilippines down to a fixed $2.50 per transaction.
This salutary competitive process would bestrengthened if smaller firms could enter intoagreements with international banks to use theirbranch networks to remit funds. Although manymajor international banks lack sufficient branchesin the countries receiving remittances, there may besome potential in easing rules in industrial coun-tries that restrict the ability of local money-transferinstitutions to cooperate with foreign banks for thepurpose of sending remittances.
Scaling up banking accessIncreasing access to banking services in developingcountries (and for the poor in industrial countries)would help reduce remittance costs by (a) givingsenders more choices in terms of the transfer agentthey use and (b) permitting some degree ofbundling of remittances so that the average remit-tance cost could be reduced by spreading fixedcosts over a larger amount. Bundling may requirenew credit facilities in sending and receiving coun-tries to ease liquidity constraints faced by individ-ual remitters. Facilitating the use of the bankingsystem for remittances may also encourage morewidespread use of other banking services. It is ob-served, for example, that 14–28 percent of non-members who came to credit unions affiliated withthe World Council of Credit Unions to transferfunds ended up opening an account (Grace 2003).
Harmonizing electronic transfer systemsHarmonizing electronic funds transfer systemscould reduce the cost of remittances. Currently,major transfer agents and banks use their own(costly) proprietary systems to send remittances.2
If funds were channeled through Fedwire,3 an elec-tronic transfer system developed and maintainedby the U.S. Federal Reserve System, the cost pertransaction would drop to around 45 cents per
transaction. The SWIFT messaging system usedby commercial banks costs less than 15 centsper transaction. If an automated clearinghousemechanism—similar to the FedACH mechanismagreed to by the United States and Mexico—werearranged between financial institutions, costs oftransfers could drop to a few cents per transac-tion.4 Use of debit and credit cards and automatedteller machines would reduce labor costs.
Removing exchange-rate restrictions Moving toward a more liberal exchange-rateregime is a powerful way to encourage remitters touse formal channels. The exchange premium re-sulting from exchange controls can be a majordrain on remittances to developing countries. Forexample, in the case of the República Bolivarianade Venezuela, which currently has dual exchangerates, nationals who remit funds through officialchannels may lose more than half of the value,compared with one estimate of the market rate.5 Arecent IMF-World Bank study (El Qorchi and oth-ers 2003) found that informal transfers had fallensubstantially since the 1980s with the dismantlingof exchange controls and the disappearance of thepremium on black-market currency exchanges.
Notes1. Following the discussion in Global Development
Finance 2003 (chapter 7), remittances are calculated bycombining workers’ remittances, compensation of employ-ees, and migrants’ transfers. Although some authors arguethat remittances should also include local withdrawal ofnonresident deposits (Kapur and McHale 2003; Jadhav2003), we do not include this item in our definition. Also,our definition may not fully capture remittances in kind,for example, when the recipient receives goods instead ofcash. See Ndarishikanye (2003) for a description of suchremittances from Canada to the Caribbean.
2. Major transfer systems are Western Union, Money-Gram, eBay’s PayPal, VIGO, and those used by major banksinvolved in the remittance business, such as Citibank, WellsFargo, and Bank of America.
3. There are two difficulties with using the Fedwire forfund transfers. First, it can be accessed only by banks, so mi-grants without a bank account cannot use it. Second, it is areal-time gross settlement system in which payments are finaland irrevocable. That finality raises some thorny issues in thecontext of cross-border transactions. How can a payment berecalled if by mistake it is delivered to the wrong addressee?
4. The automatic clearing house (ACH) between theUnited States and Mexico began one-way fund transfers toMexico in November 2003. Two-way transfers are ex-pected to go into operation in the latter half of 2004. The
172
gdf_168-173.qxd 4/6/04 12:59 PM Page 172

A P P E N D I X A : E N H A N C I N G T H E D E V E L O P M E N T A L E F F E C T
Philippines has signed a memorandum of understandingwith the United States for a similar arrangement.
5. Morgan Stanley used the rate of 2,483 bolivares perU.S. dollar on November 17, 2003, to calculate the MSCIStandard Venezuela Index. The rate was derived indirectlyusing the price of CANTV stock in the local market, and theprice of its American depository right listed in New York.The official exchange rate on that day was 1,596 bolivaresto the dollar.
References
Adams, Richard, and John Page. 2003. “The Impact of In-ternational Migration and Remittances on Poverty.”Paper presented at the International Conference onMigrant Remittances, London, October 9–10.
Chami, R., C. Fullenkamp, and S. Jahjah. 2003. “AreMigrant Remittance Flows a Source of Capital forDevelopment?” IMF Working Paper, InternationalMonetary Fund, Washington, D.C. August.
Cox Edwards, Alejandra, and Manuelita Ureta. 2003. “In-ternational migration, remittances, and schooling: Evi-dence from El Salvador.” Journal of DevelopmentEconomics 72(2): 429–61.
El Qorchi, Mohammed, Samuel Munzele Maimbo, andJohn F. Wilson. 2003. “Informal Funds Transfer Sys-tems: An Analysis of the Informal Hawala System.”A Joint IMF-World Bank Paper. Occasional Paper
222. International Monetary Fund, Washington,D.C.
Grace, David. 2003. “Integrating Financial Sector Servicesto Support Migrants’ Remittances.” Presentation at theInternational Conference on Migrant Remittances,London, October 9–10.
IMF (International Monetary Fund). 2002. Balance ofPayments Yearbook 2002. Washington, D.C.
Jadhav, Narendra. 2003. “Maximising Developmental Ben-efits of Migrant Remittances: The Indian Experience.”Paper presented at the International Conference onMigrant Remittances, London, October 9–10.
Kapur, Devesh, and John McHale. 2003. “Migration’s NewPayoff.” Foreign Policy (November/December).
Ndarishikanye, Barnabe. 2003. “Migrants’ Remittances:Background Information and Remittances fromCanada to Central America and the Caribbean Coun-tries.” Paper presented at the Conference on Migrants’Remittances from Canada: Developmental Impact andPotential, Ottawa.
Ratha, Dilip. 2003. “Workers’ Remittances as a Source ofDevelopment Finance.” Presentation at the SecondCoordination Meeting on International Migration,United Nations, New York.
World Bank. 2002. World Development Indicators 2002.Washington, D.C.
———. 2003. “Workers’ Remittances—An Important andStable Source of External Development Finance.”In Global Development Finance 2003 (chapter 7).Washington, D.C.: World Bank.
173
gdf_168-173.qxd 4/6/04 12:59 PM Page 173

gdf_174-233.qxd 4/6/04 12:58 PM Page 174

Appendix B: Summary Statistical Tables
THE SUMMARY STATISTICAL TABLESare divided into six sections (see index oftables overleaf for full details):
• Summary tables. These tables provide a snap-shot of recent history and the outlook for theglobal economy and each of the six developingcountry regions (for the full World Bank clas-sification of countries by region and incomelevel, see table B.52).
• Key macro variables. These provide detail ongrowth and inflation indicators by region and(historically) for selected economies. Althoughdetailed country forecasts form the basis forthe regional growth and inflation projections,detailed developing country forecasts are notshown separately.
• Current account tables. These tables combinedata from the IMF’s balance of payments sta-tistics, with aid-related data from the OECD’sDevelopment Assistance Committee publica-tions, and our own preferred measure ofworkers’ remittances (see appendix A).
• Capital account tables. New external financ-ing tables have been developed. They combinethe IMF’s current account, foreign-exchangereserve, and net inward foreign direct invest-ment data with the World Bank’s portfolioequity and debtor reporting system (DRS)data to produce an overall tabulation of howregions finance themselves externally.
• External liabilities and assets. These provide asummary of the DRS debt data that is providedon a country-by-country basis in volume 2.
175
.
• Key debt ratios and country classifications.These tables provide a summary of indicatorstypically used by country risk analysts tomonitor and classify countries. The WorldBank’s own debt classifications are definedand tabulated. The precise method used tocategorize countries as severely, moderately orless indebted is shown by a box in tableB.51. The two key ingredients used are thepresent value of future debt-service streams to(i) gross national income and (ii) to exports ofgoods and services. These variables are aver-aged over 2000–2002.
The use of critical values to define theboundaries between indebtedness categories im-plies that changes in country classificationsshould be interpreted with caution. If a countryhas an indicator that is close to the critical value,a small change in the indicator may trigger achange in indebtedness classification even ifeconomic fundamentals have not changed signifi-cantly. Moreover, these indicators do not repre-sent an exhaustive set of useful indicators ofexternal debt. They may not, for example, ade-quately capture the debt servicing capacity ofcountries in which government budget constraintsare key to debt service difficulties. Moreover,rising external debt may not necessarily implypayment difficulties, especially if there is a com-mensurate increase in the country’s debt servicingcapacity. Thus, these indicators should be used inthe broader context of a country-specific analysisof debt sustainability.
gdf_174-233.qxd 4/6/04 12:58 PM Page 175

A P P E N D I X B : S U M M A R Y S T A T I S T I C A L T A B L E S
Contents
Summary tablesB.1: Global outlook in summary, 2002–06 178B.2: East Asia and Pacific outlook in summary, 1981–2004 179B.3: Europe and Central Asia outlook in summary, 1981–2004 180B.4: Latin America and the Caribbean outlook in summary, 1981–2004 181B.5: Middle East and North Africa outlook in summary, 1981–2004 182B.6: South Asia outlook in summary, 1981–2004 183B.7: Sub-Saharan Africa outlook in summary, 1981–2004 184
Key macro variablesB.8: Global real GDP growth, 1981–2004 185B.9: Global inflation, 1991–2003 186B.10: Commodity prices, 1980–2004 187B.11: Commodity price indexes, 1980–2004 188B.12: Global nominal GDP growth, 1981–2004 189
Current accountB.13: Global goods export growth, 1981–2004 190B.14: Global goods import growth, 1981–2004 191B.15: Global goods trade balances, 1996–2004 192B.16: Global trade prices and volumes, 1981–2004 193B.17: Global current account balances, 1999–2004 194B.18: Global current account balances, 1981–2004 195B.19: Workers’ remittances received by developing countries, 1995–2003 196B.20: Net official development assistance from DAC countries, 1995–2002 197
Capital accountB.21: External financing: all developing countries, 1997–2003 198B.22: External financing: East Asia and Pacific, 1997–2003 199B.23: External financing: Europe and Central Asia, 1997–2003 200B.24: External financing: Latin America and the Caribbean, 1997–2003 201B.25: External financing: Middle East and North Africa, 1997–2003 202B.26: External financing: South Asia, 1997–2003 203B.27: External financing: Sub-Saharan Africa, 1997–2003 204B.28: Net inward foreign direct investment, 1995–2003 205B.29: Net inward portfolio equity flows, 1995–2003 206B.30: Net inward debt flows to developing countries, 1995–2003 207B.31: Net inward short-term debt flows to developing countries, 1995–2003 208B.32: Net inward debt flows to public sector and publicly guaranteed borrowers, 1995–2003 209B.33: Net inward debt flows to private sector borrowers, 1995–2003 210B.34: Net inward debt flows from public sector creditors, 1995–2003 211B.35: Net inward debt flows from private sector creditors, 1995–2003 212B.36: Gross market-based capital flows to developing countries, 1995–2003 213B.37: Gross international equity issuance by developing countries, 1995–2003 214B.38: Gross international bond issues in developing countries, 1995–2003 215B.39: Gross international bank lending to developing-country borrower, 1995–2003 216B.40: Total infrastructure financing to developing countries, 1995–2003 217B.41: Change in foreign-exchange reserves, 1995–2003 218
176
gdf_174-233.qxd 4/6/04 12:58 PM Page 176

A P P E N D I X B : S U M M A R Y S T A T I S T I C A L T A B L E S
External liabilities and assetsB.42: Total external debt of developing countries, 1995–2003 219B.43: Total external debt of developing countries: medium and long term, 1995–2003 220B.44: Total external debt of developing countries: short term, 1995–2003 221B.45: Total external debt of developing countries: owed by public sector and
publicly guaranteed borrowers, 1995–2003 222B.46: Total external debt of developing countries: owed by private sector
borrowers, 1995–2003 223B.47: Total external debt of developing countries: owed to public sector
creditors, 1995–2003 224B.48: Total external debt of developing countries: owed to private sector
creditors, 1995–2003 225B.49: Gross foreign exchange reserves of developing countries, 1995–2003 226
Key debt ratios and country classificationsB.50: Key external debt ratios for developing countries 227B.51: Classification of countries by levels of external indebtedness 230B.52: Classification of countries by region and level of income 231
177
gdf_174-233.qxd 4/6/04 12:58 PM Page 177
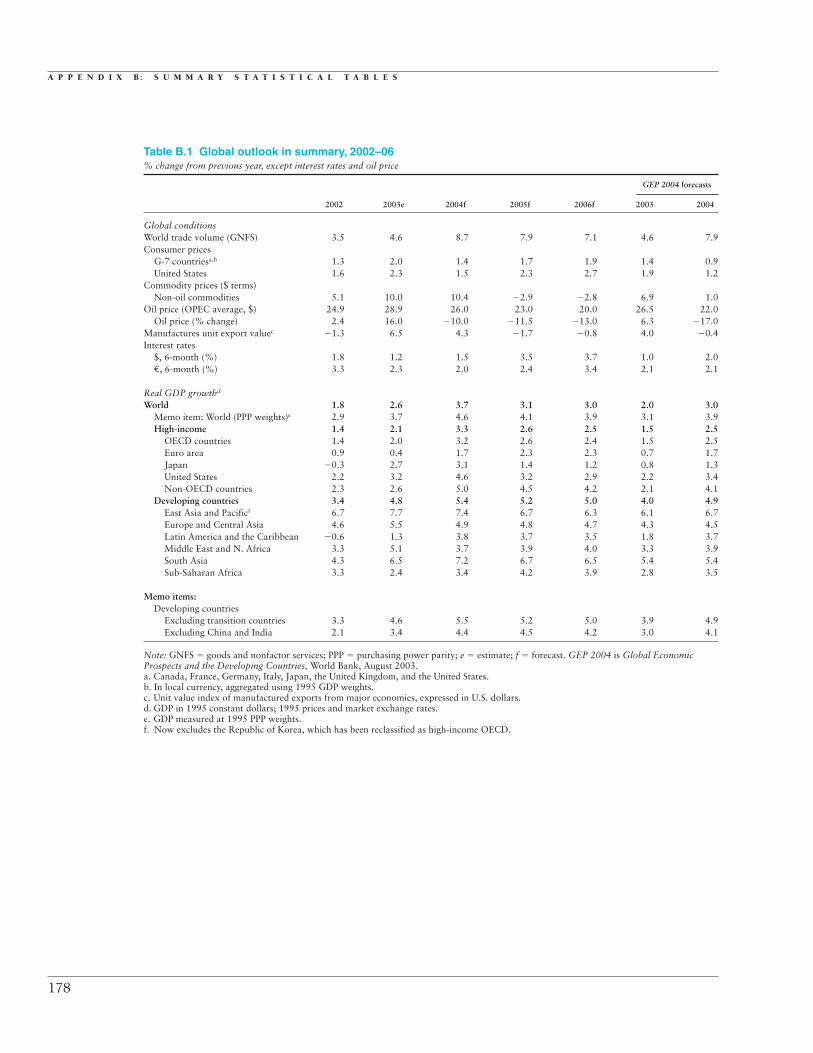
A P P E N D I X B : S U M M A R Y S T A T I S T I C A L T A B L E S
Table B.1 Global outlook in summary, 2002–06% change from previous year, except interest rates and oil price
GEP 2004 forecasts
2002 2003e 2004f 2005f 2006f 2003 2004
Global conditionsWorld trade volume (GNFS) 3.5 4.6 8.7 7.9 7.1 4.6 7.9Consumer prices
G-7 countriesa,b 1.3 2.0 1.4 1.7 1.9 1.4 0.9United States 1.6 2.3 1.5 2.3 2.7 1.9 1.2
Commodity prices ($ terms)Non-oil commodities 5.1 10.0 10.4 �2.9 �2.8 6.9 1.0
Oil price (OPEC average, $) 24.9 28.9 26.0 23.0 20.0 26.5 22.0Oil price (% change) 2.4 16.0 �10.0 �11.5 �13.0 6.3 �17.0
Manufactures unit export valuec �1.3 6.5 4.3 �1.7 �0.8 4.0 �0.4Interest rates
$, 6-month (%) 1.8 1.2 1.5 3.5 3.7 1.0 2.0€, 6-month (%) 3.3 2.3 2.0 2.4 3.4 2.1 2.1
Real GDP growthd
World 1.8 2.6 3.7 3.1 3.0 2.0 3.0Memo item: World (PPP weights)e 2.9 3.7 4.6 4.1 3.9 3.1 3.9High-income 1.4 2.1 3.3 2.6 2.5 1.5 2.5
OECD countries 1.4 2.0 3.2 2.6 2.4 1.5 2.5Euro area 0.9 0.4 1.7 2.3 2.3 0.7 1.7Japan �0.3 2.7 3.1 1.4 1.2 0.8 1.3United States 2.2 3.2 4.6 3.2 2.9 2.2 3.4Non-OECD countries 2.3 2.6 5.0 4.5 4.2 2.1 4.1
Developing countries 3.4 4.8 5.4 5.2 5.0 4.0 4.9East Asia and Pacificf 6.7 7.7 7.4 6.7 6.3 6.1 6.7Europe and Central Asia 4.6 5.5 4.9 4.8 4.7 4.3 4.5Latin America and the Caribbean �0.6 1.3 3.8 3.7 3.5 1.8 3.7Middle East and N. Africa 3.3 5.1 3.7 3.9 4.0 3.3 3.9South Asia 4.3 6.5 7.2 6.7 6.5 5.4 5.4Sub-Saharan Africa 3.3 2.4 3.4 4.2 3.9 2.8 3.5
Memo items:Developing countries
Excluding transition countries 3.3 4.6 5.5 5.2 5.0 3.9 4.9Excluding China and India 2.1 3.4 4.4 4.5 4.2 3.0 4.1
Note: GNFS � goods and nonfactor services; PPP � purchasing power parity; e � estimate; f � forecast. GEP 2004 is Global EconomicProspects and the Developing Countries, World Bank, August 2003.a. Canada, France, Germany, Italy, Japan, the United Kingdom, and the United States.b. In local currency, aggregated using 1995 GDP weights.c. Unit value index of manufactured exports from major economies, expressed in U.S. dollars.d. GDP in 1995 constant dollars; 1995 prices and market exchange rates.e. GDP measured at 1995 PPP weights.f. Now excludes the Republic of Korea, which has been reclassified as high-income OECD.
178
gdf_174-233.qxd 4/6/04 12:58 PM Page 178

S U M M A R Y T A B L E S
179
Table B.2 East Asia and Pacific outlook in summary, 1981–2004
Real economy(% change, unless stated) 1981–90 1991–2000 1998 1999 2000 2001 2002 2003e 2004f
Real GDP growth 7.3 7.7 0.6 5.6 7.2 5.6 6.7 7.7 7.4Private consumption per capita 5.6 5.4 �0.6 4.4 6.0 4.2 4.6 5.4 5.4GDP per capita 5.7 6.3 �0.5 4.6 6.2 4.7 5.8 6.8 6.6
Population 1.6 1.3 1.1 1.0 0.9 0.9 0.9 0.8 0.8Gross domestic investment/GDPa 23.2 28.7 31.7 30.4 31.4 32.7 34.7 38.2 39.5
Inflationb 5.5 5.6 9.2 0.0 4.9 2.1 3.6 2.8 3.8Central gvt. budget balance/GDP �1.3 �1.2 �1.5 �2.3 �3.3 �3.3 �3.4 �2.9 �3.1
Export market growthc 6.7 8.3 �1.6 7.7 14.7 �2.3 4.1 7.0 10.4Export volumed 8.2 11.5 3.2 4.1 22.6 2.4 15.6 21.1 18.3Terms of trade/GDPe 0.1 0.3 0.2 �0.3 �0.3 �0.5 0.1 0.1 �0.3Current account/GDP �1.4 0.4 4.5 4.2 3.5 2.4 3.4 2.6 1.7Workers’ remittances ($ billions) — 9.1 9.8 12.1 12.2 13.7 17.0 17.6 —
Memo item:GDP growth: East Asia (excluding China) 5.6 4.6 �9.5 3.1 5.8 2.4 4.4 5.0 5.9
External Financing and Debt($ billions, unless stated) 1995 1996 1997 1998 1999 2000 2001 2002 2003e
Net inward FDI 50.8 58.6 62.1 57.7 50.0 44.2 48.2 54.8 56.8Net inward portfolio equity flows 6.3 9.7 �3.9 �3.4 2.3 4.8 1.0 3.5 4.8Net inward debt flows 54.1 52.2 44.9 �32.5 �12.2 �17.7 �8.1 �10.9 0.5
From public sources 9.1 3.6 17.3 14.7 12.6 7.0 3.2 �7.8 �8.9From private sources 45.0 48.6 27.6 �47.1 �24.7 �24.7 �11.3 �3.1 9.4
Gross market-based capital inflows 60.0 71.5 76.2 27.3 28.2 48.3 20.1 40.9 48.5
Total external debt 455.6 490.4 526.3 533.2 538.6 497.3 501.3 497.4 514.7Medium and long term 346.8 365.3 394.3 447.2 464.8 434.1 410.5 397.9 402.7Short term 108.8 128.7 132.1 85.9 73.8 63.2 90.8 99.5 112.1Owed by public sector borrowers 256.7 256.8 272.0 288.6 307.5 284.7 277.7 277.8 287.4Owed by private sector borrowers 198.9 237.2 254.4 244.6 231.1 212.6 223.6 219.6 227.3Owed to public sector creditors 160.9 153.7 152.5 179.1 200.3 188.2 180.5 183.3 190.9Owed to private sector creditors 294.7 340.3 373.8 354.1 338.3 309.1 320.8 314.1 323.8
Gross foreign-exchange reserves 154.5 199.7 212.5 233.2 262.5 272.6 320.3 408.3 544.5
Note: — � not available; e � estimate; f � forecast.a. Fixed investment, measured in real terms.b. Local currency GDP deflator, median.c. Weighted average growth of import demand in export markets.d. Goods and non-factor services.e. Change in terms of trade, measured as a percentage of GDP.
gdf_174-233.qxd 4/6/04 12:58 PM Page 179

A P P E N D I X B : S U M M A R Y S T A T I S T I C A L T A B L E S
180
Table B.3 Europe and Central Asia outlook in summary, 1981–2004
Real economy(% change, unless stated) 1981–90 1991–2000 1998 1999 2000 2001 2002 2003e 2004f
Real GDP growth 1.6 �1.5 �0.2 2.9 6.8 2.4 4.6 5.5 4.9Private consumption per capita 0.1 �0.5 0.4 �0.2 4.8 3.5 5.5 6.3 5.5GDP per capita 0.9 �1.7 �0.2 2.9 6.8 2.4 4.5 5.4 4.9
Population 0.9 0.2 0.0 0.0 0.0 0.0 0.0 0.0 0.0Gross domestic investment/GDPa 32.1 24.0 21.8 20.8 21.8 20.6 20.3 21.0 21.5
Inflationb 1.1 52.5 10.6 6.5 6.5 5.4 4.3 4.7 5.2Central gvt. budget balance/GDP �0.5 �4.4 �4.2 �4.4 �2.5 �3.7 �3.7 �3.8 �3.5
Export market growthc 3.3 5.6 4.0 �0.3 13.6 4.9 4.4 9.0 8.1Export volumed 0.1 1.2 5.8 3.9 16.0 6.1 7.1 13.5 10.3Terms of trade/GDPe �0.3 �0.7 �0.4 �0.5 2.6 �0.4 0.3 0.0 �0.7Current account/GDP �0.5 �0.7 �2.5 0.0 1.9 1.9 0.8 0.6 �0.5Workers’ remittances ($ billions) — 6.2 10.5 9.3 9.7 10.2 10.3 10.4 —
Memo items:GDP growth: transition countries 1.2 �2.3 �0.9 4.7 6.7 4.5 3.9 5.6 4.9Central and Eastern Europe 1.1 0.8 2.8 3.9 3.6 3.0 3.0 4.1 4.3Commonwealth of Independent States 1.3 �4.2 �3.9 5.4 9.2 5.7 4.7 6.6 5.4
External Financing and Debt($ billions, unless stated) 1995 1996 1997 1998 1999 2000 2001 2002 2003e
Net inward FDI 17.4 16.4 22.6 26.2 28.4 29.3 31.8 32.9 26.2Net inward portfolio equity flows 1.7 4.3 4.0 4.0 2.0 1.2 0.3 �0.4 0.7Net inward debt flows 23.4 22.9 32.8 41.5 16.1 21.0 2.0 24.9 29.5
From public sources 6.8 8.6 6.6 7.4 �0.7 �0.1 2.0 2.2 �6.5From private sources 16.7 14.3 26.3 34.1 16.9 21.1 0.1 22.7 36.0
Gross market-based capital inflows 21.9 26.9 51.2 43.4 31.0 41.4 26.6 35.0 58.0
Total external debt 349.0 367.1 387.5 485.2 495.6 503.9 498.9 545.8 577.4Medium and long term 304.7 315.0 331.6 414.5 423.3 423.5 423.9 468.9 484.2Short term 44.3 52.1 56.0 70.7 72.3 80.4 75.0 77.0 93.2Owed by public sector borrowers 286.6 286.8 288.7 320.9 316.1 304.4 292.0 310.6 323.8Owed by private sector borrowers 62.4 80.3 98.8 164.3 179.5 199.5 206.9 235.2 253.5Owed to public sector creditors 156.1 160.1 156.1 172.3 171.1 166.4 158.8 165.0 167.9Owed to private sector creditors 192.9 207.1 231.4 312.9 324.5 337.5 340.0 380.8 409.5
Gross foreign-exchange reserves 81.1 83.4 90.7 95.6 102.8 119.6 130.0 174.9 235.6
Note: — � not available; e � estimate; f � forecast.a. Fixed investment, measured in real terms.b. Local currency GDP deflator, median.c. Weighted average growth of import demand in export markets.d. Goods and non-factor services.e. Change in terms of trade, measured as a percentage of GDP.
gdf_174-233.qxd 4/6/04 12:58 PM Page 180

S U M M A R Y T A B L E S
181
Table B.4 Latin America and the Caribbean outlook in summary, 1981–2004
Real economy(% change, unless stated) 1981–90 1991–2000 1998 1999 2000 2001 2002 2003e 2004f
Real GDP growth 1.1 3.3 2.0 0.1 3.7 0.3 �0.6 1.3 3.8Private consumption per capita �1.0 2.3 �0.1 �1.7 2.2 �0.9 �3.6 �1.6 2.3GDP per capita �0.9 1.6 0.4 �1.5 2.1 �1.2 �2.0 �0.1 2.4
Population 2.0 1.7 1.6 1.6 1.6 1.5 1.5 1.5 1.4Gross domestic investment/GDPa 20.2 20.0 21.4 19.8 19.7 19.2 18.0 17.5 18.1
Inflationb 17.3 11.9 8.2 4.6 7.5 5.6 5.8 4.2 4.0Central gvt. budget balance/GDP �9.1 �3.3 �5.2 �4.1 �3.0 �2.9 �3.0 �2.4 �1.4
Export market growthc 4.4 9.8 7.2 5.6 13.0 �1.4 �0.1 4.8 8.6Export volumed 5.4 8.7 7.9 6.6 10.3 1.1 2.6 5.4 11.2Terms of trade/GDPe �0.4 0.0 �0.9 0.3 1.1 �0.6 �0.1 �0.3 0.0Current account/GDP �1.5 �2.9 �4.5 �3.2 �2.4 �2.8 �0.9 �0.3 �0.6Workers’ remittances ($ billions) — 12.5 15.2 16.9 19.2 22.9 26.8 29.6 —
Memo items:GDP growth: Central America 1.0 4.6 5.9 4.7 3.2 1.9 2.0 3.1 3.1Caribbean 2.0 3.9 4.2 6.9 5.8 2.7 3.0 0.5 0.8
External Financing and Debt($ billions, unless stated) 1995 1996 1997 1998 1999 2000 2001 2002 2003e
Net inward FDI 30.5 44.3 66.7 73.8 88.0 77.0 69.9 44.7 36.6Net inward portfolio equity flows 4.8 12.2 13.3 �2.2 �3.6 �0.5 2.3 1.5 1.4Net inward debt flows 61.2 36.5 25.4 38.0 12.1 �9.7 6.3 �7.9 19.5
From public sources 22.0 �10.7 �8.7 10.9 1.5 �11.1 20.4 12.7 10.2From private sources 39.2 47.2 34.1 27.2 10.6 1.4 �14.1 �20.6 9.3
Gross market-based capital inflows 42.8 84.9 120.6 84.5 75.3 88.4 77.0 43.5 64.3
Total external debt 612.2 633.7 665.8 748.4 770.2 751.9 729.3 727.9 762.1Medium and long term 488.8 516.7 541.8 632.9 664.0 648.6 639.8 652.2 678.2Short term 123.4 116.9 124.0 115.5 106.2 103.4 89.5 75.7 84.0Owed by public sector borrowers 401.4 399.5 379.3 412.7 419.0 403.7 398.8 423.3 454.8Owed by private sector borrowers 210.8 234.2 286.5 335.6 351.2 348.2 330.5 304.7 307.3Owed to public sector creditors 187.3 164.0 145.7 160.8 162.9 149.8 162.6 182.6 200.5Owed to private sector creditors 424.8 469.7 520.1 587.6 607.3 602.1 566.7 545.3 561.6
Gross foreign-exchange reserves 125.1 153.1 166.7 157.5 150.0 152.9 155.9 156.0 188.8
Note: — � not available; e � estimate; f � forecast.a. Fixed investment, measured in real terms.b. Local currency GDP deflator, median.c. Weighted average growth of import demand in export markets.d. Goods and non-factor services.e. Change in terms of trade, measured as a percentage of GDP.
gdf_174-233.qxd 4/6/04 12:58 PM Page 181

A P P E N D I X B : S U M M A R Y S T A T I S T I C A L T A B L E S
182
Table B.5 Middle East and North Africa outlook in summary, 1981–2004
Real economy(% change, unless stated) 1981–90 1991–2000 1998 1999 2000 2001 2002 2003e 2004f
Real GDP growth 2.4 3.3 3.5 1.9 4.4 3.5 3.3 5.1 3.7Private consumption per capita 1.5 0.0 1.2 0.3 1.5 3.0 1.4 �0.1 1.3GDP per capita �0.6 1.0 1.7 0.1 2.5 1.6 1.4 3.1 1.8
Population 3.1 2.2 1.8 1.8 1.8 1.9 1.9 1.9 2.0Gross domestic investment/GDPa 26.7 21.8 21.5 23.0 22.7 23.2 22.6 23.7 23.7
Inflationb 8.4 6.4 �0.4 7.6 10.9 0.9 2.6 1.1 0.8Central gvt. budget balance/GDP �3.9 �0.9 �3.2 �2.1 �1.1 �1.9 �2.9 �1.1 �3.3
Export market growthc 5.3 7.4 1.0 8.1 14.7 �1.4 4.8 6.1 10.0Export volumed 0.7 5.0 �1.7 3.7 7.8 3.4 �0.4 7.3 6.4Terms of trade/GDPe �0.6 �0.3 �4.8 0.0 5.8 �1.0 �1.0 �1.9 �2.0Current account/GDP �1.7 �1.8 �4.2 1.2 7.2 4.4 4.6 4.5 2.4Workers’ remittances ($ billions) — 11.2 10.6 10.7 11.0 13.2 13.0 13.0 —
Memo items:GDP growth: resource poor, labor abundant 4.5 3.8 5.4 4.3 3.8 4.5 2.9 4.2 3.9Resource rich, labor abundant 2.8 3.5 3.4 2.3 4.4 4.0 5.7 5.9 5.0Resource rich, labor importing �1.3 3.2 0.6 0.3 6.2 2.0 1.1 4.7 2.6
External Financing and Debt($ billions, unless stated) 1995 1996 1997 1998 1999 2000 2001 2002 2003e
Net inward FDI �0.7 0.6 6.3 7.4 2.9 2.4 5.8 2.7 2.0Net inward portfolio equity flows 0.0 0.2 0.7 0.2 0.6 0.2 �0.1 �0.3 0.0Net inward debt flows 2.4 �0.9 �2.9 7.1 �1.8 �6.1 0.9 0.9 �7.8
From public sources �1.1 �0.6 �3.7 �1.5 �2.5 �2.8 �1.1 �2.8 �2.0From private sources 3.5 �0.3 0.8 8.6 0.6 �3.4 2.0 3.8 �5.7
Gross market-based capital inflows 11.3 4.5 18.7 12.1 13.6 10.3 12.4 14.8 8.2
Total external debt 186.4 180.5 172.6 189.3 193.6 180.7 178.4 189.0 188.1Medium and long term 154.2 149.1 140.5 152.3 152.6 143.4 141.4 151.1 150.3Short term 32.2 31.4 32.1 37.0 41.0 37.3 37.1 37.9 37.9Owed by public sector borrowers 149.0 143.6 134.0 143.7 145.6 136.9 134.8 144.6 144.9Owed by private sector borrowers 37.4 36.9 38.7 45.6 48.0 43.8 43.6 44.4 43.2Owed to public sector creditors 107.9 107.5 99.7 104.1 98.5 90.9 88.6 91.5 94.1Owed to private sector creditors 78.5 73.0 72.9 85.2 95.1 89.8 89.8 97.5 94.1
Gross foreign-exchange reserves 44.9 56.4 63.0 61.6 64.2 76.5 85.2 97.4 106.6
Note: — � not available; e � estimate; f � forecast.a. Fixed investment, measured in real terms.b. Local currency GDP deflator, median.c. Weighted average growth of import demand in export markets.d. Goods and non-factor services.e. Change in terms of trade, measured as a percentage of GDP.
gdf_174-233.qxd 4/6/04 12:58 PM Page 182

S U M M A R Y T A B L E S
183
Table B.6 South Asia outlook in summary, 1981–2004
Real economy(% change, unless stated) 1981–90 1991–2000 1998 1999 2000 2001 2002 2003 2004f
Real GDP growth 5.8 5.2 5.4 6.4 4.2 4.7 4.3 6.5 7.2Private consumption per capita 2.3 2.3 2.9 4.0 1.2 3.2 2.1 4.6 4.6GDP per capita 3.5 3.2 3.6 4.7 2.5 3.0 2.7 4.8 5.5
Population 2.2 2.0 1.8 1.7 1.6 1.6 1.6 1.6 1.5Gross domestic investment/GDPa 20.2 21.6 22.1 22.3 22.5 22.3 23.3 24.4 25.3
Inflationb 8.9 8.1 7.3 4.4 3.9 3.8 3.5 4.1 3.6Central gvt. budget balance/GDP �12.6 �10.3 �11.4 �12.3 �9.1 �8.5 �9.7 �9.3 �9.1
Export market growthc 5.0 7.5 3.0 6.2 13.4 0.1 3.4 5.3 8.2Export volumed 6.4 11.1 9.1 12.5 21.2 7.3 17.3 16.4 11.2Terms of trade/GDPe 0.0 0.1 0.8 �1.2 �0.8 �0.4 �1.1 �0.8 �0.2Current account/GDP �2.0 �1.5 �1.8 �0.9 �0.7 0.5 1.4 0.7 0.5Workers’ remittances ($ billions) — 10.6 13.3 15.1 12.8 13.1 16.9 18.2 —
Memo item:GDP growth: South Asia (excluding India) 5.5 4.4 3.7 4.2 5.1 3.1 3.4 5.4 5.9
External Financing and Debt($ billions, unless stated) 1995 1996 1997 1998 1999 2000 2001 2002 2003e
Net inward FDI 2.9 3.5 4.9 3.5 3.1 3.4 5.0 4.2 5.1Net inward portfolio equity flows 1.6 4.1 2.9 �0.6 2.4 2.8 1.9 1.0 7.0Net inward debt flows 2.5 2.7 0.7 4.7 0.5 3.4 �0.7 0.4 �2.3
From public sources �1.2 1.0 0.3 2.3 2.5 0.5 2.2 �2.4 �0.6From private sources 3.7 1.6 0.4 2.4 �2.0 2.9 �2.8 2.8 �1.7
Gross market-based capital inflows 7.4 10.5 12.7 5.1 4.2 4.5 3.3 2.7 6.2
Total external debt 151.7 149.6 149.6 157.6 162.0 159.9 156.3 168.3 171.3Medium and long term 142.6 139.3 141.4 150.5 154.9 153.9 151.4 161.1 162.9Short term 9.0 10.3 8.2 7.1 7.0 6.0 4.9 7.2 8.4Owed by public sector borrowers 134.3 129.9 129.7 139.3 144.6 138.5 137.2 147.2 150.4Owed by private sector borrowers 17.3 19.8 19.9 18.3 17.4 21.4 19.1 21.1 20.9Owed to public sector creditors 108.9 104.1 98.9 104.6 113.3 102.8 101.1 106.3 112.1Owed to private sector creditors 42.8 45.5 50.7 53.0 48.7 57.2 55.2 62.0 59.2
Gross foreign-exchange reserves 24.2 24.8 30.0 32.9 37.9 42.6 52.8 79.8 114.4
Note: — � not available; e � estimate; f � forecast.a. Fixed investment, measured in real terms.b. Local currency GDP deflator, median.c. Weighted average growth of import demand in export markets.d. Goods and non-factor services.e. Change in terms of trade, measured as a percentage of GDP.
gdf_174-233.qxd 4/6/04 12:58 PM Page 183

A P P E N D I X B : S U M M A R Y S T A T I S T I C A L T A B L E S
184
Table B.7 Sub-Saharan Africa outlook in summary, 1981–2004
Real economy(% change, unless stated) 1981–90 1991–2000 1998 1999 2000 2001 2002 2003e 2004f
Real GDP growth 1.7 2.1 2.2 2.4 3.1 3.1 3.3 2.4 3.4Private consumption per capita �0.9 �0.8 �1.5 �0.4 �1.7 1.1 1.4 0.3 0.9GDP per capita �1.2 �0.5 �0.5 �0.1 0.7 0.9 1.2 0.4 1.4
Population 2.9 2.7 2.6 2.5 2.4 2.2 2.1 2.1 2.0Gross domestic investment/GDPa 18.6 17.2 18.4 18.2 18.4 19.1 19.7 20.4 20.9
Inflationb 9.6 9.5 8.2 6.0 7.8 6.4 5.4 4.2 4.0Central gvt. budget balance/GDP �4.5 �4.6 �2.5 �2.2 �0.4 �1.3 �2.3 �2.6 �2.1
Export market growthc 4.8 7.5 7.7 7.4 12.1 0.4 2.3 4.3 7.4Export volumed 1.5 4.3 4.0 3.9 5.1 3.2 1.9 1.7 5.1Terms of trade/GDPe �0.9 0.1 �2.9 1.2 2.9 �0.7 0.9 1.7 �1.4Current account/GDP �2.7 �2.3 �5.5 �3.0 �0.6 �3.1 �2.8 �2.6 �3.7Workers’ remittances ($ billions) — 2.7 3.6 3.5 3.6 3.9 4.1 4.1 —
Memo items:GDP growth: Sub-Saharan Africa
excluding South Africa and oil-exporters 2.3 2.8 3.8 3.5 2.0 3.8 2.7 2.5 4.6Oil exporters 1.8 2.1 3.1 1.0 4.0 3.0 4.0 3.8 3.8
External Financing and Debt($ billions, unless stated) 1995 1996 1997 1998 1999 2000 2001 2002 2003e
Net inward FDI 4.3 4.2 8.4 6.9 9.3 5.8 14.3 7.8 8.5Net inward portfolio equity flows 3.0 2.4 5.6 8.7 9.0 4.1 �1.0 �0.4 0.5Net inward debt flows 7.6 3.1 4.4 �1.3 �1.0 �0.7 �1.8 �0.1 4.9
From public sources 3.5 2.0 1.4 0.4 0.3 0.6 0.2 2.2 1.5From private sources 4.1 1.2 3.0 �1.8 �1.3 �1.3 �2.0 �2.2 3.4
Gross market-based capital inflows 7.8 7.8 7.9 6.4 10.0 11.6 9.9 9.0 15.3
Total external debt 235.4 231.2 220.7 228.4 214.7 211.2 202.6 210.3 219.7Medium and long term 194.7 188.6 179.8 186.0 173.7 178.1 170.9 181.2 190.9Short term 40.6 42.6 40.8 42.4 41.0 33.1 31.7 29.1 28.8Owed by public sector borrowers 182.9 178.3 171.0 177.7 163.3 166.7 158.5 168.7 174.8Owed by private sector borrowers 52.4 52.9 49.7 50.7 51.4 44.4 44.1 41.7 44.9Owed to public sector creditors 146.2 143.9 138.1 145.5 135.0 140.9 134.5 143.3 148.6Owed to private sector creditors 89.2 87.3 82.6 82.9 79.8 70.2 68.1 67.0 71.1
Gross foreign-exchange reserves 17.9 20.6 28.1 26.8 28.2 34.0 34.3 35.1 37.4
Note: — � not available; e � estimate; f � forecast.a. Fixed investment, measured in real terms.b. Local currency GDP deflator, median.c. Weighted average growth of import demand in export markets.d. Goods and non-factor services.e. Change in terms of trade, measured as a percentage of GDP.
gdf_174-233.qxd 4/6/04 12:58 PM Page 184
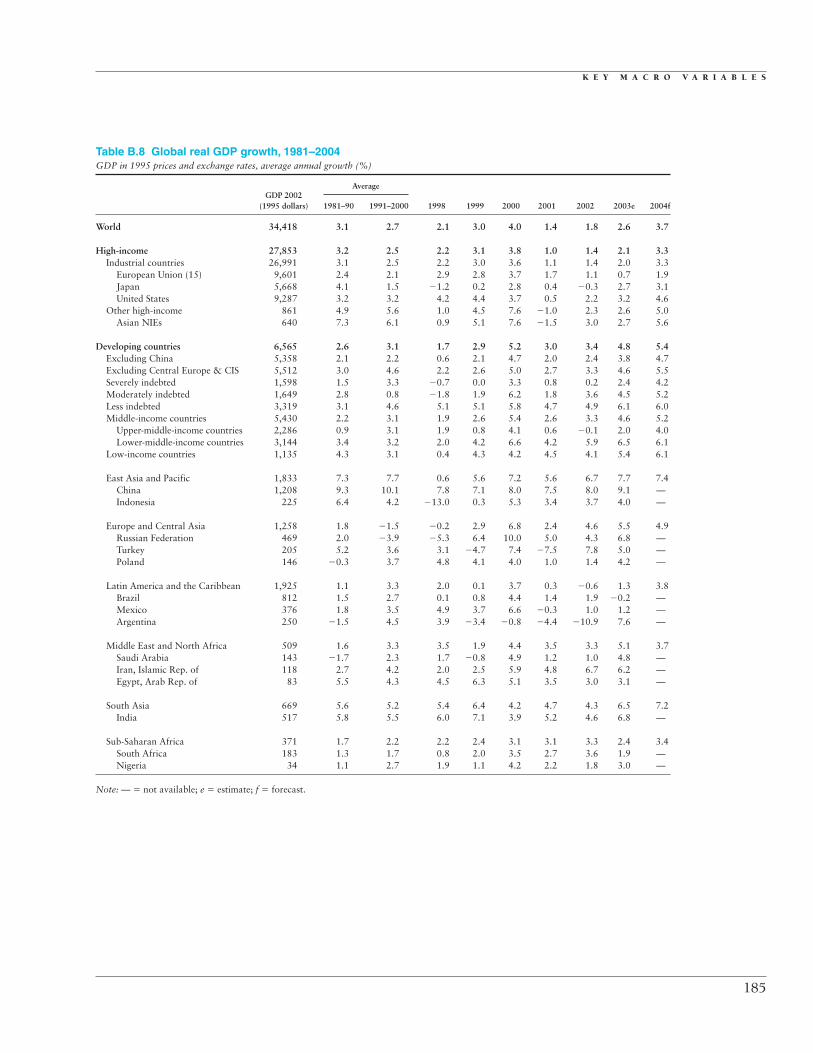
K E Y M A C R O V A R I A B L E S
185
Table B.8 Global real GDP growth, 1981–2004GDP in 1995 prices and exchange rates, average annual growth (%)
GDP 2002 Average
(1995 dollars) 1981–90 1991–2000 1998 1999 2000 2001 2002 2003e 2004f
World 34,418 3.1 2.7 2.1 3.0 4.0 1.4 1.8 2.6 3.7
High-income 27,853 3.2 2.5 2.2 3.1 3.8 1.0 1.4 2.1 3.3Industrial countries 26,991 3.1 2.5 2.2 3.0 3.6 1.1 1.4 2.0 3.3
European Union (15) 9,601 2.4 2.1 2.9 2.8 3.7 1.7 1.1 0.7 1.9Japan 5,668 4.1 1.5 �1.2 0.2 2.8 0.4 �0.3 2.7 3.1United States 9,287 3.2 3.2 4.2 4.4 3.7 0.5 2.2 3.2 4.6
Other high-income 861 4.9 5.6 1.0 4.5 7.6 �1.0 2.3 2.6 5.0Asian NIEs 640 7.3 6.1 0.9 5.1 7.6 �1.5 3.0 2.7 5.6
Developing countries 6,565 2.6 3.1 1.7 2.9 5.2 3.0 3.4 4.8 5.4Excluding China 5,358 2.1 2.2 0.6 2.1 4.7 2.0 2.4 3.8 4.7Excluding Central Europe & CIS 5,512 3.0 4.6 2.2 2.6 5.0 2.7 3.3 4.6 5.5Severely indebted 1,598 1.5 3.3 �0.7 0.0 3.3 0.8 0.2 2.4 4.2Moderately indebted 1,649 2.8 0.8 �1.8 1.9 6.2 1.8 3.6 4.5 5.2Less indebted 3,319 3.1 4.6 5.1 5.1 5.8 4.7 4.9 6.1 6.0Middle-income countries 5,430 2.2 3.1 1.9 2.6 5.4 2.6 3.3 4.6 5.2
Upper-middle-income countries 2,286 0.9 3.1 1.9 0.8 4.1 0.6 �0.1 2.0 4.0Lower-middle-income countries 3,144 3.4 3.2 2.0 4.2 6.6 4.2 5.9 6.5 6.1
Low-income countries 1,135 4.3 3.1 0.4 4.3 4.2 4.5 4.1 5.4 6.1
East Asia and Pacific 1,833 7.3 7.7 0.6 5.6 7.2 5.6 6.7 7.7 7.4China 1,208 9.3 10.1 7.8 7.1 8.0 7.5 8.0 9.1 —Indonesia 225 6.4 4.2 �13.0 0.3 5.3 3.4 3.7 4.0 —
Europe and Central Asia 1,258 1.8 �1.5 �0.2 2.9 6.8 2.4 4.6 5.5 4.9Russian Federation 469 2.0 �3.9 �5.3 6.4 10.0 5.0 4.3 6.8 —Turkey 205 5.2 3.6 3.1 �4.7 7.4 �7.5 7.8 5.0 —Poland 146 �0.3 3.7 4.8 4.1 4.0 1.0 1.4 4.2 —
Latin America and the Caribbean 1,925 1.1 3.3 2.0 0.1 3.7 0.3 �0.6 1.3 3.8Brazil 812 1.5 2.7 0.1 0.8 4.4 1.4 1.9 �0.2 —Mexico 376 1.8 3.5 4.9 3.7 6.6 �0.3 1.0 1.2 —Argentina 250 �1.5 4.5 3.9 �3.4 �0.8 �4.4 �10.9 7.6 —
Middle East and North Africa 509 1.6 3.3 3.5 1.9 4.4 3.5 3.3 5.1 3.7Saudi Arabia 143 �1.7 2.3 1.7 �0.8 4.9 1.2 1.0 4.8 —Iran, Islamic Rep. of 118 2.7 4.2 2.0 2.5 5.9 4.8 6.7 6.2 —Egypt, Arab Rep. of 83 5.5 4.3 4.5 6.3 5.1 3.5 3.0 3.1 —
South Asia 669 5.6 5.2 5.4 6.4 4.2 4.7 4.3 6.5 7.2India 517 5.8 5.5 6.0 7.1 3.9 5.2 4.6 6.8 —
Sub-Saharan Africa 371 1.7 2.2 2.2 2.4 3.1 3.1 3.3 2.4 3.4South Africa 183 1.3 1.7 0.8 2.0 3.5 2.7 3.6 1.9 —Nigeria 34 1.1 2.7 1.9 1.1 4.2 2.2 1.8 3.0 —
Note: — � not available; e � estimate; f � forecast.
gdf_174-233.qxd 4/6/04 12:58 PM Page 185
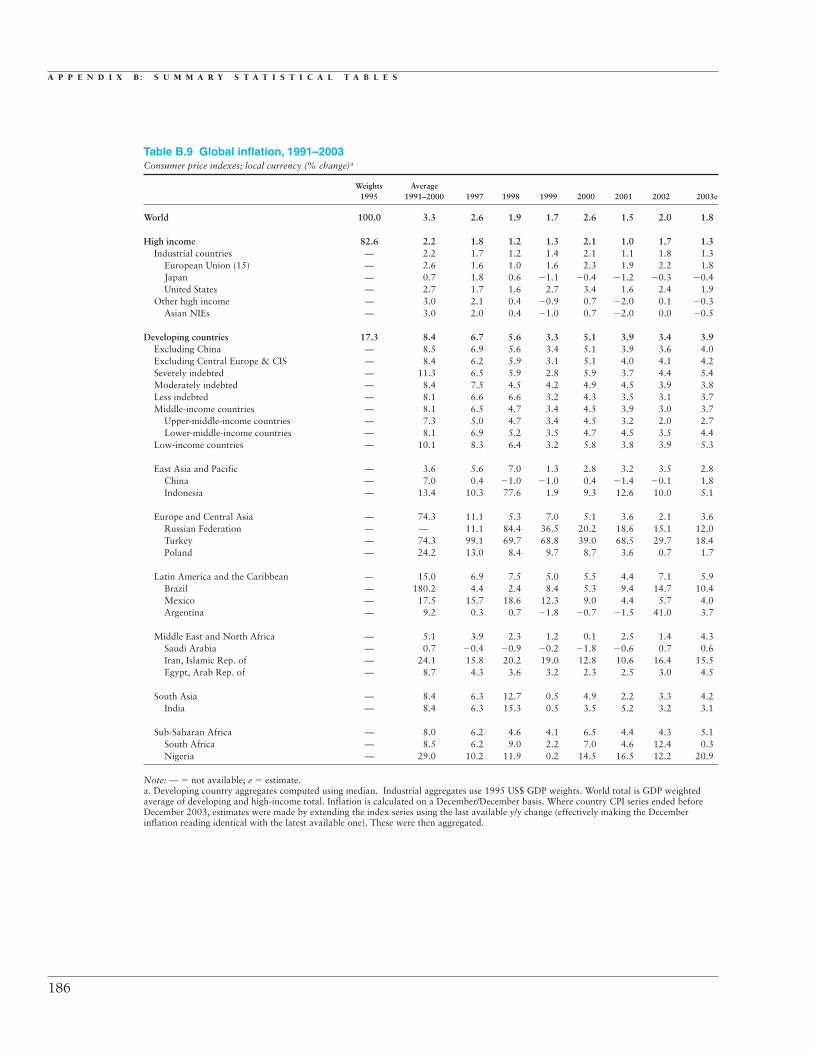
A P P E N D I X B : S U M M A R Y S T A T I S T I C A L T A B L E S
186
Table B.9 Global inflation, 1991–2003Consumer price indexes; local currency (% change)a
Weights Average1995 1991–2000 1997 1998 1999 2000 2001 2002 2003e
World 100.0 3.3 2.6 1.9 1.7 2.6 1.5 2.0 1.8
High income 82.6 2.2 1.8 1.2 1.3 2.1 1.0 1.7 1.3Industrial countries — 2.2 1.7 1.2 1.4 2.1 1.1 1.8 1.3
European Union (15) — 2.6 1.6 1.0 1.6 2.3 1.9 2.2 1.8Japan — 0.7 1.8 0.6 �1.1 �0.4 �1.2 �0.3 �0.4United States — 2.7 1.7 1.6 2.7 3.4 1.6 2.4 1.9
Other high income — 3.0 2.1 0.4 �0.9 0.7 �2.0 0.1 �0.3Asian NIEs — 3.0 2.0 0.4 �1.0 0.7 �2.0 0.0 �0.5
Developing countries 17.3 8.4 6.7 5.6 3.3 5.1 3.9 3.4 3.9Excluding China — 8.5 6.9 5.6 3.4 5.1 3.9 3.6 4.0Excluding Central Europe & CIS — 8.4 6.2 5.9 3.1 5.1 4.0 4.1 4.2Severely indebted — 11.3 6.5 5.9 2.8 5.9 3.7 4.4 5.4Moderately indebted — 8.4 7.5 4.5 4.2 4.9 4.5 3.9 3.8Less indebted — 8.1 6.6 6.6 3.2 4.3 3.5 3.1 3.7Middle-income countries — 8.1 6.5 4.7 3.4 4.5 3.9 3.0 3.7
Upper-middle-income countries — 7.3 5.0 4.7 3.4 4.5 3.2 2.0 2.7Lower-middle-income countries — 8.1 6.9 5.2 3.5 4.7 4.5 3.5 4.4
Low-income countries — 10.1 8.3 6.4 3.2 5.8 3.8 3.9 5.3
East Asia and Pacific — 3.6 5.6 7.0 1.3 2.8 3.2 3.5 2.8China — 7.0 0.4 �1.0 �1.0 0.4 �1.4 �0.1 1.8Indonesia — 13.4 10.3 77.6 1.9 9.3 12.6 10.0 5.1
Europe and Central Asia — 74.3 11.1 5.3 7.0 5.1 3.6 2.1 3.6Russian Federation — — 11.1 84.4 36.5 20.2 18.6 15.1 12.0Turkey — 74.3 99.1 69.7 68.8 39.0 68.5 29.7 18.4Poland — 24.2 13.0 8.4 9.7 8.7 3.6 0.7 1.7
Latin America and the Caribbean — 15.0 6.9 7.5 5.0 5.5 4.4 7.1 5.9Brazil — 180.2 4.4 2.4 8.4 5.3 9.4 14.7 10.4Mexico — 17.5 15.7 18.6 12.3 9.0 4.4 5.7 4.0Argentina — 9.2 0.3 0.7 �1.8 �0.7 �1.5 41.0 3.7
Middle East and North Africa — 5.1 3.9 2.3 1.2 0.1 2.5 1.4 4.3Saudi Arabia — 0.7 �0.4 �0.9 �0.2 �1.8 �0.6 0.7 0.6Iran, Islamic Rep. of — 24.1 15.8 20.2 19.0 12.8 10.6 16.4 15.5Egypt, Arab Rep. of — 8.7 4.3 3.6 3.2 2.3 2.5 3.0 4.5
South Asia — 8.4 6.3 12.7 0.5 4.9 2.2 3.3 4.2India — 8.4 6.3 15.3 0.5 3.5 5.2 3.2 3.1
Sub-Saharan Africa — 8.0 6.2 4.6 4.1 6.5 4.4 4.3 5.1South Africa — 8.5 6.2 9.0 2.2 7.0 4.6 12.4 0.3Nigeria — 29.0 10.2 11.9 0.2 14.5 16.5 12.2 20.9
Note: — � not available; e � estimate.a. Developing country aggregates computed using median. Industrial aggregates use 1995 US$ GDP weights. World total is GDP weighted average of developing and high-income total. Inflation is calculated on a December/December basis. Where country CPI series ended before December 2003, estimates were made by extending the index series using the last available y/y change (effectively making the December inflation reading identical with the latest available one). These were then aggregated.
gdf_174-233.qxd 4/6/04 12:58 PM Page 186

K E Y M A C R O V A R I A B L E S
187
Table B.10 Commodity prices, 1980–2004Current $
Unit 1980 1990 1998 1999 2000 2001 2002 2003 2004f
EnergyCoal, Australia $/mt 34.16 39.67 29.23 25.89 26.25 32.31 27.06 27.84 40.00Crude oil, average $/bbl 36.87 22.88 13.07 18.07 28.23 24.35 24.93 28.90 26.00Natural gas, Europe $/mmbtu 3.40 2.55 2.42 2.13 3.86 4.06 3.05 3.91 3.80
Non-energy commoditiesa
Agriculture
BeveragesCocoa ¢/kg 260.4 126.7 167.6 113.5 90.6 106.9 177.8 175.1 172.0Coffee, arabica ¢/kg 346.6 197.2 298.1 229.1 192.0 137.3 135.7 141.5 149.9Coffee, robusta ¢/kg 324.3 118.2 182.3 148.9 91.3 60.7 66.2 81.5 83.8
FoodFats and oils
Palm oil $/mt 583.7 289.8 671.1 436.0 310.3 285.7 390.3 443.3 500.0Soybean meal $/mt 262.4 200.2 170.3 152.2 189.2 181.0 175.2 210.9 240.0Soybeans $/mt 296.2 246.8 243.3 201.7 211.8 195.8 212.7 264.0 320.0
GrainsMaize $/mt 125.3 109.3 102.0 90.2 88.5 89.6 99.3 105.4 110.0Rice, Thailand $/mt 410.7 270.9 304.2 248.4 202.4 172.8 191.9 197.6 205.0Wheat, U.S. $/mt 172.7 135.5 126.1 112.0 114.1 126.8 148.1 146.1 155.0
Other foodBananas, U.S. $/mt 377.3 540.9 489.5 373.8 424.0 583.3 528.6 374.8 400.0Sugar, world ¢/kg 63.16 27.67 19.67 13.81 18.04 19.04 15.18 15.63 15.0
Raw materialsCotton ¢/kg 206.2 181.9 144.5 117.1 130.2 105.8 101.9 139.9 145.5Rubber, Malaysia ¢/kg 142.5 86.5 72.2 62.9 69.1 60.0 77.1 105.6 110.2Sawnwood, Malaysia $/cum 396.0 533.0 484.2 600.8 594.7 481.4 526.5 551.0 560.0
FertilizersTriple superphosphate $/mt 180.3 131.8 173.1 154.5 137.7 126.9 133.1 149.3 160.0
Metals and mineralsAluminum $/mt 1,456 1,639 1,357 1,361 1,549 1,444 1,350 1,431 1,650Copper $/mt 2,182 2,661 1,654 1,573 1,813 1,578 1,559 1,779 2,400Gold $/toz 607 383 294 278 279 271 310 363 380Nickel $/mt 6,519 8,864 4,630 6,011 8,638 5,945 6,772 9,629 14,000
Memo items:Deflator Index 78.8 100.0 99.6 99.3 97.2 94.3 93.1 99.2 103.5(MUV 1990 � 100)a
Reuters/CRB Commodity 294.2 234.8 215.2 194.5 218.6 207.3 209.4 240.5 —Futures Index (1967 � 100)
Note: MUV � manufacturing unit value; CRB � Commodity Research Bureau; f � forecast; bbl � barrel; cum � cubic meter; kg � kilogram;mmbtu � million British thermal units; mt � metric ton; — � not available; toz � troy oz.a. Unit value index in U.S. dollar terms of manufactures exported from the G-5 countries weighted by exports to developing countries.Source: World Bank Development Prospects Group. See Web site http://www.worldbank.org/prospects for details of price series and forecasts.
gdf_174-233.qxd 4/6/04 12:58 PM Page 187

A P P E N D I X B : S U M M A R Y S T A T I S T I C A L T A B L E S
188
Table B.11 Commodity price indexes, 1980–2004Weighted index unless indicated otherwise (constant 1990 $)
Weightsa 1980 1990 1998 1999 2000 2001 2002 2003 2004f
EnergyCoal, Australia 109.3 100.0 74.0 65.7 68.1 86.4 73.2 70.8 73.1Crude oil, average 204.5 100.0 57.3 79.5 127.0 112.8 117.0 127.4 109.8Natural gas, Europe 169.0 100.0 95.3 84.3 155.7 168.6 128.6 154.5 132.5
Non-energy commoditiesa 100.0 159.2 100.0 99.5 88.6 89.4 83.7 89.1 92.1 97.4Agriculture 69.1 175.2 100.0 108.2 93.5 90.3 84.6 92.8 95.3 96.0
Beverages 16.9 230.2 100.0 141.1 108.4 90.9 76.4 90.8 87.9 86.4Cocoa 3.9 260.8 100.0 132.8 90.3 73.6 89.5 150.7 139.4 131.2Coffee, arabica 8.0 223.0 100.0 151.7 117.0 100.2 73.8 73.9 72.4 73.5Coffee, robusta 2.8 348.2 100.0 154.8 126.9 79.5 54.5 60.1 69.5 68.5
Food 29.4 176.7 100.0 105.3 88.2 87.0 91.2 96.7 97.2 100.4Fats and oils 10.1 188.6 100.0 133.3 105.8 99.0 94.4 108.7 121.6 133.9
Palm oil 2.3 255.6 100.0 232.5 151.6 110.2 104.5 144.6 154.2 166.7Soybean meal 4.1 166.3 100.0 85.4 76.6 97.2 95.9 94.0 106.2 115.9Soybeans 2.0 152.3 100.0 99.0 82.3 88.3 84.1 92.5 107.9 125.3
Grains 6.9 170.4 100.0 101.6 87.0 81.8 82.9 94.6 90.9 91.2Maize 1.7 145.4 100.0 93.7 83.2 83.4 87.0 97.5 97.2 97.3Rice, Thailand 2.9 192.4 100.0 112.7 92.4 76.9 67.7 76.1 73.6 73.1Wheat, U.S. 1.9 161.7 100.0 93.4 83.3 86.6 99.2 117.3 108.7 110.5
Other food 12.4 170.4 100.0 84.5 74.5 80.0 93.2 88.1 80.7 78.0Bananas, U.S. 2.3 88.5 100.0 90.9 69.6 80.7 114.3 104.9 69.9 71.5Sugar, world 7.5 289.6 100.0 71.4 50.3 67.1 73.0 58.9 57.0 52.4
Raw materials 22.8 132.7 100.0 87.6 89.2 94.0 82.0 89.4 98.3 97.4Cotton 5.9 143.8 100.0 79.7 64.8 73.7 61.7 60.2 77.5 77.3Rubber, Malaysia 4.8 209.0 100.0 83.8 73.2 82.2 73.6 95.7 123.1 123.2Sawnwood, Malaysia 2.9 94.3 100.0 91.2 113.5 114.8 95.7 106.1 104.2 101.5
Fertilizers 2.7 163.5 100.0 122.6 114.9 108.8 104.7 107.9 107.0 107.5Triple superphosphate 0.9 173.5 100.0 131.8 118.0 107.5 102.0 108.4 114.2 117.3
Metals and minerals 28.2 119.5 100.0 75.8 74.2 85.4 79.6 78.1 82.7 100.0Aluminum 7.9 112.7 100.0 83.1 83.6 97.2 93.4 88.4 88.0 97.2Copper 9.3 104.0 100.0 62.4 59.5 70.1 62.9 62.9 67.4 87.1Golda — 201.1 100.0 77.0 73.2 74.9 74.9 86.8 95.6 95.8Nickel 2.2 93.3 100.0 52.4 68.3 100.3 71.1 82.0 109.5 152.6
Memo item:Deflator Index (MUV 1990 � 100)b 78.8 100.0 99.6 99.3 97.2 94.3 93.1 99.2 103.5
Note: MUV � manufacturing unit value; — � not available; f � forecast.a. The World Bank primary commodity price indexes are computed from 1988–89 export values in U.S. dollars for low- and middle-incomeeconomies, rebased to 1990. Energy and gold prices are not included in the index.b. Unit value index in U.S. dollar terms of manufactures exported from the G-5 countries weighted by exports to developing countries.Source: World Bank Development Prospects Group. See Web site http://www.worldbank.org/prospects for details of price series and forecasts.
gdf_174-233.qxd 4/6/04 12:58 PM Page 188

K E Y M A C R O V A R I A B L E S
189
Table B.12 Global nominal GDP growth, 1981–2004% change from a year earlier
Average
1981–90 1991–2000 1997 1998 1999 2000 2001 2002 2003e 2004f
World 9.4 6.6 6.7 4.9 4.4 6.0 3.6 3.6 3.8 4.8
High-income 8.4 4.6 5.5 3.6 3.4 4.8 2.4 2.5 2.9 4.0Industrial countries 7.9 4.4 5.4 3.6 3.4 4.7 2.5 2.5 2.9 3.9
European Union (15) 8.6 5.0 6.6 5.5 3.4 5.1 4.0 3.4 2.7 3.5Japan 6.2 1.5 2.1 �1.3 �1.3 0.8 �1.1 �1.5 0.2 0.8United States 7.6 5.4 6.2 5.3 6.0 5.9 2.9 3.8 4.9 6.2
Other high-income 25.2 9.6 8.7 2.3 3.1 9.4 �2.0 3.1 1.9 5.5Asian NIEs 12.2 8.5 9.3 2.0 1.5 5.6 �1.9 1.6 0.9 6.4
Developing countries 15.2 15.7 12.7 11.0 9.5 11.9 9.5 8.5 8.2 9.0Excluding China 15.1 15.7 12.7 11.3 9.5 12.0 9.5 8.5 8.1 8.9Excluding Central Europe & CIS 15.2 13.9 11.3 10.2 9.5 11.0 9.0 7.9 7.9 8.8Severely indebted 15.2 15.0 11.2 9.3 8.1 11.3 8.8 8.3 8.1 8.9Moderately indebted 14.9 17.0 14.8 12.3 7.2 12.1 10.6 8.7 7.9 9.2Less indebted 15.6 14.9 12.9 11.4 11.3 11.9 9.5 8.1 8.3 8.6Middle-income countries 16.4 15.9 12.8 10.0 8.5 12.3 9.1 8.5 7.5 8.2
Upper-middle-income countries 16.8 15.7 13.4 10.0 7.9 13.1 7.3 7.9 7.4 8.8Lower-middle-income countries 16.1 16.3 11.9 10.9 8.9 12.2 9.8 9.3 7.8 7.6
Low-income countries 14.3 15.5 12.1 12.1 11.0 9.6 11.0 8.4 9.2 9.8
East Asia and Pacific 13.2 12.1 10.4 6.2 8.9 10.9 9.1 7.8 8.1 10.6China 15.2 17.0 9.7 5.2 4.8 9.0 8.8 7.7 10.5 —Indonesia 15.7 19.6 17.9 57.7 13.1 13.0 14.6 11.1 7.7 —
Europe and Central Asia 4.7 48.0 21.6 14.8 11.3 14.5 12.7 11.0 12.2 12.1Russian Federation — 99.6 16.5 12.3 83.5 51.5 23.7 20.2 21.0 —Turkey 54.0 77.9 95.2 81.1 48.2 60.9 43.2 55.0 30.7 —Poland 71.8 29.0 21.6 17.2 11.3 16.0 5.1 2.8 4.6 —
Latin America and the Caribbean 25.0 17.0 12.4 12.4 6.1 11.1 7.7 6.3 7.2 7.4Brazil 337.4 214.7 11.8 5.0 6.5 13.1 9.0 12.2 12.7 —Mexico 66.7 22.2 25.7 21.0 19.5 19.4 5.1 5.9 7.4 —Argentina 431.4 15.2 7.6 2.1 �5.2 0.2 �5.5 16.3 18.8 —
Middle East and North Africa 12.4 13.0 7.8 6.8 10.0 14.7 5.9 5.3 6.8 5.1Saudi Arabia �2.9 6.1 4.6 �11.5 10.4 17.1 �1.2 3.0 �0.8 —Iran, Islamic Rep. of 18.6 31.9 17.3 18.7 26.8 40.1 14.0 29.7 10.5 —Egypt, Arab Rep. of 19.3 13.4 12.1 8.2 8.5 12.3 6.6 7.2 1.7 —
South Asia 14.7 13.1 12.7 10.8 9.8 7.9 8.8 7.8 9.2 9.9India 14.7 13.9 11.3 14.4 11.2 7.9 9.2 8.2 15.9 —
Sub-Saharan Africa 14.1 14.1 11.3 11.5 10.6 11.0 11.2 8.8 9.0 9.3South Africa 16.5 11.9 11.0 7.8 8.4 11.0 10.7 14.0 6.9 —Nigeria 17.9 32.3 4.1 �3.8 19.2 26.9 10.2 13.6 18.5 —
Note: — � not available; e � estimate; f � forecast. Developing countries aggregated using median growth rates. Industrial aggregates use1995 US$ GDP weights. World total is GDP weighted average of developing and high-income total.
gdf_174-233.qxd 4/6/04 12:58 PM Page 189

A P P E N D I X B : S U M M A R Y S T A T I S T I C A L T A B L E S
190
Table B.13 Global goods export growth, 1981–2004BoP goods exports (current $); average annual growth (%)
Exports 2002Average
($ billions) 1981–90 1991–2000 1998 1999 2000 2001 2002 2003e 2004f
World 6,314 6.4 6.8 �2.5 3.6 12.1 �3.8 5.0 15.5 14.9
High-income 4,491 7.4 6.0 �1.5 2.7 9.4 �4.7 3.7 14.1 16.0Industrial countries 3,936 7.1 5.7 �0.4 2.4 7.8 �3.8 3.7 14.3 16.3
European Union (15) 2,200 7.1 5.0 2.3 0.1 3.0 0.2 7.5 18.6 19.5Japan 395 8.1 5.0 �8.6 7.6 13.8 �16.1 2.8 13.5 13.9United States 698 6.2 7.2 �1.1 2.3 12.6 �6.5 �4.6 2.8 9.1
Other high-income 555 10.7 8.8 �9.8 5.0 21.6 �10.7 3.3 12.1 13.4Asian NIEs 459 13.2 9.2 �9.2 4.0 19.0 �11.0 5.2 12.1 14.5
Developing countries 1,823 2.7 9.6 �6.1 7.0 23.0 �0.9 8.5 18.9 12.3Excluding China 1,497 2.2 8.6 �7.3 7.2 22.0 �2.4 5.9 15.7 10.5Excluding Central Europe & CIS 1,480 3.2 9.7 �6.4 8.9 22.7 �2.3 8.1 17.7 11.9Severely indebted 220 3.4 6.0 �9.8 0.3 20.3 �2.0 2.8 15.3 8.9Moderately indebted 668 4.7 9.4 �7.9 6.9 23.5 �5.6 5.6 12.7 10.5Less indebted 935 1.1 11.1 �3.7 9.2 24.9 2.2 12.1 24.2 14.2Middle-income countries 1,432 2.5 10.1 �5.4 7.2 23.5 �0.6 8.9 20.3 13.1
Upper-middle-income countries 639 1.5 9.9 �5.0 8.7 23.1 �1.8 4.3 16.9 11.8Lower-middle-income countries 793 3.6 10.4 �5.7 5.9 23.9 0.5 13.0 23.0 14.2
Low-income countries 391 3.4 6.9 �10.4 5.8 24.1 �6.4 6.8 13.8 9.0
East Asia and Pacific 762 8.4 14.1 �2.4 8.3 22.9 �1.9 12.6 20.0 15.5China 326 11.8 17.1 0.5 6.1 27.9 6.8 22.4 33.7 —Indonesia 57 3.3 9.2 �8.8 �0.4 27.6 �9.3 1.4 7.3 —
Europe and Central Asia 383 1.2 9.0 �4.8 �1.6 24.7 3.8 10.8 24.4 14.8Russian Federation 107 1.0 9.5 �15.9 1.0 39.5 �3.8 5.3 20.8 —Turkey 40 14.8 9.0 �4.5 �5.9 6.5 11.9 15.8 25.5 —Poland 47 1.9 8.5 5.6 �7.4 19.4 16.0 12.2 32.1 —
Latin America and the Caribbean 349 5.4 10.1 �1.2 5.7 19.6 �3.6 0.1 15.2 8.6Brazil 60 4.5 5.8 �3.5 �6.1 14.7 5.7 3.7 21.1 —Mexico 161 11.2 15.8 6.2 16.0 22.2 �4.8 1.5 18.9 —Argentina 26 4.4 7.9 0.0 �11.8 13.3 1.0 �3.1 13.9 —
Middle East and North Africa 165 �2.8 5.3 �28.1 29.9 43.0 �4.6 7.2 10.6 4.1Saudi Arabia 72 �6.9 5.7 �36.1 30.7 52.9 �5.9 5.3 10.2 —Iran, Islamic Rep. of 28 �1.6 3.9 �28.6 60.3 34.8 �9.9 17.9 6.3 —Egypt, Arab Rep. of 7 4.5 6.1 �20.3 18.9 34.8 �0.5 1.3 8.7 —
South Asia 74 8.4 8.7 �2.4 6.9 12.6 3.2 11.7 19.1 15.0India 53 8.4 8.9 �4.6 10.1 14.5 0.7 16.2 19.1 —
Sub-Saharan Africa 91 0.7 3.3 �13.7 7.2 21.1 �3.6 1.5 16.2 �0.3South Africa 31 �0.7 2.7 �6.1 �2.2 10.5 �3.1 1.2 17.4 —Nigeria 14 �1.4 3.7 �41.0 43.5 51.4 �10.8 �12.5 16.4 —
Note: — � not available; e � estimate; f � forecast.
gdf_174-233.qxd 4/6/04 12:58 PM Page 190

C U R R E N T A C C O U N T
191
Table B.14 Global goods import growth, 1981–2004BoP goods imports (current $); average annual growth (%)
Exports 2002Average
($ billions) 1981–90 1991–2000 1998 1999 2000 2001 2002 2003e 2004f
World 6,264 5.9 6.9 �1.9 4.5 12.8 �3.8 4.2 15.9 15.3
High-income 4,662 6.6 6.5 �1.1 6.2 12.3 �5.2 3.3 14.4 14.8Industrial countries 4,148 6.4 6.1 0.4 6.3 11.3 �4.5 3.3 14.7 14.7
European Union (15) 2,082 5.9 4.8 3.7 2.3 5.6 �2.1 5.0 19.1 18.7Japan 302 4.9 5.2 �18.1 11.4 22.2 �8.6 �3.4 14.0 14.7United States 1,190 7.6 9.5 5.0 12.4 18.8 �6.1 2.0 7.6 7.2
Other high-income 514 9.0 9.3 �11.8 4.9 19.9 �10.9 3.3 12.1 15.5Asian NIEs 428 11.5 9.6 �13.9 2.6 21.8 �13.0 3.0 11.8 16.5
Developing countries 1,602 2.9 8.8 �4.6 �1.7 16.6 1.5 7.0 20.4 16.6Excluding China 1,320 2.6 7.7 �5.2 �4.1 13.5 0.2 4.4 15.7 14.4Excluding Central Europe & CIS 1,275 3.4 9.4 �4.7 1.1 18.1 �0.6 6.0 18.9 16.7Severely indebted 156 0.1 6.9 �7.8 �11.9 8.6 �1.6 �8.5 11.3 17.2Moderately indebted 551 4.4 6.6 �14.4 �5.5 17.6 �1.7 6.8 15.6 16.3Less indebted 894 2.9 11.1 4.0 3.8 19.6 4.0 10.4 25.0 16.7Middle-income countries 1,280 3.0 9.6 �3.5 �1.3 18.4 1.4 7.0 20.9 16.7
Upper-middle-income countries 563 0.9 11.6 1.6 �0.8 15.7 �0.8 0.2 11.8 13.7Lower-middle-income countries 717 4.6 8.1 �8.1 �1.7 21.3 3.5 13.0 28.0 18.8
Low-income countries 322 2.9 5.2 �10.6 �4.2 12.3 �4.5 7.0 18.5 16.2
East Asia and Pacific 617 8.9 11.9 �17.5 11.2 29.1 1.1 12.7 25.6 22.7China 281 9.3 17.6 0.3 15.9 35.2 8.1 21.3 42.5 —Indonesia 31 6.5 4.6 �34.4 �12.2 38.9 �7.1 1.1 7.4 —
Europe and Central Asia 375 1.6 7.3 �4.2 �12.2 16.4 1.7 12.5 27.2 16.8Russian Federation 61 3.8 0.2 �19.4 �31.9 13.5 19.8 13.4 27.0 —Turkey 48 11.0 8.9 �5.4 �12.5 35.1 �26.8 23.7 33.1 —Poland 54 �4.1 14.7 11.7 �0.4 6.8 2.3 9.5 29.2 —
Latin America and the Caribbean 329 1.3 12.6 5.9 �3.8 15.1 �2.0 �6.5 4.2 7.2Brazil 47 �1.0 10.4 �3.4 �14.6 13.3 �0.5 �15.0 2.3 —Mexico 169 7.8 15.4 14.0 13.3 22.8 �3.4 0.1 1.4 —Argentina 9 �8.8 20.4 3.4 �18.4 �1.0 �19.9 �53.1 49.1 —
Middle East and North Africa 112 1.2 2.5 3.5 �2.7 8.1 6.6 6.2 16.6 14.2Saudi Arabia 30 �3.3 2.6 4.4 �6.6 7.9 3.3 3.5 14.9 —Iran, Islamic Rep. of 22 7.4 �1.9 1.2 �6.0 13.2 25.5 20.2 24.1 —Egypt, Arab Rep. of 13 8.9 4.1 3.3 3.7 1.4 �9.2 �7.7 10.8 —
South Asia 91 6.0 7.1 �4.7 3.3 8.7 3.8 8.7 23.4 16.3India 65 7.7 7.8 �2.0 1.6 9.5 3.5 11.9 26.3 —
Sub-Saharan Africa 79 �1.2 3.7 1.7 �5.1 5.7 �0.2 3.2 17.3 3.6South Africa 27 �0.9 4.7 �5.7 �9.8 11.3 �6.0 3.3 24.2 —Nigeria 11 �7.6 5.9 �3.1 �6.8 1.6 5.7 �1.2 12.4 —
Note: — � not available; e � estimate; f � forecast.
gdf_174-233.qxd 4/6/04 12:58 PM Page 191

A P P E N D I X B : S U M M A R Y S T A T I S T I C A L T A B L E S
192
Table B.15 Global goods trade balances, 1996–2004$ billions
% of GDP2002 1996 1997 1998 1999 2000 2001 2002 2003e 2004f
World �0.1 103.9 122.9 84.8 41.2 5.0 4.9 18.6 7.3 �14.6
High income �0.7 91.1 104.4 86.1 �57.8 �191.4 �157.0 �150.4 �190.1 �164.1Industrial countries �8.4 88.0 106.0 76.9 �68.0 �212.2 �176.4 �195.2 �239.3 �206.8
European Union (15) 1.4 170.9 175.6 152.3 107.1 57.1 107.2 134.6 147.1 190.5Japan 2.3 82.8 102.4 122.9 122.7 116.1 71.7 93.1 104.2 116.1United States �4.7 �189.9 �196.5 �248.8 �348.5 �457.9 �432.5 �492.6 �563.3 �590.0
Other high income 5.3 3.1 �1.6 9.2 10.2 20.8 19.4 44.8 49.1 42.7Asian NIEs 5.9 0.5 �9.0 12.7 18.7 11.3 19.4 31.3 36.5 31.9
Developing countries 2.1 12.8 18.5 �1.3 99.0 194.0 160.8 127.0 142.7 109.2Excluding China 1.7 �6.7 �27.7 �47.9 63.1 159.5 126.8 82.8 108.6 90.2Excluding Central Europe & CIS 2.9 26.6 40.5 21.8 94.6 158.4 135.9 150.8 171.7 139.6Severely indebted 5.8 8.2 5.3 0.9 23.0 46.4 44.7 61.4 77.1 69.3Moderately indebted 1.3 �11.8 �16.9 12.8 60.1 94.9 73.2 18.7 12.5 6.0Less indebted 1.3 16.5 30.1 �14.9 15.9 52.8 41.0 47.0 53.1 33.9Middle-income countries 2.3 23.9 27.1 6.0 90.2 160.7 136.6 113.1 132.0 106.3
Upper-middle-income countries 5.0 34.5 13.2 �19.7 25.2 67.0 60.0 84.8 130.4 132.4Lower-middle-income countries 0.8 �10.6 13.9 25.7 65.1 92.9 75.7 28.3 1.6 �26.1
Low-income countries 1.4 �11.0 �8.6 �7.3 8.8 29.6 24.2 13.9 10.6 3.0
East Asia and Pacific 5.2 3.5 46.0 98.2 97.6 99.7 84.9 93.0 89.5 68.4China 3.5 19.5 46.2 46.6 36.0 34.5 34.0 44.2 34.1 —Indonesia 14.9 6.9 11.9 21.5 24.7 28.8 25.4 25.8 27.7 —
Europe and Central Asia �2.9 �24.4 �37.4 �37.4 �6.1 13.7 20.4 �32.1 �45.1 �47.2Russian Federation 13.5 22.5 17.0 16.9 36.1 60.7 47.8 46.6 61.8 —Turkey �4.5 �10.6 �15.4 �14.3 �10.5 �22.4 �4.5 �8.3 �16.1 —Poland �3.9 �7.3 �9.8 �12.8 �15.1 �12.3 �7.7 �7.2 �7.9 —
Latin America and the Caribbean 1.2 3.7 �14.6 �36.3 �7.7 4.8 �1.0 19.6 58.8 68.6Brazil 2.8 �5.6 �6.8 �6.6 �1.3 �0.8 2.7 13.1 24.8 —Mexico �1.3 6.4 0.6 �8.0 �5.7 �8.0 �10.0 �7.9 20.2 —Argentina 16.4 1.8 �2.1 �3.1 �0.8 2.6 7.6 16.7 15.9 —
Middle East and North Africa 9.4 35.8 33.5 �5.3 24.6 67.8 53.3 53.2 52.2 41.1Saudi Arabia 21.9 35.4 34.4 11.3 25.0 49.8 44.4 42.0 45.0 —Iran, Islamic Rep. of 5.2 7.4 4.3 �1.2 7.6 13.1 6.5 5.6 2.0 —Egypt, Arab Rep. of �6.4 �8.4 �8.6 �10.2 �9.9 �8.3 �6.9 �5.8 �6.5 —
South Asia �2.7 �17.9 �16.1 �14.0 �12.6 �11.5 �12.4 �16.9 �24.1 �29.2India �2.4 �10.1 �10.0 �10.8 �8.0 �6.9 �8.4 �12.4 �19.5 —
Sub-Saharan Africa 3.3 12.1 7.1 �6.4 3.3 16.1 12.7 10.3 11.4 7.6South Africa 4.0 2.7 2.3 2.1 4.1 4.3 5.0 4.4 3.3 —Nigeria 5.8 9.7 5.7 �0.2 4.3 10.8 8.2 2.6 3.5 —
Note: — � not available; e � estimate; f � forecast.
gdf_174-233.qxd 4/6/04 12:58 PM Page 192

C U R R E N T A C C O U N T
193
Table B.16 Global trade prices and volumes, 1981–2004Average annual percent change; prices are in dollar terms unless indicated otherwise
Average change
1981–90 1991–2000 1997 1998 1999 2000 2001 2002 2003e 2004f
Trade pricesManufactured goods prices 2.4 �0.3 �7.0 �3.8 �0.3 �2.1 �2.9 �1.3 6.5 4.4Developing countries’ export price (GNFS) �1.2 1.1 �1.7 �9.6 �1.2 4.8 �3.6 �0.4 4.4 1.2Oil price �4.7 2.1 �6.1 �31.8 38.3 56.2 �13.7 2.4 15.9 �10.0Non-oil commodity prices �2.2 �1.4 2.2 �15.7 �11.2 �1.3 �9.1 5.1 10.0 10.4
Terms of trade (GNFS)World �0.4 �0.2 �0.3 0.0 �0.4 �0.9 �0.5 0.4 �0.2 �0.4High-income 0.4 0.0 �0.4 1.0 �0.5 �2.4 �0.1 0.6 0.1 0.1Developing countries �2.4 �1.0 0.1 �3.9 �0.3 5.0 �1.8 �0.2 �0.8 �1.5
Severely indebted �3.5 �0.2 0.6 �6.3 �0.5 5.6 �2.9 �1.4 0.1 �2.8Moderately indebted �2.3 �1.1 �1.6 �4.4 0.5 8.0 �3.2 1.6 1.1 �3.2Less indebted �2.1 �1.0 1.5 �2.6 0.0 2.7 �0.9 �1.1 �1.9 �0.2Middle-income countries �2.3 �1.2 �0.4 �4.2 0.1 5.2 �1.7 0.5 �0.7 �1.4
Upper-middle-income countries �2.4 �0.1 0.1 �5.8 0.7 6.2 �1.2 0.4 �1.1 �1.6Lower-middle-income countries �1.9 �1.7 �0.5 �2.6 �0.4 4.2 �2.0 0.5 �0.3 �1.4
Low-income countries �2.5 0.4 3.3 �3.4 �1.0 3.3 �2.9 �4.3 �1.8 �2.3
East Asia and Pacific 0.2 1.1 1.2 0.8 �1.1 �0.9 �1.3 0.3 0.4 �0.9Europe and Central Asia �1.6 �2.3 �1.2 �1.3 �1.5 7.0 �1.0 0.8 �0.1 �1.7Latin America and the Caribbean �2.9 0.0 1.1 �5.2 1.6 5.5 �3.0 �0.6 �1.1 0.0Middle East and North Africa �3.4 �1.4 �1.7 �16.9 0.2 23.9 �4.0 �3.6 �6.9 �6.3South Asia 0.4 0.9 9.6 5.8 �8.8 �5.6 �2.7 �7.1 �5.0 �1.0Sub-Saharan Africa �3.6 0.1 �5.3 �9.5 4.0 9.6 �2.1 2.7 4.9 �4.5
Global export volumes (GNFS)World 4.8 6.7 10.1 4.2 5.5 13.0 0.4 3.7 4.6 8.7
High-income 5.1 6.8 10.4 4.1 5.6 12.3 �0.4 2.4 2.2 7.4Developing countries 3.6 6.7 9.3 4.8 5.0 15.4 3.5 8.5 13.5 13.0
Severely indebted 3.2 5.8 7.8 6.3 �5.6 11.2 5.8 4.1 9.1 10.4Moderately indebted 4.2 4.6 7.7 3.0 6.6 13.1 0.9 5.4 7.4 11.7Less indebted 3.0 7.8 10.6 5.5 7.1 18.4 4.6 11.7 18.5 14.2Middle-income countries 3.8 6.7 10.2 4.2 6.5 15.2 3.3 8.5 14.0 13.3
Upper-middle-income countries 3.1 8.9 10.0 7.2 6.1 13.4 0.1 2.2 6.7 12.4Lower-middle-income countries 4.0 4.6 9.7 2.2 6.4 16.6 5.5 12.5 18.3 13.6
Low-income countries 2.1 7.0 3.8 8.6 �5.1 17.0 5.0 8.4 9.8 10.9
East Asia and Pacific 6.4 11.5 13.9 3.2 4.1 22.6 2.4 15.6 21.1 18.3Europe and Central Asia 2.6 1.2 8.3 5.8 3.9 16.0 6.1 7.1 13.5 10.3Latin America and the Caribbean 5.5 8.7 9.9 7.9 6.6 10.3 1.1 2.6 5.4 11.2Middle East and North Africa 0.9 5.0 2.5 �1.7 3.7 7.8 3.4 �0.4 7.3 6.4South Asia 5.6 11.1 �0.1 9.1 12.5 21.2 7.3 17.3 16.4 11.2Sub-Saharan Africa 1.5 4.3 5.0 4.0 3.9 5.1 3.2 1.9 1.7 5.1
Note: GNFS � goods and nonfactor services; e � estimate; f � forecast.
gdf_174-233.qxd 4/6/04 12:58 PM Page 193

A P P E N D I X B : S U M M A R Y S T A T I S T I C A L T A B L E S
194
Table B.17 Global current account balances, 1999–2004$ billions
Percent of GDP (2002)
Merchandise Services Income Transfers,balance balance balance net 1999 2000 2001 2002 2003e 2004f
World 0.0 0.0 �0.3 �0.1 �139.7 �187.3 �192.4 �137.7 �219.9 �249.1
High income �0.7 0.2 0.1 �0.5 �132.8 �243.5 �213.5 �216.2 �295.7 �273.4Industrial countries �0.7 0.2 0.1 �0.5 �159.5 �277.4 �245.3 �251.4 �344.3 �319.0
European Union (15) 1.5 0.2 �0.3 �0.7 �21.1 �60.0 �5.1 64.4 16.6 61.7Japan 2.3 �1.1 1.6 �0.1 114.6 119.7 87.8 112.4 139.1 143.3United States �4.6 0.6 0.0 �0.6 �290.9 �411.5 �393.7 �480.9 �557.1 �589.6
Other high income 2.2 2.2 0.1 0.0 26.7 33.9 31.9 35.2 48.6 45.6Asian NIEs 2.5 3.9 0.3 �0.5 25.5 20.4 26.1 33.1 40.0 37.7
Developing countries 3.0 �0.8 �2.0 1.5 �6.9 56.2 21.0 78.5 75.8 24.2Excluding China 2.8 �0.9 �2.3 1.6 �28.1 35.7 3.6 43.1 49.4 12.6Excluding Central Europe & CIS 3.1 �0.9 �2.1 1.5 �6.7 30.2 7.8 70.8 60.7 26.7Severely indebted 6.0 �2.5 �4.3 2.1 �38.7 �23.4 �26.3 5.6 13.2 2.4Moderately indebted 5.4 �0.6 �2.2 1.1 44.8 70.1 47.1 44.7 48.3 34.0Less indebted 1.2 �0.4 �1.3 1.4 �13.1 9.5 0.3 28.3 14.4 �12.2Middle-income countries 3.3 �0.7 �2.0 1.0 1.0 51.3 19.4 70.3 71.7 24.6
Upper-middle-income countries 3.9 �1.1 �2.8 0.0 �59.9 �33.1 �40.1 �2.1 6.9 �2.7Lower-middle-income countries 3.0 �0.4 �1.4 1.7 60.9 84.4 59.4 72.4 64.8 27.3
Low-income countries 1.2 �1.3 �2.2 3.8 �7.9 4.9 1.6 8.2 4.2 �0.4
East Asia and Pacific 5.3 �1.2 �1.5 0.8 60.0 53.3 39.4 61.0 51.3 38.9China 3.5 �0.5 �1.2 1.0 21.1 20.5 17.4 35.4 26.4 —Indonesia — — — — 5.8 8.0 6.9 7.5 4.0 —
Europe and Central Asia 1.1 0.3 �2.0 1.4 �1.6 16.2 16.6 6.3 7.5 �7.8Russian Federation 13.5 �3.1 �1.8 0.0 24.6 46.8 33.6 29.9 41.5 —Turkey �4.5 4.3 �2.5 1.9 �1.3 �9.8 3.4 �1.5 �7.6 —Poland �3.8 0.4 �1.0 1.7 �12.5 �10.0 �5.4 �5.0 �5.0 —
Latin America and the Caribbean 1.4 �0.9 �3.1 1.7 �56.6 �46.8 �54.0 �15.4 �4.4 �10.1Brazil 2.9 �1.1 �4.0 0.5 �25.4 �24.2 �23.2 �7.7 2.0 —Mexico �1.2 �0.8 �1.8 1.6 �14.0 �18.2 �18.1 �14.0 �12.0 —Argentina 16.9 �1.6 �6.3 0.4 �12.0 �8.9 �4.0 9.6 8.3 —
Middle East and North Africa 9.5 �2.3 �1.1 �0.8 6.1 39.5 24.8 25.7 26.0 14.5Saudi Arabia — — — — 0.4 14.3 9.4 11.7 12.5 —Iran, Islamic Rep. of — — — — 6.6 12.6 4.1 2.9 0.8 —Egypt, Arab Rep. of �6.4 3.0 �0.3 4.4 �1.6 �1.0 �0.4 0.6 1.2 —
South Asia �2.7 1.0 �1.0 4.1 �5.2 �4.1 2.8 8.9 5.3 4.3India �2.4 1.2 �0.8 2.9 �3.2 �2.6 1.8 4.7 1.3 —
Sub-Saharan Africa 4.8 �3.2 �3.8 2.6 �9.7 �1.9 �8.6 �8.0 �9.8 �15.4South Africa 4.2 �0.8 �2.6 �0.5 �0.6 �0.6 �0.3 0.3 �2.3 —Nigeria — — — — 0.5 3.5 �0.3 �2.1 �1.6 —
Note: — � not available; e � estimate; f � forecast.
gdf_174-233.qxd 4/6/04 12:58 PM Page 194

C U R R E N T A C C O U N T
195
Table B.18 Global current account balances, 1981–2004% of GDP
Average
1981–90 1991–2000 1997 1998 1999 2000 2001 2002 2003e 2004f
World �0.5 �0.2 0.0 �0.3 �0.5 �0.6 �0.6 �0.5 �0.6 �0.6
High-income �0.2 0.1 0.3 0.1 �0.5 �1.0 �0.9 �0.9 �1.0 �0.9Industrial countries �0.4 �0.1 0.3 0.0 �0.7 �1.2 �1.0 �1.1 �1.2 �1.0
European Union (15) 0.1 0.2 1.1 0.5 �0.3 �0.8 �0.1 0.6 0.2 0.5Japan 2.3 2.4 2.2 3.0 2.6 2.5 2.1 2.8 3.2 3.1United States �1.9 �1.8 �1.5 �2.3 �3.1 �4.2 �3.9 �4.6 �5.1 �5.1
Other high-income 10.5 4.0 3.1 5.7 6.9 8.0 7.8 8.5 11.1 9.7Asian NIEs 6.9 5.2 3.4 9.3 10.5 7.9 10.5 13.3 15.9 13.8
Developing countries �1.6 �1.6 �1.4 �1.8 �0.1 1.0 0.4 1.3 1.1 0.3Excluding China �1.8 �2.3 �2.4 �2.8 �0.6 0.8 0.1 0.9 0.9 0.2Excluding Central Europe & CIS �1.7 �1.6 �1.2 �1.5 �0.1 0.6 0.2 1.4 1.1 0.4Severely indebted �2.2 �2.5 �3.5 �4.4 �3.1 �1.8 �2.1 0.5 1.1 0.2Moderately indebted �2.0 �1.5 �1.8 0.4 3.9 5.5 3.8 3.4 3.0 1.9Less indebted �1.1 �1.2 0.0 �1.4 �0.4 0.3 0.0 0.8 0.3 �0.3Middle-income countries �1.3 �1.6 �1.2 �1.6 0.1 1.1 0.4 1.5 1.3 0.4
Upper-middle-income countries �1.5 �2.9 �3.2 �4.3 �2.8 �1.4 �1.7 �0.1 0.3 �0.1Lower-middle-income countries �1.2 �0.2 0.5 1.0 2.7 3.4 2.3 2.7 2.0 0.8
Low-income countries �2.7 �2.0 �2.2 �2.9 �0.8 0.5 0.1 0.7 0.3 �0.1
East Asia and Pacific �1.4 0.5 1.2 4.5 4.2 3.5 2.4 3.4 2.6 1.7China 0.2 1.6 4.1 3.3 2.1 1.9 1.5 2.8 1.9 0.7Indonesia �3.1 �0.4 �2.3 4.1 4.1 5.3 4.9 4.3 2.0 2.7
Europe and Central Asia �0.5 �2.5 �2.5 �2.5 0.0 1.9 1.9 0.8 0.6 �0.5Russian Federation — — 0.0 0.1 12.6 18.0 10.8 8.6 9.8 5.9Turkey �1.3 �1.1 �1.4 1.0 �0.7 �4.9 2.3 �0.8 �3.2 �2.0Poland �1.4 �3.7 �3.9 �4.4 �8.1 �6.1 �2.9 �2.6 �2.4 �1.4
Latin America and the Caribbean �1.5 �2.8 �3.3 �4.5 �3.2 �2.4 �2.8 �0.9 �0.3 �0.5Brazil �1.1 �2.1 �3.8 �4.3 �4.7 �4.0 �4.6 �1.7 0.4 �0.7Mexico �0.8 �3.7 �1.9 �3.8 �2.9 �3.1 �2.9 �2.2 �2.0 �2.3Argentina �2.2 �3.1 �4.2 �4.9 �4.2 �3.1 �1.5 9.4 6.5 4.8
Middle East and North Africa �1.7 �2.0 1.0 �4.2 1.2 7.2 4.4 4.6 4.6 2.5Saudi Arabia �7.3 �6.6 0.2 �9.0 0.3 7.6 5.0 6.1 6.6 4.6Iran, Islamic Rep. of �0.4 1.9 2.2 �2.1 6.6 12.5 3.6 2.7 0.7 �3.1Egypt, Arab Rep. of �3.4 1.5 �0.9 �3.1 �1.8 �1.0 �0.4 0.7 1.7 2.1
South Asia �2.0 �1.5 �1.0 �1.8 �0.9 �0.7 0.5 1.4 0.7 0.5India �1.7 �1.2 �0.7 �1.7 �0.7 �0.6 0.4 0.9 0.2 0.0
Sub-Saharan Africa �2.7 �2.0 �2.2 �5.5 �3.0 �0.6 �3.1 �2.8 �2.6 �3.7South Africa 0.4 �0.2 �1.5 �1.7 �0.5 �0.5 �0.3 0.3 �1.4 �1.4Nigeria �0.7 0.4 1.5 �13.2 1.4 8.4 �0.6 �4.6 �3.2 �6.8
Note: — � not available; e � estimate; f � forecast.
gdf_174-233.qxd 4/6/04 12:58 PM Page 195

A P P E N D I X B : S U M M A R Y S T A T I S T I C A L T A B L E S
196
Table B.19 Workers’ remittances received by developing countries, 1995–2003$ billions
1995 1996 1997 1998 1999 2000 2001 2002 2003e
All developing countries 51.1 56.0 66.1 62.9 67.6 68.4 77.0 88.1 93.0
East Asia and Pacific 9.9 11.4 15.9 9.8 12.1 12.2 13.7 17.0 17.6China 0.4 1.7 4.6 0.3 0.5 0.8 1.2 2.4 2.4Indonesia 0.4 0.8 0.7 1.0 1.1 1.2 1.0 1.3 1.3Malaysia 0.1 0.2 0.2 0.2 0.3 0.3 0.4 0.4 0.4Philippines 5.4 4.9 6.8 5.1 6.9 6.2 6.2 7.4 8.0Thailand 3.4 3.6 3.3 2.8 2.9 3.4 2.5 2.8 2.8
Europe and Central Asia 5.6 6.3 7.3 10.5 9.3 9.7 10.2 10.3 10.4Albania 0.4 0.6 0.3 0.5 0.4 0.6 0.7 0.7 0.7Croatia 0.5 0.7 0.6 0.6 0.5 0.6 0.7 0.8 0.8Poland 0.7 0.8 0.8 1.1 0.8 0.8 1.1 1.4 1.4Russian Federation 0.2 0.1 0.2 0.3 0.4 0.5 0.6 0.8 0.8Turkey 3.3 3.5 4.2 5.4 4.5 4.6 2.8 1.9 1.9
Latin America and the Caribbean 12.9 12.9 13.8 15.2 16.9 19.2 22.9 26.8 29.6Brazil 3.0 2.1 1.6 1.2 1.5 1.3 1.4 2.0 2.0Colombia 0.8 0.8 0.8 0.8 1.3 1.6 2.0 2.4 2.5Dominican Republic 0.8 1.0 1.1 1.4 1.6 1.8 2.0 2.2 2.2El Salvador 1.1 1.1 1.2 1.3 1.4 1.8 1.9 2.0 2.1Mexico 4.4 5.0 5.5 6.5 6.6 7.6 9.9 11.0 13.2
Middle East and North Africa 10.0 10.5 10.8 10.6 10.7 11.0 13.2 13.0 13.0Egypt, Arab Rep. of 3.2 3.1 3.7 3.4 3.2 2.9 2.9 2.9 2.9Jordan 1.2 1.5 1.7 1.5 1.7 1.8 2.0 2.1 2.0Lebanon 1.2 1.2 1.2 1.2 1.4 1.6 2.3 2.3 2.1Morocco 2.0 2.2 1.9 2.0 1.9 2.2 3.3 2.9 3.2
South Asia 10.0 12.3 14.6 13.3 15.1 12.8 13.1 16.9 18.2Bangladesh 1.2 1.3 1.5 1.6 1.8 2.0 2.1 2.9 3.2India 6.2 8.8 10.3 9.5 11.1 8.5 8.2 8.4 8.4Pakistan 1.7 1.3 1.7 1.2 1.0 1.1 1.5 3.6 4.2Sri Lanka 0.8 0.8 0.9 1.0 1.1 1.2 1.2 1.3 1.5
Sub-Saharan Africa 2.7 2.7 3.7 3.6 3.5 3.5 3.9 4.1 4.1Lesotho 0.4 0.4 0.4 0.3 0.3 0.3 0.2 0.2 0.2Nigeria 0.8 0.9 1.9 1.6 1.3 1.3 1.3 1.3 1.3Senegal 0.1 0.2 0.2 0.1 0.2 0.2 0.2 0.2 0.2Sudan 0.3 0.2 0.4 0.7 0.7 0.6 0.7 1.0 1.0
Note: e � estimate.
gdf_174-233.qxd 4/6/04 12:58 PM Page 196

C U R R E N T A C C O U N T
197
Table B.20 Net official development assistance from DAC countries, 1995–2002$ billions
1995 1996 1997 1998 1999 2000 2001 2002
Total ODA 58.9 55.6 48.5 52.1 56.4 53.7 52.3 58.3Australia 1.2 1.1 1.1 1.0 1.0 1.0 0.9 1.0Austria 0.8 0.6 0.5 0.5 0.5 0.4 0.5 0.5Belgium 1.0 0.9 0.8 0.9 0.8 0.8 0.9 1.1Canada 2.1 1.8 2.0 1.7 1.7 1.7 1.5 2.0Denmark 1.6 1.8 1.6 1.7 1.7 1.7 1.6 1.6Finland 0.4 0.4 0.4 0.4 0.4 0.4 0.4 0.5France 8.4 7.5 6.3 5.7 5.6 4.1 4.2 5.5Germany 7.5 7.6 5.9 5.6 5.5 5.0 5.0 5.3Greece — 0.2 0.2 0.2 0.2 0.2 0.2 0.3Ireland 0.2 0.2 0.2 0.2 0.2 0.2 0.3 0.4Italy 1.6 2.4 1.3 2.3 1.8 1.4 1.6 2.3Japan 14.5 9.4 9.4 10.6 15.3 13.5 9.8 9.3Luxembourg 0.1 0.1 0.1 0.1 0.1 0.1 0.1 0.1Netherlands 3.2 3.2 2.9 3.0 3.1 3.1 3.2 3.3New Zealand 0.1 0.1 0.2 0.1 0.1 0.1 0.1 0.1Norway 1.2 1.3 1.3 1.3 1.4 1.3 1.3 1.7Portugal 0.3 0.2 0.3 0.3 0.3 0.3 0.3 0.3Spain 1.3 1.3 1.2 1.4 1.4 1.2 1.7 1.7Sweden 1.7 2.0 1.7 1.6 1.6 1.8 1.7 2.0Switzerland 1.1 1.0 0.9 0.9 1.0 0.9 0.9 0.9United Kingdom 3.2 3.2 3.4 3.9 3.4 4.5 4.6 4.9United States 7.4 9.4 6.9 8.8 9.1 10.0 11.4 13.3
Note: — � not available.
gdf_174-233.qxd 4/6/04 12:58 PM Page 197

A P P E N D I X B : S U M M A R Y S T A T I S T I C A L T A B L E S
198
Table B.21 External financing: all developing countries, 1997–2003$ billions
1997 1998 1999 2000 2001 2002 2003e
Current account balance �83.7 �102.4 �6.9 56.2 21.0 78.5 75.8as % GDP �1.4 �1.8 �0.1 1.0 0.4 1.3 1.1
Financed by:Net equity flows 193.7 182.1 194.4 174.8 179.4 152.0 149.5
Net FDI inflows 171.1 175.6 181.7 162.2 175.0 147.1 135.2Net portfolio equity inflows 22.6 6.6 12.6 12.6 4.4 4.9 14.3
Net debt flows 105.3 57.6 13.8 �9.8 �1.2 7.3 44.3
Official creditors 13.2 34.2 13.7 �5.9 26.9 4.1 �6.3World Bank 9.2 8.7 8.8 7.9 7.5 �0.2 �1.9IMF 3.4 14.1 �2.2 �10.6 19.5 14.0 8.0Others 0.6 11.4 7.1 �3.1 �0.1 �9.7 �12.4
Private creditors 92.2 23.4 0.1 �3.9 �28.1 3.2 50.6Net medium- and long-term debt flows 84.2 87.0 22.4 5.2 �5.3 1.8 18.6
Bonds 38.2 39.7 29.8 16.5 12.2 12.7 33.1Banks 43.9 52.4 �5.1 �5.8 �10.2 �3.9 �6.6Others 2.0 �5.1 �2.3 �5.5 �7.3 �7.0 �7.9
Net short-term debt flows 8.0 �63.6 �22.3 �9.1 �22.9 1.4 32.0
Balancing itema �162.5 �120.7 �163.1 �168.6 �119.0 �65.0 6.3
Change in reserves (� � increase) �52.8 �16.6 �38.1 �52.6 �80.2 �172.9 �276.0
Memo items:Bilateral aid grants 25.3 26.7 28.5 28.7 27.9 31.2 34.3(excluding technical cooperation grants)
Net private flows (debt � equity) 285.8 205.5 194.5 170.9 151.3 155.3 200.2Net official flows (aid � debt) 38.4 60.9 42.2 22.8 54.8 35.3 28.0Workers’ remittances 66.1 62.9 67.6 68.4 77.0 88.1 93.0
Note: e � estimate.a. Combination of errors and omissions and net acquisition of foreign assets (including FDI) by developing countries.
gdf_174-233.qxd 4/6/04 12:58 PM Page 198

C A P I T A L A C C O U N T
199
Table B.22 External financing: East Asia and Pacific, 1997–2003$ billions
1997 1998 1999 2000 2001 2002 2003e
Current account balance 17.0 59.4 60.0 53.3 39.4 61.0 51.3as % GDP 1.2 4.5 4.2 3.5 2.4 3.4 2.6
Financed by:Net equity flows 58.2 54.2 52.3 49.0 49.2 58.3 61.6
Net FDI inflows 62.1 57.7 50.0 44.2 48.2 54.8 56.8Net portfolio equity inflows �3.9 �3.4 2.3 4.8 1.0 3.5 4.8
Net debt flows 44.9 �32.5 �12.2 �17.7 �8.1 �10.9 0.5
Official creditors 17.3 14.7 12.6 7.0 3.2 �7.8 �8.9World Bank 2.0 2.8 2.4 1.8 0.9 �1.7 �1.5IMF 5.9 7.0 1.9 1.2 �2.5 �2.7 �0.5Others 9.3 4.8 8.2 3.9 4.8 �3.4 �6.9
Private creditors 27.6 �47.1 �24.7 �24.7 �11.3 �3.1 9.4Net medium- and long-term debt flows 22.9 �3.8 �10.9 �14.6 �12.0 �10.8 �2.7
Bonds 13.3 0.7 0.9 �1.6 0.7 0.8 5.8Banks 4.0 �4.8 �11.4 �11.6 �10.9 �9.4 �4.9Others 5.7 0.3 �0.4 �1.3 �1.8 �2.2 �3.5
Net short-term debt flows 4.7 �43.3 �13.9 �10.1 0.7 7.7 12.1
Balancing itema �107.3 �60.5 �70.8 �74.5 �32.9 �20.4 22.8
Change in reserves (� � increase) �12.8 �20.7 �29.3 �10.1 �47.7 �88.0 �136.2
Memo items:Bilateral aid grants 2.4 2.5 2.5 2.5 2.2 2.2 2.2(excluding technical cooperation grants)
Net private flows (debt � equity) 85.8 7.1 27.5 24.3 38.0 55.2 71.0Net official flows (aid � debt) 19.6 17.1 15.1 9.5 5.4 �5.6 �6.7Workers’ remittances 15.9 9.8 12.1 12.2 13.7 17.0 17.6
Note: e � estimate.a. Combination of errors and omissions and net acquisition of foreign assets (including FDI) by developing countries.
gdf_174-233.qxd 4/6/04 12:58 PM Page 199

A P P E N D I X B : S U M M A R Y S T A T I S T I C A L T A B L E S
200
Table B.23 External financing: Europe and Central Asia, 1997–2003$ billions
1997 1998 1999 2000 2001 2002 2003e
Current account balance �26.8 �25.1 �1.6 16.2 16.6 6.3 7.5 as % GDP �2.5 �2.5 0.0 1.9 1.9 0.8 0.6
Financed by:Net equity flows 26.7 30.1 30.4 30.5 32.1 32.5 26.9
Net FDI inflows 22.6 26.2 28.4 29.3 31.8 32.9 26.2Net portfolio equity inflows 4.0 4.0 2.0 1.2 0.3 �0.4 0.7
Net debt flows 32.8 41.5 16.1 21.0 2.0 24.9 29.5
Official creditors 6.6 7.4 �0.7 �0.1 2.0 2.2 �6.5 World Bank 3.9 1.5 1.9 2.1 2.1 1.0 �0.7 IMF 2.4 5.3 �3.1 �0.7 6.1 4.6 �2.1 Others 0.3 0.6 0.5 �1.5 �6.2 �3.4 �3.7
Private creditors 26.3 34.1 16.9 21.1 0.1 22.7 36.0 Net medium- and long-term debt flows 17.7 29.7 17.9 11.6 6.8 21.2 18.9
Bonds 9.2 16.0 8.2 5.3 1.6 4.1 13.9 Banks 8.4 14.8 10.6 8.0 7.4 18.7 7.1 Others 0.1 �1.1 �0.9 �1.7 �2.1 �1.6 �2.0
Net short-term debt flows 8.5 4.4 �1.0 9.5 �6.8 1.4 17.1
Balancing itema �25.4 �41.7 �37.7 �50.9 �40.4 �18.8 �3.1
Change in reserves (� � increase) �7.3 �4.9 �7.2 �16.8 �10.3 �44.9 �60.7
Memo items:Bilateral aid grants 5.4 5.4 8.2 8.6 7.1 8.5 9.1 (excluding technical cooperation grants)
Net private flows (debt � equity) 52.9 64.2 47.2 51.5 32.2 55.2 62.9 Net official flows (aid � debt) 12.0 12.8 7.5 8.5 9.1 10.7 2.5 Workers’ remittances 7.3 10.5 9.3 9.7 10.2 10.3 10.4
Note: e � estimate.a. Combination of errors and omissions and net acquisition of foreign assets (including FDI) by developing countries.
gdf_174-233.qxd 4/6/04 12:58 PM Page 200

C A P I T A L A C C O U N T
201
Table B.24 External financing: Latin America and the Caribbean, 1997–2003$ billions
1997 1998 1999 2000 2001 2002 2003e
Current account balance �66.0 �90.3 �56.6 �46.8 �54.0 �15.4 �4.4as % GDP �3.3 �4.5 �3.2 �2.4 �2.8 �0.9 �0.3
Financed by:Net equity flows 80.0 71.7 84.4 76.5 72.2 46.2 38.0
Net FDI inflows 66.7 73.8 88.0 77.0 69.9 44.7 36.6Net portfolio equity inflows 13.3 �2.2 �3.6 �0.5 2.3 1.5 1.4
Net debt flows 25.4 38.0 12.1 �9.7 6.3 �7.9 19.5
Official creditors �8.7 10.9 1.5 �11.1 20.4 12.7 10.2World Bank 0.8 2.4 2.1 2.0 1.3 �0.3 �0.5IMF �3.9 2.5 �0.9 �10.7 15.6 11.9 11.4Others �5.5 5.9 0.3 �2.4 3.5 1.2 �0.7
Private creditors 34.1 27.2 10.6 1.4 �14.1 �20.6 9.3Net medium- and long-term debt flows 41.7 54.7 18.5 4.0 �0.7 �11.6 6.7
Bonds 10.8 17.3 19.3 5.2 3.6 0.5 13.2Banks 31.9 39.1 �1.5 �0.3 �2.7 �10.3 �5.8Others �1.0 �1.7 0.8 �0.9 �1.7 �1.8 �0.7
Net short-term debt flows �7.7 �27.6 �7.9 �2.6 �13.4 �9.0 2.6
Balancing itema �25.9 �28.6 �47.4 �17.1 �21.6 �22.8 �20.2
Change in reserves (� � increase) �13.5 9.2 7.5 �2.9 �2.9 �0.1 �32.9
Memo items:Bilateral aid grants 2.7 3.2 2.9 2.5 3.2 2.7 2.9(excluding technical cooperation grants)
Net private flows (debt � equity) 114.1 98.8 95.0 78.0 58.1 25.6 47.3Net official flows (aid � debt) �6.0 14.0 4.4 �8.7 23.6 15.5 13.1Workers’ remittances 13.8 15.2 16.9 19.2 22.9 26.8 29.6
Note: e � estimate.a. Combination of errors and omissions and net acquisition of foreign assets (including FDI) by developing countries.
gdf_174-233.qxd 4/6/04 12:58 PM Page 201

A P P E N D I X B : S U M M A R Y S T A T I S T I C A L T A B L E S
202
Table B.25 External financing: Middle East and North Africa, 1997–2003$ billions
1997 1998 1999 2000 2001 2002 2003e
Current account balance 5.1 �19.8 6.1 39.5 24.8 25.7 26.0as % GDP 1.0 �4.2 1.2 7.2 4.4 4.6 4.6
Financed by:Net equity flows 7.0 7.6 3.6 2.7 5.7 2.4 2.0
Net FDI inflows 6.3 7.4 2.9 2.4 5.8 2.7 2.0 Net portfolio equity inflows 0.7 0.2 0.6 0.2 �0.1 �0.3 0.0
Net debt flows �2.9 7.1 �1.8 �6.1 0.9 0.9 �7.8
Official creditors �3.7 �1.5 �2.5 �2.8 �1.1 �2.8 �2.0 World Bank �0.3 �0.2 0.2 �0.3 �0.1 �0.3 �0.3 IMF 0.3 0.0 0.0 �0.2 �0.1 �0.3 �0.5 Others �3.8 �1.3 �2.7 �2.3 �0.9 �2.3 �1.2
Private creditors 0.8 8.6 0.6 �3.4 2.0 3.8 �5.7 Net medium- and long-term debt flows �0.2 3.9 �0.4 0.5 2.3 3.0 �5.7
Bonds 1.5 1.3 1.4 1.2 4.4 5.0 �0.8 Banks �0.1 3.8 �0.6 0.9 �1.1 �1.5 �4.2 Others �1.7 �1.3 �1.2 �1.6 �1.0 �0.5 �0.7
Net short-term debt flows 1.1 4.7 1.0 �3.9 �0.3 0.8 �0.1
Balancing itema �2.5 3.6 �5.2 �23.8 �22.6 �16.8 �11.0
Change in reserves (� � increase) �6.6 1.5 �2.6 �12.2 �8.8 �12.2 �9.2
Memo items:Bilateral aid grants 3.0 3.5 2.7 3.1 2.2 2.4 3.6 (excluding technical cooperation grants)
Net private flows (debt � equity) 7.8 16.3 4.2 �0.7 7.7 6.1 �3.8 Net official flows (aid � debt) �0.7 1.9 0.2 0.3 1.1 �0.4 1.6 Workers’ remittances 10.8 10.6 10.7 11.0 13.2 13.0 13.0
Note: e � estimate.a. Combination of errors and omissions and net acquisition of foreign assets (including FDI) by developing countries.
gdf_174-233.qxd 4/6/04 12:58 PM Page 202

C A P I T A L A C C O U N T
203
Table B.26 External financing: South Asia, 1997–2003$ billions
1997 1998 1999 2000 2001 2002 2003e
Current account balance �5.4 �9.4 �5.2 �4.1 2.8 8.9 5.3 as % GDP �1.0 �1.8 �0.9 �0.7 0.5 1.4 0.7
Financed by:Net equity flows 7.8 2.9 5.5 6.2 6.9 5.2 12.1
Net FDI inflows 4.9 3.5 3.1 3.4 5.0 4.2 5.1 Net portfolio equity inflows 2.9 �0.6 2.4 2.8 1.9 1.0 7.0
Net debt flows 0.7 4.7 0.5 3.4 �0.7 0.4 �2.3
Official creditors 0.3 2.3 2.5 0.5 2.2 �2.4 �0.6 World Bank 1.1 0.8 1.0 0.7 1.5 �1.0 �0.8 IMF �0.8 �0.4 �0.1 �0.3 0.3 0.1 �0.2 Others 0.0 2.0 1.6 0.1 0.4 �1.4 0.4
Private creditors 0.4 2.4 �2.0 2.9 �2.8 2.8 �1.7 Net medium- and long-term debt flows 2.5 3.7 �2.1 3.9 �1.8 0.5 �2.9
Bonds 2.3 4.2 �1.2 5.4 0.0 �0.5 �4.1 Banks 1.3 0.7 �0.5 �2.0 �1.4 1.0 1.1 Others �1.1 �1.1 �0.4 0.5 �0.3 �0.1 0.2
Net short-term debt flows �2.1 �1.3 0.1 �1.0 �1.1 2.3 1.2
Balancing itema 2.1 4.8 4.2 �0.9 1.2 12.4 19.5
Change in reserves (� � increase) �5.2 �3.0 �5.0 �4.7 �10.2 �27.0 �34.6
Memo items:Bilateral aid grants 2.1 2.1 2.3 2.1 3.2 2.5 2.6 (excluding technical cooperation grants)
Net private flows (debt � equity) 8.2 5.3 3.5 9.2 4.0 8.0 10.4 Net official flows (aid � debt) 2.4 4.5 4.8 2.6 5.3 0.1 2.0 Workers’ remittances 14.6 13.3 15.1 12.8 13.1 16.9 18.2
Note: e � estimate.a. Combination of errors and omissions and net acquisition of foreign assets (including FDI) by developing countries.
gdf_174-233.qxd 4/6/04 12:58 PM Page 203

A P P E N D I X B : S U M M A R Y S T A T I S T I C A L T A B L E S
204
Table B.27 External financing: Sub-Saharan Africa, 1997–2003$ billions
1997 1998 1999 2000 2001 2002 2003e
Current account balance �7.6 �17.3 �9.7 �1.9 �8.6 �8.0 �9.8as % GDP �2.2 �5.5 �3.0 �0.6 �3.1 �2.8 �2.6
Financed by:Net equity flows 14.0 15.6 18.3 9.9 13.3 7.4 9.0
Net FDI inflows 8.4 6.9 9.3 5.8 14.3 7.8 8.5Net portfolio equity inflows 5.6 8.7 9.0 4.1 �1.0 �0.4 0.5
Net debt flows 4.4 �1.3 �1.0 �0.7 �1.8 �0.1 4.9
Official creditors 1.4 0.4 0.3 0.6 0.2 2.2 1.5World Bank 1.7 1.3 1.1 1.5 1.8 2.2 1.9IMF �0.5 �0.3 0.0 0.1 0.1 0.5 �0.2Others 0.3 �0.6 �0.8 �1.0 �1.7 �0.5 �0.3
Private creditors 3.0 �1.8 �1.3 �1.3 �2.0 �2.2 3.4Net medium- and long-term debt flows �0.4 �1.3 �0.6 �0.2 0.1 �0.5 4.3
Bonds 1.0 0.3 1.2 1.0 1.9 2.7 5.2Banks �1.7 �1.2 �1.6 �0.8 �1.5 �2.4 0.1Others 0.2 �0.3 �0.2 �0.5 �0.3 �0.8 �1.1
Net short-term debt flows 3.5 �0.5 �0.6 �1.0 �2.0 �1.8 �0.9
Balancing itema �3.4 1.6 �6.1 �1.5 �2.7 1.4 �1.7
Change in reserves (� � increase) �7.5 1.4 �1.5 �5.8 �0.3 �0.7 �2.4
Memo items:Bilateral aid grants 9.6 10.1 9.9 10.0 10.0 13.0 13.9(excluding technical cooperation grants)
Net private flows (debt � equity) 17.0 13.8 17.0 8.6 11.3 5.2 12.4Net official flows (aid � debt) 11.0 10.6 10.2 10.6 10.3 15.1 15.4Workers’ remittances 3.7 3.6 3.5 3.5 3.9 4.1 4.1
Note: e � estimate.a. Combination of errors and omissions and net acquisition of foreign assets (including FDI) by developing countries.
gdf_174-233.qxd 4/6/04 12:58 PM Page 204

C A P I T A L A C C O U N T
205
Table B.28 Net inward foreign direct investment, 1995–2003$ billions
1995 1996 1997 1998 1999 2000 2001 2002 2003e
All developing countries 105.3 127.6 171.1 175.6 181.7 162.2 175.0 147.1 135.2
East Asia and Pacific 50.8 58.6 62.1 57.7 50.0 44.2 48.2 54.8 56.8China 35.8 40.2 44.2 43.8 38.8 38.4 44.2 49.3 53.5Malaysia 4.2 5.1 5.1 2.2 3.9 3.8 0.6 3.2 1.6Philippines 1.5 1.5 1.2 2.3 1.7 1.3 1.0 1.1 0.4Thailand 2.1 2.3 3.9 7.3 6.1 3.4 3.8 0.9 1.5Vietnam 1.8 2.4 2.2 1.7 1.4 1.3 1.3 1.4 1.3
Europe and Central Asia 17.4 16.4 22.6 26.2 28.4 29.3 31.8 32.9 26.2Czech Republic 2.6 1.4 1.3 3.7 6.3 5.0 5.6 9.3 3.5Hungary 4.9 2.4 2.2 2.1 2.0 1.7 2.6 0.9 0.0Poland 3.7 4.5 4.9 6.4 7.3 9.3 5.7 4.1 4.0Russian Federation 2.1 2.6 4.9 2.8 3.3 2.7 2.5 3.0 4.1Slovak Republic 0.2 0.4 0.2 0.6 0.4 2.1 1.6 4.0 1.1
Latin America and the Caribbean 30.5 44.3 66.7 73.8 88.0 77.0 69.9 44.7 36.6Argentina 5.6 6.9 9.2 7.3 24.0 10.4 2.2 0.8 0.4Brazil 4.9 11.2 19.7 31.9 28.6 32.8 22.5 16.6 10.1Chile 3.0 5.0 5.3 4.8 9.0 3.6 4.5 1.7 2.4Mexico 9.5 9.2 12.8 11.9 13.1 16.1 26.2 14.6 11.5Venezuela, R. B. de 1.0 2.2 6.2 5.0 2.9 4.7 3.7 0.7 2.5
Middle East and North Africa �0.7 0.6 6.3 7.4 2.9 2.4 5.8 2.7 2.0Algeria 0.0 0.3 0.3 0.5 0.5 0.4 1.2 1.1 1.0Egypt, Arab Rep. of 0.6 0.6 0.9 1.1 1.1 1.2 0.5 0.6 0.5Morocco 0.3 0.3 1.2 0.4 1.4 0.4 2.8 0.4 0.4
South Asia 2.9 3.5 4.9 3.5 3.1 3.4 5.0 4.2 5.1India 2.1 2.4 3.6 2.6 2.2 2.7 4.3 3.0 4.1Pakistan 0.7 0.9 0.7 0.5 0.5 0.3 0.4 0.8 0.7Sri Lanka 0.1 0.1 0.4 0.2 0.2 0.2 0.2 0.2 0.2
Sub-Saharan Africa 4.3 4.2 8.4 6.9 9.3 5.8 14.3 7.8 8.5Angola 0.5 0.2 0.4 1.1 2.5 0.9 2.1 1.3 1.7Nigeria 1.1 1.6 1.5 1.1 1.0 0.9 1.1 1.3 1.3South Africa 1.2 0.8 3.8 0.6 1.5 1.0 7.3 0.7 0.6
Note: e � estimate.
gdf_174-233.qxd 4/6/04 12:58 PM Page 205

A P P E N D I X B : S U M M A R Y S T A T I S T I C A L T A B L E S
206
Table B.29 Net inward portfolio equity flows, 1995–2003$ billions
1995 1996 1997 1998 1999 2000 2001 2002 2003e
All developing countries 17.3 32.9 22.6 6.6 12.6 12.6 4.4 4.9 14.3
East Asia and Pacific 6.3 9.7 �3.9 �3.4 2.3 4.8 1.0 3.5 4.8China 0.4 1.9 5.7 0.8 0.6 6.9 0.8 2.2 3.0Indonesia 1.5 1.8 �5.0 �4.4 �0.8 �1.0 0.4 0.9 1.0Malaysia 2.2 2.7 �8.0 �0.4 0.1 �1.8 �0.7 �0.3 �0.1Philippines — 2.1 �0.4 0.3 1.4 �0.2 0.4 0.4 0.4Thailand 2.1 1.2 3.9 0.3 0.9 0.9 0.0 0.2 0.5
Europe and Central Asia 1.7 4.3 4.0 4.0 2.0 1.2 0.3 �0.4 0.7Czech Republic 1.2 0.6 0.4 1.1 0.1 0.6 0.6 �0.3 �0.2Hungary — 0.4 1.0 0.6 1.2 �0.4 0.1 �0.1 0.2Poland 0.2 0.7 0.6 1.7 0.0 0.4 �0.3 �0.8 0.4Russian Federation 0.0 2.2 1.3 0.7 �0.3 0.2 0.5 2.6 0.8Turkey 0.2 0.2 0.0 �0.5 0.4 0.5 �0.1 0.0 1.0
Latin America and the Caribbean 4.8 12.2 13.3 �2.2 �3.6 �0.5 2.3 1.5 1.4Argentina 1.1 1.0 1.4 �0.2 �10.8 �3.2 �0.1 �0.1 0.3Brazil 2.8 5.8 5.1 �1.8 2.6 3.1 2.5 2.0 2.2Chile �0.2 �0.7 1.7 0.6 0.5 �0.4 �0.2 �0.3 0.3Mexico 0.5 2.8 3.2 �0.7 3.8 0.4 0.2 �0.1 �0.5Venezuela, R. B. de 0.3 1.3 1.4 0.0 0.4 �0.5 �0.1 0.1 �1.0
Middle East and North Africa 0.0 0.2 0.7 0.2 0.6 0.2 �0.1 �0.3 0.0Egypt, Arab Rep. of 0.0 0.0 0.5 �0.2 0.7 0.3 0.0 �0.2 0.0
South Asia 1.6 4.1 2.9 �0.6 2.4 2.8 1.9 1.0 7.0India 1.6 4.0 2.6 �0.6 2.3 2.8 2.0 1.0 7.0
Sub-Saharan Africa 3.0 2.4 5.6 8.7 9.0 4.1 �1.0 �0.4 0.5South Africa 2.9 2.3 5.5 8.6 9.0 4.2 �1.0 �0.4 0.5
Note: — � not available; e � estimate.
gdf_174-233.qxd 4/6/04 12:58 PM Page 206

C A P I T A L A C C O U N T
207
Table B.30 Net inward debt flows to developing countries, 1995–2003$ billions
1995 1996 1997 1998 1999 2000 2001 2002 2003e
All developing countries 151.3 116.5 105.3 57.6 13.8 �9.8 �1.2 7.3 44.3
East Asia and Pacific 54.1 52.2 44.9 �32.5 �12.2 �17.7 �8.1 �10.9 0.5China 17.8 13.9 18.5 �14.2 �1.6 �5.3 0.0 0.6 —Indonesia 9.9 12.3 10.1 �4.6 �3.8 �0.7 �6.0 �7.0 —Malaysia 5.1 6.4 8.4 �3.6 �0.7 0.4 4.7 3.7 —Philippines �0.7 4.5 7.6 �3.1 3.1 0.8 2.7 1.1 —Thailand 21.2 13.9 �1.3 �7.9 �9.4 �13.7 �10.0 �9.9 —
Europe and Central Asia 23.4 22.9 32.8 41.5 16.1 21.0 2.0 24.9 29.5Bulgaria �0.2 0.0 0.0 0.1 0.7 0.4 0.0 0.5 —Czech Republic 4.8 4.1 3.2 1.4 �0.2 �1.7 0.3 1.0 —Hungary 2.8 �2.0 �1.4 2.7 2.0 0.4 1.7 0.5 —Poland 0.3 1.0 2.5 4.2 1.7 3.5 1.0 1.2 —Russian Federation 4.9 7.3 7.6 21.9 �4.2 �2.8 �3.9 �2.7 —Turkey 4.4 3.1 4.2 5.5 10.9 18.3 �4.5 12.1 —
Latin America and the Caribbean 61.2 36.5 25.4 38.0 12.1 �9.7 6.3 �7.9 19.5Argentina 22.0 14.1 17.1 11.7 6.3 4.3 �4.7 �1.8 —Brazil 8.8 19.2 �1.3 6.7 �5.9 �4.2 5.2 �1.4 —Chile �0.3 1.2 2.0 4.8 2.1 2.4 1.4 2.3 —Colombia 2.9 4.4 3.6 0.8 1.3 �0.2 3.3 �1.2 —Mexico 25.6 �4.9 �4.9 9.0 6.9 �16.4 �3.2 �8.7 —Venezuela, R. B. de �1.7 �0.2 2.6 1.7 0.2 0.9 �2.2 �3.1 —
Middle East and North Africa 2.4 �0.9 �2.9 7.1 �1.8 �6.1 0.9 0.9 �7.8Algeria 1.4 1.6 �0.4 �1.6 �1.9 �1.6 �2.0 �1.5 —Egypt, Arab Rep. of 0.1 �0.5 0.6 1.1 �0.6 �0.7 0.1 �0.6 —Lebanon 0.8 1.1 1.1 1.7 1.5 1.8 2.7 4.4 —
South Asia 2.5 2.7 0.7 4.7 0.5 3.4 �0.7 0.4 �2.3India �0.7 0.7 �1.6 3.0 �1.1 3.4 �1.9 �0.9 —Pakistan 2.6 1.1 1.6 0.7 0.7 �0.3 0.4 0.5 —
Sub-Saharan Africa 7.6 3.1 4.4 �1.3 �1.0 �0.7 �1.8 �0.1 4.9South Africa 3.4 0.7 �0.4 �0.3 �0.7 1.2 �0.8 �0.5 —
Note: — � not available; e � estimate.
gdf_174-233.qxd 4/6/04 12:58 PM Page 207
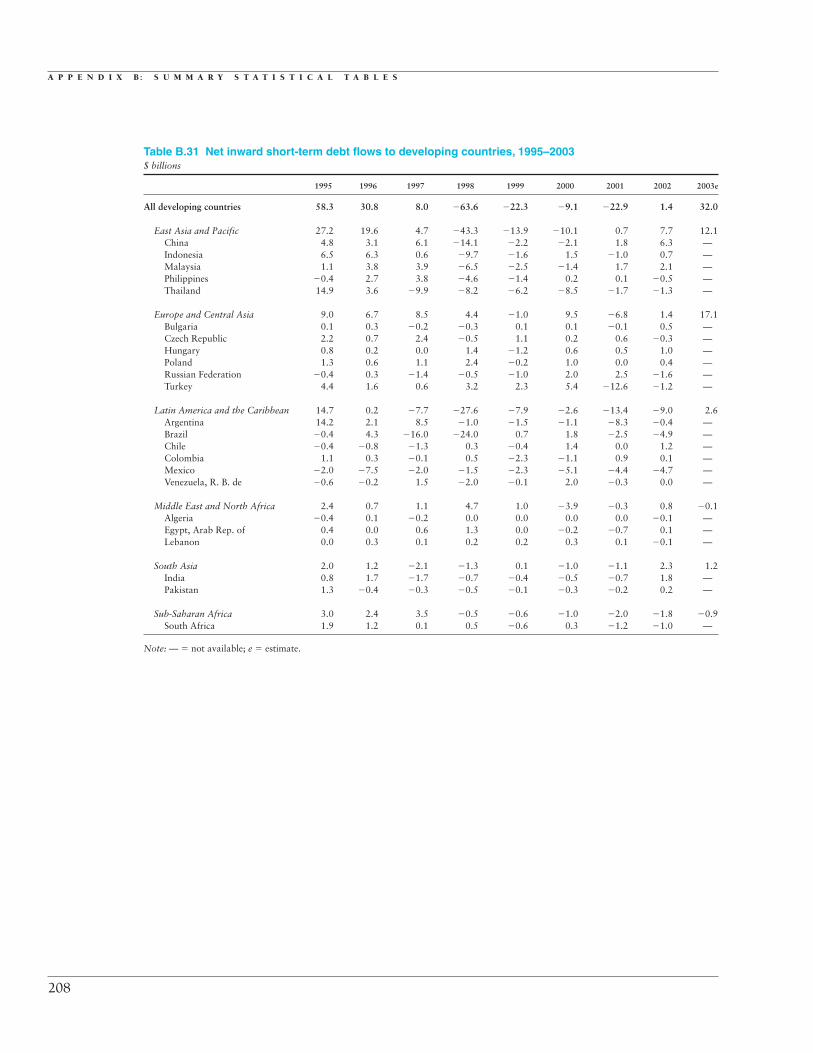
A P P E N D I X B : S U M M A R Y S T A T I S T I C A L T A B L E S
208
Table B.31 Net inward short-term debt flows to developing countries, 1995–2003$ billions
1995 1996 1997 1998 1999 2000 2001 2002 2003e
All developing countries 58.3 30.8 8.0 �63.6 �22.3 �9.1 �22.9 1.4 32.0
East Asia and Pacific 27.2 19.6 4.7 �43.3 �13.9 �10.1 0.7 7.7 12.1China 4.8 3.1 6.1 �14.1 �2.2 �2.1 1.8 6.3 —Indonesia 6.5 6.3 0.6 �9.7 �1.6 1.5 �1.0 0.7 —Malaysia 1.1 3.8 3.9 �6.5 �2.5 �1.4 1.7 2.1 —Philippines �0.4 2.7 3.8 �4.6 �1.4 0.2 0.1 �0.5 —Thailand 14.9 3.6 �9.9 �8.2 �6.2 �8.5 �1.7 �1.3 —
Europe and Central Asia 9.0 6.7 8.5 4.4 �1.0 9.5 �6.8 1.4 17.1Bulgaria 0.1 0.3 �0.2 �0.3 0.1 0.1 �0.1 0.5 —Czech Republic 2.2 0.7 2.4 �0.5 1.1 0.2 0.6 �0.3 —Hungary 0.8 0.2 0.0 1.4 �1.2 0.6 0.5 1.0 —Poland 1.3 0.6 1.1 2.4 �0.2 1.0 0.0 0.4 —Russian Federation �0.4 0.3 �1.4 �0.5 �1.0 2.0 2.5 �1.6 —Turkey 4.4 1.6 0.6 3.2 2.3 5.4 �12.6 �1.2 —
Latin America and the Caribbean 14.7 0.2 �7.7 �27.6 �7.9 �2.6 �13.4 �9.0 2.6Argentina 14.2 2.1 8.5 �1.0 �1.5 �1.1 �8.3 �0.4 —Brazil �0.4 4.3 �16.0 �24.0 0.7 1.8 �2.5 �4.9 —Chile �0.4 �0.8 �1.3 0.3 �0.4 1.4 0.0 1.2 —Colombia 1.1 0.3 �0.1 0.5 �2.3 �1.1 0.9 0.1 —Mexico �2.0 �7.5 �2.0 �1.5 �2.3 �5.1 �4.4 �4.7 —Venezuela, R. B. de �0.6 �0.2 1.5 �2.0 �0.1 2.0 �0.3 0.0 —
Middle East and North Africa 2.4 0.7 1.1 4.7 1.0 �3.9 �0.3 0.8 �0.1Algeria �0.4 0.1 �0.2 0.0 0.0 0.0 0.0 �0.1 —Egypt, Arab Rep. of 0.4 0.0 0.6 1.3 0.0 �0.2 �0.7 0.1 —Lebanon 0.0 0.3 0.1 0.2 0.2 0.3 0.1 �0.1 —
South Asia 2.0 1.2 �2.1 �1.3 0.1 �1.0 �1.1 2.3 1.2India 0.8 1.7 �1.7 �0.7 �0.4 �0.5 �0.7 1.8 —Pakistan 1.3 �0.4 �0.3 �0.5 �0.1 �0.3 �0.2 0.2 —
Sub-Saharan Africa 3.0 2.4 3.5 �0.5 �0.6 �1.0 �2.0 �1.8 �0.9South Africa 1.9 1.2 0.1 0.5 �0.6 0.3 �1.2 �1.0 —
Note: — � not available; e � estimate.
gdf_174-233.qxd 4/6/04 12:58 PM Page 208
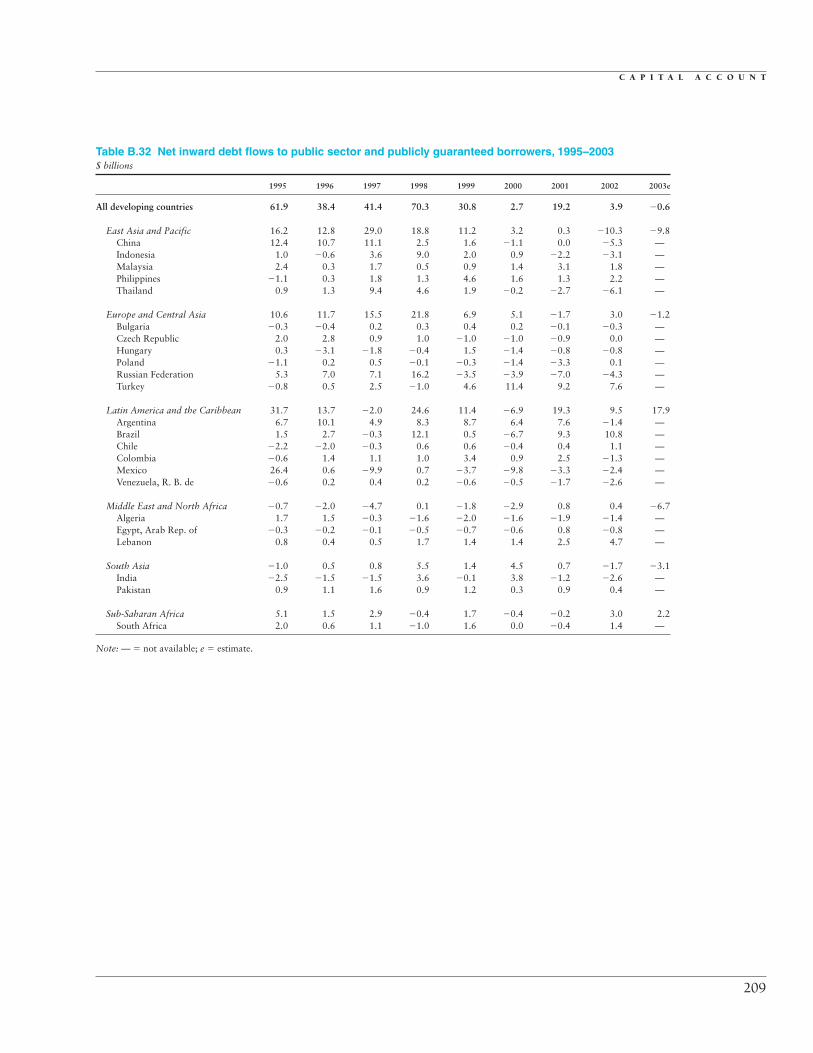
C A P I T A L A C C O U N T
209
Table B.32 Net inward debt flows to public sector and publicly guaranteed borrowers, 1995–2003$ billions
1995 1996 1997 1998 1999 2000 2001 2002 2003e
All developing countries 61.9 38.4 41.4 70.3 30.8 2.7 19.2 3.9 �0.6
East Asia and Pacific 16.2 12.8 29.0 18.8 11.2 3.2 0.3 �10.3 �9.8China 12.4 10.7 11.1 2.5 1.6 �1.1 0.0 �5.3 —Indonesia 1.0 �0.6 3.6 9.0 2.0 0.9 �2.2 �3.1 —Malaysia 2.4 0.3 1.7 0.5 0.9 1.4 3.1 1.8 —Philippines �1.1 0.3 1.8 1.3 4.6 1.6 1.3 2.2 —Thailand 0.9 1.3 9.4 4.6 1.9 �0.2 �2.7 �6.1 —
Europe and Central Asia 10.6 11.7 15.5 21.8 6.9 5.1 �1.7 3.0 �1.2Bulgaria �0.3 �0.4 0.2 0.3 0.4 0.2 �0.1 �0.3 —Czech Republic 2.0 2.8 0.9 1.0 �1.0 �1.0 �0.9 0.0 —Hungary 0.3 �3.1 �1.8 �0.4 1.5 �1.4 �0.8 �0.8 —Poland �1.1 0.2 0.5 �0.1 �0.3 �1.4 �3.3 0.1 —Russian Federation 5.3 7.0 7.1 16.2 �3.5 �3.9 �7.0 �4.3 —Turkey �0.8 0.5 2.5 �1.0 4.6 11.4 9.2 7.6 —
Latin America and the Caribbean 31.7 13.7 �2.0 24.6 11.4 �6.9 19.3 9.5 17.9Argentina 6.7 10.1 4.9 8.3 8.7 6.4 7.6 �1.4 —Brazil 1.5 2.7 �0.3 12.1 0.5 �6.7 9.3 10.8 —Chile �2.2 �2.0 �0.3 0.6 0.6 �0.4 0.4 1.1 —Colombia �0.6 1.4 1.1 1.0 3.4 0.9 2.5 �1.3 —Mexico 26.4 0.6 �9.9 0.7 �3.7 �9.8 �3.3 �2.4 —Venezuela, R. B. de �0.6 0.2 0.4 0.2 �0.6 �0.5 �1.7 �2.6 —
Middle East and North Africa �0.7 �2.0 �4.7 0.1 �1.8 �2.9 0.8 0.4 �6.7Algeria 1.7 1.5 �0.3 �1.6 �2.0 �1.6 �1.9 �1.4 —Egypt, Arab Rep. of �0.3 �0.2 �0.1 �0.5 �0.7 �0.6 0.8 �0.8 —Lebanon 0.8 0.4 0.5 1.7 1.4 1.4 2.5 4.7 —
South Asia �1.0 0.5 0.8 5.5 1.4 4.5 0.7 �1.7 �3.1India �2.5 �1.5 �1.5 3.6 �0.1 3.8 �1.2 �2.6 —Pakistan 0.9 1.1 1.6 0.9 1.2 0.3 0.9 0.4 —
Sub-Saharan Africa 5.1 1.5 2.9 �0.4 1.7 �0.4 �0.2 3.0 2.2South Africa 2.0 0.6 1.1 �1.0 1.6 0.0 �0.4 1.4 —
Note: — � not available; e � estimate.
gdf_174-233.qxd 4/6/04 12:58 PM Page 209

A P P E N D I X B : S U M M A R Y S T A T I S T I C A L T A B L E S
210
Table B.33 Net inward debt flows to private sector borrowers, 1995–2003$ billions
1995 1996 1997 1998 1999 2000 2001 2002 2003e
All developing countries 89.3 78.1 63.9 �12.7 �17.0 �12.5 �20.4 3.4 44.9
East Asia and Pacific 37.9 39.3 15.9 �51.3 �23.4 �20.9 �8.4 �0.6 10.3China 5.4 3.2 7.4 �16.7 �3.2 �4.1 �0.1 5.9 —Indonesia 9.0 12.9 6.5 �13.6 �5.8 �1.6 �3.8 �3.9 —Malaysia 2.7 6.1 6.7 �4.0 �1.6 �1.0 1.6 1.9 —Philippines 0.4 4.2 5.8 �4.3 �1.4 �0.8 1.4 �1.1 —Thailand 20.4 12.6 �10.7 �12.5 �11.3 �13.5 �7.3 �3.7 —
Europe and Central Asia 12.8 11.2 17.4 19.8 9.3 15.8 3.7 21.9 30.7Bulgaria 0.1 0.4 �0.2 �0.2 0.3 0.2 0.1 0.8 —Czech Republic 2.8 1.3 2.3 0.4 0.8 �0.6 1.2 1.0 —Hungary 2.5 1.1 0.5 3.1 0.5 1.8 2.5 1.3 —Poland 1.5 0.8 2.0 4.3 2.1 4.9 4.3 1.0 —Russian Federation �0.4 0.3 0.5 2.4 �0.7 1.1 3.1 1.5 —Turkey 5.1 2.7 1.8 6.5 6.3 6.8 �13.7 4.5 —
Latin America and the Caribbean 29.5 22.7 27.4 13.5 0.7 �2.8 �13.0 �17.4 1.6Argentina 15.3 3.9 12.3 3.4 �2.4 �2.1 �12.3 �0.5 —Brazil 7.3 16.5 �1.0 �5.3 �6.4 2.4 �4.2 �12.2 —Chile 2.0 3.2 2.3 4.2 1.5 2.8 1.0 1.1 —Colombia 3.5 3.0 2.5 �0.2 �2.1 �1.1 0.7 0.1 —Mexico �0.8 �5.5 5.0 8.3 10.5 �6.6 0.1 �6.2 —Venezuela, R. B. de �1.1 �0.4 2.2 1.5 0.7 1.4 �0.4 �0.4 —
Middle East and North Africa 3.1 1.1 1.8 7.0 0.0 �3.2 0.1 0.5 �1.1Algeria �0.4 0.1 �0.2 0.0 0.0 0.0 0.0 �0.1 —Egypt, Arab Rep. of 0.4 �0.2 0.6 1.5 0.1 �0.1 �0.7 0.1 —Lebanon 0.1 0.7 0.6 0.1 0.1 0.4 0.2 �0.2 —
South Asia 3.5 2.1 �0.1 �0.8 �0.9 �1.1 �1.4 2.1 0.8India 1.8 2.2 �0.1 �0.5 �1.0 �0.4 �0.7 1.7 —Pakistan 1.7 0.0 0.0 �0.2 �0.5 �0.6 �0.5 0.1 —
Sub-Saharan Africa 2.5 1.6 1.6 �0.9 �2.7 �0.3 �1.5 �3.1 2.6South Africa 1.4 0.1 �1.5 0.7 �2.3 1.3 �0.4 �1.9 —
Note: — � not available; e � estimate.
gdf_174-233.qxd 4/6/04 12:58 PM Page 210
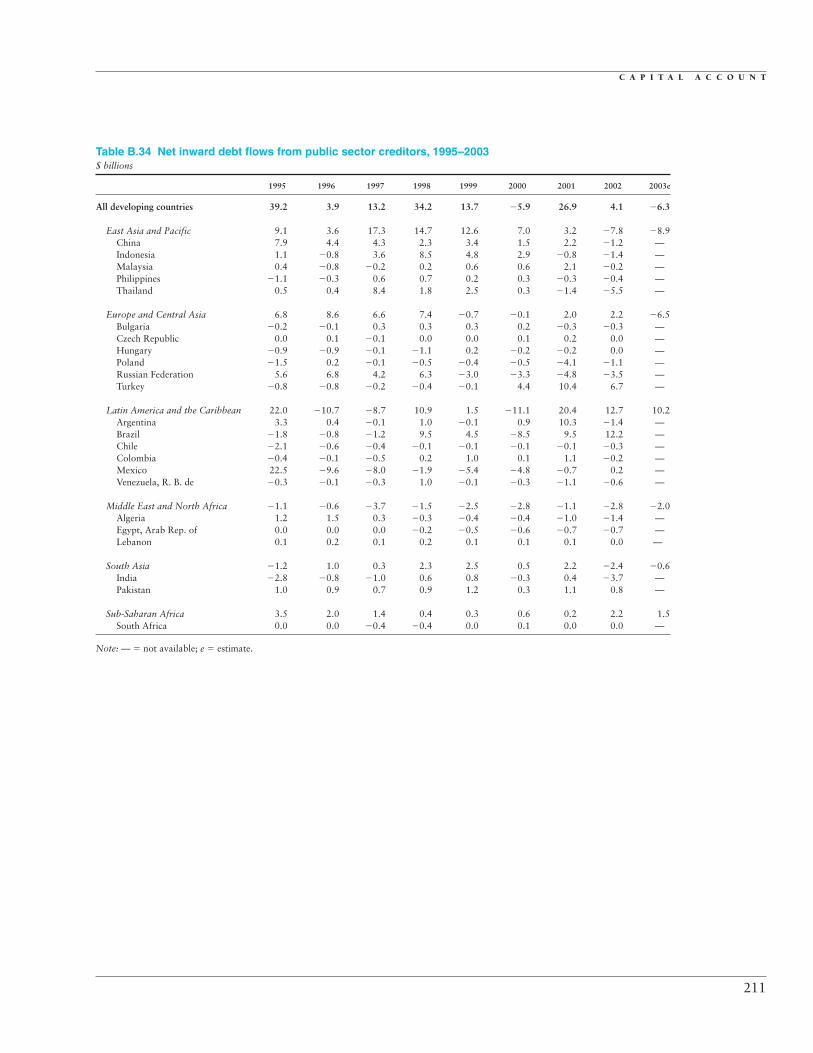
C A P I T A L A C C O U N T
211
Table B.34 Net inward debt flows from public sector creditors, 1995–2003$ billions
1995 1996 1997 1998 1999 2000 2001 2002 2003e
All developing countries 39.2 3.9 13.2 34.2 13.7 �5.9 26.9 4.1 �6.3
East Asia and Pacific 9.1 3.6 17.3 14.7 12.6 7.0 3.2 �7.8 �8.9China 7.9 4.4 4.3 2.3 3.4 1.5 2.2 �1.2 —Indonesia 1.1 �0.8 3.6 8.5 4.8 2.9 �0.8 �1.4 —Malaysia 0.4 �0.8 �0.2 0.2 0.6 0.6 2.1 �0.2 —Philippines �1.1 �0.3 0.6 0.7 0.2 0.3 �0.3 �0.4 —Thailand 0.5 0.4 8.4 1.8 2.5 0.3 �1.4 �5.5 —
Europe and Central Asia 6.8 8.6 6.6 7.4 �0.7 �0.1 2.0 2.2 �6.5Bulgaria �0.2 �0.1 0.3 0.3 0.3 0.2 �0.3 �0.3 —Czech Republic 0.0 0.1 �0.1 0.0 0.0 0.1 0.2 0.0 —Hungary �0.9 �0.9 �0.1 �1.1 0.2 �0.2 �0.2 0.0 —Poland �1.5 0.2 �0.1 �0.5 �0.4 �0.5 �4.1 �1.1 —Russian Federation 5.6 6.8 4.2 6.3 �3.0 �3.3 �4.8 �3.5 —Turkey �0.8 �0.8 �0.2 �0.4 �0.1 4.4 10.4 6.7 —
Latin America and the Caribbean 22.0 �10.7 �8.7 10.9 1.5 �11.1 20.4 12.7 10.2Argentina 3.3 0.4 �0.1 1.0 �0.1 0.9 10.3 �1.4 —Brazil �1.8 �0.8 �1.2 9.5 4.5 �8.5 9.5 12.2 —Chile �2.1 �0.6 �0.4 �0.1 �0.1 �0.1 �0.1 �0.3 —Colombia �0.4 �0.1 �0.5 0.2 1.0 0.1 1.1 �0.2 —Mexico 22.5 �9.6 �8.0 �1.9 �5.4 �4.8 �0.7 0.2 —Venezuela, R. B. de �0.3 �0.1 �0.3 1.0 �0.1 �0.3 �1.1 �0.6 —
Middle East and North Africa �1.1 �0.6 �3.7 �1.5 �2.5 �2.8 �1.1 �2.8 �2.0Algeria 1.2 1.5 0.3 �0.3 �0.4 �0.4 �1.0 �1.4 —Egypt, Arab Rep. of 0.0 0.0 0.0 �0.2 �0.5 �0.6 �0.7 �0.7 —Lebanon 0.1 0.2 0.1 0.2 0.1 0.1 0.1 0.0 —
South Asia �1.2 1.0 0.3 2.3 2.5 0.5 2.2 �2.4 �0.6India �2.8 �0.8 �1.0 0.6 0.8 �0.3 0.4 �3.7 —Pakistan 1.0 0.9 0.7 0.9 1.2 0.3 1.1 0.8 —
Sub-Saharan Africa 3.5 2.0 1.4 0.4 0.3 0.6 0.2 2.2 1.5South Africa 0.0 0.0 �0.4 �0.4 0.0 0.1 0.0 0.0 —
Note: — � not available; e � estimate.
gdf_174-233.qxd 4/6/04 12:58 PM Page 211

A P P E N D I X B : S U M M A R Y S T A T I S T I C A L T A B L E S
212
Table B.35 Net inward debt flows from private sector creditors, 1995–2003$ billions
1995 1996 1997 1998 1999 2000 2001 2002 2003e
All developing countries 112.1 112.5 92.2 23.4 0.1 �3.9 �28.1 3.2 50.6
East Asia and Pacific 45.0 48.6 27.6 �47.1 �24.7 �24.7 �11.3 �3.1 9.4China 9.9 9.5 14.2 �16.5 �5.0 �6.8 �2.2 1.8 —Indonesia 8.8 13.1 6.5 �13.0 �8.6 �3.6 �5.2 �5.6 —Malaysia 4.8 7.2 8.6 �3.8 �1.3 �0.2 2.6 3.9 —Philippines 0.5 4.9 7.0 �3.7 2.9 0.4 3.0 1.5 —Thailand 20.7 13.4 �9.7 �9.6 �11.9 �14.0 �8.6 �4.4 —
Europe and Central Asia 16.7 14.3 26.3 34.1 16.9 21.1 0.1 22.7 36.0Bulgaria 0.0 0.0 �0.3 �0.3 0.4 0.1 0.3 0.7 —Czech Republic 4.8 4.0 3.2 1.4 �0.2 �1.7 0.1 1.0 —Hungary 3.7 �1.1 �1.3 3.8 1.8 0.7 1.9 0.6 —Poland 1.8 0.7 2.6 4.7 2.2 4.0 5.1 2.2 —Russian Federation �0.7 0.5 3.4 12.3 �1.2 0.5 0.9 0.8 —Turkey 5.2 4.0 4.4 5.9 11.0 13.8 �14.9 5.4 —
Latin America and the Caribbean 39.2 47.2 34.1 27.2 10.6 1.4 �14.1 �20.6 9.3Argentina 18.7 13.7 17.3 10.7 6.4 3.4 �15.0 �0.4 —Brazil 10.6 20.1 �0.1 �2.7 �10.4 4.3 �4.3 �13.6 —Chile 1.8 1.8 2.4 4.8 2.2 2.5 1.5 2.6 —Colombia 3.3 4.5 4.1 0.6 0.2 �0.3 2.2 �1.0 —Mexico 3.1 4.8 3.1 10.8 12.2 �11.6 �2.5 �8.9 —Venezuela, R. B. de �1.4 0.0 2.9 0.7 0.3 1.2 �1.1 �2.4 —
Middle East and North Africa 3.5 �0.3 0.8 8.6 0.6 �3.4 2.0 3.8 �5.7Algeria 0.1 0.1 �0.7 �1.3 �1.5 �1.2 �1.0 �0.1 —Egypt, Arab Rep. of 0.1 �0.4 0.6 1.3 �0.1 �0.1 0.8 0.1 —Lebanon 0.7 0.8 1.0 1.6 1.4 1.7 2.6 4.4 —
South Asia 3.7 1.6 0.4 2.4 �2.0 2.9 �2.8 2.8 �1.7India 2.0 1.5 �0.6 2.5 �1.9 3.6 �2.3 2.8 —Pakistan 1.6 0.1 0.9 �0.2 �0.6 �0.7 �0.7 �0.3 —
Sub-Saharan Africa 4.1 1.2 3.0 �1.8 �1.3 �1.3 �2.0 �2.2 3.4South Africa 3.4 0.7 0.0 0.1 �0.7 1.2 �0.8 �0.5 —
Note: — � not available; e � estimate.
gdf_174-233.qxd 4/6/04 12:58 PM Page 212

C A P I T A L A C C O U N T
213
Table B.36 Gross market-based capital flows to developing countries, 1995–2003$ billions
1995 1996 1997 1998 1999 2000 2001 2002 2003
All developing countries 151.2 206.1 287.3 178.6 162.4 204.5 149.1 145.9 200.5
East Asia and Pacific 60.0 71.5 76.2 27.3 28.2 48.3 20.1 40.9 48.5China 15.2 16.1 26.4 10.1 8.7 29.0 6.7 16.0 24.1Indonesia 17.5 24.2 21.1 1.2 2.8 0.9 1.0 1.5 6.6Malaysia 10.4 10.9 11.9 3.4 6.8 6.9 5.4 12.8 7.4Philippines 3.3 5.6 7.7 5.7 7.3 6.8 4.8 6.3 6.5Thailand 12.5 14.1 8.9 6.7 2.2 4.3 2.3 3.7 3.9
Europe and Central Asia 21.9 26.9 51.2 43.4 31.0 41.4 26.6 35.0 58.0Czech Republic 1.6 3.2 4.4 3.6 8.5 3.9 3.1 4.6 7.1Hungary 5.2 3.5 4.2 4.0 3.9 2.1 3.1 1.9 6.8Poland 1.5 0.9 4.5 4.6 5.0 4.5 5.4 6.6 10.2Russian Federation 4.0 5.8 20.0 13.3 0.7 5.2 4.7 10.8 17.7Turkey 7.1 8.6 10.3 9.8 12.9 22.1 6.9 7.3 10.3
Latin America and the Caribbean 42.8 84.9 120.6 84.5 75.3 88.4 77.0 43.5 64.3Argentina 9.4 24.1 28.6 26.7 21.0 19.3 6.5 2.1 0.7Brazil 7.1 14.5 32.3 18.0 14.6 28.0 23.6 14.5 18.4Chile 2.6 5.5 8.9 4.8 8.6 5.9 5.3 4.1 5.1Mexico 15.1 29.3 30.4 19.9 18.4 21.3 19.9 14.8 28.7Venezuela, R. B. de 1.9 2.9 7.5 7.8 2.0 3.0 4.8 0.8 4.1
Middle East and North Africa 11.3 4.5 18.7 12.1 13.6 10.3 12.4 14.8 8.2Egypt, Arab Rep. of 0.3 0.2 1.5 1.7 4.4 1.1 2.6 0.6 1.1Lebanon 0.7 0.9 1.5 1.9 1.4 1.9 3.3 1.0 0.2Saudi Arabia 3.1 0.8 9.7 6.5 4.1 2.4 1.9 5.7 0.8
South Asia 7.4 10.5 12.7 5.1 4.2 4.5 3.3 2.7 6.2India 5.3 6.7 10.7 4.0 3.8 4.4 2.6 2.2 5.2Pakistan 2.0 3.1 1.7 0.9 0.0 0.0 0.2 0.4 1.1
Sub-Saharan Africa 7.8 7.8 7.9 6.4 10.0 11.6 9.9 9.0 15.3South Africa 4.2 5.8 5.7 3.0 7.8 9.2 6.9 5.4 10.7
gdf_174-233.qxd 4/6/04 12:58 PM Page 213

A P P E N D I X B : S U M M A R Y S T A T I S T I C A L T A B L E S
214
Table B.37 Gross international equity issuance by developing countries, 1995–2003$ billions
1995 1996 1997 1998 1999 2000 2001 2002 2003
All developing countries 6.4 12.6 21.4 8.0 13.5 34.3 5.7 10.9 19.0
East Asia and Pacific 4.1 5.2 10.7 4.0 6.2 22.1 3.5 7.2 12.9China 0.8 2.1 9.1 1.2 3.7 21.9 2.9 5.5 9.4Indonesia 1.4 1.3 0.9 0.0 1.2 0.0 0.3 0.3 1.2Malaysia 0.6 0.6 0.4 0.2 0.0 0.0 0.0 1.2 0.6Philippines 0.7 1.0 0.3 0.4 0.2 0.2 0.0 0.0 0.1Thailand 0.5 0.2 0.0 2.2 1.0 0.0 0.2 0.1 1.5
Europe and Central Asia 0.6 1.3 3.1 2.6 1.4 3.4 0.3 1.6 2.4Hungary 0.3 0.4 1.7 0.4 0.5 0.0 0.0 0.0 0.0Poland 0.1 0.0 0.7 1.0 0.7 0.4 0.0 0.2 0.6Russian Federation 0.0 0.8 0.1 0.0 0.0 0.4 0.2 1.3 0.6Turkey 0.1 0.0 0.4 0.8 0.0 2.4 0.0 0.1 0.1
Latin America and the Caribbean 0.9 3.6 4.9 0.3 0.8 6.8 1.2 1.1 1.2Argentina 0.0 0.4 1.1 0.0 0.3 0.4 0.0 0.0 0.0Brazil 0.2 0.4 2.4 0.1 0.2 3.1 1.1 1.1 0.6Chile 0.2 0.1 0.6 0.1 0.0 0.0 0.0 0.0 0.1Mexico 0.0 0.7 0.8 0.0 0.2 3.3 0.0 0.0 0.5
Middle East and North Africa 0.0 0.4 0.7 0.4 0.1 0.4 0.0 0.0 0.0Egypt, Arab Rep. of 0.0 0.2 0.3 0.1 0.1 0.3 0.0 0.0 0.0Morocco 0.0 0.1 0.0 0.1 0.0 0.1 0.0 0.0 0.0
South Asia 0.3 1.3 1.1 0.1 0.9 0.9 0.5 0.3 1.3India 0.3 1.3 1.0 0.1 0.9 0.9 0.5 0.3 1.3
Sub-Saharan Africa 0.4 0.8 1.0 0.7 4.2 0.6 0.3 0.7 1.3South Africa 0.3 0.6 1.0 0.7 4.2 0.6 0.3 0.7 1.3
gdf_174-233.qxd 4/6/04 12:58 PM Page 214

C A P I T A L A C C O U N T
215
Table B.38 Gross international bond issues in developing countries, 1995–2003$ billions
1995 1996 1997 1998 1999 2000 2001 2002 2003
All developing countries 39.4 78.1 99.2 65.4 63.2 59.5 63.3 55.7 86.2
East Asia and Pacific 9.9 20.8 20.2 4.5 8.6 5.1 7.1 12.5 11.2China 1.6 4.1 6.1 1.8 1.7 1.3 2.6 0.9 3.2Indonesia 2.5 5.5 5.6 0.5 0.0 0.0 0.1 0.9 1.5Malaysia 2.8 2.5 3.1 0.0 2.2 1.4 2.4 6.0 1.3Philippines 0.8 3.3 3.0 1.9 4.5 2.4 1.8 4.8 5.0Thailand 2.2 5.1 2.4 0.3 0.0 0.0 0.3 0.0 0.3
Europe and Central Asia 6.5 6.8 15.7 21.7 13.6 15.0 10.8 16.3 26.4Croatia 0.1 0.1 0.5 0.1 0.6 0.9 0.9 0.8 1.0Hungary 3.3 0.3 0.4 1.8 2.4 0.5 1.2 0.1 2.2Poland 0.3 0.3 1.2 1.9 1.7 1.6 2.8 2.7 4.7Russian Federation 0.3 1.2 7.0 10.5 0.0 0.1 1.4 3.6 8.3Turkey 2.4 2.9 4.2 3.4 5.8 8.5 2.2 3.5 5.5
Latin America and the Caribbean 19.8 46.8 57.4 36.6 37.3 35.6 37.8 22.2 40.8Argentina 5.5 13.7 16.0 15.0 13.5 12.2 1.5 0.0 0.0Brazil 4.7 10.9 15.0 6.5 7.6 11.2 11.9 7.0 14.1Colombia 1.2 1.9 1.3 1.4 1.7 1.5 4.3 1.0 1.8Mexico 6.9 18.0 14.9 8.4 9.5 7.2 8.2 7.4 15.2Venezuela, R. B. de 0.7 1.0 5.9 3.3 2.2 0.5 1.7 0.0 3.7
Middle East and North Africa 1.0 1.0 2.1 1.5 1.9 2.4 5.3 2.7 1.0Egypt, Arab Rep. of 0.0 0.0 0.0 0.0 0.1 0.0 1.5 0.0 0.0Lebanon 0.4 0.5 1.3 1.5 1.4 1.9 3.3 1.0 0.2Tunisia 0.6 0.1 0.5 0.0 0.2 0.5 0.5 0.7 0.4
South Asia 0.8 1.4 2.7 0.1 0.1 0.0 0.1 0.2 0.5India 0.8 1.1 2.2 0.0 0.1 0.0 0.1 0.1 0.5Pakistan 0.0 0.3 0.5 0.0 0.0 0.0 0.0 0.0 0.0
Sub-Saharan Africa 1.5 1.3 1.1 1.0 1.7 1.5 2.2 1.9 6.4South Africa 1.3 1.0 1.1 1.0 1.7 1.5 2.2 1.9 6.4
gdf_174-233.qxd 4/6/04 12:58 PM Page 215

A P P E N D I X B : S U M M A R Y S T A T I S T I C A L T A B L E S
216
Table B.39 Gross international bank lending to developing-country borrower, 1995–2003$ billions
1995 1996 1997 1998 1999 2000 2001 2002 2003
All developing countries 105.4 115.4 166.6 105.2 85.7 110.7 80.1 79.3 95.3
East Asia and Pacific 46.0 45.5 45.3 18.8 13.4 21.1 9.5 21.3 24.4China 12.7 9.8 11.1 7.0 3.4 5.8 1.3 9.6 11.5Indonesia 13.6 17.3 14.7 0.7 1.6 0.9 0.5 0.3 4.0Malaysia 7.0 7.8 8.3 3.2 4.6 5.5 3.0 5.6 5.5Philippines 1.8 1.2 4.4 3.4 2.6 4.6 3.0 1.5 1.4Thailand 9.8 8.8 6.5 4.3 1.2 4.3 1.8 3.6 2.1
Europe and Central Asia 14.8 18.7 32.4 19.0 16.1 23.0 15.5 17.1 29.2Czech Republic 1.6 3.2 3.5 2.4 0.6 1.2 0.8 0.2 2.2Hungary 1.6 2.8 2.1 1.8 0.9 1.5 1.8 1.8 4.5Poland 1.2 0.6 2.5 1.7 2.7 2.6 2.6 3.7 4.9Russian Federation 3.6 3.8 12.9 2.8 0.7 4.7 3.1 5.9 8.8Turkey 4.6 5.7 5.7 5.7 7.1 11.2 4.7 3.7 4.8
Latin America and the Caribbean 22.1 34.5 58.2 47.6 37.3 46.0 38.0 20.2 22.3Argentina 3.8 10.0 11.5 11.8 7.2 6.7 5.0 2.1 0.7Brazil 2.2 3.2 14.9 11.4 6.9 13.7 10.6 6.4 3.7Chile 1.8 4.3 7.2 4.3 7.6 6.5 5.6 2.1 3.1Colombia 3.2 2.3 4.9 1.8 2.0 2.2 0.6 1.2 0.2Mexico 8.2 10.6 14.7 11.5 8.7 10.9 11.7 7.4 13.0
Middle East and North Africa 10.3 3.0 15.9 10.2 11.6 7.5 7.1 12.1 7.2Egypt, Arab Rep. of 0.3 0.0 1.2 1.6 4.2 0.8 1.1 0.6 1.1Iran 1.0 0.6 0.5 0.5 0.7 1.0 1.0 3.0 2.0Saudi Arabia 3.1 0.8 9.7 6.5 4.4 2.4 1.9 5.7 0.8
South Asia 6.3 7.8 8.9 5.0 3.2 3.6 2.7 2.2 4.5India 4.1 5.0 7.5 3.9 2.8 3.5 2.0 1.8 3.4Pakistan 2.0 2.8 1.3 0.9 0.0 0.0 0.2 0.4 1.1
Sub-Saharan Africa 6.0 5.8 5.8 4.7 4.1 9.5 7.4 6.4 7.7South Africa 2.6 4.1 3.6 1.3 1.9 7.1 4.4 2.8 3.1
gdf_174-233.qxd 4/6/04 12:58 PM Page 216
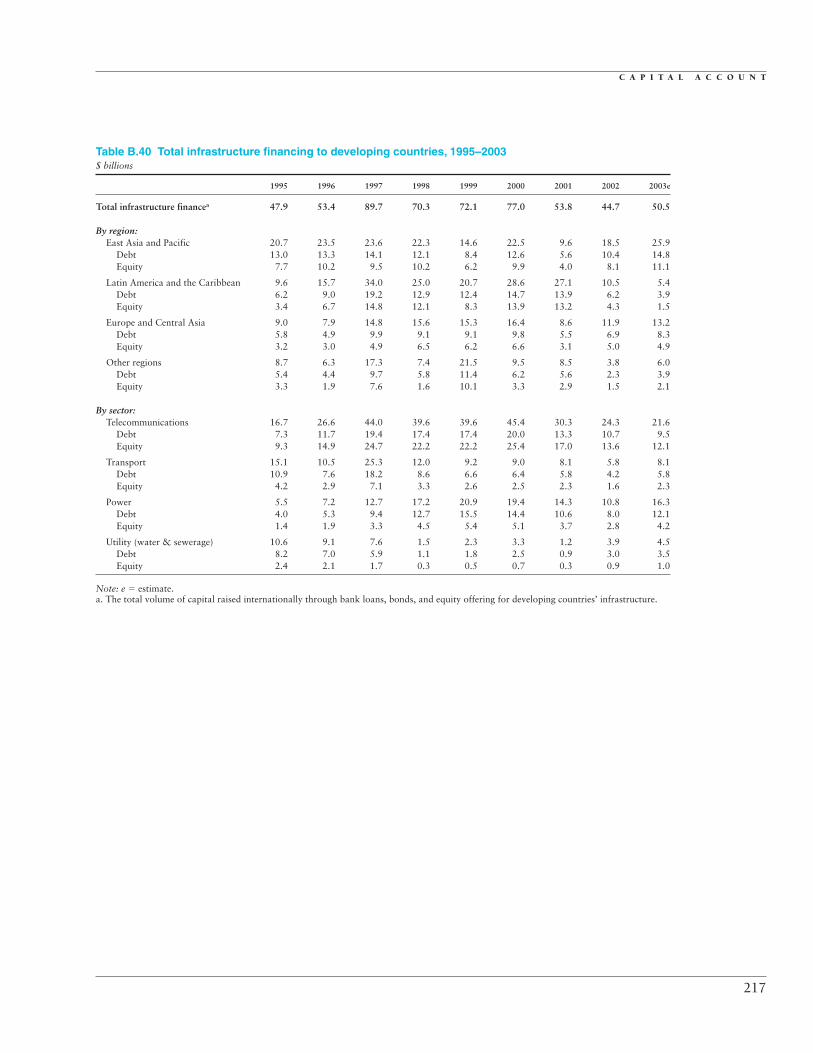
C A P I T A L A C C O U N T
217
Table B.40 Total infrastructure financing to developing countries, 1995–2003$ billions
1995 1996 1997 1998 1999 2000 2001 2002 2003e
Total infrastructure financea 47.9 53.4 89.7 70.3 72.1 77.0 53.8 44.7 50.5
By region:East Asia and Pacific 20.7 23.5 23.6 22.3 14.6 22.5 9.6 18.5 25.9
Debt 13.0 13.3 14.1 12.1 8.4 12.6 5.6 10.4 14.8Equity 7.7 10.2 9.5 10.2 6.2 9.9 4.0 8.1 11.1
Latin America and the Caribbean 9.6 15.7 34.0 25.0 20.7 28.6 27.1 10.5 5.4Debt 6.2 9.0 19.2 12.9 12.4 14.7 13.9 6.2 3.9Equity 3.4 6.7 14.8 12.1 8.3 13.9 13.2 4.3 1.5
Europe and Central Asia 9.0 7.9 14.8 15.6 15.3 16.4 8.6 11.9 13.2Debt 5.8 4.9 9.9 9.1 9.1 9.8 5.5 6.9 8.3Equity 3.2 3.0 4.9 6.5 6.2 6.6 3.1 5.0 4.9
Other regions 8.7 6.3 17.3 7.4 21.5 9.5 8.5 3.8 6.0Debt 5.4 4.4 9.7 5.8 11.4 6.2 5.6 2.3 3.9Equity 3.3 1.9 7.6 1.6 10.1 3.3 2.9 1.5 2.1
By sector:Telecommunications 16.7 26.6 44.0 39.6 39.6 45.4 30.3 24.3 21.6
Debt 7.3 11.7 19.4 17.4 17.4 20.0 13.3 10.7 9.5Equity 9.3 14.9 24.7 22.2 22.2 25.4 17.0 13.6 12.1
Transport 15.1 10.5 25.3 12.0 9.2 9.0 8.1 5.8 8.1Debt 10.9 7.6 18.2 8.6 6.6 6.4 5.8 4.2 5.8Equity 4.2 2.9 7.1 3.3 2.6 2.5 2.3 1.6 2.3
Power 5.5 7.2 12.7 17.2 20.9 19.4 14.3 10.8 16.3Debt 4.0 5.3 9.4 12.7 15.5 14.4 10.6 8.0 12.1Equity 1.4 1.9 3.3 4.5 5.4 5.1 3.7 2.8 4.2
Utility (water & sewerage) 10.6 9.1 7.6 1.5 2.3 3.3 1.2 3.9 4.5Debt 8.2 7.0 5.9 1.1 1.8 2.5 0.9 3.0 3.5Equity 2.4 2.1 1.7 0.3 0.5 0.7 0.3 0.9 1.0
Note: e � estimate.a. The total volume of capital raised internationally through bank loans, bonds, and equity offering for developing countries’ infrastructure.
gdf_174-233.qxd 4/6/04 12:58 PM Page 217

A P P E N D I X B : S U M M A R Y S T A T I S T I C A L T A B L E S
218
Table B.41 Change in foreign-exchange reserves, 1995–2003$ billions (� � increase)
Gross foreign-exchangereserves
2002 1995 1996 1997 1998 1999 2000 2001 2002 2003e
All developing countries 951.4 �96.1 �90.4 �52.8 �16.6 �38.1 �52.6 �80.2 �172.9 �276.0
East Asia and Pacific 408.3 �29.0 �45.2 �12.8 �20.7 �29.3 �10.1 �47.7 �88.0 �136.2China 286.4 �22.0 �31.5 �34.9 �5.1 �9.7 �10.9 �46.6 �74.2 �116.7Indonesia 30.8 �1.5 �4.5 1.7 �6.3 �3.8 �2.0 1.2 �3.7 �4.0Malaysia 33.3 1.9 �3.2 6.1 �4.7 �4.9 1.0 �1.0 �3.7 �10.2Philippines 13.0 �0.4 �3.7 2.8 �2.0 �4.0 0.2 �0.4 0.3 �0.3Thailand 38.0 �6.6 �1.7 11.5 �2.7 �5.4 1.9 �0.4 �5.7 �2.9
Europe and Central Asia 174.9 �41.0 �2.3 �7.3 �4.9 �7.2 �16.8 �10.3 �44.9 �60.7Czech Republic 23.3 �7.7 1.5 2.6 �2.8 �0.3 �0.2 �1.2 �9.1 �3.0Hungary 9.7 �5.2 2.3 1.3 �0.9 �1.5 �0.2 0.6 0.6 �2.3Poland 28.0 �8.9 �3.1 �2.6 �6.9 1.1 �0.2 1.2 �2.8 �3.8Russian Federation 44.1 �10.3 3.0 �1.5 5.0 �0.7 �15.8 �8.3 �11.5 �29.1Turkey 26.9 �5.3 �4.0 �2.2 �0.8 �3.7 0.9 3.6 �8.2 �6.9
Latin America and the Caribbean 156.0 �23.4 �28.0 �13.5 9.2 7.5 �2.9 �2.9 �0.1 �32.9Argentina 10.4 0.0 �4.0 �4.4 �2.3 �1.6 1.7 9.9 4.1 �2.7Brazil 37.4 �12.6 �8.6 7.5 8.2 7.8 2.3 �3.2 �1.7 �11.7Chile 14.8 �1.0 �0.8 �2.3 2.0 1.1 �0.5 0.6 �0.8 �0.3Mexico 49.9 �9.1 �3.9 �9.0 �3.3 0.5 �4.2 �9.2 �5.5 �7.8Venezuela, R. B. de 8.0 1.7 �5.4 �2.9 2.4 �0.1 �0.9 3.8 0.8 �7.5
Middle East and North Africa 97.4 �3.8 �11.5 �6.6 1.5 �2.6 �12.2 �8.8 �12.2 �9.2Algeria 23.1 0.6 �2.2 �3.8 1.2 2.4 �7.5 �6.1 �5.1 �9.8Egypt, Arab Rep. of 13.2 �2.7 �1.2 �1.3 0.6 3.6 1.4 0.0 �0.3 �0.1Saudi Arabia 16.7 �1.2 �5.7 �0.6 0.8 �2.8 �2.5 3.2 �1.9 �0.9
South Asia 79.8 4.1 �0.6 �5.2 �3.0 �5.0 �4.7 �10.2 �27.0 �34.6Bangladesh 1.7 1.9 0.5 0.2 �0.3 0.3 0.1 0.2 �0.4 �0.9India 67.0 1.2 �2.3 �4.6 �2.6 �5.0 �5.3 �8.0 �21.7 �30.6Pakistan 8.1 0.0 1.2 �0.6 0.2 �0.5 0.0 �2.1 �4.4 �2.6
Sub-Saharan Africa 35.1 �3.0 �2.8 �7.5 1.4 �1.5 �5.8 �0.3 �0.7 �2.4Botswana 5.4 0.0 �0.3 �0.7 �0.2 �0.4 0.0 0.4 0.4 0.1Nigeria 7.3 �0.1 �2.6 �3.5 0.5 1.7 �4.5 �0.5 3.1 0.2South Africa 5.6 �1.1 1.9 �3.8 0.6 �1.9 0.3 0.0 0.2 �0.6
Note: e � estimate.
gdf_174-233.qxd 4/6/04 12:58 PM Page 218

E X T E R N A L L I A B I L I T I E S A N D A S S E T S
219
Table B.42 Total external debt of developing countries, 1995–2003$ billions
1995 1996 1997 1998 1999 2000 2001 2002 2003e
All developing countries 1,990.3 2,056.1 2,122.6 2,342.1 2,374.7 2,305.0 2,266.7 2,338.8 2,433.3
East Asia and Pacific 455.6 490.4 526.3 533.2 538.6 497.3 501.3 497.4 514.7China 118.1 128.8 146.7 144.0 152.1 145.7 170.1 168.3 —Indonesia 124.4 128.9 136.2 151.2 151.2 144.4 134.0 132.2 —Malaysia 34.3 39.7 47.2 42.4 41.9 41.9 44.6 48.6 —Philippines 39.4 44.0 50.7 53.5 58.0 57.4 57.8 59.3 —Thailand 100.0 112.8 109.7 104.9 96.8 79.7 67.2 59.2 —
Europe and Central Asia 349.0 367.1 387.5 485.2 495.6 503.9 498.9 545.8 577.4Bulgaria 10.4 10.1 9.9 10.0 10.1 10.2 9.6 10.5 —Czech Republic 16.2 20.1 23.1 24.2 22.8 21.5 22.3 26.4 —Hungary 31.7 27.3 24.6 28.5 29.9 29.5 30.3 35.0 —Poland 44.3 43.5 40.4 55.5 60.7 63.3 63.3 69.5 —Russian Federation 121.5 126.4 127.6 177.9 174.8 160.0 152.5 147.5 —Turkey 73.8 79.8 84.8 97.1 102.2 117.4 113.4 131.6 —
Latin America and the Caribbean 612.2 633.7 665.8 748.4 770.2 751.9 729.3 727.9 762.1Argentina 98.8 111.4 128.4 141.5 145.3 145.9 136.7 132.3 —Brazil 160.5 181.3 198.0 241.0 243.7 238.8 226.4 227.9 —Chile 22.0 23.0 22.8 30.2 34.3 37.0 38.4 41.9 —Colombia 25.0 28.9 31.9 33.1 34.4 33.9 36.7 33.9 —Mexico 165.4 156.3 147.6 159.0 166.5 150.3 145.7 141.3 —Venezuela, R. B. de 35.5 34.5 35.7 37.8 37.6 38.2 35.0 32.6 —
Middle East and North Africa 186.4 180.5 172.6 189.3 193.6 180.7 178.4 189.0 188.1Algeria 33.0 33.6 30.9 30.7 28.0 25.3 22.6 22.8 —Egypt, Arab Rep. of 33.5 31.5 30.1 32.4 31.0 29.2 29.3 30.8 —Lebanon 3.0 4.0 5.0 6.8 8.2 9.9 12.4 17.1 —
South Asia 151.7 149.6 149.6 157.6 162.0 159.9 156.3 168.3 171.3India 94.5 93.5 94.3 97.6 98.3 99.1 97.5 104.4 —Pakistan 30.2 29.8 30.1 32.3 33.9 32.8 31.7 33.7 —
Sub-Saharan Africa 235.4 231.2 220.7 228.4 214.7 211.2 202.6 210.3 219.7South Africa 25.4 26.1 25.3 24.8 23.9 24.9 24.1 25.0 —
Note: — � not available; e � estimate.
gdf_174-233.qxd 4/6/04 12:58 PM Page 219

A P P E N D I X B : S U M M A R Y S T A T I S T I C A L T A B L E S
220
Table B.43 Total external debt of developing countries: medium and long term, 1995–2003$ billions
1995 1996 1997 1998 1999 2000 2001 2002 2003e
All developing countries 1,631.9 1,674.1 1,729.4 1,983.5 2,033.4 1,981.7 1,937.8 2,012.4 2,069.0
East Asia and Pacific 346.8 365.3 394.3 447.2 464.8 434.1 410.5 397.9 402.7China 95.8 103.4 115.2 126.7 136.9 132.6 128.4 120.4 —Indonesia 98.4 96.7 103.3 131.1 131.2 121.8 112.2 108.9 —Malaysia 27.1 28.6 32.3 33.9 35.9 37.3 38.3 40.2 —Philippines 34.1 36.1 38.9 46.3 52.3 51.5 51.8 53.8 —Thailand 55.9 65.1 71.9 75.3 73.4 64.8 54.0 47.3 —
Europe and Central Asia 304.7 315.0 331.6 414.5 423.3 423.5 423.9 468.9 484.2Bulgaria 9.9 9.2 9.1 9.6 9.7 9.8 9.3 9.6 —Czech Republic 11.1 14.3 15.0 16.6 14.0 12.5 12.8 15.7 —Hungary 28.4 23.9 21.2 23.7 26.3 25.4 25.7 29.3 —Poland 42.1 40.8 36.6 49.3 54.6 56.2 56.3 60.6 —Russian Federation 111.2 114.5 121.7 163.1 159.0 144.4 133.5 131.2 —Turkey 58.1 62.5 66.8 75.9 78.8 88.5 97.1 116.4 —
Latin America and the Caribbean 488.8 516.7 541.8 632.9 664.0 648.6 639.8 652.2 678.2Argentina 77.4 87.9 96.4 110.6 115.9 117.6 116.7 117.5 —Brazil 129.3 145.4 163.2 211.1 214.5 207.8 198.1 204.5 —Chile 18.6 20.4 21.5 28.6 33.1 34.5 35.8 38.2 —Colombia 19.5 23.0 26.2 26.9 30.5 31.1 33.0 30.1 —Mexico 128.1 126.4 119.8 132.7 142.4 131.4 131.1 131.4 —Venezuela, R. B. de 32.5 31.8 31.5 35.5 35.5 34.1 31.2 28.8 —
Middle East and North Africa 154.2 149.1 140.5 152.3 152.6 143.4 141.4 151.1 150.3Algeria 32.8 33.3 30.7 30.5 27.8 25.0 22.4 22.7 —Egypt, Arab Rep. of 31.1 29.2 27.1 28.2 26.8 25.1 26.0 27.3 —Lebanon 1.6 2.3 3.2 4.8 6.0 7.3 9.8 14.5 —
South Asia 142.6 139.3 141.4 150.5 154.9 153.9 151.4 161.1 162.9India 89.4 86.7 89.3 93.3 94.4 95.6 94.8 99.9 —Pakistan 27.0 27.0 27.6 30.1 32.1 31.3 30.4 32.1 —
Sub-Saharan Africa 194.7 188.6 179.8 186.0 173.7 178.1 170.9 181.2 190.9South Africa 15.7 15.2 14.3 13.3 13.1 15.3 15.7 17.6 —
Note: — � not available; e � estimate.
gdf_174-233.qxd 4/6/04 12:58 PM Page 220

E X T E R N A L L I A B I L I T I E S A N D A S S E T S
221
Table B.44 Total external debt of developing countries: short term, 1995–2003$ billions
1995 1996 1997 1998 1999 2000 2001 2002 2003e
All developing countries 358.5 382.0 393.2 358.6 341.3 323.3 329.0 326.4 364.3
East Asia and Pacific 108.8 128.7 132.1 85.9 73.8 63.2 90.8 99.5 112.1China 22.3 25.4 31.5 17.3 15.2 13.1 41.6 47.9 —Indonesia 26.0 32.2 32.9 20.1 20.0 22.6 21.8 23.3 —Malaysia 7.3 11.1 14.9 8.5 6.0 4.6 6.3 8.4 —Philippines 5.3 8.0 11.8 7.2 5.7 5.9 6.0 5.6 —Thailand 44.1 47.7 37.8 29.7 23.4 14.9 13.2 11.9 —
Europe and Central Asia 44.3 52.1 56.0 70.7 72.3 80.4 75.0 77.0 93.2Bulgaria 0.5 0.9 0.7 0.4 0.4 0.4 0.3 0.8 —Czech Republic 5.1 5.7 8.1 7.6 8.8 9.0 9.6 10.8 —Hungary 3.2 3.4 3.4 4.8 3.5 4.2 4.6 5.7 —Poland 2.2 2.7 3.8 6.2 6.0 7.1 7.0 8.9 —Russian Federation 10.2 12.0 5.9 14.8 15.7 15.6 19.0 16.3 —Turkey 15.7 17.3 18.0 21.2 23.5 28.9 16.3 15.2 —
Latin America and the Caribbean 123.4 116.9 124.0 115.5 106.2 103.4 89.5 75.7 84.0Argentina 21.4 23.5 32.0 31.0 29.4 28.3 20.0 14.8 —Brazil 31.2 35.9 34.9 29.9 29.2 31.0 28.3 23.4 —Chile 3.4 2.6 1.3 1.6 1.2 2.5 2.6 3.8 —Colombia 5.5 5.9 5.8 6.2 4.0 2.9 3.7 3.8 —Mexico 37.3 29.8 27.9 26.3 24.1 18.9 14.6 9.9 —Venezuela, R. B. de 3.1 2.7 4.2 2.2 2.1 4.1 3.7 3.7 —
Middle East and North Africa 32.2 31.4 32.1 37.0 41.0 37.3 37.1 37.9 37.9Algeria 0.3 0.3 0.2 0.2 0.2 0.2 0.2 0.1 —Egypt, Arab Rep. of 2.4 2.3 3.0 4.3 4.3 4.1 3.4 3.5 —Lebanon 1.4 1.7 1.8 2.0 2.2 2.5 2.7 2.5 —
South Asia 9.0 10.3 8.2 7.1 7.0 6.0 4.9 7.2 8.4India 5.0 6.7 5.0 4.3 3.9 3.5 2.7 4.6 —Pakistan 3.2 2.8 2.5 2.2 1.8 1.5 1.3 1.5 —
Sub-Saharan Africa 40.6 42.6 40.8 42.4 41.0 33.1 31.7 29.1 28.8South Africa 9.7 10.8 10.9 11.4 10.8 9.6 8.4 7.4 —
Note: — � not available; e � estimate.
gdf_174-233.qxd 4/6/04 12:58 PM Page 221
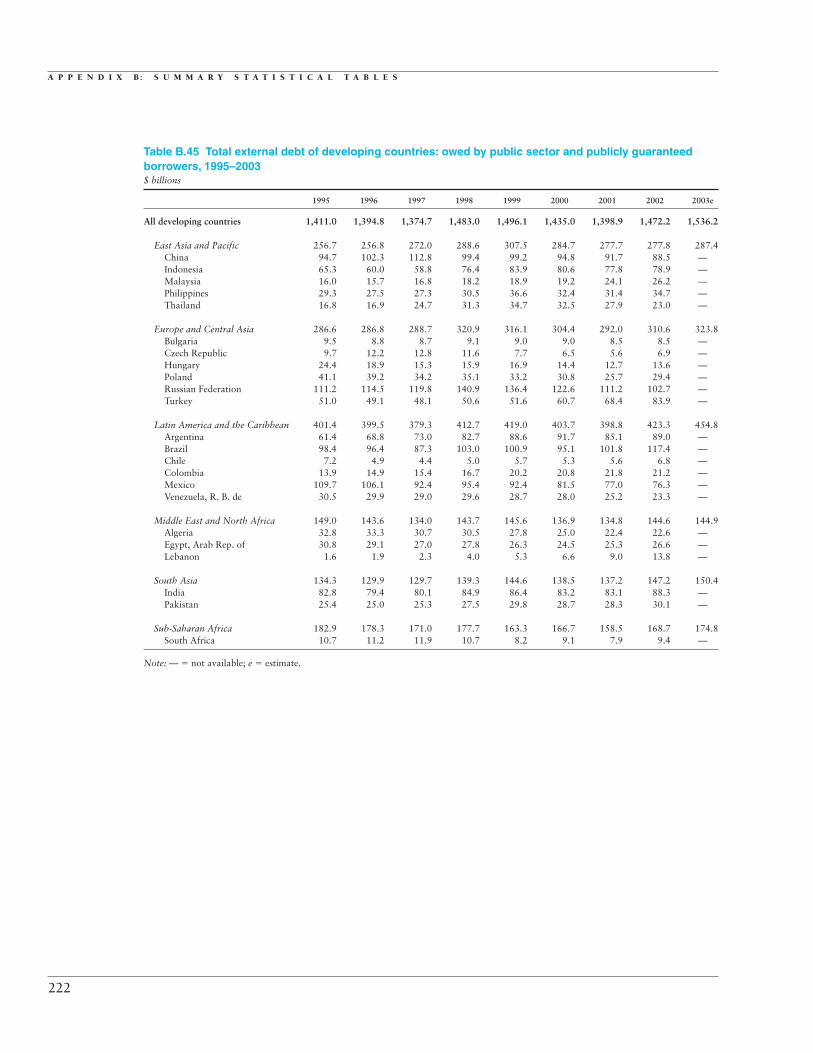
A P P E N D I X B : S U M M A R Y S T A T I S T I C A L T A B L E S
222
Table B.45 Total external debt of developing countries: owed by public sector and publicly guaranteed borrowers, 1995–2003$ billions
1995 1996 1997 1998 1999 2000 2001 2002 2003e
All developing countries 1,411.0 1,394.8 1,374.7 1,483.0 1,496.1 1,435.0 1,398.9 1,472.2 1,536.2
East Asia and Pacific 256.7 256.8 272.0 288.6 307.5 284.7 277.7 277.8 287.4China 94.7 102.3 112.8 99.4 99.2 94.8 91.7 88.5 —Indonesia 65.3 60.0 58.8 76.4 83.9 80.6 77.8 78.9 —Malaysia 16.0 15.7 16.8 18.2 18.9 19.2 24.1 26.2 —Philippines 29.3 27.5 27.3 30.5 36.6 32.4 31.4 34.7 —Thailand 16.8 16.9 24.7 31.3 34.7 32.5 27.9 23.0 —
Europe and Central Asia 286.6 286.8 288.7 320.9 316.1 304.4 292.0 310.6 323.8Bulgaria 9.5 8.8 8.7 9.1 9.0 9.0 8.5 8.5 —Czech Republic 9.7 12.2 12.8 11.6 7.7 6.5 5.6 6.9 —Hungary 24.4 18.9 15.3 15.9 16.9 14.4 12.7 13.6 —Poland 41.1 39.2 34.2 35.1 33.2 30.8 25.7 29.4 —Russian Federation 111.2 114.5 119.8 140.9 136.4 122.6 111.2 102.7 —Turkey 51.0 49.1 48.1 50.6 51.6 60.7 68.4 83.9 —
Latin America and the Caribbean 401.4 399.5 379.3 412.7 419.0 403.7 398.8 423.3 454.8Argentina 61.4 68.8 73.0 82.7 88.6 91.7 85.1 89.0 —Brazil 98.4 96.4 87.3 103.0 100.9 95.1 101.8 117.4 —Chile 7.2 4.9 4.4 5.0 5.7 5.3 5.6 6.8 —Colombia 13.9 14.9 15.4 16.7 20.2 20.8 21.8 21.2 —Mexico 109.7 106.1 92.4 95.4 92.4 81.5 77.0 76.3 —Venezuela, R. B. de 30.5 29.9 29.0 29.6 28.7 28.0 25.2 23.3 —
Middle East and North Africa 149.0 143.6 134.0 143.7 145.6 136.9 134.8 144.6 144.9Algeria 32.8 33.3 30.7 30.5 27.8 25.0 22.4 22.6 —Egypt, Arab Rep. of 30.8 29.1 27.0 27.8 26.3 24.5 25.3 26.6 —Lebanon 1.6 1.9 2.3 4.0 5.3 6.6 9.0 13.8 —
South Asia 134.3 129.9 129.7 139.3 144.6 138.5 137.2 147.2 150.4India 82.8 79.4 80.1 84.9 86.4 83.2 83.1 88.3 —Pakistan 25.4 25.0 25.3 27.5 29.8 28.7 28.3 30.1 —
Sub-Saharan Africa 182.9 178.3 171.0 177.7 163.3 166.7 158.5 168.7 174.8South Africa 10.7 11.2 11.9 10.7 8.2 9.1 7.9 9.4 —
Note: — � not available; e � estimate.
gdf_174-233.qxd 4/6/04 12:58 PM Page 222

E X T E R N A L L I A B I L I T I E S A N D A S S E T S
223
Table B.46 Total external debt of developing countries: owed by private sector borrowers, 1995–2003$ billions
1995 1996 1997 1998 1999 2000 2001 2002 2003e
All developing countries 579.4 661.3 747.9 859.1 878.6 870.0 867.9 866.7 897.1
East Asia and Pacific 198.9 237.2 254.4 244.6 231.1 212.6 223.6 219.6 227.3China 23.4 26.6 33.9 44.6 52.9 50.9 78.4 79.7 —Indonesia 59.1 68.9 77.3 74.8 67.3 63.8 56.2 53.3 —Malaysia 18.3 24.0 30.4 24.3 23.0 22.7 20.5 22.4 —Philippines 10.1 16.5 23.5 23.0 21.4 25.0 26.5 24.7 —Thailand 83.2 96.0 85.0 73.6 62.0 47.2 39.3 36.2 —
Europe and Central Asia 62.4 80.3 98.8 164.3 179.5 199.5 206.9 235.2 253.5Bulgaria 0.9 1.3 1.2 1.0 1.1 1.2 1.1 1.9 —Czech Republic 6.5 7.8 10.2 12.7 15.1 15.0 16.7 19.5 —Hungary 7.3 8.4 9.3 12.6 13.0 15.2 17.6 21.4 —Poland 3.2 4.3 6.2 20.4 27.5 32.5 37.6 40.1 —Russian Federation 10.2 12.0 7.8 36.9 38.3 37.4 41.3 44.8 —Turkey 22.8 30.8 36.7 46.6 50.6 56.7 45.0 47.6 —
Latin America and the Caribbean 210.8 234.2 286.5 335.6 351.2 348.2 330.5 304.7 307.3Argentina 37.4 42.6 55.4 58.8 56.7 54.2 51.6 43.3 —Brazil 62.1 84.9 110.7 138.0 142.8 143.7 124.6 110.5 —Chile 14.9 18.2 18.4 25.2 28.6 31.8 32.8 35.2 —Colombia 11.1 14.0 16.5 16.3 14.2 13.1 14.9 12.7 —Mexico 55.6 50.2 55.2 63.5 74.1 68.8 68.6 64.9 —Venezuela, R. B. de 5.1 4.5 6.7 8.2 8.9 10.2 9.7 9.3 —
Middle East and North Africa 37.4 36.9 38.7 45.6 48.0 43.8 43.6 44.4 43.2Algeria 0.3 0.3 0.2 0.2 0.2 0.2 0.2 0.2 —Egypt, Arab Rep. of 2.7 2.5 3.1 4.6 4.8 4.7 4.0 4.1 —Lebanon 1.4 2.1 2.7 2.7 2.9 3.3 3.5 3.2 —
South Asia 17.3 19.8 19.9 18.3 17.4 21.4 19.1 21.1 20.9India 11.7 14.1 14.3 12.7 11.9 15.9 14.4 16.2 —Pakistan 4.8 4.8 4.8 4.8 4.1 4.1 3.4 3.5 —
Sub-Saharan Africa 52.4 52.9 49.7 50.7 51.4 44.4 44.1 41.7 44.9South Africa 14.6 14.8 13.3 14.1 15.7 15.8 16.1 15.6 —
Note: — � not available; e � estimate.
gdf_174-233.qxd 4/6/04 12:58 PM Page 223

A P P E N D I X B : S U M M A R Y S T A T I S T I C A L T A B L E S
224
Table B.47 Total external debt of developing countries: owed to public sector creditors, 1995–2003$ billions
1995 1996 1997 1998 1999 2000 2001 2002 2003e
All developing countries 867.3 833.2 791.1 866.4 881.1 839.1 826.1 872.1 914.1
East Asia and Pacific 160.9 153.7 152.5 179.1 200.3 188.2 180.5 183.3 190.9China 37.0 39.4 39.8 45.1 50.4 50.4 50.5 50.7 —Indonesia 51.2 46.1 45.5 58.2 66.3 65.9 62.1 65.2 —Malaysia 5.5 4.2 4.0 4.5 4.8 5.0 5.9 5.8 —Philippines 23.4 21.0 19.7 22.2 23.6 22.0 19.8 21.0 —Thailand 11.2 10.6 17.8 21.4 25.3 23.9 20.8 16.6 —
Europe and Central Asia 156.1 160.1 156.1 172.3 171.1 166.4 158.8 165.0 167.9Bulgaria 3.7 3.4 3.4 3.8 3.9 3.9 3.4 3.5 —Czech Republic 1.3 1.3 1.1 1.1 1.1 1.1 1.2 1.5 —Hungary 4.8 3.7 3.3 2.3 2.3 1.9 1.7 1.9 —Poland 32.2 30.5 26.6 27.1 25.1 23.7 17.8 19.7 —Russian Federation 67.1 75.6 76.8 88.3 86.7 82.5 71.7 62.2 —Turkey 18.0 15.9 14.3 15.0 13.8 17.4 26.9 35.9 —
Latin America and the Caribbean 187.3 164.0 145.7 160.8 162.9 149.8 162.6 182.6 200.5Argentina 27.1 26.1 24.2 25.9 25.5 25.6 35.2 35.7 —Brazil 28.0 25.4 22.2 32.7 37.7 31.1 37.2 52.2 —Chile 3.6 2.7 2.2 2.2 2.1 1.9 1.7 1.5 —Colombia 7.1 6.5 5.6 6.0 7.8 7.7 8.6 8.7 —Mexico 54.8 42.6 32.1 31.4 26.3 20.8 19.9 20.5 —Venezuela, R. B. de 6.9 6.3 5.5 6.7 6.6 6.1 4.9 4.4 —
Middle East and North Africa 107.9 107.5 99.7 104.1 98.5 90.9 88.6 91.5 94.1Algeria 17.2 20.2 20.3 21.5 20.4 19.2 17.7 17.6 —Egypt, Arab Rep. of 29.1 27.7 25.9 26.9 25.7 24.0 23.4 24.7 —Lebanon 0.4 0.6 0.7 0.9 0.9 0.9 1.0 1.0 —
South Asia 108.9 104.1 98.9 104.6 113.3 102.8 101.1 106.3 112.1India 59.5 55.9 52.8 53.9 58.6 50.6 49.8 49.9 —Pakistan 24.3 23.8 22.8 25.1 27.7 26.6 26.9 29.2 —
Sub-Saharan Africa 146.2 143.9 138.1 145.5 135.0 140.9 134.5 143.3 148.6South Africa 0.9 0.9 0.4 0.0 0.0 0.1 0.1 0.1 —
Note: — � not available; e � estimate.
gdf_174-233.qxd 4/6/04 12:58 PM Page 224

E X T E R N A L L I A B I L I T I E S A N D A S S E T S
225
Table B.48 Total external debt of developing countries: owed to private sector creditors, 1995–2003$ billions
1995 1996 1997 1998 1999 2000 2001 2002 2003e
All developing countries 1,123.0 1,222.9 1,331.5 1,475.7 1,493.5 1,465.9 1,440.7 1,466.8 1,519.2
East Asia and Pacific 294.7 340.3 373.8 354.1 338.3 309.1 320.8 314.1 323.8China 81.1 89.4 106.9 98.9 101.6 95.3 119.6 117.5 —Indonesia 73.1 82.8 90.7 93.1 84.9 78.5 72.0 67.0 —Malaysia 28.9 35.5 43.2 37.9 37.1 37.0 38.8 42.8 —Philippines 16.0 23.0 31.1 31.4 34.4 35.4 38.0 38.3 —Thailand 88.9 102.3 91.9 83.5 71.5 55.8 46.4 42.6 —
Eastern Europe and Central Asia 192.9 207.1 231.4 312.9 324.5 337.5 340.0 380.8 409.5Bulgaria 6.7 6.7 6.5 6.2 6.2 6.3 6.2 7.0 —Czech Republic 14.9 18.7 22.0 23.1 21.7 20.5 21.1 24.9 —Hungary 26.8 23.6 21.3 26.2 27.6 27.6 28.6 33.1 —Poland 12.0 13.0 13.8 28.4 35.6 39.6 45.5 49.8 —Russian Federation 54.4 50.8 50.8 89.6 88.1 77.6 80.8 85.4 —Turkey 55.8 64.0 70.5 82.2 88.4 100.0 86.5 95.6 —
Latin America and the Caribbean 424.8 469.7 520.1 587.6 607.3 602.1 566.7 545.3 561.6Argentina 71.7 85.3 104.2 115.6 119.8 120.3 101.5 96.6 —Brazil 132.5 155.9 175.8 208.4 206.0 207.7 189.2 175.7 —Chile 18.5 20.3 20.6 28.0 32.2 35.1 36.7 40.5 —Colombia 18.0 22.4 26.3 27.1 26.6 26.2 28.1 25.2 —Mexico 110.6 113.6 115.6 127.5 140.2 129.5 125.8 120.7 —Venezuela, R. B. de 28.6 28.2 30.2 31.0 31.0 32.0 30.0 28.2 —
Middle East and North Africa 78.5 73.0 72.9 85.2 95.1 89.8 89.8 97.5 94.1Algeria 15.9 13.4 10.6 9.2 7.6 6.1 4.9 5.2 —Egypt, Arab Rep. of 4.4 3.8 4.2 5.5 5.3 5.2 6.0 6.1 —Lebanon 2.5 3.4 4.3 5.9 7.3 8.9 11.5 16.1 —
South Asia 42.8 45.5 50.7 53.0 48.7 57.2 55.2 62.0 59.2India 35.0 37.6 41.5 43.7 39.7 48.5 47.7 54.5 —Pakistan 5.9 6.0 7.2 7.2 6.2 6.1 4.8 4.5 —
Sub-Saharan Africa 89.2 87.3 82.6 82.9 79.8 70.2 68.1 67.0 71.1South Africa 24.4 25.2 24.9 24.8 23.9 24.7 23.9 24.9 —
Note: — � not available; e � estimate.
gdf_174-233.qxd 4/6/04 12:58 PM Page 225
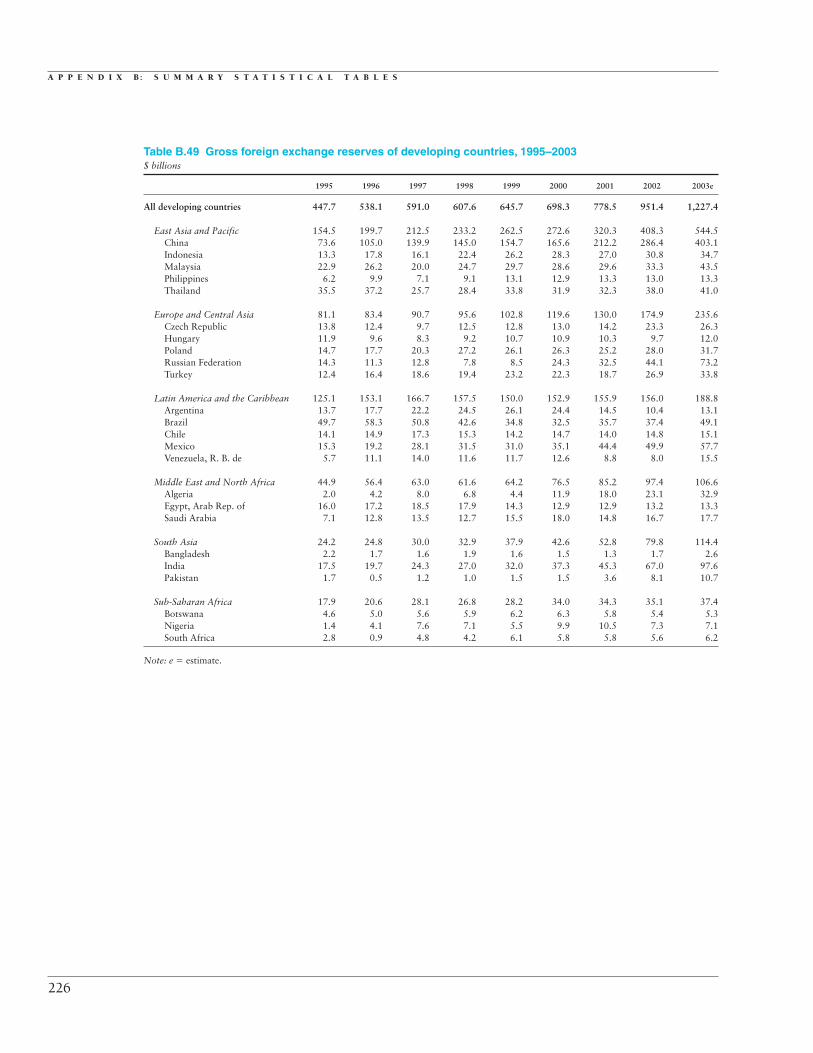
A P P E N D I X B : S U M M A R Y S T A T I S T I C A L T A B L E S
226
Table B.49 Gross foreign exchange reserves of developing countries, 1995–2003$ billions
1995 1996 1997 1998 1999 2000 2001 2002 2003e
All developing countries 447.7 538.1 591.0 607.6 645.7 698.3 778.5 951.4 1,227.4
East Asia and Pacific 154.5 199.7 212.5 233.2 262.5 272.6 320.3 408.3 544.5China 73.6 105.0 139.9 145.0 154.7 165.6 212.2 286.4 403.1Indonesia 13.3 17.8 16.1 22.4 26.2 28.3 27.0 30.8 34.7Malaysia 22.9 26.2 20.0 24.7 29.7 28.6 29.6 33.3 43.5Philippines 6.2 9.9 7.1 9.1 13.1 12.9 13.3 13.0 13.3Thailand 35.5 37.2 25.7 28.4 33.8 31.9 32.3 38.0 41.0
Europe and Central Asia 81.1 83.4 90.7 95.6 102.8 119.6 130.0 174.9 235.6Czech Republic 13.8 12.4 9.7 12.5 12.8 13.0 14.2 23.3 26.3Hungary 11.9 9.6 8.3 9.2 10.7 10.9 10.3 9.7 12.0Poland 14.7 17.7 20.3 27.2 26.1 26.3 25.2 28.0 31.7Russian Federation 14.3 11.3 12.8 7.8 8.5 24.3 32.5 44.1 73.2Turkey 12.4 16.4 18.6 19.4 23.2 22.3 18.7 26.9 33.8
Latin America and the Caribbean 125.1 153.1 166.7 157.5 150.0 152.9 155.9 156.0 188.8Argentina 13.7 17.7 22.2 24.5 26.1 24.4 14.5 10.4 13.1Brazil 49.7 58.3 50.8 42.6 34.8 32.5 35.7 37.4 49.1Chile 14.1 14.9 17.3 15.3 14.2 14.7 14.0 14.8 15.1Mexico 15.3 19.2 28.1 31.5 31.0 35.1 44.4 49.9 57.7Venezuela, R. B. de 5.7 11.1 14.0 11.6 11.7 12.6 8.8 8.0 15.5
Middle East and North Africa 44.9 56.4 63.0 61.6 64.2 76.5 85.2 97.4 106.6Algeria 2.0 4.2 8.0 6.8 4.4 11.9 18.0 23.1 32.9Egypt, Arab Rep. of 16.0 17.2 18.5 17.9 14.3 12.9 12.9 13.2 13.3Saudi Arabia 7.1 12.8 13.5 12.7 15.5 18.0 14.8 16.7 17.7
South Asia 24.2 24.8 30.0 32.9 37.9 42.6 52.8 79.8 114.4Bangladesh 2.2 1.7 1.6 1.9 1.6 1.5 1.3 1.7 2.6India 17.5 19.7 24.3 27.0 32.0 37.3 45.3 67.0 97.6Pakistan 1.7 0.5 1.2 1.0 1.5 1.5 3.6 8.1 10.7
Sub-Saharan Africa 17.9 20.6 28.1 26.8 28.2 34.0 34.3 35.1 37.4Botswana 4.6 5.0 5.6 5.9 6.2 6.3 5.8 5.4 5.3Nigeria 1.4 4.1 7.6 7.1 5.5 9.9 10.5 7.3 7.1South Africa 2.8 0.9 4.8 4.2 6.1 5.8 5.8 5.6 6.2
Note: e � estimate.
gdf_174-233.qxd 4/6/04 12:58 PM Page 226

K E Y D E B T R A T I O S A N D C O U N T R Y C L A S S I F I C A T I O N S
227
Table B.50 Key external debt ratios for developing countries%, averages for 2000–02
Total external debt Present value EDT as % of gross Total debt Interest(EDT) to exports of (PV) of EDT as national income PV as % service as % of service as %
G&S (XGS) % of XGS (GNI) of GNI XGS of XGS
Albania 84 56 30 20 4 2Algeria 109 104 43 42 20 6Angola 129 125 123 118 11 2Argentina 372 393 63 66 16 7Armenia 168 109 52 34 11 4Azerbaijan 55 44 26 21 7 1Bangladesh 182 117 35 22 8 2Belarus 11 10 7 7 2 0Belize 178 202 114 129 40 11Benin 288 136 76 36 10 4Bhutan 265 244 79 73 5 1Bolivia 282 105 62 23 28 7Bosnia and Herzegovina 107 76 47 34 7 3Botswana 17 14 10 8 2 1Brazil 316 336 45 48 72 20Bulgaria 132 136 77 79 17 5Burkina Faso 493 145 56 16 16 5Burundi 2,492 1,553 176 110 48 14Cambodia 129 109 86 73 1 0Cameroon 321 183 102 58 14 6Cape Verde 160 102 74 48 8 3Central African Republic 831 597 107 77 1 0Chad 542 259 77 37 12 4Chile 174 173 63 63 32 7China 52 50 15 14 9 2Colombia 191 204 43 46 39 12Comoros 753 535 119 84 13 3Congo, Dem. Rep. of 836 805 178 171 89 28Congo, Rep. of 211 200 241 228 1 0Costa Rica 64 67 31 33 9 4Côte d’Ivoire 235 188 114 91 17 6Croatia 145 142 78 76 28 5Czech Republic 62 62 46 46 11 3Djibouti 133 87 57 37 5 1Dominica 150 138 88 81 8 4Dominican Republic 59 56 32 30 6 3Ecuador 222 244 87 95 30 14Egypt, Arab Rep. of 149 129 32 28 10 4El Salvador 102 109 43 46 8 5Equatorial Guinea 13 10 57 47 0 0Eritrea 345 200 69 40 6 4Estonia 90 89 87 86 15 4Ethiopiaa 614 374 103 63 10 4Fiji 43 41 12 12 6 2Gabon 107 107 87 87 12 5Gambia, The 256 132 150 77 9 3Georgia 178 133 56 42 12 4Ghana 291 155 137 73 8 4Grenada 161 141 91 80 12 6Guatemala 94 90 22 21 8 4Guinea 391 165 111 47 16 4Guinea-Bissau 1,145 747 354 231 24 8Guyana 205 119 221 129 11 5Haiti 113 76 34 23 3 1Honduras 174 100 86 49 13 3Hungary 88 82 66 62 37 3India 130 103 22 17 16 5Indonesia 191 189 90 89 24 6Iran, Islamic Rep. of 29 25 9 7 5 1Jamaica 120 129 76 82 18 7
(Table continues on next page)
gdf_174-233.qxd 4/6/04 12:58 PM Page 227

A P P E N D I X B : S U M M A R Y S T A T I S T I C A L T A B L E S
228
Table B.50 Key external debt ratios for developing countries (continued )%, averages for 2000–02
Total external debt Present value EDT as % of gross Total debt Interest(EDT) to exports of (PV) of EDT as national income PV as % service as % of service as %
G&S (XGS) % of XGS (GNI) of GNI XGS of XGS
Jordan 129 118 92 84 9 3Kazakhstan 159 149 85 80 37 7Kenya 197 147 54 40 15 3Kyrgyz Republic 282 208 126 93 27 4Lao PDR 522 280 162 87 9 2Latvia 175 174 86 85 17 4Lebanon 333 352 96 102 43 21Lesotho 115 78 64 44 12 3Liberia 1,584 1,686 526 559 1 0Lithuania 97 94 51 50 20 5Macedonia, FYR of 101 83 45 37 15 3Madagascar 417 129 107 33 7 3Malawi 609 183 168 51 8 3Malaysia 44 44 58 57 7 2Maldives 57 42 45 34 5 1Mali 279 123 109 48 9 2Mauritania 600 148 243 60 17 5Mauritius 63 60 40 39 9 2Mexico 75 82 24 26 23 6Moldova 138 126 86 79 23 5Mongolia 149 102 100 69 8 2Morocco 129 119 55 51 26 8Mozambique 444 86 138 27 7 2Myanmar 241 150 — — 4 1Nepal 228 133 53 31 8 2Nicaragua 501 221 174 77 12 4Niger 527 149 92 26 8 3Nigeria 138 143 78 81 7 2Oman 39 38 24 23 15 2Pakistan 256 201 57 45 22 6Panama 91 107 71 84 18 6Papua New Guinea 117 113 85 82 13 3Paraguay 96 92 44 42 11 4Peru 280 296 53 56 33 12Philippines 130 135 75 77 20 7Poland 127 122 39 38 25 5Romania 103 106 36 37 22 4Russian Federation 121 122 49 50 12 6Rwanda 912 438 83 40 14 5Samoa 249 178 95 68 8 5São Tomé and Principe 1,903 640 751 253 35 15Senegal 247 152 86 53 14 5Serbia and Montenegro 280 269 108 104 3 3Seychelles 48 49 42 43 3 1Sierra Leone 1,181 585 207 102 19 8Slovak Republic 84 84 62 62 22 6Solomon Islands 139 100 66 47 4 2Somalia — — — — — —South Africa 66 66 22 22 12 3Sri Lanka 129 103 60 48 10 3St. Kitts and Nevis 157 148 84 80 23 11St. Lucia 110 107 67 65 7 4St. Vincent and the Grenadines 116 95 63 51 7 3Sudan 620 600 137 133 1 0Swaziland 27 26 26 25 2 1Syrian Arab Republic 274 270 116 114 3 2Tajikistan 152 118 113 88 10 2Tanzania 483 117 79 19 10 5Thailand 71 69 50 49 24 3
gdf_174-233.qxd 4/6/04 12:58 PM Page 228

K E Y D E B T R A T I O S A N D C O U N T R Y C L A S S I F I C A T I O N S
229
Table B.50 Key external debt ratios for developing countries %, averages for 2000–02
Total external debt Present value EDT as % of gross Total debt Interest(EDT) to exports of (PV) of EDT as national income PV as % service as % of service as %
G&S (XGS) % of XGS (GNI) of GNI XGS of XGS
Togo 314 231 125 92 3 1Tonga 102 68 50 34 4 1Trinidad and Tobago 55 61 31 35 5 4Tunisia 123 123 66 65 14 5Turkey 227 232 75 77 48 10Turkmenistan — — — — — —Uganda 378 116 72 22 7 3Ukraine 63 59 37 35 15 3Uruguay 274 278 65 65 33 12Uzbekistan 142 136 60 57 23 5Vanuatu 50 33 38 25 1 1Venezuela, R. B. de 101 113 29 33 23 7Vietnam 72 61 41 35 6 2Yemen, Rep. of 101 68 59 40 3 1Zambia 566 406 177 127 29 10Zimbabwe 197 190 35 33 3 1
Note: — � not available. For definition of indicators, see Sources and Definitions section. Numbers in italics include the effects of traditionalrelief and HIPC relief (countries that have reached the completion point) and are based on public and publicly guaranteed debt only. Exportscomprise the total value of goods and services exported, receipts of compensations of employees and investment income, and workers’ remittances. In the ratios, the numerator refers to the 2002 data and the denominator is an average of 2000 to 2002 data.a. As of December 31, 2002, Ethiopia had yet to reach the completion point under HIPC.
gdf_174-233.qxd 4/6/04 12:58 PM Page 229
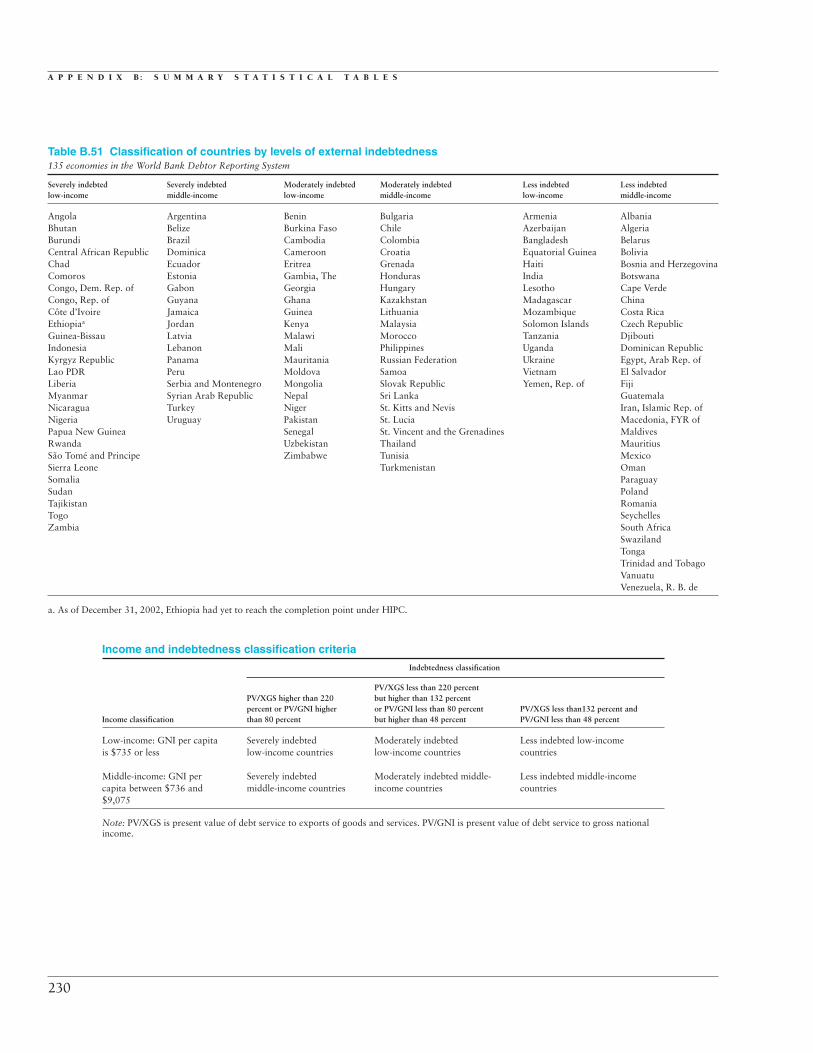
A P P E N D I X B : S U M M A R Y S T A T I S T I C A L T A B L E S
230
Table B.51 Classification of countries by levels of external indebtedness135 economies in the World Bank Debtor Reporting System
Severely indebted Severely indebted Moderately indebted Moderately indebted Less indebted Less indebtedlow-income middle-income low-income middle-income low-income middle-income
Angola Argentina Benin Bulgaria Armenia AlbaniaBhutan Belize Burkina Faso Chile Azerbaijan AlgeriaBurundi Brazil Cambodia Colombia Bangladesh BelarusCentral African Republic Dominica Cameroon Croatia Equatorial Guinea BoliviaChad Ecuador Eritrea Grenada Haiti Bosnia and HerzegovinaComoros Estonia Gambia, The Honduras India BotswanaCongo, Dem. Rep. of Gabon Georgia Hungary Lesotho Cape VerdeCongo, Rep. of Guyana Ghana Kazakhstan Madagascar ChinaCôte d’Ivoire Jamaica Guinea Lithuania Mozambique Costa RicaEthiopiaa Jordan Kenya Malaysia Solomon Islands Czech RepublicGuinea-Bissau Latvia Malawi Morocco Tanzania DjiboutiIndonesia Lebanon Mali Philippines Uganda Dominican RepublicKyrgyz Republic Panama Mauritania Russian Federation Ukraine Egypt, Arab Rep. ofLao PDR Peru Moldova Samoa Vietnam El SalvadorLiberia Serbia and Montenegro Mongolia Slovak Republic Yemen, Rep. of FijiMyanmar Syrian Arab Republic Nepal Sri Lanka GuatemalaNicaragua Turkey Niger St. Kitts and Nevis Iran, Islamic Rep. ofNigeria Uruguay Pakistan St. Lucia Macedonia, FYR ofPapua New Guinea Senegal St. Vincent and the Grenadines MaldivesRwanda Uzbekistan Thailand MauritiusSão Tomé and Principe Zimbabwe Tunisia MexicoSierra Leone Turkmenistan OmanSomalia ParaguaySudan PolandTajikistan RomaniaTogo SeychellesZambia South Africa
SwazilandTongaTrinidad and TobagoVanuatuVenezuela, R. B. de
a. As of December 31, 2002, Ethiopia had yet to reach the completion point under HIPC.
Income and indebtedness classification criteria
Indebtedness classification
PV/XGS less than 220 percentPV/XGS higher than 220 but higher than 132 percentpercent or PV/GNI higher or PV/GNI less than 80 percent PV/XGS less than132 percent and
Income classification than 80 percent but higher than 48 percent PV/GNI less than 48 percent
Low-income: GNI per capita Severely indebted Moderately indebted Less indebted low-incomeis $735 or less low-income countries low-income countries countries
Middle-income: GNI per Severely indebted Moderately indebted middle- Less indebted middle-income capita between $736 and middle-income countries income countries countries$9,075
Note: PV/XGS is present value of debt service to exports of goods and services. PV/GNI is present value of debt service to gross national income.
gdf_174-233.qxd 4/6/04 12:58 PM Page 230

K E Y D E B T R A T I O S A N D C O U N T R Y C L A S S I F I C A T I O N S
231
Table B.52 Classification of countries by region and level of income
Europe andMiddle East andSub-Saharan Africa
AsiaCentral Asia
North AfricaEast and Eastern
Income Southern West East Asia South Europe and Rest of Middle Northgroup Subgroup Africa Africa and Pacific Asia Central Asia Europe East Africa Americas
Low- Angola Benin Cambodia Afghanistan Azerbaijan Yemen, Haitiincome Burundi Burkina Faso Indonesia Bangladesh Georgia Rep. of Nicaragua
Comoros Cameroon Korea, Dem. Bhutan KyrgyzCongo, Dem. Central African Rep. of India RepublicRep. of Republic Lao PDR Nepal Moldova
Eritrea Chad Mongolia Pakistan TajikistanEthiopia Congo, Rep. of Myanmar UzbekistanKenya Côte d’Ivoire Papua NewLesotho Equatorial GuineaMadagascar Guinea SolomonMalawi Gambia, The IslandsMozambique Ghana Timor-LesteRwanda Guinea VietnamSomalia Guinea-BissauSudan LiberiaTanzania MaliUganda MauritaniaZambia NigerZimbabwe Nigeria
São Toméand Principe
SenegalSierra LeoneTogo
Middle- Lower Namibia Cape Verde China Maldives Albania Turkey Iran, Islamic Algeria Boliviaincome South Africa Fiji Sri Lanka Armenia Rep. of Djibouti Brazil
Swaziland Kiribati Belarus Iraq Egypt, Arab ColombiaMarshall Bosnia and Jordan Rep. of CubaIslands Herzegovina Syrian Arab Morocco Dominican
Micronesia, Bulgaria Republic Tunisia RepublicFederated Kazakhstan West Bank EcuadorStates of Macedonia, and Gaza El Salvador
Philippines FYRa GuatemalaSamoa Romania GuyanaThailand Russian HondurasTonga Federation JamaicaVanuatu Serbia and Paraguay
Montenegro PeruTurkmenistan St. Vincent andUkraine the Grenadines
Suriname
Upper Botswana Gabon American Croatia Lebanon Libya ArgentinaMauritius Samoa Czech Oman BelizeMayotte Malaysia Republic Saudi ChileSeychelles N. Mariana Estonia Arabia Costa Rica
Islands Hungary DominicaPalau Latvia Grenada
Lithuania MexicoPoland PanamaSlovak St. Kitts andRepublic Nevis
St. LuciaTrinidadand Tobago
UruguayVenezuela, R. B. de
(Table continues on next page)
gdf_174-233.qxd 4/6/04 12:58 PM Page 231

A P P E N D I X B : S U M M A R Y S T A T I S T I C A L T A B L E S
232
Table B.52 Classification of countries by region and level of income (continued )
Europe andMiddle East andSub-Saharan Africa
AsiaCentral Asia
North AfricaEast and Eastern
Income Southern West East Asia South Europe and Rest of Middle Northgroup Subgroup Africa Africa and Pacific Asia Central Asia Europe East Africa Americas
High- OECD Australia Austria Canadaincome Japan Belgium United States
Korea, DenmarkRep. of Finland
New Zealand Franceb
GermanyGreeceIcelandIrelandItalyLuxembourgNetherlandsNorwayPortugalSpainSwedenSwitzerlandUnitedKingdom
Non- Brunei Slovenia Andorra Bahrain Malta Antigua andOECD French Channel Israel Barbuda
Polynesia Islands Kuwait ArubaGuam Cyprus Qatar Bahamas, TheHong Kong, Faeroe United Arab BarbadosChinac Islands Emirates Bermuda
Macao, Greenland Cayman IslandsChinad Isle of Man Netherlands
New Liechtenstein AntillesCaledonia Monaco Puerto Rico
Singapore San Marino VirginTaiwan, Islands (U.S.)China
Note: For operational and analytical purposes, the World Bank’s main criterion for classifying economies is gross national income (GNI) per capita. Every economy isclassified as low income, middle income (subdivided into lower middle and upper middle), or high income. Other analytical groups, based on geographic regions andlevels of external debt, are also used.
Low-income and middle-income economies are sometimes referred to as developing economies. The use of the term is convenient; it is not intended to imply that alleconomies in the group are experiencing similar development or that other economies have reached a preferred or final stage of development. Classification by incomedoes not necessarily reflect development status.
This table classifies all World Bank member economies and all other economies with populations of more than 30,000. Economies are divided among income groupsaccording to 2002 GNI per capita, calculated using the World Bank Atlas method. The groups are: low income, $735 or less; lower middle income, $736–2,935;upper middle income, $2,936–9,075; and high income, $9,076 or more.
a. Former Yugoslav Republic of Macedonia.b. The French overseas departments French Guiana, Guadeloupe, Martinique, and Réunion are included in France.c. On July 1, 1997, China resumed its exercise of sovereignty over Hong Kong.d. On December 20, 1999, China resumed its exercise of sovereignty over Macao.
gdf_174-233.qxd 4/6/04 12:58 PM Page 232