Embed Size (px)
Citation preview
GCSE
Geography
8035/2 – Paper 2 – Challenges in the Human Environment
Mark scheme
8035
June 2018
Version/Stage: 1.0 Final
Copyright © 2018 AQA and its licensors. All rights reserved.
AQA retains the copyright on all its publications. However, registered schools/colleges for AQA are permitted to copy material from this booklet
for their own internal use, with the following important exception: AQA cannot give permission to schools/colleges to photocopy any material that
is acknowledged to a third party even for internal use within the centre.
Mark schemes are prepared by the Lead Assessment Writer and considered, together with the relevant
questions, by a panel of subject teachers. This mark scheme includes any amendments made at the
standardisation events which all associates participate in and is the scheme which was used by them in
this examination. The standardisation process ensures that the mark scheme covers the students’
responses to questions and that every associate understands and applies it in the same correct way.
As preparation for standardisation each associate analyses a number of students’ scripts. Alternative
answers not already covered by the mark scheme are discussed and legislated for. If, after the
standardisation process, associates encounter unusual answers which have not been raised they are
required to refer these to the Lead Assessment Writer.
It must be stressed that a mark scheme is a working document, in many cases further developed and
expanded on the basis of students’ reactions to a particular paper. Assumptions about future mark
schemes on the basis of one year’s document should be avoided; whilst the guiding principles of
assessment remain constant, details will change, depending on the content of a particular examination
paper.
Further copies of this mark scheme are available from aqa.org.uk
MARK SCHEME – GCSE GEOGRAPHY – 8035/2 – JUNE 2018
3
Point marked questions marking instructions
The mark scheme will state the correct answer or a range of possible answers, although these may not
be exhaustive. It may indicate how a second mark is awarded for a second point or developed idea. It
may give an indication of unacceptable answers. Each mark should be shown by placing a tick where
credit is given. The number of ticks must equal the mark awarded. Do not use crosses to indicate
answers that are incorrect.
Level of response marking instructions
Level of response mark schemes are broken down into levels, each of which has a descriptor. The
descriptor is linked to the assessment objective(s) being addressed. The descriptor for the level shows
the average performance for the level.
Before you apply the mark scheme to a student’s answer read through the answer and annotate it (as
instructed) to show the qualities that are being looked for. You can then apply the mark scheme. You
should read the whole answer before awarding marks on levels response questions.
Step 1 Determine a level
Descriptors for the level indicate the different qualities that might be seen in the student’s answer for that
level. When assigning a level you should look at the overall quality of the answer and not look to pick
holes in small and specific parts of the answer where the student has not performed quite as well as the
rest. If the answer covers different aspects of different levels of the mark scheme you should use a best
fit approach for defining the level and then use the variability of the response to help decide the mark
within the level, ie if the response is predominantly Level 2 with a small amount of Level 3 material it
would be placed in Level 2 but be awarded a mark near the top of the level because of the Level 3
content. For instance, in a 9 mark question with three levels of response, an answer may demonstrate
thorough knowledge and understanding (AO1 and AO2) but fail to respond to command words such as
assess or evaluate (AO3). The script could still access Level 2 marks. Note that the mark scheme is not
progressive in the sense that students don’t have to fulfil all the requirements of Level 1 in order to
access Level 2.
Step 2 Determine a mark
Once you have assigned a level you need to decide on the mark. The descriptors on how to allocate
marks can help with this. The exemplar materials used during standardisation will also help. There will
generally be an answer in the standardising materials which will correspond with each level of the mark
scheme. This answer will have been awarded a mark by the Lead Examiner. You can compare the
student’s answer with the example to determine if it is the same standard, better or worse than the
example. You can then use this to allocate a mark for the answer based on the Lead Examiner’s mark
on the example.
You may well need to read back through the answer as you apply the mark scheme to clarify points and
assure yourself that the level and the mark are appropriate.
Indicative content in the mark scheme is provided as a guide for examiners. It is not intended to be
exhaustive and you must credit other valid points. Students do not have to cover all of the points
mentioned in the indicative content to reach the highest level of the mark scheme.
An answer which contains nothing of relevance to the question must be awarded no marks.

MARK SCHEME – GCSE GEOGRAPHY – 8035/2 – JUNE 2018
4
Assessment of spelling, punctuation, grammar and use of specialist terminology
(SPaG)
Accuracy of spelling, punctuation, grammar and the use of specialist terminology will be assessed via
the indicated 9 mark questions. In each of these questions, three marks are allocated for SPaG as
follows:
High performance – 3 marks
Intermediate performance – 2 marks
Threshold performance – 1 mark
General guidance
Mark schemes should be applied positively. Examiners should look for qualities to reward rather
than faults to penalise. They are looking to find credit in each response they mark. Unless the
mark scheme specifically states, candidates must never lose marks for incorrect answers.
The full range of marks should be used. Examiners should always award full marks if deserved,
i.e. if the answer matches the mark scheme.
When examiners are in doubt regarding the application of the mark scheme to a candidate’s
response, the team leader must be consulted
Crossed out work should be marked unless the candidate has replaced it with an alternative
response.
Do NOT add ticks to level-marked questions – use the highlight tool/brackets to signify what is
relevant.
Sometimes there are specific “triggers” in the mark scheme that enable higher level marks to be
awarded. For instance, an example or case study may be required for Level 3 if it is stated within
the question.
Where a source, such as a photograph or map, is provided as a stimulus it should be used if
requested in the question, but credit can often be given for inferred as well as direct use of the
source.
Always be consistent – accept the guidelines given in the mark scheme and apply them to every
script
If necessary make comments to support the level awarded and to help clarify a decision you have
made
Examiners should revisit standardise script answers as they apply the mark scheme in order to
confirm that the level and the mark allocated is appropriate to the response provided.
Mark all answers written on the examination paper.
MARK SCHEME – GCSE GEOGRAPHY – 8035/2 – JUNE 2018
5
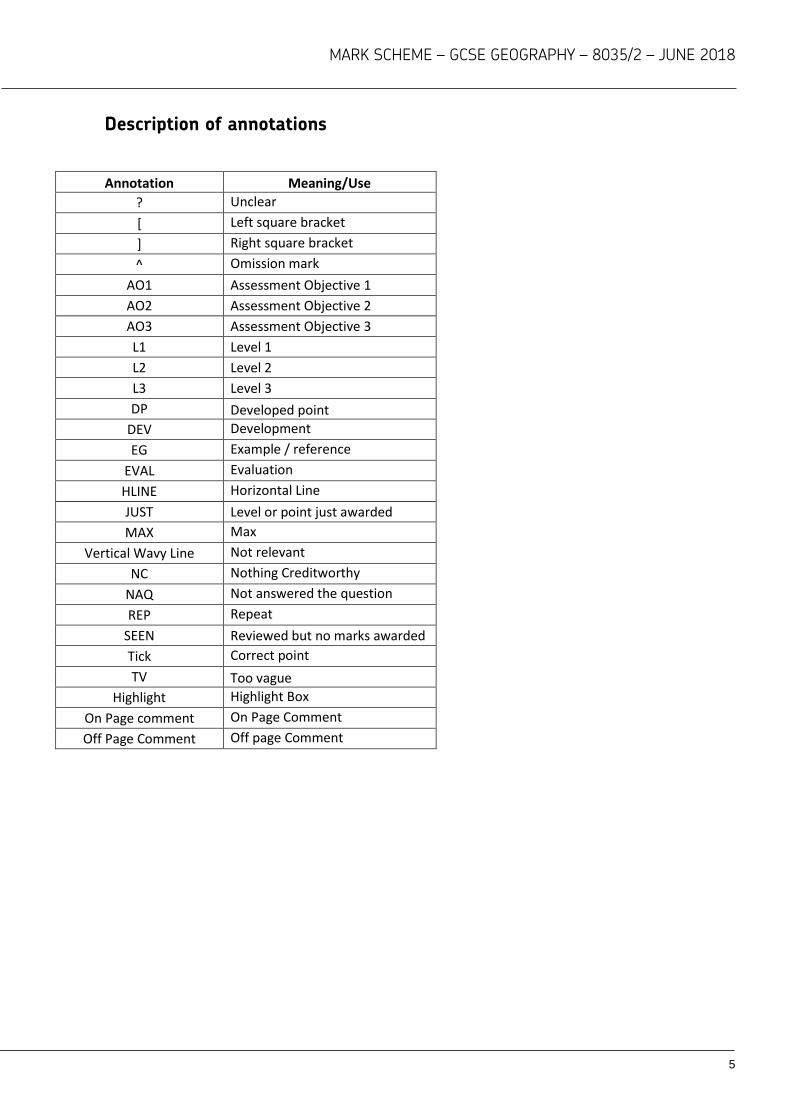
Description of annotations
Annotation Meaning/Use
? Unclear
[ Left square bracket
] Right square bracket
^ Omission mark
AO1 Assessment Objective 1
AO2 Assessment Objective 2
AO3 Assessment Objective 3
L1 Level 1
L2 Level 2
L3 Level 3
DP Developed point
DEV Development
EG Example / reference
EVAL Evaluation
HLINE Horizontal Line
JUST Level or point just awarded
MAX Max
Vertical Wavy Line Not relevant
NC Nothing Creditworthy
NAQ Not answered the question
REP Repeat
SEEN Reviewed but no marks awarded
Tick Correct point
TV Too vague
Highlight Highlight Box
On Page comment On Page Comment
Off Page Comment Off page Comment
MARK SCHEME – GCSE GEOGRAPHY – 8035/2 – JUNE 2018
6
Section A
Qu Pt Marking Guidance Total
marks
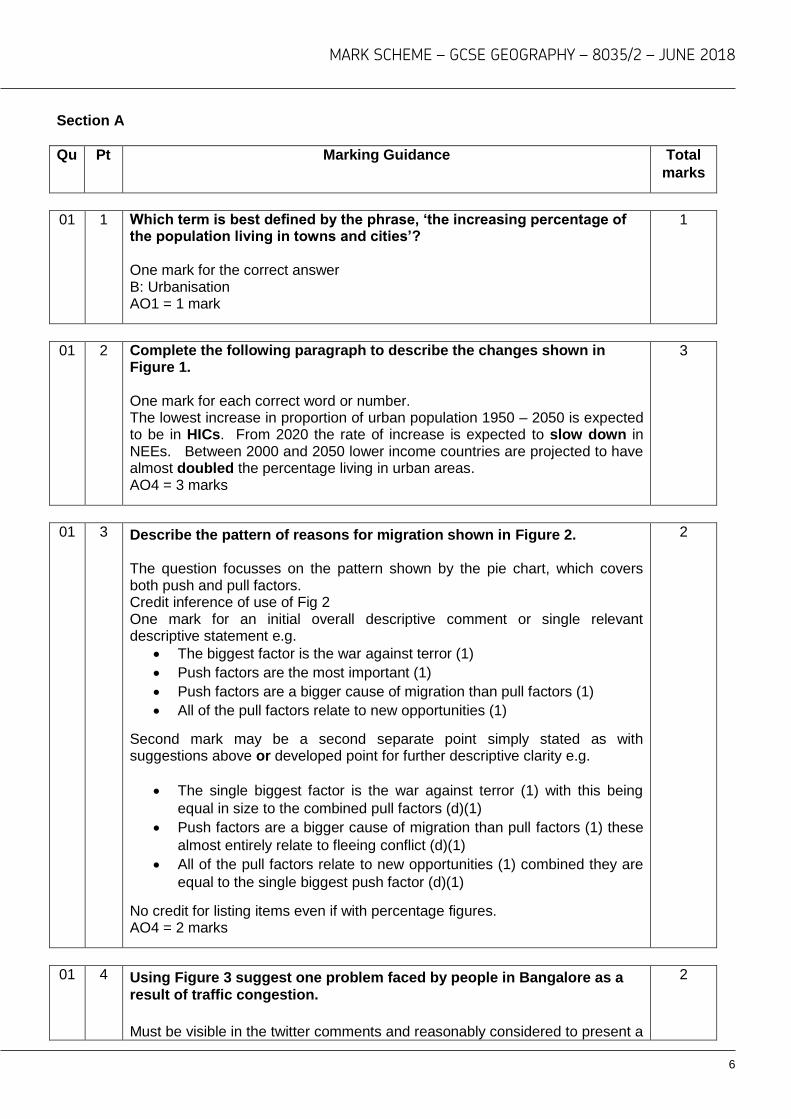
01 1 Which term is best defined by the phrase, ‘the increasing percentage of the population living in towns and cities’? One mark for the correct answer B: Urbanisation AO1 = 1 mark
1
01 2 Complete the following paragraph to describe the changes shown in Figure 1. One mark for each correct word or number. The lowest increase in proportion of urban population 1950 – 2050 is expected to be in HICs. From 2020 the rate of increase is expected to slow down in NEEs. Between 2000 and 2050 lower income countries are projected to have almost doubled the percentage living in urban areas. AO4 = 3 marks
3
01 3 Describe the pattern of reasons for migration shown in Figure 2. The question focusses on the pattern shown by the pie chart, which covers both push and pull factors. Credit inference of use of Fig 2 One mark for an initial overall descriptive comment or single relevant descriptive statement e.g.
The biggest factor is the war against terror (1)
Push factors are the most important (1)
Push factors are a bigger cause of migration than pull factors (1)
All of the pull factors relate to new opportunities (1)
Second mark may be a second separate point simply stated as with suggestions above or developed point for further descriptive clarity e.g.
The single biggest factor is the war against terror (1) with this being
equal in size to the combined pull factors (d)(1)
Push factors are a bigger cause of migration than pull factors (1) these
almost entirely relate to fleeing conflict (d)(1)
All of the pull factors relate to new opportunities (1) combined they are
equal to the single biggest push factor (d)(1)
No credit for listing items even if with percentage figures. AO4 = 2 marks
2
01 4 Using Figure 3 suggest one problem faced by people in Bangalore as a
result of traffic congestion.
Must be visible in the twitter comments and reasonably considered to present a
2
MARK SCHEME – GCSE GEOGRAPHY – 8035/2 – JUNE 2018
7
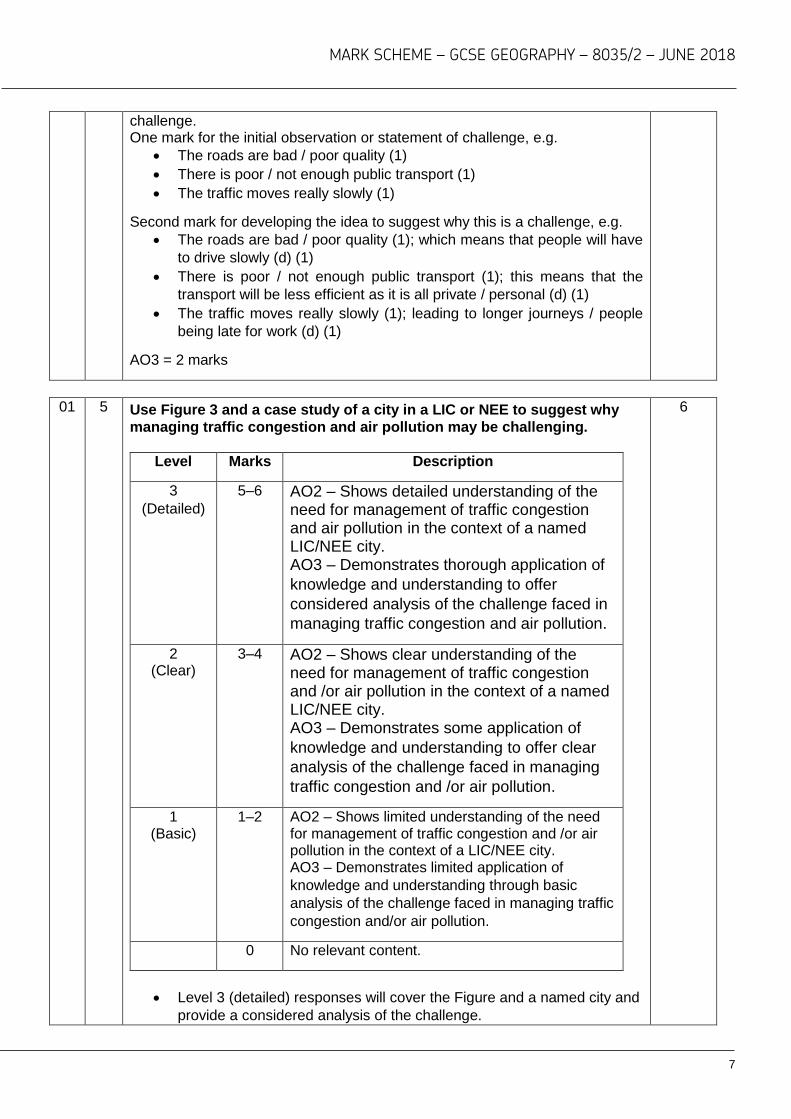
challenge. One mark for the initial observation or statement of challenge, e.g.
The roads are bad / poor quality (1)
There is poor / not enough public transport (1)
The traffic moves really slowly (1)
Second mark for developing the idea to suggest why this is a challenge, e.g.
The roads are bad / poor quality (1); which means that people will have
to drive slowly (d) (1)
There is poor / not enough public transport (1); this means that the
transport will be less efficient as it is all private / personal (d) (1)
The traffic moves really slowly (1); leading to longer journeys / people
being late for work (d) (1)
AO3 = 2 marks
01 5 Use Figure 3 and a case study of a city in a LIC or NEE to suggest why
managing traffic congestion and air pollution may be challenging.
Level Marks Description
3
(Detailed)
5–6 AO2 – Shows detailed understanding of the need for management of traffic congestion and air pollution in the context of a named LIC/NEE city. AO3 – Demonstrates thorough application of
knowledge and understanding to offer
considered analysis of the challenge faced in
managing traffic congestion and air pollution.
2 (Clear)
3–4 AO2 – Shows clear understanding of the need for management of traffic congestion and /or air pollution in the context of a named LIC/NEE city. AO3 – Demonstrates some application of
knowledge and understanding to offer clear
analysis of the challenge faced in managing
traffic congestion and /or air pollution.
1 (Basic)
1–2 AO2 – Shows limited understanding of the need for management of traffic congestion and /or air pollution in the context of a LIC/NEE city. AO3 – Demonstrates limited application of
knowledge and understanding through basic
analysis of the challenge faced in managing traffic
congestion and/or air pollution.
0 No relevant content.
Level 3 (detailed) responses will cover the Figure and a named city and
provide a considered analysis of the challenge.
6
MARK SCHEME – GCSE GEOGRAPHY – 8035/2 – JUNE 2018
8
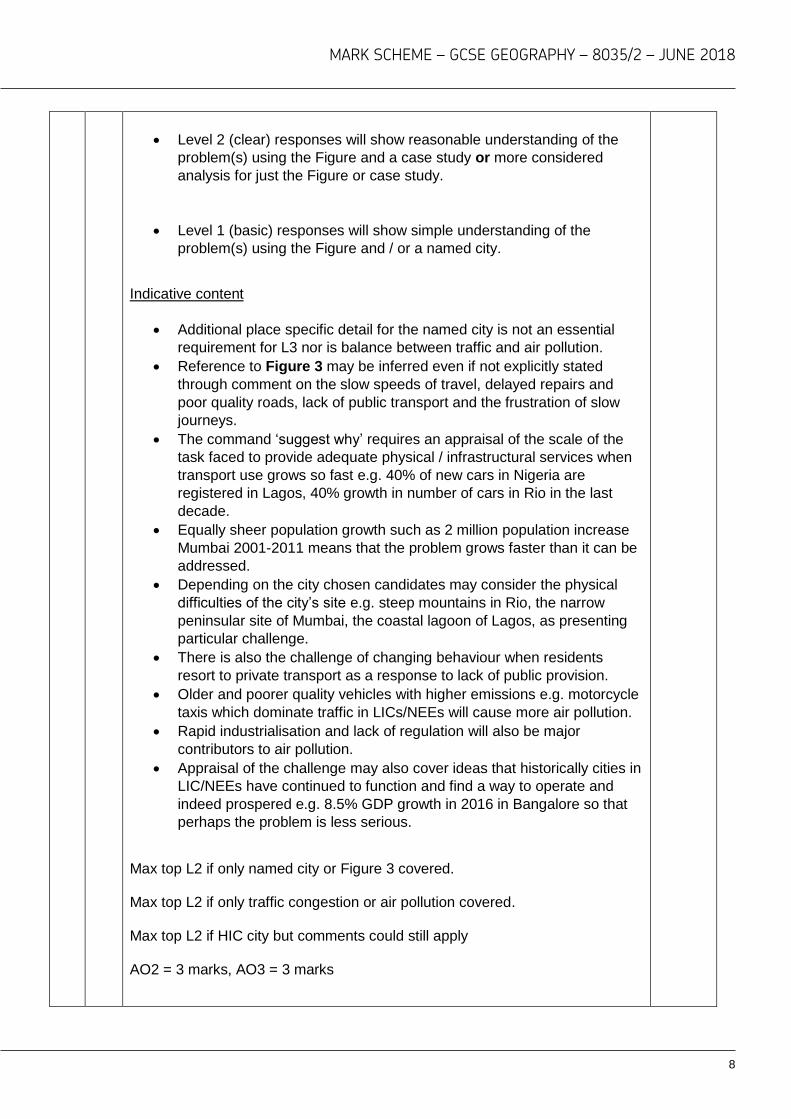
Level 2 (clear) responses will show reasonable understanding of the
problem(s) using the Figure and a case study or more considered
analysis for just the Figure or case study.
Level 1 (basic) responses will show simple understanding of the
problem(s) using the Figure and / or a named city.
Indicative content
Additional place specific detail for the named city is not an essential
requirement for L3 nor is balance between traffic and air pollution.
Reference to Figure 3 may be inferred even if not explicitly stated
through comment on the slow speeds of travel, delayed repairs and
poor quality roads, lack of public transport and the frustration of slow
journeys.
The command ‘suggest why’ requires an appraisal of the scale of the
task faced to provide adequate physical / infrastructural services when
transport use grows so fast e.g. 40% of new cars in Nigeria are
registered in Lagos, 40% growth in number of cars in Rio in the last
decade.
Equally sheer population growth such as 2 million population increase
Mumbai 2001-2011 means that the problem grows faster than it can be
addressed.
Depending on the city chosen candidates may consider the physical
difficulties of the city’s site e.g. steep mountains in Rio, the narrow
peninsular site of Mumbai, the coastal lagoon of Lagos, as presenting
particular challenge.
There is also the challenge of changing behaviour when residents
resort to private transport as a response to lack of public provision.
Older and poorer quality vehicles with higher emissions e.g. motorcycle
taxis which dominate traffic in LICs/NEEs will cause more air pollution.
Rapid industrialisation and lack of regulation will also be major
contributors to air pollution.
Appraisal of the challenge may also cover ideas that historically cities in
LIC/NEEs have continued to function and find a way to operate and
indeed prospered e.g. 8.5% GDP growth in 2016 in Bangalore so that
perhaps the problem is less serious.
Max top L2 if only named city or Figure 3 covered. Max top L2 if only traffic congestion or air pollution covered. Max top L2 if HIC city but comments could still apply AO2 = 3 marks, AO3 = 3 marks
MARK SCHEME – GCSE GEOGRAPHY – 8035/2 – JUNE 2018
9
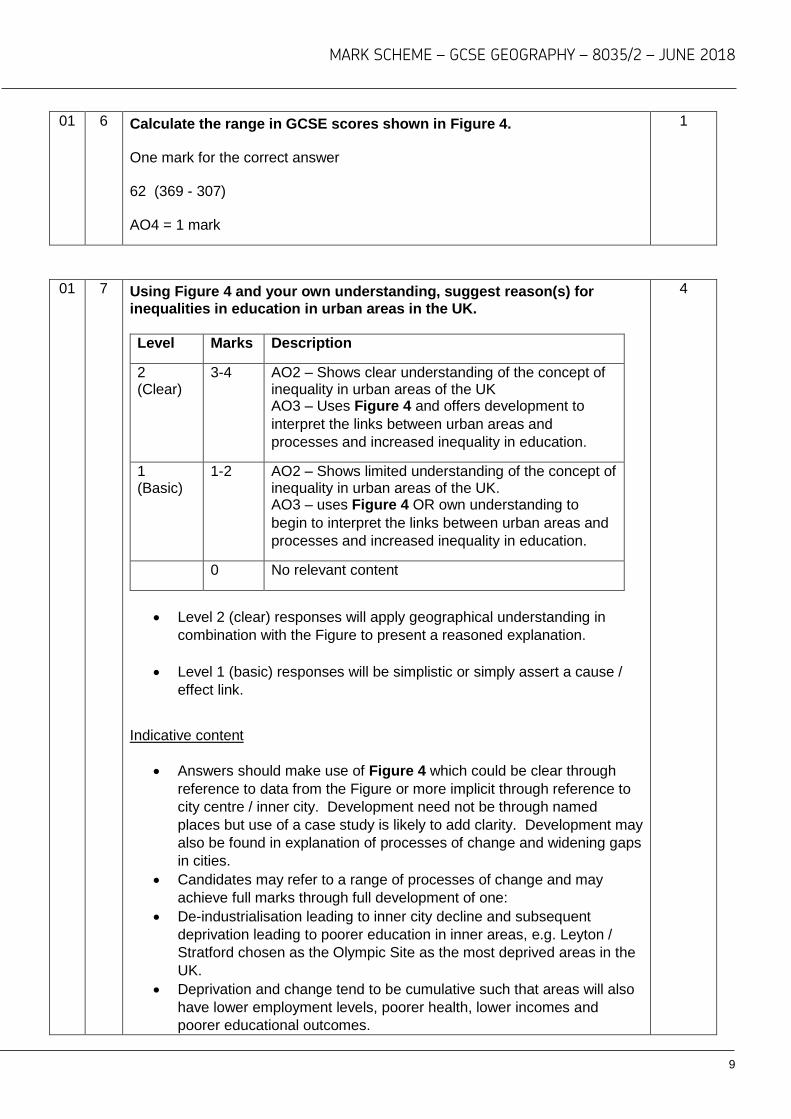
01 6 Calculate the range in GCSE scores shown in Figure 4. One mark for the correct answer 62 (369 - 307) AO4 = 1 mark
1
01 7 Using Figure 4 and your own understanding, suggest reason(s) for
inequalities in education in urban areas in the UK.
Level Marks Description
2 (Clear)
3-4 AO2 – Shows clear understanding of the concept of inequality in urban areas of the UK AO3 – Uses Figure 4 and offers development to
interpret the links between urban areas and
processes and increased inequality in education.
1 (Basic)
1-2 AO2 – Shows limited understanding of the concept of inequality in urban areas of the UK. AO3 – uses Figure 4 OR own understanding to
begin to interpret the links between urban areas and
processes and increased inequality in education.
0 No relevant content
Level 2 (clear) responses will apply geographical understanding in
combination with the Figure to present a reasoned explanation.
Level 1 (basic) responses will be simplistic or simply assert a cause /
effect link.
Indicative content
Answers should make use of Figure 4 which could be clear through
reference to data from the Figure or more implicit through reference to
city centre / inner city. Development need not be through named
places but use of a case study is likely to add clarity. Development may
also be found in explanation of processes of change and widening gaps
in cities.
Candidates may refer to a range of processes of change and may
achieve full marks through full development of one:
De-industrialisation leading to inner city decline and subsequent
deprivation leading to poorer education in inner areas, e.g. Leyton /
Stratford chosen as the Olympic Site as the most deprived areas in the
UK.
Deprivation and change tend to be cumulative such that areas will also
have lower employment levels, poorer health, lower incomes and
poorer educational outcomes.
4
MARK SCHEME – GCSE GEOGRAPHY – 8035/2 – JUNE 2018
10
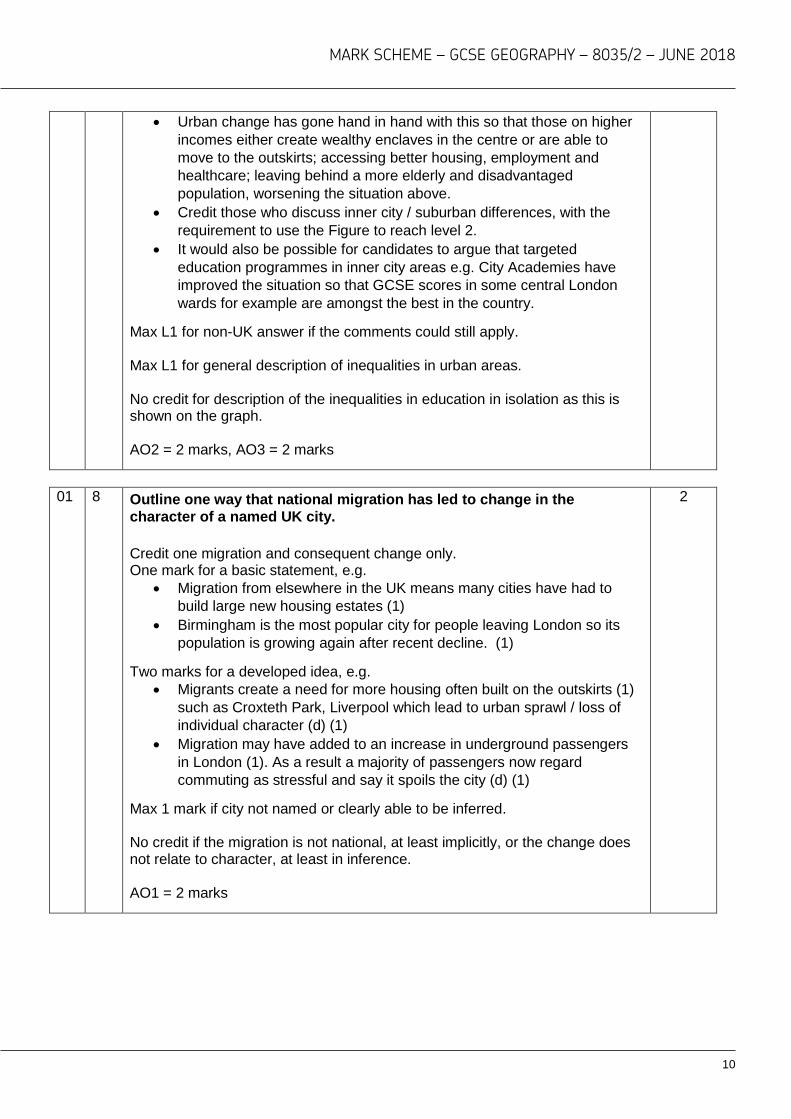
Urban change has gone hand in hand with this so that those on higher
incomes either create wealthy enclaves in the centre or are able to
move to the outskirts; accessing better housing, employment and
healthcare; leaving behind a more elderly and disadvantaged
population, worsening the situation above.
Credit those who discuss inner city / suburban differences, with the
requirement to use the Figure to reach level 2.
It would also be possible for candidates to argue that targeted
education programmes in inner city areas e.g. City Academies have
improved the situation so that GCSE scores in some central London
wards for example are amongst the best in the country.
Max L1 for non-UK answer if the comments could still apply. Max L1 for general description of inequalities in urban areas. No credit for description of the inequalities in education in isolation as this is shown on the graph. AO2 = 2 marks, AO3 = 2 marks
01 8 Outline one way that national migration has led to change in the
character of a named UK city.
Credit one migration and consequent change only. One mark for a basic statement, e.g.
Migration from elsewhere in the UK means many cities have had to
build large new housing estates (1)
Birmingham is the most popular city for people leaving London so its
population is growing again after recent decline. (1)
Two marks for a developed idea, e.g.
Migrants create a need for more housing often built on the outskirts (1)
such as Croxteth Park, Liverpool which lead to urban sprawl / loss of
individual character (d) (1)
Migration may have added to an increase in underground passengers
in London (1). As a result a majority of passengers now regard
commuting as stressful and say it spoils the city (d) (1)
Max 1 mark if city not named or clearly able to be inferred. No credit if the migration is not national, at least implicitly, or the change does not relate to character, at least in inference. AO1 = 2 marks
2
MARK SCHEME – GCSE GEOGRAPHY – 8035/2 – JUNE 2018
11
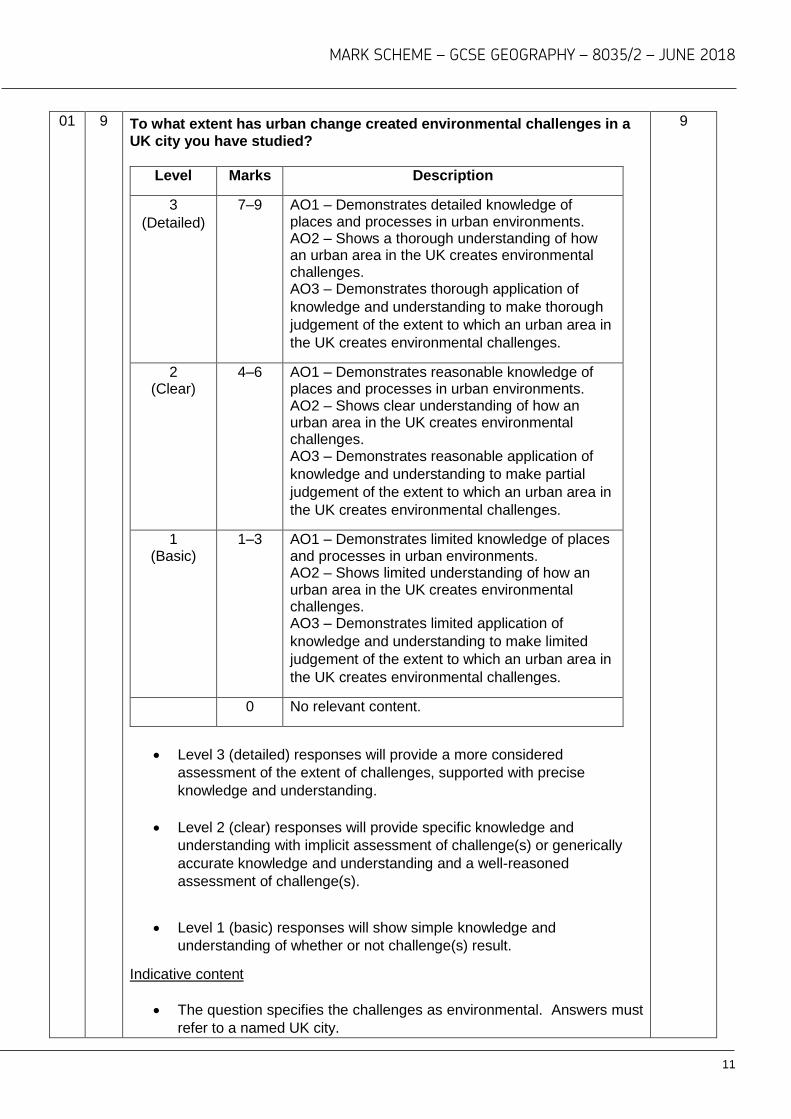
01 9 To what extent has urban change created environmental challenges in a
UK city you have studied?
Level Marks Description
3
(Detailed)
7–9 AO1 – Demonstrates detailed knowledge of places and processes in urban environments. AO2 – Shows a thorough understanding of how an urban area in the UK creates environmental challenges. AO3 – Demonstrates thorough application of
knowledge and understanding to make thorough
judgement of the extent to which an urban area in
the UK creates environmental challenges.
2 (Clear)
4–6 AO1 – Demonstrates reasonable knowledge of places and processes in urban environments. AO2 – Shows clear understanding of how an urban area in the UK creates environmental challenges. AO3 – Demonstrates reasonable application of
knowledge and understanding to make partial
judgement of the extent to which an urban area in
the UK creates environmental challenges.
1 (Basic)
1–3 AO1 – Demonstrates limited knowledge of places and processes in urban environments. AO2 – Shows limited understanding of how an urban area in the UK creates environmental challenges. AO3 – Demonstrates limited application of
knowledge and understanding to make limited
judgement of the extent to which an urban area in
the UK creates environmental challenges.
0 No relevant content.
Level 3 (detailed) responses will provide a more considered
assessment of the extent of challenges, supported with precise
knowledge and understanding.
Level 2 (clear) responses will provide specific knowledge and
understanding with implicit assessment of challenge(s) or generically
accurate knowledge and understanding and a well-reasoned
assessment of challenge(s).
Level 1 (basic) responses will show simple knowledge and
understanding of whether or not challenge(s) result.
Indicative content
The question specifies the challenges as environmental. Answers must
refer to a named UK city.
9
MARK SCHEME – GCSE GEOGRAPHY – 8035/2 – JUNE 2018
12
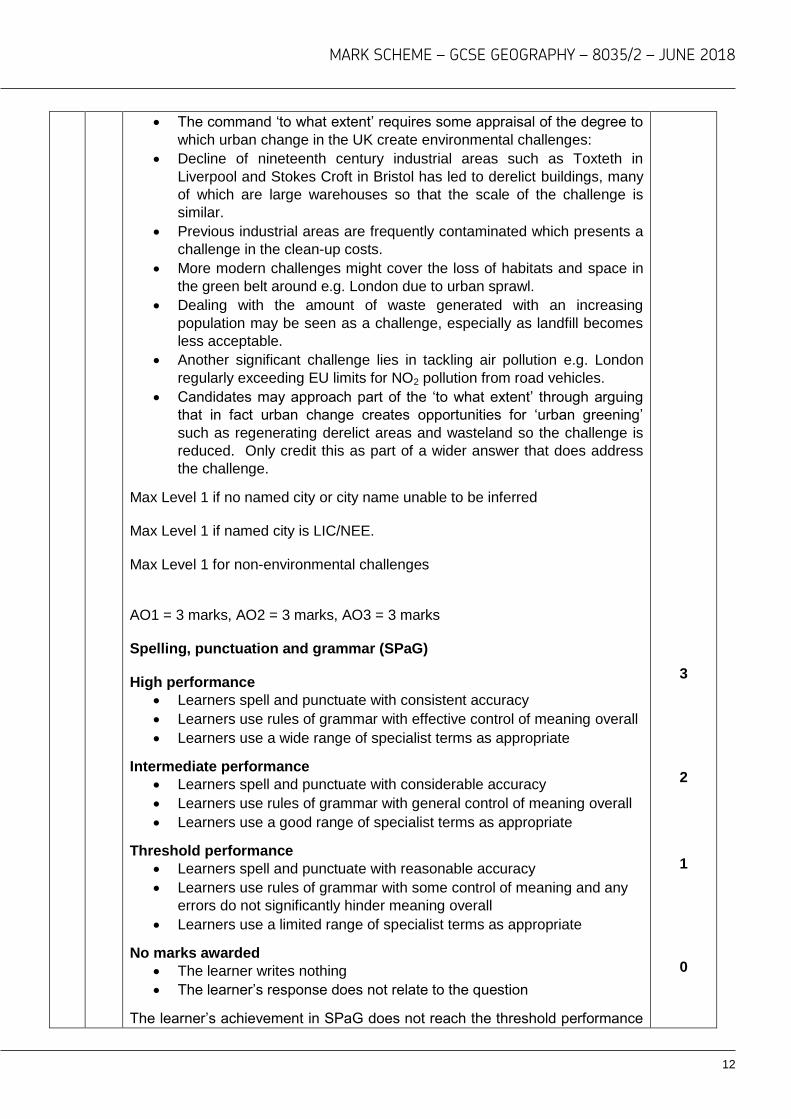
The command ‘to what extent’ requires some appraisal of the degree to
which urban change in the UK create environmental challenges:
Decline of nineteenth century industrial areas such as Toxteth in
Liverpool and Stokes Croft in Bristol has led to derelict buildings, many
of which are large warehouses so that the scale of the challenge is
similar.
Previous industrial areas are frequently contaminated which presents a
challenge in the clean-up costs.
More modern challenges might cover the loss of habitats and space in
the green belt around e.g. London due to urban sprawl.
Dealing with the amount of waste generated with an increasing
population may be seen as a challenge, especially as landfill becomes
less acceptable.
Another significant challenge lies in tackling air pollution e.g. London
regularly exceeding EU limits for NO2 pollution from road vehicles.
Candidates may approach part of the ‘to what extent’ through arguing
that in fact urban change creates opportunities for ‘urban greening’
such as regenerating derelict areas and wasteland so the challenge is
reduced. Only credit this as part of a wider answer that does address
the challenge.
Max Level 1 if no named city or city name unable to be inferred Max Level 1 if named city is LIC/NEE. Max Level 1 for non-environmental challenges AO1 = 3 marks, AO2 = 3 marks, AO3 = 3 marks Spelling, punctuation and grammar (SPaG) High performance
Learners spell and punctuate with consistent accuracy
Learners use rules of grammar with effective control of meaning overall
Learners use a wide range of specialist terms as appropriate
Intermediate performance
Learners spell and punctuate with considerable accuracy
Learners use rules of grammar with general control of meaning overall
Learners use a good range of specialist terms as appropriate
Threshold performance
Learners spell and punctuate with reasonable accuracy
Learners use rules of grammar with some control of meaning and any
errors do not significantly hinder meaning overall
Learners use a limited range of specialist terms as appropriate
No marks awarded
The learner writes nothing
The learner’s response does not relate to the question
The learner’s achievement in SPaG does not reach the threshold performance
3
2
1
0

MARK SCHEME – GCSE GEOGRAPHY – 8035/2 – JUNE 2018
13
level, for example errors in spelling, punctuation and grammar severely hinder
meaning.
Section B
Qu Pt Marking Guidance Total
marks
02 1 Calculate the median value for the GNI data in Figure 5. Award 2 marks if answer correct even if no working. Allow one mark if evidence of attempting to work out correctly e.g. ranking of Figures on the table but answer subsequently wrong. Dollar sign not necessary. Median = 11 960 AO4 = 2 marks
2
02 2 Suggest one reason why the GNI per person varies between the countries shown in Figure 5. Credit any reasonable suggestion. Candidates should make reference to Figure 5 through using country name(s) and / or data provided, e.g. Some of the countries are poor e.g. Kenya (1) Haiti has a lower GNI than most other countries because it has a poorly developed economy (1) European countries have the highest GNI scores because they have economies based around high value services (1) The GNI scores in the middle of the range are in NEEs as their economies have developed to create higher value. (1) AO3 = 1 mark
1
02 3 Give one disadvantage of using an economic measure of development
such as GNI.
Credit one reason only, there is no requirement to use the Figure. They should show an awareness of how economic measures, especially simplistic measures such as GNI, can be misleading e.g.
Economic measures do take any account of people’s quality of life which is important in social terms (1)
Economic measures tend to be per person / are an average figure so do not allow for extremes of wealth and poverty (1)
Many economic measures are in US$ so do not allow for the relative spending power of different currencies (1)
No credit for general answers regarding the unreliability of single measures other than economic. AO2 = 1 mark
1
MARK SCHEME – GCSE GEOGRAPHY – 8035/2 – JUNE 2018
14
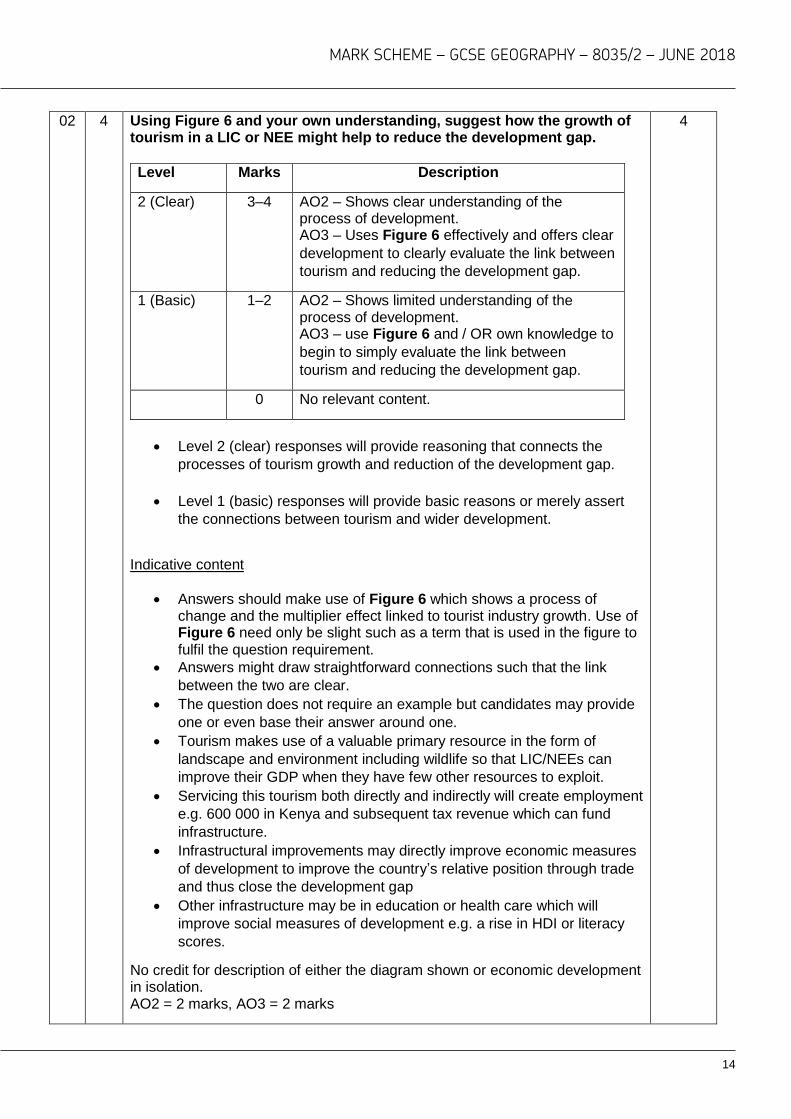
02 4 Using Figure 6 and your own understanding, suggest how the growth of tourism in a LIC or NEE might help to reduce the development gap.
Level Marks Description
2 (Clear) 3–4 AO2 – Shows clear understanding of the process of development. AO3 – Uses Figure 6 effectively and offers clear
development to clearly evaluate the link between
tourism and reducing the development gap.
1 (Basic) 1–2 AO2 – Shows limited understanding of the process of development. AO3 – use Figure 6 and / OR own knowledge to
begin to simply evaluate the link between
tourism and reducing the development gap.
0 No relevant content.
Level 2 (clear) responses will provide reasoning that connects the
processes of tourism growth and reduction of the development gap.
Level 1 (basic) responses will provide basic reasons or merely assert
the connections between tourism and wider development.
Indicative content
Answers should make use of Figure 6 which shows a process of change and the multiplier effect linked to tourist industry growth. Use of Figure 6 need only be slight such as a term that is used in the figure to fulfil the question requirement.
Answers might draw straightforward connections such that the link
between the two are clear.
The question does not require an example but candidates may provide
one or even base their answer around one.
Tourism makes use of a valuable primary resource in the form of
landscape and environment including wildlife so that LIC/NEEs can
improve their GDP when they have few other resources to exploit.
Servicing this tourism both directly and indirectly will create employment
e.g. 600 000 in Kenya and subsequent tax revenue which can fund
infrastructure.
Infrastructural improvements may directly improve economic measures
of development to improve the country’s relative position through trade
and thus close the development gap
Other infrastructure may be in education or health care which will
improve social measures of development e.g. a rise in HDI or literacy
scores.
No credit for description of either the diagram shown or economic development in isolation. AO2 = 2 marks, AO3 = 2 marks
4
MARK SCHEME – GCSE GEOGRAPHY – 8035/2 – JUNE 2018
15
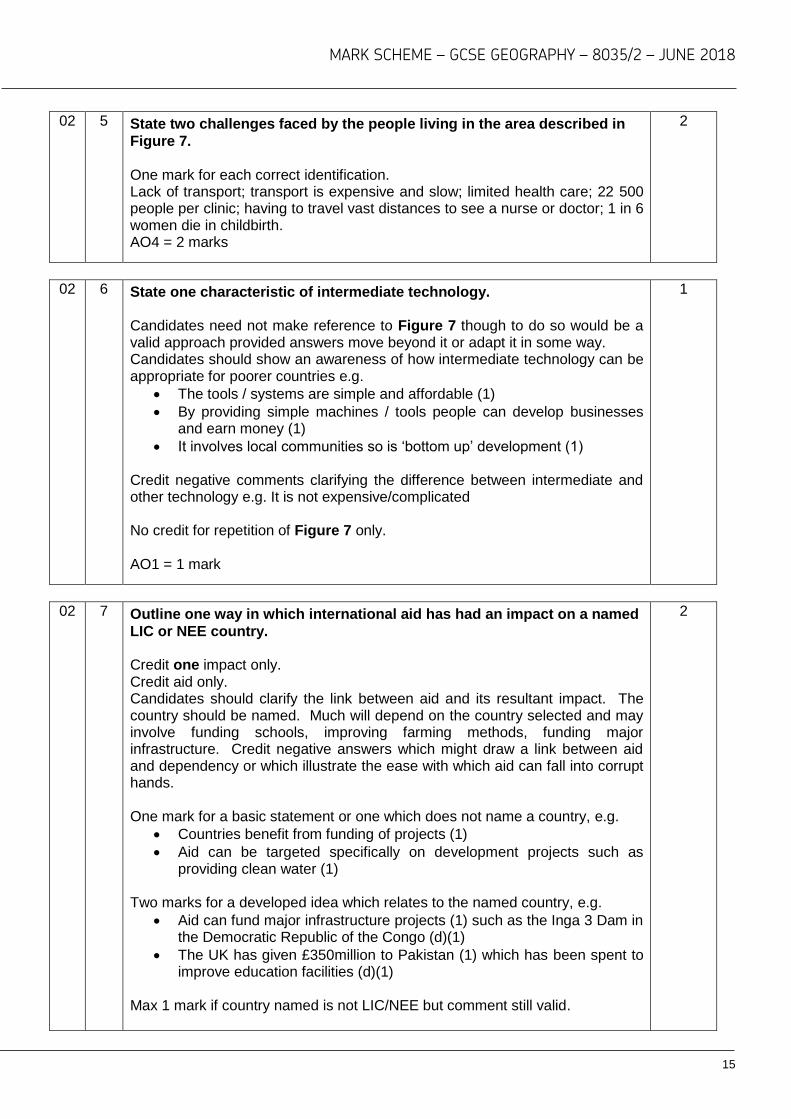
02 5 State two challenges faced by the people living in the area described in
Figure 7. One mark for each correct identification. Lack of transport; transport is expensive and slow; limited health care; 22 500 people per clinic; having to travel vast distances to see a nurse or doctor; 1 in 6 women die in childbirth. AO4 = 2 marks
2
02 6 State one characteristic of intermediate technology. Candidates need not make reference to Figure 7 though to do so would be a valid approach provided answers move beyond it or adapt it in some way. Candidates should show an awareness of how intermediate technology can be appropriate for poorer countries e.g.
The tools / systems are simple and affordable (1)
By providing simple machines / tools people can develop businesses and earn money (1)
It involves local communities so is ‘bottom up’ development (1)
Credit negative comments clarifying the difference between intermediate and other technology e.g. It is not expensive/complicated No credit for repetition of Figure 7 only. AO1 = 1 mark
1
02 7 Outline one way in which international aid has had an impact on a named
LIC or NEE country. Credit one impact only. Credit aid only. Candidates should clarify the link between aid and its resultant impact. The country should be named. Much will depend on the country selected and may involve funding schools, improving farming methods, funding major infrastructure. Credit negative answers which might draw a link between aid and dependency or which illustrate the ease with which aid can fall into corrupt hands. One mark for a basic statement or one which does not name a country, e.g.
Countries benefit from funding of projects (1)
Aid can be targeted specifically on development projects such as providing clean water (1)
Two marks for a developed idea which relates to the named country, e.g.
Aid can fund major infrastructure projects (1) such as the Inga 3 Dam in the Democratic Republic of the Congo (d)(1)
The UK has given £350million to Pakistan (1) which has been spent to improve education facilities (d)(1)
Max 1 mark if country named is not LIC/NEE but comment still valid.
2
MARK SCHEME – GCSE GEOGRAPHY – 8035/2 – JUNE 2018
16
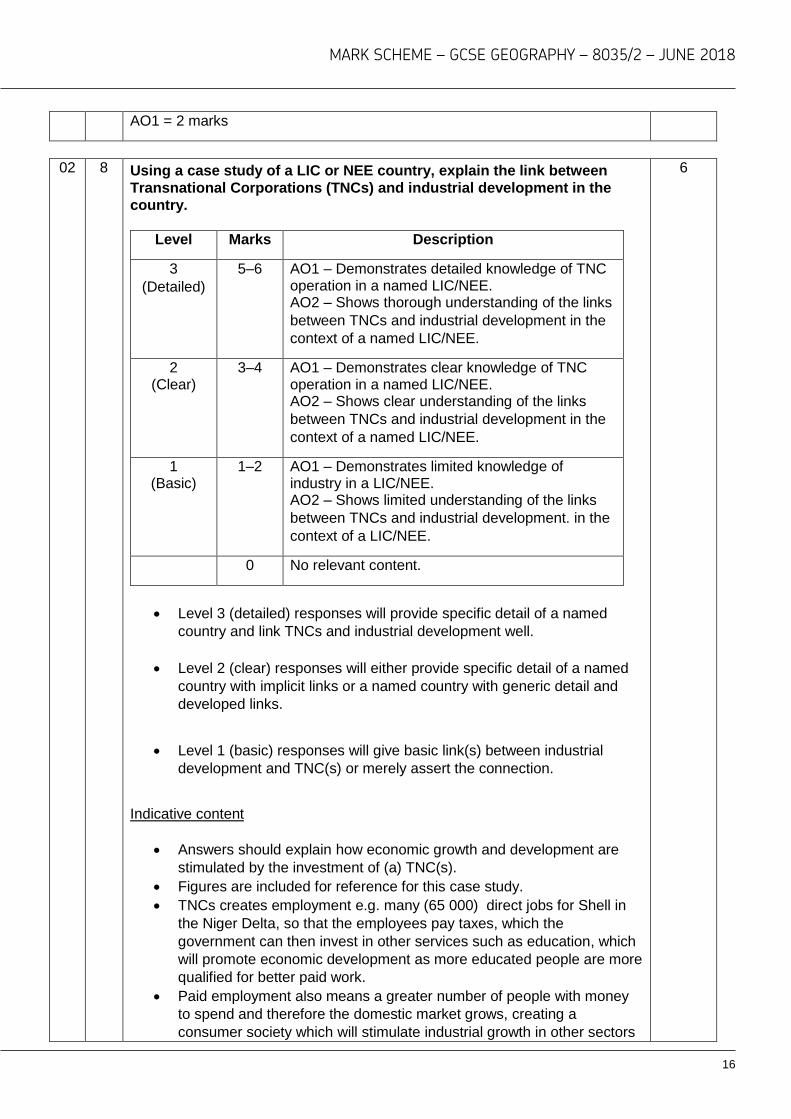
AO1 = 2 marks
02 8 Using a case study of a LIC or NEE country, explain the link between
Transnational Corporations (TNCs) and industrial development in the
country.
Level Marks Description
3
(Detailed)
5–6 AO1 – Demonstrates detailed knowledge of TNC operation in a named LIC/NEE. AO2 – Shows thorough understanding of the links
between TNCs and industrial development in the
context of a named LIC/NEE.
2 (Clear)
3–4 AO1 – Demonstrates clear knowledge of TNC operation in a named LIC/NEE. AO2 – Shows clear understanding of the links
between TNCs and industrial development in the
context of a named LIC/NEE.
1 (Basic)
1–2 AO1 – Demonstrates limited knowledge of industry in a LIC/NEE. AO2 – Shows limited understanding of the links
between TNCs and industrial development. in the
context of a LIC/NEE.
0 No relevant content.
Level 3 (detailed) responses will provide specific detail of a named
country and link TNCs and industrial development well.
Level 2 (clear) responses will either provide specific detail of a named
country with implicit links or a named country with generic detail and
developed links.
Level 1 (basic) responses will give basic link(s) between industrial
development and TNC(s) or merely assert the connection.
Indicative content
Answers should explain how economic growth and development are
stimulated by the investment of (a) TNC(s).
Figures are included for reference for this case study.
TNCs creates employment e.g. many (65 000) direct jobs for Shell in
the Niger Delta, so that the employees pay taxes, which the
government can then invest in other services such as education, which
will promote economic development as more educated people are more
qualified for better paid work.
Paid employment also means a greater number of people with money
to spend and therefore the domestic market grows, creating a
consumer society which will stimulate industrial growth in other sectors
6
MARK SCHEME – GCSE GEOGRAPHY – 8035/2 – JUNE 2018
17
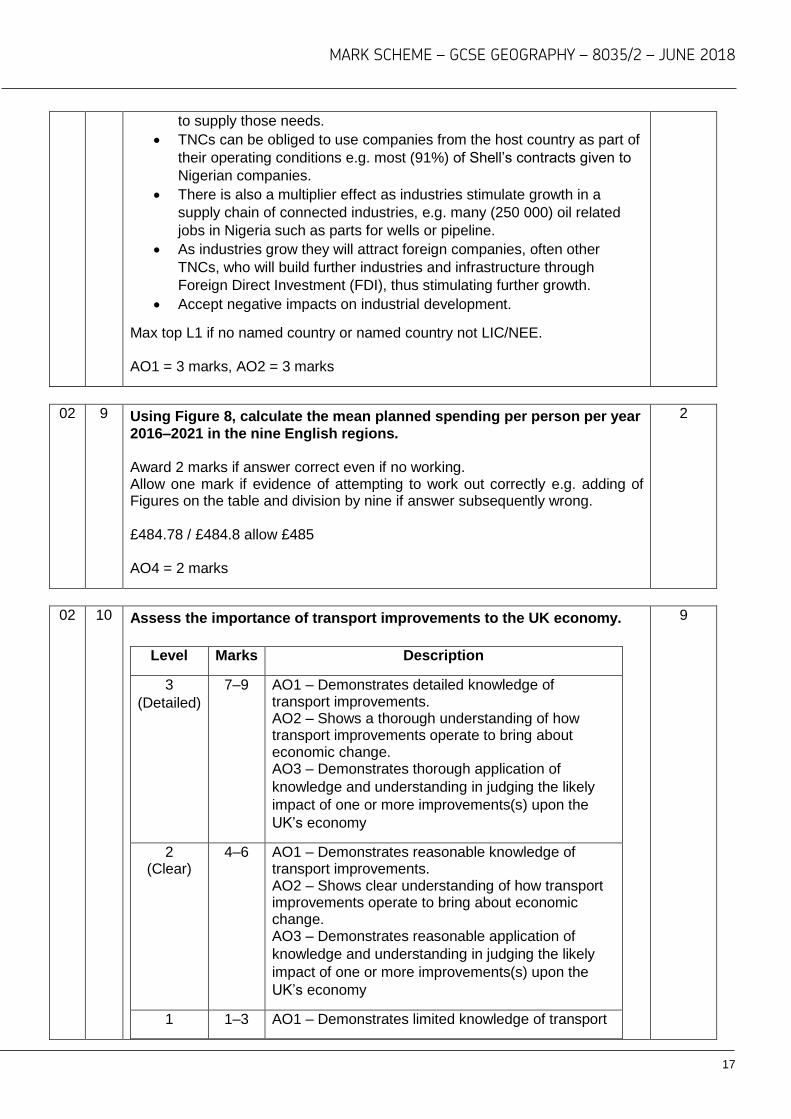
to supply those needs.
TNCs can be obliged to use companies from the host country as part of
their operating conditions e.g. most (91%) of Shell’s contracts given to
Nigerian companies.
There is also a multiplier effect as industries stimulate growth in a
supply chain of connected industries, e.g. many (250 000) oil related
jobs in Nigeria such as parts for wells or pipeline.
As industries grow they will attract foreign companies, often other
TNCs, who will build further industries and infrastructure through
Foreign Direct Investment (FDI), thus stimulating further growth.
Accept negative impacts on industrial development.
Max top L1 if no named country or named country not LIC/NEE. AO1 = 3 marks, AO2 = 3 marks
02 9 Using Figure 8, calculate the mean planned spending per person per year
2016–2021 in the nine English regions. Award 2 marks if answer correct even if no working. Allow one mark if evidence of attempting to work out correctly e.g. adding of Figures on the table and division by nine if answer subsequently wrong. £484.78 / £484.8 allow £485 AO4 = 2 marks
2
02 10 Assess the importance of transport improvements to the UK economy.
Level Marks Description
3
(Detailed)
7–9 AO1 – Demonstrates detailed knowledge of transport improvements. AO2 – Shows a thorough understanding of how transport improvements operate to bring about economic change. AO3 – Demonstrates thorough application of
knowledge and understanding in judging the likely
impact of one or more improvements(s) upon the
UK’s economy
2 (Clear)
4–6 AO1 – Demonstrates reasonable knowledge of transport improvements. AO2 – Shows clear understanding of how transport improvements operate to bring about economic change. AO3 – Demonstrates reasonable application of
knowledge and understanding in judging the likely
impact of one or more improvements(s) upon the
UK’s economy
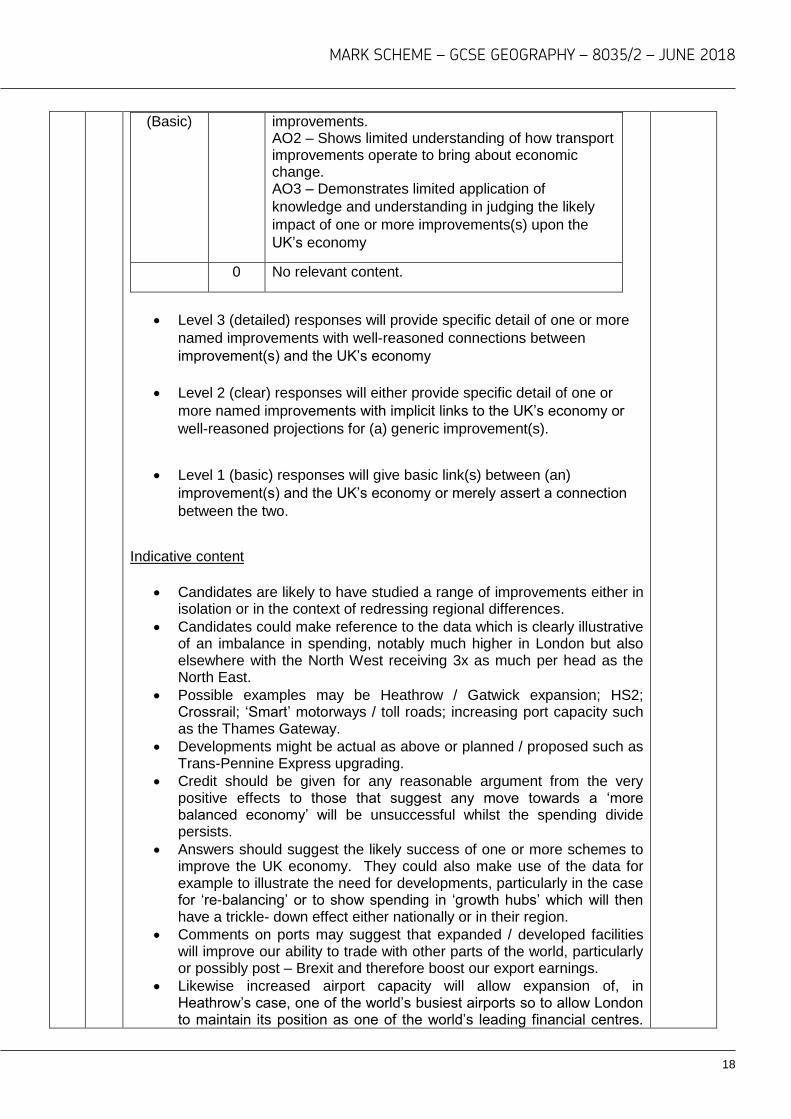
1 1–3 AO1 – Demonstrates limited knowledge of transport
9
MARK SCHEME – GCSE GEOGRAPHY – 8035/2 – JUNE 2018
18
(Basic) improvements. AO2 – Shows limited understanding of how transport improvements operate to bring about economic change. AO3 – Demonstrates limited application of
knowledge and understanding in judging the likely
impact of one or more improvements(s) upon the
UK’s economy
0 No relevant content.
Level 3 (detailed) responses will provide specific detail of one or more
named improvements with well-reasoned connections between
improvement(s) and the UK’s economy
Level 2 (clear) responses will either provide specific detail of one or
more named improvements with implicit links to the UK’s economy or
well-reasoned projections for (a) generic improvement(s).
Level 1 (basic) responses will give basic link(s) between (an)
improvement(s) and the UK’s economy or merely assert a connection
between the two.
Indicative content
Candidates are likely to have studied a range of improvements either in isolation or in the context of redressing regional differences.
Candidates could make reference to the data which is clearly illustrative of an imbalance in spending, notably much higher in London but also elsewhere with the North West receiving 3x as much per head as the North East.
Possible examples may be Heathrow / Gatwick expansion; HS2; Crossrail; ‘Smart’ motorways / toll roads; increasing port capacity such as the Thames Gateway.
Developments might be actual as above or planned / proposed such as Trans-Pennine Express upgrading.
Credit should be given for any reasonable argument from the very positive effects to those that suggest any move towards a ‘more balanced economy’ will be unsuccessful whilst the spending divide persists.
Answers should suggest the likely success of one or more schemes to improve the UK economy. They could also make use of the data for example to illustrate the need for developments, particularly in the case for ‘re-balancing’ or to show spending in ‘growth hubs’ which will then have a trickle- down effect either nationally or in their region.
Comments on ports may suggest that expanded / developed facilities will improve our ability to trade with other parts of the world, particularly or possibly post – Brexit and therefore boost our export earnings.
Likewise increased airport capacity will allow expansion of, in Heathrow’s case, one of the world’s busiest airports so to allow London to maintain its position as one of the world’s leading financial centres.
MARK SCHEME – GCSE GEOGRAPHY – 8035/2 – JUNE 2018
19
Candidates may also argue this will have little effect on the UK as a whole and will worsen the regional differences the policy is supposed to reduce.
HS2 is intended to encourage growth in the Midlands by reducing journey time between London and Birmingham.
No credit for mere description of the spending pattern in Figure 8. AO1 = 3 marks, AO2 = 3 marks, AO3 = 3 marks
MARK SCHEME – GCSE GEOGRAPHY – 8035/2 – JUNE 2018
20
Section C
Qu Pt Marking Guidance Total
marks
03 1 What is the difference between Africa and North America’s share of world
oil consumption shown in Figure 9? One mark for correct calculation. 20% / 6 times greater / 500% more Percentage sign not necessary AO4 = 1 mark
1
03 2 Using Figure 9 and your own understanding, suggest how inequalities in
the consumption of resources influence well-being. Candidates should make reference to Figure 9 through using continent / continental area name(s) and / or data provided. They should show that they can apply knowledge and understanding in analysing the pattern shown by the map. Expect recognition of a global pattern of higher consumption in wealthier regions / emerging economies, lower in poorer regions. The connection should be made with oil consumption as an indicator of wealth and therefore an ability to secure the goods and services that allow well-being. Credit reference to economic and / or social well-being. Figure 9 shows that Asia Pacific has the largest single share of the world oil consumption. (1) Countries in this region can use this oil to develop rapidly and improve incomes through employment (1) so people are likely to have improved well-being as they can access more goods and services with this wealth (1) Africa has the lowest share of world oil consumption at 4%. (1) This links to for example Sub-Saharan Africa which has low levels of well-being measured through indicators such as HDI (1). Richer countries will have the means to purchase oil and therefore energy for personal use and industrial development (1) and this will increase the well-being of the population as they will have a good standard of living as a result (1) as visible in the North American share at 24% when that is just USA and Canada (1). Max 1 mark if no reference to Figure 9. Reserve 3rd mark (AO4) for clear and explicit reference to the map in Figure 9.
AO3 = 2 marks, AO4 = 1 mark
3
MARK SCHEME – GCSE GEOGRAPHY – 8035/2 – JUNE 2018
21
03 3 Outline one advantage of the trend towards agribusiness in the UK.
Credit one advantage only. Candidates should clarify how the change in scale and intensity of production that characterise agribusiness have created opportunities, which may be for a wide range of people, or the UK as a whole. One mark for a basic statement, e.g.
Farmers can make more profit. (1)
‘Farm to fork’ integration allows producers / supermarkets to maximise
profits. (1)
Food is cheaper. (1)
Reduces imports (1)
Two marks for a developed idea, e.g.
Large farms have taken over small ones (1) so they can reduce costs in
using machinery across a wider area and increase profits. (d)(1)
Supermarkets and large growing organisations such as Produce World
have prospered (1) as they control every stage from growing to final
sale (d)(1) and don’t lose money to any middle-men. (d)(1)
Reduced costs of production mean prices can be kept lower (1) so food
prices are lower in real terms than 30 years ago (d) (1) / so the shopper
benefits. (d)(1)
No credit for disadvantages. AO2 = 2 marks
2
MARK SCHEME – GCSE GEOGRAPHY – 8035/2 – JUNE 2018
22
03 4 Using Figure 10 and your own understanding discuss the issues arising
from the UK’s changing energy mix.
Level Marks Description
3
(Detailed)
5–6 AO2 – Shows detailed understanding of the issues around changing means of electricity generation in the UK. AO3 – Demonstrates detailed application of knowledge
and understanding by interpreting the resources
thoroughly and effectively discussing the issues arising.
2 (Clear)
3–4 AO2 – Shows some understanding of the issues around changing means of electricity generation in the UK. AO3 – Demonstrates some application of knowledge
and understanding by interpreting the resources with
some effectiveness with some discussion of the issues
arising.
1 (Basic)
1–2 AO2 – Shows limited understanding of the issues around changing means of electricity generation in the UK. AO3 – Demonstrates limited application of knowledge
and understanding through simple interpretation of the
resources with limited discussion of the issues arising.
0 No relevant content.
Level 3 (detailed) responses will provide a more reasoned interpretation
of the relevant issues, supported with thorough understanding.
Level 2 (clear) responses will give a partially reasoned interpretation of
the relevant issue(s) supported with reasonable understanding
Level 1 (basic) responses will show basic interpretation and simple
understanding of whether or not issues arise.
Indicative content
Figure 10 shows a clear shift from fossil fuels, particularly coal, to
renewables in a 10 year period.
Candidates should be making some assessment of how this shift will
present issues for the UK.
Figure 10 should be used by reference to Figures given or description
that is accurate enough to infer use of the resource rather than learned
knowledge.
Candidates should also be bringing their own understanding to the
answer through discussion, which may be in terms of opportunities and
challenges (shown below), or in assessment of the relative scale of
either positive or negative issues alone.
6
MARK SCHEME – GCSE GEOGRAPHY – 8035/2 – JUNE 2018
23
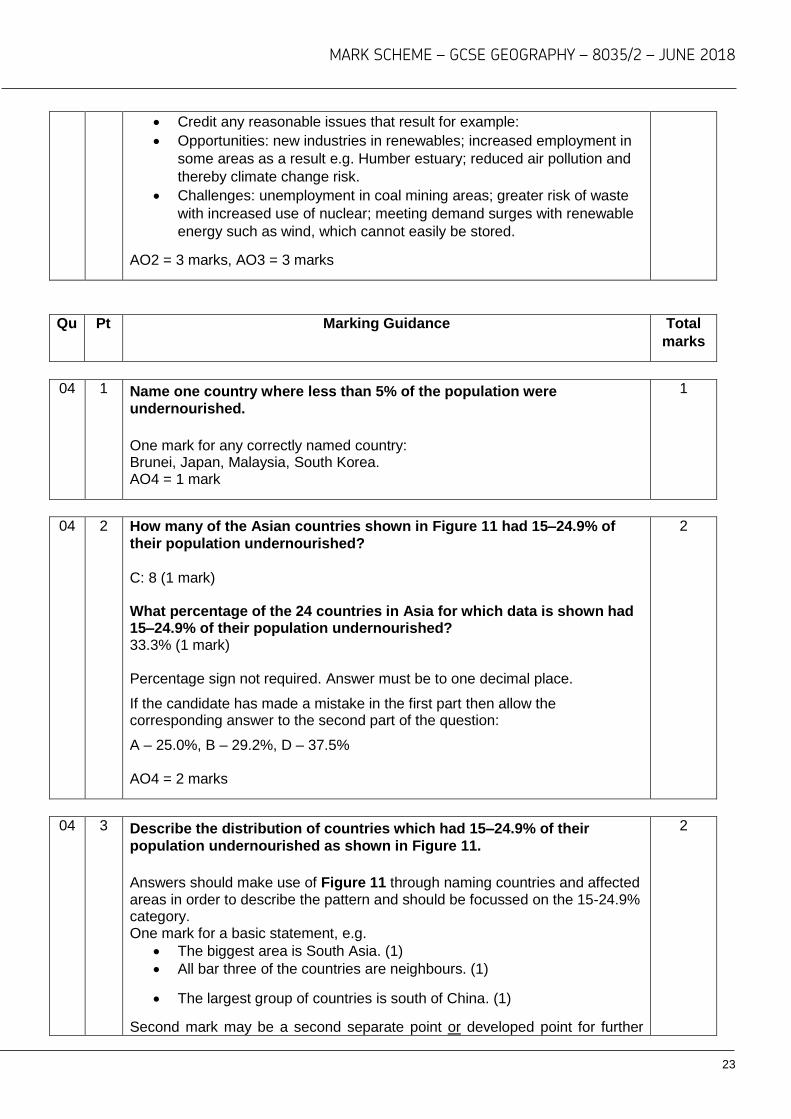
Credit any reasonable issues that result for example:
Opportunities: new industries in renewables; increased employment in
some areas as a result e.g. Humber estuary; reduced air pollution and
thereby climate change risk.
Challenges: unemployment in coal mining areas; greater risk of waste
with increased use of nuclear; meeting demand surges with renewable
energy such as wind, which cannot easily be stored.
AO2 = 3 marks, AO3 = 3 marks
Qu Pt Marking Guidance Total
marks
04 1 Name one country where less than 5% of the population were
undernourished.
One mark for any correctly named country: Brunei, Japan, Malaysia, South Korea. AO4 = 1 mark
1
04 2 How many of the Asian countries shown in Figure 11 had 15–24.9% of
their population undernourished?
C: 8 (1 mark) What percentage of the 24 countries in Asia for which data is shown had 15–24.9% of their population undernourished? 33.3% (1 mark) Percentage sign not required. Answer must be to one decimal place.
If the candidate has made a mistake in the first part then allow the corresponding answer to the second part of the question:
A – 25.0%, B – 29.2%, D – 37.5% AO4 = 2 marks
2
04 3 Describe the distribution of countries which had 15–24.9% of their
population undernourished as shown in Figure 11.
Answers should make use of Figure 11 through naming countries and affected areas in order to describe the pattern and should be focussed on the 15-24.9% category. One mark for a basic statement, e.g.
The biggest area is South Asia. (1)
All bar three of the countries are neighbours. (1)
The largest group of countries is south of China. (1)
Second mark may be a second separate point or developed point for further
2
MARK SCHEME – GCSE GEOGRAPHY – 8035/2 – JUNE 2018
24
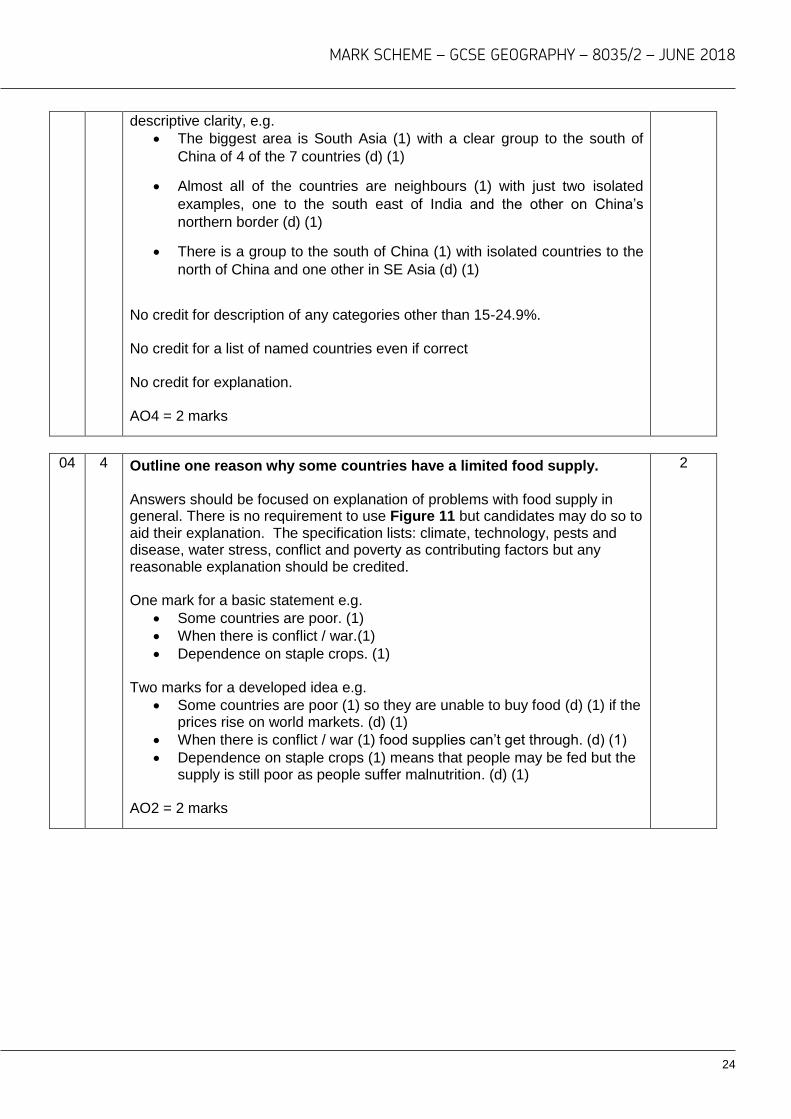
descriptive clarity, e.g.
The biggest area is South Asia (1) with a clear group to the south of
China of 4 of the 7 countries (d) (1)
Almost all of the countries are neighbours (1) with just two isolated
examples, one to the south east of India and the other on China’s
northern border (d) (1)
There is a group to the south of China (1) with isolated countries to the
north of China and one other in SE Asia (d) (1)
No credit for description of any categories other than 15-24.9%. No credit for a list of named countries even if correct No credit for explanation. AO4 = 2 marks
04 4 Outline one reason why some countries have a limited food supply. Answers should be focused on explanation of problems with food supply in general. There is no requirement to use Figure 11 but candidates may do so to aid their explanation. The specification lists: climate, technology, pests and disease, water stress, conflict and poverty as contributing factors but any reasonable explanation should be credited. One mark for a basic statement e.g.
Some countries are poor. (1)
When there is conflict / war.(1)
Dependence on staple crops. (1) Two marks for a developed idea e.g.
Some countries are poor (1) so they are unable to buy food (d) (1) if the prices rise on world markets. (d) (1)
When there is conflict / war (1) food supplies can’t get through. (d) (1)
Dependence on staple crops (1) means that people may be fed but the supply is still poor as people suffer malnutrition. (d) (1)
AO2 = 2 marks
2
MARK SCHEME – GCSE GEOGRAPHY – 8035/2 – JUNE 2018
25
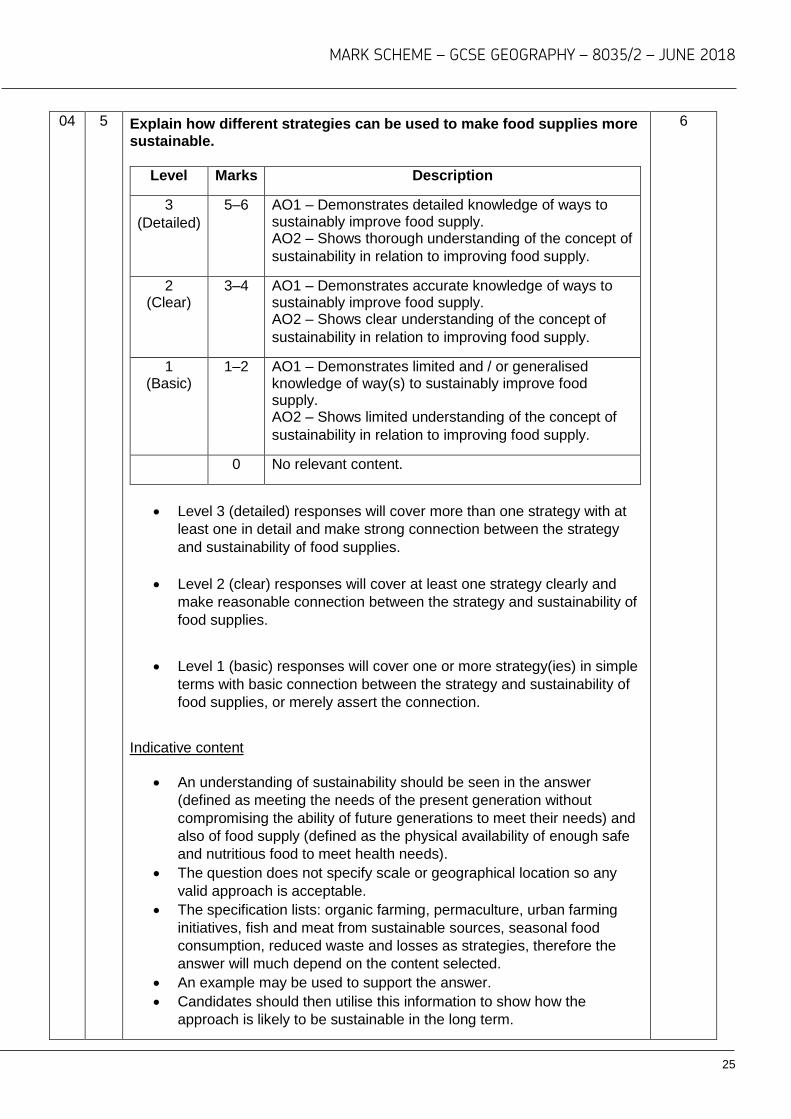
04 5 Explain how different strategies can be used to make food supplies more
sustainable.
Level Marks Description
3
(Detailed)
5–6 AO1 – Demonstrates detailed knowledge of ways to sustainably improve food supply. AO2 – Shows thorough understanding of the concept of
sustainability in relation to improving food supply.
2 (Clear)
3–4 AO1 – Demonstrates accurate knowledge of ways to sustainably improve food supply. AO2 – Shows clear understanding of the concept of
sustainability in relation to improving food supply.
1 (Basic)
1–2 AO1 – Demonstrates limited and / or generalised knowledge of way(s) to sustainably improve food supply. AO2 – Shows limited understanding of the concept of
sustainability in relation to improving food supply.
0 No relevant content.
Level 3 (detailed) responses will cover more than one strategy with at
least one in detail and make strong connection between the strategy
and sustainability of food supplies.
Level 2 (clear) responses will cover at least one strategy clearly and
make reasonable connection between the strategy and sustainability of
food supplies.
Level 1 (basic) responses will cover one or more strategy(ies) in simple
terms with basic connection between the strategy and sustainability of
food supplies, or merely assert the connection.
Indicative content
An understanding of sustainability should be seen in the answer
(defined as meeting the needs of the present generation without
compromising the ability of future generations to meet their needs) and
also of food supply (defined as the physical availability of enough safe
and nutritious food to meet health needs).
The question does not specify scale or geographical location so any
valid approach is acceptable.
The specification lists: organic farming, permaculture, urban farming
initiatives, fish and meat from sustainable sources, seasonal food
consumption, reduced waste and losses as strategies, therefore the
answer will much depend on the content selected.
An example may be used to support the answer.
Candidates should then utilise this information to show how the
approach is likely to be sustainable in the long term.
6

MARK SCHEME – GCSE GEOGRAPHY – 8035/2 – JUNE 2018
26
Max L1 for large scale or unsustainable strategies AO1 = 3 marks, AO2 = 3 marks
MARK SCHEME – GCSE GEOGRAPHY – 8035/2 – JUNE 2018
27
Qu Pt Marking Guidance Total
marks
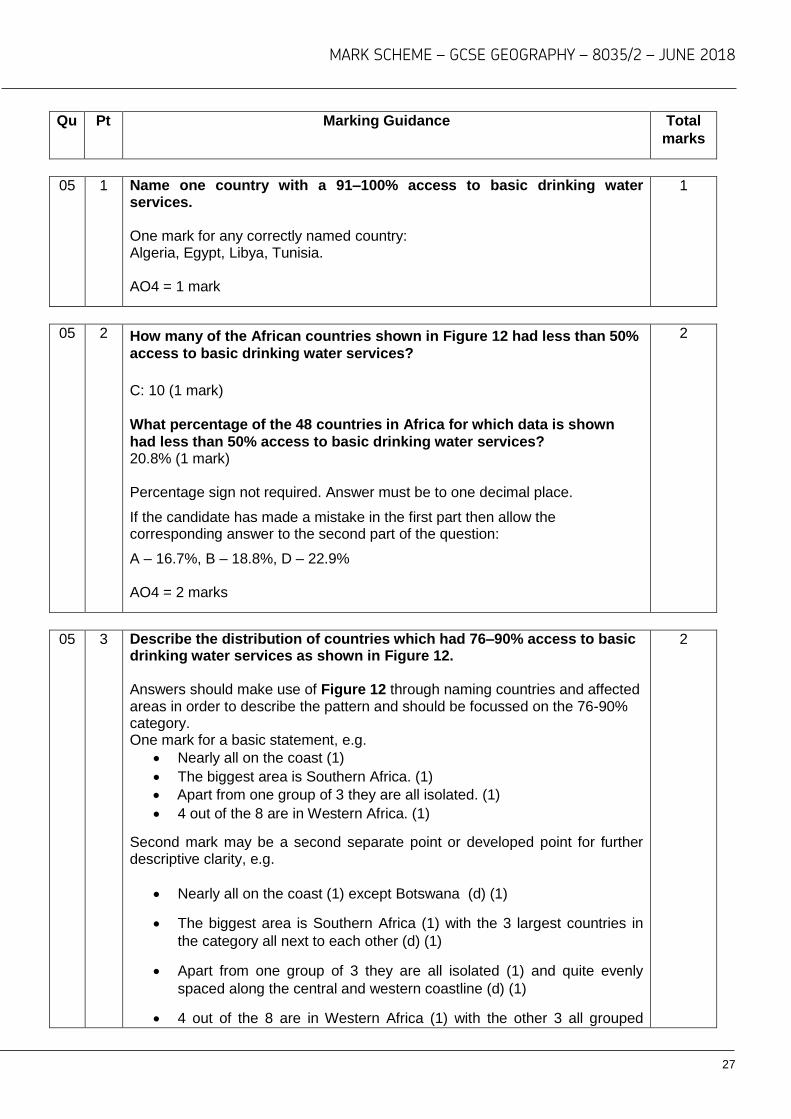
05 1 Name one country with a 91–100% access to basic drinking water services. One mark for any correctly named country: Algeria, Egypt, Libya, Tunisia. AO4 = 1 mark
1
05 2 How many of the African countries shown in Figure 12 had less than 50%
access to basic drinking water services?
C: 10 (1 mark)
What percentage of the 48 countries in Africa for which data is shown
had less than 50% access to basic drinking water services? 20.8% (1 mark) Percentage sign not required. Answer must be to one decimal place.
If the candidate has made a mistake in the first part then allow the corresponding answer to the second part of the question:
A – 16.7%, B – 18.8%, D – 22.9% AO4 = 2 marks
2
05 3 Describe the distribution of countries which had 76–90% access to basic drinking water services as shown in Figure 12. Answers should make use of Figure 12 through naming countries and affected areas in order to describe the pattern and should be focussed on the 76-90% category. One mark for a basic statement, e.g.
Nearly all on the coast (1)
The biggest area is Southern Africa. (1)
Apart from one group of 3 they are all isolated. (1)
4 out of the 8 are in Western Africa. (1)
Second mark may be a second separate point or developed point for further descriptive clarity, e.g.
Nearly all on the coast (1) except Botswana (d) (1)
The biggest area is Southern Africa (1) with the 3 largest countries in
the category all next to each other (d) (1)
Apart from one group of 3 they are all isolated (1) and quite evenly
spaced along the central and western coastline (d) (1)
4 out of the 8 are in Western Africa (1) with the other 3 all grouped
2
MARK SCHEME – GCSE GEOGRAPHY – 8035/2 – JUNE 2018
28
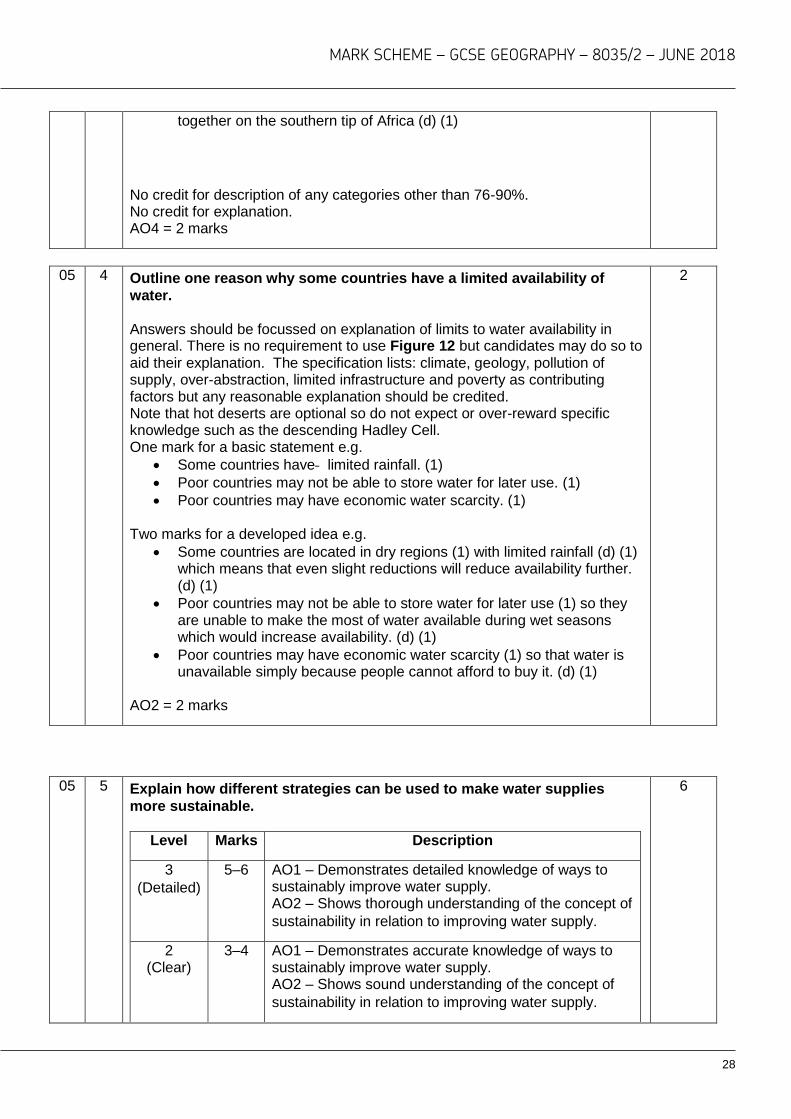
together on the southern tip of Africa (d) (1)
No credit for description of any categories other than 76-90%. No credit for explanation. AO4 = 2 marks
05 4 Outline one reason why some countries have a limited availability of
water. Answers should be focussed on explanation of limits to water availability in general. There is no requirement to use Figure 12 but candidates may do so to aid their explanation. The specification lists: climate, geology, pollution of supply, over-abstraction, limited infrastructure and poverty as contributing factors but any reasonable explanation should be credited. Note that hot deserts are optional so do not expect or over-reward specific knowledge such as the descending Hadley Cell. One mark for a basic statement e.g.
Some countries have limited rainfall. (1)
Poor countries may not be able to store water for later use. (1)
Poor countries may have economic water scarcity. (1) Two marks for a developed idea e.g.
Some countries are located in dry regions (1) with limited rainfall (d) (1) which means that even slight reductions will reduce availability further. (d) (1)
Poor countries may not be able to store water for later use (1) so they are unable to make the most of water available during wet seasons which would increase availability. (d) (1)
Poor countries may have economic water scarcity (1) so that water is unavailable simply because people cannot afford to buy it. (d) (1)
AO2 = 2 marks
2
05 5 Explain how different strategies can be used to make water supplies
more sustainable.
Level Marks Description
3
(Detailed)
5–6 AO1 – Demonstrates detailed knowledge of ways to sustainably improve water supply. AO2 – Shows thorough understanding of the concept of
sustainability in relation to improving water supply.
2 (Clear)
3–4 AO1 – Demonstrates accurate knowledge of ways to sustainably improve water supply. AO2 – Shows sound understanding of the concept of
sustainability in relation to improving water supply.
6
MARK SCHEME – GCSE GEOGRAPHY – 8035/2 – JUNE 2018
29
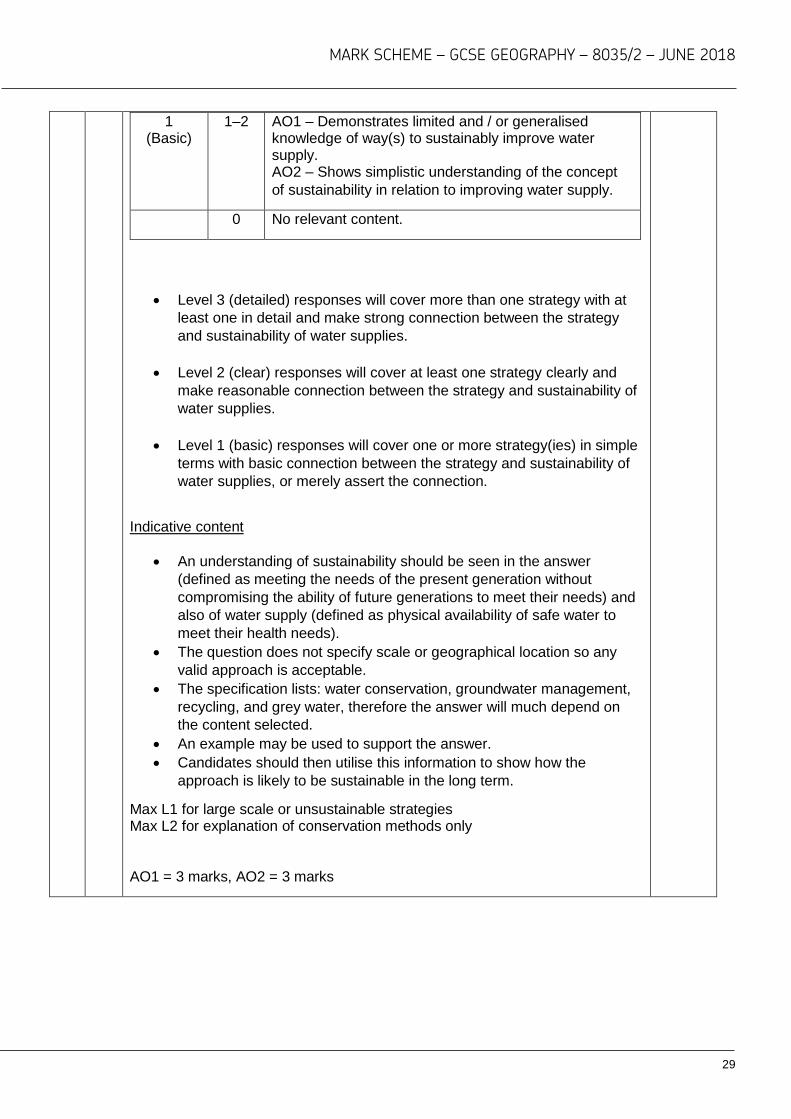
1 (Basic)
1–2 AO1 – Demonstrates limited and / or generalised knowledge of way(s) to sustainably improve water supply. AO2 – Shows simplistic understanding of the concept
of sustainability in relation to improving water supply.
0 No relevant content.
Level 3 (detailed) responses will cover more than one strategy with at
least one in detail and make strong connection between the strategy
and sustainability of water supplies.
Level 2 (clear) responses will cover at least one strategy clearly and
make reasonable connection between the strategy and sustainability of
water supplies.
Level 1 (basic) responses will cover one or more strategy(ies) in simple
terms with basic connection between the strategy and sustainability of
water supplies, or merely assert the connection.
Indicative content
An understanding of sustainability should be seen in the answer
(defined as meeting the needs of the present generation without
compromising the ability of future generations to meet their needs) and
also of water supply (defined as physical availability of safe water to
meet their health needs).
The question does not specify scale or geographical location so any
valid approach is acceptable.
The specification lists: water conservation, groundwater management,
recycling, and grey water, therefore the answer will much depend on
the content selected.
An example may be used to support the answer.
Candidates should then utilise this information to show how the
approach is likely to be sustainable in the long term.
Max L1 for large scale or unsustainable strategies Max L2 for explanation of conservation methods only AO1 = 3 marks, AO2 = 3 marks
MARK SCHEME – GCSE GEOGRAPHY – 8035/2 – JUNE 2018
30
Qu Pt Marking Guidance Total
marks
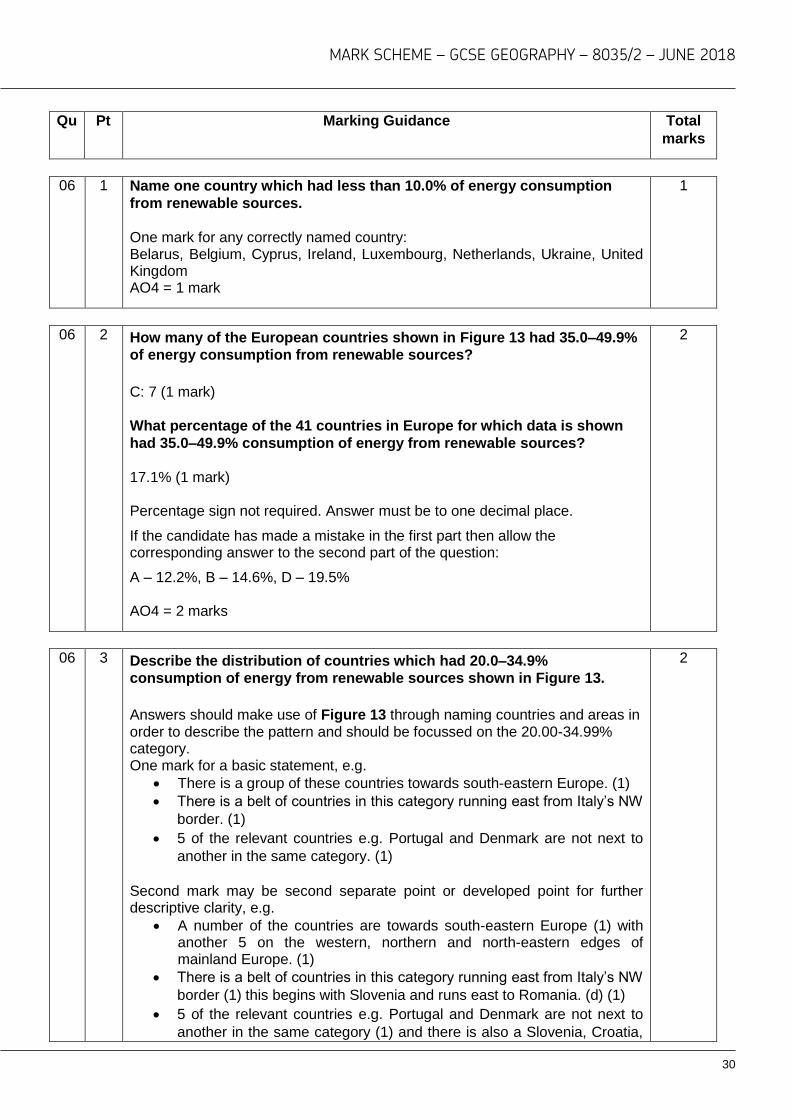
06 1 Name one country which had less than 10.0% of energy consumption
from renewable sources.
One mark for any correctly named country: Belarus, Belgium, Cyprus, Ireland, Luxembourg, Netherlands, Ukraine, United Kingdom AO4 = 1 mark
1
06 2 How many of the European countries shown in Figure 13 had 35.0–49.9%
of energy consumption from renewable sources?
C: 7 (1 mark) What percentage of the 41 countries in Europe for which data is shown
had 35.0–49.9% consumption of energy from renewable sources?
17.1% (1 mark) Percentage sign not required. Answer must be to one decimal place.
If the candidate has made a mistake in the first part then allow the corresponding answer to the second part of the question:
A – 12.2%, B – 14.6%, D – 19.5% AO4 = 2 marks
2
06 3 Describe the distribution of countries which had 20.0–34.9%
consumption of energy from renewable sources shown in Figure 13.
Answers should make use of Figure 13 through naming countries and areas in order to describe the pattern and should be focussed on the 20.00-34.99% category. One mark for a basic statement, e.g.
There is a group of these countries towards south-eastern Europe. (1)
There is a belt of countries in this category running east from Italy’s NW
border. (1)
5 of the relevant countries e.g. Portugal and Denmark are not next to
another in the same category. (1)
Second mark may be second separate point or developed point for further descriptive clarity, e.g.
A number of the countries are towards south-eastern Europe (1) with another 5 on the western, northern and north-eastern edges of mainland Europe. (1)
There is a belt of countries in this category running east from Italy’s NW
border (1) this begins with Slovenia and runs east to Romania. (d) (1)
5 of the relevant countries e.g. Portugal and Denmark are not next to
another in the same category (1) and there is also a Slovenia, Croatia,
2
MARK SCHEME – GCSE GEOGRAPHY – 8035/2 – JUNE 2018
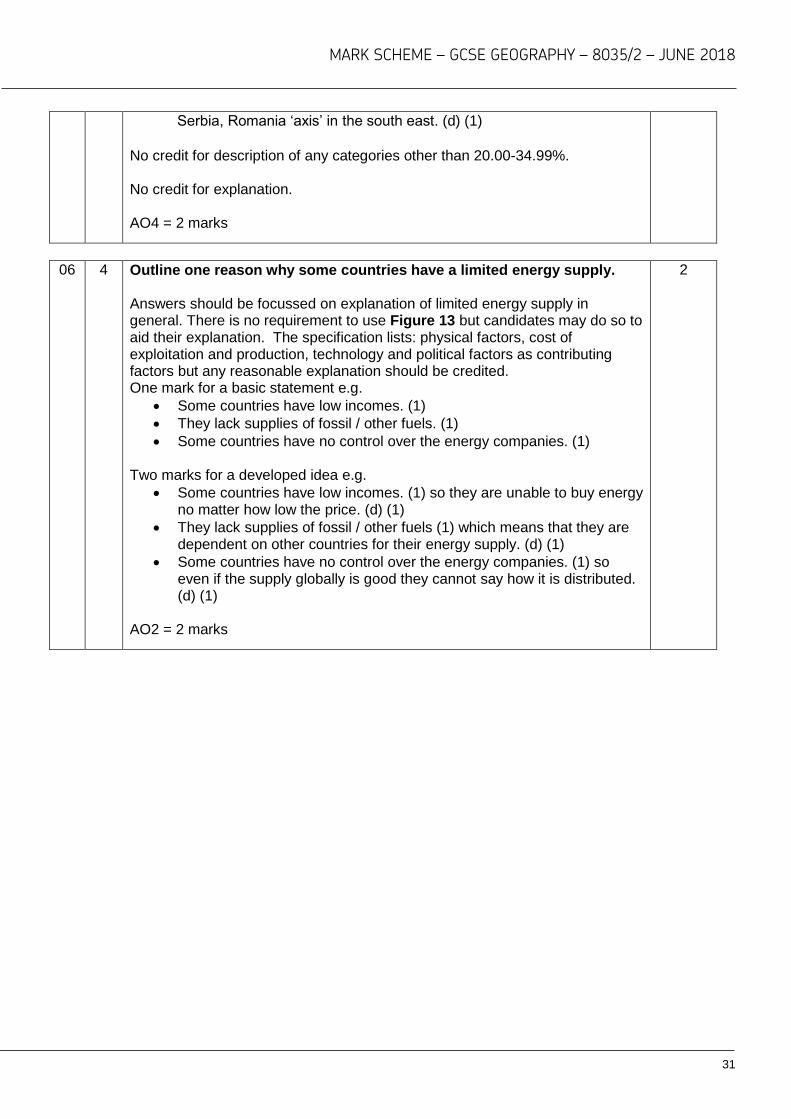
31
Serbia, Romania ‘axis’ in the south east. (d) (1)
No credit for description of any categories other than 20.00-34.99%. No credit for explanation. AO4 = 2 marks
06 4 Outline one reason why some countries have a limited energy supply. Answers should be focussed on explanation of limited energy supply in general. There is no requirement to use Figure 13 but candidates may do so to aid their explanation. The specification lists: physical factors, cost of exploitation and production, technology and political factors as contributing factors but any reasonable explanation should be credited. One mark for a basic statement e.g.
Some countries have low incomes. (1)
They lack supplies of fossil / other fuels. (1)
Some countries have no control over the energy companies. (1) Two marks for a developed idea e.g.
Some countries have low incomes. (1) so they are unable to buy energy no matter how low the price. (d) (1)
They lack supplies of fossil / other fuels (1) which means that they are dependent on other countries for their energy supply. (d) (1)
Some countries have no control over the energy companies. (1) so even if the supply globally is good they cannot say how it is distributed. (d) (1)
AO2 = 2 marks
2
MARK SCHEME – GCSE GEOGRAPHY – 8035/2 – JUNE 2018
32
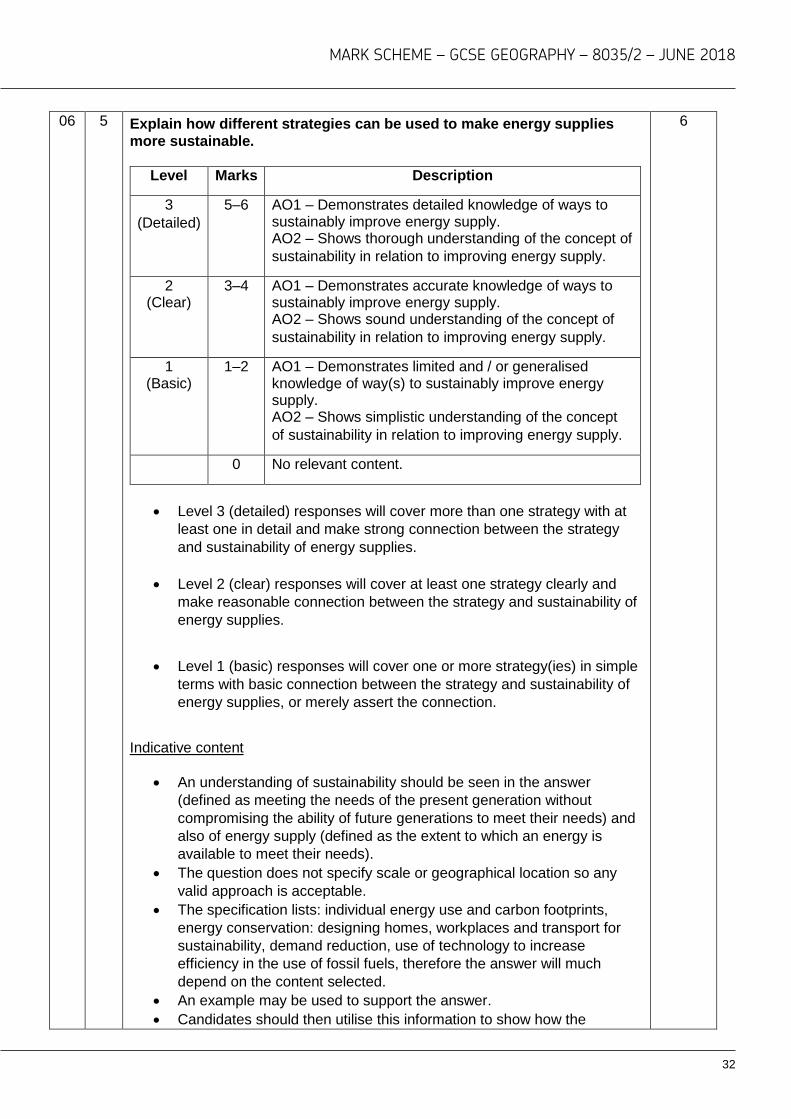
06 5 Explain how different strategies can be used to make energy supplies
more sustainable.
Level Marks Description
3
(Detailed)
5–6 AO1 – Demonstrates detailed knowledge of ways to sustainably improve energy supply. AO2 – Shows thorough understanding of the concept of
sustainability in relation to improving energy supply.
2 (Clear)
3–4 AO1 – Demonstrates accurate knowledge of ways to sustainably improve energy supply. AO2 – Shows sound understanding of the concept of
sustainability in relation to improving energy supply.
1 (Basic)
1–2 AO1 – Demonstrates limited and / or generalised knowledge of way(s) to sustainably improve energy supply. AO2 – Shows simplistic understanding of the concept
of sustainability in relation to improving energy supply.
0 No relevant content.
Level 3 (detailed) responses will cover more than one strategy with at
least one in detail and make strong connection between the strategy
and sustainability of energy supplies.
Level 2 (clear) responses will cover at least one strategy clearly and
make reasonable connection between the strategy and sustainability of
energy supplies.
Level 1 (basic) responses will cover one or more strategy(ies) in simple
terms with basic connection between the strategy and sustainability of
energy supplies, or merely assert the connection.
Indicative content
An understanding of sustainability should be seen in the answer
(defined as meeting the needs of the present generation without
compromising the ability of future generations to meet their needs) and
also of energy supply (defined as the extent to which an energy is
available to meet their needs).
The question does not specify scale or geographical location so any
valid approach is acceptable.
The specification lists: individual energy use and carbon footprints,
energy conservation: designing homes, workplaces and transport for
sustainability, demand reduction, use of technology to increase
efficiency in the use of fossil fuels, therefore the answer will much
depend on the content selected.
An example may be used to support the answer.
Candidates should then utilise this information to show how the
6
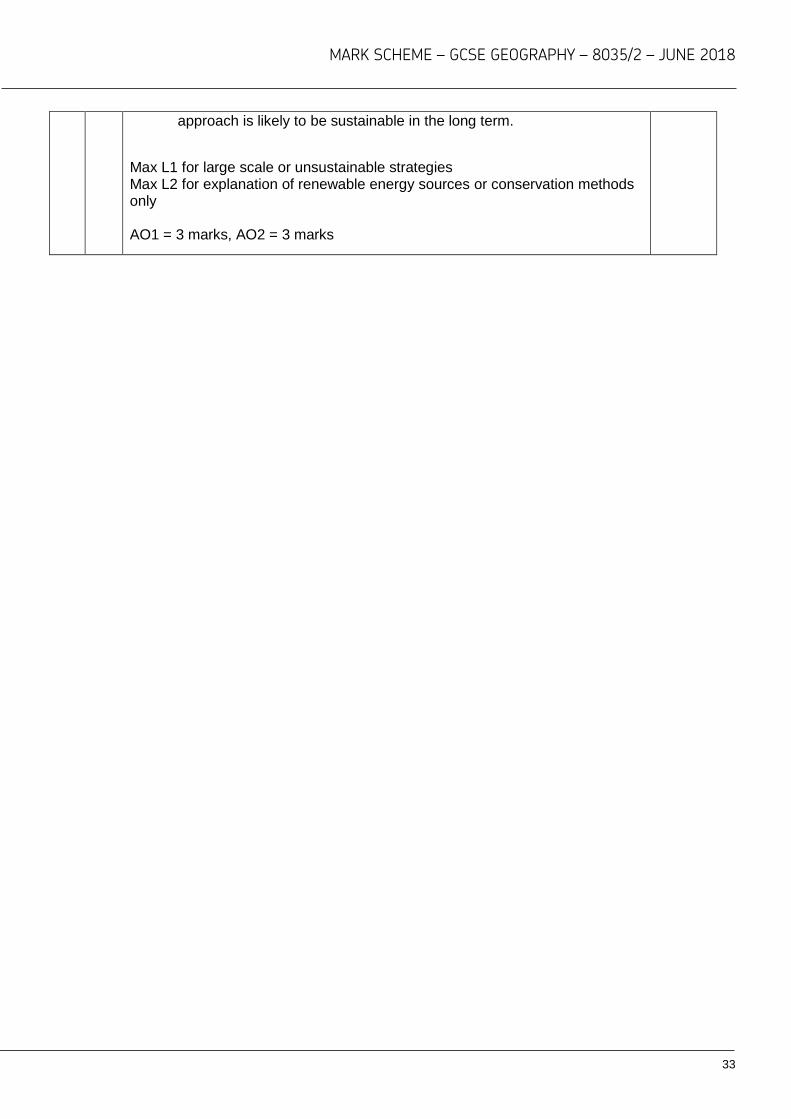
MARK SCHEME – GCSE GEOGRAPHY – 8035/2 – JUNE 2018
33
approach is likely to be sustainable in the long term.
Max L1 for large scale or unsustainable strategies Max L2 for explanation of renewable energy sources or conservation methods only AO1 = 3 marks, AO2 = 3 marks