Embed Size (px)
Citation preview

DRAFT Version 0.1 Component code
DRAFT SPECIMEN
MATERIAL
GCSE
GEOGRAPHY
Paper 3 Geographical applications
Specimen 2015 Time allowed: 1 hour
Materials For this paper you must have: • a clean copy of the pre-release resources sheet
Instructions • Use black ink or black ball-point pen. • Fill in the boxes at the bottom of this page. • Answer all questions. • You must answer the questions on the spaces provided. Do not write outside the box around
each page or on blank pages. • Do all rough work in this book. Cross through any work you do not want to be marked.
Information • The marks for questions are shown in brackets. • The total number of marks available for this paper is 76. • Spelling, punctuation, grammar and specialist terminology will be assessed in Questions 03.2
and 05.2.
Advice For multiple-choice questions, completely fill in the circle alongside the appropriate answer(s).
If you want to change your answer you must cross out your original answer as shown.
If you wish to return to an answer previously crossed out, ring the answer you now wish to select as shown.
Please write clearly, in block capitals, to allow character computer recognition. Centre number Candidate number Surname Forename(s) Candidate signature
CORRECT METHOD WRONG METHODS Draft
2
DRAFT Version 0.1
Section A Issue evaluation
Answer all questions in this section.
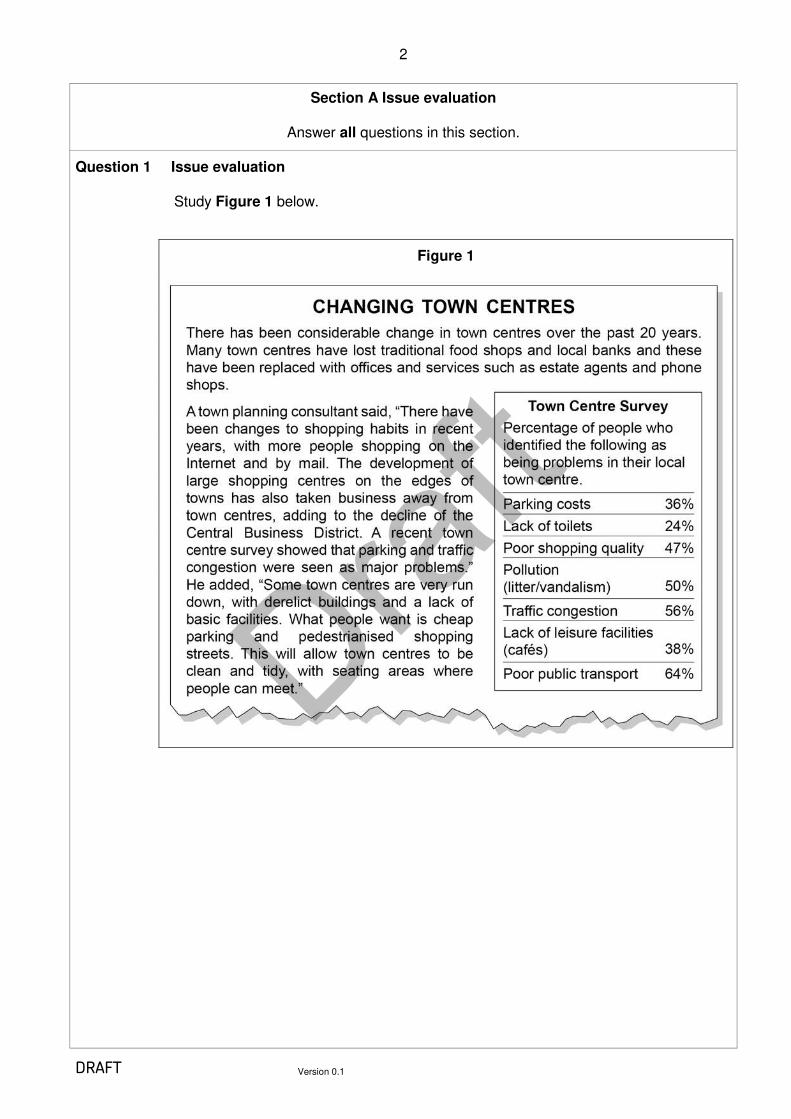
Question 1 Issue evaluation Study Figure 1 below.
Figure 1
Draft
3
DRAFT Version 0.1 Turn over
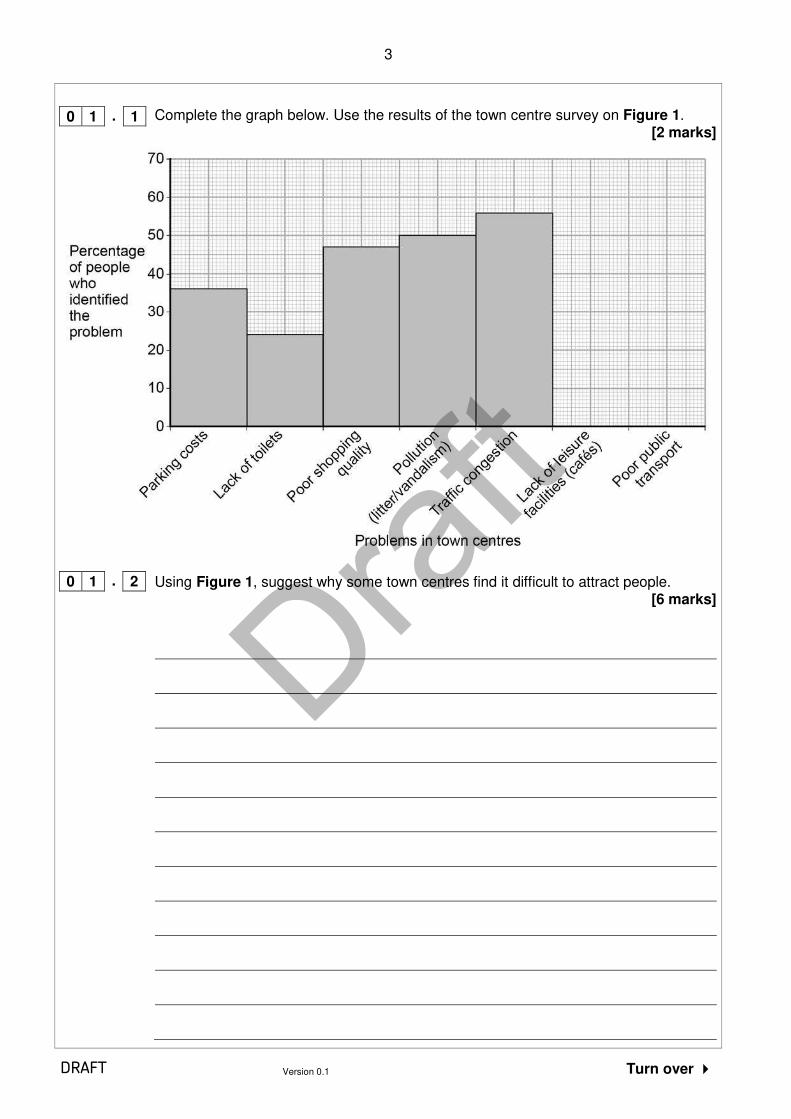
Complete the graph below. Use the results of the town centre survey on Figure 1.
[2 marks]
Using Figure 1, suggest why some town centres find it difficult to attract people.
[6 marks]
0 1 . 1
0 1 . 2
Draft
4
DRAFT Version 0.1
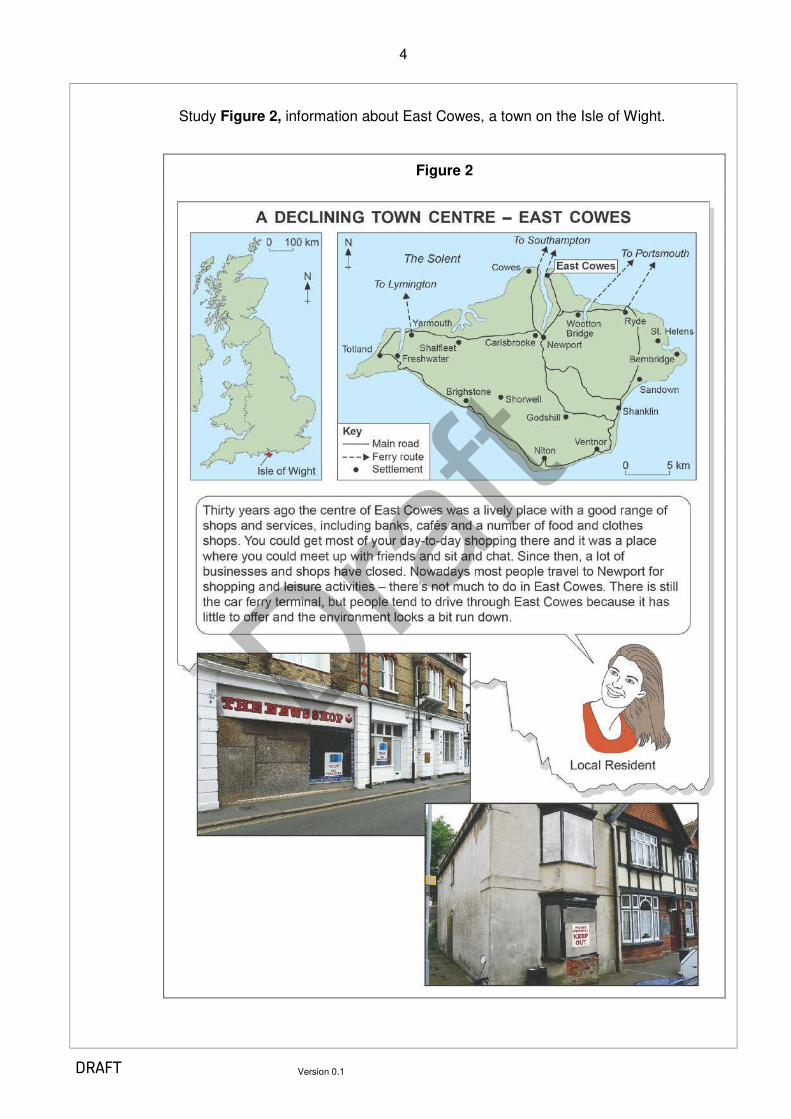
Study Figure 2, information about East Cowes, a town on the Isle of Wight.
Figure 2
Draft
5
DRAFT Version 0.1 Turn over
Using Figure 2, which two of the following statements about East Cowes are true? Shade two circles only.
A East Cowes has a ferry route to Portsmouth. B East Cowes is in the centre of the Isle of Wight. C East Cowes is on the north coast of the Isle of Wight. D East Cowes is over 50 km from the mainland of England. E The ferry route from East Cowes goes to Southampton.
[2 marks]
Using Figure 2, explain how the decline of business in town centres affects both the local economy and the local environment.
[6 marks]
Question 2 continues on the next page
0 2 . 1
0 2 . 2
Draft

6
DRAFT Version 0.1
Explain why declining urban areas such as East Cowes may not be seen as a good location to open a new business.
[6 marks]
0 2 . 3
Draft

7
DRAFT Version 0.1 Turn over
Study Figure 3 on the resources sheet, information about the East Cowes Regeneration Project. What is meant by the following terms?
[3 marks]
Residential area:
Community facility:
Infrastructure:
Question 3 continues on the next page
0 3 . 1
Draft
8
DRAFT Version 0.1
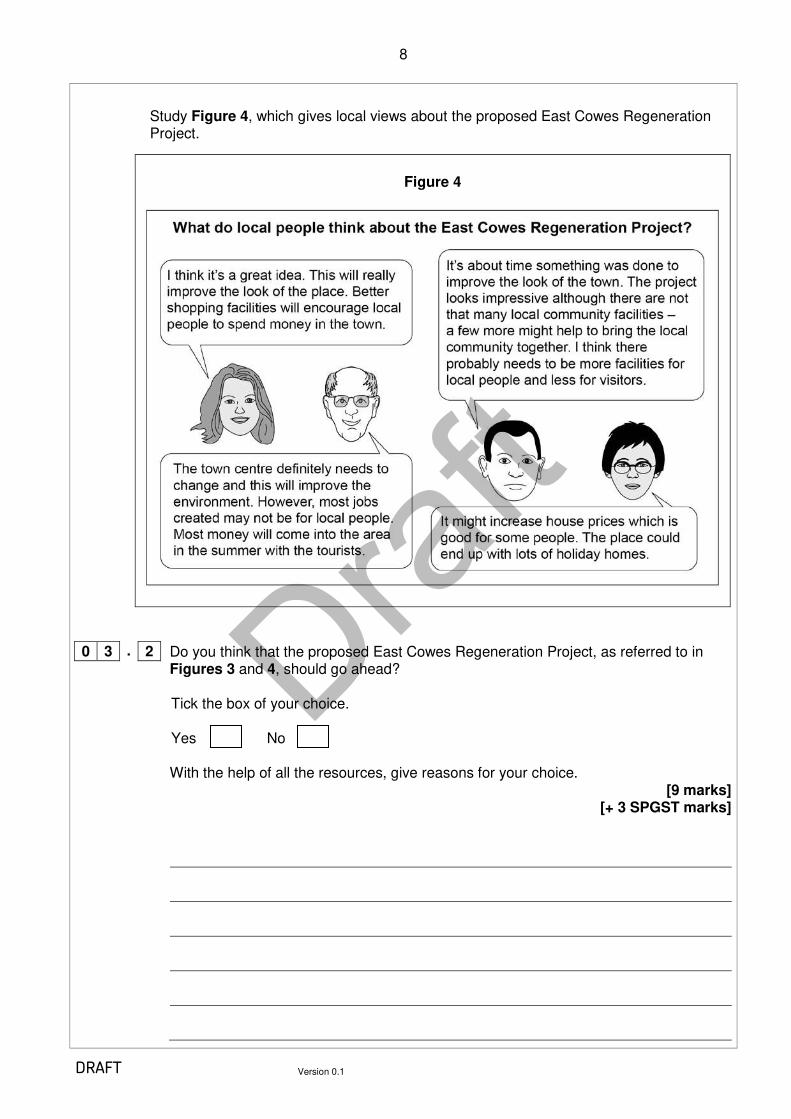
Study Figure 4, which gives local views about the proposed East Cowes Regeneration
Project.
Figure 4
Do you think that the proposed East Cowes Regeneration Project, as referred to in Figures 3 and 4, should go ahead?
Tick the box of your choice. Yes No
With the help of all the resources, give reasons for your choice.
[9 marks] [+ 3 SPGST marks]
0 3 . 2
Draft

9
DRAFT Version 0.1 Turn over
End of Section A
Turn over for Section B
Draft
10
DRAFT Version 0.1
Section B
Fieldwork
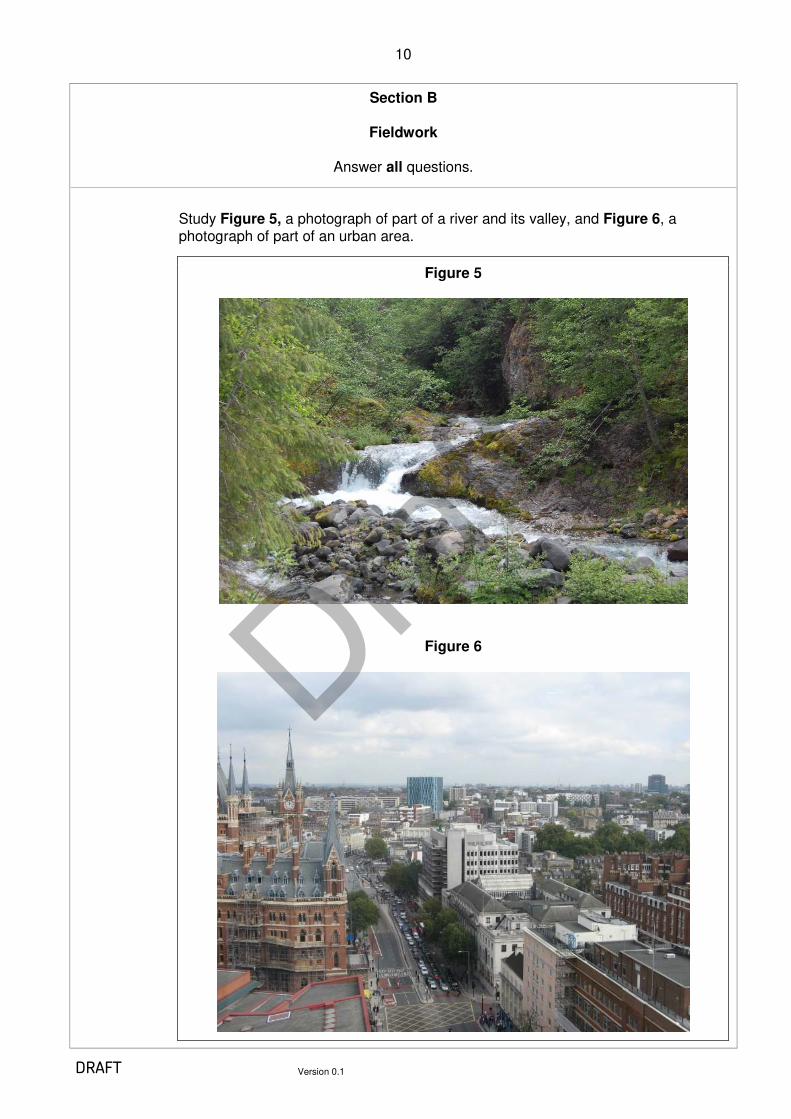
Answer all questions. Study Figure 5, a photograph of part of a river and its valley, and Figure 6, a
photograph of part of an urban area.
Figure 5
Figure 6
Draft
11
DRAFT Version 0.1 Turn over
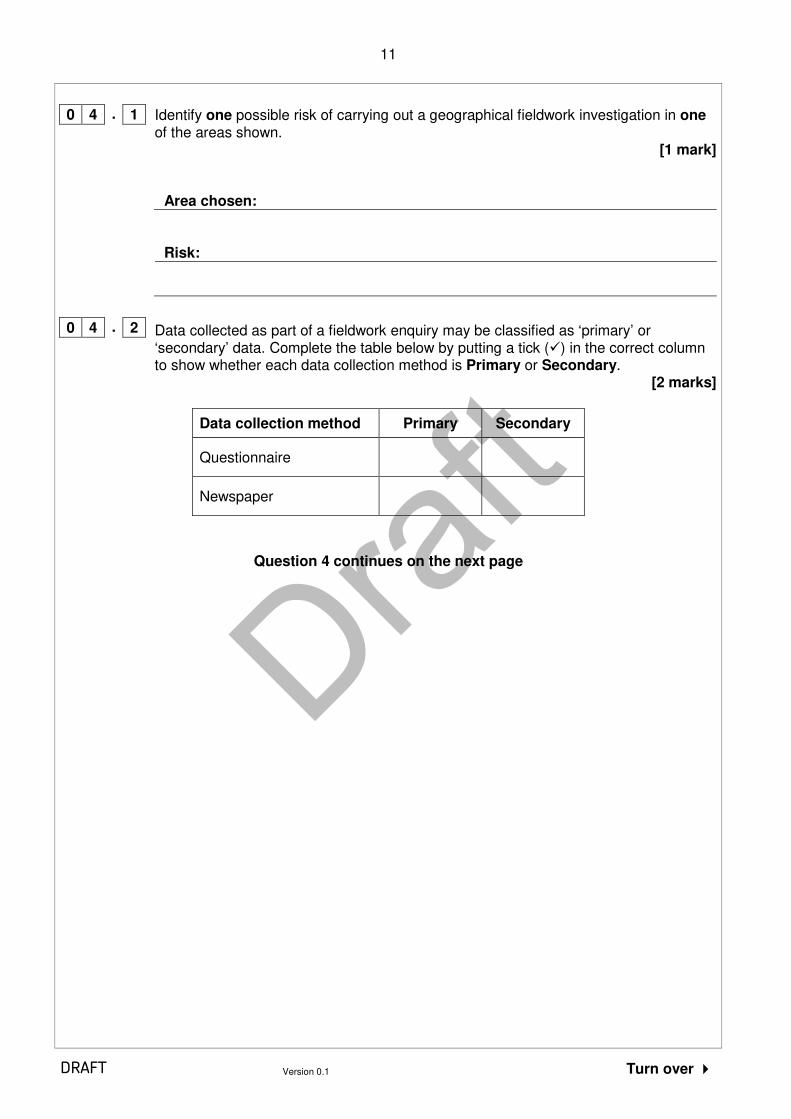
Identify one possible risk of carrying out a geographical fieldwork investigation in one of the areas shown.
[1 mark]
Area chosen:
Risk:
Data collected as part of a fieldwork enquiry may be classified as ‘primary’ or ‘secondary’ data. Complete the table below by putting a tick () in the correct column to show whether each data collection method is Primary or Secondary.
[2 marks]
Data collection method Primary Secondary
Questionnaire
Newspaper
Question 4 continues on the next page
0 4 . 1
0 4 . 2
Draft
12
DRAFT Version 0.1
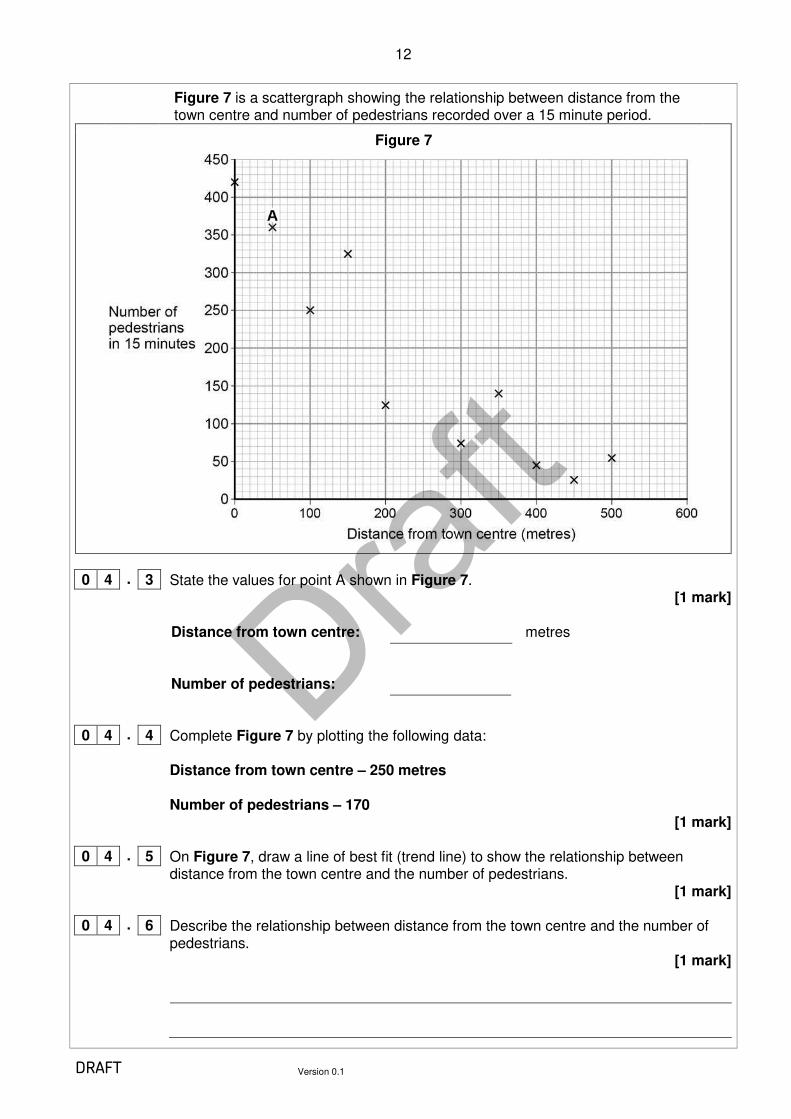
Figure 7 is a scattergraph showing the relationship between distance from the town centre and number of pedestrians recorded over a 15 minute period.
Figure 7
State the values for point A shown in Figure 7.
[1 mark] Distance from town centre: metres Number of pedestrians:
Complete Figure 7 by plotting the following data: Distance from town centre – 250 metres Number of pedestrians – 170
[1 mark] On Figure 7, draw a line of best fit (trend line) to show the relationship between distance from the town centre and the number of pedestrians.
[1 mark] Describe the relationship between distance from the town centre and the number of pedestrians.
[1 mark]
0 4 . 3
0 4 . 4
0 4 . 5
0 4 . 6
Draft

13
DRAFT Version 0.1 Turn over
Study Figure 8, an incomplete summary of a student’s survey recording traffic flows as part of a local fieldwork enquiry.
Figure 8
Location: London Road Day/Date: Monday 25 January Time: 10.45–11.00 am Weather: Dry, cool
Cars 173
Vans/lorries
Buses/coaches 3
Cycles/motor cycles etc 5
Total 197
Calculate the total number of vans/lorries recorded. Complete Figure 8 by writing your answer in the box.
[1 mark]
A student used a line graph to represent the data on Figure 8. Identify a type of graph that would be more appropriate to display these results and give a reason for your choice.
[2 marks]
Type of graph:
Reason:
Suggest why the results shown in Figure 8 might not be representative of traffic flows along London Road.
[2 marks]
Question 4 continues on the next page
0 4 . 7
0 4 . 9
0 4 . 8
Draft
14
DRAFT Version 0.1
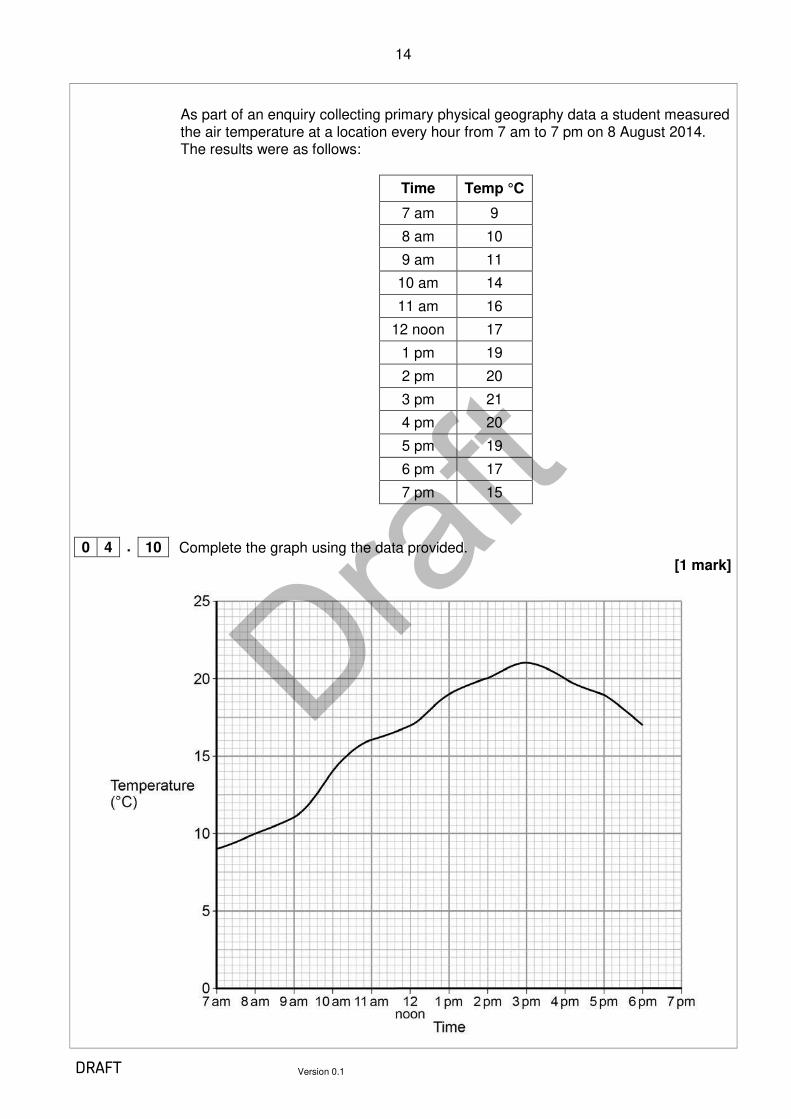
As part of an enquiry collecting primary physical geography data a student measured
the air temperature at a location every hour from 7 am to 7 pm on 8 August 2014. The results were as follows:
Time Temp °C
7 am 9
8 am 10
9 am 11
10 am 14
11 am 16
12 noon 17
1 pm 19
2 pm 20
3 pm 21
4 pm 20
5 pm 19
6 pm 17
7 pm 15
Complete the graph using the data provided. [1 mark]
0 4 . 10
Draft
15
DRAFT Version 0.1 Turn over
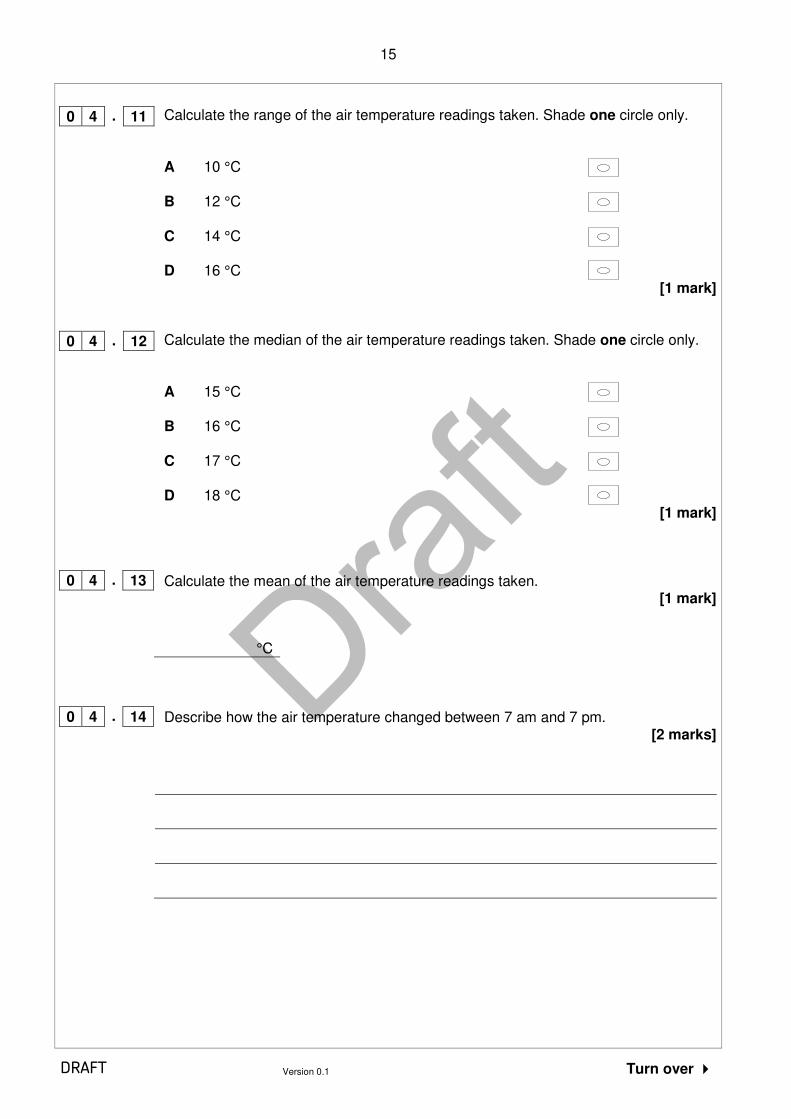
Calculate the range of the air temperature readings taken. Shade one circle only.
A 10 °C B 12 °C C 14 °C D 16 °C
[1 mark]
Calculate the median of the air temperature readings taken. Shade one circle only.
A 15 °C B 16 °C C 17 °C D 18 °C
[1 mark]
Calculate the mean of the air temperature readings taken.
[1 mark]
°C
Describe how the air temperature changed between 7 am and 7 pm.
[2 marks]
0 4 . 14
0 4 . 11
0 4 . 12
0 4 . 13
Draft

16
DRAFT Version 0.1
State the title of your fieldwork enquiry in which physical geography data was collected.
Title of fieldwork enquiry:
Outline the geographical idea(s) on which your fieldwork enquiry was based.
[2 marks]
Describe how you carried out one primary data collection method used to collect your physical geography data and explain why it was required.
[6 marks] [+ 3 SPGST marks]
Method used:
Description and explanation:
0 5 . 1
0 5 . 2
Draft

17
DRAFT Version 0.1 Turn over
State the title of your fieldwork enquiry in which human geography data was collected.
Title of fieldwork enquiry:
Outline the main results and conclusions of your enquiry.
[6 marks]
Question 5 continues on the next page
0 5 . 3
Draft

18
DRAFT Version 0.1
Explain how your enquiry in which human geography fieldwork data was collected could be improved.
[4 marks]
END OF QUESTIONS
0 5 . 4
Draft

19
DRAFT Version 0.1 Turn over
There are no questions printed on this page
DO NOT WRITE ON THIS PAGE ANSWER IN THE SPACES PROVIDED
Draft

20
DRAFT Version 0.1
There are no questions printed on this page
DO NOT WRITE ON THIS PAGE ANSWER IN THE SPACES PROVIDED
Draft