Embed Size (px)
Citation preview
GCP Applied Technologies
May 2016
©2016 GCP Applied Technologies Inc.
Goldman Sachs Basic Materials Conference
©2016 GCP Applied Technologies Inc. 2
This presentation contains “forward-looking statements,” that is, information related to future, not past, events. Such statements generally include the words “believes,” “plans,” “intends,” “targets,” “will,” “expects,” “suggests,” “anticipates,” “outlook,” “continues” or similar expressions. Forward-looking statements include, without limitation, expected financial positions; results of operations; cash flows; financing plans; business strategy; operating plans; capital and other expenditures; competitive positions; growth opportunities for existing products; benefits from new technology and cost reduction initiatives, plans and objectives; and markets for securities. Like other businesses, GCP is subject to risks and uncertainties that could cause its actual results to differ materially from its projections or that could cause other forward-looking statements to prove incorrect. Factors that could cause actual results to materially differ from those contained in the forward-looking statements, or that could cause other forward-looking statements to prove incorrect, include, without limitation, risks related to: the cyclical and seasonal nature of theindustries that GCP serves; foreign operations, especially in emerging regions; changes in currency exchange rates; the cost and availability of raw materials and energy; the effectiveness of GCP’s research and development, new product introductions and growth investments; acquisitions and divestitures of assets and gains and losses from dispositions; developments affecting GCP’s outstanding liquidity and indebtedness, including debt covenants and interest rate exposure; developments affecting GCP’s funded and unfunded pension obligations; warranty and product liability claims; legal proceedings; uncertainties related to GCP’s ability to realize the anticipated benefits of the spin-off /separation from W.R. Grace and the value of GCP’s common stock following the spin-off; the inability to establish or maintain certain business relationships and relationships with customers and suppliers or the inability to retain key personnel following the spin-off; and hazardous materials and the costs of compliance with environmental regulation. These and other factors are identified and described in more detail in the “Risk Factors” section of company’s Form 10-K filed March 29, 2016 and available online at www.sec.gov. Readers are cautioned not to place undue reliance on GCP’s projections and forward-looking statements, which speak only as the date thereof. GCP undertakes no obligation to publicly release any revision to the projections and forward-looking statements contained in this presentation, or to update them to reflect events or circumstances occurring after the date of this presentation.
Non-GAAP Financial MeasuresThese slides contain certain “non-GAAP financial measures”. Please refer to the Appendix for definitions of the non-GAAP financial measures used herein and a reconciliation of those non-GAAP financial measures to their most comparable GAAP measure.
Forward Looking Statements
Investment Highlights
©2016 GCP Applied Technologies Inc. 3
Successfully launched as a $1.4B revenue public company on February 3
Leading global provider of high-value products and technologies in the
construction and packaging industries
Capitalizing on formulation, selling capability and technical service
expertise across diverse geographies
Low capital intensity business serving a global customer base
Positioned for continued growth and focused on building shareholder value
4©2016 GCP Applied Technologies Inc.
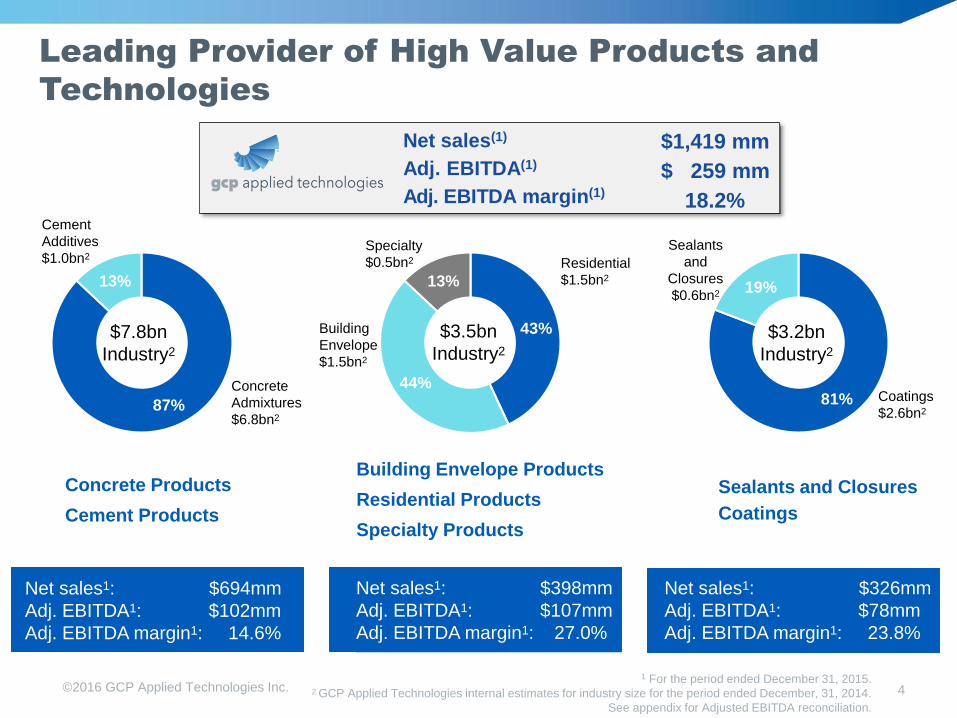
Leading Provider of High Value Products and
Technologies
Building Envelope Products
Residential Products
Specialty Products
Sealants and Closures
Coatings
Concrete Products
Cement Products
Net sales1: $694mm
Adj. EBITDA1: $102mm
Adj. EBITDA margin1: 14.6%
Net sales1: $326mm
Adj. EBITDA1: $78mm
Adj. EBITDA margin1: 23.8%
Net sales1: $398mm
Adj. EBITDA1: $107mm
Adj. EBITDA margin1: 27.0%
Net sales(1)
Adj. EBITDA(1)
Adj. EBITDA margin(1)
$1,419 mm
$ 259 mm
18.2%
1 For the period ended December 31, 2015.2 GCP Applied Technologies internal estimates for industry size for the period ended December, 31, 2014.
See appendix for Adjusted EBITDA reconciliation.
87%
13%
43%
44%
13%
81%
19%
Cement
Additives
$1.0bn2
Concrete
Admixtures
$6.8bn2
Building
Envelope
$1.5bn2
Specialty
$0.5bn2 Residential
$1.5bn2
Sealants
and
Closures
$0.6bn2
Coatings
$2.6bn2
$7.8bn
Industry2
$3.5bn
Industry2
$3.2bn
Industry2
5
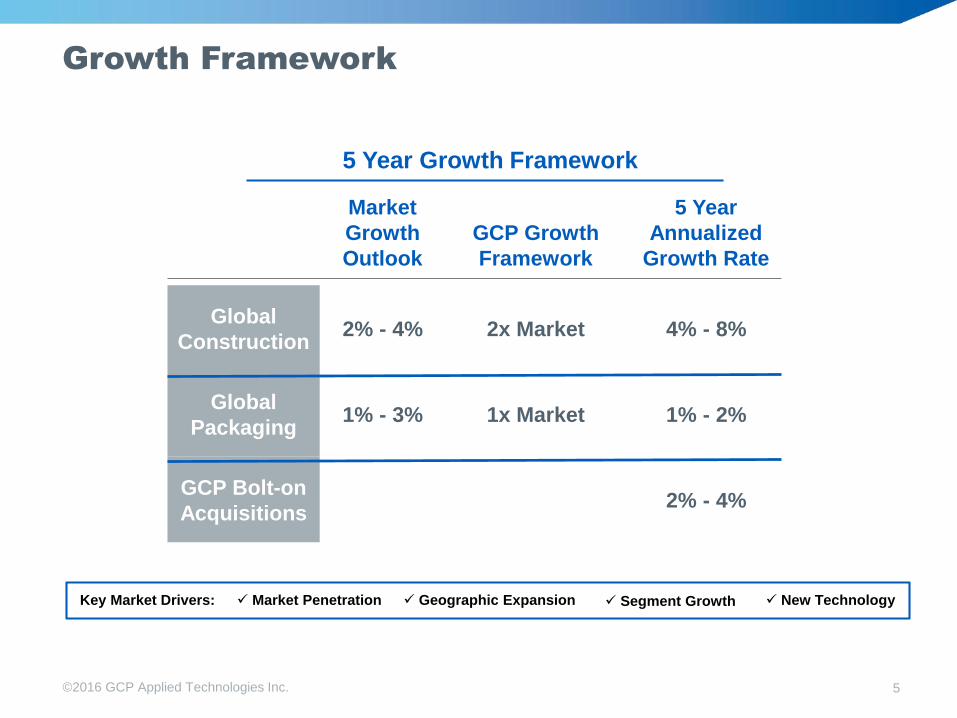
Growth Framework
5 Year Growth Framework
Market
Growth
Outlook
GCP Growth
Framework
5 Year
Annualized
Growth Rate
Global
Construction2% - 4% 2x Market 4% - 8%
Global
Packaging1% - 3% 1x Market 1% - 2%
GCP Bolt-on
Acquisitions2% - 4%
©2016 GCP Applied Technologies Inc.
Market PenetrationKey Market Drivers: Segment Growth New Technology Geographic Expansion
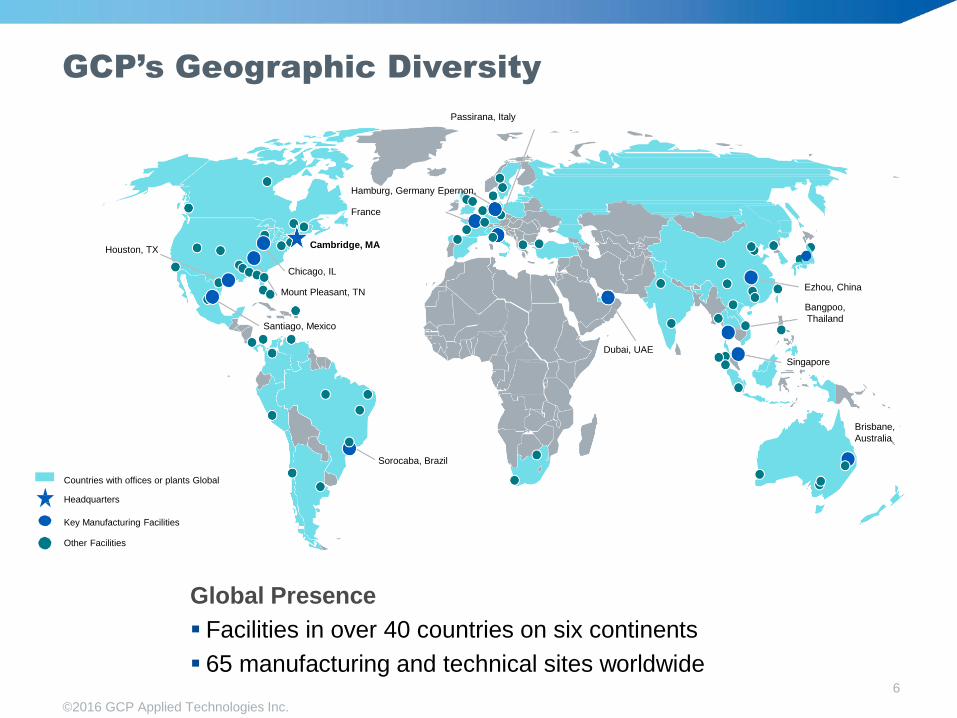
Global Presence
Facilities in over 40 countries on six continents
65 manufacturing and technical sites worldwide
GCP’s Geographic Diversity
Cambridge, MA
Hamburg, Germany Epernon,
France
Chicago, IL
Mount Pleasant, TN
Santiago, Mexico
Singapore
Dubai, UAE
Sorocaba, Brazil
Bangpoo,
Thailand
Brisbane,
Australia
Ezhou, China
Houston, TX
Passirana, Italy
Countries with offices or plants Global
Headquarters
Key Manufacturing Facilities
Other Facilities
©2016 GCP Applied Technologies Inc.
6
7
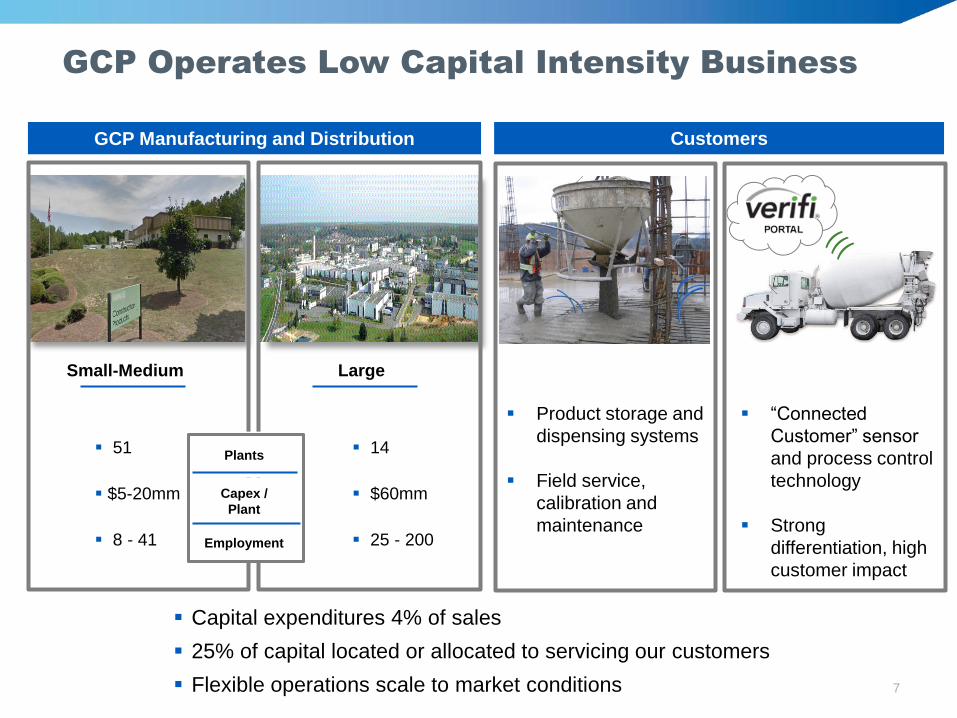
GCP Operates Low Capital Intensity Business
“Connected
Customer” sensor
and process control
technology
Strong
differentiation, high
customer impact
GCP Manufacturing and Distribution Customers
Product storage and
dispensing systems
Field service,
calibration and
maintenance
Small-Medium Large
51Plants
14
$5-20mm Capex /
Plant $60mm
8 - 41 Employment 25 - 200
Capital expenditures 4% of sales
25% of capital located or allocated to servicing our customers
Flexible operations scale to market conditions
8
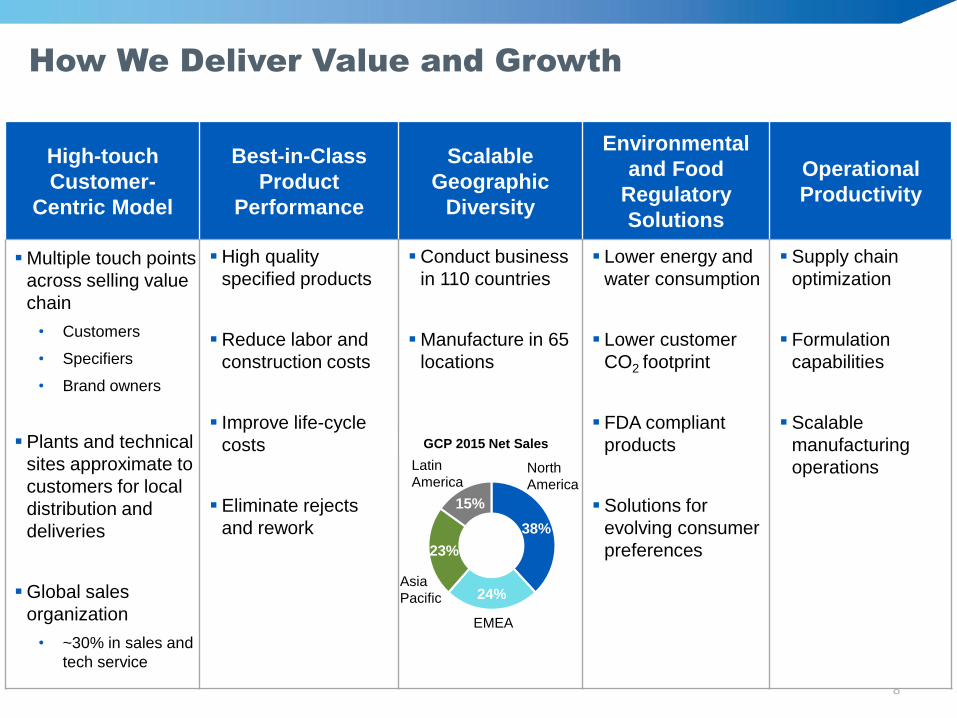
High-touch
Customer-
Centric Model
Best-in-Class
Product
Performance
Scalable
Geographic
Diversity
Environmental
and Food
Regulatory
Solutions
Operational
Productivity
High quality
specified products
Reduce labor and
construction costs
Improve life-cycle
costs
Eliminate rejects
and rework
Conduct business
in 110 countries
Manufacture in 65
locations
Lower energy and
water consumption
Lower customer
CO2 footprint
FDA compliant
products
Solutions for
evolving consumer
preferences
Supply chain
optimization
Formulation
capabilities
Scalable
manufacturing
operations
How We Deliver Value and Growth
38%
24%
23%
15%
North
America
EMEA
Asia
Pacific
Latin
America
GCP 2015 Net Sales
Multiple touch points
across selling value
chain
• Customers
• Specifiers
• Brand owners
Plants and technical
sites approximate to
customers for local
distribution and
deliveries
Global sales
organization
• ~30% in sales and
tech service
©2016 GCP Applied Technologies Inc.
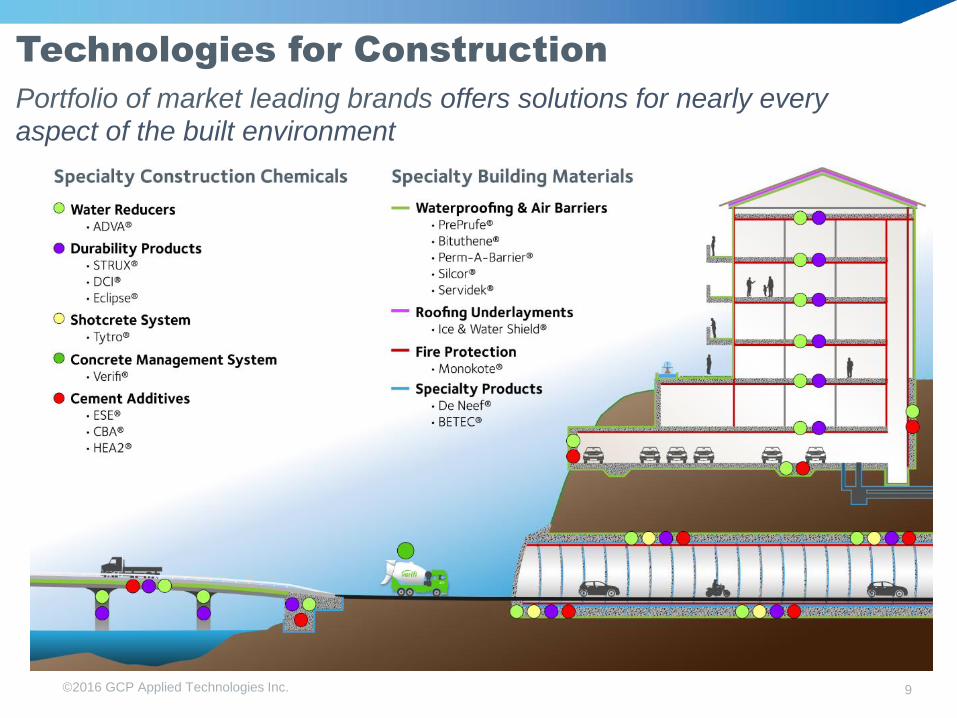
Technologies for Construction
Portfolio of market leading brands offers solutions for nearly every
aspect of the built environment
9
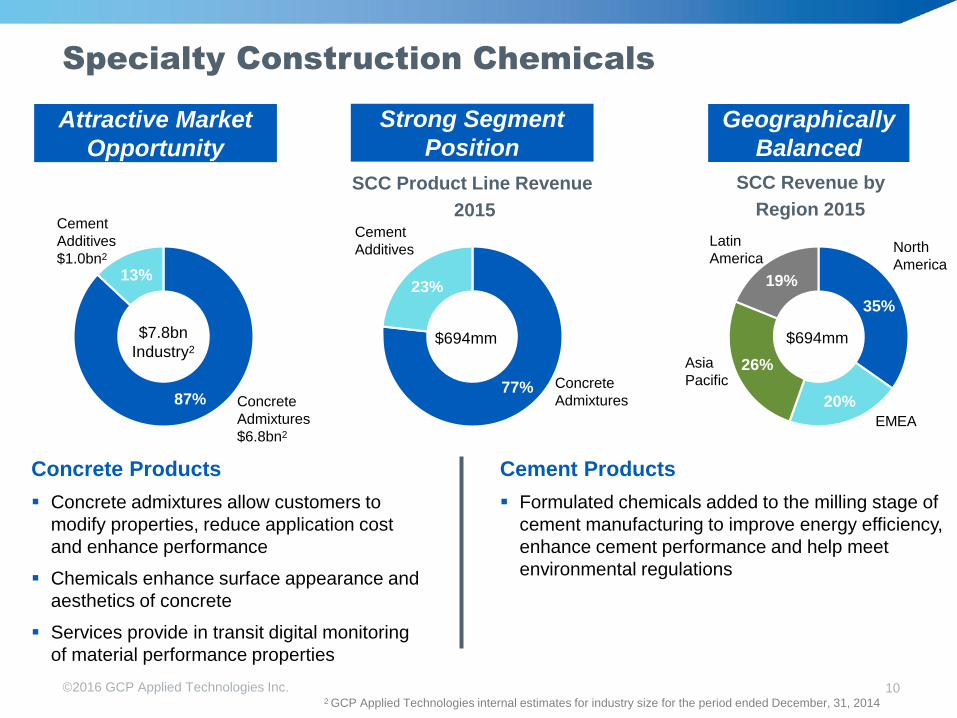
Specialty Construction Chemicals
Strong Segment
Position
Geographically
Balanced
©2016 GCP Applied Technologies Inc. 10
77%
23%
$694mm
Cement
Additives
Concrete
Admixtures
35%
20%
26%
19%
$694mm
Latin
America
Asia
Pacific
North
America
EMEA
Concrete Products
Concrete admixtures allow customers to
modify properties, reduce application cost
and enhance performance
Chemicals enhance surface appearance and
aesthetics of concrete
Services provide in transit digital monitoring
of material performance properties
Cement Products
Formulated chemicals added to the milling stage of
cement manufacturing to improve energy efficiency,
enhance cement performance and help meet
environmental regulations
SCC Revenue by
Region 2015
SCC Product Line Revenue
2015
87%
13%
Cement
Additives
$1.0bn2
Concrete
Admixtures
$6.8bn2
$7.8bn
Industry2
Attractive Market
Opportunity
2 GCP Applied Technologies internal estimates for industry size for the period ended December, 31, 2014
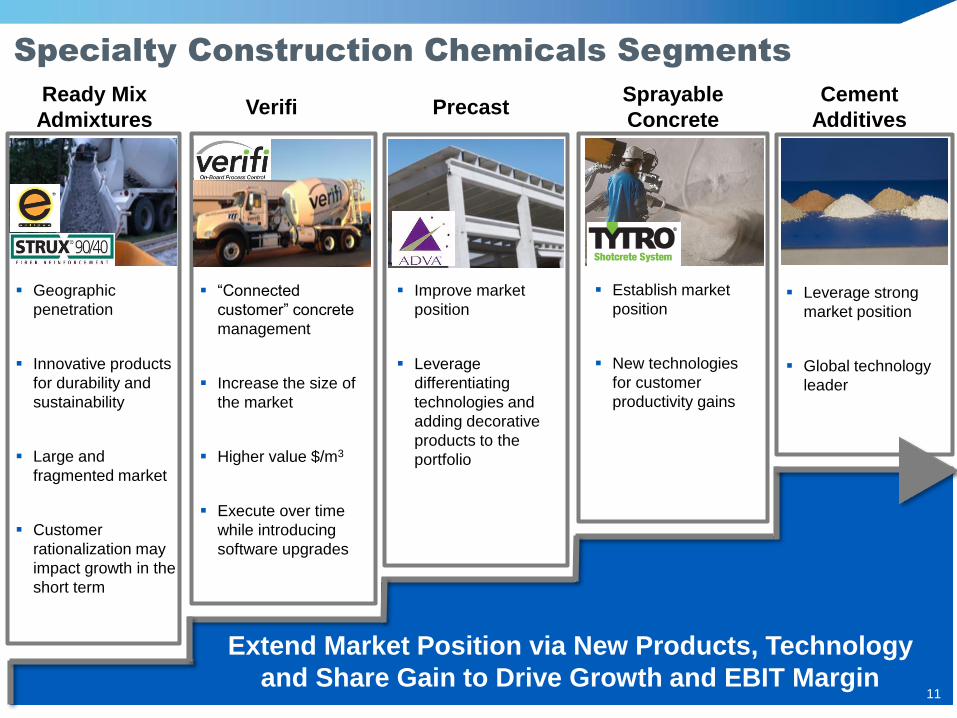
Specialty Construction Chemicals Segments
Cement
AdditivesPrecast
Sprayable
ConcreteVerifi
Leverage strong
market position
Global technology
leader
Geographic
penetration
Innovative products
for durability and
sustainability
Large and
fragmented market
Customer
rationalization may
impact growth in the
short term
“Connected
customer” concrete
management
Increase the size of
the market
Higher value $/m3
Execute over time
while introducing
software upgrades
Ready Mix
Admixtures
Extend Market Position via New Products, Technology
and Share Gain to Drive Growth and EBIT Margin
Improve market
position
Leverage
differentiating
technologies and
adding decorative
products to the
portfolio
Establish market
position
New technologies
for customer
productivity gains
11
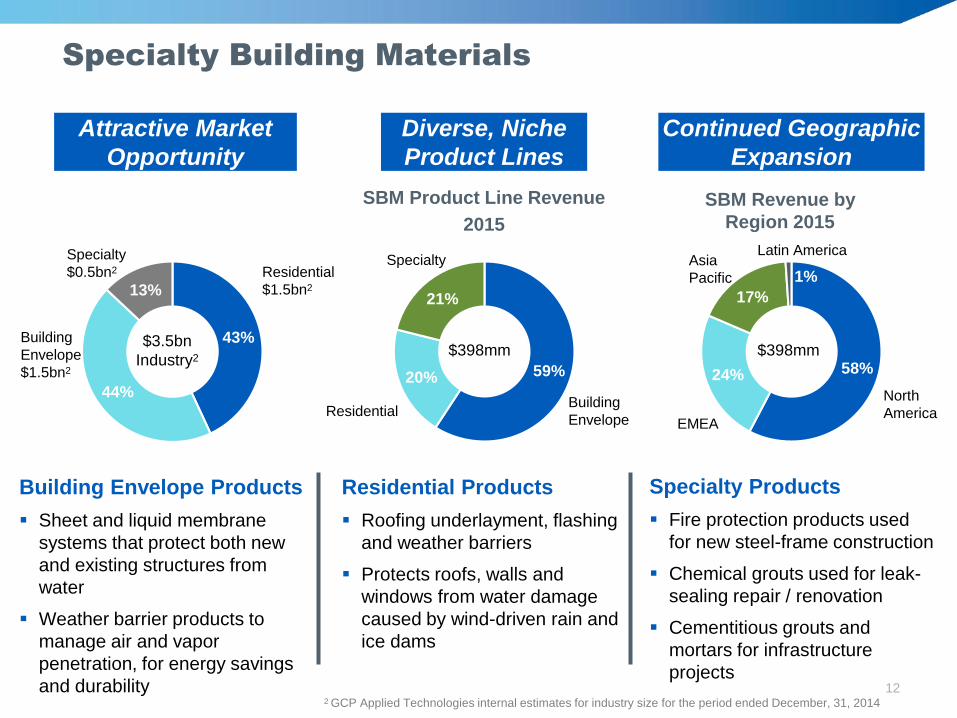
Specialty Building Materials
Continued Geographic
Expansion
12
59%20%
21%
58%24%
17%
1%Specialty
ResidentialBuilding
Envelope
Asia
Pacific
Latin America
EMEA
North
America
$398mm$398mm
Building Envelope Products
Sheet and liquid membrane
systems that protect both new
and existing structures from
water
Weather barrier products to
manage air and vapor
penetration, for energy savings
and durability
Residential Products
Roofing underlayment, flashing
and weather barriers
Protects roofs, walls and
windows from water damage
caused by wind-driven rain and
ice dams
Specialty Products
Fire protection products used
for new steel-frame construction
Chemical grouts used for leak-
sealing repair / renovation
Cementitious grouts and
mortars for infrastructure
projects
Diverse, Niche
Product Lines
SBM Revenue by
Region 2015
SBM Product Line Revenue
2015
43%
44%
13%
Building
Envelope
$1.5bn2
Specialty
$0.5bn2 Residential
$1.5bn2
$3.5bn
Industry2
Attractive Market
Opportunity
2 GCP Applied Technologies internal estimates for industry size for the period ended December, 31, 2014
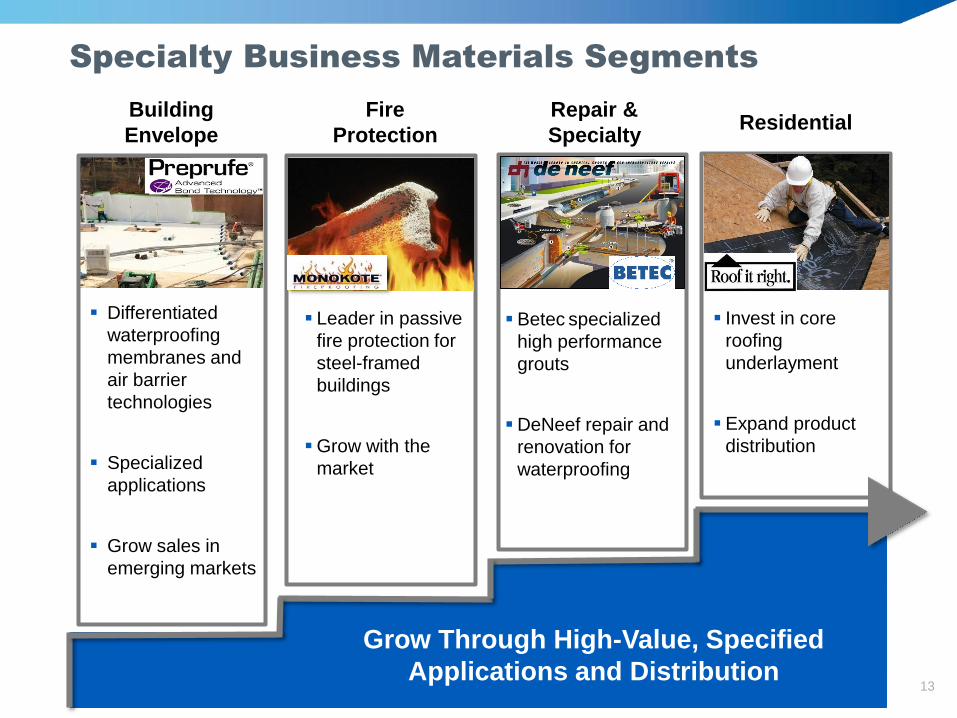
Specialty Business Materials Segments
13
Building
Envelope
Fire
Protection
Repair &
Specialty
Differentiated
waterproofing
membranes and
air barrier
technologies
Specialized
applications
Grow sales in
emerging markets
Leader in passive
fire protection for
steel-framed
buildings
Grow with the
market
Betec specialized
high performance
grouts
DeNeef repair and
renovation for
waterproofing
Residential
Invest in core
roofing
underlayment
Expand product
distribution
Grow Through High-Value, Specified
Applications and Distribution
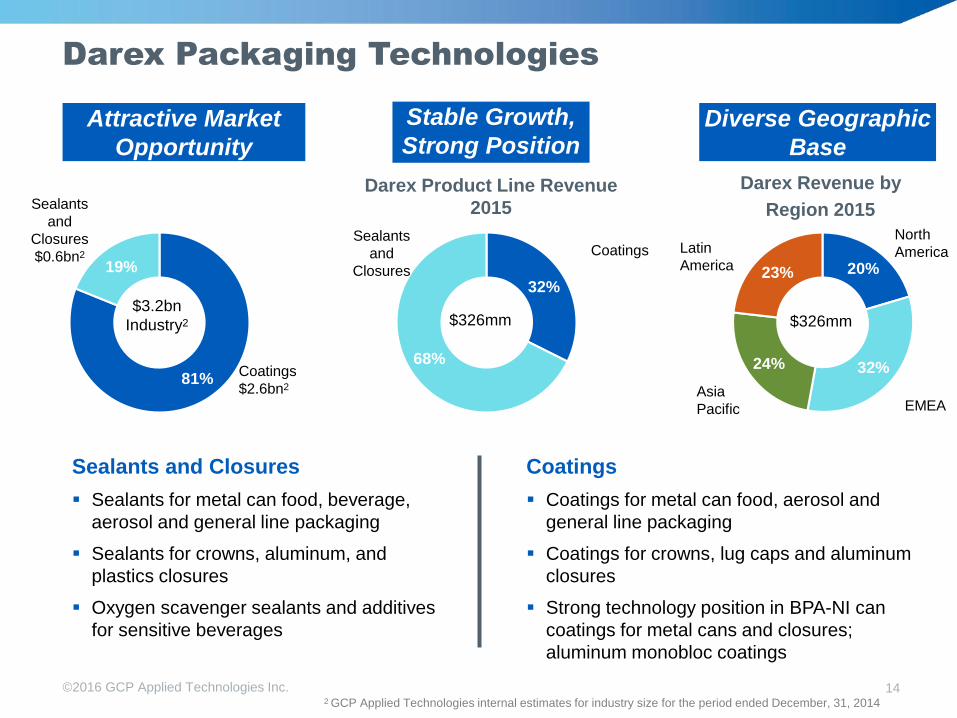
Darex Packaging Technologies
Darex Revenue by
Region 2015
Darex Product Line Revenue
2015
Stable Growth,
Strong PositionDiverse Geographic
Base
©2016 GCP Applied Technologies Inc. 14
32%
68%
20%
32%24%
23%
CoatingsSealants
and
Closures
Asia
Pacific
Latin
America
EMEA
North
America
$326mm $326mm
Sealants and Closures
Sealants for metal can food, beverage,
aerosol and general line packaging
Sealants for crowns, aluminum, and
plastics closures
Oxygen scavenger sealants and additives
for sensitive beverages
Coatings
Coatings for metal can food, aerosol and
general line packaging
Coatings for crowns, lug caps and aluminum
closures
Strong technology position in BPA-NI can
coatings for metal cans and closures;
aluminum monobloc coatings
81%
19%
Sealants
and
Closures
$0.6bn2
Coatings
$2.6bn2
$3.2bn
Industry2
Attractive Market
Opportunity
2 GCP Applied Technologies internal estimates for industry size for the period ended December, 31, 2014
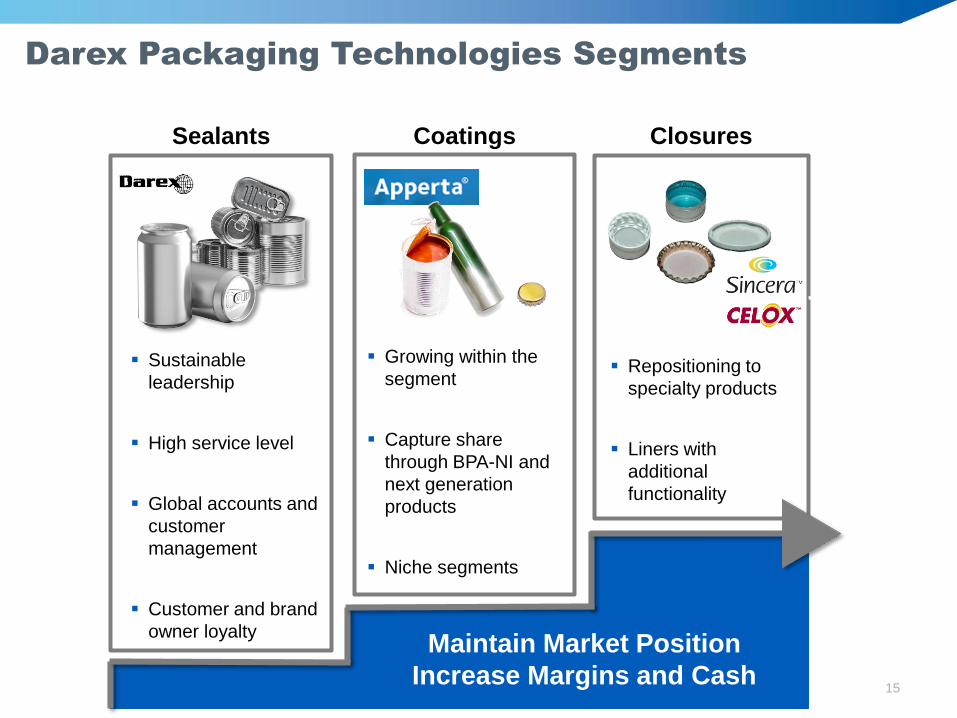
Darex Packaging Technologies Segments
15
Sealants Coatings Closures
Sustainable
leadership
High service level
Global accounts and
customer
management
Customer and brand
owner loyalty
Repositioning to
specialty products
Liners with
additional
functionality
Growing within the
segment
Capture share
through BPA-NI and
next generation
products
Niche segments
Maintain Market Position
Increase Margins and Cash
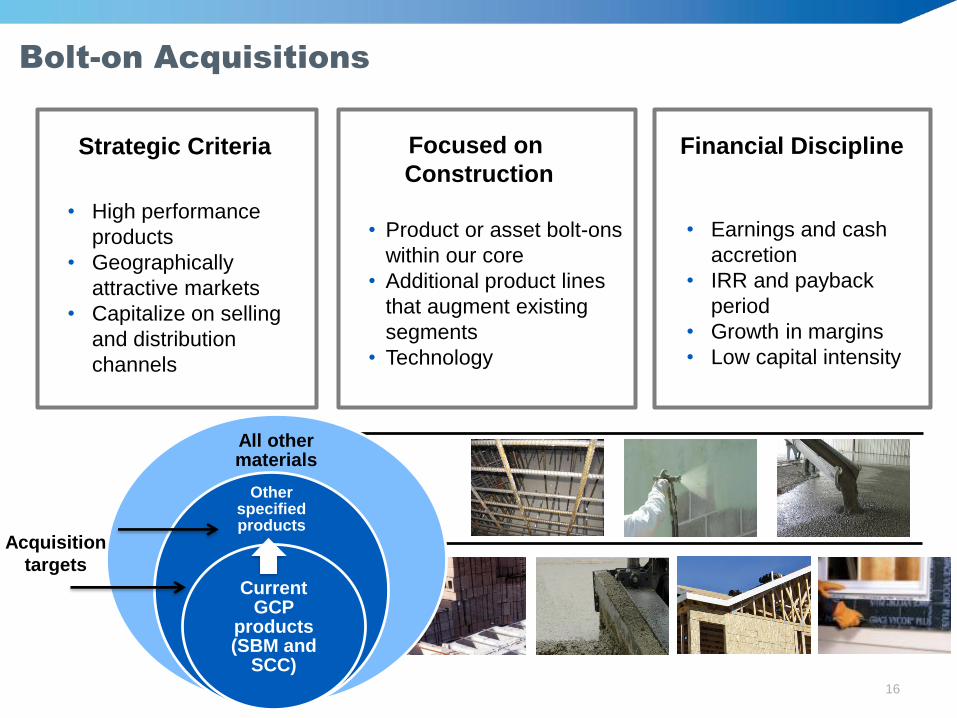
16
Strategic Criteria
• High performance
products
• Geographically
attractive markets
• Capitalize on selling
and distribution
channels
Bolt-on Acquisitions
All other materials
Other specified products
Current GCP
products (SBM and
SCC)
Acquisition
targets
Financial Discipline
• Earnings and cash
accretion
• IRR and payback
period
• Growth in margins
• Low capital intensity
Focused on
Construction
• Product or asset bolt-ons
within our core
• Additional product lines
that augment existing
segments
• Technology
©2016 GCP Applied Technologies Inc. 17
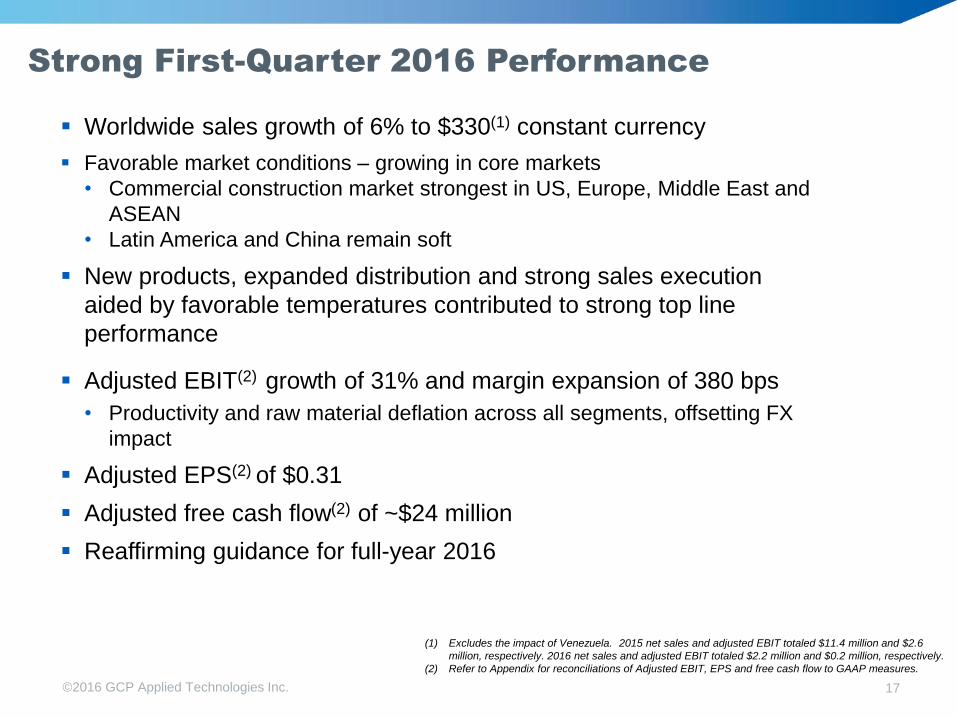
Worldwide sales growth of 6% to $330(1) constant currency
Favorable market conditions – growing in core markets
• Commercial construction market strongest in US, Europe, Middle East and
ASEAN
• Latin America and China remain soft
New products, expanded distribution and strong sales execution
aided by favorable temperatures contributed to strong top line
performance
Adjusted EBIT(2) growth of 31% and margin expansion of 380 bps
• Productivity and raw material deflation across all segments, offsetting FX
impact
Adjusted EPS(2) of $0.31
Adjusted free cash flow(2) of ~$24 million
Reaffirming guidance for full-year 2016
(1) Excludes the impact of Venezuela. 2015 net sales and adjusted EBIT totaled $11.4 million and $2.6
million, respectively. 2016 net sales and adjusted EBIT totaled $2.2 million and $0.2 million, respectively.
(2) Refer to Appendix for reconciliations of Adjusted EBIT, EPS and free cash flow to GAAP measures.
Strong First-Quarter 2016 Performance
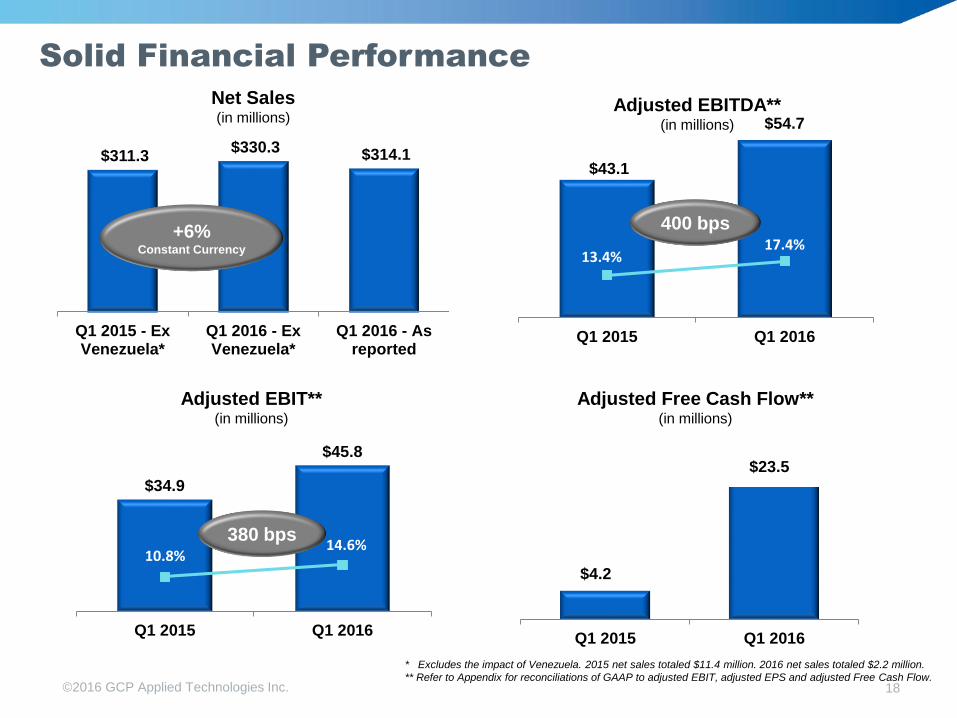
©2016 GCP Applied Technologies Inc. 18
$34.9
$45.8
10.8%14.6%
Q1 2015 Q1 2016
Adjusted EBIT**(in millions)
380 bps
Q1 2015 Q1 2016
Adjusted Free Cash Flow**(in millions)
$311.3 $330.3 $314.1
Q1 2015 - ExVenezuela*
Q1 2016 - ExVenezuela*
Q1 2016 - Asreported
Net Sales (in millions)
$43.1
$54.7
13.4%17.4%
Q1 2015 Q1 2016
Adjusted EBITDA** (in millions)
400 bps
Solid Financial Performance
$23.5
$4.2
+6% Constant Currency
* Excludes the impact of Venezuela. 2015 net sales totaled $11.4 million. 2016 net sales totaled $2.2 million.
** Refer to Appendix for reconciliations of GAAP to adjusted EBIT, adjusted EPS and adjusted Free Cash Flow.
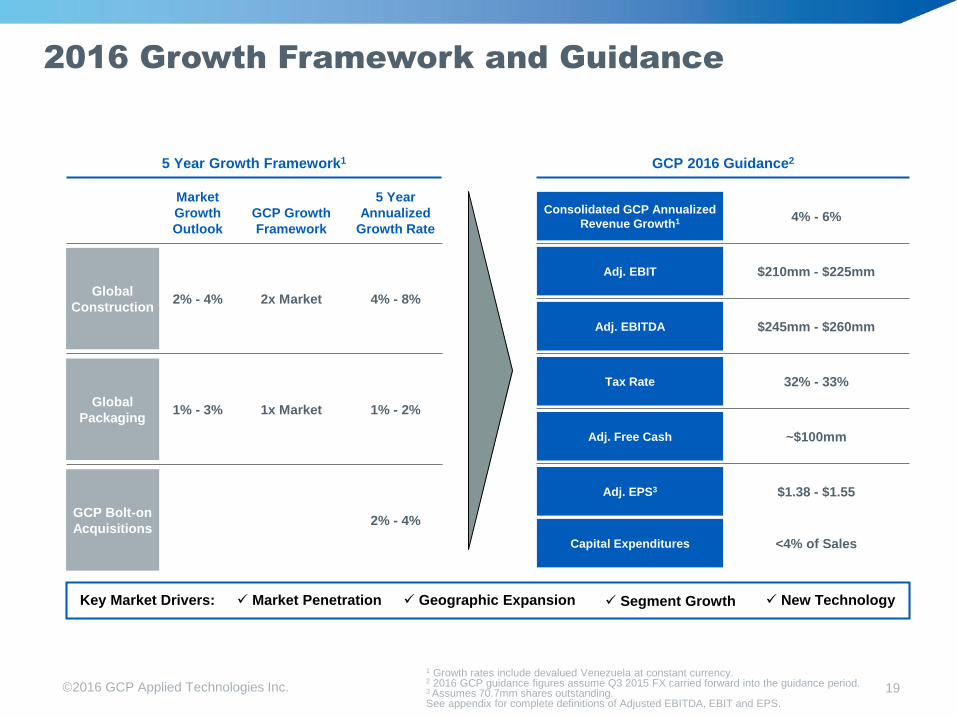
©2016 GCP Applied Technologies Inc. 19
5 Year Growth Framework1
Market
Growth
Outlook
GCP Growth
Framework
5 Year
Annualized
Growth Rate
Global
Construction2% - 4% 2x Market 4% - 8%
Global
Packaging1% - 3% 1x Market 1% - 2%
GCP Bolt-on
Acquisitions2% - 4%
GCP 2016 Guidance2
Market PenetrationKey Market Drivers: Segment Growth New Technology Geographic Expansion
Consolidated GCP Annualized
Revenue Growth1 4% - 6%
Adj. EBIT $210mm - $225mm
Adj. EBITDA $245mm - $260mm
Tax Rate 32% - 33%
Adj. Free Cash ~$100mm
Adj. EPS3 $1.38 - $1.55
Capital Expenditures <4% of Sales
2016 Growth Framework and Guidance
1 Growth rates include devalued Venezuela at constant currency.2 2016 GCP guidance figures assume Q3 2015 FX carried forward into the guidance period. 3 Assumes 70.7mm shares outstanding.See appendix for complete definitions of Adjusted EBITDA, EBIT and EPS.
Investment Highlights
©2016 GCP Applied Technologies Inc. 20
Successfully launched as a $1.4B revenue public company on February 3
Leading global provider of high-value products and technologies in the
construction and packaging industries
Capitalizing on formulation, selling capability and technical service
expertise across diverse geographies
Low capital intensity business serving a global customer base
Positioned for continued growth and focused on building shareholder value

Appendix
Additional Information
22
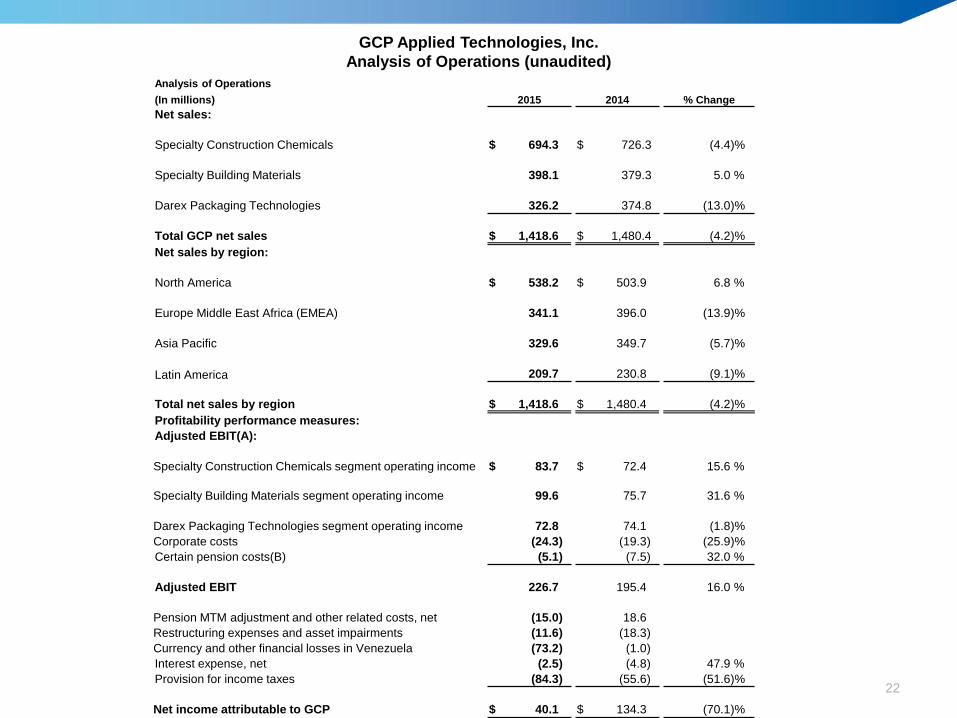
GCP Applied Technologies, Inc.
Analysis of Operations (unaudited)
Analysis of Operations
(In millions) 2015 2014 % Change
Net sales:
Specialty Construction Chemicals $ 694.3 $ 726.3 (4.4)%
Specialty Building Materials 398.1 379.3 5.0 %
Darex Packaging Technologies 326.2 374.8 (13.0)%
Total GCP net sales $ 1,418.6 $ 1,480.4 (4.2)%
Net sales by region:
North America $ 538.2 $ 503.9 6.8 %
Europe Middle East Africa (EMEA) 341.1 396.0 (13.9)%
Asia Pacific 329.6 349.7 (5.7)%
Latin America 209.7 230.8 (9.1)%
Total net sales by region $ 1,418.6 $ 1,480.4 (4.2)%
Profitability performance measures:
Adjusted EBIT(A):
Specialty Construction Chemicals segment operating income $ 83.7 $ 72.4 15.6 %
Specialty Building Materials segment operating income 99.6 75.7 31.6 %
Darex Packaging Technologies segment operating income 72.8 74.1 (1.8)%
Corporate costs (24.3) (19.3) (25.9)%
Certain pension costs(B) (5.1) (7.5) 32.0 %
Adjusted EBIT 226.7 195.4 16.0 %
Pension MTM adjustment and other related costs, net (15.0) 18.6
Restructuring expenses and asset impairments (11.6) (18.3)
Currency and other financial losses in Venezuela (73.2) (1.0)
Interest expense, net (2.5) (4.8) 47.9 %
Provision for income taxes (84.3) (55.6) (51.6)%
Net income attributable to GCP $ 40.1 $ 134.3 (70.1)%
23
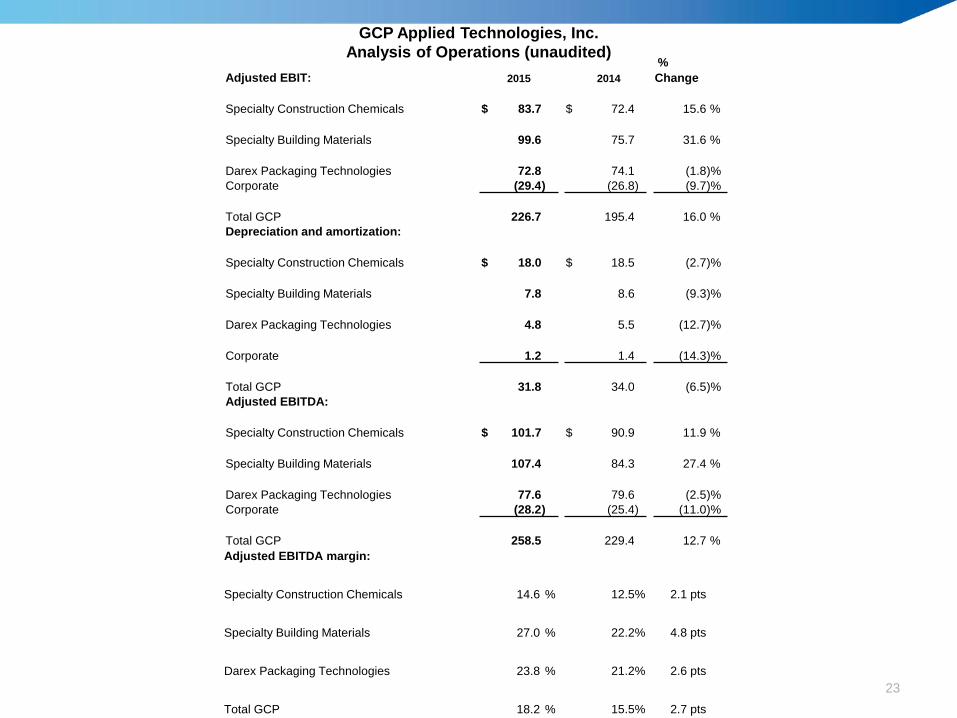
GCP Applied Technologies, Inc.
Analysis of Operations (unaudited)
Adjusted EBIT: 2015 2014
%
Change
Specialty Construction Chemicals $ 83.7 $ 72.4 15.6 %
Specialty Building Materials 99.6 75.7 31.6 %
Darex Packaging Technologies 72.8 74.1 (1.8)%
Corporate (29.4) (26.8) (9.7)%
Total GCP 226.7 195.4 16.0 %
Depreciation and amortization:
Specialty Construction Chemicals $ 18.0 $ 18.5 (2.7)%
Specialty Building Materials 7.8 8.6 (9.3)%
Darex Packaging Technologies 4.8 5.5 (12.7)%
Corporate 1.2 1.4 (14.3)%
Total GCP 31.8 34.0 (6.5)%
Adjusted EBITDA:
Specialty Construction Chemicals $ 101.7 $ 90.9 11.9 %
Specialty Building Materials 107.4 84.3 27.4 %
Darex Packaging Technologies 77.6 79.6 (2.5)%
Corporate (28.2) (25.4) (11.0)%
Total GCP 258.5 229.4 12.7 %
Adjusted EBITDA margin:
Specialty Construction Chemicals 14.6 % 12.5% 2.1 pts
Specialty Building Materials 27.0 % 22.2% 4.8 pts
Darex Packaging Technologies 23.8 % 21.2% 2.6 pts
Total GCP 18.2 % 15.5% 2.7 pts
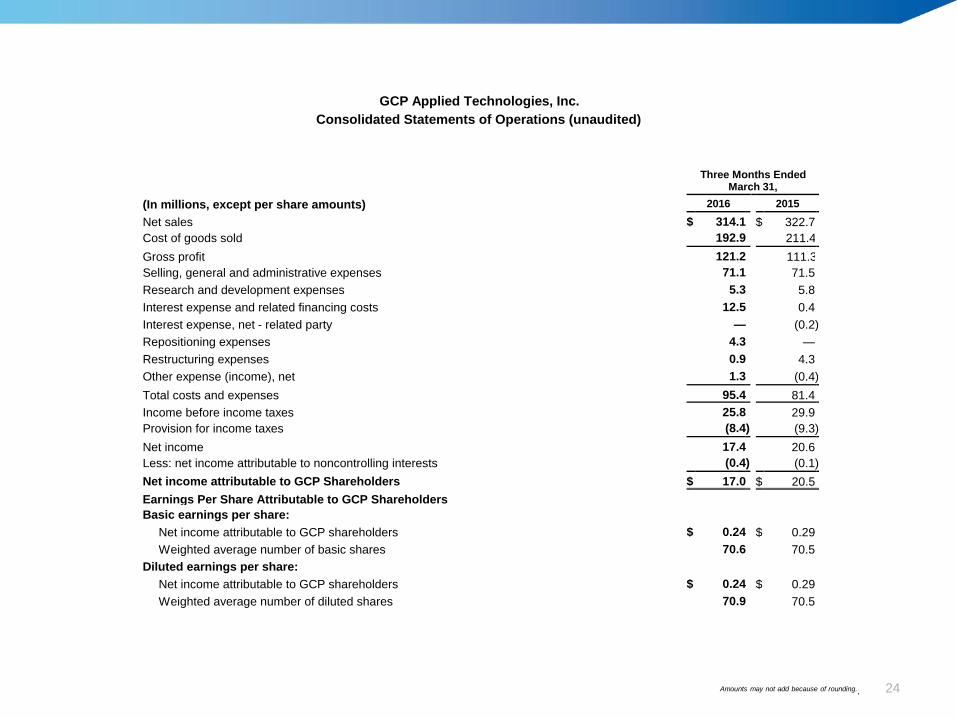
GCP Applied Technologies, Inc.
Consolidated Statements of Operations (unaudited)
Three Months Ended
March 31,
(In millions, except per share amounts) 2016 2015
Net sales $ 314.1 $ 322.7
Cost of goods sold 192.9 211.4
Gross profit 121.2 111.3
Selling, general and administrative expenses 71.1 71.5
Research and development expenses 5.3 5.8
Interest expense and related financing costs 12.5 0.4
Interest expense, net - related party — (0.2 )
Repositioning expenses 4.3 —
Restructuring expenses 0.9 4.3
Other expense (income), net 1.3 (0.4 )
Total costs and expenses 95.4 81.4
Income before income taxes 25.8 29.9
Provision for income taxes (8.4 ) (9.3 )
Net income 17.4 20.6
Less: net income attributable to noncontrolling interests (0.4 ) (0.1 )
Net income attributable to GCP Shareholders $ 17.0 $ 20.5
Earnings Per Share Attributable to GCP Shareholders Basic earnings per share:
Net income attributable to GCP shareholders $ 0.24 $ 0.29
Weighted average number of basic shares 70.6 70.5
Diluted earnings per share:
Net income attributable to GCP shareholders $ 0.24 $ 0.29
Weighted average number of diluted shares 70.9 70.5
Amounts may not add because of rounding.. 24
(A) See non-GAAP measure definitions.
Amounts may not add due to rounding.
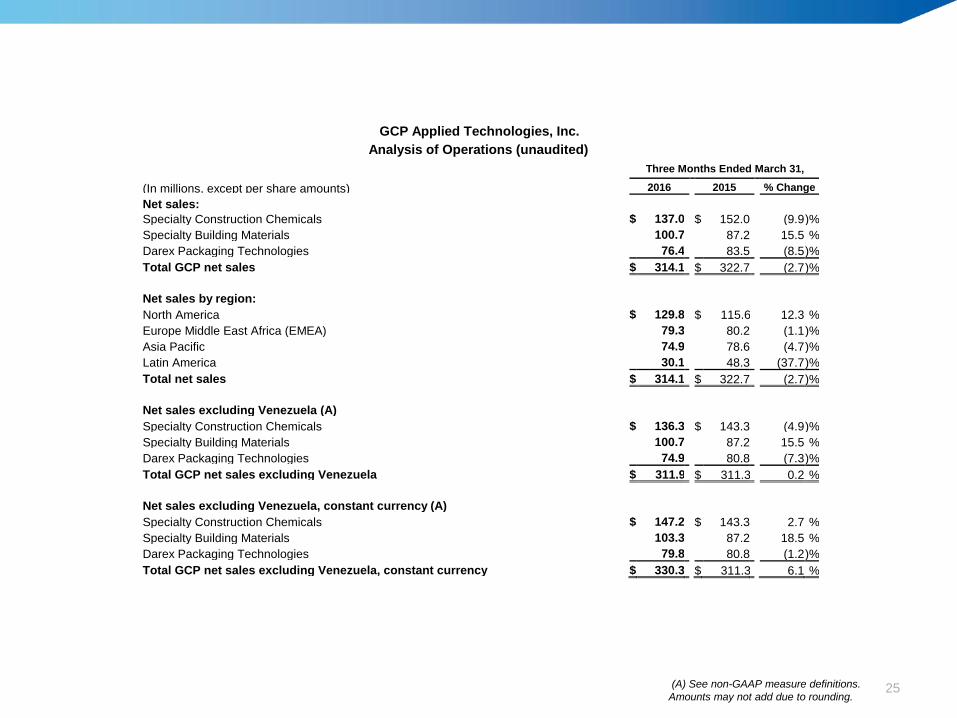
GCP Applied Technologies, Inc.
Analysis of Operations (unaudited)
Three Months Ended March 31,
(In millions, except per share amounts) 2016 2015 % Change
Net sales: Specialty Construction Chemicals $ 137.0 $ 152.0 (9.9 )%
Specialty Building Materials 100.7 87.2 15.5 %
Darex Packaging Technologies 76.4 83.5 (8.5 )%
Total GCP net sales $ 314.1 $ 322.7 (2.7 )%
Net sales by region: North America $ 129.8 $ 115.6 12.3 %
Europe Middle East Africa (EMEA) 79.3 80.2 (1.1 )%
Asia Pacific 74.9 78.6 (4.7 )%
Latin America 30.1 48.3 (37.7 )%
Total net sales $ 314.1 $ 322.7 (2.7 )%
Net sales excluding Venezuela (A) Specialty Construction Chemicals $ 136.3 $ 143.3 (4.9 )%
Specialty Building Materials 100.7 87.2 15.5 %
Darex Packaging Technologies 74.9 80.8 (7.3 )%
Total GCP net sales excluding Venezuela $ 311.9 $ 311.3 0.2 %
Net sales excluding Venezuela, constant currency (A) Specialty Construction Chemicals $ 147.2 $ 143.3 2.7 %
Specialty Building Materials 103.3 87.2 18.5 %
Darex Packaging Technologies 79.8 80.8 (1.2 )%
Total GCP net sales excluding Venezuela, constant currency $ 330.3 $ 311.3 6.1 %
25
(A); (B) See non-GAAP measure definitions.
Amounts may not add due to rounding
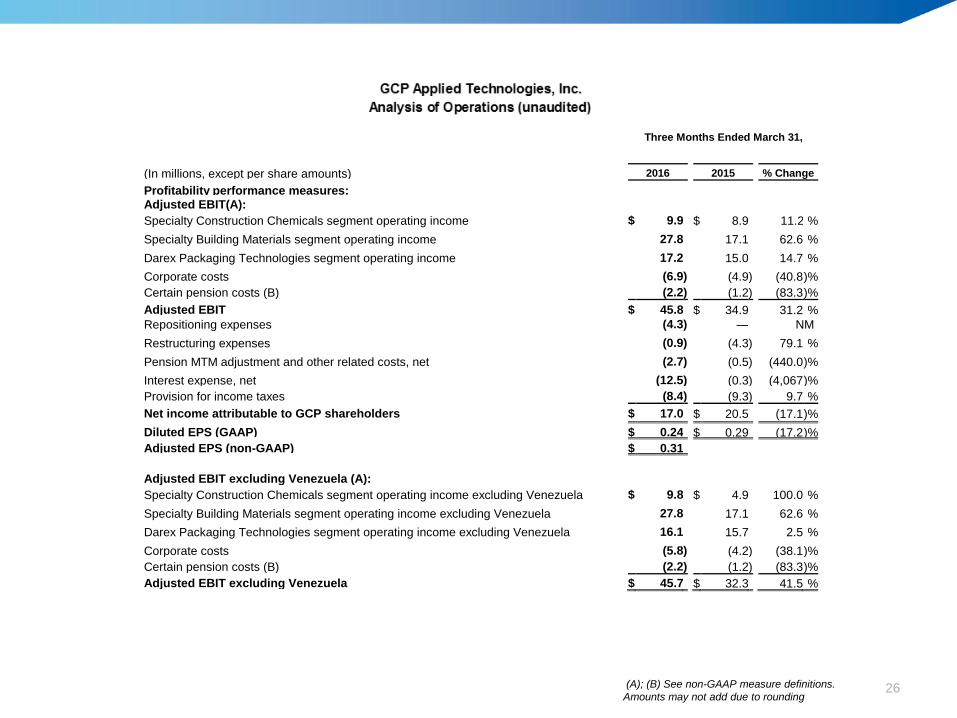
Three Months Ended March 31,
(In millions, except per share amounts) 2016 2015 % Change
Profitability performance measures: Adjusted EBIT(A): Specialty Construction Chemicals segment operating income $ 9.9 $ 8.9 11.2 %
Specialty Building Materials segment operating income 27.8 17.1 62.6 %
Darex Packaging Technologies segment operating income 17.2 15.0 14.7 %
Corporate costs (6.9 ) (4.9 ) (40.8 )%
Certain pension costs (B) (2.2 ) (1.2 ) (83.3 )%
Adjusted EBIT $ 45.8 $ 34.9 31.2 %
Repositioning expenses (4.3 ) — NM
Restructuring expenses (0.9 ) (4.3 ) 79.1 %
Pension MTM adjustment and other related costs, net (2.7 ) (0.5 ) (440.0 )%
Interest expense, net (12.5 ) (0.3 ) (4,067 )%
Provision for income taxes (8.4 ) (9.3 ) 9.7 %
Net income attributable to GCP shareholders $ 17.0 $ 20.5 (17.1 )%
Diluted EPS (GAAP) $ 0.24 $ 0.29 (17.2 )%
Adjusted EPS (non-GAAP) $ 0.31
Adjusted EBIT excluding Venezuela (A): Specialty Construction Chemicals segment operating income excluding Venezuela $ 9.8 $ 4.9 100.0 %
Specialty Building Materials segment operating income excluding Venezuela 27.8 17.1 62.6 %
Darex Packaging Technologies segment operating income excluding Venezuela 16.1 15.7 2.5 %
Corporate costs (5.8 ) (4.2 ) (38.1 )%
Certain pension costs (B) (2.2 ) (1.2 ) (83.3 )%
Adjusted EBIT excluding Venezuela $ 45.7 $ 32.3 41.5 %
26
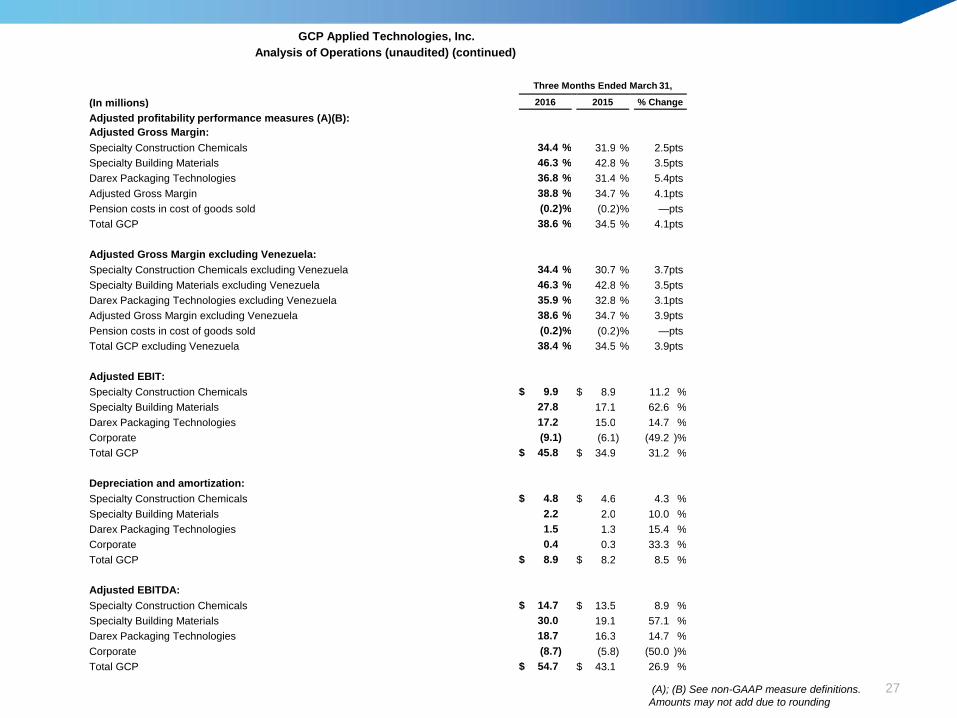
GCP Applied Technologies, Inc.
Analysis of Operations (unaudited) (continued)
Three Months Ended March 31,
(In millions) 2016 2015 % Change
Adjusted profitability performance measures (A)(B):
Adjusted Gross Margin:
Specialty Construction Chemicals 34.4 % 31.9 % 2.5 pts
Specialty Building Materials 46.3 % 42.8 % 3.5 pts
Darex Packaging Technologies 36.8 % 31.4 % 5.4 pts
Adjusted Gross Margin 38.8 % 34.7 % 4.1 pts
Pension costs in cost of goods sold (0.2 )% (0.2 )% — pts
Total GCP 38.6 % 34.5 % 4.1 pts
Adjusted Gross Margin excluding Venezuela:
Specialty Construction Chemicals excluding Venezuela 34.4 % 30.7 % 3.7 pts
Specialty Building Materials excluding Venezuela 46.3 % 42.8 % 3.5 pts
Darex Packaging Technologies excluding Venezuela 35.9 % 32.8 % 3.1 pts
Adjusted Gross Margin excluding Venezuela 38.6 % 34.7 % 3.9 pts
Pension costs in cost of goods sold (0.2 )% (0.2 )% — pts
Total GCP excluding Venezuela 38.4 % 34.5 % 3.9 pts
Adjusted EBIT:
Specialty Construction Chemicals $ 9.9 $ 8.9 11.2 %
Specialty Building Materials 27.8 17.1 62.6 %
Darex Packaging Technologies 17.2 15.0 14.7 %
Corporate (9.1 ) (6.1 ) (49.2 )%
Total GCP $ 45.8 $ 34.9 31.2 %
Depreciation and amortization:
Specialty Construction Chemicals $ 4.8 $ 4.6 4.3 %
Specialty Building Materials 2.2 2.0 10.0 %
Darex Packaging Technologies 1.5 1.3 15.4 %
Corporate 0.4 0.3 33.3 %
Total GCP $ 8.9 $ 8.2 8.5 %
Adjusted EBITDA:
Specialty Construction Chemicals $ 14.7 $ 13.5 8.9 %
Specialty Building Materials 30.0 19.1 57.1 %
Darex Packaging Technologies 18.7 16.3 14.7 %
Corporate (8.7 ) (5.8 ) (50.0 )%
Total GCP $ 54.7 $ 43.1 26.9 %
(A); (B) See non-GAAP measure definitions.
Amounts may not add due to rounding
27
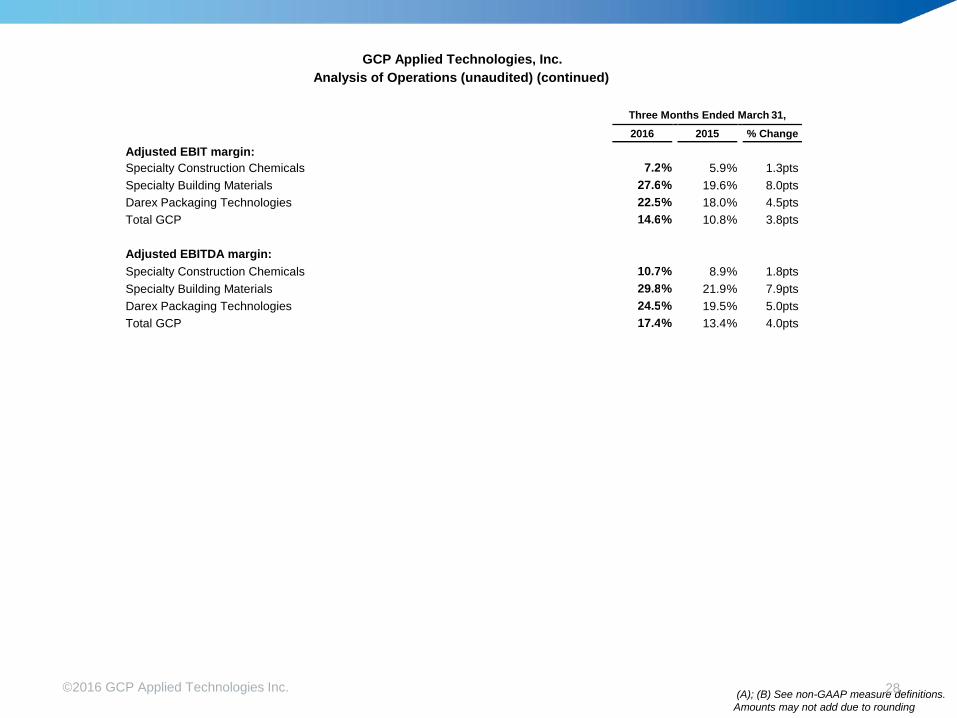
GCP Applied Technologies, Inc.
Analysis of Operations (unaudited) (continued)
Three Months Ended March 31,
2016 2015 % Change
Adjusted EBIT margin: Specialty Construction Chemicals 7.2 % 5.9 % 1.3 pts
Specialty Building Materials 27.6 % 19.6 % 8.0 pts
Darex Packaging Technologies 22.5 % 18.0 % 4.5 pts
Total GCP 14.6 % 10.8 % 3.8 pts
Adjusted EBITDA margin:
Specialty Construction Chemicals 10.7 % 8.9 % 1.8 pts
Specialty Building Materials 29.8 % 21.9 % 7.9 pts
Darex Packaging Technologies 24.5 % 19.5 % 5.0 pts
Total GCP 17.4 % 13.4 % 4.0 pts
(A); (B) See non-GAAP measure definitions.
Amounts may not add due to rounding
©2016 GCP Applied Technologies Inc. 28
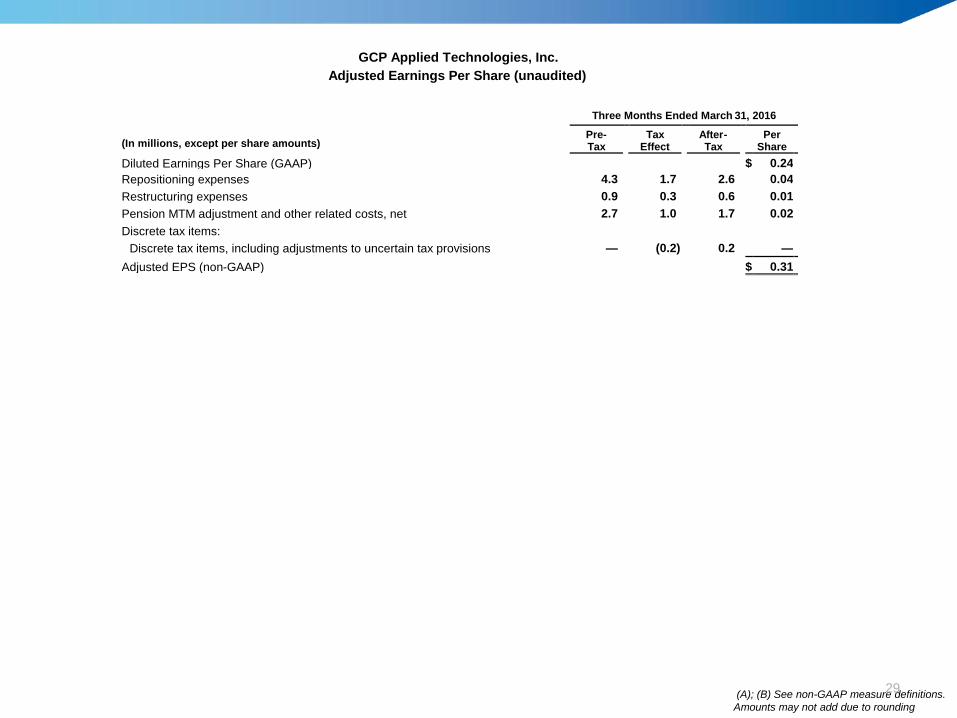
GCP Applied Technologies, Inc.
Adjusted Earnings Per Share (unaudited)
Three Months Ended March 31, 2016
(In millions, except per share amounts) Pre- Tax
Tax Effect
After- Tax
Per Share
Diluted Earnings Per Share (GAAP) $ 0.24
Repositioning expenses 4.3 1.7 2.6 0.04
Restructuring expenses 0.9 0.3 0.6 0.01
Pension MTM adjustment and other related costs, net 2.7 1.0 1.7 0.02
Discrete tax items:
Discrete tax items, including adjustments to uncertain tax provisions — (0.2 ) 0.2 —
Adjusted EPS (non-GAAP) $ 0.31
(A); (B) See non-GAAP measure definitions.
Amounts may not add due to rounding
29
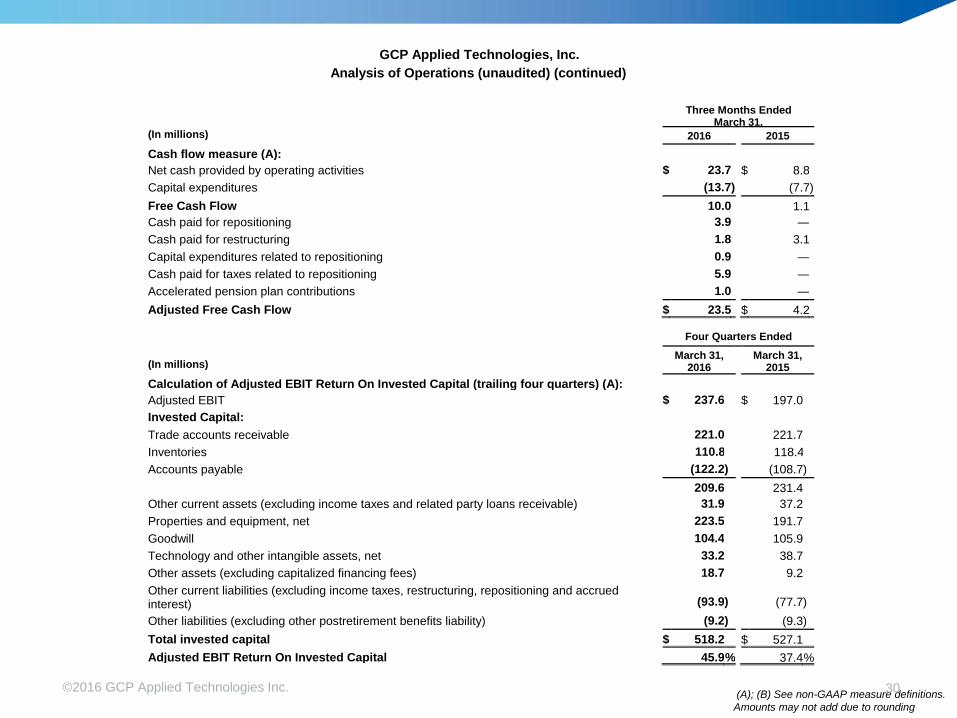
GCP Applied Technologies, Inc.
Analysis of Operations (unaudited) (continued)
(In millions)
Three Months Ended March 31,
2016 2015
Cash flow measure (A):
Net cash provided by operating activities $ 23.7 $ 8.8
Capital expenditures (13.7 ) (7.7 )
Free Cash Flow 10.0 1.1
Cash paid for repositioning 3.9 —
Cash paid for restructuring 1.8 3.1
Capital expenditures related to repositioning 0.9 —
Cash paid for taxes related to repositioning 5.9 —
Accelerated pension plan contributions 1.0 —
Adjusted Free Cash Flow $ 23.5 $ 4.2
(In millions)
Four Quarters Ended
March 31, 2016
March 31, 2015
Calculation of Adjusted EBIT Return On Invested Capital (trailing four quarters) (A):
Adjusted EBIT $ 237.6 $ 197.0
Invested Capital:
Trade accounts receivable 221.0 221.7
Inventories 110.8 118.4
Accounts payable (122.2 ) (108.7 )
209.6 231.4
Other current assets (excluding income taxes and related party loans receivable) 31.9 37.2
Properties and equipment, net 223.5 191.7
Goodwill 104.4 105.9
Technology and other intangible assets, net 33.2 38.7
Other assets (excluding capitalized financing fees) 18.7 9.2
Other current liabilities (excluding income taxes, restructuring, repositioning and accrued interest) (93.9 ) (77.7 )
Other liabilities (excluding other postretirement benefits liability) (9.2 ) (9.3 )
Total invested capital $ 518.2 $ 527.1
Adjusted EBIT Return On Invested Capital 45.9 % 37.4 %
(A); (B) See non-GAAP measure definitions.
Amounts may not add due to rounding
©2016 GCP Applied Technologies Inc. 30
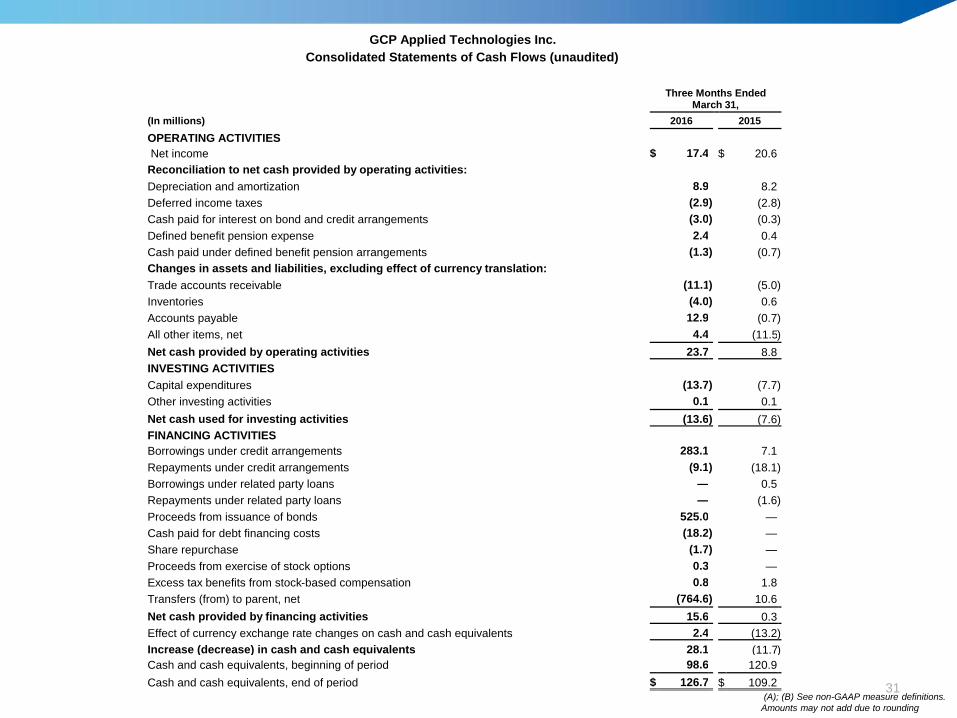
GCP Applied Technologies Inc.
Consolidated Statements of Cash Flows (unaudited)
Three Months Ended
March 31,
(In millions) 2016 2015
OPERATING ACTIVITIES Net income $ 17.4 $ 20.6
Reconciliation to net cash provided by operating activities:
Depreciation and amortization 8.9 8.2
Deferred income taxes (2.9 ) (2.8 )
Cash paid for interest on bond and credit arrangements (3.0 ) (0.3 )
Defined benefit pension expense 2.4 0.4
Cash paid under defined benefit pension arrangements (1.3 ) (0.7 )
Changes in assets and liabilities, excluding effect of currency translation:
Trade accounts receivable (11.1 ) (5.0 )
Inventories (4.0 ) 0.6
Accounts payable 12.9 (0.7 )
All other items, net 4.4 (11.5 )
Net cash provided by operating activities 23.7 8.8
INVESTING ACTIVITIES
Capital expenditures (13.7 ) (7.7 )
Other investing activities 0.1 0.1
Net cash used for investing activities (13.6 ) (7.6 )
FINANCING ACTIVITIES Borrowings under credit arrangements 283.1 7.1
Repayments under credit arrangements (9.1 ) (18.1 )
Borrowings under related party loans — 0.5
Repayments under related party loans — (1.6 )
Proceeds from issuance of bonds 525.0 —
Cash paid for debt financing costs (18.2 ) —
Share repurchase (1.7 ) —
Proceeds from exercise of stock options 0.3 —
Excess tax benefits from stock-based compensation 0.8 1.8
Transfers (from) to parent, net (764.6 ) 10.6
Net cash provided by financing activities 15.6 0.3
Effect of currency exchange rate changes on cash and cash equivalents 2.4 (13.2 )
Increase (decrease) in cash and cash equivalents 28.1 (11.7 )
Cash and cash equivalents, beginning of period 98.6 120.9
Cash and cash equivalents, end of period $ 126.7 $ 109.2
(A); (B) See non-GAAP measure definitions.
Amounts may not add due to rounding
31
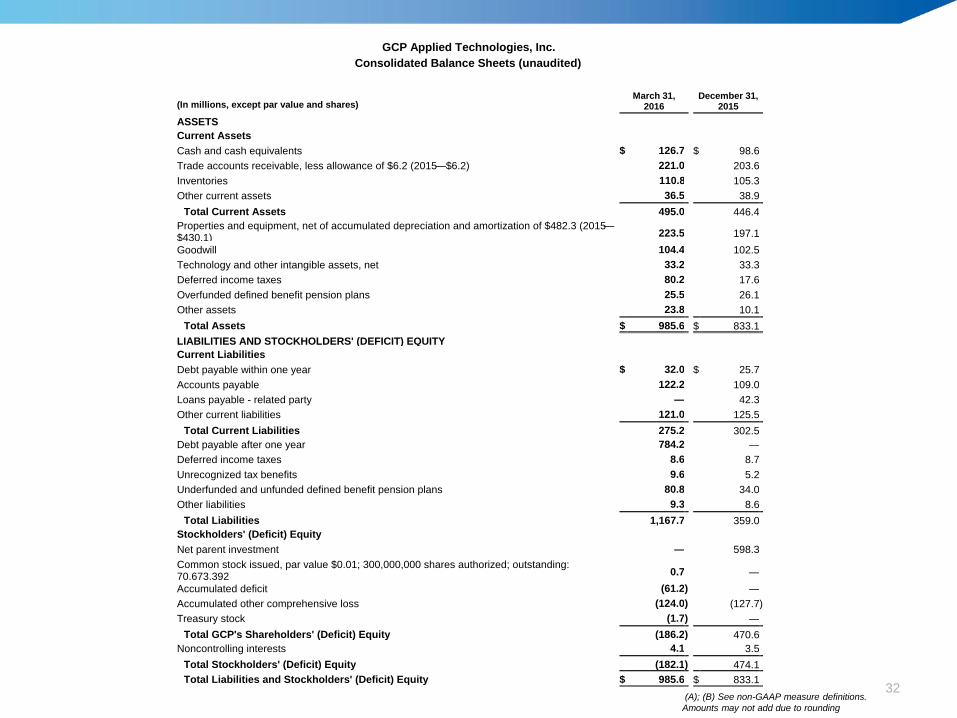
GCP Applied Technologies, Inc.
Consolidated Balance Sheets (unaudited)
(In millions, except par value and shares) March 31,
2016 December 31,
2015
ASSETS Current Assets
Cash and cash equivalents $ 126.7 $ 98.6
Trade accounts receivable, less allowance of $6.2 (2015—$6.2) 221.0 203.6
Inventories 110.8 105.3
Other current assets 36.5 38.9
Total Current Assets 495.0 446.4
Properties and equipment, net of accumulated depreciation and amortization of $482.3 (2015—$430.1) 223.5
197.1
Goodwill 104.4 102.5
Technology and other intangible assets, net 33.2 33.3
Deferred income taxes 80.2 17.6
Overfunded defined benefit pension plans 25.5 26.1
Other assets 23.8 10.1
Total Assets $ 985.6 $ 833.1
LIABILITIES AND STOCKHOLDERS' (DEFICIT) EQUITY Current Liabilities
Debt payable within one year $ 32.0 $ 25.7
Accounts payable 122.2 109.0
Loans payable - related party — 42.3
Other current liabilities 121.0 125.5
Total Current Liabilities 275.2 302.5
Debt payable after one year 784.2 —
Deferred income taxes 8.6 8.7
Unrecognized tax benefits 9.6 5.2
Underfunded and unfunded defined benefit pension plans 80.8 34.0
Other liabilities 9.3 8.6
Total Liabilities 1,167.7 359.0
Stockholders' (Deficit) Equity
Net parent investment — 598.3
Common stock issued, par value $0.01; 300,000,000 shares authorized; outstanding: 70,673,392 0.7
—
Accumulated deficit (61.2 ) —
Accumulated other comprehensive loss (124.0 ) (127.7 )
Treasury stock (1.7 ) —
Total GCP's Shareholders' (Deficit) Equity (186.2 ) 470.6
Noncontrolling interests 4.1 3.5
Total Stockholders' (Deficit) Equity (182.1 ) 474.1
Total Liabilities and Stockholders' (Deficit) Equity $ 985.6 $ 833.1
(A); (B) See non-GAAP measure definitions.
Amounts may not add due to rounding
32
GCP Applied Technologies, Inc.
Notes to the Financial Information
(A) In the above charts, GCP presents its results of operations by operating segment and for adjusted operations.
Constant currency means current period revenue in local currency translated using prior period exchange rates. GCP uses constant currency
in assessing trends in sales excluding the impact of fluctuations in foreign currency exchange rates.
Net Sales excluding Venezuela, Adjusted Gross Margin excluding Venezuela, Adjusted EBIT excluding Venezuela and Segment Operating
Income excluding Venezuela means GCP’s combined results or respective segment results excluding Venezuela. GCP uses these measures to
distinguish the operating results of its current business.
Adjusted EBIT means net income adjusted for interest income and expense, income taxes, restructuring and repositioning expenses and asset
impairments, pension costs other than service and interest costs, expected returns on plan assets, and amortization of prior service
costs/credits; gains and losses on sales of businesses, product lines, and certain other investments; and certain other unusual or infrequent
items that are not representative of underlying trends. Adjusted EBIT Margin means Adjusted EBIT divided by net sales.
Adjusted EBITDA means Adjusted EBIT adjusted for depreciation and amortization. GCP uses Adjusted EBIT and Adjusted EBITDA as
performance measures in significant business decisions.
Adjusted EPS means Diluted EPS adjusted for costs related to restructuring and repositioning expenses and related asset impairments;
pension costs other than service and interest costs, expected returns on plan assets, and amortization of prior service costs/credits; income and
expense items related to divested businesses, product lines, and certain other investments; gains and losses on sales of businesses, product
lines, and certain other investments; certain other unusual or infrequent items that are not representative of underlying trends; and certain
discrete tax items.
Adjusted Free Cash Flow means net cash provided by or used for operating activities minus capital expenditures plus cash paid for
restructuring and repositioning, taxes paid for repositioning, capital expenditures related to repositioning, accelerated payments under defined
benefit pension arrangements, and expenditures for legacy items. GCP uses Adjusted Free Cash Flow as a liquidity measure to evaluate its
ability to generate cash to support its ongoing business operations, to invest in its businesses, and to provide a return of capital to shareholders.
Adjusted Gross Margin means gross margin adjusted for pension-related costs and devaluation loss in Venezuela included in cost of goods
sold.
©2016 GCP Applied Technologies Inc. 33
Adjusted EBIT Return On Invested Capital means Adjusted EBIT (on a trailing four quarters basis) divided by the sum of net
working capital, properties and equipment and certain other assets and liabilities.
Adjusted EBIT, Adjusted EBIT excluding Venezuela, Adjusted EBITDA, Adjusted Free Cash Flow, Adjusted EPS, Adjusted Gross
Margin, Adjusted Gross Margin excluding Venezuela, and Adjusted EBIT Margin do not purport to represent income or liquidity
measures as defined under United States generally accepted accounting principles, and should not be considered as
alternatives to such measures as an indicator of GCP's performance. These measures are provided to distinguish the operating
results of GCP's current business.
(B) Certain pension costs include only ongoing costs recognized quarterly, which include service and interest costs, expected
returns on plan assets, and amortization of prior service costs/credits. Specialty Construction Chemicals, Specialty Building
Materials, and Darex Packaging Technologies segment operating income and corporate costs do not include any amounts for
pension expense. Other pension related costs including annual mark-to-market adjustments and actuarial gains and losses, and
other related costs are excluded from Adjusted EBIT. These amounts are not used by management to evaluate the performance
of GCP's businesses and significantly affect the peer-to-peer and period-to-period comparability of our financial results. Mark-to-
market adjustments and actuarial gains and losses, and other related costs relate primarily to changes in financial market values
and actuarial assumptions and are not directly related to the operation of GCP's businesses.
NM - Not Meaningful
©2016 GCP Applied Technologies Inc. 34


![GCP & Go in 2015 [GCP編]](https://img.pdfslide.us/doc/110x75/58737f5a1a28ab272d8b474d/gcp-go-in-2015-gcp.jpg)