Embed Size (px)
Citation preview

Gatwick Airport Flight Performance ReportQ3 Data 2014

Gatwick Airport Flight Performance Team Quarterly report for the period July to September 2014
ABOUT THIS REPORT
This report is produced by the Gatwick Flight Performance Team (FPT). This team is responsible for recording, investigating and responding to aircraft noise enquiries as well as monitoring airline compliance to noise mitigation measures as detailed in the UK Aeronautical Information Publication (AIP). This department also actively engages with the airlines to improve their adherence to the above noise mitigation measures and in addition manages the night-time restrictions on flying at Gatwick.
This report contains detailed data on aircraft activity at Gatwick including the adherence to the noise mitigation measures detailed in the UK AIP, a report on night flying during the quarter, and an analysis of noise complaints received during the period.
KEY MONITORING INDICATORS – 3RD QUARTER 2014
12 month averages*
Parameter Year to date Previous year 2011 2006
Track keeping performance (% on track) 98.98 98.04 97.47 98.17**
24hr CDA (% achievement) 92.58 90.93 90.49 80.79
Day/Shoulder CDA (% achievement) 92.19 92.68 90.19 79.90
Core night CDA (% achievement) 95.31 92.67 93.96 89.60
1000ft Infringements (No.) 0 0 3 11
1000ft Infringements (No. below 900ft) 0 0 1 6
Departure Noise Infringements (Day) - 0 0 0 10
Departure Noise Infringements (Night/Shoulder)
- 0 0 4 2
Callers 3285 535 343 587
Noise complaints 16910 2696 2673 4791
Enquiry response performance target is 95% within 8 days (quarterly) 50.98% 97.58% KPI 95%
West/East Runway Split (%) - 68/32 68/32 67/33 68/32
* The colour indicates the most recent 12 month performance compared to 2011, with green showing improvement and red a decline in performance. ** This figure did not include deviations from prop types or those due to weather.
Introduction

Gatwick Airport Flight Performance Team Quarterly report for the period July to September 2014 1
PERFORMANCE HEADLINES
Continuous Descent Approach (CDA) performance indicators for all time periods remain green, as performance levels have continued to improve. With this level of performance Gatwick is a world class leader for this noise mitigation technique. The primary reason for the drop in CDA performance in 2012 was the main runway being out of operation most nights whilst runway resurfacing was being carried out.
It should also be noted that historically CDA performance during the winter months does decrease due to instances of inclement weather.
Track keeping performance has also improved again on the previous year’s performance, details on track keeping will follow later in this report.
As part of our continuing commitment to increase on track performance the FPT also continues to engage with the airlines directly and through the Flight Operations Performance and Safety Committee on a range of initiatives.
During this period the number of complaints has increased significantly compared to the previous twelve months. The number of individual callers to the Flight Performance Team has also increased fivefold. This increase has been caused by a number of contributing factors. As well as the publicity surrounding a potential 2nd runway at Gatwick, this year has been the busiest in the airports history, PRNAV departures has been introduced on all departure routes and a departure trial took place earlier in the year. This summer also saw the emergence of a number of new anti -airport campaign groups.
The postcode areas with the greatest number of enquiries this quarter were, Dorking, Tunbridge Wells, Billingshurst and Warnham.
AIRPORT OPERATIONS
During the quarter, there were a total of 77,407 fixed wing aircraft movements at Gatwick, an increase in traffic of about 10% compared to the same period in 2013. The direction of operation is determined by wind direction and this quarter was split 65% on the westerly runway and 35% on the easterly runway. The rolling 20 year average for the split in runway usage is approximately 68% westerly and 32% easterly.
NORTHERN RUNWAY (26R/08L) USAGE
Although Gatwick has the main runway and the ‘reserve’ or northern runway, they cannot be operated simultaneously.
The northern runway is normally only utilised during the night when maintenance on the main runway is planned. During these three months there were a total of 456 movements from the northern runway.
WOULD YOU LIKE TO KNOW MORE ABOUT AIRCRAFT NOISE OR TRACK A FLIGHT?
To track aircraft, see noise readings or make a complaint about aircraft noise at Gatwick you can visit our website: www.gatwickairport.com/noise
The website provides detailed maps on aircraft traffic around the airport as well as useful information on noise and statistics on aircraft movements. It also details the work we undertake with others in the aviation industry to try and alleviate the impact of our operations on both the local and wider community.
COMMUNITY NOISE MONITORING
In addition to fixed monitors located close to the ends of the runway there are currently mobile noise monitors deployed at sites in Lingfield, Rusper, Okewood Hill, Hever, Bidborough, Warnham and Cowden.
1
Gatwick Airport Flight Performance Team Quarterly report for the period July to September 20142
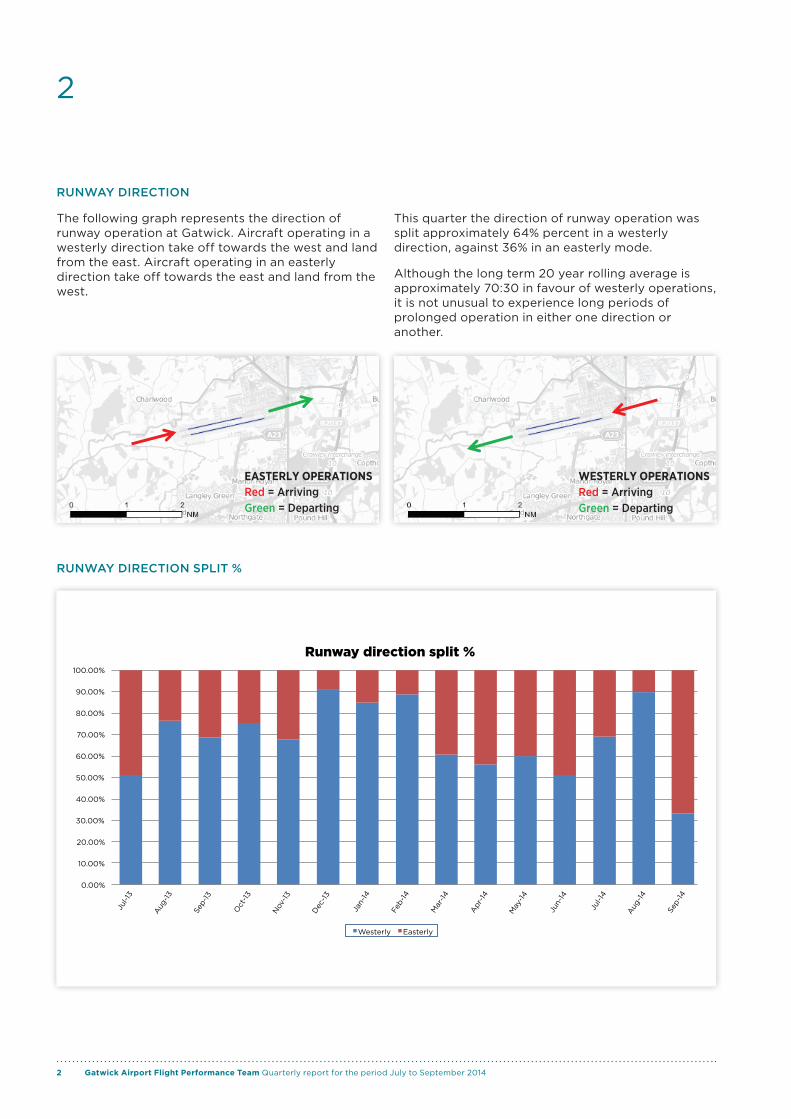
RUNWAY DIRECTION
The following graph represents the direction of runway operation at Gatwick. Aircraft operating in a westerly direction take off towards the west and land from the east. Aircraft operating in an easterly direction take off towards the east and land from the west.
This quarter the direction of runway operation was split approximately 64% percent in a westerly direction, against 36% in an easterly mode.
Although the long term 20 year rolling average is approximately 70:30 in favour of westerly operations, it is not unusual to experience long periods of prolonged operation in either one direction or another.
2
0.00%
10.00%
20.00%
30.00%
40.00%
50.00%
60.00%
70.00%
80.00%
90.00%
100.00%
Jul-1
3
Aug
-13
Sep-
13
Oct
-13
Nov
-13
Dec
-13
Jan-
14
Feb-
14
Mar
-14
Apr
-14
May
-14
Jun-
14
Jul-1
4
Aug
-14
Sep-
14
Runway direction split %
Westerly Easterly
EASTERLY OPERATIONS Red = Arriving Green = Departing
WESTERLY OPERATIONS Red = Arriving Green = Departing
RUNWAY DIRECTION SPLIT %

Gatwick Airport Flight Performance Team Quarterly report for the period July to September 2014 3
EGKK AD 2.21 (3 (1) ). After take-off the aircraft shall be operated in such a way that it is at a height of not less than 1000 ft aal (above airfield level) at 6.5 km from start of roll as measured along the departure track of the aircraft. This is to ensure departing aircraft achieve at least that climb gradient in order to reduce the impact on the ground.
3
FOR THE PURPOSES OF THIS REPORT ANY REFERENCE TO HEIGHT SHOULD BE READ AS ABOVE AIRFIELD ELEVATION UNLESS OTHERWISE STATED.
ALL DATA CONTAINED WITHIN THIS REPORT SHOULD BE CONSIDERED IN LIGHT OF THE PRECEDING TEXT AND THE COMMENTARY THAT FOLLOWS.
THE AERONAUTICAL INFORMATION PUBLICATION
An Aeronautical Information Publication (or AIP) is defined by the International Civil Aviation Organisation (ICAO) as a publication issued by or with the authority of a state and containing aeronautical information of a lasting character essential to air navigation.
It is designed to be a manual containing thorough details of regulations, procedures and other information pertinent to flying aircraft in the particular country to which it relates. It is usually issued by or on behalf of the respective civil aviation administration.
The structure and contents of AIPs are standardized by international agreement through ICAO. AIPs normally have three parts - GEN (general), ENR (en route) and AD (aerodromes).
The Gatwick Aerodrome AIP contains details regarding the noise mitigation measures in place and adherence to these is reported in this section.
ADHERENCE TO NOISE MITIGATION MEASURES AS DETAILED IN THE GATWICK AIP
Each element of this report is preceded where applicable by the relevant Aeronautical Information Publication (AIP) reference and summary text detailing the purpose of the requirement. Data is then presented on current performance.
It should be noted that Gatwick is 202ft above mean sea level and the NTK system measures height relative to Gatwick elevation and not sea level.
References in the AIP are usually above sea level (quoted as Gatwick QNH) and therefore need to be reduced by 202ft to be comparable with heights as measured by the Noise and Track keeping system. For example the requirement to join the ILS at 3000ft would equate to 2798ft in the Noise and Track keeping system.
No account is taken of the variability of heights as measured by the radar which, depending on the distance from the radar head, can be +/- 200ft from that indicated. This is obviously allowed for by NATS when managing operations.
DEPARTURES - INITIAL CLIMB PERFORMANCE
Comment:
There were no infringements of the 1000ft rule during this quarter.
Historically the summer months are typically the peak period for aircraft failing to meet the 1,000ft requirement primarily due to the warmer weather, which reduces aircraft climb performance.
1000ft INFRINGEMENT TABLE
Year Total Infringements Year Total
Infringements Year Total Infringements
2006 11 2009 22 2012 2
2007 26 2010 6 2013 0
2008 11 2011 3 2014 0

Gatwick Airport Flight Performance Team Quarterly report for the period July to September 20144
4
EGKK AD 2.21(3(3)) Subject to sub-paragraphs (5) and (6) below, any aircraft shall, after take-off, be operated in such a way that it will not cause more than 94 dBA Lmax by day 0700 to 2300 hours local time) as measured at any noise monitoring terminal at any of the sites referred to in sub-paragraph (2). This is to ensure that departing aircraft do not exceed the stated level during the day.
EGKK AD 2.21 (3(4)) Subject to sub-paragraphs (5) and (6) below, any aircraft shall, after take-off, be operated in such a way that it will not cause more than 89 dBA Lmax by night (2300 to 0700 hours local time) and that it will not cause more than 87 dBA Lmax during the night quota period from 2330 to 0600 hours local time) as measured at any noise monitoring terminal at any of the sites referred to in sub-paragraph (2). This is to ensure that departing aircraft do not exceed the stated levels during the night and shoulder periods.
0
1
2
3
4
5
6
7
8
Jan Feb Mar Apr May Jun Jul Aug Sep Oct Nov Dec
Air
craf
t b
elo
w 1
,00
0ft
Month
Initial Climb Performance 2006 2007 2008 2009 2010 2011 2012 2013 2014
DEPARTURES - NOISE INFRINGEMENTS
Departure Noise Limits (Daytime)
Comment:
There were no infringements of the noise limits during the day time period during the quarter.
Year Number of Day Infringements Year Number of Day
Infringements Year Number of Day Infringements
2006 9 2009 0 2012 0
2007 13 2010 0 2013 0
2008 2 2011 0 2014 0
DEPARTURE NOISE LIMITS (CORE NIGHT & SHOULDERS)
Comment:
There have been no night time noise infringements during this quarter.
YearNumber of Night
& Shoulder Infringements
YearNumber of Night
& Shoulder Infringements
YearNumber of Night
& Shoulder Infringements
2006 2 2009 1 2012 0
2007 2 2010 0 2013 0
2008 2 2011 4 2014 0
GRAPH ILLUSTRATING 1000FT PERFORMANCE

Gatwick Airport Flight Performance Team Quarterly report for the period July to September 2014 5
DEPARTURES - TRACK KEEPING
All jet aircraft leaving Gatwick Airport should follow flight paths known as Noise Preferential Routes (NPRs) up to a height of 3,000ft or 4,000ft depending on the route.
In 2012 Gatwick Airport publicly consulted on the implementation of a more modern form of aircraft navigation called P-RNAV (Precision Route Navigation). After having assessed all consultation feedback, the Civil Aviation Authority (CAA) granted the airport permission to implement P-RNAV on all of our departure routes.
Implementing P-RNAV on the published departure routes has resulted in the tracks of departing aircraft being more concentrated within the boundaries of the current NPRs, with one exception.
This is the NPR designed 26LAM that heads west then turns back on itself and passes to the north of the airfield. This route has always presented a challenge for modern jets as it was designed to accommodate propeller driven aircraft and early jets that were around in the late 1960s.
Implementing P-RNAV on this route now requires aircraft to fly outside of the current NPR and therefore aircraft on a P-RNAV departure on this route are not classified as off track as they are following the published route.
Air Traffic Control (ATC) are responsible for the routing of aircraft once airborne and when 3,000 or 4,000ft has been reached they may give a flight a more direct heading (known as vectoring) off the route. This is subject to certain factors including weather conditions or other traffic in the vicinity.
An NPR is a corridor 3 kilometres wide and aircraft are not obliged to follow any particular track within it. As long as aircraft remain within the corridor boundaries they are deemed to be on track. A map illustrating the Noise Preferential Routes at Gatwick is available on our website. www.gatwickairport.com/noise
Flights leaving the route below the required height are automatically tagged and details sent to the airline for investigation. Our Flight Operations Performance & Safety Committee regularly review track keeping performance.
5
TABLE ILLUSTRATING TRACK KEEPING PERFORMANCE OVER 15 MONTHS
Total Westerly Easterly
Month Deviations Departures % Deviations Deviations Departures % Deviations Deviations Departures % Deviations
Apr-13 194 10151 1.91% 182 5974 3.05% 13 4177 0.31%
May-13 167 11494 1.45% 155 8409 1.84% 12 3054 0.39%
Jun-13 271 11583 2.34% 243 7103 3.42% 28 4480 0.63%
Jul-13 384 12598 3.05% 331 6299 5.25% 50 6299 0.79%
Aug-13 395 12909 3.06% 374 9868 3.79% 21 3040 0.69%
Sep-13 315 12065 2.61% 296 8292 3.57% 17 3821 0.44%
Oct-13 228 11276 2.02% 211 8457 2.49% 17 2817 0.60%
Nov-13 126 8633 1.46% 113 5916 1.91% 13 2738 0.47%
Dec-13 163 8996 1.81% 156 8202 1.90% 7 794 0.88%
Jan-14 159 8762 1.81% 151 7428 2.03% 8 1333 0.60%
Feb-14 151 8516 1.77% 141 7511 1.88% 10 996 1.00%
Mar-14 106 9444 1.12% 92 5855 1.57% 14 3589 0.39%
Apr-14 78 9774 0.80% 57 5229 1.09% 21 4545 0.46%
May-14 37 11654 0.32% 26 7067 0.37% 11 4587 0.24%
Jun-14 41 11659 0.35% 25 6079 0.41% 16 5580 0.29%
Jul-14 56 12642 0.44% 30 8769 0.34% 26 3873 0.67%
Aug-14 102 13182 0.77% 83 11816 0.70% 19 1366 1.39%
Sep-14 40 11993 0.33% 22 4069 0.54% 18 7924 0.23%
Comment:
The table above shows track keeping performance over the previous 12 month period. The on track performance for the quarter was increased to 98.98% compared to 99.52% measured in the 1st quarter. The rolling 12 month year on year period on track performance stands at 98.98% as opposed to 98.04% for the 12 months ended Sept 2013.

Gatwick Airport Flight Performance Team Quarterly report for the period July to September 20146
DEPARTURES - OVER CONGESTED AREAS
The WIZAD Noise Preferential Route
Comment:
This quarter there have been no departures during the restricted period, on the ’26 WIZAD’ Noise Preferential Route.
Overflight of Crawley and Horley
Comment:
During this period there were 8 departing flights that passed over Crawley. Of these 7 were confirmed weather deviations, that were directed off the route by Air Traffic Control. A departing Thomson flight on 18th July, was given the wrong initial heading and was turned back towards the south and passed the very edge of the town at 5800 feet. An Easyjet A319 departure using runway 08 passed over Horley on 28 July at less than 2000 feet having had to turn sharply after take off to avoid a thunder storm in close proximity to the runway. There were several periods of storm activity during the summer months.
6
EGKK AD 2.21 (8) (c) The ATC clearance via Mayfield specified in the second column of the table will not be available between 2300 hours and 0700 hours local time. Aircraft following the Noise Preferential Routing which relates to that clearance shall not fly over Crawley, Crawley Down or East Grinstead. This is to avoid aircraft noise from departing aircraft over areas of high population at night on the 26WIZAD NPR.
EGKK AD 2.21 (9) After take-off the aircraft shall avoid flying over the congested areas of Horley and Crawley. This is to avoid aircraft noise from departing aircraft over areas of high population.
MAP ILLUSTRATING CRAWLEY TOWN BOUNDARY WITH NOISE PREFERENTIAL ROUTE 26 WIZAD AND DEPARTURE OVERFLIGHT

Gatwick Airport Flight Performance Team Quarterly report for the period July to September 2014 7
7
MAP BELOW SHOWS THE TRACK OF THE DEPARTING FLIGHT PASSING HORLEY CAUSED BY WEATHER AVOIDANCE
MAP BELOW ILLUSTRATES THE TRACK DENSITY OF AIRCRAFT OVERFLYING HORLEY DURING THE THREE MONTH PERIOD
Gatwick Airport Flight Performance Team Quarterly report for the period July to September 20148
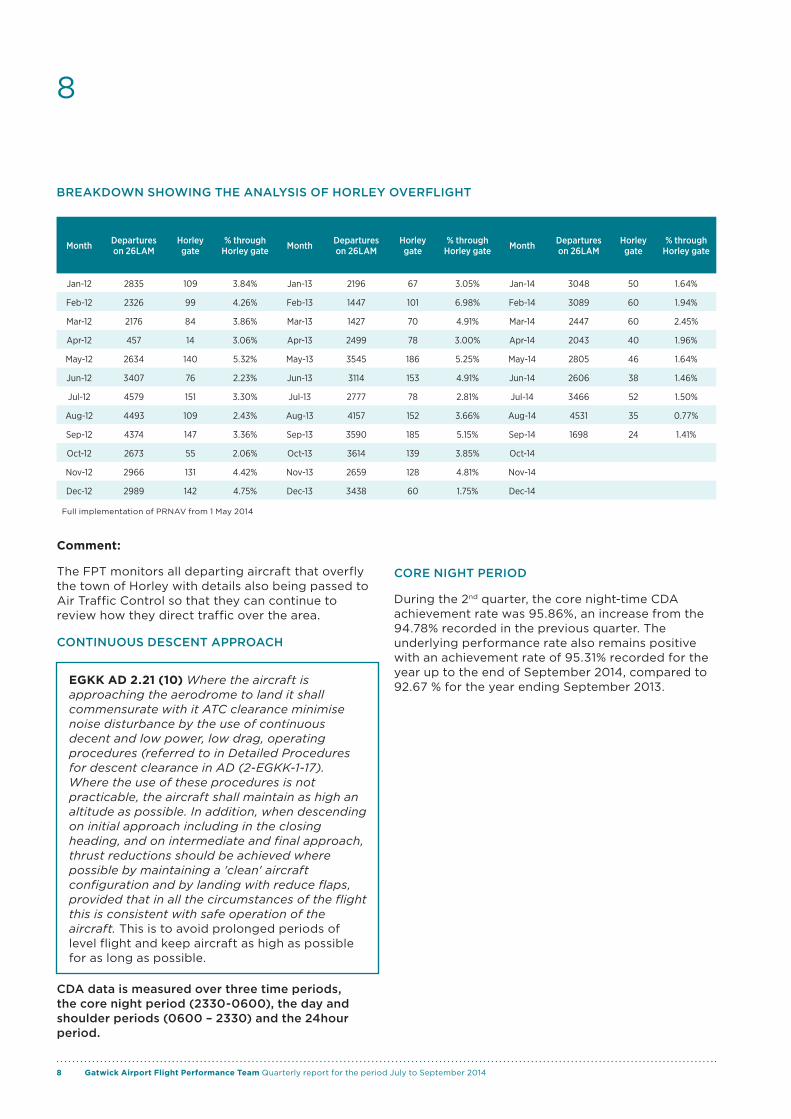
CORE NIGHT PERIOD
During the 2nd quarter, the core night-time CDA achievement rate was 95.86%, an increase from the 94.78% recorded in the previous quarter. The underlying performance rate also remains positive with an achievement rate of 95.31% recorded for the year up to the end of September 2014, compared to 92.67 % for the year ending September 2013.
BREAKDOWN SHOWING THE ANALYSIS OF HORLEY OVERFLIGHT
Month Departures on 26LAM
Horley gate
% through Horley gate Month Departures
on 26LAMHorley gate
% through Horley gate Month Departures
on 26LAMHorley gate
% through Horley gate
Jan-12 2835 109 3.84% Jan-13 2196 67 3.05% Jan-14 3048 50 1.64%
Feb-12 2326 99 4.26% Feb-13 1447 101 6.98% Feb-14 3089 60 1.94%
Mar-12 2176 84 3.86% Mar-13 1427 70 4.91% Mar-14 2447 60 2.45%
Apr-12 457 14 3.06% Apr-13 2499 78 3.00% Apr-14 2043 40 1.96%
May-12 2634 140 5.32% May-13 3545 186 5.25% May-14 2805 46 1.64%
Jun-12 3407 76 2.23% Jun-13 3114 153 4.91% Jun-14 2606 38 1.46%
Jul-12 4579 151 3.30% Jul-13 2777 78 2.81% Jul-14 3466 52 1.50%
Aug-12 4493 109 2.43% Aug-13 4157 152 3.66% Aug-14 4531 35 0.77%
Sep-12 4374 147 3.36% Sep-13 3590 185 5.15% Sep-14 1698 24 1.41%
Oct-12 2673 55 2.06% Oct-13 3614 139 3.85% Oct-14
Nov-12 2966 131 4.42% Nov-13 2659 128 4.81% Nov-14
Dec-12 2989 142 4.75% Dec-13 3438 60 1.75% Dec-14
Full implementation of PRNAV from 1 May 2014
Comment:
The FPT monitors all departing aircraft that overfly the town of Horley with details also being passed to Air Traffic Control so that they can continue to review how they direct traffic over the area.
CDA data is measured over three time periods, the core night period (2330-0600), the day and shoulder periods (0600 – 2330) and the 24hour period.
8
EGKK AD 2.21 (10) Where the aircraft is approaching the aerodrome to land it shall commensurate with it ATC clearance minimise noise disturbance by the use of continuous decent and low power, low drag, operating procedures (referred to in Detailed Procedures for descent clearance in AD (2-EGKK-1-17). Where the use of these procedures is not practicable, the aircraft shall maintain as high an altitude as possible. In addition, when descending on initial approach including in the closing heading, and on intermediate and final approach, thrust reductions should be achieved where possible by maintaining a 'clean' aircraft configuration and by landing with reduce flaps, provided that in all the circumstances of the flight this is consistent with safe operation of the aircraft. This is to avoid prolonged periods of level flight and keep aircraft as high as possible for as long as possible.
CONTINUOUS DESCENT APPROACH
Gatwick Airport Flight Performance Team Quarterly report for the period July to September 2014 9
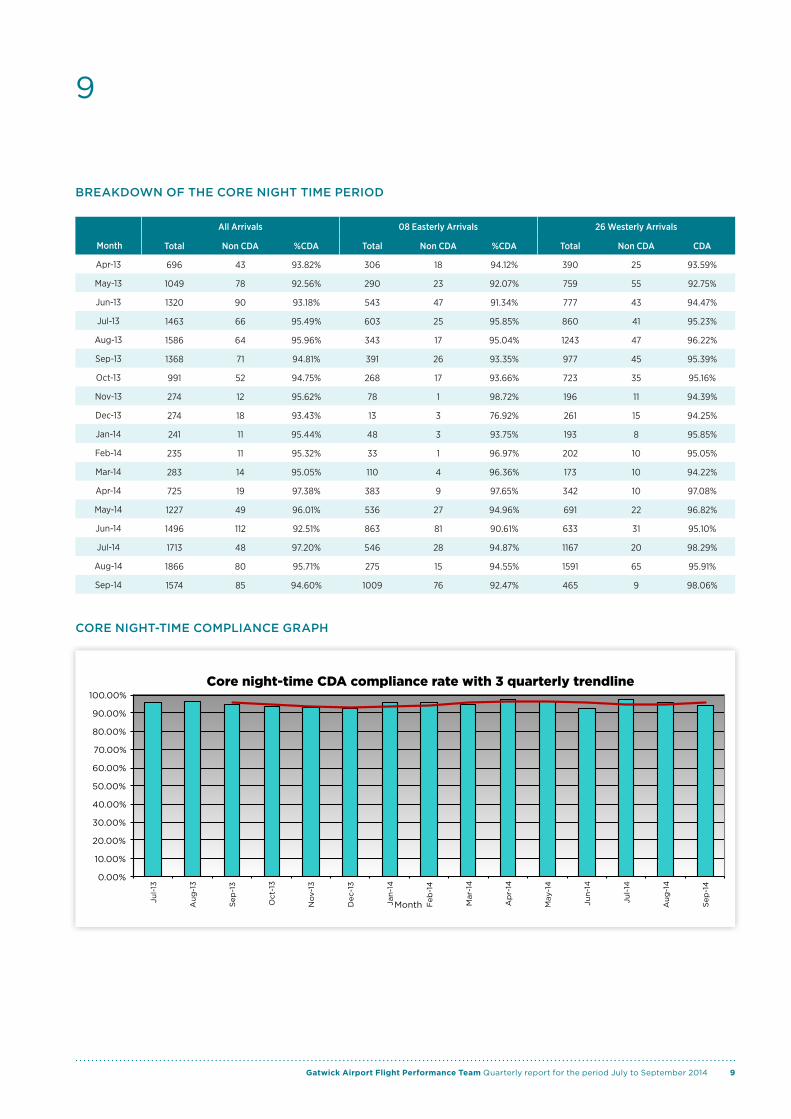
BREAKDOWN OF THE CORE NIGHT TIME PERIOD
All Arrivals 08 Easterly Arrivals 26 Westerly Arrivals
Month Total Non CDA %CDA Total Non CDA %CDA Total Non CDA CDA
Apr-13 696 43 93.82% 306 18 94.12% 390 25 93.59%
May-13 1049 78 92.56% 290 23 92.07% 759 55 92.75%
Jun-13 1320 90 93.18% 543 47 91.34% 777 43 94.47%
Jul-13 1463 66 95.49% 603 25 95.85% 860 41 95.23%
Aug-13 1586 64 95.96% 343 17 95.04% 1243 47 96.22%
Sep-13 1368 71 94.81% 391 26 93.35% 977 45 95.39%
Oct-13 991 52 94.75% 268 17 93.66% 723 35 95.16%
Nov-13 274 12 95.62% 78 1 98.72% 196 11 94.39%
Dec-13 274 18 93.43% 13 3 76.92% 261 15 94.25%
Jan-14 241 11 95.44% 48 3 93.75% 193 8 95.85%
Feb-14 235 11 95.32% 33 1 96.97% 202 10 95.05%
Mar-14 283 14 95.05% 110 4 96.36% 173 10 94.22%
Apr-14 725 19 97.38% 383 9 97.65% 342 10 97.08%
May-14 1227 49 96.01% 536 27 94.96% 691 22 96.82%
Jun-14 1496 112 92.51% 863 81 90.61% 633 31 95.10%
Jul-14 1713 48 97.20% 546 28 94.87% 1167 20 98.29%
Aug-14 1866 80 95.71% 275 15 94.55% 1591 65 95.91%
Sep-14 1574 85 94.60% 1009 76 92.47% 465 9 98.06%
9
0.00%
10.00%
20.00%
30.00%
40.00%
50.00%
60.00%
70.00%
80.00%
90.00%
100.00%
Jul-
13
Aug
-13
Sep
-13
Oct
-13
Nov
-13
Dec
-13
Jan-
14
Feb
-14
Mar
-14
Ap
r-14
May
-14
Jun-
14
Jul-
14
Aug
-14
Sep
-14
Month
Core night-time CDA compliance rate with 3 quarterly trendline
CORE NIGHT-TIME COMPLIANCE GRAPH

Gatwick Airport Flight Performance Team Quarterly report for the period July to September 201410
DAYTIME AND SHOULDER PERIOD
The average daytime and shoulder period achievement rate for this 3 month period is 92.17% compared to 92.39% for the previous quarter. The twelve month period to the end of September 2014 shows an achievement rate of 92.33% compared to 91.08% for the same period ending September 2013.
10
BREAKDOWN OF THE DAYTIME AND SHOULDER TIME PERIOD WITH GRAPH
All Arrivals 08R Easterly Arrivals 26L Westerly Arrivals
Month Total Non CDA %CDA Total Non CDA %CDA Total Non CDA CDA
Jul-13 11057 908 91.79% 5394 552 89.77% 5663 356 93.71%
Aug-13 11220 866 92.28% 2691 272 89.89% 8529 594 93.04%
Sep-13 10695 783 92.68% 3351 273 91.85% 7344 510 93.06%
Oct-13 9883 695 92.97% 2348 207 91.18% 7535 488 93.52%
Nov-13 8328 518 93.78% 2783 190 93.17% 5545 328 94.08%
Dec-13 8681 749 91.37% 824 79 90.41% 7857 670 91.47%
Jan-14 8410 684 91.87% 1246 143 88.52% 7164 541 92.45%
Feb-14 8174 705 91.38% 916 103 88.76% 7258 602 91.71%
Mar-14 9316 668 92.83% 3707 312 91.58% 5609 356 93.65%
Apr-14 9326 655 92.98% 4402 345 92.16% 4924 310 93.70%
May-14 10618 796 92.50% 4230 345 91.84% 6388 451 92.94%
Jun-14 10455 861 91.76% 5000 479 90.42% 5455 382 93.00%
Jul-14 11144 895 91.97% 3413 355 89.60% 7731 540 93.02%
Aug-14 11404 870 92.37% 1099 107 90.26% 10305 9542 7.40%
Sep-14 10853 848 92.19% 7149 590 91.75% 3704 258 93.03%
50.00%
55.00%
60.00%
65.00%
70.00%
75.00%
80.00%
85.00%
90.00%
95.00%
100.00%
Jul-13 Aug-13 Sep-13 Oct-13 Nov-13 Dec-13 Jan-14 Feb-14 Mar-14 Apr-14 May-14 Jun-14 Jul-14 Aug-14 Sep-14
Day and Shoulder periods CDA Achievement with quarterly trend line
GATWICK DAY & SHOULDER CDA ACHIEVEMENT (0600 - 2330) WITH QUARTERLY TREND LINE
Gatwick Airport Flight Performance Team Quarterly report for the period July to September 2014 11
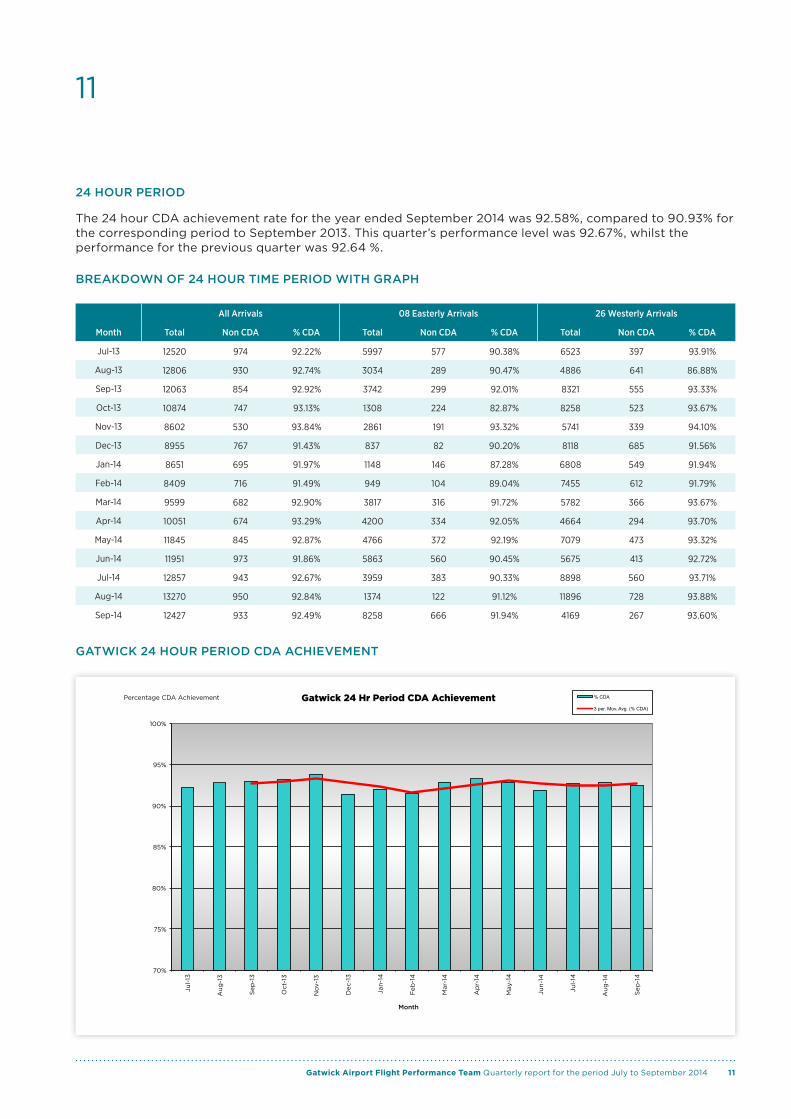
24 HOUR PERIOD
The 24 hour CDA achievement rate for the year ended September 2014 was 92.58%, compared to 90.93% for the corresponding period to September 2013. This quarter’s performance level was 92.67%, whilst the performance for the previous quarter was 92.64 %.
11
BREAKDOWN OF 24 HOUR TIME PERIOD WITH GRAPH
All Arrivals 08 Easterly Arrivals 26 Westerly Arrivals
Month Total Non CDA % CDA Total Non CDA % CDA Total Non CDA % CDA
Jul-13 12520 974 92.22% 5997 577 90.38% 6523 397 93.91%
Aug-13 12806 930 92.74% 3034 289 90.47% 4886 641 86.88%
Sep-13 12063 854 92.92% 3742 299 92.01% 8321 555 93.33%
Oct-13 10874 747 93.13% 1308 224 82.87% 8258 523 93.67%
Nov-13 8602 530 93.84% 2861 191 93.32% 5741 339 94.10%
Dec-13 8955 767 91.43% 837 82 90.20% 8118 685 91.56%
Jan-14 8651 695 91.97% 1148 146 87.28% 6808 549 91.94%
Feb-14 8409 716 91.49% 949 104 89.04% 7455 612 91.79%
Mar-14 9599 682 92.90% 3817 316 91.72% 5782 366 93.67%
Apr-14 10051 674 93.29% 4200 334 92.05% 4664 294 93.70%
May-14 11845 845 92.87% 4766 372 92.19% 7079 473 93.32%
Jun-14 11951 973 91.86% 5863 560 90.45% 5675 413 92.72%
Jul-14 12857 943 92.67% 3959 383 90.33% 8898 560 93.71%
Aug-14 13270 950 92.84% 1374 122 91.12% 11896 728 93.88%
Sep-14 12427 933 92.49% 8258 666 91.94% 4169 267 93.60%
70%
75%
80%
85%
90%
95%
100%
Jul-
13
Aug
-13
Sep
-13
Oct
-13
Nov
-13
Dec
-13
Jan-
14
Feb
-14
Mar
-14
Ap
r-14
May
-14
Jun-
14
Jul-
14
Aug
-14
Sep
-14
Percentage CDA Achievement
Month
Gatwick 24 Hr Period CDA Achievement % CDA
3 per. Mov. Avg. (% CDA)
GATWICK 24 HOUR PERIOD CDA ACHIEVEMENT
Gatwick Airport Flight Performance Team Quarterly report for the period July to September 201412
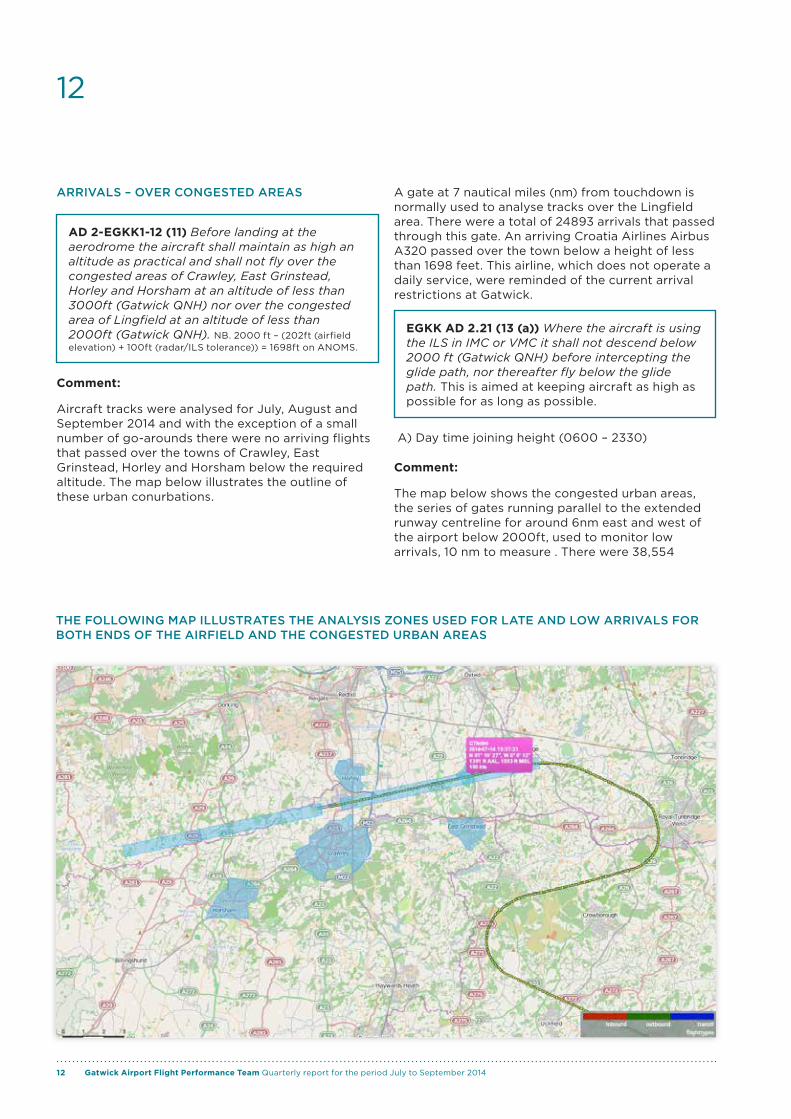
ARRIVALS – OVER CONGESTED AREAS
Comment:
Aircraft tracks were analysed for July, August and September 2014 and with the exception of a small number of go-arounds there were no arriving flights that passed over the towns of Crawley, East Grinstead, Horley and Horsham below the required altitude. The map below illustrates the outline of these urban conurbations.
A gate at 7 nautical miles (nm) from touchdown is normally used to analyse tracks over the Lingfield area. There were a total of 24893 arrivals that passed through this gate. An arriving Croatia Airlines Airbus A320 passed over the town below a height of less than 1698 feet. This airline, which does not operate a daily service, were reminded of the current arrival restrictions at Gatwick.
A) Day time joining height (0600 – 2330)
Comment:
The map below shows the congested urban areas, the series of gates running parallel to the extended runway centreline for around 6nm east and west of the airport below 2000ft, used to monitor low arrivals, 10 nm to measure . There were 38,554
12
AD 2-EGKK1-12 (11) Before landing at the aerodrome the aircraft shall maintain as high an altitude as practical and shall not fly over the congested areas of Crawley, East Grinstead, Horley and Horsham at an altitude of less than 3000ft (Gatwick QNH) nor over the congested area of Lingfield at an altitude of less than 2000ft (Gatwick QNH). NB. 2000 ft – (202ft (airfield elevation) + 100ft (radar/ILS tolerance)) = 1698ft on ANOMS.
EGKK AD 2.21 (13 (a)) Where the aircraft is using the ILS in IMC or VMC it shall not descend below 2000 ft (Gatwick QNH) before intercepting the glide path, nor thereafter fly below the glide path. This is aimed at keeping aircraft as high as possible for as long as possible.
THE FOLLOWING MAP ILLUSTRATES THE ANALYSIS ZONES USED FOR LATE AND LOW ARRIVALS FOR BOTH ENDS OF THE AIRFIELD AND THE CONGESTED URBAN AREAS
Gatwick Airport Flight Performance Team Quarterly report for the period July to September 2014 13
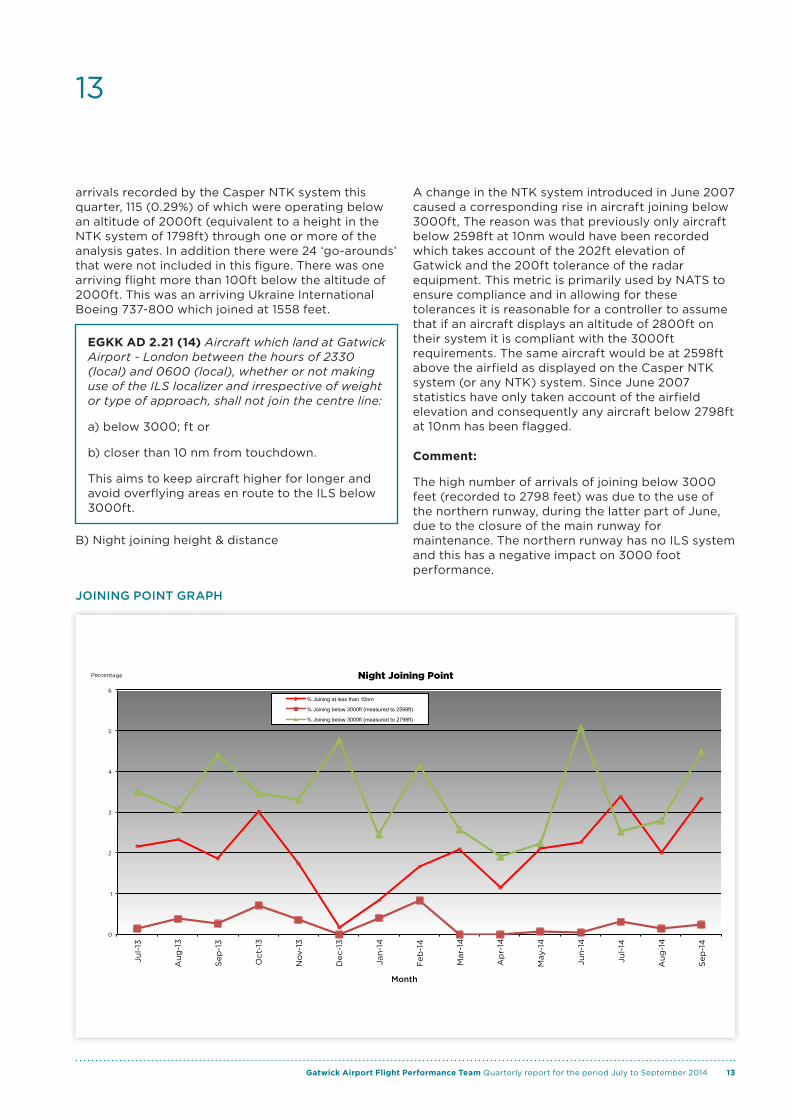
arrivals recorded by the Casper NTK system this quarter, 115 (0.29%) of which were operating below an altitude of 2000ft (equivalent to a height in the NTK system of 1798ft) through one or more of the analysis gates. In addition there were 24 ‘go-arounds’ that were not included in this figure. There was one arriving flight more than 100ft below the altitude of 2000ft. This was an arriving Ukraine International Boeing 737-800 which joined at 1558 feet.
B) Night joining height & distance
A change in the NTK system introduced in June 2007 caused a corresponding rise in aircraft joining below 3000ft, The reason was that previously only aircraft below 2598ft at 10nm would have been recorded which takes account of the 202ft elevation of Gatwick and the 200ft tolerance of the radar equipment. This metric is primarily used by NATS to ensure compliance and in allowing for these tolerances it is reasonable for a controller to assume that if an aircraft displays an altitude of 2800ft on their system it is compliant with the 3000ft requirements. The same aircraft would be at 2598ft above the airfield as displayed on the Casper NTK system (or any NTK) system. Since June 2007 statistics have only taken account of the airfield elevation and consequently any aircraft below 2798ft at 10nm has been flagged.
Comment:
The high number of arrivals of joining below 3000 feet (recorded to 2798 feet) was due to the use of the northern runway, during the latter part of June, due to the closure of the main runway for maintenance. The northern runway has no ILS system and this has a negative impact on 3000 foot performance.
13
EGKK AD 2.21 (14) Aircraft which land at Gatwick Airport - London between the hours of 2330 (local) and 0600 (local), whether or not making use of the ILS localizer and irrespective of weight or type of approach, shall not join the centre line:
a) below 3000; ft or
b) closer than 10 nm from touchdown.
This aims to keep aircraft higher for longer and avoid overflying areas en route to the ILS below 3000ft.
0
1
2
3
4
5
6
Jul-
13
Aug
-13
Sep
-13
Oct
-13
Nov
-13
Dec
-13
Jan-
14
Feb
-14
Mar
-14
Ap
r-14
May
-14
Jun-
14
Jul-
14
Aug
-14
Sep
-14
Percentage
Month
Night Joining Point
% Joining at less than 10nm
% Joining below 3000ft (measured to 2598ft)
% Joining below 3000ft (measured to 2798ft)
JOINING POINT GRAPH

Gatwick Airport Flight Performance Team Quarterly report for the period July to September 201414
GO - AROUNDS
A go-around is a procedure adopted when an arriving aircraft on final approach aborts landing by applying take off power and climbing away from the airport. It is a set procedure to be followed by the flight crew in the event of an aircraft being unable to land. The procedure is published so that Air Traffic Control (ATC) and the pilots can anticipate where the aircraft will go following the decision to go-around.
The number and reasons for go-arounds are routinely discussed at FLOPSC meetings and Pilot Forums. All parties are focussed on minimising the number of occasions when a go around is required but expect some to occur given the fact that Gatwick
is a busy single runway airport. It should be stated that there are well established standard procedures which both pilots and controllers are trained in and are familiar with. Gatwick Airport Ltd as the airport operator actively encourages airlines operating at the airport to fly to the best possible environmental standards. However safety must and always will be the number one priority.
The main causes of go arounds this quarter were 'runway occupied' and 'unstable approaches'.
14
0
10
20
30
40
50
60
70
80
Unstable Approach
Runway Occupied
Aborted Take Off
ATC Spacing
Windshear IRVR FOD ATC Misjudge
Birdstrike Technical Problem
Cabin Not Secure
Narrative
Go-arounds causal factors July - Sept 2014
NATS CURRENTLY RECORD GO-AROUNDS UNDER ONE OF THE FOLLOWING CAUSAL FACTORS

Gatwick Airport Flight Performance Team Quarterly report for the period July to September 2014 15
GO AROUND STATISTICS 2003 - 2013
Year Total Total Arrivals % of Arrivals
2004 344 124665 0.28
2005 450 129509 0.35
2006 405 130954 0.31
2007 434 133271 0.33
2008 359 131858 0.35
2009 455 125861 0.36
2010 364 120263 0.3
2011 386 125541 0.31
2012 520 123408 0.42
2013 473 125290 0.38
2014 433 100531 0.43
Comment:
The high number of wind shear events due to winter storms is the main reason for the higher than average number of recorded events for the year to date. The percentage of go arounds this quarter is back to the normal levels experienced in previous years, 0.32%.
15
Gatwick Airport Flight Performance Team Quarterly report for the period July to September 201416
NIGHT FLIGHTS
Introduction
The Secretary of State in exercise of his powers under Section 78 of the Civil Aviation Act 1982 has imposed restrictions at Gatwick Airport on aircraft operating at night. These restrictions are in place to limit and mitigate noise disturbance from aircraft operating at night and to prohibit aircraft of specified descriptions from operating, also to limit the number of occasions on which other aircraft may take off or land.
The night flying restrictions are divided into summer and winter seasons which coincide with the start and end of British Summer Time. They consist of a movement limit and a quota count system. The quota count (QC) means that points are allocated to different aircraft types according to how noisy they are. The noisier the aircraft type, the higher the points allocated. This provides an incentive for airlines to use quieter aircraft types. Aircraft are certified by the International Civil Aviation Organisation according to the noise they produce and are classified separately for both take-off and landing.
For the purposes of night flying operations, the night quota period is defined as the period between 23:30 -06:00 (Local time). In addition there are two further shoulder periods of 23:00 – 23:30 and 06:00 – 07:00 (Local time), where other restrictions apply to the scheduling and operation of aircraft of specified descriptions.
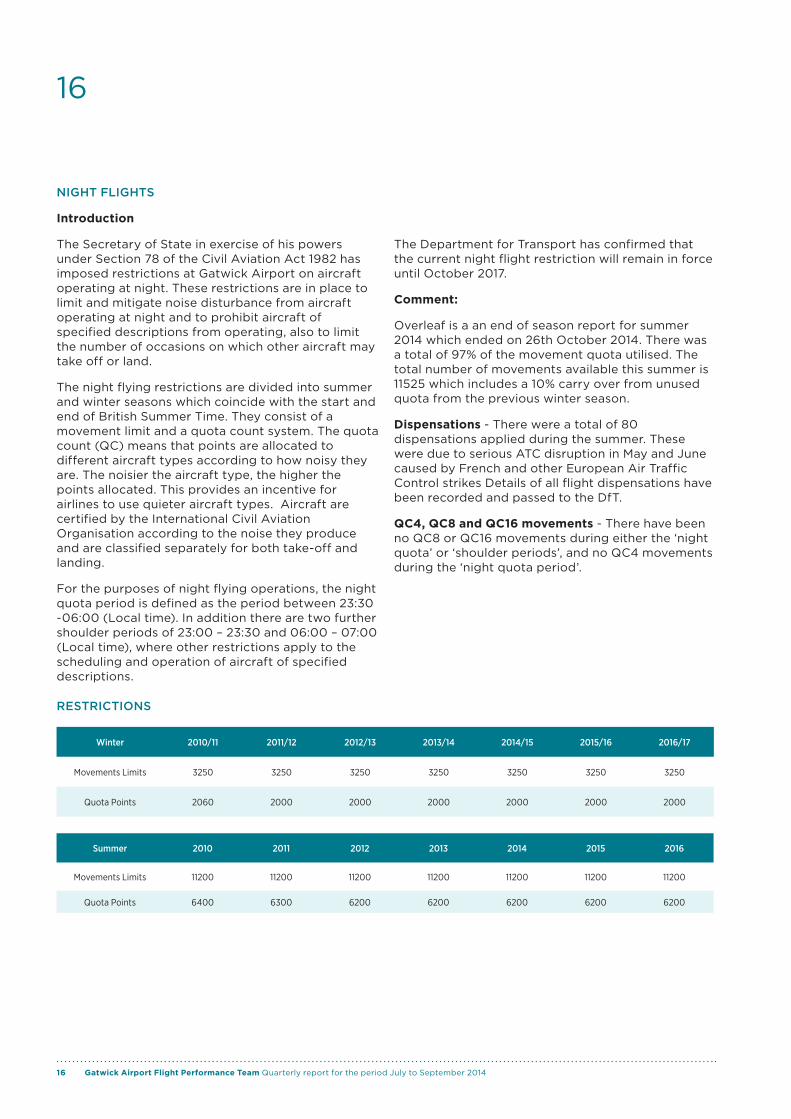
RESTRICTIONS
Winter 2010/11 2011/12 2012/13 2013/14 2014/15 2015/16 2016/17
Movements Limits 3250 3250 3250 3250 3250 3250 3250
Quota Points 2060 2000 2000 2000 2000 2000 2000
Summer 2010 2011 2012 2013 2014 2015 2016
Movements Limits 11200 11200 11200 11200 11200 11200 11200
Quota Points 6400 6300 6200 6200 6200 6200 6200
The Department for Transport has confirmed that the current night flight restriction will remain in force until October 2017.
Comment:
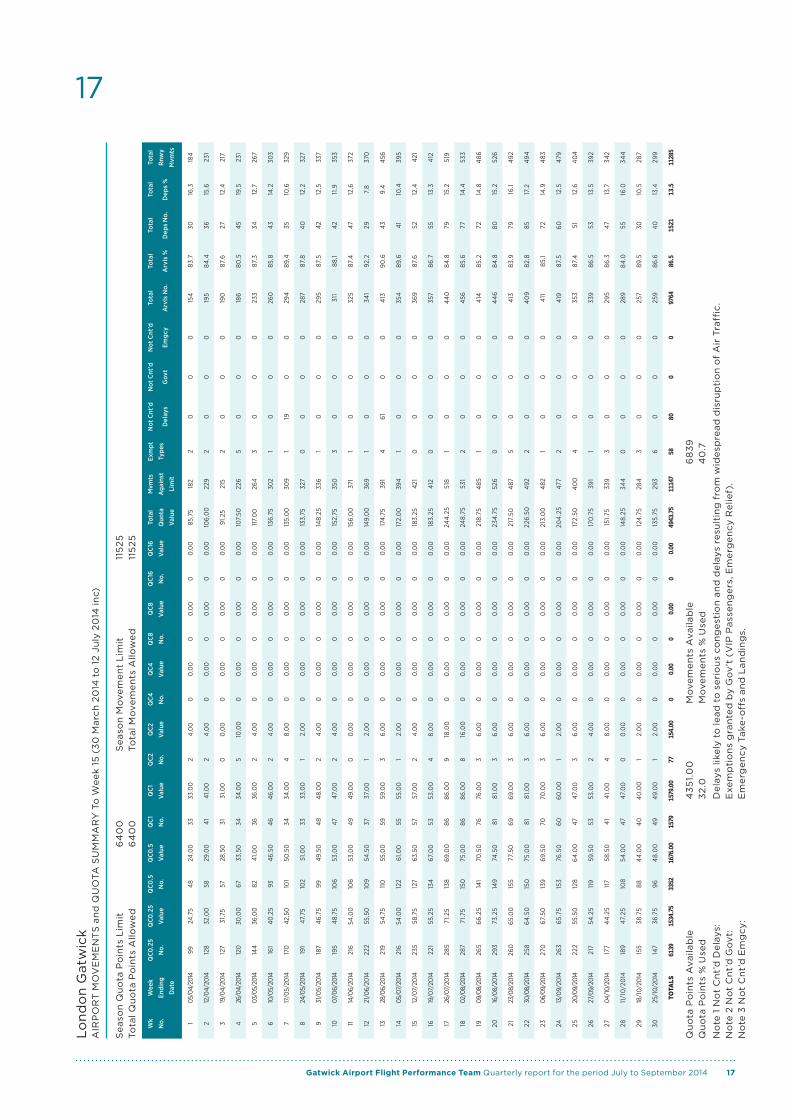
Overleaf is a an end of season report for summer 2014 which ended on 26th October 2014. There was a total of 97% of the movement quota utilised. The total number of movements available this summer is 11525 which includes a 10% carry over from unused quota from the previous winter season.
Dispensations - There were a total of 80 dispensations applied during the summer. These were due to serious ATC disruption in May and June caused by French and other European Air Traffic Control strikes Details of all flight dispensations have been recorded and passed to the DfT.
QC4, QC8 and QC16 movements - There have been no QC8 or QC16 movements during either the ‘night quota’ or ‘shoulder periods’, and no QC4 movements during the ‘night quota period’.
16
Gatwick Airport Flight Performance Team Quarterly report for the period July to September 2014 17
17
Wk
No.
Wee
k
Endi
ng
Dat
e
QC0
.25
No.
QC0
.25
Valu
e
QC0
.5
No.
QC0
.5
Valu
e
QC
1
No.
QC
1
Valu
e
QC
2
No.
QC
2
Valu
e
QC4
No.
QC4
Valu
e
QC
8
No.
QC
8
Valu
e
QC
16
No.
QC
16
Valu
e
Tota
l
Quo
ta
Valu
e
Mvm
ts
Aga
inst
Lim
it
Exm
pt
Type
s
Not
Cnt
'd
Del
ays
Not
Cnt
'd
Gov
t
Not
Cnt
'd
Emgc
y
Tota
l
Arv
ls N
o.
Tota
l
Arv
ls %
Tota
l
Dep
s N
o.
Tota
l
Dep
s %
Tota
l
Rnw
y
Mvm
ts
105
/04/
2014
9924
.75
4824
.00
3333
.00
24.
00
00
.00
00
.00
00
.00
85.7
518
22
00
015
483
.730
16.3
184
212
/04/
2014
128
32.0
058
29.0
041
41.0
02
4.0
00
0.0
00
0.0
00
0.0
010
6.0
022
92
00
019
584
.436
15.6
231
319
/04/
2014
127
31.7
557
28.5
031
31.0
00
0.0
00
0.0
00
0.0
00
0.0
091
.25
215
20
00
190
87.6
2712
.421
7
426
/04/
2014
120
30.0
067
33.5
034
34.0
05
10.0
00
0.0
00
0.0
00
0.0
010
7.50
226
50
00
186
80.5
4519
.523
1
503
/05/
2014
144
36.0
082
41.0
036
36.0
02
4.0
00
0.0
00
0.0
00
0.0
011
7.0
026
43
00
023
387
.334
12.7
267
610
/05/
2014
161
40.2
593
46.5
046
46.0
02
4.0
00
0.0
00
0.0
00
0.0
013
6.75
302
10
00
260
85.8
4314
.230
3
717
/05/
2014
170
42.5
010
150
.50
3434
.00
48.
00
00
.00
00
.00
00
.00
135.
00
309
119
00
294
89.4
3510
.632
9
824
/05/
2014
191
47.7
510
251
.00
3333
.00
12.
00
00
.00
00
.00
00
.00
133.
7532
70
00
028
787
.84
012
.232
7
931
/05/
2014
187
46.7
599
49.5
048
48.0
02
4.0
00
0.0
00
0.0
00
0.0
014
8.25
336
10
00
295
87.5
4212
.533
7
1007
/06/
2014
195
48.7
510
653
.00
4747
.00
24.
00
00
.00
00
.00
00
.00
152.
7535
03
00
031
188
.142
11.9
353
1114
/06/
2014
216
54.0
010
653
.00
4949
.00
00
.00
00
.00
00
.00
00
.00
156.
00
371
10
00
325
87.4
4712
.637
2
1221
/06/
2014
222
55.5
010
954
.50
3737
.00
12.
00
00
.00
00
.00
00
.00
149.
00
369
10
00
341
92.2
297.
837
0
1328
/06/
2014
219
54.7
511
055
.00
5959
.00
36.
00
00
.00
00
.00
00
.00
174.
7539
14
610
041
390
.643
9.4
456
1405
/07/
2014
216
54.0
012
261
.00
5555
.00
12.
00
00
.00
00
.00
00
.00
172.
00
394
10
00
354
89.6
4110
.439
5
1512
/07/
2014
235
58.7
512
763
.50
5757
.00
24.
00
00
.00
00
.00
00
.00
183.
2542
10
00
036
987
.652
12.4
421
1619
/07/
2014
221
55.2
513
467
.00
5353
.00
48.
00
00
.00
00
.00
00
.00
183.
2541
20
00
035
786
.755
13.3
412
1726
/07/
2014
285
71.2
513
869
.00
8686
.00
918
.00
00
.00
00
.00
00
.00
244
.25
518
10
00
44
084
.879
15.2
519
1802
/08/
2014
287
71.7
515
075
.00
8686
.00
816
.00
00
.00
00
.00
00
.00
248.
7553
12
00
045
685
.677
14.4
533
1909
/08/
2014
265
66.2
514
170
.50
7676
.00
36.
00
00
.00
00
.00
00
.00
218.
754
851
00
041
485
.272
14.8
486
2016
/08/
2014
293
73.2
514
974
.50
8181
.00
36.
00
00
.00
00
.00
00
.00
234
.75
526
00
00
44
684
.880
15.2
526
2123
/08/
2014
260
65.0
015
577
.50
6969
.00
36.
00
00
.00
00
.00
00
.00
217.
504
875
00
041
383
.979
16.1
492
2230
/08/
2014
258
64.5
015
075
.00
8181
.00
36.
00
00
.00
00
.00
00
.00
226.
5049
22
00
04
09
82.8
8517
.249
4
2306
/09/
2014
270
67.5
013
969
.50
7070
.00
36.
00
00
.00
00
.00
00
.00
213.
00
482
10
00
411
85.1
7214
.94
83
2413
/09/
2014
263
65.7
515
376
.50
6060
.00
12.
00
00
.00
00
.00
00
.00
204
.25
477
20
00
419
87.5
6012
.547
9
2520
/09/
2014
222
55.5
012
864
.00
4747
.00
36.
00
00
.00
00
.00
00
.00
172.
504
00
40
00
353
87.4
5112
.64
04
2627
/09/
2014
217
54.2
511
959
.50
5353
.00
24
.00
00
.00
00
.00
00
.00
170
.75
391
10
00
339
86.5
5313
.539
2
2704
/10/
2014
177
44
.25
117
58.5
041
41.0
04
8.0
00
0.0
00
0.0
00
0.0
015
1.75
339
30
00
295
86.3
4713
.734
2
2811
/10
/20
1418
947
.25
108
54.0
047
47.0
00
0.0
00
0.0
00
0.0
00
0.0
014
8.25
344
00
00
289
84.0
5516
.034
4
2918
/10/
2014
155
38.7
588
44
.00
40
40
.00
12.
00
00
.00
00
.00
00
.00
124
.75
284
30
00
257
89.5
3010
.528
7
3025
/10/
2014
147
36.7
596
48.
00
4949
.00
12.
00
00
.00
00
.00
00
.00
135.
7529
36
00
025
986
.64
013
.429
9
TOTA
LS61
39
153
4.7
53
352
1676
.00
157
91
579
.00
771
54
.00
00
.00
00
.00
00
.00
49
43
.75
1114
75
88
00
09
76
48
6.5
15
21
13
.511
28
5
Lon
do
n G
atw
ick
AIR
PO
RT
MO
VE
ME
NT
S a
nd
QU
OTA
SU
MM
AR
Y T
o W
eek
15
(30
Mar
ch 2
014
to
12
July
20
14 in
c)
Sea
son
Qu
ota
Po
ints
Lim
it
6
40
0
S
easo
n M
ove
men
t L
imit
115
25
Tota
l Qu
ota
Po
ints
Allo
wed
64
00
Tota
l Mo
vem
ents
Allo
wed
115
25
Qu
ota
Po
ints
Ava
ilab
le
43
51.
00
Mo
vem
ents
Ava
ilab
le
68
39
Qu
ota
Po
ints
% U
sed
3
2.0
Mo
vem
ents
% U
sed
4
0.7
No
te 1
No
t C
nt’
d D
elay
s:
Del
ays
likel
y to
lead
to
ser
iou
s co
ng
esti
on
and
del
ays
resu
ltin
g f
rom
wid
esp
read
dis
rup
tio
n o
f A
ir T
raff
ic.
No
te 2
No
t C
nt’
d G
ov
t:
Exe
mp
tio
ns
gra
nte
d b
y G
ov
’t (
VIP
Pas
sen
ger
s, E
mer
gen
cy R
elie
f).
No
te 3
No
t C
nt’
d E
mg
cy:
Em
erg
ency
Tak
e-o
ffs
and
Lan
din
gs.

Gatwick Airport Flight Performance Team Quarterly report for the period July to September 201418
Ground Noise 0%
Night 5%
Increased Flights
7% Early Morning
6%
Track Keeping 7%
Low Flying 22%
Too Loud 53%
Reason for complaint
NOISE COMPLAINTS
Knowing people’s concerns about the airport is important to us. By studying the complaints we receive, and gathering information from the surrounding towns and villages, we believe that we have a good understanding of the noise issues that affect our communities.
18
The graph to the left illustrates the number of complaints by month, divided between those complaining about a specific flight and those about general issues. The charts below detail a breakdown of the specific reasons recorded.
The main reason for the complaints we receive are shown as a % in the graph to the left.
This graph shows the reason for complaint by actual the numbers received.
0
1000
2000
3000
Jul-14 Aug-14 Sep-14 Generic 1721 1930 823
Specific 531 880 691
Complaints by month
0 116 139 129 141
472
1105
0
200
400
600
800
1000
1200
Ground Noise
Night flights
Increased Flights
Early Morning
Track Keeping
Low Flying
Too Loud
Reason for complaint

Gatwick Airport Flight Performance Team Quarterly report for the period July to September 2014 19
NOISE COMPLAINTS
Noise is very subjective and peoples’ attitude to various forms of noise can vary widely. What one person may consider acceptable may disturb another. These charts provide further analysis of where our complainants live and whether they have been disturbed by arriving or departing flights, or by noise from within the airport boundary.
19
Right hand diagram indicates the mode of operation for complaints matched to flights. This quarter departing flights have been the main cause for concern. A trial departure flight path that moved some oubound traffic closer to the areas of Warnham and Rusper began operation on 17th February for a period of 6 months.
Gatwick airport provides a number of different methods for people to contact the airport about aircraft disturbance. As well as a low cost telephone line, individuals can email write, or contact us via our website' This graph illustrates how people have contact the airport about noise.
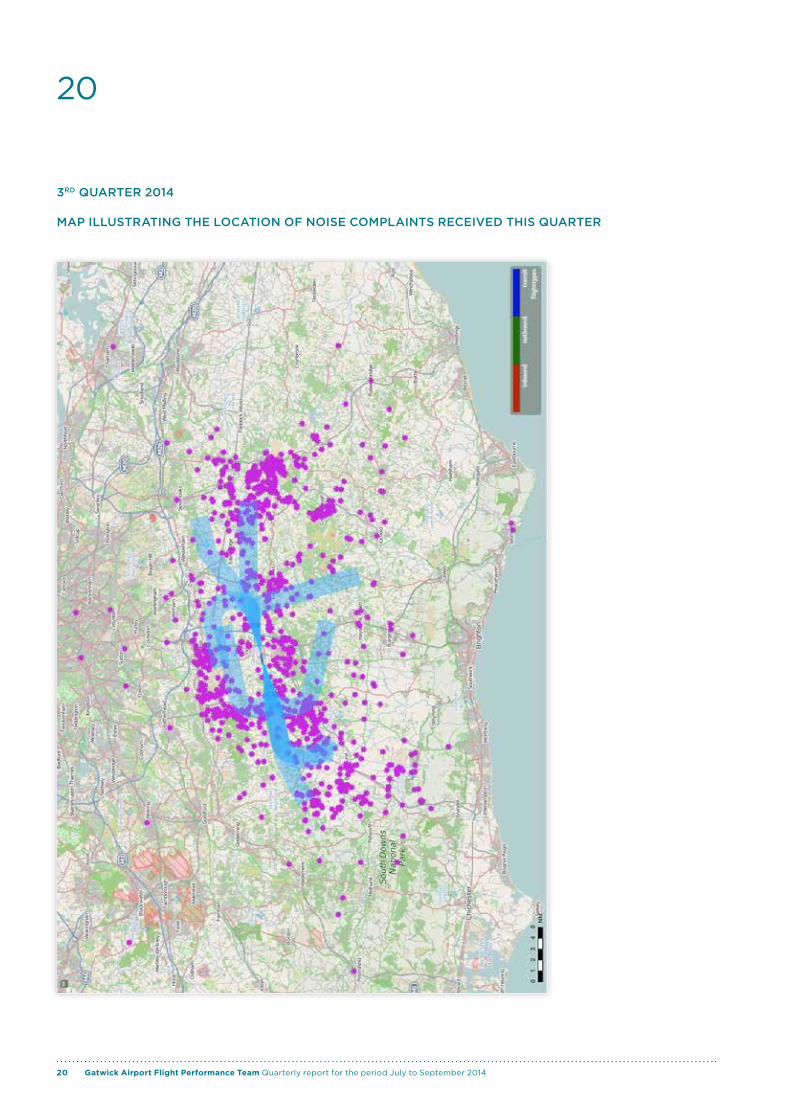
Although the areas closest to the airport generate the majority of complaints individuals from areas further from the airfield can also be disturbed by aircraft operations. This graph show the locations that generated the most complaints. (Some individals make numerous complaints so the areas where they live will be over represented.
0
500
1000
1500
2000
2500
3000
Jul-14 Aug-14 Sep-14
Method of complaint
Web
Letter
Telephone
0 100 200 300 400 500 600 700 800 900
Dorking Tunbridge Wells
Other Towns Billingshurst
Warnham Rusper
Betchworth Horsham
East Grinstead Reigate
Edenbridge Penshurst
Crawley Crowborough
Slinfold Redhill
Tonbridge Lingfield
Pulborough Broadbridge Heath
Horley Kingsfold
Complaints by town
Landing, 668
Takeoff, 895
Overflight, 189
Category of aircraft operation
Gatwick Airport Flight Performance Team Quarterly report for the period July to September 201420
3RD QUARTER 2014
MAP ILLUSTRATING THE LOCATION OF NOISE COMPLAINTS RECEIVED THIS QUARTER
20
Gatwick Airport Flight Performance Team Quarterly report for the period July to September 2014 21
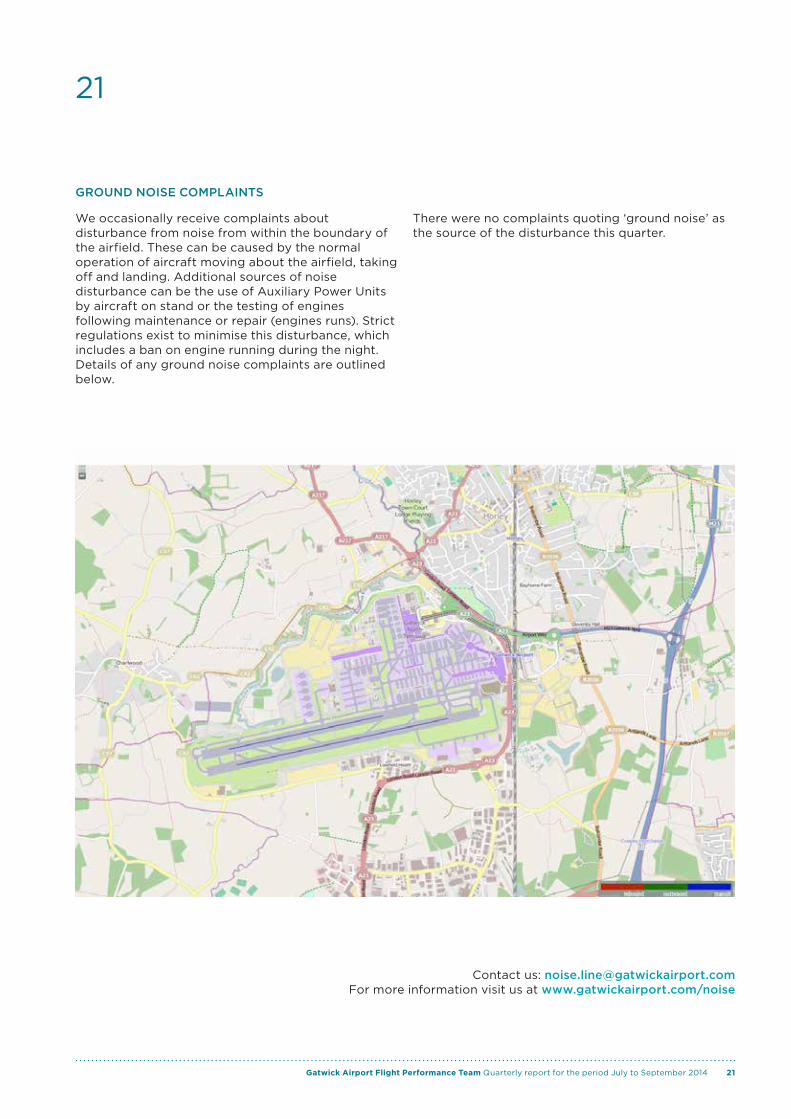
GROUND NOISE COMPLAINTS
We occasionally receive complaints about disturbance from noise from within the boundary of the airfield. These can be caused by the normal operation of aircraft moving about the airfield, taking off and landing. Additional sources of noise disturbance can be the use of Auxiliary Power Units by aircraft on stand or the testing of engines following maintenance or repair (engines runs). Strict regulations exist to minimise this disturbance, which includes a ban on engine running during the night. Details of any ground noise complaints are outlined below.
There were no complaints quoting ‘ground noise’ as the source of the disturbance this quarter.
21
Contact us: [email protected] more information visit us at www.gatwickairport.com/noise