Embed Size (px)
Citation preview
/THE GASIFICATION OF BIOMASS
IN COMMERCIAL DOWNDRAFT GASIFIERS/
by
SHYH-MING CHERN
B.S. ChE. National Taiwan University, Taipei, Taiwan, ROC 1979
A MASTER'S THESIS
submitted in partial fulfillment of the
requirements for the degree
MASTER OF SCIENCE
Department of Chemical Engineering
KANSAS STATE UNIVERSITY
Manhattan, Kansas
1985
Approved by
Ia)oI& P[^/MOMr<-v<iLy
Major Professor
LDJU> ACKNOWLEDGEMENTS
A11202 TMSSbfl
a
I with to express ay sincere gratitude to Dr. W. P. Walawender and Dr.
Li T. Fan whose guidance and encouragement was invaluable. Appreciation is
also extended to Dr. L. A. Glasgow for serving on the supervisory committee.
Thanks are also due to Kansas Agricultural Experiment Station, Kansas State
University and The Buck Rogers Co., Inc., Industrial Airport, KS. for
providing financial support.
Finally, a debt of gratitude is owed to my parents, Mr. and Mrs. Gin-Chow
chern for their constant spiritual support.
TABLE OF CONTENTS
CHAPTER 1 INTRODUCTION
REFERENCES CITED 1-4
CHAPTER 2 LITERATURE REVIEW
INTRODUCTION
MOVING BED GASIFIER - DOWNDRAFT TYPE
EXPERIMENTAL STUDIES ON DOWNDRAFT GASIFIERS
MODELLING CONSIDERATIONS
Pyrolysis of a Single Large Particle
Volume Reaction Models
Surface Reaction Models
Modeling of the Downdraft Gasifier
CONCLUDING REMARKS
REFERENCES CITED
2-1
2-4
2-6
2-7
2-10
2-12
2-16
2-18
2-19
2-21
CHAPTER 3 WOOD CHIP GASIFICATION IN A COMMERCIAL DOWNDRAFT GASIFIER
INTRODUCTION 3-1
EXPERIMENTAL FACILITIES AND PROCEDURE 3-2
Gasifier Description 3-2
Operating Procedure 3-3
Supporting Measurements 3-4
Feedstock 3-4
Measurement Scheme and Computations 3-5
RESULTS AND DISCUSSION
Results
Discussion
REFERENCES CITED
3-8
3-8
3-9
3-11
CHAPTER 4 MASS AND ENERGY BALANCE ANALYSIS ON A DOWNDRAFT GASIFIER
INTRODUCTION 4-1
MASS BALANCE ANALYSIS 4-3
Primary Balance Adjustments 4-4
Secondary Balance Adjustments 4-6
THERMODYNAMIC ANALYSIS 4-7
Background 4-8
Reference State 4-8
Energy Balance 4-8
Available Energy Balance 4-9
Thermodynamic Efficiencies 4-10
Computations 4-11
DISCUSSION 4-14
Material Balance Analysis 4-14
Thermodynamic Analysis 4-15
SUMMARY 4-17
REFERENCES CITED 4-18
CHAPTER 5 GASIFICATION OF WOOD PELLETS AND CHIPS IN A DOWNDRAFT
GASIFIER
INTRODUCTION 5-1
EXPERIMENTAL FACILITIES AND PROCEDURE 5-3
Gasifier Description 5-3
The Current gasifier 5-3
Comparison With the Previous Gasifier
Operating Procedure
Measurements
Direct Measurements
5-4
5-4
5-6
5-6
Indirect Measurements 5-7
Operating Parameters 5-8
Feedstocks 5-8
Bed Supports 5-9
Grate Rotation 5-9
Chemical and Physical Analyses 5-9
Feedstock properties 5-10
TREATMENT OF DATA 5-10
Calculations 5-10
Statistical Analysis 5-11
Means and Standard Deviations 5-11
Regression Analyses 5-12
RESULTS AND DISCUSSION 5-12
Results 5-12
Discussion 5-15
CONCLUSIONS 5-18
REFERENCES CITED 5-20
CHAPTER 6 CONCLUSIONS AND RECOMMENDATIONS
LIST OF TABLES
Page
CHAPTER 2 LITERATURE REVIEW
Table
1. Summary of Single Large Particle Pyrolysis Models 2-25
CHAPTER 3 WOOD CHIP GASIFICATION IN A COMMERCIAL GASIFIER
Table
1. Chip Size Distribution 3-12
2. Material Balance Summary 3-13
3. Performance Summary 3-14
4. Dry Gas Composition 3-17
CHAPTER 4 MASS AND ENERGY BALANCE ANALYSIS ON A DOWNDRAFT GASIFIER
Table
1. Material Balance Summary 4-20
2. Mass Balance Closures of Original Date 4-21
3. Elemental Compositions 4-22
4. Summary of the Primary Adjustment 4-23
5. Mass Balance Closures After Primary Adjustment 4-24
6. Summary of Mass Balance After Primary Adjustment
on Dry Ash Free Basis 4-25
7. First and Final Stages of the Secondary Adjustments 4-26
8. An Expirical Equation of Gasification of Wood Chips
in a Moving Bed Gasifier 4-27
9. Specific Chemical Enthalpy, Specific Chemical Exergy,
Datum Level Material and Datum Level Concentration 4-28
10. Summary of Enthalpy Evaluation 4-29
11. Summary of Exergy Evaluation 4-30
LIST OF FIGURES
Page
CHAPTER 2 LITERATURE REVIEW
Figure
1. Schematic Diagram of Updraft Gasifier (Reed. 1980)
2. Schematic Diagram of Downdraft Choke-Gas if ier
(Reed, 1980)
3. Schematic Diagram of a Straitified Downdraft
Gasifier with Representative Temperature Profiles
(Reed and Markson,1982)
4. The Pyrolysis and Combustion of Cellulose
5. Schematic Diagram of Time-Resolution Temperature
and Density Profiles for the Pyrolysis of a Large
Biomass Particle
2-26
2-27
2-28
2-29
2-30
CHAPTER 3 WOOD CHIP GASIFICATION IN A COMMERCIAL GASIFIER
Figure
1. Commercial Gasifier
2. Energy Output Versus Dry Chip Feed Rate
3-18
3-19
CHAPTER 4 MASS AND ENERGY BALANCE ANALYSIS ON A DOWNDRAFT GASIFIER
Figure
1. Schmatic Diagram of an Open Flow System
2. Schematic of the Gasifier
4-32
4-33
CHAPTER 5 GASIFICATION OF WOOD PELLETS AND CHIPS IN A DOWNDRAFT
GASIFIER
Figure
1. Commercial Gasifier 5-29

2. Char Yield Versus Rotation of Grate 5-30
3. Cold Gas Efficiency Versus Rotation of Grate 5-31
4. Air Input Versus Rotation of Grate 5-32
5. Cold gas Efficiency Versus Char Yield 5-33
6. Air Input Versus Char Yield 5-34
7. Energy Output Versus Dry Feed Rate 5-35

CHAPTER 1
INTRODUCTION
1-1
Increasing prices coupled with the instability and uncertainty in the
supply of fossil fuels and diminishing reserves has prompted the search for
alternate energy sources. In response, the conversion of biomass to energy
has gained attention. Biomass is renewable and generally low in sulphur.
Because it is renewable, it can be used without increasing the CO, content of
the atmosphere, and the low sulphur content is an asset for small-scale
utilization. The main disadvantages of biomass compared to fossil fuels are
its wide distribution (non-point source) and low energy density. The non-
point source nature of biomass makes large-scale processing costly due to high
transportation costs. The low energy density requires larger quantities to be
processed relative to fossil fuels for a given energy need. In this regard,
benefication processes (see, e.g.. Bain, 1980) are available for improving the
properties of biomass. Wood pellets are a prime example of improved biomass.
Wood is a major source of biomass. Currently, wood provides about 2% of
our total energy needs and could contribute up to 8% within the next decade
(Zerbe, 1981) . The annual harvest of woody biomass amounts to about 1 .4
billion tons in the US alone. Over 700 million tons of this material is not
used becanse it is not of the right species, size, fiber length, fiber
morphology etc. (Goldstein, 197 8). Thus the potential for the utilization of
wood to ensure a continuous supply of fuels and chemicals is significant.
Direct combustion of biomass is generally inconvenient and usually
environmentally unacceptable. Hence various technologies have been
investigated to convert biomass into more attractive fuels or chemicals.
Among these, gasification technologies are of particular interest due to the
versatility of gas and the convenience of use. Various types of reactors have
been used to gasify biomass; they include fixed beds, moving beds, entrained
beds, rotary kilns and fluidized beds. One of these technologies, the moving
1-2
bed downdraft gasifier, was studied in this thesis.
The objective of this thesis is to report on studies on the gasification of
woody biomass in two similar commercial moving bed downdraft gasifiers. The
study gathered complete material balance data and envaluated various
performance measures for the gasifiers. These included various input and
output stream rates, gas composition, material balance closure, gas yield, gas
heating value, total energy output, mass conversion efficiency and cold gas
efficiency. The influence of feed rate, type of feedstock, grate rotation
speed and type of bed support on the gasifier performance was also
investigated. Furthermore, an extensive mass and energy analysis was
conducted based on the material balance data from one of the gasifiers.
A literature review is presented in Chapter 2. This review focussed on the
gasification of biomass in moving bed downdraft gasifiers, including
experimental studies and modeling efforts. Since only biomass of the macro-
particle size is suitable for gasification in the downdraft gasifier, models
for the pyrolysis of a single large biomass particle were reviewed, as a
precursor to overall gasifier modeling. The single large particle models were
classified into volumetric reaction and surface reaction models.
Chapter 3 presents an experimental study on the gasification of wood chips
in the first gasifier. This study investigated the effect of feed rate on the
gasifier performance. The feed rate was proportional to the fan speed and was
varied from 27 to 126 xg/hr . Adequate data were gathered to evaluated
material balance closures for the experiments. The data were also used to
evaluate various gasifier performance measures.
Chapter 4 presents a detailed mass and energy analysis based on the
material balance data obtained in Chapter 3. The mass analysis resulted in an
1-3
experimental stoichiome try for the gasification of wood chips. This was
accomplished through a two level adjustment of the original data which forced
both the overall and elemental balances to perfect closure. The energy
analysis was based on the thermodynamic first and second laws. It evaluated
the first law and second law efficiencies for the process for various
operation modes (combinations of different usable products and output
temperatures). Various energy dissipations were also determined, including
the system heat loss, the ezergy loss due to the heat loss and the exergy
dissipation due to irreversibilities of the process.
Chapter 5 presents an experimental study on the gasification of wood
materials in the second gasifier, similar to the one used in Chapter 3. In
addition to the complete material balance data and evaluation of various
performance measures, this work focussed on the influence of some operating
parameters on the gasifier performance. The operating parameters studied
include the type of feedstock, the grate rotation speed, and the type of bed
support. Wood chips and wood pellets were used as feedstocks and the grate
rotation speed was varied from 3 to 14 min/rev. Bed supports consisted of a 9
cm layer of ceramic balls (2 cm diameter) on top of the grid plate (grate),
the grid plate with half of its available open area obstructed and the
unobstructed grid plate.
Chapter 6 summarizes the major conclusions of this thesis and outlines the
recommendations for extensions of this work.
1-4
REFERENCES CITED
Bain, R. , 'Benefication of Biomass for Gasification and Combustion, 'in A
Survey of Biomass Gasification, T.B. Reed, Ed., Vol. 3, 1-25,
SERI/TP-33-23 9(1980)
.
Goldstein, I. S., 'Wood as a Source of Chemical Feedstocks,' in Energy and
Environment Concerns in the Forest Products Industry, AIChE Symposium
Series 177, 74, 111-114 (1978).
Zerbe, J. J., 'The Contribution of Wood to the Energy Picture,' presented at
Conference on Wood - An Alternate Energy Resource for Application
Industry and Institutions, Proceedings published by School of
Engineering, North Carolina State University (1981).

CHAPTER 2
LITERATURE REVIEW
2-1
INTRODUCTION
The increasing price and the uncertainty in the supply of fossil fuels in
the 70's increased the need to search for alternative energy sources. In
response to this, the utilization of all kinds of organic wastes, including
biomass. has gained attention. Biomass has the potential of providing up to
20 fuel-quad equivalents per year in the US ( Inman .1980) ;furthermore, it can
also serve as a feedstock for industrial chemicals.
Biomass is renewable and. because of this, its utilization will not affect
the composition of atmosphere, especially C0 2# which has been recognized as a
potential threat to the entire planet. Furthermore, its very low sulphur
content is an asset for small-scale utilization. On the other hand, its wide
distribution (non-point source). low energy density and high degree of
diversity (species) are the main disadvantages compared to fossil fuels. IU
non-point source nature of biomass makes large-scale processing costly due U>
high collection and transportation costs. Its low energy density requires
larger quantities to be processed in order to obtain the same amount of
energy. The wide variety of species further complicates the processing of
biomass materials.
Direct combustion of biomass is generally inconvenient and usually
environmentally unacceptable. Hence various technologies have been
investigated to convert biomass into more attractive fuels or chemicals.
Among these, gasification technologies, which convert biomass into low BTU
gas, are of particular interest, due to the versatility of gas and the
convenience of use. The superiority of gaseous fuels over solid fuels is
evidenced by the fact that most existing industrial and residential heating
equipment are designed for gas. Gasification of biomass is one way to
2-2
supplement our supply of gaseous fuels.
Gasification is a rather loosely defined term. Generally speaking, any
process which converts organic materials (biomass as well as solid fossil
fuels) into gas as well as minor amounts of liquid hydrocarbons and solid
residues, may be called gasification. Gasification processes generally fall
into two categories, thermochemical and biochemical. In this thesis,
gasification will refer to thermochemical gasification which can be defined as
the process by which solid organic materials are decomposed at elevated
temperatures into gases as well as small amounts of liquid hydrocarbons and
solid residues with the introduction of controlled amounts of oxidizing agents
and heat. With the introduction of oxidizing agents and heat in various
amounts, it bears different names: pyrolysis, with only heat introduced;
pyrolysis-gasification, with both oxidizing agents and heat introduced; air or
oxygen gasification, with air or oxygen introduced as the oxidizing agent; and
in the extreme case, combustion, with enough oxidizing agent introduced to
insure complete oxidation. Reed et al.(1980) have presented an extensive
survey on the principles of biomass gasification, including the pyrolysis of
biomass, the thermodynamics of gas-char reactions and the kinetics of char
gasification.
Various types of reactors have been used to gasify biomass; they include
fixed beds, entrained beds, moving beds, rotary kilns, and fluidized beds.
Fixed bed and moving bed gasifiers have been used for quite a long time and a
few commercial units are presently available. The other technologies are
relatively new, and basically geared to large-scale operation; only very few
have attempted commercialization. Reed and Jantzen (1980) summarized the
state of gasifier research and the status of various gasifier manufacturers.
2-3
This introduction will only deal with the gasification of biomass in moving
bed gasifiers of the downdraft type, with attention focused on research
pertaining to some of the aspects of modeling and analysis of downdraft
gasifiers. The modeling of another type of moving bed gasifier, namely the
updraft type, has been reviewed in detail by Buekens and Schoeters (1985).
Moving bed gasifiers have been used to produce gas from biomass for more
than a century. The first gas producer was built by Bischof in 1839; later in
1878, it was adapted for power generation purposes by Dowson (Wyer, 1906).
Since then, numerous gas producers have been invented and the producer gas
industry emerged. Producer gas continued to be the major gas supply until
natural gas dominated the market in the 1930s; after that, almost all the
producer gas plants were closed. However, the fuel shortages in World War II
revived the interest in producer gas for a number of years. Due to the
scarcity of liquid fuels in Europe during World War II, the search for
domestically available fuels intensified and a great surge of activity in
designing and using gas producers resulted. In Sweden, approximately 75,000
vehicles (40* of the automotive fleet) were converted to producer gas
operation within two years. This experience was compiled by Swedish Academy
of Engineering, and was translated by Reed and Jantzen (1979) . After the war,
the need for gasifiers dwindled and only a minimum level of research was
maintained. The energy crisis in the past decade prompted a renewed search
for alternative energy resources, and moving bed gasifiers ones again obtained
attention.
MOVING BED GASIFIER - DOWNDRAFT TYPE
Moving bed gasifiers generally fall into one of two types, updraft or
downdraft, according to the flow patterns of solids and gas in the gasifier.
In an updraft gasifier, the solid phase moves slowly downward, while the
gaseous phase flows upward; the phases flow counter-current to each other. On
the other hand, both the solid and gaseous phases flow downward in a downdraft
gasifier; the phases flow co-current to each other. Downdraft gasifiers can
be further classified into two groups according to their structure, one with a
choke-plate and another without a choke-plate. Downdraft gasifiers with a
choke-plate have air (or oxygen) injected in the choke region. Downdraft
gasifiers without a choke-plate usually consist of a cylindrical column with
the air (or oxygen) flowing through the top of the bed to the reaction zone;
this type of gasifiers has been termed the 'stratified downdraft gasifier' by
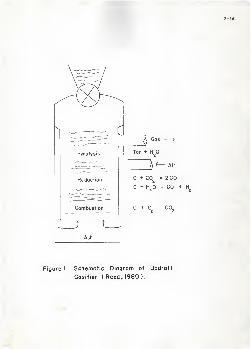
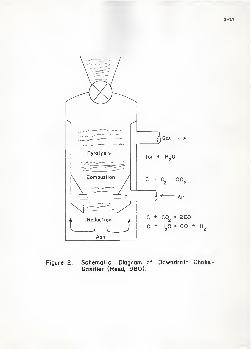
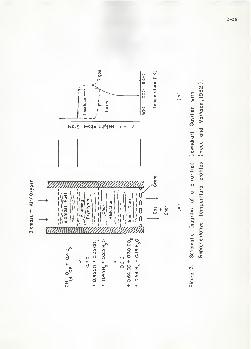
Reed and Markson (1982). Figures 1 and 2 (Reed. 1980) present schematic
diagrams of typical updraft and downdraft choke-type gasifier.s, respectively.
Figure 3 (Reed and Markson, 1 982 ) presents a schematic diagram of a stratified
downdraft gasifier.
Although the mechanical features of a moving bed gasifier are simple, the
physical and chemical processes in the reactor are extremely complex. For
convenience, the active region of the reactor is ideally divided into a
number of zones, as indicated in Figures 1-3. Due to the different flow
patterns, the sequence of reaction zones in an updraft gasifier is different
from that in a downdraft gasifier. With respect to the solids flow, the
updraft type has the sequence pyrolysis-reduction-combust ion, whereas the
downdraft type has the sequence pyrolysis-combustion-reduction. Furthermore,
the different flow patterns also result in significantly different performance
2-5
characteristics between the two types of gasifiers.
In an updraft gasifier, the solid phase moves in the direction of
increasing temperature, while the gaseous phase flows in the direction of
decreasing temperature. The solid phase is able to reduce to ash before
leaving the system by reaction with incoming air (or oxygen). On the other
hand, the volatile materials are carried by the gaseous phase into cooler
regions and hardly have a chance for further gasification. Consequently, the
product gas from updraft gasifier is rich in tar. Generally, this type of
gasifier is only suitable for fuels with low volatile content, like coal or
char
.
In a downdraft gasifier, although the highest temperature is in the middle
of the active region, the gas basically flows in the direction of increasing
temperature; this enables the volatile materials from the pyrolysis zone to be
cracked into permanent gases or combusted. However, the char can not react
with oxygen; therefore, a certain amount of char output from the downdraft
gasifier is unavoidable. The downdraft gasifier is usually suitable for fuels
with high volatile contents, like biomass.
The main difference between the choke-type and stratified downdraft
gasifiers is the location at which air (or oxygen) is injected. The choke-
type introduces air in the middle of the reaction zone, whereas the stratified
type introduces air at the top or both the top and the middle of the bed.
Reed and Mafkson (1982) measured temperature profiles in wood cylinders as
they descended through a stratified downdraft gasifier. The temperature
profiles are included in Figure 3. They concluded that the pyrolysis zone cr.d
combustion zone were indistinguishable, and therefore they combined them into
a single zone, called the 'flaming pyrolysis' zone.
2-6
The choke-type downdraft gasifier has been used extensively for over a
century; however, its scale-up has not been successful. The stratified
downdraft gasifier was only developed recently and in an attempt to provide a
basic design suitable for scale-up. The major limitation in the application
of any moving bed gasifier is the size of the fuel. A typical dimension of
1-3 cm for fuels is required to provide adequate bed porosity to allow
adequate flow of the gaseous phase and to avoid excessive pressure drop across
the bed. Unlike fluidized bed gasifiers, downdraft gasifiers have limited
means to control the ratio of feedstock to oxidizing agent. Instead, the
inputs and outputs of the gasifier are managed to achieve steady-state
operation, leaving the ratio of feedstock to oxidizing agent as an
uncontrollable parameter.
EXPERIMENTAL STUDIES ON DOWNDRAFT GASIFIERS
A large amount of literature is available which describes various aspects
of the design and operation of different types of downdraft gasifiers.
However, very few studies have been published which contain complete ml and
energy balances. Graham and Huffman (1981) investigated a commercial choie-
gasifier rated at 1 MJ/hr. They reported complete mass balances, thermal
efficiencies, mass conversion efficiencies and gas compositions with feed
species, moisture content, and size and quality of feedstock as operating
parameters. Walawender et al . (1985) reported on the performance of
commercial downdraft gasifier with a working capacity of 320 to 1,600 MJ/hr,
Complete material balances as well as gas composition were reported over a
wide range of throughput to examine the gasifier performance. These two
studies represent the only works which present complete material balances for
2-7
moving bed downdraft gasifiers in the open literature.
MODELLING CONSIDERATIONS
Despite the use of downdraft gasifiers for biomass gasification for over a
century, modeling attempts to describe this process have just started. Very
few attempts have been made to model the entire gasifier. However, more
fundamental studies, such as the analysis of the pyrolysis of small particles
have been conducted to investigate the kinetics of biomass pyrolysis. The
pyrolysis behavior of single large particles has also been investigated.
The reaction mechanisms involved in the pyrolysis of cellulosic materials
are extremely complicated. It is believed that numerous elementary reactions
take place in pyrolysis, in parallel and/or in series with each other.
However, details on the kinetics of these reactions are lacking, because of
the difficulty in isolating the individual reactions from eacn other.
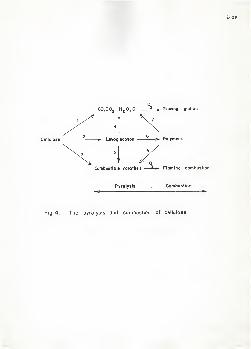
Shafizadeh (1968) proposed a conceptual mechanism for the pyrolysis of
cellulosic materials which represented numerous experimental observation;,, as
shown in Figure 4. As indicated in the figure, reactions 1, 2 and 3 refer to
the primary reactions and reactions 4, 5. 6, 7 and 8 refer to the secondary
reactions. The major product from the primary reactions is levoglucosan . The
secondary reactions further reduce the products from the primary reactions
(rich in tar) into lighter products (rich in permanent gases). When oxygen is
present, some of pyrolysis products burn to produce Ul0 ana cOj and release
heat
.
There is an alternate conceptual chemistry often used to describe the
gasification of biomass materials. The concept presents a qualitative
2-8
chemistry for pyrolysis by lumping the pyrolysis products into three major
classes, char(solid phase), tar( liquid phase) and gas(gaseous phase). The
virgin biomass is first thermally devolatilized to produce gas, char and tar.
Biomass ==> Gas + Char + Tar (1)
Some of the tar is then further cracked in secondary reactions to become gas.
Tar ==> Gas (2)
When oxygen is present, part of the product gas will burn to produce C0a and
H20.
Gas + 0, ==> C0j + HiO (3)
The combustion releases heat to maintain the temperature necessary for the
devolatilization of biomass and secondary reactions. The char (consisting
primarily of carbon) can then undergo gasification reactions with some of the
constituents of the gaseous phase, such as H2
(
HjO and COj
.
C + H, = CO + H a (4)
C + 2H, . CH, (5)
C + CO, = 2CO CS)
There are also reactions in the gaseous phase, such as the water gas shift
reaction.
CO + H2o = COi + H2 !7>
Two distinct solid-phase reactions are present in the downdraft gasifier,
the pyrolysis of virgin biomass and the gasification of char. Virgin biomass
is devolatilized in the pyrolysis zone to produce char and volatiles. The
char is then further reduced in the reduction zone to produce additional gas.
Due to the high volatile matter content of biomass (approximately 80%,' . the
pyrolysis step is a major consideration. In this regard, the modeling of the
pyrolysis of a single large particle is requisite to the modeling of a
downdraft gasifier. The fundamentals of char gasification have been reviewed
in detail by Graboski (1980).
2-9
Conceptually, the pyrolysis of a large biomass particle can be described by
integrating (over the whole particle) the local intrinsic decomposition and
the secondary reactions between the pyrolysis products. However, due to a
lack of complete knowledge of the secondary reactions (in particular, tar
cracking), it is natural that most of the models for the pyrolysis of large
particles are based only on the kinetics of the decomposition step. The
kinetics of the thermal decomposition of biomass have been explored primarily
with small particles. A number of works have been conducted with small
particles and these were recently reviewed by Milne (198*)). It kas been
postulated that the decomposition of biomass can be represented by an
Arrhenius-type kinetic expression, especially for cellulose. Since
experimental data can usually be fit quite well with a range of adjustable
parameters, first-order kinetics are often used for convenience. The
activation energies determined for cellulose with this approach ranged from 26
to 60 kcal/gmole(Milne,1980) .
Due to this wide range of activation energies, it is suspected that a
single-reaction kinetic model might not be adequate for the pyroiysis oi
cellulosic materials under all circumstances. Pitt (1962) »Sg$CSt«d a
multiple-reaction model with a distribution of activation energies for the
pyrolysis of coal. This model assumed that there were macy iirst-order
parallel reactions competing with each other, and that the number of reactions
was large enough to allow the use of a continuous probability function as
follows
/°f(E)dE = 1 (8)
where E designates the activation energy and f(E)dE is the fraction of the
reactions which have an activation energy from E to E+dE. The activation
energy distribution functions, f(E), is determined experimentally. Pitt used
2-10
this model to describe his thermogravimetric data for the devolatilization of
coal. Furthermore, Raman et al. (1981) applied this model to describe the
devolatilization of feedlot manure.
The heat of pyrolysis, while still controversial, is generally suggested to
be endothermic, when the secondary gas phase reactions and char gasification
reactions are not important.
Pyrolysis of a Single Large Particle
When a biomass particle of significant size is pyrolyzed, heat and mass
transfer effects must be taken into account. Biomass is usually a poor heat
conductor and. when subjected to heat, significant temperature variations may
exist within the particle. On the other hand, the pyrolysis rate, at 25CC or
higher, is considerably faster than the heat transfer rate. Whenever the
temperature inside the particle reaches 250"C or more, pyrolysis initiates and
begins to convert the solid phase into volatiles. The volatiles have
specific volume which is 2 to 3 orders of magnitude greater than the specific
volume of the solid. Therefore, the large volume of the generated gaseous
phase results in a vigorous gas stream bursting out of the particle at a
significant velocity. The magnitude of this phenomenon can be illustrated
from Reed and Markson's (1962) estimation that the velocity of gas emerging
from a pyrolyzing particle subject to a relatively high temperature (900°C or
higher) may be as high as several cm/sec. The escaping gases not or.ly carry
away a significant amount of sensible heat but they also hinder heat transfer
to the interior of the particle .which limits the supply of the energy needed
for the endothermic pyrolysis reaction. Consequently, the heat and mass
transfer effects result in a wave like temperature profile traversing into the
2-11
particle. The pyrolyzing front driven by the impeded heat transfer moves
inward with a growing char layer left behind. A schematic of the temperature
and density profiles in a biomass particle during pyrolysis is shown in Figure
5. This conceptual model is supported by temperature and density profile
measurements in a single biomass particle, e.g. Kanury, 1966; Maa and Bailie,
1973; and Belleville et al., 1982. The model leads to the conclusion that the
pyrolysis of a large biomass particle is heat- transfer limited.
While emerging from the particle, the volatile materials generated by
primary pyrolysis have a higher probability to further react within the
gaseous phase or with the hot char layer in a large particle than they do in
small particles. This phenomenon accounts for the differences in the end
products of pyrolysis between large and small particles. For instance, Chan
and Krieger (1983) reported the product distributions from the pyrolysis of s
wood cylinder (radius 0.5cm) under fire-level radiation to be char 25.1%. tar
62.4% and gas 12.5%, whereas the product distribution from the pyrolysis of
fine particles of white fir under fast heating (about 1000°C/s), reported by
Brink and Mossoudi (1978), was char 2.5%, tar 7.1% and gas 90%. Roy et al
.
(1983) studied the effect of particle size on the product distribution for the
pyrolysis of wood. They reported the product distribution for the pyrolysis
of aspen wood under slow heating conditions (lOT/min) for three different
particle sizes, chips (about 2x2x0.5 cm), pins (about 1x0.3x0.3 cm) and wood
flour. The product distribution for chips was oils 50.7%, water 16.3%. char
20.4% and gas 12.6%; for pins, oils 56.9%, water 13.9%, char 18.1% and gas
11.1%; and for wood flour, oils 60.8%, water 12.8%, char 15.8% and gas 10.6%.
Despite the complicated reaction mechanism, and the mass and heat transfer
processes involved in the pyrolysis of a single large biomass particle, a
number of models have been proposed to predict the pyrolysis behavior. These
2-12
models generally fall into two groups, one based the 'volume reaction' concept
and the other based on the 'surface reaction' concept. Several representative
models in each group are summarized in Table 1 and outlined as follows.
Volume Reaction Models
Bamford et al. (1946) proposed the first model for the pyrolysis of wood.
This model considered the heat conduction of the solid , the heat of reaction
and Arrhenius kinetics. Convective and radiative heat transfer were
considered in the boundary conditions. The model satisfactorily predicted the
central temperature versus time curve for the combustion of a wood slab.
Matsumota et al . (1968) extended Bamford's model to incorporate convective
heat transfer within the particle with a temperature dependent thermal
conductivity and applied it to the thermal decomposition of plastics.
However, in their formulation they divided the space-time region into three
distinct zones, namely the char, pyrolysis, and virgin material zone.
Consequently, three sets of partial differential equations were used to
describe the three zones. The oxidation of char at the particle surface mi
also included in the model which resulted in a recession of the char surfsce
(particle surface). The prediction of the penetration velocity of the
pyrolysis front (interface between the char and pyrolysis zones) and t*e
recession velocity of char surface using this model was in good agreement with
the experimental data. It was concluded that the temperature at the pyrolysis
front was almost independent of the heat input at the particle surface and
that it remained almost constant at 920°K over the course of the
decomposition.
Kung (1972) developed a model for the pyrolysis of a wood slab, using
density dependent thermal properties (specific heat and thermal conductivity)
.
2-13
The effects of slab thickness, char thermal conductivity, and the
decomposition endo thermicity on the pyrolysis rate were examined. It was
found that (1) the pyrolysis rate of a thermally thick slab (in their case,
>lcm) was quite sensitive to the char conductivity and endothermici ty. while
that of a thermally thin slab (in their case, <0.02cm) slab was insensitive to
these parameters, and (2) a precise estimation of the thermal conductivity of
char for the pyrolysis of the thermally thick slab was important due to its
pronounced influence on the pyrolysis rate. Kung did not compare the results
from his model with experiment due to the lack of suitable experimental data.
Havens et al . (1972) proposed a model for the pyrolysis of a large
particle, which allowed the direct use of the data from differential scanning
calorimetric and thermogravimetric measurements on small particles of the same
material. As a result, no explicit kinetics were required and the ben of
reaction was implied in the enthalpies of the solid and gaseous phases. The
model was successfully applied to the prediction of the transient temperature
distribution and volatile product evolution rates in the decomposition of wood
cylinders. Application of their model required the following information (1)
energy capacity data (total heat input required for a unit temperature
increase per unit mass) obtained directly from a DSC, (2) weight loss data
obtained directly from a TGA, and (3) experimentally measured values of the
thermal conductivities for virgin wood and char at temperatures above 400°C.
The requirement for extensive experimental data was the major disadvantage of
their model and makes it semi-empirical.
Fan et al. (1977) proposed a mathematical model for pyrolysis, in which an
effective diffusivity was used to account for the overall effects of molecular
diffusion, eddy diffusion and convective flow. However, the authors pointed
out that since pressure effects and size variations were neglected, the model
2-14
only applied to systems with a small fraction of pyrolyzable material under a
slow heating conditions.
Kansa et al . (1977) incorporated the momentum balance into the modeling of
wood pyrolysis. Their model included convective heat transfer between the
solid and the gaseous phase, in contrast to the local thermal equilibrium
assumed by other investigators. However, this effect was dropped out later in
order to make numerical solution of the equations feasible. The predicted
temperature distribution within a 5 cm slab almost coincided with the
experimental data. The model also predicted the shape and magnitude ol the
pressure history within the particle, however the predicted pressure peak had
a time lead of about 2 minutes compared to the experimental data. It was
found that the pressure development within the particle was significantly
influenced by the permeabilities of wood and char. The smaller the
permeabilities, the greater the pressure build-up within the particle. when
the permeability of char was small enough, oscillations (similar to a se<oiid-
order damped response) in the pressure history as well as the pyrolysis rate J
were predicted by the model. This oscillatory phenomenon has not been
observed experimentally,
A simple model for the pyrolysis of a wood cylinder was developed by
Belleville et al . (1982). Surprisingly, only Fourier's law of heat conduction
appeared in the energy balance with the thermal conductivity as a parameter.
They experimentally measured the temperature in the center of cylinders as a
function of time. Three different values of thermal conductivity were used
over three consecutive temperature ranges. Their thermal conductivity vajues
were determined by fitting the temperature- time curves. Consequently, the
overall mass and heat transfer effects were lumped into the effective thermal
conductivity parameter. The energy balance yielded the time-resolution
2-15
temperature distribution inside the particle. With the temperature
distribution determined, the density distribution was then calculated using
first-order kinetics. This model predicted the weight loss versus reaction
time quite well.
The pyrolysis of cellulosic materials usually proceeds with some size
reduction. This effect, ignored by most investigators, was incorporated in a
recent model proposed by Villermaux et al. (1983). The particle was assumed
to have a uniform density profile over the course of pyrolysis with the local
ratio of volatiles to char varying. As the volatiles escaped, the particle
was required to shrink to maintain a uniform density profile. Consequently,
the remaining char had a density equal to the virgin solid. This behavior
contradicts the experimental observation that the density of du is
considerably lower than that of virgin solid. Consequently, this model Ma
not be applied to materials with a high volatile matter content, like bioiuass.
All of the models discussed so far have focused on the time for complete
pyrolysis or the influence of heat transfer rate or the rate of weight loss.
No effort has been made to incorporate the secondary reactions or to predict
the product distribution. It is generally recognized that the telative
amounts of volatiles and char vary with the heating history, the nature of tht
secondary reactions and the particle size ( see . e .g . .Robert s ,1 970) .Chan and
Krieger (1983) recently proposed a model for the prediction the relative
amounts of gas, tar and char. The primary decomposition reaction as well as
secondary reactions of the gases and tars were taken into account id their
model. The model predicted the temperature profile within the particle and
the relative amounts of char, tar, and gas for the pyrolysis of wood slab
fairly well.
2-16
Surface Reaction Models
The unreacted shrinking core model was first applied to the pyrolysis of
cellulosic materials by Maa and Bailie (1973) . Decomposition was assumed to
proceed only at the boundary between the char layer and the unreacted core,
while the temperature within the core was assumed to be uniform and the same
as that of reacting boundary. The boundary moved slowly towards the center of
the particle as pyrolysis progressed. The pseudo-steady state assumption was
imposed to facilitate numerical solution. One advantage of this model was the
ease of solution of the system of equations, which were reduced to ordinary
differential equations by the use of pseudo-steady state assumption. A
sensitivity analysis was conducted to determine the effects of the model
parameters. The most significant parameters were found to be the wall
temperature, activation energy, frequency factor, effective thermal
conductivity, heat of reaction and solid density. They indicated that
pyrolysis was controlled by two competing mechanisms, the heat transfer raie
and kinetic reaction rate. They proposed a criterion to determine the
controlling mechanism based on the particle size and wall temperature. For a
large particle (in their case, > 3 cm), pyrolysis was in the heat transfer
controlled region, and the time for complete pyrolysis (r) was estimated (in
their case) from
t = r»pAH/(240ke (To-Tc ))
(9)
where r, p, AH, k, To and Tc
represent the radius of the particle, the
density of solid, the heat of reaction, the effective thermal conductivity,
the surface temperature of the particle and the temperature of the unreacted
core. For a small particle (in their case. < 0.1 cm), pyrolysis was in the
reaction controlled region and the time for complete reaction was estimated
(in their case) from
2-17
f = r/(60koe"E/RT
) U°>
where k„( £, R, and T represent the frequency factor, activation energy, gas
constant and local temperature. For a particle of intermediate size, both
heat transfer and reaction rates need to be considered.
An interesting 'Phase-change' model, aimed at simplifying the mathematics
of modeling the pyrolysis of cellulosic materials, was proposed by Derosiers
and Lin (1983). The main feature of their model was that a kinetic expression
was not needed. The solid was assumed to decompose into char and volatiles
immediately when its temperature reached a prescribed temperature, which was
treated as an experimentally determined parameter. As the particle was
heated, a phase change like boundary shifted toward the center of the
particle. Behind the boundary only a char layer remained, while ahead of the
boundary temperature variation within the virgin solid was allowed. The model
predicted the central temperature and weight loss of the particle versus time.
Unavoidably, most these models include complicated mathematical equations;
coupled mass and energy balance partial differential equations and/or kinetic
expressions. The effort required in obtaining numerical solutions is often
quite formidable. Still, considerable experimental work is needed in order to
independently determine the parameters required for a specific model. Th.ise
models may find very limited application for design and prediction purposes,
especially in real gasifiers. For example, in a moving bed gasifier, the
properties of the gaseous phase (i.e. the environment surrounding the
particles) vary significantly within the gasifier. These properties include
the temperature, composition, velocity and pressure (although pressure effects
are often negligible). Consequently, the modeling of a moving bed gasifier is
much more complicated than for a single particle.
2-18
Modeling of the Downdraf t Gasif ier
Although the downdraft gasifier has been used for the gasification of
biomass for over a century, modeling efforts are just beginning. The behavior
of the particle and gas phases combine to give the performance of a gasifier.
However no modeling work for the entire moving bed gasifier, based on the
single particle model, has been successful. To date there has been only one
single particle model (Derosiers and Lin; 1983) ever used to estimate the
temperature profile in the pyrolysis zone of an updraft gasifier.
A recent review by Buekens and Schoeters (1985) summarized the modeling
efforts for moving bed gasifiers. However, the models were all based on
updraft gasifiers with coal and low volatile content materials as the fuel.
The behavior of a downdraft gasifier is quite different from that of an
updraft type. The major reaction for biomass fuels is pyrolysis, whereas for
coal and other low volatile content materials it is gasification. These basic
differences make the models for updraft gasifiers not readily applicable to
the downdraft type.
The work of Reed and Markson (1982) seems to be the first work to attempt
to directly model a downdraft biomass gasifier. Their model divided the
active portion of the gasifier into two major sections, a flaming pyrolysis
zone and a char reduction zone. They based their analysis of the flamins
pyrolysis zone on Huffs (1985) empirical equation, which correlated the time
required to complete flaming combustion of a particle with temperature,
particle size, shape, density and moisture content. They modified Huff's
equation to incorporate the depletion of oxygen and developed an equation for
estimating the time to complete flaming pyrolysis at a given temperature. In
a gasifier, the temperature as well as oxygen concentration changes with axial
2-19
position; therefore, an experimentally determined correction factor was
required to determine the flaming pyrolysis time. With a given solid flow
rate, the length of the flaming pyrolysis zone could then be determined. For
the char reduction zone, the time and hence bed length was determined using
first-order kinetics for the Boudouard reaction.
Reed et al. (1983) proposed a mathematical model to predict the temperature
and composition of the product exiting pyrolysis zone, and to simulate the
temperature aud composition profiles of the gas and solid phases in the char
reduction zone. The output from the pyrolysis zone served as the input for
the char reduction zone.
CONCLUDING REMARKS
This brief review is aimed at improving the understanding a particular
biomass gasification processes; downdraf I gasification. Special attention has
been given to some of the modeling aspects. Due to the transport phenomena
limitations, only biomass cf the macro-particle size is suitable for
gasification in the downdraft gasifier. As a precursor to gasifier modeling,
models for a single large particle are required. However, these models are
often too complex to be used in the mathematical modeling of the complete
gasifier. In this regard, experiments are always required to correlate the
model predictions with the operating parameters of a specific gasifier. Well
developed models for prediction and design purposes are still lacking.
Actually, the gasifiers that are in operation today have been designed by
experience
.
A large number of studies have concentrated on various aspects of the

2-20
design and operation of different downdraft gasifiers. Very few experimental
results have been reported concerning the modeling aspects of a general
gasifier. Those experimental results reported have focused only on the mass
and energy balances. To date, no work has been attempted to investigate the
influence of momentum transfer in a downdraft gasifier in which the flowrates
of gases and solid, temperature and the size of solids change with position.
2-21
REFERS)CES CITED
Bamford, C. H. , J. Crank, and D. H. Malan, 'The Combustion of Wood. Part I,'
Proceedings of the Cambridge Philosophical Society, 42, 166-182 (1946)
.
Belleville, P., R. Capart, and M. Gelus, 'Thermal Degradation of Wood
Cylinders,' in '2nd E.C. Conference on Energy from Biomass,' A. Strub et
al,, Eds.. Applied Science Publishers, London and New York, 914-918
(1982) .
Brink, D.L., and M.S. Massoudi, 'A Flow Reactor Technique for the Study of
Wood Pyrolysis. I. Experimental ,' J. Fire and Flammability , 9, 176 (1978).
Buekens, A. G. , and J. G. Schoeters, 'Modelling of Biomass Gasification,' in
Fundamentals of Thermochemical Biomass Conversion, Elsevier Science Pub.
Co., New York, 619-690 (1985).
Chan, R., and B. B. Krieger, 'Modeling of Physical and Chemical Processes
During Pyrolysis of A Large Biomass Pellet with Experimental
Verification,' Prep. Papers, Am. Chem. Soc, Fuel Chem. Div., 28:5,
390-397 (1983) .
Derosiers, R. E. , and R. J. Lin, 'A Phase-Change Approach to Macro-Particle
Pyrolysis of Cellulosic Materials,' Prep. Papers, Am. Chem. Soc, Fuel
Chem. Div., 28:5, 338-383 (1983).
Fan, L. T. , Liang-Shin Fan, Kei Miyanami, T. Y. Chen, and I. P. Walawender.
'A Mathematical Model for Pyrolysis of a Solid Particle-Effects of the
Lewis Number,' CaD . J. Chem. Engg. 55, 47-53 (1977).
Graboski, M. , 'Kinetics of Char Gasification Reactions,' in 'A Survey of
Biomass Gasification,' Reed, T. B. , Ed., Vol. 2, 177-218, SER1/TP-33-23
9
(1980) .
Graham, R. G. , and D. R. Buffman, 'Gasification of Wood in a Commercial-Scale
Downdraft Gasifier,' in Symposium Papers, Energy from Biomass and Wastes
V (Institute of Gas Technology), 633-650 (1981).
2-22
Havens, J. A., H. T. Hashemi, L. E. Brown, and J. R. Welker, 'A Mathematical
Model of the Thermal Decomposition of Wood,' Comb. Sci. Technol. 5,
91-98 (1972)
.
Huff, E. R., 'Effect of Size, Shape, Density, Moisture and Furnace Temperature
on Burning Times of Wood Pieces,' Presented at the International
Conference on Fundamentals of Thermochemical Biomass Conversion, Estes
Park, CO, 18-22 Oct. 1982. Proceedings of this conference published by
Elsevier Science Pub. Co., New York (1985).
Inman, R. , 'The Potential Biomass Resource Base,' in A Survey of Biomass
Gasification, T.B. Reed, Ed., Vol. 2, 11-19. SERI/TP-33-23 9 (1980).
Kansa, E. J., H. E. Perlee, and R. F. Chaiken, 'Mathematical Model of Wood
Pyrolysis Including Internal Forced Convection,' Combustion and Flame 29,
311-324 (1977)
.
Kanury, A. M. and P. L. Blackshear, Jr., 'An X-ray Photographic Study of the
Reaction Kinetics of a-Cellulose Decomposition,* Pyrodynamics , 4, 285-298
(1966)
.
Kung, Hsiang-Cheng, 'A Mathematical Model of Wood Pyrolysis,' Combustion and
Flame 5, 91-98 (1972).
Maa, P. S., and R. C. Bailie, 'influence of Particle Sizes and Environmental
Conditions on High Temperature Pyrolysis of Cellulosic Material-
KTheoretical) ,' Comb. Sci. Technol. 6, 1-13 (1973).
Matsumoto. T. , T. Fujiwara, and J. Kondo , 'Nonsteady Thermal Decomposition of
Plastics,' 12th Symposium (International) on Combustion, The Combustion
Institute, Pittsburgh, 515-524 (1968).
Milne, T. , 'Pyrolysis- The Thermal Behavior of Biomass Below 600°C,' in 'A
Survey of Biomass Gasification,' T. B. Reed, Ed.. Vol. 2, 95-132,
SERI/TP-33-23 9 (1980).
Pitt, G.J., 'The Kinetics of the Evolution of Volatiles Products from Coal,'
2-23
Fuel, 41, 267 (1962).
Raman, K. P., W. P. Walawender, L. T. Fan and J. A. Howell, 'Thermogravimetric
Analysis of Biomass. Devolatilization Studies on Feedlot manure,' I.E.C.
Process Design and Development, 20, 630-636 (1981).
Reed, T.B. , 'Types of Gasifiers and Gasifier Design Considerations,' in A
Survey of Biomass Gasification, T.B. Reed, Ed., Vol. 3, 1-25,
SERI/TP-33-239U980) .
Reed, T.B. , Ed., 'Current Technology and Research,' in A Survey of Biomass
Gasification, Vol. 3, 1-25, SERI/TP-33-239(1980)
.
Reed, T. B. , and D. E. Jantzen, Ed., A Survey of Biomass Gasification, Vol.
1-3, SERI/TP-33-239U980) .
Reed, T. B. , and D. E. Jantzen, 'Generator Gas - The Swedish Experience from
1939-1945,' (translated from the work of the Swedish Academy of
Engineering) SERI/TP-33-23 9 (1980).
Reed, T. B. , and M. Markson, 'A Predictive Model for Stratified Downdraft
Gasification of Biomass,' Presented in Proceedings of the 14th Biomass
Thermochemical Conversion Contractors Meeting. Atlanta, GA (1982)
.
Reed, T. B. . B. Levie , M. Markson and M. S. Graboski, 'A Mathematical Model
For Stratified Downdraft Gasifiers,' Prep. Papers, Am. Chem . Soc . , Fuel
Chem. Div., 28:5. 410-421 (1983).
Roberts, A. F.. Combustion and Flame 14, 261-272 (1970).
Roy, Christian, Bruno de Caumia and Pierre PLante, 'Production of Liquids from
Biomass by Vacuum Pyrolysis-Development of Data Base For Continuous
process,' in Symposium Papers, Energy from Biomass and Wastes VII
(Institute of Gas Technology), 1147-1167 (1983).
Shafizadeh, F. , 'Pyrolysis and Combustion of Cellulosic Materials,' in
Advances in Carbohydrate Chemistry. M.S. Wolfrom, R.S. Tipson Eds., 23,
419-47 4 (196 8) .
2-24
Villermaux, J., B. Antoine, J. Lede and F. Soulignac, 'A New Model for Thermal
Volatilization of Solid Particles Undergoing Flash-Pyrolysi s, ' Prep.
Papers, Am. Chem . Soc . , Fuel Chem . Div . , 28:5, 330-337 (1983).
Walawender, W. P., S. M. Chern, and L. T. Fan, 'Wood Chip Gasification in a
Commercial Downdraft Gasifier,' in Fundamentals of Thermochemical Biomass
Conversion, Elsevier Science Pub. Co., New York, 911-922 (1985).
Wyer, S. S. , in 'Catechism on Producer Gas,' Chap. 3, 26-27, New York, McG
Publishing Company (1906)
.
!raw
£ «
2-25
— O
3 a
2-26
Figure I. Schematic Diagram of Updraft
Gasifier ( Reed, 1980).
2-27
Figure 2. Schematic Diagram of Downdraft Choke -
Gasifier (Reed, 1980).
2-2!
— a
aiojg aAoqv m6|8H
c\j
CD91
D5
* so tro —
<+
o
xo
Ou
or1
IT,
CO
O o+ +o<Jm
*o O+ +
ooorO
d+o
o+
o+
— c
co tr
2-29
Cellulose
CO.CCL ,H 0,C ?—». Glowing ignition
> Levoglucosan * Polymers
Combustible volatiles ?-»• Flaming combustion
Pyrolysis Combustion
Fig 4. The pyrolysis and combustion of cellulose.
2-30
p (»,t)
Time-. I > t
T(x,t)
(Surface;
Figure 5. Schematic Diagram of Time - Resolution Temperature
and Density Profiles for the Pyrolysis of a
Large Biomass Particle.
CHAPTER 3
WOOD CHIP GASIFICATION
IN A COMMERCIAL DOWNDRAFT GASIFIER
3-1
INTRODUCTION
Fixed-bed and moving-bed gasifiers for the production of low Btu gas from
wood and charcoal were widely used in Sweden and other countries during the
World War II era. The Swedish experience was compiled by the Swedish Academy
of Engineering, and this work was recently translated by Reed and Jantzen
(197 9) . After the war, the need for gasifiers dwindled although the Swedes
continued their development efforts.
Following the Arab oil embargo, rapidly rising prices for petroleum coupled
with projections of potential near- term petroleum and gas shortages prompted
the search for alternative energy sources. In response to this effort,
gasification technology has been resurrectsed and low BTU gas production
became one of the major options for alternative energy in the United State?.
Reed et al. (1980) reviewed the state of the art in gasification technology
and summarized the status of a number of commercial and research efforts in
the field.
Although the literature contains a vast amount of information on various
facets of the gasification of wood and biomass in fixed-bed and moving-bed
gasifiers, very little has been published on the complete material balance for
these gasifiers. In fact, many gasifiers have been constructed with little or
no quantitative information on the gasifier performance. Graham and Huffman
(1981) presented detailed information on the Biomass Corporation gasifier;
this appears to be the only compl ete material balance ana lysis of a moving bed
gasifier in the open literature.
The present work reports the material balances and performance of a
recently commercialized downdraft gasifier, the Buck Rogers ' Gasaf ire 'TM. The
3-2
gasifier, rated to produce 320 tol600 MJ/hr, was evaluated over its working
capacity range and was found to be remarkably consistent in terms of gas
yield, gas composition, gas heating value and other measures characterizing
its performance.
EXPERIMENTAL FACILITIES AND PROCEDURE
Gasifier Description
Figure 1 presents a schematic representation of the commercial gasifier
used in this study. It is unique in that there is no throat or choke plate to
support the bed. A fan located downstream from the gasifier draws air through
the chip bed as well as the tuyeres. A feed bin and a screw feeder (not shown
in Figure 1) supply chips to the top of the gasifier each time the bed height
drops to a set level, controlled by an electric eye. The fan motor also
drives the cyclone rotary valve and the 'airgitator' gearbox througn a series
of speed reducing pulleys and gears. Consequently, the fan speed controls the
air intake, chip feed, gas production and char output rates. The 'airgitator'
rotates very slowly at 20 to 30 minutes per revolution and has several
functions, listed below:
(l)It provides secondary air, through the tuyeres.
(2)It levels the feed at the top of the bed.
(3)It slowly mixes material throughout the gasifier.
(4)It generates a grinding motion in the ceramic ball bed which, in turn,
reduces the char size so that it can percolate through the ball bed and
finally through the grid plate.

3-3
(5)Coupled with ball bed and the grid plate, it serves as the support for
the bed.
Gas and char flow out of the gasifier through the grid plate. The fan
suction draws them out of the base of the gasifier and blows them through the
cyclone where the char is separated from the gas. the gas stream is then sent
to a flare stack (not shown in Figure 1) where it is incinerated.
Operating Procedure
The procedure used in operating the gasifier is outlined below.
1. S;art-up. The fan was started at low speed, and propane was introduced
into the flare stack and ignited. Next the feeder was manually operated to
fill the gasifier just above the tuyeres. The bed was then ignited with an
electric fire starter and the fan speed was increased. The fire was allowed
to develop for 15 to 20 minutes. Then chips were added to fill the gasifier
and the fan speed was increased. As gas production increased, the propane
rate was decreased and finally shut down. The fan speed was then gradually
increased to the desired operating condition and the reactor was allowed to
stabilize. This procedure normally required two hours to complete.
2. Char and feed measurements. Char was measured by direct collection over 30
minute intervals. Chip feed was measured by a procedure to be detailed later.
Both of these measurements were conducted over a five hour period starting
after the completion of step 1.
3. Gas analysis and condensables measurement. One hour after the char and
feed measurements were started, a small gas stream was drawn for gas analysis
and condensate determination. The specific procedures will be detailed later.
3-4
These measurements were conducted for two hours.
4. Tracer gas measurement. Nitrogen tracer gas was introduced to the product
gas at a known rate, and the gas analysis and condensate measurements were
repeated. The specific procedures are detailed later. These measurements
were conducted for one hour.
5. Post tracer measurements. Step 3 was again repeated without the tracer
gas for a one hour period. 6. Shut-down. The chip feed was stopped and the
fan speed was increased to accelerate complete consumption of the chips. This
normally required one hour.
Supporting Measurements
The supporting measurements included moisture and ash analyses of the feed
and elemental analysis of the feed. Moisture was determined in a muffle
furnace by standard ASTM procedure. The elemental analysis ol feed was
conducted with the aid of a Perkin-Elmer Model 240b Elemental Analyzer.
Feedstock
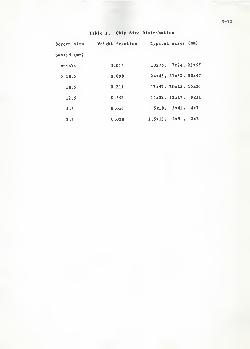
The feed material used in this work was a mired hardwood chip. The average
chip screen size was 14 mm; the approximate size distribution is given in
Table 1. The chips were free of bark and were pre-dried to 6 - 17% moisture
(wet basis). The elemental analysis of the dry chips was fairly constant over
the course of the experiments. The average analysis was C, 48.31*; U, 5.94%;
0, 44.77%; N, 0.18%; ash, 0.80%. The average higher heating value of the dry
chips, estimated from the Dulong formula, was 16.82 MJ/kg.
3-5
Measurement Scheme and Computations
The objective of the present work was to gather complete material balance
data for the gasifier and to evaluate the gasifier performance. Because of
the configuration of the gasifier and the stream flow rates involved, it was
not convenient to measure all of the stream rates directly; consequently,
indirect methods were devised.
The two quantities directly measured were the char output rate and the dry
gas composition. Char output was determined by collecting and weighing the
char over 30 minute intervals for approximately a five hour period. The gas
analysis was conducted with an Applied Automation on-line process gas
chromatograph (GC) which drew a continuous sample from points downstream of
the cyclone. The GC had a cycle time of about 11 minutes and was able to
detect the following components in the producer gas: fl 1# COi, CO, CH4 , 2 and
N2 along with traces of C 2H« , C 2H, and C 3 H« . It was believed that the 2 in
the producer gas resulted from air leaks in the fan seal and the gas sampling
system. Consequently all compositions were converted into an air-free basis.
Product gas compositions were determined from the average of the pre and post
trace gas analyses.
The dry product gas rate was indirectly determined with the aid of a tracer
technique. Nitrogen tracer was introduced into the product gas at a known
volumetric rate at a point just upstream from the fan. The gas composition
was then measured with the tracer flowing over a one hour period to insure
steady state compositions. From the known tracer, the dry gas volumetric flow
rate could be readily evaluated. Knowing the molecular weight of the gas
allowed the stream rate to be converted to a mass basis.
3-6
The dry gas flow rate, coupled with a nitrogen balance between the inlet
and outlet of the gasifier, allowed the dry air input rate to be evaluated.
This balance assumed that negligible nitrogen was produced in the gasification
process. Knowing the temperature and relative humidity over the course of an
experiment allowed the moisture input from humid air to be evaluated. Since
most experiments were of five hour duration, the moisture evaluation was based
on mid-run conditions.
Condensables consisted of two parts, tar and aqueous. These were
determined by taking a side draw from the main gas stream at a rate of about
0.55 m'/hr. This stream also supplied the GC with sample. The gas was first
sent through a hot filter (maintained at about 420°K with a heating tape)
which was packed with glass wool to remove heavy tar components. Next the gas
was sent through two water cooled condensers in series to remove most of the
water. The remaining water removal was accomplished with two receivers placed
in series in an ice bath. The tarry mist was then removed by passing the
stream through a tightly packed glass wool filter. Flow through the train was
maintained with the aid of a 'Gast' compressor which provided suction. The
discharge from the compressor was then sent through a wet test meter, followed
by a drierite chamber and then to the GC. Two identical trains were
constructed for use with and without tracer. The wet test meter readings were
corrected for temperature, pressure, water of saturation and air, and tracer
gas when needed. The condensates and tars were weighed and converted to a
mass per unit volume dry gas basis. These results were then scaled to the
main stream flow.
The chip feed to the gasifier was intermittent rather than continuous.
However, chip flow through the gasifier was continuous with only the chip
level fluctuation (0.3 - 0.5 m) . Chips were delivered by a constant speed
3-7
screw feeder which was activated by the chip level sensed by an electric eye.
The following procedure was adopted to evaluate the chip feed rate. A timer
was wired into the screw feeder. This was generally recorded over a five hour
period. The feeder was calibrated by collecting and weighing the feeder
discharge over 5 to 10 sec intervals. Some fluctuations in the calibration
were noticed, i.e., 0.6 to 0.7 kg /sec. These were due to bin height
variations and/or bulk density variations. The feed rate for each run was
evaluated by taking the appropriate calibration factor times the cumulative
on-time for that run. The above items determined the material balance for the
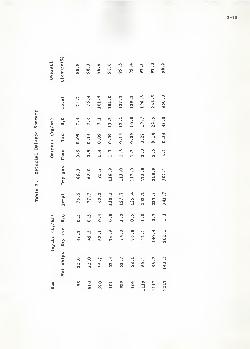
gasifier. Material balance closure was evaluated as output/ input and the
results adjusted so that all closures were less than 100%, i.e., for closure
greater than 100% the result was subtracted from 200.
The performance of the gasifier was evaluated in terms of a variety of
measures determined from the gas composition, material balance data and
supporting measurements. The dry gas composition gave one measure of gasifier
performance and from it, the higher heating value of the dry gas was
calculated from the standard heat of combustion of the components. The gas,
char and tar yields gave other measures of performance. These were calculated
on the basis of a unit mass of dry feed to eliminate the inf luence of moisture
variations. A dry ash- free basis was not used since the ash conten t of the
dry chips was less than 1% and not subject to much variation. Char yield was
expressed as the kg of char per 100 kg of dry chips and gas yield was
expressed on a volume trie basis as m* /kg of dry chips. The volume basis used
in this work was 289°K and 101.3 kpa. Tar yield was expressed in two ways,
one as kg of tar per 1000 kg of dry chips and the other as parts per million
in the dry gas. Also evaluated were the water output, kg of condensate per kg
of dry chips. The energy output was evaluated in MJ/hr and the energy yield
in MJ/kg of dry chips. The cold gas efficiency was evaluated as the ratio of
3-8
the energy content of the gas produced from one kg of dry chips to the energy
content of one kg of dry chips. This quantity represented the fraction of the
energy content of the feed that was converted to combustible gas. The mass
conversion efficiency was evaluated as the ratio of dry gas output to the
total input.
RESULTS AND DISCUSSION
Results
The material balances for runs with closures greater than 95% sre
summarized in Table 2. A total of 19 runs were completed, and 9 had closures
greater than 95%; the poorest closure was 80%. Some runs had closures
greater than 100% and these were adjusted to a 100% basis by subtracting the
result from 200. The material balance closures for all runs are included in
Table 3
.
Table 3 presents various measures of the gasifier performance as a junction
of the dry chip feed rate along with the moisture content of the as-received
feed. Included in the table are the char yield in kg/100 kg of dry chips, the
tar yield in kg/1000 kg of dry chips, the gas higher heating value, the energy
yield per unit mass of dry chips, the total energy output, the water output
rate in kg/kg of dry chips, the tar content of the gas in ppm, the dry air
input rate in kg/kg of dry chips, the volumetric gas yield, the mass
conversion efficiency and the cold gas efficiency. The means and standard
deviations for the complete data set and the nine runs with closures greater
3-9
than 95% are given at the bottom of the table. As can be seen from the table,
although the values fluctuated somewhat, no distinct trends were observed as
the dry chip feed rate increased. The mean gas yield over the entire
operating range was 2.19 m J /kg for runs with closures greater than 95%. Other
important performance measures include the mean heating value at 5 .51 MJ/m 1,
the mean mass conversion efficiency at 88%, and the mean cold gas efficiency
at 72%.
The energy yield per kg of dry chips was fairly close for the runs with
closures greater than 95%. This behavior is also illustrated by Figure 2 in
which the total energy output is plotted against the dry chip feed rate. As
can be seen from the figure., a linear relationship determined by least squares
analysis describes the data quite well.
Dry gas composition data as a function of dry chip feed rate for all the
runs are summarized in Table 4 . The pr inc ipal components of the product gas
were H2 , CO, C0 2 . CH 4 and N a with trace amounts of C aH« , C z fl 4 and C 3 H, .
Although the results show some fluctuation, there is no distinct trend with
increasing dry chip feed rate. As noted earlier, all gas compositions were
determined from the average of the pre and post trace gas analyses and are
reported on an air-free basis.
Discussion
The results of this work indicate that the performance of the gasifier is
remarkably consistent over a fairly wide range of operating conditions. The
chip feed rate was varied over almost a five fold range from 27 to 126 kg/hr
with a corresponding energy output ranging from 320 to 1400 MJ/hr . The
3-10
consistency in performance was further reflected by the temperature measured
right above the ceramic ball bed. It fluctuated only slightly from 950 to
1000°K over the course of the experiments with no distinct trends indicated as
the chip feed rate was increased.
The mass conversion and cold gas efficiencies obtained in this study are
compatible with the results obtained by Graham and Huffman (1981) using a
downdraft gasifier of comparable capacity. Using poplar chips with 13%
moisture content (wet basis), they reported a mass conversion efficiency of
88% and a cold gas efficiency of 74%. Their feed rates were comparable to the
upper range examined in this work, but they made no effort to study wide
ranges of feed rate. Their gas compositions were similar to ours but showed
more CO (24 - 26%) and less COj (9 - 10%). The differences are probably due
to the differences in composition of the feedstocks used in the two studies.
Furthermore, Graham and Huffman (1981) reported substantially more tar than we
did, i.e., of the order of 10,000 ppm. Their tar results were determined by
difference whereas ours were measured values. Our measurements of tar were
rather crude because some of the tar was deposited on the sample system
surfaces and not measured. Even if the measurements were low by 100%, the tar
observed in our study was still an order of magnitude lower than that reported
by Graham and Huffman.
3-11
REFERENCES CITED
Graham, R. G. , and D. R. Huffman, 'Gasification of Wood in a Commercial-Scale
Downdraft Gasifier,' in Symposium Papers, Energy from Biomass and Wastes
V (Institute of Gas Technology). 633-650 (1981).
Reed, T. B. , and D. E. Jantzen, 'Generator Gas - The Swedish Experience from
1939-1945,' (translated from the work of the Swedish Academy of
Engineering) SERI/TP-33-23 9 (1980).
Reed, T. B. , et al., 'A Survey of Biomass Gasification,' Volumes 2 and 3,
SERI/TP-33-23 9 (1980).
3-12
Table 1. Chip Size Distribution
1 Typical sizes (mm)
10x75, 7x74, 23x95
24x43, 21x32, 30x47
17x47, 20x25, 15x26
15x32, 12x17, 9x31
5x19, 3x41, 4x7
1.5x13, 2x9 , 2x2
Screen size Weight frai
passed (mm)
sticks 0.014
> 18.5 0.099
18.5 0.211
12.5 0.592
4.5 0.056
3.5 0.028
3-13
H
O
r-l rH n
r4 v4 C4
r- r* •
~ o5 a"
I
3-14
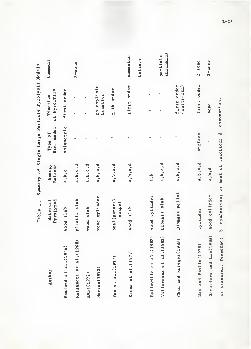
Table 3. Performance Summary
Run Dry Chip Chip Moisture Matl. Balance Dry Gas HHV Gas Yield
Rate(kg/hr) (% wet basis) Closure(%) (MJ/m') ("'/kg DC")
98 26.7 16.52
910 26.7 16.52
920 33.6 6.01
927 41.2 8.11
922 47.8 5.75
101 48.7 6.99
92 9 48.8 7.41
1011 49.5 7.31
1015 52.3 7.95
924 53.7 5.50
106 54.3 6.67
123 54.3 14.61
104 63.7 7.72
1129 68.9 14.27
121 72.5 15.07
1119 74.6 16.32
1117 85.4 11.26
1110 119.7 11.56
1221 125.5 10.67
all da umean — —o — —
>95%
•DC represents Dry Chips.
98.9 5.33 2.22
98.3 5.18 2.28
96.6 5.33 2.48
85.4 5.63 2.54
85.1 5.44 1.43
98.6 5.59 2.18
99.5 5.63 2.10
91.6 5.44 2.55
88.8 5.33 2.73
91.8 5.66 1.62
95.4 5.48 1.95
94.2 5.51 1.90
92.6 5.55 2.61
91.9 5.59 2.85
80.4 5.63 1.39
97.3 5.7 4 2.11
97.0 5.7 8 2.30
91.0 5.7 4 1.7 9
98.2 5.44 2.10
_ 5.51 2.17
0.15 0.41
_ 5.51 2.19— 0.19 0.14
3-15
Table 3 . Continued
Run Char Yield Tar Yield(kg/lOOkg DC) (kg/10'kg DC)
98 3.28 2.55
910 3.21 4.59
920 4.06 2.71
927 3.08 3.30
922 2.76 1.90
101 3.45 1.86
929 3.72 2.79
1011 3.94 4.59
1015 4.69 5.21
924 2.79 2.54
106 2.18 1.67
123 4.27 3.35
104 2.71 2.85
1129 3.82 3.96
121 3.57 3.76
1119 3.96 3.65
1117 2.92 2.13
1110 1.67 3.03
1221 3.25 4.34
all datamean 3.33 3.20
a 0.72 0.99
>95*mean 3.34 2.92o 0.54 0.99
Tar in DryGas (ppm)
Dry Air In
(kg/kg DC)
HjO Out(kg/kg DC)
1370 1.61 0.277
2003 1.69 0.277
977 1.85 0.212
1180 1.75 0.43 8
1199 1.05 0.186
777 1.56 0.273
1205 1.52 0.250
1607 1.88 0.321
1679 2.08 0.3 81
1426 1.13 0.209
776 1.42 0.199
1594 1.35 0.236
989 1.90 0.3 07
1254 2.04 0.2 81
2445 0.99 0.169
1567 1.50 0.264
830 1.64 0.26 8
1544 1.27 0.206
1803 1.61 0.345
1380
424
1.57
0.310.26 8
0.067
1256433
1.600.12
0.2630.039
3-16
Table 3 . Continued
Run Energy Yield
(MJ/kg DC)
Total Energy Out Mass
(MJ/hr) Eff
Conversioniciency (%)
Cold Gas
Efficiency (%)
98 11.82 3 15 87.7 70.2
910 11.82 315 87.5 70.2
920 13.14 441 94.7 78.1
927 14.31 5 90 98.1 85.0
922 7.76 370 74.9 46.1
101 12.19 594 89.8 72.5
929 11.82 576 88.5 70.2
1011 13.84 685 96.1 82.2
1015 14.52 759 97.5 86.3
92 4 9.11 490 80.9 54.2
106 10.68 57 9 86.5 63.5
123 10.44 567 83.0 62.1
104 14.50 924 96.2 86.2
1129 15.89 1094 98.1 94.4
121 7.81 567 70.8 46.5
1119 12.08 901 86.0 71.8
1117 13.31 1136 92 .2 79.1
1110 10.23 1224 81.6 60.8
1221 11.42 1434 87.9 67.9
all datmeana
a
11 .93
2.25
88.3
7.5
70.913 .0
>95%mean
o
12.03
0.76
— 87.92.1
71.54.5
3-17
Table 4. Dry Gas Composition (*)
Run H2 c,H, COi C 2H4 CiH« Nj CH. CO
98 15.00 0.10 16.67 0.39 0.07 46.92 2.50 18.41
910 15.00 0.08 16.25 0.36 0.06 47.89 2.33 18.05
920 14.27 0.09 15.50 0.42 0.07 48.19 2.49 18.97
927 16.56 0.08 16.60 0.41 0.07 44.45 2.52 19.31
922 14.85 0.09 15.24 0.42 0.07 47.46 2.48 19.40
101 15.47 0.10 14.80 0.49 0.09 46.72 2.41 19.94
929 15.52 0.09 14.96 0.47 0.07 46.50 2.55 19.85
1011 14.69 0.12 16.28 0.57 0.09 47.55 2.61 18.09
1015 13.25 0.14 16.31 0.65 0.10 49.14 2.67 17.73
924 16.04 0.08 15.84 0.44 0.07 45.11 2.51 19.93
106 15.32 0.07 15.23 0.39 0.07 46.7 8 2.45 19.69
123 16.33 0.11 16.81 0.57 0.09 45.94 2.39 17.77
104 15.25 0.08 14.83 0.45 0.06 46.83 2.48 20.01
1129 15.61 0.12 15.90 0.57 0.09 46.22 2.41 19.07
121 16.06 0.13 16.41 0.63 0.10 45.86 2.47 18.34
1119 15.56 0.14 15.51 0.63 0.09 45.96 2.49 19.62
1117 14.90 0.15 15.66 0.66 0.10 46.02 2.61 20.00
1110 15.50 0.13 15.17 0.58 0.09 45.95 2.49 20.08
1221 12.25 0.19 16.24 0.82 0.10 49.40 2.81 18.20
3-18
-Electric Eye
Airgitator
Cyclone
ft4
Gear Box
Figure 1. Commercial Gasifier
3-19
o o oo o o(D CJ CD
(JM/f W ) * nd»nQ <6j3u3
CHAPTER 4
MASS AND ENERGY BALANCE ANALYSIS
ON A DOWNDRAFT GASIFIER
4-1
INTRODUCTION
Moving bed gasifiers have been used to produce gas from biomass for more
than a century. The first gas producer was built by Bischof in 1839; later in
1878, it was adapted for power generation purposes by Dowson (Wyer, 1906)
.
Since that time, numerous gas producers have been invented and for a time, the
producer gas industry grew rapidly. Producer gas was the major gas supply
until natural gas dominated the market in the 1930s; after that, almost all
the producer gas plants were closed. However, the fuel shortages in World War
II revived interest in producer gas for a number of years. Due to the
scarcity of liquid fuels in Europe during World War II, the search for
domestically available fuels intensified and a great surge of activity in gas
producers resulted. In Sweden, approximately 75,000 vehicles (40% of the
automotive fleet) were converted to producer gas operation within two years.
Their experience was compiled by Swedish Academy of Engineering, and was
translated to English by Reed and Jantien (1979). After the war, the need for
gasifiers dwindled and only a minimum level of research work was maintained.
The energy crisis in the past decade prompted a renewed search for alternative
energy resources, and moving bed gasifiers once again obtained attention.
A large amount of literature is available which describes various aspects
of the design and operation of different types of downdraft gasifiers.
However, very few studies have been published which contain complete mass and
energy balances. In fact, many gasifiers have been constructed on a trial
and error basis. Graham and Huffman (1981) investigated a commercial-scale
choke-gasifier rated at 1 MJ/hr. They reported complete mass balances,
thermal efficiencies, mass conversion efficiencies and gas compositions with
the feed species, moisture content, and the size and quality of feedstock as
4-2
operating parameters. Walawender et al. (1985) reported on the performance of
a commercial downdraft gasifier with a working capacity of 320 to 1,600 MJ/hr.
Complete material balances as well as gas compositions were reported over a
wide working range to examine the gasifier performance. These two studies
represent the only complete material balance analyses of moving bed downdraft
gasifiers in the open literature.
A few studies have been published concerning the energy analysis of
pyrolysis processes. Otoma and Gotoh (1979) applied the second law of
thermodynamics to the analysis of a pyrolysis system. Shieh and Fan (19S2)
developed formulas for estimating the energy and available energy contents of
structurally complicated materials, such as coal and biomass. Recently,
rigorous mass, energy and available energy balances for a conceptual pyrolysis
system were developed by Ishimi et al . (1982). However, at present, no
detailed thermodynamic analysis has been reported on the moving bed downdraft
gasifier .
This work presents the complete material and energy balances for a
commercial moving bed downdraft gasifier. It is based on the experimental
data of Walawender et al . (1985) for a commercial moving bed downdraft
gasifier. One objective of this work was to formulate an empirical
stoichiometry to represent the the overall gasification process. A second
objective was to conduct a thermodynamic analysis to determine the efficiency
of the process; the approach was based on applications of the first and
second laws of thermodynamics.
4-3
MASS BALANCE ANALYSIS
The objective of the material balance analysis was to formulate an
empirical stoichiometric equation for the gasification of wood chips based on
the data of Walawender et al . (1985). The formulation of the stoichiome try
was based on an analysis of the experimental overall material balance data for
the gasifier and the development of elemental material balances for the
process through a two level adjustment of the data to force closure.
To formulate the stoichiome try for the overall gasification reaction
requires a perfect balance for all of elements involved in the reaction.
Therefore, if a uet of experimental data with perfect balances for all
elements exists, the empirical stoichiome try will result naturally. However,
perfect closure is rare for a real process, especially one as complicated as a
moving bed gasifier. The inherent variability of biomass, measurement errors
and system fluctuations all contribute to make complete closure impossible.
The material balance closure, both overall and elemental, is used in this
analysis as a measure of how well material balance has been achieved. It is
defined as the mass ratio of output to input. Nine runs from the work of
Walawender et al . (1985) were selected for the initial analysis. All had
overall closures to within 5%. The data base is summarized in Table 1.
However, one of the nine runs. Run 101, was rejected due to its poor elemental
balance closures in the preliminary analysis.
Table 2 presents the overall material balance closures and the elemental
balance closures for the remaining runs. Closures were evaluated based on the
following assumptions.
(l)The elemental composition of dry chips was based on the mean of the
4-4
available experimental data. This composition is presented in Table 3.
(2)Dry air consists of oxygen and nitrogen only, with a molar ratio of 21
to 79. Its composition is included in Table 3 on a weight basis.
(3)The elemental composition of tar was assumed to be the same as dry chips
due to the lack of experimental data. Although this introduces
significant error in the elemental composition of tar, its effect on the
material balance is negligible due to the extremely small amount of tar
compared to other streams (see Table 1).
(4)The elemental composition of char was assumed to be the mean of the
available experimental data. This composition is included in Table 3.
As can be seen from Table 2, the carbon(C) closures on the original data
ranged from 0.82 to 1.09, hydrogen(H) closures ranged from 0.84 co 1.02,
oxygen(O) closures ranged from 0.98 to 1.10, all nitrogen(N) closures were
0.99, and overall closures ranged from 0.95 to 1.03. Among the elemental
balance closures, the poorest were those for hydrogen and the best were those
for nitrogen.
The problem becomes one of adjusting the experimental data to achieve
perfect balances without losing their general representation of the
gasification process. Since merely averaging the data is not sufficient,
special techniques need to be developed; these are the primary and secondary
balance adjustments as described in the following sections.
Primary Balance Adjustments
The strategy of the primary adjustment is to make small adjustments in the
rates of the various input and output streams to achieve the best overall and
4-5
elemental material balance closure possible, without altering the compositions
of any stream. This is based on the assumption that the material imbalances
were primarily a result of the errors in the measurement or indirect
determination of the stream rates. There were two inputs streams, air (with
moisture) and wood chips (with moisture), and four output streams, dry gas,
water, char and tar. There were four elemental species C, H, and N. Sulfur
was neglected due to its small amount in biomass.
Since the amounts of tar and char were very small compared to the other
streams, they were not altered in the primary adjustment. Efforts were
directed at adjusting the four remaining streams to achieve the best overall
results for the five closures. This is a multi-variable multi-objective
optimization problem. To solve it, priority must be assigned to each of the
five closures. Priorities were chosen to be, in descending order, the
overall, C, H, and N closures. This order was determined according to their
relative importance in the subsequent thermodynamic analysis. The problem was
then solved using sequential search techniques with the aid of computer.
Table 4 presents the extent of the adjustment on each stream as a
percentage of each stream rate. The maximum adjustment was 17%. Table 5
presents the closures for the 8 runs after the first adjustment. As can be
seen, all the overall closures are 1.00 (3 digit accuracy).
Table 6 presents the mass balance data (on a dry ash free basis) for the 8
runs after the first adjustment, normalized such that the wood chip rates are
all 100. Note that all of the water terms have been combined into a single
term, the net water output. The means and standard deviations for the 8 runs
are also given at the bottom of the table.
4-6
Secondary Balance Adjustments
As can be seen from Table 5, although the closures after the primary
adjustment improved, they still lacked perfect closure. Therefore, a
secondary adjustment was conducted. The secondary adjustment scheme was
developed based on the following considerations:
(l)As many compositions as possible of the six streams were to remain
unchanged. However, all of them can not remain fixed. The composition
of char was chosen to be open for adjustment, because (a) the
compositions of air and water are fixed, (b) the compositions of wood
chips and dry gas were measured and are preferred to remain fixed due to
their importance in the thermodynamic analysis, and (c) variation of the
composition of tar is not effective, because the amount of tar is too
sma 1 1
.
(2)The amount of dry gas relative to of wood chips was fixed due to its
importance in the thermodynamic analysis.
Therefore, the amount of air, the amount and composition of char, and the net
water output remained to be adjusted.
The secondary adjustments were based on the means for the 8 runs, as
presented in Table 6. The first and final stages of this adjustment are
presented in Table 7. In the first stage, the amount of dry air was first
slightly adjusted to give a complete overall material balance closure (since
the closure 1.00 obtained from the primary adjustment was accurate only up to
3 digits). Then each of the first 5 streams were broken down into their
elemental constituents C, H, 0, and N. Next, the elemental constituents of
char were determined by difference to force perfect elemental balances.
However, as can be seen from Table 7, the resulting char composition is not
4-7
realistic with respect to oxygen and nitrogen.
From the elemental analysis of the char presented in Table 3 , the oxygen
and nitrogen contents of char should be very small or negligible. Therefore,
the assumption of zero oxygen and nitrogen contents for char was adopted. The
nitrogen content of the char was then forced to zero by subtracting the same
amount from the nitrogen content of the air and accordingly adjusting the
oxygen content of the air to maintain the composition of the air. Next, the
oxygen content of the char was forced to zero by adjusting the oxygen content
of the net water output to compensate for the change of the oxygen in the air
and char. Then, the hydrogen content of water was accordingly adjusted to
maintain the composition of water and the hydrogen content of char was
adjusted to maintain the material balance for hydrogen. The above procedure
gave the results presented as the final stage in Table 7.
Converting the above results from a weight basis to a molar basis (using
the mean gas composition of the experimental data , se e Walawender e t al . ,1985
)
and expressing the dry gas in terms of its respective constituents yields the
empirical stoichiometric equation for the overall gasification presented in
Table 8. Note that the structurally complicated materials, wood chips, tar,
and char, all have an arbitrary molecular weight of 100.
THERMODYNAMIC ANALYSIS
The purpose of this analysis was to evaluate the thermodynamic efficiencies
for the commercial gasifier. The approach was based on the first and second
laws of thermodynamics. These efficiencies can be used to identify the
sources of inefficiency in the process.
4-8
Background
The thermodynamic analysis was based on the works of Ishimi et al.(1982)
and Shieh and Fan (1982). The thermodynamic background for the analysis to
follow will be briefly reviewed.
Reference State
The dead state (see, e.g., Shieh and Fan, 1982) is chosen as the reference
state for the evaluation of enthalpy and available energy. This is a state in
which the materials (or system) can neither exchange energy with nor perform
work on the surroundings; in other words, this is a state in which materials
are in equilibrium with their environment. For pratical cases, the dead state
of a material will assume the most stable state of that material in the
surroundings. Table 9 presents the datum level materials, datum level
concentrations, specific chemical enthalpies and specific chemical exergies of
those materials involved in the present gasification process (see ,e .g ., Shieh
and Fan, 1982). The temperature and pressure of the dead state used in this
study are 298.15"K and 1 atm, respectively.
Energy Balance
Applying the first law of thermodynamics to the system shown in Fig. 1 and
assuming that potential energy, kinetic energy, etc. are negligible, we have
I£Vk>i + 0» + W " I®knk>e(1)
where Q,, = heat interchange between the system and surroundings,
W = work supplied by the surroundings,
P = partial molar enthalpy relative to the dead state. Here, P is
defined as (see, e.g. Szargut and Pelela, 1965; Fan and Shieh, 1980)
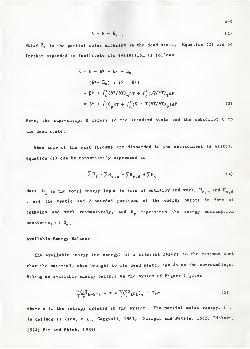
4-9
P = E - \ .(2)
where n is the partial molar enthalpy in the dead state. Equation (2) can be
further expanded to facilitate its evaluation as follows
P = 5 - E° + 1° - 1
= (E°- E„) + (h - E°>
= P» + /^On/aT) dT + /p
P OV/3T) TdP
= P° + /T
T
C dT + ./^(V - TOY/3T) )dP (3)
Here, the superscript refers to the standard state and the subscript to
the dead state
.
When some of the exit streams are discarded to the environment as wastes,
equation (1) can be conveniently expressed as
^ Hi =XHe,u + IHe.d +I Hc
(4)
Here H. j s the total energy input in form of enthalpy and work, Heu and H e>(j
, are the usable and discarded portions of the energy output in form of
enthalpy and work respectively, and H represents the energy consumption
consisting of Q,, ,
Available Energy Balance
The available energy (or exergy) of a material refers to the maximum work
that the material, when brought to its dead state, can do on the surroundings.
Making an available energy balance on the system of Figure 1 gives
^knk |j + W •liD^^t Too (5)
where a is the entropy created in the system. The partial molar exergy, e ,
is defined as (see, e.g., Gaggioli, 1961; Szargut and Petela, 1965; Riekert,
1974; Fan and Shieh, 1980)
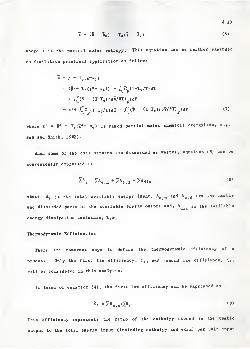
4-10
8 - (S - I,) - T (i - *o) (6)
where s is the partial molar entropy. This equation can be further expanded
to facilitate practical application as follows
« - F - T (s-s„)
= (P°- T„(i»- •,)) + /T
T
Cp(l-T /T)dT
+ /BP(V - (T-T )OV/3T)
p)dP
= I" + £l (i-T„/T)dT + f'(V - (T-T )(dV/aT)p)dP (7)
where e° = P° - T (s°- s ) is named partial molar chemical exergytsee, e.g.
Fan and Shieh, 1982) .
When some of the exit streams are discarded as wastes, equation (5) can be
conveniently expressed as
£Ai
= 2Ae,u + IAe,d + IAdis (8)
where A. is the total available energy input, Ae u and A
e dare the usable
and discarded parts of the available energy output and, Adis is the available
energy dissipation containing T <j.
Thermodynamic Efficiencies
There are numerous ways to define the thermodynamic efficiency oi a
process. Only the first law efficiency, \ Xt and second law efficiency, t,i,
will be considered in this analysis.
In terms of equation (4). the first law efficiency can be expressed as
^=IHe,u/IH i(9)
This efficiency represents the ratio of the enthalpy stored in the usable
output to the total energy input (including enthalpy and work) per unit input
4-11
s. In terms of equation (8), the second law efficiency can be expressed as
*« =lAe#u/£Ai (10)
This efficiency represents the ratio of the available energy stored in the
usable output to the total available energy input per unit input mass. These
two efficiencies are concerned mainly the conservation of enthalpy and
available energy, respectively. Variations are possible depending on what is
considered to be a usable output.
Computations
The commercial gasifier under consideration is shown in Figure 2. There
were two input streams, chips (with moisture and ash) and air (with moisture),
and four output streams, dry gas, vapor, tar and char (with ash). Equations
(3) and (7) were used to evaluate the enthalpy and eiergy for each stream,
respectively. Equations (4) and (8) were used to evaluate the first law and
second law efficiencies for the process, respectively. Ail the streams were
assumed to enter the system at 298.15°K. The moisture content of wood chips
was treated as liquid water, ignoring the interaction between the moisture and
wood chips. The amount of ash was small compared to wood chips (less than 1%,
see Table 3) . The ash was treated as an independent inert material which went
through the system and carried away only small amount of sensible heat. The
binding energy between ash and wood chips or char was ignored.
Work was done on the system by a motor which powered the gas fan, the
rotating grate and char air lock. Compared to the energy input from the
chips, the mechanical work was not significant and was neglected in the
comput ation.
4-12
A method for the evaluation of p° ( specif ic chemical enthalpy) and
e°(specific chemical exergy) of structurally complicated materials from their
elemental compostion has been described by Shieh and Fan (1982) . The method
uses the following formulas.
0° = (1 + 0.15[0])( 7837.667[C] + 33 888.889( [H]-[0]/8)
)
(11)
and
e» = 8177.79[C] + 5.25[N] + 27892 .63[H] - 3173.6610]
+ 0.15[OK7837.667[C] + 33888. 889[H] -4236.1[0]) (12)
where [ ] represents the elemental composition of the complex substance in
weight fraction. The units for both 0° and e° are kcal/kg. Equations (11)
and (12) were used to evaluate B° and e° for the wood chips, char and tar on a
dry ash free basis.
The system was open to the atmosphere. The pressure variation through Lhe
system was negligible and, therefore, the pressure of the system was assumed
to be 1 atm. Furthermore, ideal gas behavior was assumed for all gas phases.
Therefore, all of the partial molar terms involved in the evaluation of the
enthalpy and exergy of gas mixtures reduced to ordinary molar terms. The
pressure dependent term in equation (3) vanished due to the ideal gas
assumption. The pressure dependent term in equation (7) was small compared to
other terms and therefore was neglected. Consequently, all the pressure
dependent terms were dropped in the evaluation of enthalpies and exergies.
To evaluate the temperature dependent terms, as needed in Equations (3) and
(7), the heat capacities of the materials as a function of temperature must be
known. Heat capacities of the form
C - a + bT + cT1 + dT' (13)P
4-13
were used for all the gases, H a , C,H« . COi , C 2H4 , C 2H« , N 2 , CH 4 , CO and
H20(g). The coefficient constants are available in the literature (e.g.,
Reid, et al., 1976). The sensible heat of crude oil was used to approximate
that of tar, due to the lack of better information. The heat capacity of char
was approximated by graphite (C) . The heat capacity of ash was approximated
by silicone dioxide.
The crude product stream was composed of dry gas, water, tar and char.
Sometimes, the crude product can be directly used for some purpose, such as
heating. In other cases, some of its constituents must be removed before use.
In principle, the four constituents of the crude product can be separated.
Therefore, in evaluating the efficiencies of the process, four operating modes
were considered as follows.
Mode 1: All the output species are recovered as usable products.
Mode 2: Char is discarded and the rest of the constituents are used.
Mode 3: Char and tar are discarded and the rest of the constituents are
used.
Mode 4: Only dry cooled gas is recovered as usable product.
The temperature of the crude product was observed to range from 644°K to
700°K; therefore, efficiencies at 3 temperatures, 298°K, 644°K and 700°K were
determined. The output temperature of 298°K represents the cold output.
Tables 10 and 11 respectively summarize the enthalpies and exergies for
various constituents of the input and output streams. The enthalpies and
exergies of each constituent are reported in two parts; one is the chemical
energy related portion, (3° and e°, and the other is the sensible heat related
portion, A6 an d Aet
. The latter is evaluated for each output at two
temperatures, 644 and 700 °K. Also included in the tables are the percentages
of input energy stored in the various output constituents at three different
4-14
temperatures. The evaluation for char has been conducted using two elemental
compositions; one is from the empirical stoichiome try and the other, from the
data in Table 3. The results show that the important energy related
constituents in the output are, in descending order, CO, U, , CH 4 and char.
Table 12 summarizes the first law and second law efficiencies for the four
operating modes at the three output temperatures. The char composition used
for the evaluation of these efficiencies was based on the data in Table 3.
The highest first and second law efficiencies were 89.5% and 62*,
respectively, in Mode 1 with an output temperature of 700°K. The lowest first
and second law efficiencies were 72% and 53%, respectively, in Mode 4 with an
output temperature of 298°K (cold dry gas).
DISCUSSION
Material Balance Analysi s
Walawender et al . (1985) reported means and standard deviations for the air
input, dry gas output, net water output and char output in kg per kg dry chips
(DC) for the 8 runs as 1.62, 0.13; 2.46, 0.19; 0.13, 0.054; and 0.032, 0.0061,
respectively. The empirical stoichiome try derived in this study resulted in
air input, dry gas output, net water output and char output in kg per kg DC of
1.69, 2.60, 0.056 and 0.036 respectively (see the bottom line of Table 7).
Comparison the derived st oichiome try with the experimental data shows that the
air input, dry gas output and char output were within one standard deviation
of the mean of the experimental data. The net water output was slightly more
4-15
than one standard deviation from the mean of the experimental data.
Therefore, the derived stoichiometric formula was able to represent the
gasification process in terms of the relative amounts of each stream.
All the compostions of various streams, except for char, remained unchanged
in formulating the stoichiometric equation. Note that the composition of the
tar was arbitrarily assigned, because the amount of tar was negligible.
However, since the char was selected as the victim to close the material
balance, its composition has been distorted. The molar hydrogen to carbon
ratio of the char was determined to be 6.3, which is higher than that of
methane. The distortion of the composition of char is the tradeoff for the
complete material balance closure. The high hydrogen content of char resulted
from the low elemental closures for hydrogen in the original data as shown in
Table 2. Consequently, this equation is primitive and needs to be refined
when more accurate material balance data become available.
Thermodynamic Analysis
The evaluation of the first and second law efficiencies were based on the
stoichiometric formula derived in the material balance analysis. However,
there was one adjustment. The composition of char was based on the
experimental data to provide a more realistic measure of the gasifier
efficiency when char was considered to be a usable product.
The highest first law efficiency, 89.5%, implied that the heat loss of the
system to its surroundings is 10.5% of the input enthalpy. The available
energy loss due to this heat loss is about 7%. This dissipation was evaluated
by assuming that the heat was dissipated from the system at a uniform
4-16
temperature 900°K to its surroundings at 298°K. Therefore, the use of more
insulation to reduce the heat loss is important, especially in terms of
available energy.
The lowest first law efficiency, 72%, corresponds to the cold gas
efficiency; this is the same as that reported by Walawender et al. (1985).
The lowest second law efficiency, 53%. represents the second law cold gas
efficiency. This indicates that when cold product gas is the only usable
product, 28% of the enthalpy and 47% of the available energy are lost in the
proces s
.
The highest second law efficiency, 62%, along with the available energy
dissipation due to the heat loss, 7%, implies that 31% of the input available
energy is dissipated in the system due to the various irreversibilities of the
gasification process. This means that 31% of the input available energy is
dissipated in the system due to the nature of the process. This dissipation
can not be recovered.
The variation in the output temperature shows that the sensible heat
accounts for 7 to 8% of the enthalpy and only 2 to 3% of the exergy for all I
operating modes. This indicates that the sensible heat is more valuable in
terms of enthalpy than in terms of exergy.
Comparing the efficiencies in the different operating modes shows that, for
all output temperatures, (1) discarding the char will lower both efficiencies
by approximately 6%, (2) discarding the tar will lower both efficiencies by
less than 1%. and (3) discarding steam will lower the first law efficiencies
by approximately 3% and has negligible influence on the second law
efficiencies. These results indicate that the utilization of the energy
(mainly the chemical energy) stored in char can improve the efficiency of this
4-17
process significantly.
SUMMARY
An empirical stoichiometry for wood chip gasification in moving bed
downdraft gasifier has been derived. The equation was based on an analysis of
experimental overall and elemental balance data. However, the char
composition in the stoichiometry was distorted.
A thermodynamic analysis was applied to a commercial moving bed downdraft
gasifier. This analysis was based on the emipirical stoichiometry. The first
law and second law thermodynamic efficiencies were evaluated for the process
for four different operating modes at three different output temperatures.
The highest first law and second law thermodynamic efficiencies were evaluated
to be 89.5% and 63% respectively. The lowest first law and second law were
evaluated to be 72% and 53% respectively, representing the cold dry gas
output. The heat loss from the system to its surroundings was estimated to be
10.5% of the input energy, and 7% of the input available energy was lost due
to this heat loss. The available energy dissipation in the system, due to the
various irreversibilities of the gasification procses, was evaluated to be 31%
of the input available energy. This dissipation reflects the nature of the
process.
4-18
REFERENCES CITED
Fan, L. T. , and J. H. Shieh, 'Thermodynamical ly Based Analysis and Synthesis
of Chemical Process Systems,' Energy, 5, 955-966 (1980).
Fan, L. T. , J. H. Shieh, T. Ishimi and T. Graham, 'Practical Application of
Process Systems Engineering to Energy and Resource Conservation and
Management,' Paper Presented at the International Symposium on Process
Systems Engineering, Kyoto Japan (1982).
Gaggioli, R.A., 'The Concept of Available Energy,' Chem. Engr. Sci., 16, 87
(1961).
Graham, R. G. , and D. R. Huffman, 'Gasification of Wood in a Commercial-Scale
Doirndraft Gasifier,' in Symposium Papers, Energy from Biomass and Wastes
V (Institute of Gas Technology), 633-650 (1981).
Ishimi, T., J. H. Shieh and L. T. Fan, 'Thermodynamic Analysis of A Boimass
Pyrolysis Process,' Paper presented at the Symposium on Feed, Futls and
Chemicals from Wood and Agricultural Residues, the Cellulose, Paper and
Textile Division, the 184th ACS National Meeting, Kansas City, Missouri.
September 12-17 (1982) .
Otoma, S. and S. Gotoh, 'Application of the Exergy Concept to a Resource
recovery System,' Paper presented at Int. recyling congr., Berlin, West
Germany, Oct. 1 (1979)
.
Reed, T. B. , and D. E. Jantzen, 'Generator Gas - The Swedish Experience from
1939-1945,' (translated from the work of the Swedish Academy of
Engineering) SERI/TP-33-23 9 (1980).
Reid, R. C, et al. 'The Properties of Gases and Liquids,' 3 th ed. . Appendix
A, New York, McGraw-Hill (1976) .
Riekert, L. , 'The Efficiency of Energy-Utilization in Chemical Processes,'
Chem. Engr. Sci., 29, 1613 (1974).
Shieh, J. H., and L. T. Fan, 'Estimation of Energy (Enthalpy) and Exergy
4-19
(Availability) Contents in Structurally Complicated Materials,' Energy
Sources, 6, 1-45 (1982) .
Szargut, J., and Petela, Egzergia, Warezawa, 1965 (in Polish).
Walawender, W. P.. S. M. Chern, and L. T. Fan, 'Wood Chip Gasification in a
Commercial Downdraft Gasifier,' in Fundamentals of Thermochemical Biomass
Conversion, Elsevier Science Pub. Co., New York, 911-922 (1985).
Wyer, S. S., in 'Catechism on Producer Gas,' Chap. 3, 26-27, New York, McGraw
Publishing Company (1906)
.
4-20
3 iH o o HONo
00 ••r
D O o o O o O o o
* o\ * p- CO (N o in -
4-21
Table 2. Mass Balance Closures* of Original Data
N Overall
98 0.96 0.86 1.01 0.99 0.99
910 0.96 0.85 1.00 0.99 0.98
920 1.06 0.99 1.09 0.99 1.03
929 0.92 0.93 1.05 0.99 1.00
106 0.82 0.84 0.99 0.99 0.95
1119 0.94 0.85 0.98 0.99 0.97
1117 1.02 0.99 1.09 0.99 1.03
1221 0.93 1.02 1.10 0.99 1.02
•Closure is defined as the mass ratio of output
to input.
4-22
Table 3. Elemental Compositions*
Wood chips'* mean 48.11 6.05 44.97 0.13 0.74
a 0.44 0.09 0.51 0.06 0.21
Dry air - - 23 .30 76.70
Char*** mean 75.83 0.89 4.74 0.06 19.48
a 8.15 0.08 - 0.05
Water - 11.11 88.89
•Weight %.**9 samples; dry basis.
***8 samples; dry basis.
4-23
Table 4. Summary of the Primary Adjustment*
Run Streams adjusted (%)
Air(wet) Chips(wet) Dry gas H,o*»
98 -10 - 5 15
910 - 5
920 4 5 15
929 4 - 8 - 5
106 4 -17 - 5
1119 0-71117 4 2 5
1221 4-5 -15
•Adjustment is expressed by the percentages
by which the rates of the correspondingstreams were adjusted.
••This is the vapor in the outlet gas stream.
4-24
Table 5. Mass balance closures* After Primary Adjustment
Run C H N Overall
98 1.01 0.98 1.07 0.94 1.00
910 1.00 0.90 1.02 0.99 1.00
920 1.00 0.99 1.06 0.96 1.00
929 0.99 0.98 1.06 0.96 1.00
106 0.99 0.99 1.07 0.96 1.00
1119 1.00 0.91 1.02 0.99 1.00
1117 0.99 0.98 1.07 0.96 1.00
1221 0.97 0.99 1.06 0.96 1.00
Closure is defined as the mass ratio of input
to output.
4-25
Table 6. Summary of Mass Balance* After Primary
Adjustment on Dry Ash Free (DAF) Basis.
Run Dry chips + Dry Air » Dry gas + Hao + Tar + Char
98 100.00 181.41 265.32 14.05 0.3 8 2.41
910 100.00 179.67 270.23 7.41 0.54 2.61
920 100.00 184.34 265.42 15.88 0.26 3.20
929 100.00 172.86 273.90 15.68 0.31 3.20
106 100.00 178.65 261.88 14.69 0.20 1.84
1119 100.00 163.21 253.05 7.74 0.40 3.18
1117 100.00 168.80 252.98 14.21 0.21 2.11
1221 100.00 178.12 256.04 18.24 0.46 2.29
mean 100.00 175.88 259.85 13.49 0.35 2.61
o - 7.06 6.72 3.88 0.12 0.54
•The values were normalized such that all chips are 100.
4-26
Table 7. First and Final Stages of the
Secondary Adjustments.
First stage
Element Chips + Air = Gas + H2 + Tar + Char
C 48.477 0.000 45.965 0.000 0.168 2.344
H 6.094 0.000 4.215 1.499 0.021 0.359
45.306 41.076 79.622 11.991 0.156 -5.387
N 0.123 135.215 130.050 0.000 0.000 5.288
Sum 100.000 176.291 259.852 13.490 0.345 2.604
Total input = 276.291 Total output = 276.291
Final stage
Element Chips + Air = Gas + H2o + Tar + Char
C 48.477 0.000 45.965 0.000 0.168 2.344
H 6.094 0.000 4.215 0.625 0.021 1.233
45.306 39.470 79.622 4.998 0.156 0.000
N 0.123 129.927 130.050 0.000 0.000 0.000
Sum 100.000 169.397 259.852 5.553 0.345 3.577
Total input = 269.397 Total output - 269.397
4-27
Table 8. An Empirical Equation of Gasification of
Wood chips in a Moving Bed Gasifier.
1.0 Chips + 1.233 0, = 1.435 H 2 + 0.0112 C S H.
(or 5.871 Air)
+ 1.549 CO, + 0.0509 C,H<
+ 0.0077 CjH, + 0.0044 Nj(or 4.643)
+ 0.249 CH4 + 1.878 CO
+ 0.308 HjO + 0.00345 Tar
+ 0.0357 Char
where Chips, Tar and Char all have arbitrary molecular
weight of 100 and their empirical formulas are
Chips, Tar: C4 o^ ^ g3N 0088
Char : C5.45 H34.6
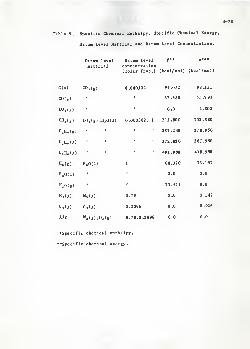
4-28
Table 9. Specific Chemical Enthalpy, Specific Chemical Exergy,
Datum Level Material and Datum Level Concentration.
Datum level Datum level P" e°»*
material concentration(molar frac.) (kcal/mol) (kcal/mol)
C(s) C0 2 (g)
CO(g) *
COjfg)
C 2H 4 (g)t t
C,H,(g) 1 $
C.H«(g) 1 1
B»<g) HjO(l)
H»Od) '
H»0(g) •
«.(«) H,(f)
<>,<»> 0»(»)
Air Nj(g),Oz(g)
0.000302 94.052 98.131
i 67.630 65.790
< 0.0 4.802
0.000302, 1 212.800 152.3 80
' • 337.240 27 8.950
» • 372.820 287.990
• ' 491.990 408.990
1 68.320 33.197
9 0.0 0.0
§ 10.511 0.0
0.7 8 0.0 0.147
0.2096 0.0 0.926
0.78,0.2096 0.0 0.0
•Specific chemical enthalpy.
••Specific chemical exergy.
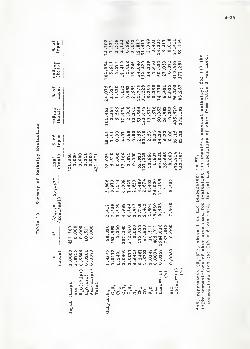
4-29
O 3
to. u
3^
CO. oH M
oo h Oi «t >n N o\HOiH>nr*Mwoics m <o h ^o h oo^l-fn'*m',J"0'«f ,t
^ r^ r^Trotn<Sr-ifoO'* voor-2;(S .Hco H <* oo
^^t o\ oo \o ©oe*Q'-<fO w-> °'-<
© v*> *r> Tj-ChcMO^iH'OTOO^icSN V) vo r» n n "*tS'*'-<or-oOt—^ H * «
o m m h >o ^ r-.tstSfnfo^fO(S<s
-* ^ -I tONNHnOfVjOjMr^ .H eo *H Q\ 00
fO^-vo H « h ^-eo t*«N innOrt•*j- >n v» 'tam00>o>c\omftO ,«H,Hw*imr-cS'-Hco'-imrHO\£>C> ,'*><s© ,_! H ")(T| h \o<s or-H -i * m
vi t-t O hMOXlffimMfflNOiflffiM m © ©\0©'/»^H''><,0C*<,0Oi-ICN
(r) rH©-"tO©<NO<NO'*^00<>,-t
Soo-iOr- (S^ovor-OtsH^oes^-OT-j^«r> © © r-4 O "^ O«nO-H00OO\O\O^OOvOO00Tt
2 2 H mm
oo m if \p mm^^tnO^Or-'to r-) m oo t- © n m00 Q\ N O ^fCO^CO^O^
p. o> (rj eo •» m,ks ao»rHftl O\ 00 •it'^-^rvo O « O«t ^ vi o> fH^r-^" ctnooio
ts r- w ^- >o N mN <-J ch c*
O O O i-t o\© O O ,h om o o «n ©tH o o o ©
— O «n iH O4> O H * O *^ O [^ * NOO © 00 vo © Oa— i-t in o O O
O © O oOOOOrH^iOOOO©(S J O Tt-cqOOmrH'HtH'^rOPl^ONMOM^Viffi^CCOeo^
1or-(SOtsr-0«n ,^- r-0
\£lO ff) h Hve h >o » ** <n m fS * ^o r-
ic a — o\ r* <n r-N r- "**" t-^iHC^or-fS 000" Tffnwt(rj^H'.r «n © T ^ t- nowvomoo^fscc oooiHOiHOO^OrH i-iOO
4 ^ <**W•H m -H
xj -H j3</> o eO O •-«
a "2- <«r — *•* H O © Jf **..;;-- « rt (A Ou -< es ca <4 H
oa. H
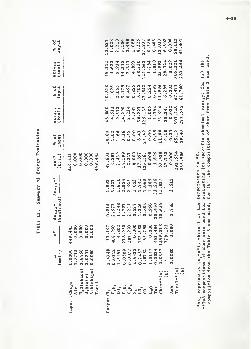
4-30
3
*5CTvO(S^H ,tO ,'> 1^ol ,*OfnO'
u ffiV'Jl^NtWlOHHnOOO'OOTf r-t WIN W-i<NO«
# a Ortc^moooor-oO-Hvoor-^
O 3 I
a I
# 3 i
ON^^oaOiriaOMOOOJONO\o© ,o>H'<ro-**, '*romco,HO.H ,'t
O^rHmOOOOr^OOiH^Onn^
,H O O O O ,H"*J- O O O O **f o O O O T
ri^Ht^o\ r-Or-r-ov£)COoO'*^om00mO>.HOCTv\©O<*<N^OV)00\ox*» ,,t'H<soso<novc^i-r~o*o^
fl M I0\ O O O O O'v i-H m r- o r4 ^
0"ft>OmOiOr"OMN»
co \o oi r— n oo fn oo o» ^ ^o
on HHNOHO ocom+J <4-l <0
rH o o o o^t o o o o*r o o o oo> o o o o
O ui ^o rH OO H »C O «o r- °° <n oo w « o o.-t «n o o o
a «- *-"*H l-l e O .H fcj
U 4 M a -c H M
a= Pi
9 sM o
^S©w-i5f\©352F\0'Xf-lcSO
<r»COTf00r~O(S ,^»Of-j^ o, O
oDNH^r^'ftr-N r- * r-
rHOiHOO^Ot-4 .-IOOa a
h*J -H IM
d<A « o-j c r*i-i a.a, n HV o <lt
u u o
*->o 1u *O H 'J
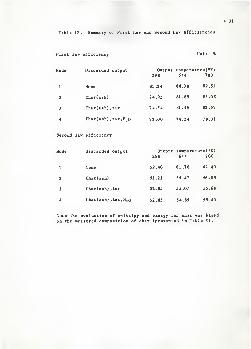
4-31
Table 12. Summary of First Law and Second Law Efficiencies
First law efficiency Unit: %
Mode Discarded output Output temperatureCK)298 644 700
1 None 81.24 88.30 89.51
2 Char(ash) 74.92 81.89 83.08
3 Char(ash),tar 74.54 81.49 82.67
4 Char(ash) ,tar,H,o 72.00 78.24 79.31
Second law efficiency
Mode Discarded output Output temperatureCK)298 644 700
1 None 59.40 61.76 62.40
2 Char(ash) 53.23 55.47 56.09
3 Char(ash),tar 52.85 55.07 55.69
4 Char(ash) ,tar,H2o 52.85 54.85 55.40
Note the evaluation of enthalpy and exergy for char was based
on the measured composition of char (presented in Table 3).
12 .Summary of First Law and Second Law Efficiencies 4-31
CHAPTER 5 GASIFICATION OF WOOD PELLETS AND CHIPS IN A DOWNDRAFT
GASIFIER
Table
1. Properties of Feedstocks 5-21
2. Performance Summary 5-22
3
.
Dry Gas Composition 5-26
4. Statistical Analysis 5-27
5. Comparisons of the Present Study with the Previous
Study 5-28
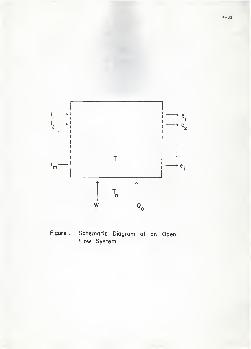
w
4-32
-> e_
-* e,
Figure I. Schematic Diagram of an OpenFlow System.
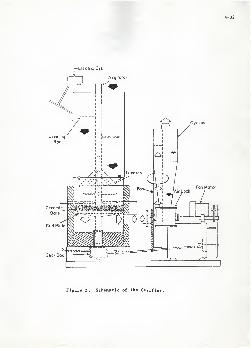
4-33
-Electric Eye
Airgitator
Gear Box-
Cyclone
Figure 2. Schematic of the Gagifier.
CHAPTER 5
GASIFICATION OF WOOD PELLETS AND CHIPS
IN A DOWNDRAFT GASIFIER
5-1
INTRODUCTION
Gasification is one means for converting wood or any biomass into a gaseous
fuel which is more versatile than the original biomass. Currently, wood
provides about 2% of our total energy needs and could contribute up to 8%
within the next decade (Zerbe,1981) . The annual harvest of woody biomass
amounts to about 1.4 billion tons in the U.S. alone. Over 700 million tons of
this material is not used because it is not of the right species, size, fiber
length, fiber morphology etc. (Goldstein, 197 8) . Branchwood is a prime
example of this type of wood waste. Thus the potential for the utilization of
wood to ensure a continuous supply of fuels and chemicals is significant.
Some advantages of wood as a gasification feedstock over solid fossil fuels
such as coal and oil shale are its higher reactivity, its lower sulphur
content, and its lower ash content. Most important is the fact that it is
renewable. Its disadvantages stem from its lower heating value, lower bulk
density and its higher moisture content which makes handling facilities more
expensive. In this regard, benefication processes (see, e .g. , Bain, 1980) are
available for improving the properties of biomass, such as drying and
densification. Wood pellets are a prime example of improved biomass.
Various types of reactors have been used to gasify biomass; they include
fixed beds, entrained beds, moving beds, rotary kilns, and fluidized beds.
Fixed bed and moving bed gasification has been practiced for a long time and a
few commercial units are available. The other technologies are relatively
new, and are basically geared to large-scale operation; only a very few
systems have been commercialized. Reed et al . (1980) summarized the state of
gasifier research and the status of various gasifier manufacturers.
5-2
Downdraft gasifiers for the production of low BID gas from biomass are
generally mechanically simple and relatively easy to operate with suitable
feed materials. The product gas has a negligible tar content. This feature
makes them superior to updraft gasifiers which produce a gas with a high tar
content (about 20%) when biomass is used as the feedstock. The clean gas can
be used for different applications, such as heating, and fueling boilers or
engines
.
Moving bed gasifiers have been used for the production of low BTU gas since
the early nineteenth century. Sweden (Reed and Jantzen,197 9) and other
countries used them to power automobiles during World War II. However, their
performance under various operating conditions has not been well understood.
In this regard, numerous research efforts are currently underway to improve
our understanding and to develop models to facilitate gasifier design.
Despite the limited knowledge, a large number of gasifiers have been
constructed for research and/or commercial use. The Buck Roger's TM gasifier
is one recently commercialized downdraft gasifier which has undergone some
design changes since its invention in 1982. The gasifier used in this study
is a variation of its predecessor used in cur previous work (Walawender et
al.,1985) .
The objective of this work was to determine the performance of the gasifier
under different operating conditions through complete material balance data
for the gasifier. The operating parameters studied included the rotation
speed of the grate, type of feed, and bed supports. Two feedstocks, wood
chips and wood pellets, were gasified and three different bed supports were
investigated at grate rotation speeds ranging from 3 to 14 min/rev.
5-3
EXPERIMENTAL FACILITIES AND PROCEDURE
Gasifier Description
The Current gasifier
Figure 1 presents a schematic diagram o£ the gasifier used in this study.
It has a diameter of 0.6m and is open at the top. There is no throat or choke
plate in the unit. A fan located downstream from the gasifier draws air
through the bed as well as the tuyeres. A butterfly valve inserted in the fan
outlet serves as throttle for the coarse control of gas throughput. A feed
bin and a screw feeder (not shown in Figure 1) supply feed to the top of the
gasifier each time the bed height drops to a set level. Feeding is controlled
by an electric eye, mounted at the side of the reactor. A plate (on the top
of the reactor) with a bearing is used to hold the upper end of the
'Airgitator' in place. A chute is seated on the top plate to receive the feed
delivered by the screw feeder. The 'Airgitator' is driven by a hydraulic
motor with a hydraulic fluid flow splitter for the control of rotation speed.
It rotates at speeds from 3 to 14 minutes per revolution. The 'Airgitator'
has several functions, listed below:
(1) It provides part of air intake, through the tuyeres.
(2) It levels the feed at the top of the bed.
(3) It slowly mixes material throughout the gasifier.
Gas and char flow out of the gasifier through the grid plate which is
attached to the 'Airgitator' shaft. They are drawn out of the base of the
gasifier by the fan which blows them through the cyclone where the char is
5-4
separated from the gas. The gas stream is then sent to a flare stack (not
shown in Figure 1) where it is incinerated.
Comparison With the Previous Gasifier
The current gasifier is basically similar to its predecessor (used in our
previous study (Walawender et al..l985)> in most aspects, except for a few
design changes which are detailed as follows. The current gasifier allows the
grate rotation speed to be controlled independent of the fan speed, whereas
its predecessor had the two speeds proportional to each other through a series
of speed reducing pulleys and gears. The rotation speed of the fan in the
current gasifier is fixed (or more precisely, the applied voltage to the fan
motor driving the fan is fixed), whereas the rotation speed of the fan in the
previous gasifier was electronically controllable. Therefore, a butterfly-
valve is used at the outlet of the fan as a throttle for the coarse control of
gas throughput in the current system.
Operating Procedure
The operating procedure for the gasifier is detailed below.
1. Start-up. A portable propane burner was used to preheat the system for
about 15 minutes. The temperature in the empty gasifier was about 600°K at
the end of the preheat period. During the preheat period, the fan was started
and its throughput gradually increased from low to maximum. The fan was
turned down to low throughput at the end of the preheat period. Propane was
then introduced into the flare stack and ignited. Next, the feeder was
manually operated to fill the gasifier to build a shallow bed about 4 inches
thick. The bed was then set on fire. After the fire was uniformly spread
5-5
over the bed, another layer of feed was introduced. The same procedure
repeated until the bed level was just above the tuyeres. The gasifier was
then filled to the desired operating level, and the automatic feeding mode was
turned on. The grate was rotated very slowly or even stopped when the bed was
being developed. The rotation speed was gradually increased up to the desired
speed after the bed was established. As the gas production and gas
temperature increased, the propane rate into the flare stack was decreased and
finally shut down. The fan throttle was finally brought to the wide open
position and the gasifier was allowed to attain steady state. This procedure
normally required two hours to complete.
2. Gas analysis and condensables measurement. After the completion of step
1, a side drawn of the gas was taken for analysis and condensate
determination. The specific procedures will be detailed in the next section.
These measurements were conducted for a two hour period.
3. Char measurement. Char was measured by direct collection over a one to
two hour intervals in the middle of the run.
4.Tracer gas measurement. Nitrogen tracer gas was introduced into the
product gas (at the gas inlet) at a known rate, and the gas analysis and
condensate measurement were repeated. The specific procedures are detailed in
the next section. These measurements were conducted for one hour.
5. Post tracer measurement. Step 3 was again repeated without the tracer
gas for 30 minutes to one hour to confirm the steady state of the system.
6. Shut-down. The supply of feed was stopped and the gasifier continued to
consume the feed in the bed. As the bed was depleted, flame began to spread
over the surface of the bed. Then, the whole bed reduced to char and the
temperature of the bed began to rise rapidly. The fan was shut down when the
5-6
temperature of the bed reached 1200°K and the remaining char was allowed to
burn slowly. Normally more than four hours were required to completely burn
the char.
Measurements
Because of the configuration of the gasifier and the stream flow rates
involved, it was not convenient to measure all of the stream rates directly;
consequently, indirect methods were employed.
Direct Measurements
(l)Char output rate. Char output was determined by collecting and weighing
the char over a one to two hour interval in the middle of the run, usually
covering the tracer gas measurement period.
(2)Gas analysis. The composition of gas with and without nitrogen tracer
was determined with an Applied Automation on-line process gas chroma tograph
(GO which drew a continuous sample from a point downstream from the cyclone.
The GC had a cycle time of about 11 minutes and was able to detect the
following components in the producer gas: H 2 , COj, CO, CH« , Oi and N 2 along
with traces of C lH< , C2H4 and CiUt .
(3)Condensables. Condensables consisted of two parts, tar and aqueous.
These were determined by taking a side draw from the main gas stream at rate
of about 0.55 m'/hr. This stream also supplied the GC with sample. The gas
was first sent through a hot filter which was packed with glass wool to remove
heavy tar components. Next the gas was sent through two water cooled
condensers in series to remove most of the water. The remaining water removal
5-7
was accomplished with two receivers placed in series in an ice bath. The
remaining tarry mist was then removed by passing the stream through a tightly-
packed glass wool filter. Flow through the sample train was maintained with
the aid of a 'Gasf compressor which provided suction. The discharge from the
compressor was then sent through a wet test meter, followed by a drierite
chamber and then to the GC. The wet test meter readings were corrected for
temperature, pressure, water of saturation and air, and tracer gas when
needed. The aqueous condensates were collected and weighed. The tar was
collected, however, it was not measured, because prior experience showed that
negligible amount of tar was present (Walawender et al., 1985). The known
volume of dry gas flowing through the sample train allowed the amount of
condensate to be converted to a mass per unit volume dry gas basis.
(4) Temperatures. Temperatures at various positions in the system were
monitored over the course of each run. Sir thermocouples were placed in the
system to monitor the temperatures at the following positions: just above the
the upper tuyeres (drying zone), 0.1m above the grid plate (one 1 cm from the
shaft and one half way between the wall of reactor and shaft), 0.1 m below the
grid plate, just before the fan inlet, and at the outlet of cyclone. The
temperature data were recorded at 15 to 60 minute intervals.
Indirect Measurements
(l)Dry product gas rate. The dry product gas rate was indirectly
determined with the aid of a tracer technique. Nitrogen gas was introduced
into the product gas at a know volumetric rate at the fan inlet. From the
known tracer injection rate and the nitrogen composition of the gas with and
without tracer, the dry gas volumetric flow rate could be readily evaluated by
a nitrogen balance. Knowing the molecular weight of the gas allowed the dry
gas volumetric rate to be converted to a mass basis.
5-8
(2)Dry air and moisture input rates. The dry gas flow rate, coupled with a
nitrogen balance between the inlet and outlet of the gasifier, allowed the dry
air input rate to be evaluated. This balance assumed that negligible nitrogen
was produced in the gasification process. Knowing the temperature and
relative humidity of the ambient air over the course of an experiment allowed
the moisture input from humid air to be evaluated. Since most experiments
were of five hour duration, the moisture evaluation was based on mid-run
conditions.
(3)Feed rate. The feed rate for each run was determined by a carbon
balance between the inputs and outputs of the gasifier. Among the inputs,
only the feedstock contained carbon which was determined by elemental
analysis. Carbon existed in two output streams, the product gas and char; the
former was determined from the gas analysis and the latter, by elemental
analysis. With the rate of gas and char already determined, the feed rate
could then be calculated from a carbon balance on the system.
(4)Condensate rate. The directly measured amount of condensate (in mass
per unit volume dry gas) and the calculated dry gas flow rate allowed the
total condensate output rate to be evaluated.
Operating Parameters
Three operating parameters were investigated in this study, the type of
feedstock ,bed support and grate rotation speed.
Feedstocks
Two feedstocks were used in this study; they were mixed hardwood chips
5-9
(wood chips) and wood pellets (contaminated with about 10* wood chips). The
properties of the feedstocks are detailed later.
Bed Supports
The bed was supported by a rotating grate. The grid plate had a diameter
of 56 cm with 48 open slots. Each slot had dimensions of 11x52 mm and was
rounded at the ends. The open area of the grid plate was estimated to be
approximately 12* of the cross section of the gasifier. Three different bed
supports were used in turn in this study; the first was with 9 cm bed of
ceramic balls(19mm diameter) on the grid plate (W/B) , the second, without the
balls, but with about half of the open area blocked by broken ceramic balls
(W01) , and last, an open grid plate (WO).
Grate Rotation
The grate rotation speed was independently controlled. The rotation speed
used in this study ranged from 3 to 14 minutes per revolution.
Chemical and Physical Analyses
These analyses included moisture and ash analyses of the feed and char, and
elemental analysis of the feed and char. Moisture was determined by drying in
an oven for three hours at 380°K. Ash was determined in a muffle furnace by
standard ASTM procedure. The elemental analyses of feed and char were
conducted with a Perkin-Elmer Model 240b Elemental Analyzer.
5-10
Feedstock properties
Table 1 presents various properties of the two feedstocks, wood chips and
wood pellets. The wood chips contained a minor portion of bark. The wood
pellets were contaminated with about 10* wood chips. The properties presented
in Table 1 include the elemental analysis (C,H,0 and N) , ash content (dry
basis), moisture content (wet basis), bulk density, size distribution and
higher heating value.
TREATMENT OF DATA
Calculations
The performance of the gasifier was evaluated in terms of a variety of
measures determined from the gas composition, material balance data and
chemical and physical analyses. Material balance closure was defined as total
mass output divided by total mass input. The inputs included air (with
moisture) and the wet feedstock. The outputs included dry product gas,
condensate, and char. The dry gas composition provides one measure of
gasifier performance and from it, the higher heating value of the dry gas was
evaluated from the standard heats of combustion of the dry gas components.
The gas and char yields provide other measures of performance. These were
calculated on the basis of a unit mass of dry feed to eliminate the influence
of feed moisture variations. An ash-free basis was not used since the ash
contents of the dry chips and pellets were less than 1 *. Char yield was
5-11
expressed as the mass of char per unit mass of dry feed (DF) and gas yield was
expressed on a volumetric basis as m»/kg DF. The volume basis used in this
work was 289°K and 101.3kPa. Also evaluated were the water output ratio as
mass of condensate per unit mass DF and the air-to-feed ratio as mass of dry
air per unit mass DF . The total energy output (cold gas) was evaluated in
MJ/hr and the energy yield (cold gas) in MJ/kg DF. The cold gas efficiency
was evaluated as the ratio of the higher heating value of the dry gas produced
from a unit mass DF to the higher heating value of a unit mass DF. This
efficiency represents the fraction of the energy content of the feed converted
to combustible gas. The mass conversion efficiency was evaluated as the ratio
of mass of the dry gas output to the total mass input.
Statistica l Analysis
Means and Standard Deviations
Means and standard deviations were evaluated for the various performance
measures, including the dry gas higher heating value, volumetric gas yield,
water output rate, dry air input, energy yield, mass conversion efficiency,
cold gas efficiency, the highest observed temperature (either of the two
temperatures monitored 0.1m above the grate) and the dry gas composition. For
each performance measure, the statistics were evaluated for all runs and for
the runs with closures greater than 95%. For the dry gas composition, the
statistics were evaluated for all runs, for runs with wood chips and for runs
with wood pellets.
5-12
Regression Analyses
For the performance measures which appeared to show distinct trends with
changes in the operating parameters or other performance measures, regression
analyses using the SAS (Statistical Analysis System) software package were
conducted. These analyses included (1) the char yield, cold gas efficiency
and air ratio as a function of the grate rotation speed with the type of feed
as a parameter, (2) the cold gas efficiency and air ratio as a function of the
char yield, and (3) the total energy output as a function of the dry feed
rate. The regression models and model parameters are summarized in Table 4.
along with the square of the correlation coefficient (*») and the probability
of falsely rejecting the proposed regression model (prob. F-value !' F-
statistic in F-test for significance of regression). The parameters within
parentheses in the first six models (see Table 4) were determined by a search
technique and then the remaining ones were determined by linear regression.
The first six models were transformed to logarithmic scales prior to the
conduct of linear regression.
RESULTS AND DISCUSSION
Results
A total of 16 runs were completed, and 14 had material balances within 5%
of closure, (i.e.. 95-105%); the other 2 runs had closures within 6%. Table 2
presents the operating parameters, feed species (with the moisture content of
the as-received feed), bed support and grate rotation speed, and various
5-13
measures of the gasifier performance. The table is arranged according to the
feed species and the type of bed support. Included in the table are the dry
feed (DF) rate in kg/hr, the gas higher heating value (HHV) , the volumetric
gas yield, the char yield, the energy yield MJ per kg DF, the dry air input
rate in kg/kg DF. the mass conversion efficiency, the cold gas efficiency and
the highest observed temperature. The means and standard deviations for the
complete data set and the 14 runs with closures greater than 95% are given at
the bottom of the table. The rotation speed of the grate varied from 3 to
13.7 min/rev. The dry feed rate ranged from 18.2 to 74.3 kg/hr. The gas HHV
varied from 5.64 to 6.45 MJ/m» with a mean of 6.07 MJ/m' . The volumetric gas
yield varied from 1.35 to 2.20 m>/kg DF with a mean of 1.95 m»/kg DF. The
char yield varied from 4.38 to 28.31 kg/kg DF with a mean of 12.51 kg/kg DF.
The energy yield varied from 8.33 to 13.64 MJ/kg DF with a mean of 11.80 MJ/kg
DF. The total energy output ranged from 216 to 824 MJ/hr. The water output
rate ranged from 0.148 to 0.481 kg/kg DF with a mean of 0.216 kg/kg DF. The
dry air input rate varied from 0.97 to 1.60 kg/kg DF with a mean of 1.40 kg/kg
DF. The mass conversion efficiency varied from 72.1 to 89.7% with a mean of
85.6%. The cold gas efficiency ranged from 49.1 to 80.3% with a mean of
69.5%. The highest observed temperature ranged form 853 to 1172°K with a mean
of 1010»K,
Table 3 summarizes the dry gas compositions (mole %) for all the runs. The
principal components of the product gas were Ha < QQ t cO, # CH4 and Ni with
trace amounts of C2H» , C 2H 4 and CjHi. The means and standard deviations for
all runs, for wood chips, and for wood pellets are also provided at the bottom
of the table. Although the data show some fluctuation, no distinct trends
were observed as the operating parameters varied. However, the means for the
hydrogen compostion were significantly different for wood chips, 12.2%, and
for wood pellets, 16.11%; this was determined by applying the pooled t-test to
5-14
determine the significance of difference of the two means, which gave 0.001
for Prob.>ltl .
Figures 2 through 4 present the variations of char yield, cold gas
efficiency, and air ratio as a function of the rotation speed of the grate,
respectively. The data are presented in 3 groups, (1) for wood chips with the
ball bed (4 runs), (2) for wood pellets with the ball bed (2 runs), and (3)
for wood pellets without the ball bed (10 runs). For groups 1 and 3,
asymptotes were observed as the grate rotation approached 3 min/rev. The
regression lines (see Table 4) for groups 1 and 3 are included in the figures.
Unfortunately, the sample sizes were too small to statistically test for
significant differences between the regression models for groups 1 and 3,
although a definite difference appears to exist.
Figures 5 and 6 present the variations of the cold gas efficiency and the
air to feed ratio as a function of the char yield, respectively. Although the
data show some fluctuation, a linear correlation was determined by the least-
squares method. The parameters and statistics are included in Table 4. The
two lowest points in Figures 5 and 6 correspond to the two points at 3 min/rev
in Figures 2, 3, and 4.
Figure 7 shows the total energy output as a function of the dry feed rate
for the present gasifier, as well as for the previous gasifier (Walawender et
al., 1985) for comparison. In fitting the present data by the least-squares
method, the two data points at 3 min/rev were excluded. As can be seen from
the figure, both data sets were well described by straight lines. Table 4
presents the statistics. It is interesting that these two lines almost
coincide with each other, considering the large differences in grate rotation
speeds in the two gasifiers. The previous gasifier was operated with maximum
grate rotation of the order of 20 min/rev.
5-15
Discussion
The 16 experimental runs can be classified, according to feed species and
the type of bed support, into three groups, (1) wood chips with the ball bed
(4 runs), (2) wood pellets with the ball bed (2 runs), (3) wood pellets
without the ball bed, including (a) W01 (3 runs) and (b) WO (7 runs). Since
the sample sizes of the three groups are relatively small, a statistical
analysis for determining the effect of the operating parameters on the
gasifier performance is not possible. However, a rather primitive qualitative
assessment can be made.
Comparison of the results for groups 2 and 3 (a and b) reflects the
influence of the bed support on the gasifier performance, for wood pellets.
Only a few of the performance measures exhibited noticeable trends as the
rotation speed of the grate increased. These are shown in Figures 2 through
4. As can be seen from the Figures, the data points for groups 2 and 3,
although scattered, show no definite trend from one group to another as the
rotation speed of the grate varied. Therefore, it appears the the three
different bed supports have no significant influence on the gasifier
performance
.
Comparison of the data for group 1 and 3 illustrates the influence of feed
type on the gasifier performance. As can be seen from Figures 2 through 4,
different regression lines described the data for the two groups. The char
yield was lower for chips than for pellets, the cold gas efficiency was higher
for chips than for pellets, and the air ratio was higher for chips than for
pellets .
The shortest average residence time of the solid phase in the active zone
5-16
of the gasifier for the 16 completed runs was estimated to be in the order of
20 minutes. The average residence time was evaluated by dividing the length
of active zone of the gasifier (approximately 0.3m) by the average solid phase
velocity in the active zone. The time required for complete pyrolysis of
various types large particles in a moving bed downdraft gasifier was reported
by Reed and Markson (1982) to be less than 5 minutes. Therefore, it can be
concluded that the residence time of solid phase in this study was sufficient
for complete pyrolysis of the solid phase in all the runs. Consequently, the
residence time was not responsible for the difference in char yield between
wood chips and wood pellets.
The difference in char yield between wood chips and wood pellets is
probably due to the differences in the dimensions and physical properties
(e.g.. density and porosity) of the two feedstocks. It is known that char
yield is higher for large particle than for small particle. Chan et al .
(1985) reported that the char yields for wood pyrolysis under fire-level
radiation were 19% and 24% for the pellets with characteristic dimensions of
0.5 cm and 1.5 cm, respectively. The smallest dimension (representing the
characteristic dimension) of the wood chips ranged from 2 to 5 mm, and that of
wood pellets ranged from 12 to 14 mm. The dimension ratio of pellets to chips
ranged from 3 to 7 . Therefore, the char yield of wood pellets can be expected
to be higher than wood chips because of their differences in dimensions. In
addition, the wood pellets were about twice as dense as the wood chips (see
Table 1). Therefore, the particle porosity for pellets can be expected to be
smaller than that for wood chips (by a factor of about 1/2). The variation of
char yield with the particle density or porosity of the feedstock has not been
determined. However, it is intuitively expected that it has a role in
determining the char yield.
5-17
As the grate rotation speed increased, a sharp increase in char yield and a
sharp decrease in the air to feed ratio were observed. The air to feed ratio
dropped to about 1.2 and 1.0 for wood chips and wood pellets respectively.
Our previous study (Walawender et al.,1985) showed that by maintaining an
average air to feed ratio at 1.6, we were able to obtain an average char yield
of 3.3% for the gasification of wood chips. Furthermore, Run 08/29 of this
study had a char yield of 4.8% with an air to feed ratio of 1.6. These
observations suggest that the increase in char yield with increasing grate
rotation speed was a result of the decrease in the air to feed ratio. This is
supported by the decreasing linear relationship between the air to feed ratio
and the char yield shown in Figure 6. Unfortunately, the air to feed ratio
for the present gasifier can not be independently controlled. In principle,
the air input will be determined by the depth and porosity of the bed and the
pressure drop across the bed. The fast rotation of grate might have caused a
dramatic change in the bed porosity due to the action of the tuyeres and the
pressure distribution in the bed, which in turn resulted in a sharp increase
in the char yield. This was suggested by the decrease in the total air input
at high grate rotation speed.
The cold gas efficiency was found to decrease linearly with increasing char
yield. This relationship along with the decreasing linear relationship
between the air to feed ratio and char yield implied a linear relationship
between the air to feed ratio and cold gas efficiency. Note that the cold gas
efficiency represents a conservative estimate of the actual first law
efficiency for the gasifier. In other words, by maintaining an adequate air
to feed ratio a high efficiency will result.
Table 5 summarizes the operating conditions and various performance
measures for the present study and the previous study (Walawender et
5-18
al.,1985). As can be seen from the table, despite the differences in
operating conditions used for the two gasifiers, most of the performance
measures are essentially the same, including the gas yield, water output,
energy yield, cold gas efficiency, mass conversion efficiency and gas
composition. However, the average char yield of the present gasifier was
three fold larger than that of the previous gasifier. The average air input
of the present gasifier, 1.44 kg/kg DF, was also significantly different from
that of the previous gasifier, 1.60 kg/kg DF; this is supported by the pooled
t-test, which gives 0.005 for Prob.>ltl. Another difference is the dry gas
HHV, which was 6.08 MJ/m» for the present gasifier and 5.51 MJ/m» for the
previous one; the Prob.>ltl for the pooled t-test was 0.001. The energy
output rate of the present gasifier was lower than that of the previous one
almost by a factor of 1/2, however the throughput was also lower.
CONCLUSIONS
The results of this work show that the performance of the gasifier used in
this study is similar to the gasifier used in previous study. From the
viewpoint of the total energy output, the gasifier treated wood chips and wood
pellets as if they were the same.
The char yield was shown to sharply increase at high rotation speed of the
grate and level out at slow rotation speed of the grate. The air to feed
ratio and cold gas efficiency were shown to decrease linearly with increasing
char yield. The cold gas efficiency was shown to increase linearly with
increasing the air input.
The char yield from wood pellets was shown to significantly higher than

5-19
that from wood chips. The higher yield was a consequence of the higher
characteristic dimension.
The use of three different bed supports was shown to have no significant
influence on the performance of the gasifier when comparable operating
conditions were used.
5-20
REFERENCES CITED
Bain, R. , 'Benefication of Biomass for Gasification and Combustion,' in A
Survey of Biomass Gasification, T.B. Reed, Ed., Vol. 3, 1-25.
SERI/TP-33-239(1980) .
Chan, W. R. , Marcia Kelbon and B. B. Krieger, 'Product Formation in the
Pyrolysis of Large Wood Particles,' in Fundamentals of Thermochemical
Biomass Conversion, Elsevier Science Pub. Co., New York, 219-236 (1985).
Goldstein, I. S. , 'Wood as a Source of Chemical Feedstocks,' in Energy and
Environment Concerns in the Forest Products Industry, AIChE Symposium
Series 177, 74, 111-114 (1978).
Reed, T. B. , et al., 'A Survey of Biomass Gasification,' Vol. 2-3,
SERI/TP-33-239(1980) .
Reed, T. B. , and D. E. Jantzen, 'Generator Gas - The Swedish Experience from
1939-1945,' (translated from the work of the Swedish Academy of
Engineering) SERI/TP-33-23 9 (1980).
Reed, T. B. , and M. Markson, 'A Predictive Model for Stratified Downdraft
Gasification of Biomass,' Presented in Proceedings of the 14th iHomass
Thermochemical Conversion Contractors Meeting. Atlanta, GA (1982).
Walawender, W. P., S. M. Chern, and L. T. Fan, 'Wood Chip Gasification in a
Commercial Downdraft Gasifier, ' in Fundamentals of Thermochemical Biomass
Conversion, Elsevier Science Pub. Co., New York, 911-922 (1985).
Zerbe, J. J., 'The Contribution of Wood to the Energy Picture,' presented at
Conference on Wood - An Alternate Energy Resource for Application
Industry and Institutions, Proceedings published by School of
Engineering, North Carolina State University (1981).
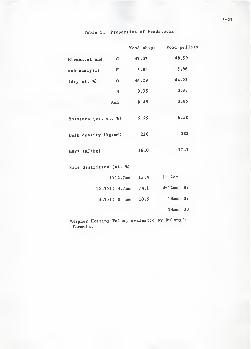
5-21
Table 1. Properties of Feedstocks
Wood chips Wood pellets
Elemental and C 47.07 48.59
ash analysis H 5.84 5.96
(dry wt. ft) 46.29 44.23
N 0.35 0.37
Ash 0.45 0.85
Moisture (wet wt. ft) 9.99 6.50
Bulk density (kg/m>) 23 6 5S5
HHV* (MJ/kg) 16.0 17.1
Size distrition (wt. ft)
1>12. 7mm 15.4 1~ 2 cm
12,,7>1> 4,,7- 74.1 d=12 mm 33
4.,7>1> mm 10.5 13
14
mm 33
mm 33
•Higher Heating Value, evaluated by Dulong's
formula
.
5-22
Table 2. Performance Summary
Run Feedstock Feed Moisture Bed Rotation of Dry Feed
(% wet basis) Grate(min/r) rate(kg/hr)
08/27 Chips 10.30 W/B 1 5.25 64.2
08/28 Chips 9.99 W/B 4.66 57.9
08/29 Chips 9.67 W/B 3.00 74.3
08/29 Chips 9.67 W/B 9.90 38.8
09/10 pellets 1 6.71 W/B 4.23 39.8
09/11 pellets 6.11 W/B 6.00 18.2
09/24 pellets 6.49 W01* 13.70 44.5
09/28 pel lets 6.49 WOl 10.80 49.5
10/01 pellets 6.49 WOl 7.33 56.9
10/03 pellets 6.74 wo-1 12.50 58.8
10/05 pellets 6.42 wo 9.58 56.6
10/05 pe llets 6.42 TO 6.13 70.0
10/08 pellets 6.49 wo 9.65 60.8
10/10 pellets 6.49 wo 3 .00 46.3
10/12 pellets 6.49 TO 9.83 41.1
10/15 pellets 6.49 wo 10.00 57.0
'Wood pellets conteminated with about 10% wood chips.
2With ceramic balls bed.
'Without ceramic balls bed but with the grid plate half blocked.
4 Wihtout ceramic balls bed.
Run Matl .Balance Dry Gas HHV
Closure(%) (MJ /m> )
08/27 100.74 5.911
08/28 103 .06 6.064
08/29 106.30 5.945
08/29 104.2 8 6.190
09/10 100. OO 1 6.261
09/11 98.38 5.993
09/24 101.72 5.640
09/28 103.94 5.829
10/01 102.01 6.145
10/03 104.12 6.186
10/05 99.56 6.023
10/05 100. 00 1 6.231
10/08 101.91 5.982
10/10 94.31 6.171
10/12 98.16 6.450
10/15 100.19 6.142
All datamean — 6.071
a — 0.193
>95%mean — 6.07 5
o — 0.202
5-23
Table 2 . Continued
Gas Yield Char Yield H2o Out
(m> /kg DF°)(kg/100kg DF) (kg/kg DF)
0.3 03
0.359
0.481
0.354
0.214*
0.184
0.3 01
0.261
0.234
0.312
0.202
0.209 1
0.2 51
0.171
0.148
0.187
2, 00
2..00
1 55
2 20
1 ,96
1 .98
2 .01
2 .10
1 .93
1 .95
2 .00
1 .89
2 .18
1 .35
1 .37
2 .07
1 .95
.22
2 .02
.10
9. 53
9. 95
21 .29
4 .38
10 .7 5
10 .64
12 .22
9 .90
11 .71
13 .12
13 .14
13 .74
8 .44
28 .31
12 .82
10 .26
12 .51
5. 455
10 .7 5
2. 42K
0.2610.0872
0.251
0.0658
"Dry feed.1 Closure was forced to 1 to determine (by difference) the H 2q output,which was not measured.
2 By difference.
Table 2 . Continued
Run Dry Air In Energy Yield Total Energy Out
(kg/kg DF) (MJ /kg DF) (MJ /hr)
08/27 1.53 11.80 757.9
08/28 1.50 12.11 701.7
08/29 1.22 9.22 686.0
08/29 1.60 13.64 529.1
09/10 1.39 12.27 488.2
09/11 1.49 11.89 216.5
09/24 1.60 11.75 523.7
09/28 1.45 12.23 605.4
10/01 1.35 11.88 676.3
10/03 1.35 12.08 710.1
10/05 1.40 12.05 682.1
10/05 1.32 11.78 824.4
10/08 1.52 13.02 791.3
10/10 0.97 8.33 385.8
10/12 1.26 12.02 493.3
10/15 1.40 12.69 723.5
All data
mean 1.40 11.80 —a 0.16 1.29 —
>95%mean 1.44 12.23
a 0.10 0.54
5-24
[ass Conversio
Eff iciencyOb)
85. 81
85.,64
76,,70
89 ,71
87 .03
87 .10
85 .99
89 .69
87 .54
85 .95
86 .11
85 .61
89 .07
72 .14
M .39
88 .53
83 .56
4 .65
S7 .16
5-25
Table 2 . Continued
Run Cold Gas Highest Temp.
Eff iciencyOb) Observed (»K)
08/27 69.49 1008.3
08/28 71.34 986.1
08/29 54.32 977.8
08/29 80.32 983.3
09/10 72.24 852.8
09/11 70.05 947.2
09/24 69.22 966.7
09/28 72.03 1172.2
10/01 69.97 1005.6
10/03 71.17 1005.6
10/05 70.95 994.4
10/05 69.37 983.3
10/08 76.69 1093 .3
10/10 49.08 1025.0
10/12 70.78 1052.8
10/15 74.71 1166.7
All datamean 69.48 1013.9
a 7.61 78.9
>951b
mean 72.02 1015.6
a 3.18 83.9
5-26
Table 3. Dry Gas Composition (*)
Run H, CsH« COi C 2H< C 3 H. Ni CH4
8/27 11.68 0.31 15.74 1.10 0.20 49.28 3.29 18.39
08/28 12.66 0.25 14.94 1.00 0.19 48.41 3.50 19.05
08/29 10.20 0.34 15.30 1.22 0.21 50.54 3.49 18.70
08/29 14.28 0.23 14.99 1.03 0.17 46.7 8 3.29 19.23
09/10 14.93 0.21 14.81 0.80 0.17 45.62 3.45 20.01
09/11 12.79 0.24 15.81 0.81 0.20 48.31 3.96 17.88
09/24 14.42 0.18 14.95 0.68 0.18 49.50 3.16 16.94
09/28 17.53 0.08 15.01 0.60 0.10 44.62 2.25 19.81
10/01 15.47 0.16 15.34 0.72 0.17 45.13 3.28 19.73
10/03 17.37 0.14 13.91 0.68 0.11 44.56 2.78 20.45
10/05 17.62 0.09 13.43 0.55 0.09 45.02 2.53 20.66
10/05 16.28 0.18 15.01 0.82 0.15 45.10 3.26 19.20
10/08 17.27 0.09 12.6 8 0.51 0.08 45.18 2.21 21.98
10/10 15.27 0.19 14.07 0.76 0.15 46.24 3.20 20.11
10/12 16.52 0.21 15.11 0.82 0.18 43.63 3.33 20.20
10/15 17.86 0.08 13.23 0.51 0.08 43.82 2.49 21.93
All data
meano
15.13
2.88
0.19
0.08
14.640.91
0.790.21
0.15
0.05
46.3 6
2.18
3.090.50
19.641.33
Chipsmean
o
12.201.71
0.280.05
15.240.37
1.090.10
0.190.02
48.751.58
3.390.11
18.840.37
pelletsmean
o
16.111.56
0.150.06
14.450.96
0.690.12
0.140.04
45.561.73
2.990.54
19.911.44
5-27
u 1
Ml -—© «oM-P I
a h
o CO
o +J O *J O -t-»
fi
5
5-28
Table 5. Comparisons of the Present Study with the
Previous Study (Walawender et al., 1985).
Study Present Previous
Operating parameters:
Feedstocks
moisture (wet %)
Bed support
Grate rotation (min/r)
Material balance closure (%)
Input: Dry feed rate (kg/hr)
Dry air in» (kg/kg DF)
Output :Gas yield* (m'/kg DF)
char yield* (kg/kg DF)
water out* (kg/kg DF)
Mass conversion ef f iciency(9>)
Energy aspects
:
Dry gas HHV (MJ/m 1) 6.08 5.51
Energy yield(MJ/kg DF) 12.2 12.0
Energy output (MJ/hr) 220-820 310-1430
Cold gas ef ficiency(%) 72.0 71.5
Gas compost ion: (%)
Major components
Chips, pellets Chips
9.99 ,6.50 10.33
W/B,W01,WO W/B
3-14 20-30**
94-106 80-115
18-7 4 27-126
1.44 1.60
2.02 2.19
0.108 0.0334
0.25 0.26
87.2 87.9
H, 15.1
CO 19.6
CH, 3.09
CO, 14.6
N, 46.4
15 .1
19 .1
2 .51
15 .8
46 .8
•Mean for the runs within of 5* closure.
••Estimated.
Cyclone
Electric
Eye
Figure I. Commercial Gasifier.
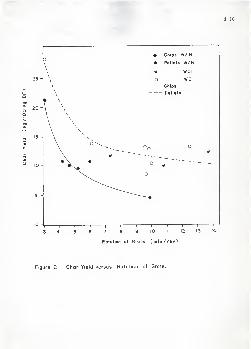
5-30
25
20 "
10
Chips W/ B
• Pellets W/B
a wot
WO- Chips
- Pellets
t 1 1 1 11 1 1
1 I Ir^
3 4 5 6 7 8 9 10 II 12 13 14
Rotation of Grate (min/rev)
Figure 2 Char Yield versus Rotation of Grate.
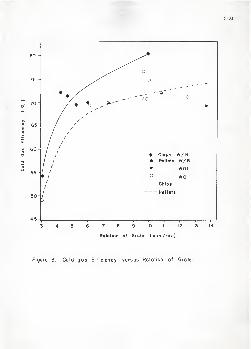
5-31
80 -
O
75 -
3| 70-
g 65-
5
u
/ %/ ^*/ // // /"
/ /
/ /
/ /
/ /
>'" ' -- oo °e
« 60 -o
o
/ // /
/ /
/ /
Chips W/B• Pellets W/B
o° 55-
/ /
/ /
* /
/
/
9 WOI
WOThinwRipi
50-/ Pellets
45-
6 7 8 9
Rotation of Grate (min/rev
10 II 12 13 14
Figure 3. Cold gas Efficiency versus Rotation of Grate.
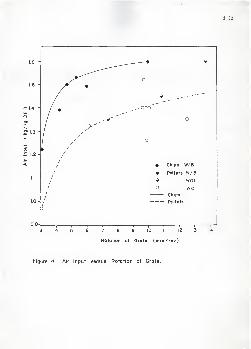
5-32
1.6 " ___——- ©
1.5 -/ •
1.4 -
1.3"
/ •
/ -©""/ o"'
\ /\ /1 /1 /
__ _ co"
o
o
1.2- //
/
/ «. Chips W/B
/ • Pellets W/B1.1 - /
/e woi
o WO/
/
i
Chips
1.0- Pellets
0.0- r i 1 1 1 1 1 1 1 1 11
4 5 7 8 9 10 II 12 13 14
Rotation of Grote (min/rev)
Figure 4. Air Input versus Rotation of Grate.
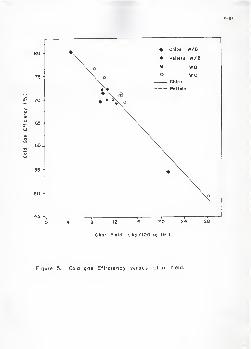
5-33
80
75
70 -
65 -
60.
55
50 "
45 -
1
-168 12 16 20
Char Yield ( kg /I00 kg DF )
24 28
Figure 5. Cold gas Efficiency versus Char Yield.
5-34
Chips W/B1.6 - *\ ® • Pellets W/B
- WOI
1.5"
o wo
Chips
Pellets
1.4- q,\o
Q13 H
1.2-
o o\* \
o
\
< I.I"
1.0 -
0.9 -1 1 1 1 T 1 1 "1"
4 6 12 16 20 24
Char Yield ( kg /I00 kg DF )
Figure 6. Air input versus Char Yield.
28
5-3 5
1600-O Current gasifier
Previous gasifier
1400"/
//
//
— 1200--C
O /^s /"3 /Z /
1000-/
//
3 /Q.
aO
j#800->>
c» ~ /"Orf«
cUl /"
600-
400-
200- 420 40 60 80 100 120
Dry Feed Rate (kg/hr)
Figure 7. Energy Output versus Dry Feed Rate.
CHAPTER 6
CONCLUSIONS AND RECOMMENDATIONS
6-1
Air gasification of woody biomass was studied in two (0.6 m ID) commercial
downdraft gasifiers of similar design. The objectives were to determine the
gasifier performance and to investigate the influence of several operating
variables. For the first gasifier, the grate rotational speed was
proportional to the fan speed, with the fan speed being variable. For the
second gasifier, the fan speed was fixed and the grate rotational speed was
variable
.
Studies with the first gasifier investigated the effect of feed rate with
wood chips as the feedstock. The feed rate was proportional to the fan speed
and was varied form 27 to 126 kg/hr. The second gasifier was used to
investigate the effects of the following operating variables: 1) grate
rotation speed, 2) type of feed material, and 3) bed support. The grate
rotation speed was varied from 3 to 14 min/rev. and wood chips and wood
pellets were used as feedstocks. Bed supports consisted of a 9 cm layer of
ceramic balls (2 cm diameter) on top of the grid plate (grate), the grid plate
with half of its available open area obstructed and the unobstructed grid
plate.
Measured data included the feed rate, air input rate, gas output rate, gas
composition, char rate, and condensate and tar rates. These data were used
to evaluate material balance closures for the experiments. The data were also
used to evaluate various gasifier performance measures, including the gas
yield and gas heating value, the mass conversion and cold gas efficiencies,
and the total energy output.
The major results from the experimental studies are outlined below.
For the first gasifier
1. Material balance closures on 16 runs ranged from 80* to 115*, with 9
runs within 5* of closure.
6-2
2. The gasifier performance was found to be remarkably consistent (in terms
of various performance measures) over a four fold range of feed rate, with,
the energy output ranging form 320 to 1430 MJ/hr.
3. Various performance measures, when expressed on a unit mass of dry feed
basis, were found to be independent of the feed rate. The mean for the gas
yield was 2.19 m>/kg; for the gas heating value, 5.51 MJ/m' ;for the char
yield, it was 0.033 kg/kg; for the mass conversion efficiency, it was 87*;
and for the cold gas efficiency, it was 72%.
4. The tar yield was negligible. The mean value for the tar yield was
0.0032 kg per kg of dry chips.
For the second gasifier
5. The char yield was significantly higher for pellets than for chips, due
to the larger characteristic dimension for pellets relative to chips.
6. The char yield increased with increasing grate rotation speed, and the
cold gas efficiency decreased with increasing grate rotation speed. This
behavior was due to an inadequate air-to-feed ratio, a direct consequence
of the fixed fan speed.
7. No significant effects were detected for variation of the type of bed
support
.
Eight data sets from the first gasifier (with material balance closures
within 5*) were used to conduct a detailed mass and energy analysis. The mass
analysis resulted in an empirical stoichiometry for the gasification of wood
chips This was accomplished through a two level adjustment of the original
data which forced both the overall and elemental balances to perfect closure.
The energy analysis was based on the thermodynamic first and second laws. It
evaluated the first law and second law efficiencies for the process for
various operation modes (combinations of different usable products and output
temperatures). Various energy dissipations were also determined, including
6-3
the system heat loss, the exergy loss due to the heat loss and the exergy
dissipation due to irreversibilities of the process.
The important results from the energy analysis are outlined below.
1. The highest first law and second law efficiencies (with all outputs as
usable products at hot output) were 89.5* and 62%, respectively.
2. The lowest first law and second law efficiencies (dry cool gas) were 72%
(agreed with the experimental observation) and 53%, respectively.
3. The system heat loss was 10.5% of the input energy (enthalpy), and the
corresponding exergy loss was 7% of the input exergy.
4. The exergy dissipation due to various irreversibilities of the process
was 31% of the input exergy.
The studies in this thesis have focussed on the material and energy
balances of the process. Very little has been done to investigate transport
phenomena in the system. (Measurement of the pressure drop across the bed was
attempted; however, the data were not reported due to incomplete data.) The
experimental study revealed that an inadequate air-to-feed ratio resulted in a
decrease in the cold gas efficiency as the grate rotation speed increased.
However, with the current gasifiers, it is impossible to control the air-to-
feed ratio arbitrarily. Hence, it is desirable to modify the gasifier to have
the air-to-feed ratio under control. In principle, the air input rate is
determined by the pressure drop across the bed and the bed porosity. The bed
porosity is in turn determined by the bulk density of the feedstock and the
imposed agritation of the bed (e.g., by the rotation of the grate). The use
of fan with powerful suction and variable speed will enable the control of the
presssure drop across the bed. The use of feedstocks with various bulk
densities and various degrees of bed agritation will enable the control of bed
porosity, The control of the pressure drop and the bed porosity together
6-4
makes the control of air input rate possible and hence, the control of air-to-
feed ratio.
Wood ohips and wood pellets were gasified in this thesis. Other biomass
materials, such as peat pellets and paper pellets, can also be used as
feedstocks to investigate the gasifier performance over a wide variety of feed
materials.
Although some temperature measurements were made at various positions in
the system, the data were not sufficient to indicate the temperature
distribution in the system. The measurement of the temperature distribution
is desirable, because the temperature distribution indicates various active
rones in the system. The measurements of product distribution and pressure
distribution in the active zones are also useful to investigate the chemical
processes and transport phenomena in the process, although these are more
difficult to measure.
High char yield from the gasifier is undesirable. However, due to the
nature of the downdraft gasifier, it is impossible to completely eliminate the
char yield. The elimination of the char yield would be possible by
introducing a secondary air (or oxygen) into the char bed. The char would be
consumed partly by the oxidation reaction and partly by gasification reactions
with the gaseous phase (using the heat released by the oxidation reaction).
This concept originates from the updraft gasification which has no char yield.
THE GASIFICATION OF BIOHASS
IN COMMERCIAL DOWNDRAFT GAS1FIERS
SHYH-MING CHERN
B.S. ChE. National Taiwan University, Taipei, Taiwan, ROC 1979
AN ABSTRACT OF A MASTER'S THESIS
submitted in partial fulfillment of tie
requirements for the degree
MASTER OF SCIENCE
Department of Chemical Engineering
KANSAS STATE UNIVERSITY
Manhattan, Kansas
1985
Air gasification of wood chips and wood pellets was studied in two (0.6m
ID) commercial downdraft gasifiers of similar design. The objectives were to
determine the gasifier performance and the influence of several operating
variables. For the first gasifier, the grate rotational speed was
proportional to the fan speed, with the fan speed being variable. For the
second gasifier, the fan speed was fixed and the grate rotational speed was
variable.
Studies with the first gasifier investigated the effect of wood chip feed
rate which was proportional to the fan speed. The chip rate ranged from 27 to
126 kg/hr. Measurements of the feed rate, gas composition, char rate,
condensate rate, gas rate, and air rate were used to evaluate material balance
closures. The data were also used to evaluate gasifier performance measures
including the gas yield and the mass conversion and cold gas efficiencies.
The performance measures, when expressed on a unit mass of dry feed bassis,
were found to be independent of the feed rate. The gas yield averaged 2.19
m'/kg and the char yield averaged 0.033 kg/kg while the mass conversion and
cold gas efficiencies averaged 87* and 72* respectively.
Eight data sets were used to determine gasifier efficiencies based on the
first and second laws of thermodynamics. As a part of the analysis, it was
necessary to develop an empirical stoichiometry for the overall gasification.
Primary and secondary adjustments were made on the data which forced both the
overall and elemental balances to perfect closure. Efficiencies were
determined for different classes of usable products. These included dry cool
gas at one end and moist hot gas with both tar and char at the other. The
first law efficiency (dry cool gas) was 72* and agreed with the experimental
observation. The second law efficiency (dry cool gas) was 53* and the system
heat loss was 10.5* of the input energy (enthalpy). The corresponding exergy
(available energy) loss was 7* of the input eiergy and tie eiergy dissipation
(doe to irrever.ibilitie.) was 31* of the input eiergy. With all of the
products considered usable, the first law efficiency was 89.5% and the second
law efficiency was 62*.
The second gasifier was used to investigate the effects of the following
operating variables: 1) grate rotation speed, 2) type of feed material, and 3)
bed support. The grate rotation speed was varied from 3 to 14 min/rev. and
wood chips and wood pellets were used as feedstocks. Bed supports consisted
of a 9 cm layer of ceramic balls (2 cm diameter) on top of the grid plate
(grate), the grid plate with half of its available open area obstructed and
the unobstructed grid plate. No significant effects were detected for
variation of the type of bed support. For both feed materials, it was
observed that the char rate increased and the cold gas efficiency decreased
with increasing grate rotation speed. This behavior was due to an inadequate
air to feed ratio, a direct consequence of the fixed fan speed. The char
yield was observed to be higher for pellets than for chips. This behavior was
due to the larger characteristic dimension for pellets relative to chips.