Embed Size (px)
Citation preview
Gasification and pyrolysis of poultry litter – An opportunity to produce bioenergy and
nutrient rich biochar
Natalie Taupe
Supervisors: JJ Leahy, Witold Kwapinski
Joint Scientific Workshop 2015 Erfurt, Germany
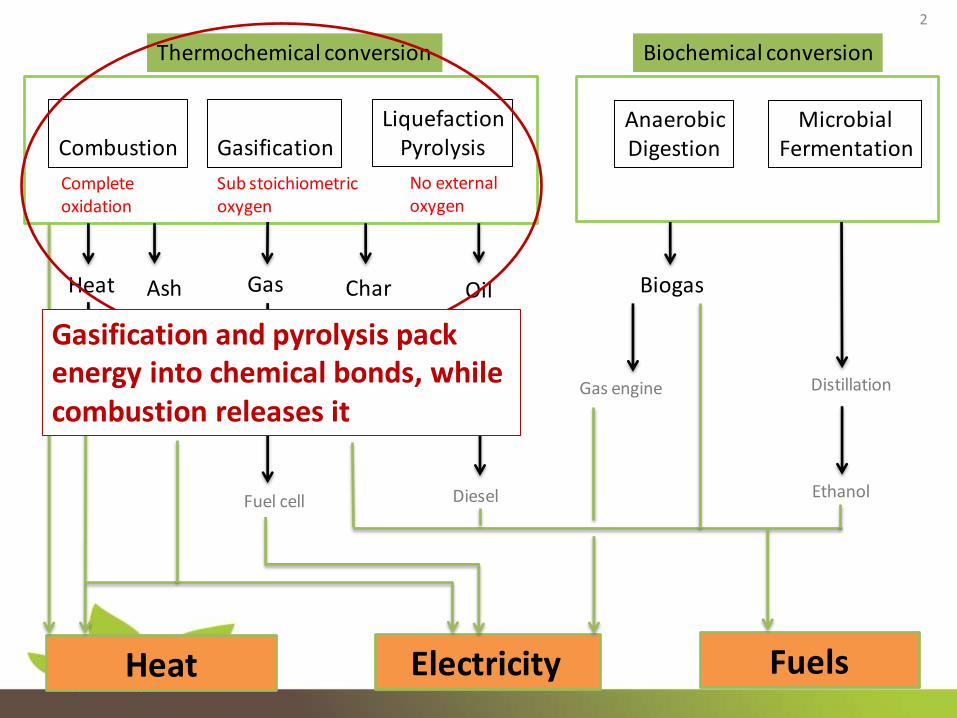
Combustion
Gasification
Liquefaction Pyrolysis
Anaerobic Digestion
Microbial Fermentation
Thermochemical conversion Biochemical conversion
Heat Gas Oil Char Biogas
Distillation Steam turbine
Fuel cell
Gas engine
Ethanol
Gas turbine Engine Boiler
Methanol Hydrocarbons Hydrogen
Upgrading
Diesel
Heat Electricity Fuels
Complete oxidation
Sub stoichiometric oxygen
No external oxygen
Ash
2
Gasification and pyrolysis pack energy into chemical bonds, while combustion releases it
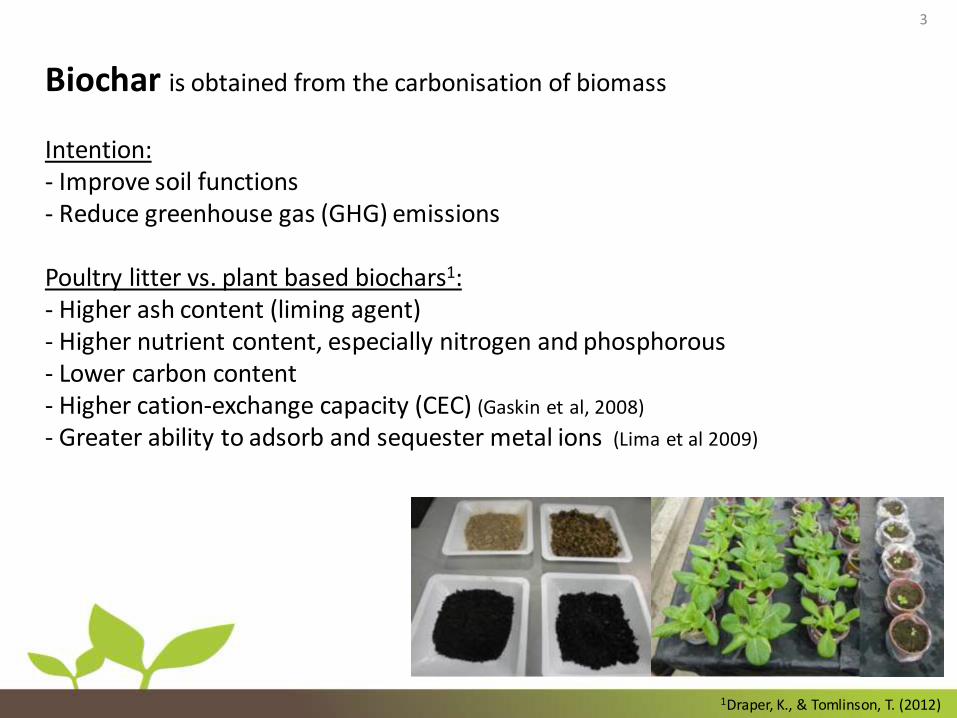
Biochar is obtained from the carbonisation of biomass
Intention: - Improve soil functions - Reduce greenhouse gas (GHG) emissions Poultry litter vs. plant based biochars1: - Higher ash content (liming agent) - Higher nutrient content, especially nitrogen and phosphorous - Lower carbon content - Higher cation‐exchange capacity (CEC) (Gaskin et al, 2008)
- Greater ability to adsorb and sequester metal ions (Lima et al 2009)
3
1Draper, K., & Tomlinson, T. (2012)
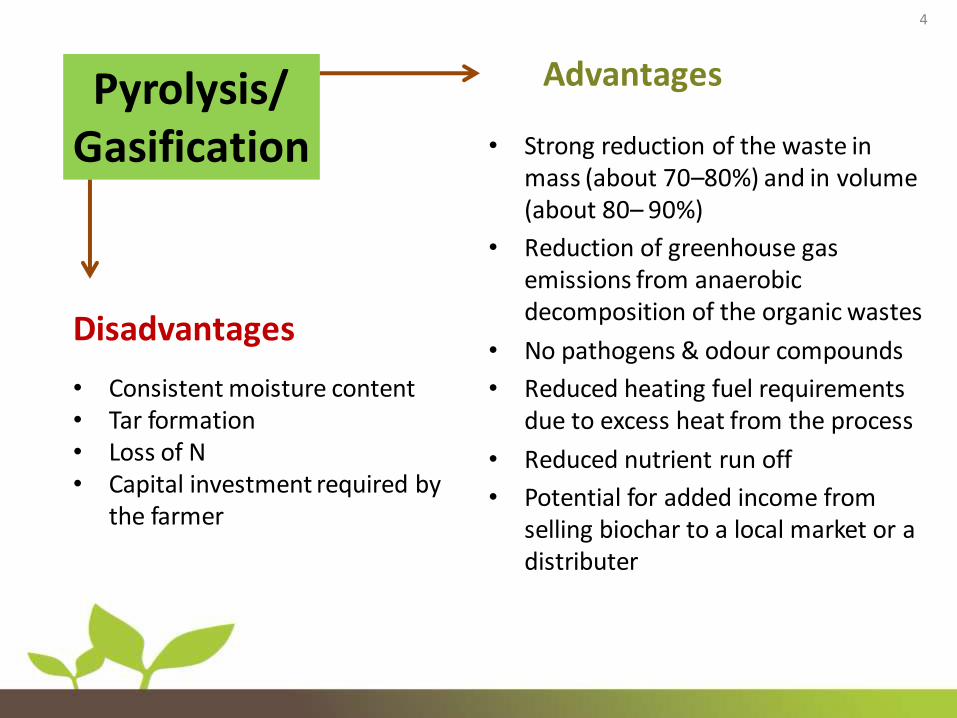
• Strong reduction of the waste in mass (about 70–80%) and in volume (about 80– 90%)
• Reduction of greenhouse gas emissions from anaerobic decomposition of the organic wastes
• No pathogens & odour compounds
• Reduced heating fuel requirements due to excess heat from the process
• Reduced nutrient run off
• Potential for added income from selling biochar to a local market or a distributer
Advantages 4
• Consistent moisture content • Tar formation • Loss of N • Capital investment required by
the farmer
Pyrolysis/ Gasification
Disadvantages
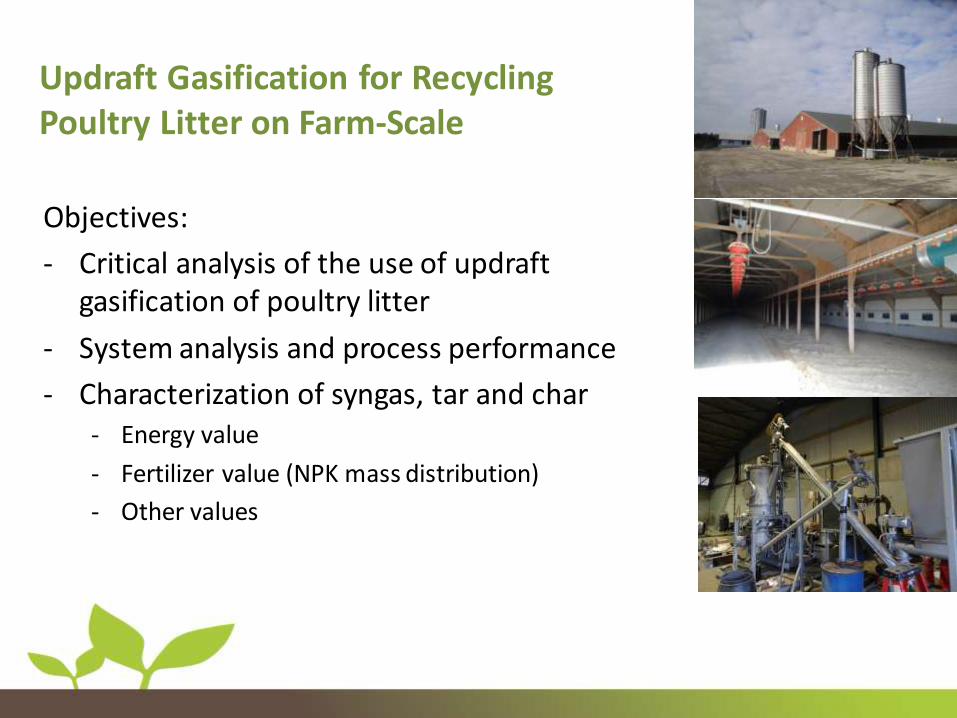
Updraft Gasification for Recycling Poultry Litter on Farm-Scale
Objectives:
- Critical analysis of the use of updraft gasification of poultry litter
- System analysis and process performance
- Characterization of syngas, tar and char - Energy value
- Fertilizer value (NPK mass distribution)
- Other values
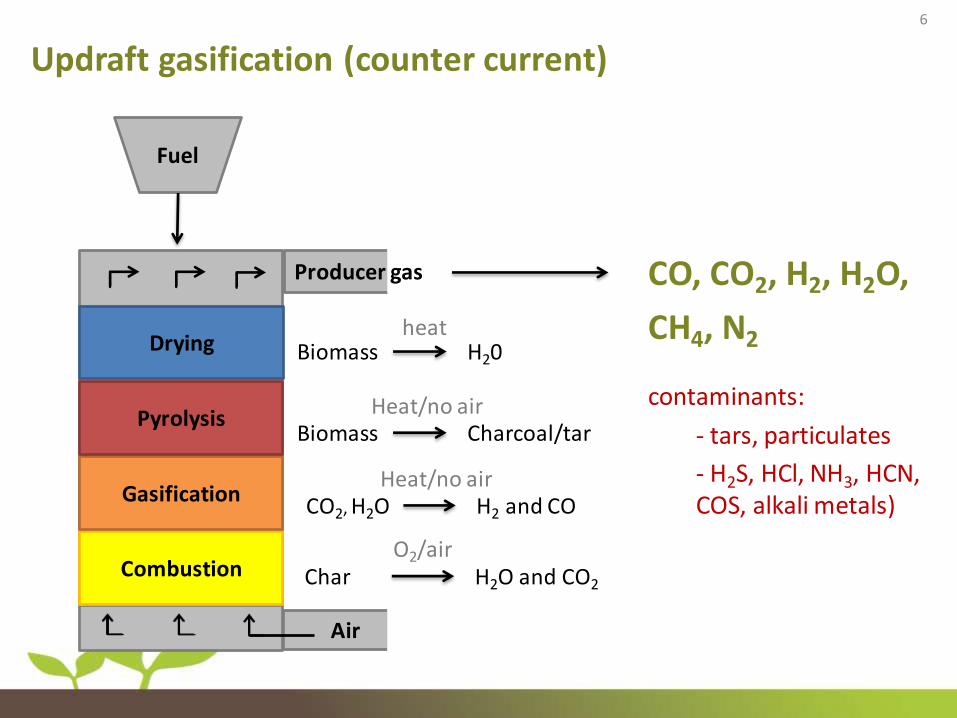
Updraft gasification (counter current)
Drying
Pyrolysis
Gasification
Combustion
Producer gas
Air
Fuel
Biomass H20 heat
Biomass Charcoal/tar Heat/no air
Char H2O and CO2
O2/air
CO2, H2O H2 and CO Heat/no air
CO, CO2, H2, H2O,
CH4, N2
contaminants:
- tars, particulates
- H2S, HCl, NH3, HCN, COS, alkali metals)
6
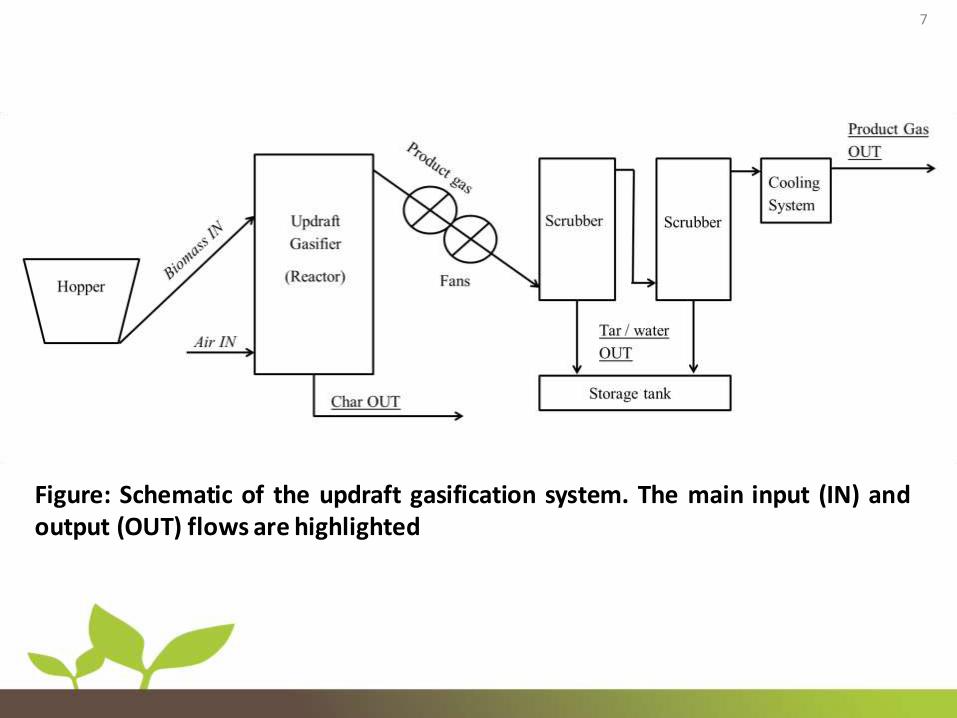
7
Figure: Schematic of the updraft gasification system. The main input (IN) and output (OUT) flows are highlighted
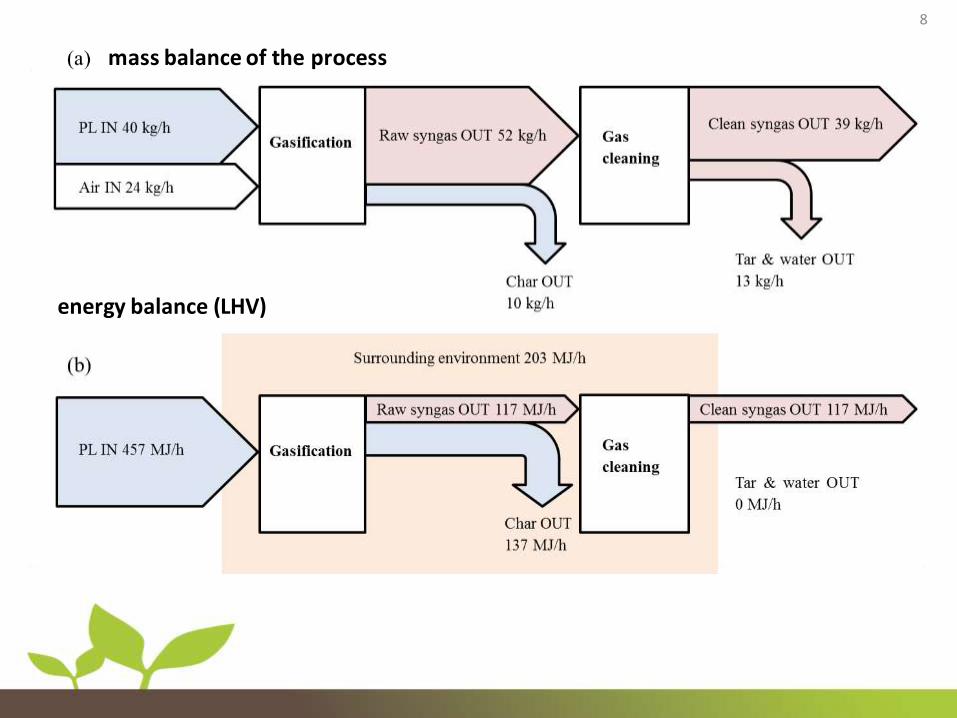
8
energy balance (LHV)
mass balance of the process
PL
feedstock
Requirements
for updraft*
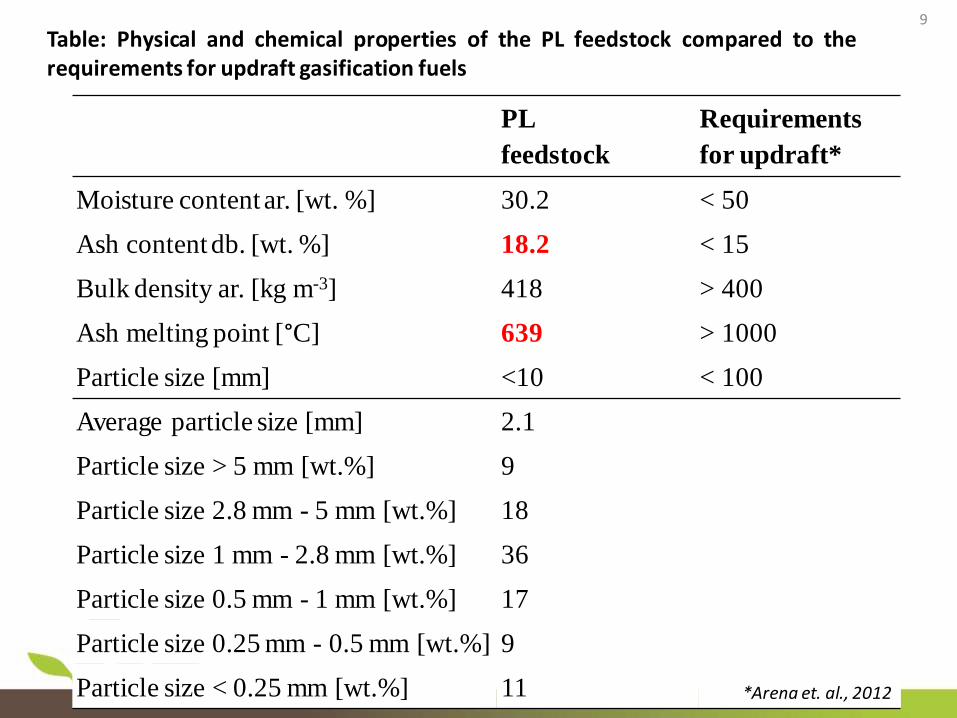
Moisture content ar. [wt. %] 30.2 < 50
Ash content db. [wt. %] 18.2 < 15
Bulk density ar. [kg m-3] 418 > 400
Ash melting point [°C] 639 > 1000
Particle size [mm] <10 < 100
Average particle size [mm] 2.1
Particle size > 5 mm [wt.%] 9
Particle size 2.8 mm - 5 mm [wt.%] 18
Particle size 1 mm - 2.8 mm [wt.%] 36
Particle size 0.5 mm - 1 mm [wt.%] 17
Particle size 0.25 mm - 0.5 mm [wt.%] 9
Particle size < 0.25 mm [wt.%] 11
9
Table: Physical and chemical properties of the PL feedstock compared to the requirements for updraft gasification fuels
*Arena et. al., 2012
10
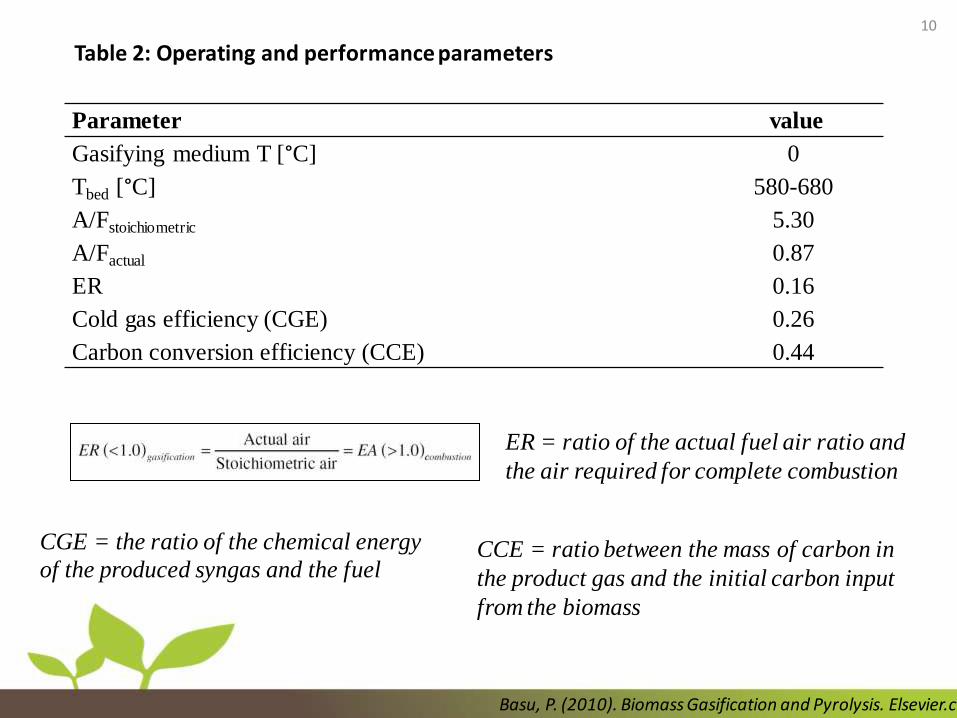
Parameter value
Gasifying medium T [°C] 0
Tbed [°C] 580-680
A/Fstoichiometric 5.30
A/Factual 0.87
ER 0.16
Cold gas efficiency (CGE) 0.26
Carbon conversion efficiency (CCE) 0.44
Table 2: Operating and performance parameters
CGE = the ratio of the chemical energy
of the produced syngas and the fuel CCE = ratio between the mass of carbon in
the product gas and the initial carbon input
from the biomass
ER = ratio of the actual fuel air ratio and
the air required for complete combustion
Basu, P. (2010). Biomass Gasification and Pyrolysis. Elsevier.c
Updraft
Continuous1
Updraft
Batch2
FBG
Batch3
FBG
Batch4
Typical
Syngas composition5
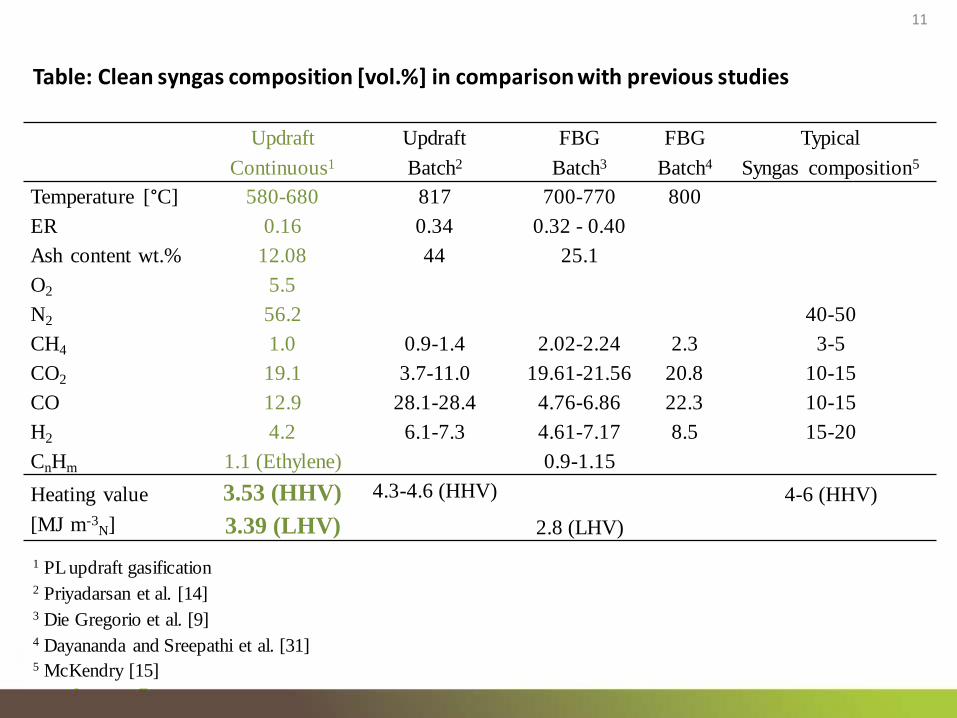
Temperature [°C] 580-680 817 700-770 800
ER 0.16 0.34 0.32 - 0.40
Ash content wt.% 12.08 44 25.1
O2 5.5
N2 56.2 40-50
CH4 1.0 0.9-1.4 2.02-2.24 2.3 3-5
CO2 19.1 3.7-11.0 19.61-21.56 20.8 10-15
CO 12.9 28.1-28.4 4.76-6.86 22.3 10-15
H2 4.2 6.1-7.3 4.61-7.17 8.5 15-20
CnHm 1.1 (Ethylene) 0.9-1.15
Heating value
[MJ m-3N]
3.53 (HHV)
3.39 (LHV)
4.3-4.6 (HHV)
2.8 (LHV)
4-6 (HHV)
11
Table: Clean syngas composition [vol.%] in comparison with previous studies
1 PL updraft gasification 2 Priyadarsan et al. [14] 3 Die Gregorio et al. [9] 4 Dayananda and Sreepathi et al. [31] 5 McKendry [15]
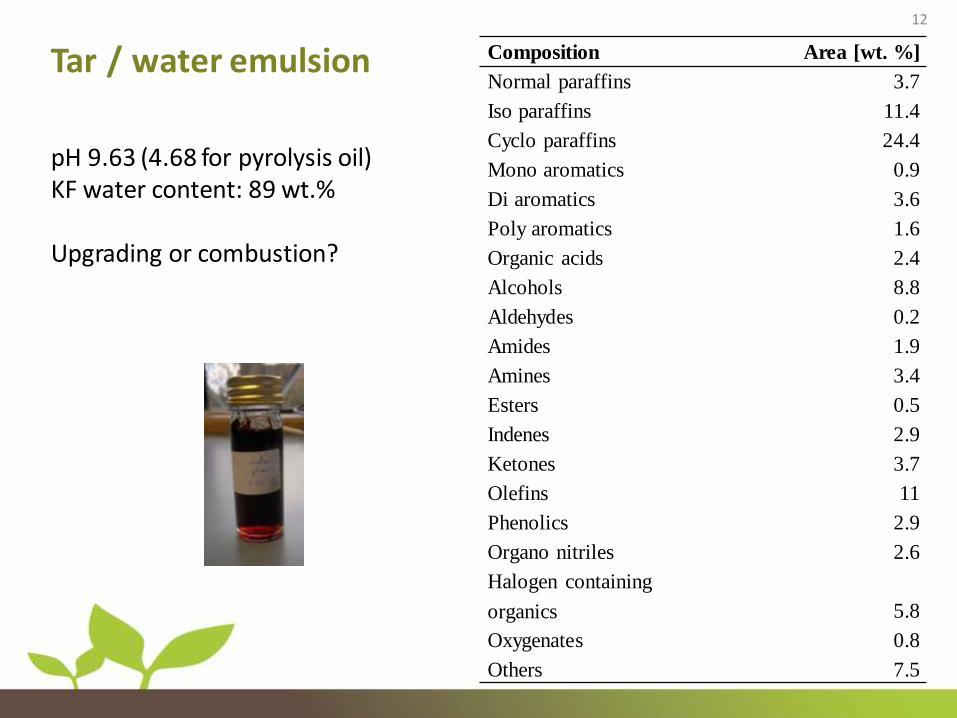
Tar / water emulsion
pH 9.63 (4.68 for pyrolysis oil) KF water content: 89 wt.% Upgrading or combustion?
12
Composition Area [wt. %]
Normal paraffins 3.7
Iso paraffins 11.4
Cyclo paraffins 24.4
Mono aromatics 0.9
Di aromatics 3.6
Poly aromatics 1.6
Organic acids 2.4
Alcohols 8.8
Aldehydes 0.2
Amides 1.9
Amines 3.4
Esters 0.5
Indenes 2.9
Ketones 3.7
Olefins 11
Phenolics 2.9
Organo nitriles 2.6
Halogen containing
organics 5.8
Oxygenates 0.8
Others 7.5
13
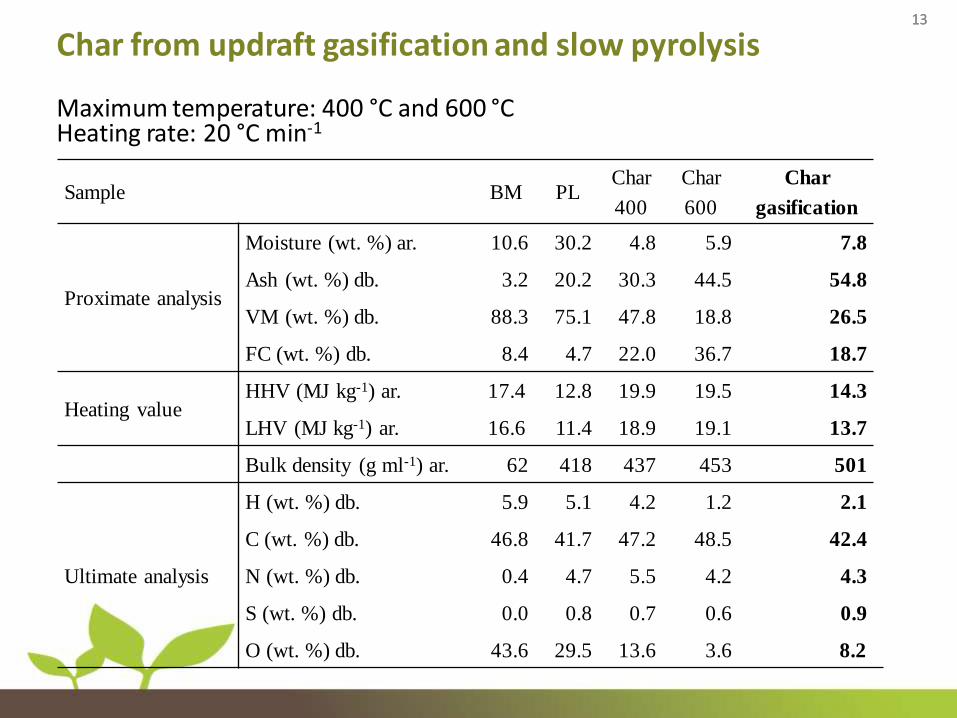
Char from updraft gasification and slow pyrolysis Maximum temperature: 400 °C and 600 °C Heating rate: 20 °C min-1
13
NPK Sample BM PL
Char
400
Char
600
Char
gasification
Proximate analysis
Moisture (wt. %) ar. 10.6 30.2 4.8 5.9 7.8
Ash (wt. %) db. 3.2 20.2 30.3 44.5 54.8
VM (wt. %) db. 88.3 75.1 47.8 18.8 26.5
FC (wt. %) db. 8.4 4.7 22.0 36.7 18.7
Heating value HHV (MJ kg-1) ar. 17.4 12.8 19.9 19.5 14.3
LHV (MJ kg-1) ar. 16.6 11.4 18.9 19.1 13.7
Bulk density (g ml-1) ar. 62 418 437 453 501
Ultimate analysis
H (wt. %) db. 5.9 5.1 4.2 1.2 2.1
C (wt. %) db. 46.8 41.7 47.2 48.5 42.4
N (wt. %) db. 0.4 4.7 5.5 4.2 4.3
S (wt. %) db. 0.0 0.8 0.7 0.6 0.9
O (wt. %) db. 43.6 29.5 13.6 3.6 8.20
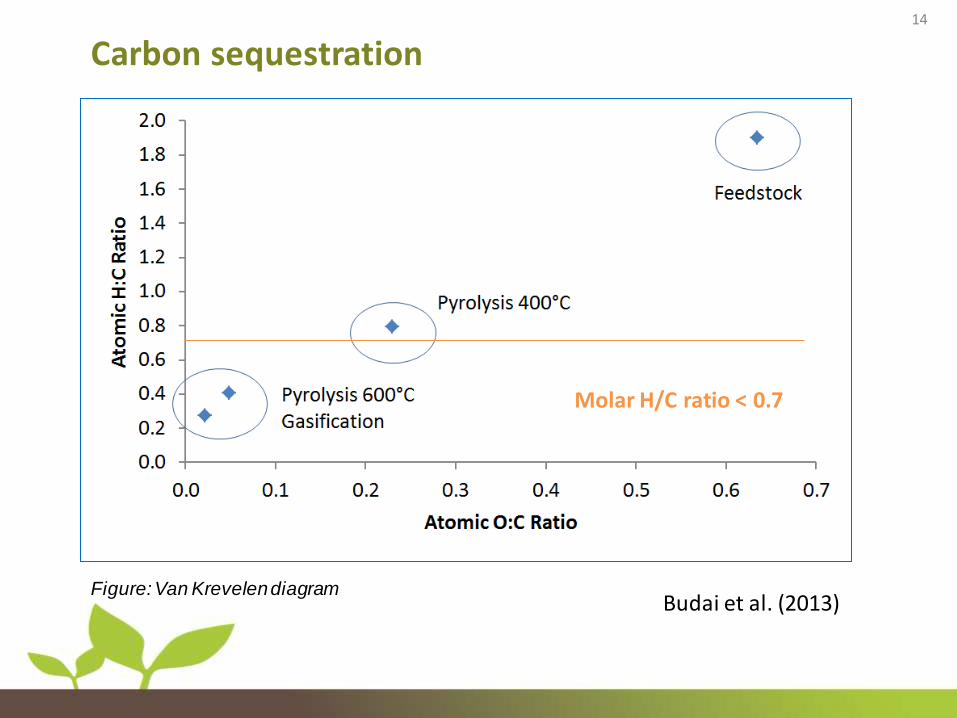
Carbon sequestration
Figure: Van Krevelen diagram
Molar H/C ratio < 0.7
14
Budai et al. (2013)
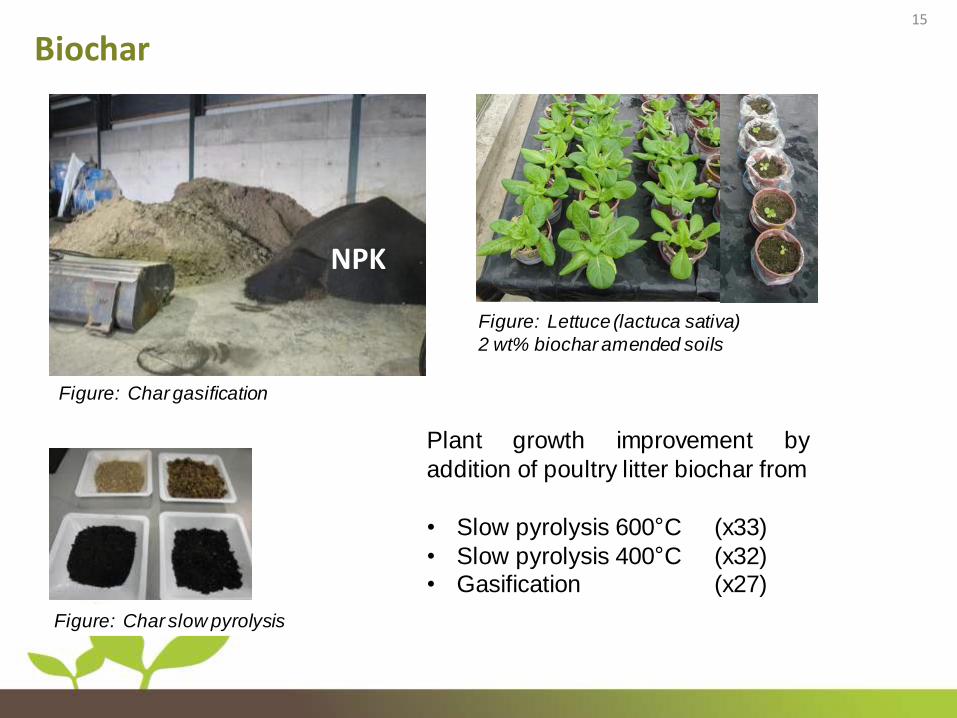
Biochar
Figure: Lettuce (lactuca sativa)
2 wt% biochar amended soils
Plant growth improvement by
addition of poultry litter biochar from
• Slow pyrolysis 600°C (x33)
• Slow pyrolysis 400°C (x32) • Gasification (x27)
Figure: Char gasification
Figure: Char slow pyrolysis
15
NPK
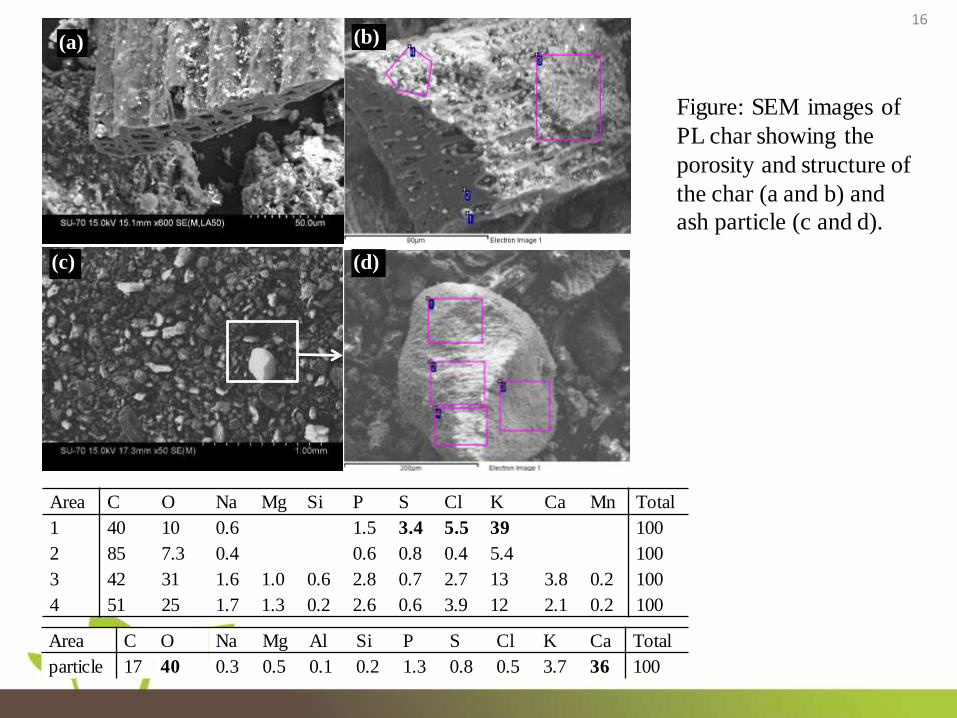
Area C O Na Mg Si P S Cl K Ca Mn Total
1 40 10 0.6 1.5 3.4 5.5 39 100
2 85 7.3 0.4 0.6 0.8 0.4 5.4 100
3 42 31 1.6 1.0 0.6 2.8 0.7 2.7 13 3.8 0.2 100
4 51 25 1.7 1.3 0.2 2.6 0.6 3.9 12 2.1 0.2 100
16
(a) (b)
1
(c)
1 1
(d)
Figure: SEM images of
PL char showing the
porosity and structure of
the char (a and b) and
ash particle (c and d).
Area C O Na Mg Al Si P S Cl K Ca Total
particle 17 40 0.3 0.5 0.1 0.2 1.3 0.8 0.5 3.7 36 100
17
Conclusions • The process performance (0.26) is low compared to
gasifiers fed with dry plant derived fuels (~0.7) • Total solid waste reduction was 42.5 wt.%. • The clean syngas is of average quality compared to
previous studies (LHV = 3.4 MJ m-3N )
• The tar/water emulsion is of very poor quality and needs to be upgraded. A high amount of nitrogen in form of ammonia is stored in the emulsion, which probably increases the pH.
• The char has a high potential to be used as a biochar; however, further investigations on toxins, such as PAHs, are necessary.
• Arena, U. (2012). Process and technological aspects of municipal solid waste gasification. A review. Waste management (New York, N.Y.), 32(4), 625–39
• Basu, P. (2010) Biomass gasification and pyrolysis: practical design and theory. Elsevier
• Budai, A., Zimmerman, A., Cowie, A., Webber, J., Singh, B., Glaser, B., Masiello, C., Andersson, D., Shields, F., Lehmann10, J., others, 2013. Biochar Carbon Stability Test Method: An assessment of methods to determine biochar carbon stability. International Biochar Initiative.
• Dayananda, B. S., & Sreepathi, L. K. (2013). An Experimental Study on Gasification of Chicken Litter, 2(1), 63–67.
• Di Gregorio, F., Santoro, D., & Arena, U. (2014). The effect of ash composition on gasification of poultry wastes in a fluidized bed reactor. Waste Management & Research, ISWA, 32(4), 323–30.
• Draper, K., & Tomlinson, T. (2012). Poultry Litter Biochar – a US Perspective. International Biochar Initiative.
• Priyadarsan, S., Annamalai, K., Sweeten, J. M., Mukhtar, S., & Holtzapple, M. T. (2004). Fixed-bed Gasification of feedlot manure and poultry litter biomass, 47(5), 1689–1696.
References
18
Acknowledgement
Financial support for this work is gratefully acknowledged from the People Programme (Marie Curie Actions) of the European Union's Seventh Framework Programme FP7/2007-2013/ under REA grant agreement n° [289887].
Thank you for you attention
Any questions?
19
H2
CO