Embed Size (px)
Citation preview
Geosci Model Dev 7 2557ndash2579 2014wwwgeosci-model-devnet725572014doi105194gmd-7-2557-2014copy Author(s) 2014 CC Attribution 30 License
Gaseous chemistry and aerosol mechanism developments forversion 351 of the online regional model WRF-Chem
S Archer-Nicholls1 D Lowe1 S Utembe2 J Allan13 R A Zaveri4 J D Fast4 Oslash Hodnebrog5H Denier van der Gon6 and G McFiggans1
1Centre for Atmospheric Sciences School of Earth Atmospheric and Environmental SciencesUniversity of Manchester Manchester UK2School of Earth Sciences University of Melbourne Victoria Australia3National Centre of Atmospheric Science University of Manchester Manchester UK4Atmospheric Sciences and Global Change Division Pacific Northwest National LaboratoryRichland Washington USA5Department of Geosciences University of Oslo Norway6Department of Climate Air and Sustainability TNO Utrecht the Netherlands now at Centre for International climate and Environmental Research-Oslo (CICERO)Oslo Norway
Correspondence toG McFiggans (gmcfiggansmanchesteracuk)
Received 7 January 2014 ndash Published in Geosci Model Dev Discuss 22 January 2014Revised 18 September 2014 ndash Accepted 25 September 2014 ndash Published 8 November 2014
Abstract We have made a number of developments tothe Weather Research and Forecasting model coupled withChemistry (WRF-Chem) with the aim of improving modelprediction of trace atmospheric gas-phase chemical andaerosol composition and of interactions between air qual-ity and weather A reduced form of the Common ReactiveIntermediates gas-phase chemical mechanism (CRIv2-R5)has been added using the Kinetic Pre-Processor (KPP) in-terface to enable more explicit simulation of VOC degrada-tion N2O5 heterogeneous chemistry has been added to theexisting sectional MOSAIC aerosol module and coupled toboth the CRIv2-R5 and existing CBM-Z gas-phase schemesModifications have also been made to the sea-spray aerosolemission representation allowing the inclusion of primaryorganic material in sea-spray aerosol We have worked onthe European domain with a particular focus on making themodel suitable for the study of nighttime chemistry and ox-idation by the nitrate radical in the UK atmosphere Drivenby appropriate emissions wind fields and chemical bound-ary conditions implementation of the different developmentsare illustrated using a modified version of WRF-Chem 341in order to demonstrate the impact that these changes have
in the Northwest European domain These developments arepublicly available in WRF-Chem from version 351 on-wards
1 Introduction
Coupled simulations of atmospheric dynamics pollutanttransport chemical transformation and mixed-phase pro-cesses are challenging because of the complexities of the in-teractions and feedbacks between these processes Histori-cally these systems have been researched in isolation lead-ing to the development and use of offline chemical transportmodels (CTMs) that are run offline driven by atmosphericfields calculated by a previously run meteorological modelCTMs can be used to investigate chemical processes undervarious prevailing meteorological conditions but do not allowcharacterisation of the influence of atmospheric compositionon meteorology This limitation has driven the developmentof online coupled models (Baklanov et al 2011)
Published by Copernicus Publications on behalf of the European Geosciences Union
2558 S Archer-Nicholls et al WRF-Chem developments
WRF-Chem is such a fully coupled ldquoonlinerdquo regionalmodel with integrated meteorological gas-phase chemistryand aerosol components (Grell et al 2005) WRF-Chem isbuilt around the well-established Advanced Research WRF(ARW) core which handles the meteorology physics andtransport components of the model (Skamarock et al 2005)Transport of chemical species is calculated using the sameprognostic equations time step and vertical coordinate sys-tem used to transport conserved variables in the ARW coremodel
The work in this paper has been conducted as part of theROle of Nighttime chemistry in controlling the OxidisingCapacity Of the atmosphere (RONOCO) campaign This col-laboration of six UK universities aims to better understandnighttime nitrate NO3 radical chemistry compare its oxida-tion capacity with that of the daytime hydroxyl (OH) radicaland investigate the impacts of multiphase NO3 chemistry ona regional and global scale WRF-Chem is capable of car-rying descriptions of each of the key chemical processes ofrelevance to RONOCO science outlined below
Photolysis of ozone (O3) by ultraviolet light at wave-lengths below 320 nm produces excited free oxygen atoms(O(1D)) a fraction of which react with water to create(OH) The OH radical is highly reactive reacting with al-most all volatile organic compounds (VOCs) to produceorganic peroxy radicals (RO2) (Atkinson 2000) In NOx(NOx = NO+ NO2) rich environments RO2 oxidises NOvia the general reaction
NO+ RO2 minusrarr RO+ NO2 (R1)
As photolysis of NO2 creates O3 this cycling of NOx break-ing down VOCs results in a net increase of O3 with the ozoneforming potential of the reactions proportional to the VOCchain length (Sheehy et al 2010) However O3 is only pro-duced in this process where there is a balance of NOx andVOCs (Sillman 1999) Air parcels saturated with VOCs butlow in NOx are said to be ldquoNOx sensitiverdquo as a small in-crease in NOx can result in a large increase in O3 productionLikewise air parcels with low VOC but high NOx are said tobe ldquoVOC sensitiverdquo
Oxidising agents are required to initiate the breakdown ofVOCs to take part in the reactions described above playingan essential role of ldquocleaningrdquo the atmosphere of pollutantsin the process (Monks 2005) There are three main oxidantsin the troposphere OH NO3 and O3 The OH radical dom-inates oxidation during the daytime but at night its concen-tration drops and NO3 becomes the primary oxidant (Brownand Stutz 2012)
The oxidation of VOCs is dominated by OH-initiated re-actions However NO3 plays a key role controlling the at-mospheric burden of certain species with unsaturated doublebonds such as alkenes monoterpenes and some sulfur con-taining compounds such as dimethyl sulfide (DMS) (Monks2005 Allan et al 2000)
The primary source of NO3 is the reaction of O3 and NO2(Atkinson 2000)
O3 + NO2 minusrarr NO3 + O2 (R2)
During the day it is rapidly photolysed back to NOx and alsoreacts with NO (Asaf et al 2010) At night the absence ofphotolysis and the lower concentrations of NO allow for theaccumulation of NO3 Nighttime mixing ratios of NO3 aretypically a few tens of pptv although peak levels of over800 pptv have been reported (Asaf et al 2010) NO3 furtherreacts with NO2 to form dinitrogen pentoxide (N2O5) N2O5is thermally unstable and readily dissociates back into NO3and NO2 such that these species settle into a tightly cou-pled temperature-dependent equilibrium With cooler tem-peratures or higher levels of NO2 the N2O5 NO3 ratio willincrease (Osthoff et al 2007)
There are several loss mechanisms for N2O5 as describedin more detail byChang et al(2011) The most signifi-cant are thought to be the heterogeneous uptake reactionswhereby N2O5 is lost to aerosol or cloud particles (Dentenerand Crutzen 1993) The rate at which N2O5 is processed byheterogeneous uptake is highly dependent on the composi-tion of the aerosol and the ambient humidity (Riemer et al2009 Chang et al 2011) As NO3 and N2O5 are in equilib-rium with each other direct loss of N2O5 is an indirect lossmechanism for NO3
This nighttime oxidant system is tightly coupled and itsrealistic simulation requires the accurate representation ofmeteorological conditions the gas-phase chemistry and theaerosol loadings and chemical composition Such a represen-tation in WRF-Chem will enable regional-scale evaluationof
a the extent of nighttime NO3ndashVOC chemistry comparedto daytime OH-initiated oxidation
b the impact of NO3-initiated oxidation on radical bud-gets organic products and ozone formation
c the relative effect of daytime and nighttime nitrate for-mation on atmospheric denoxification
d the effect of aerosol composition on VOC lifetime ofthe impact of nighttime chemistry on the regional depo-sition of oxidised nitrogen
There are a number of specific requirements for modellingof the UK atmosphere including those related to comparisonof the impacts of nighttime and daytime oxidative chemistrythat are the focus of the current work This paper describesmodifications to the process descriptions previously availablein the distribution version of WRF-Chem for these purposesThe following three areas provide the focus of the develop-ments
i Previous WRF-Chem studies have used substantially re-duced chemical schemes In order to make more com-prehensive use of the available emissions data and
Geosci Model Dev 7 2557ndash2579 2014 wwwgeosci-model-devnet725572014
S Archer-Nicholls et al WRF-Chem developments 2559
comparison with network measurements inclusion ofa chemical scheme more readily traceable to the Mas-ter Chemical Mechanism (MCMSaunders et al 2003Jenkin et al 2003) is desirable
ii N2O5 heterogeneous chemistry is inadequately repre-sented in the currently available chemistryndashaerosol con-figurations in WRF-Chem The coupled nighttime ox-idant system is of primary interest to the RONOCOproject A parameterised representation of the processhas been added to the model
iii The contribution to PM in the UK from marine aerosolmay be substantial and the policy implications ofsuch uncontrollable PM fractions is important (DE-FRA 2012) Furthermore N2O5 heterogeneous uptakeis known to be dependent on the chloride content ofaqueous aerosol particles and so an accurate represen-tation of the aerosol Clminus burden is required (Thorntonet al 2010) In addition to the inorganic sea-salt therehas been considerable interest in primary marine or-ganic material (OrsquoDowd et al 2004) A new sea-sprayemissions parameterisation has been developed and in-cluded based onFuentes et al(2010) which includesapportionment of some of the aerosol to organic aerosolmass
Below we will detail the developments that we have madeto the gas and aerosol chemical representations within WRF-Chem A domain has been configured over the UK to testthe changes and make comparisons with the existing CBM-Zchemistry scheme The detailed emissions available for theUK have been mapped to this domain and work has beenconducted mapping emissions and chemical boundary condi-tions to the model to create a realistic chemical backgroundThe model has been run to coincide with the summer mea-surement campaign of the RONOCO project in July 2010This paper describes the configuration and evaluation of themodel used to compare with measurements as described indetail in the companion paper (Lowe et al 2014)
All development work discussed in this paper has beenapplied to version 341 of the WRF-Chem model whichis the version used for all simulations shown All develop-ments have been tested and used in fully coupled simulationsin both one-way and two-way nested configurations and areavailable in WRF-Chem distribution version 351
2 WRF-Chem model developments
WRF-Chem is modular in design and provided witha rapidly expanding choice of gas-phase and aerosol chemi-cal schemes Gas-phase schemes provided with WRF-Cheminclude RADM2 (Stockwell et al 1990 59 species 157 re-actions) RACM (Stockwell et al 1997 73 species 237 re-actions) CBM-Z (Zaveri and Peters 1999 73 species 237
reactions) SAPRC99 (Carter 2000 79 species 235 reac-tions) and MOZART (Emmons et al 2010 85 species and196 reactions) WRF-Chem is also provided with the capa-bility to add gas-phase chemical schemes or modify the ex-isting schemes through the Kinetic Pre-Processor (KPP) in-terface (Damian et al 2002) Aerosol modules available inWRF-Chem include the bulk GOCART (Chin et al 2000)modal MADE-SORGAM (Ackermann et al 1998 Schellet al 2001) and MAM (Liu et al 2012) and sectional MO-SAIC (Zaveri et al 2008) schemes
WRF-Chem has most widely been used for simulation ofthe Continental US (seeGrell et al 2011 Ntelekos et al2009 Qian et al 2009) However it is steadily becomingmore widely used in Europe ndash from regional air quality stud-ies (Solazzo et al 2012b a Tuccella et al 2012 Ritter et al2013) to the impact of emissions from mega-cities (Hodne-brog et al 2011) the impact of biomass burning and bio-genic emissions on elevated ozone levels during a heat wave(Hodnebrog et al 2012) and the impact of the aerosol directeffect on air quality (Forkel et al 2012) Most studies havebeen carried out using the RADM2 gas-phase scheme cou-pled with MADE-SORGAM whereby aerosol is included ndashexcept forRitter et al(2013) who use CBM-Z coupled with4-bin MOSAIC
21 CRIv2-R5 gas-phase scheme
Speciated measurements indicate that hundreds of VOCs areemitted from both biogenic and anthropogenic sources (egGuenther et al 1995 Dore et al 2003) and many thou-sands of organic compounds have been isolated in atmo-spheric samples (Goldstein and Galbally 2007) These com-pounds possess a variety of physico-chemical properties be-cause of differences in structure and functional group con-tent Because these factors influence the reactivity and oxida-tion pathways it has long been recognised that the produc-tion efficiency of secondary pollutants such as ozone andsecondary organic aerosol (SOA) varies considerably fromone compound to another (egDerwent 1991 Carter 1994Grosjean and Seinfeld 1989) An accurate representation ofthe degradation of gaseous VOCs is a pre-requisite to reason-able representation of ozone and SOA production
The MCM v31 (Saunders et al 2003 Jenkin et al 2003)describes the degradation of 135 emitted VOCs and involvesthousands of species and reactions (5900 species and 13 500reactions) While ideal for simulation of larger number ofoxygenates it has not been extensively used in computation-ally intensive applications such as global and regional 3-Dmodels (the only exceptions beingYing and Li 2011 Jacob-son and Ginnebaugh 2010) For large-scale coupled modelsit is generally considered necessary to use reduced schemeswith fewer species and reactions
There are several techniques for reducing the complexityof chemical schemes Aggregated mechanisms group entireclasses of organic compounds as single species carried by the
wwwgeosci-model-devnet725572014 Geosci Model Dev 7 2557ndash2579 2014
2560 S Archer-Nicholls et al WRF-Chem developments
chemical scheme (Stockwell et al 2011) For example thecarbon bond mechanisms (of which CBM-Z is an example)carries the constituent molecular groups separate from thewhole molecules such as PAR (alkane carbon atomsgt C lt)or OLET (terminal double bonded carbon atoms C = C) asindependent species (Zaveri and Peters 1999) This can dra-matically reduce the total number of species and reactionswhilst conserving the number of carbon atoms in the system
Another method is to use surrogate species with simi-lar chemical properties to represent groups of VOCs Sur-rogate schemes are somewhere between explicit and aggre-gated schemes in nature and complexity (Stockwell et al2011) One such scheme is the Common Representative In-termediates version 2 (CRIv2) (Jenkin et al 2008) Trace-able to the MCM v31 the protocol for the development ofthe CRIv2 scheme is based on the understanding that the to-tal molecular yield of O3 potentially formed as a by-productof a complete OH-initiated and NOx-catalysed oxidation ofa simple hydrocarbon is equivalent to the number of reactivebonds in the parent molecule This defines the Common Rep-resentative Intermediate (CRI) index based on the number ofreactive CminusC and CminusH bonds and represents the total num-ber of NO to NO2 conversions would occur in the completeoxidation of the parent molecule to CO2 and H2O This indexis used to define a number of intermediates that represent thebreakdown of larger VOCs (Jenkin et al 2002) reducing thenumber of intermediates for a given suite of VOCs
In CRIv2 the mechanism was built on a compound-by-compound basis continually testing the mechanism againstthe full MCM identifying cases where explicit degradationdiffered from the CRI index approximation and modifyingthe CRI index appropriately (Jenkin et al 2008) CRIv2 re-duces the number of species and reactions in the MCM v31by around 90 (to 434 species and 1183 reactions) whilststill describing the degradation of methane and 115 non-methane VOCs (Jenkin et al 2008)
By considering a series of emission lumping options foranthropogenic VOCs a set of five further reduced CRIv2mechanisms were developed byWatson et al(2008) withthe smallest CRIv2 scheme (known as CRIv2-R5) having220 species and 609 reactions for the degradation of 22emitted non-methane VOCs compounds We have modifiedthe CRIv2-R5 to consider degradation of 26 non-methaneVOCs and have implemented it in WRF-Chem The CRIv2-R5 scheme has the advantage over other schemes currentlyused in 3-D CTMs in that through its traceability to MCMv31 it is also traceable to the results of kinetic and mech-anistic studies of atmospheric reactions and has undergoneindirect evaluation against environmental chamber data Forthis reason the CRIv2-R5 mechanism represents a referencebenchmark mechanism traceable to our most explicit under-standing of atmospheric VOC degradation
We have used the KPP protocol to include the CRIv2-R5scheme in WRF-Chem It has also been coupled to the MO-SAIC 4-bin and 8-bin aerosol schemes Although consider-
Table 1Computational cost of a single 90 s time step for differentWRF-Chem configurations on the case-study domain These tim-ings are for the model domain described in the text running on 160processors on the HECToR supercomputer
Chemistry modules used Computational cost
CBM-Z gas-phase only 16 sCRIv2-R5 gas-phase only 45 sCBM-Z and 8-bin MOSAIC 65 sCRIv2-R5 and 8-bin MOSAIC 95 s
ably more simple than the MCM v31 it is the most com-plex chemical scheme currently in WRF-Chem We wouldhighlight three main strengths of using the CRIv2-R5 overa simpler mechanism
i It is traceable to the MCM especially with regard to O3production It can therefore be used as a benchmark forother schemes
ii It explicitly carries many intermediate and species suchas RO2 or organic nitrates This enables the decouplingof sources and sinks for radicals or the disentanglingof different reaction pathways that would be lumped ina simpler mechanism
iii The longer chains of VOCs and explicit processing ofintermediate species have been shown to produce moreO3 in their breakdown in global model studies such asUtembe et al(2010)
However it is more expensive to run relative to simplermechanisms As a demonstration we present the computa-tional costs of a 90 s model time step for the model domaindescribed below on 160 processors on the HECToR super-computer (httpwwwhectoracuk) in Table1 The CRIv2-R5 chemical scheme is approximately 200 more expen-sive than CBM-Z However the overhead associated withthe full 8-bin MOSAIC aerosol module (with aqueous chem-istry) is greater than the gas-phase chemistry schemes anduse of CRIv2-R5 instead of CBM-Z in our model configura-tion increases the computational cost by 50
For this study we are interested in the behaviour of thenighttime radical NO3 As dimethylsulfide (DMS) reactsrapidly with NO3 and may be one of its primary direct lossmechanisms in an oceanic environment DMS chemistry hasbeen added to the CRIv2-R5 scheme based onvon Glasowand Crutzen(2004)
22 Heterogeneous N2O5 chemistry
The rates of the major gas-phase reactions to form and de-stroy NO3 and N2O5 are well known and these reactionsare included in most gas-phase chemical schemes (includingCBM-Z and CRIv2-R5) The heterogeneous uptake of N2O5onto aerosol particles is also important as this reaction acts
Geosci Model Dev 7 2557ndash2579 2014 wwwgeosci-model-devnet725572014
S Archer-Nicholls et al WRF-Chem developments 2561
as a sink for NOx (Dentener and Crutzen 1993) and con-tributes to particulate nitrate (Riemer et al 2003) Howeverthis process is poorly represented (if present at all) in manychemical schemes and so is the focus of the developmentwork described below
The N2O5 heterogeneous reaction has been investigatedon materials representing the range of compositions of at-mospheric aerosols The reaction probability (γ ) has beenshown to be dependent principally on the composition andwater content (and so atmospheric relative humidity) of thesematerials Theγ is greatest on aqueous solutions of ammo-nium sulfate or sodium sulfate at high relative humidities (upto 004ndash0086 at 76 RH) Reducing the relative humidityor adding organics or nitrate to the solutions suppressesγ reducing it by an order of magnitude or more (seeChanget al 2011 and references therein for a more complete dis-cussion of these studies) A number of parameterisations ofthe composition dependence ofγ have been made We havechosen to use that ofBertram and Thornton(2009) for thisstudy because it takes into account the contributions of bothnitrate and chloride ions to calculation ofγ ndash sea-salt andammonium nitrate aerosol both being common over the UKdomain This scheme will provide an upper bound on the in-fluence of N2O5 heterogeneous chemistry In the companionpaper to this one (Lowe et al 2014) we will also investigatethe suppression ofγ by organics using the parameterisationof Riemer et al(2009)
The reaction mechanism that is used for the hydrolysis ofN2O5 is that of Thornton et al(2003) They suggest thatafter uptake onto the aerosol particle aqueous phase N2O5reacts reversibly with liquid water to form an (as yet unob-served) protonated nitric acid intermediate (H2ONO+
2 ) Thisthen reacts with either liquid water to form aqueous ni-tric acid (HNO3) or with halide ions to form nitryl halide(XNO2 where X=Cl Br or I)
N2O5 (gas) N2O5 (aq) (R3)
N2O5 (aq) + H2O(l) H2ONO+
2 (aq) + NOminus
3 (aq) (R4)
H2ONO+
2 (aq) + H2O(l) minusrarr H3O+ (aq) + HNO3 (aq) (R5)
H2ONO+
2 (aq) + Xminus (aq) minusrarr XNO2 + H2O(l) (R6)
This reaction mechanism has been used byBertram andThornton(2009) to interpret the results of laboratory studiesmade into the reactivity of N2O5 in aqueous solutions Theyhave parameterised the reaction probability (γ ) on how manygas-particle collisions result in the net removal of N2O5 fromthe gas-phase in terms of the condensed-phase H2O(l) NOminus
3and Xminus abundances
Heterogeneous uptake of N2O5 has been added by extend-ing the Adaptive Step Time-Split Euler Method (ASTEM)within the MOSAIC aerosol module (Zaveri et al 2008)Because we are not modelling any of the intermediate com-pounds within theBertram and Thornton(2009) scheme weassume that N2O5 is nonvolatile and that the mass transfercoefficients of N2O5 for all size bins remain constant over
the external ASTEM time step (hASTEM) so that the uptakeof N2O5 can be reduced to a simple first-order process
dCgN2O5
dt= minus
(summ
kN2O5m
)CgN2O5 (1)
whereCgN2O5 is the concentration of N2O5 in the gas-phaseand kN2O5m is the first-order mass transfer coefficient forN2O5 over binm described by Eq (5) ofZaveri et al(2008)Integrating the above equation across the time step from thestarting timet to the end timet +hASTEM gives the new gas-phase concentration as
Ct+hASTEMgN2O5
= CtgN2O5
exp
(minushASTEM times
summ
kN2O5m
) (2)
This is equivalent to Eq (9) inZaveri et al(2008) Uptakeof N2O5 to the individual binsUN2O5m is given by
UN2O5m =
(Ct
gN2O5minus C
t+hASTEMgN2O5
) kN2O5msumm kN2O5m
(3)
In applying the parameterisation ofBertram and Thorn-ton (2009) we assume that the limiting step is the uptake ofN2O5 to the condensed-phase and that it reacts in a near-instantaneous manner with H2O and Clminus to give NOminus
3 andClNO2 through Reactions (R4)ndash(R6) ClNO2 is not addedto the aerosol but is instead assumed to out-gas in a near-instantaneous manner and has instead been added as an ex-tra species to the gas-phase (currently as an inert tracer ndash nogas-phase reactions involving ClNO2 have been added to thegas-phase chemistry scheme although this could be addedin the future eg followingSarwar et al 2012) In additionfor simplicity we assume that the HNO3 molecules formedin Reaction (R5) undergoes ion dissociation to produce aque-ous NOminus
3 The uptake of N2O5 is controlled by the reaction probabil-
ity γN2O5 which we use instead of a mass accommodationcoefficient in the calculation of the transition regime correc-tion factor (Fuchs and Sutugin 1971) used in the calculationof kN2O5m (Eqs 5 and 6 ofZaveri et al 2008) The reactionprobability of N2O5 has been parameterised byBertram andThornton(2009) as
γN2O5m =
A(β minus βeminusδ[H2O]m)
1minus1
kprime
3[H2O]m
[NOminus
3 ]m+ 1+
kprime
4[Clminus]m
[NOminus
3 ]m
(4)
where [H2O]m [Clminus]m and [NOminus
3 ]m are the molarities ofthese compounds within binm andA = 32times 10minus8 s β =
115times106 sminus1 δ = 13times10minus1 Mminus1 kprime
3 = 6times10minus2 andkprime
4 =
290 are fitting parameters calculated byBertram and Thorn-ton (2009)
wwwgeosci-model-devnet725572014 Geosci Model Dev 7 2557ndash2579 2014
2562 S Archer-Nicholls et al WRF-Chem developments
The new concentrations of NOminus3 Clminus and ClNO2 are cal-culated as
Ct+hASTEM
aNOminus
3 m= Ct
aNOminus
3 m+ (1+ fNOminus
3 m)UN2O5m (5)
Ct+hASTEMaClminusm
= CtaClminusm
minus fClminusmUN2O5m (6)
Ct+hASTEMgClNO2m
= CtgClNO2m
+ fClminusmUN2O5m (7)
where fNOminus
3 m is the fraction of the intermediate species
H2ONO+
2 postulated byBertram and Thornton(2009) whichreacts with H2O(l) to give HNO3(aq) (or within the MO-SAIC framework NOminus3 ) in bin m andfClminusm = 1minusfNOminus
3 m
where
fNOminus
3 m =1
1+kprime
4[Clminus]m
kprime
3[H2O]m
(8)
The above equations are equivalent to Eq (10) inZaveri et al(2008)
Equation (6) is checked to ensure thatCt+hASTEMaClminusm
neverbecomes negative where this would occur we calculate theconcentrations at timet + hASTEM as
Ct+hASTEM
aNOminus
3 m= Ct
aNOminus
3 m+ 2UN2O5m minus Ct
aClminusm
Ct+hASTEMaClminusm
= 0
Ct+hASTEMgClNO2m
= CtgClNO2m
+ CtaClminusm
The uptake of N2O5 is carried out at the same time as theuptake of the involatile gases H2SO4 and MSA The changein NOminus
3 and Clminus content of the aerosol is taken into accountwhen estimating the amount of NH3 which is allowed to con-dense with these involatile acids by modifying Eq (11) ofZaveri et al(2008) to
Ct+hASTEMaNH4m
= CtaNH4m
+min((
21Ct+hASTEMaSULFm+1C
t+hASTEMaCH3SO3m
+ 1Ct+hASTEMaNO3m
+1Ct+hASTEMaClm
)1Cmax
aNH4m
)
(9)
Once the new particle-phase SULF CH3SO3 NOminus
3 Clminusand NH+
4 concentrations are computed then the internalsolidndashliquid phase equilibrium in each size bin is updated bythe thermodynamic module MESA as in the standard MO-SAIC module The total gas- plus particle-phase species con-centrations (Eq 22 ofZaveri et al 2008) required for thecondensationevaporation of semi-volatiles HNO3 HCl andNH3 are also recalculated at this point in order to account forthe change in aerosol composition after the heterogeneousuptake of N2O5
It should be noted that heterogeneous uptake is only simu-lated for deliquesced aerosol particles and there are currentlyno in-cloud reactions This limits the application of the modelto largely cloud-free conditions and their inclusion should bethe focus of further work
Table 2 Fractional POA content of sea-salt emissions across the 8MOSAIC size bins given in Table3
Bin 1 Bin 2 Bin 3 Bin 4 Bin 5 Bin 6 Bin 7 Bin 8
Low Activity005 005 00 00 00 00 00 00
High Activity01 01 005 001 001 001 001 001
Table 3Eight-bin MOSAIC size grid
Bin Particle dry diameternumber (microm)
1 390625times 10minus2ndash78125times 10minus2
2 78125times 10minus2ndash15625times 10minus1
3 15625times 10minus1ndash3125times 10minus1
4 3125times 10minus1ndash625times 10minus1
5 625times 10minus1ndash125times 100
6 125times 100ndash250times 100
7 250times 100ndash500times 100
8 500times 100ndash100times 100
23 Marine organic aerosol
The current sea-spray emission scheme within the MOSAICmodule of WRF-Chem is based onGong et al(1997) Thisparameterisation over-estimates the production of smallerparticles (seeGong 2003 de Leeuw et al 2011) and sohas been modified with a reduction in the source term forparticles below a dry diameter of 200 nm based on the sea-salt measurements ofOrsquoDowd et al (1997) In order tobetter represent the source term for these smaller particlesFuentes et al(2010 2011) have investigated the influenceof dissolved organic matter on the production of submi-cron sea-spray aerosol They parameterised the sea-spraysize distribution (Eqs 2ndash4 ofFuentes et al 2010) over thesize range of 3ndash450 nm dry diameter in terms of the sea-water diatomaceous bioexudate organic carbon concentra-tion (OClt02microm) We use their parameterisation for sea-sprayemissions up to a dry diameter of 450 nm while above thissize we continue to use the scheme ofGong et al(1997) Forthis study we have chosen two biogenic activity scenariosa low-biogenic activity scenario with OClt02microm= 0 microMand a high-biogenic activity scenario with OClt02microm=
280 microM (seeLee et al 2010)The composition of the inorganic phase of the particles is
the same as the previous scheme However we also allow forthe inclusion of an organic phase based on a measurementof biogenic activity The emitted organic phase is simply in-cluded as primary organic matter (OM) at present and is rea-sonably assumed involatile as evidenced by the high molec-ular weight derived in theFuentes et alstudy In this studywe use the size-resolved mass fractions for the low- and high-
Geosci Model Dev 7 2557ndash2579 2014 wwwgeosci-model-devnet725572014
S Archer-Nicholls et al WRF-Chem developments 2563
biogenic activity scenarios given in Table2 The size depen-dence of the organic mass fraction is estimated from Fig 7of de Leeuw et al(2011) (based onOrsquoDowd et al 2004)while the magnitude of the mass fraction is estimated fromFig 5 of Fuentes et al(2011) (assuming concentrations of0 and 2 microg Lminus1 Chl a for the low- and high-biogenic activityscenarios respectively)
3 Model domain setup
For this study we used a single domain with a 15 km hor-izontal grid spacing and a size of 134 (EndashW) by 146 (NndashS)grid points shown in Fig1 Forty-one vertical model levelsare used with enhanced resolution in the near-surface andplanetary boundary layer afterBeck et al(2013) Each sce-nario was run from 0000 UTC 10 July 2010 to 1200 UTC30 July 2010 The time and location of the domain was cho-sen to coincide with the RONOCO summer flight campaignwhich was principally over the UK and the North Sea Com-parisons between these model results and the aircraft mea-surements will be made in the companion paper (Lowe et al2014)
Meteorological boundary conditions were taken fromECMWF ERA-Interim reanalysis data (Dee et al2011) downloaded from the ECMWF data server(httpdata-portalecmwfint) Following an investiga-tion into the evolution of the meteorological fields in thedomain using WRF simulations the internal domain wasfound to diverge sharply from the ECMWF reanalysis datadriving the boundaries shortly after 21 July To counterthis the meteorology was restarted from ECMWF fields at0000 UTC on 21 July 2010 Chemical and aerosol tracerswere carried across from the previous model runs when themeteorology was restarted in this way The remainder ofthe campaign period was found to evolve in line with theECMWF data and so further meteorological restarts werenot considered necessary
31 Emissions
Emissions are taken from the UK National AtmosphericEmissions Inventory (NAEI) (httpnaeidefragovuk) and theTNO emissions inventory Both inventories provide spa-tial distributions of gas-phase (NOx CO CH4 SO2 NH3NMVOCs) and particulate (PM25 and PM10) emissions Thedata are further disaggregated into 11 UNECE source sec-tors combustion in energy production and transfer combus-tion in commercial institutions residential and agriculturalsectors combustion in industry production processes ex-traction or distribution of fossil fuels solvent use road trans-port and other transport
The NAEI database covers the UK at a resolution of1kmtimes 1km ndash we use the 2008 database for this work TheTNO database covers all of Europe at a resolution of 0125
longitude by 00625 latitude ndash for this work we use the 2005database (Denier van der Gon et al 2010) We also use TNOdatabases for particulate emissions of black carbon elemen-tal carbon and organic carbon which are part of the Pan-European Carbonaceous aerosol inventory (from deliverable42 of the EUCAARI project)Kulmala et al(2011) NOxemissions are speciated as NO 5 of SO2 emissions arepartitioned into sulfate aerosol (Chin et al 2000 Simpsonet al 2003)
The speciation of NMVOCs is taken fromWatson et al(2008) As the CBM-Z scheme carries a reduced number ofchemical species compared to CRIv2-R5 the 25 emitted CRINMVOCs have been lumped to 13 CBM-Z species as shownin Table4 Care was taken to conserve the carbon bonds inconverting the emissions of NMVOCs from CRI to CBM-Zspeciation resulting in added emissions of the lumped sur-rogate species PAR representing paraffin carbon atoms inhigher alkanes and other NMVOCs following Table 10 ofZaveri and Peters(1999) The only emitted species we werenot able to adequately do this for was Ethyne (C2H2) as thetriple bond is not carried in CBM-Z Instead this is emittedas 2 PAR in order to conserve carbon atoms
Using scripts developed byHodnebrog et al(2012) theemissions were reapportioned to the model grid and scaledby monthly day of the week and hourly scaling factorsto create 24 emission files for each day Vertical distribu-tion profiles for each source sector are assumed according toEMEP(2003) The NAEI database is used over the UK (andfor shipping emissions around the shores of the UK) whilethe TNO database is used for mainland Europe the Republicof Ireland and shipping emissions around the rest of Europe
Maps of anthropogenic emissions are shown in Fig1aand b There is a mix of NOx and VOC emissions from thecities of UK and mainland Europe There are also significantNOx and SO2 emissions from shipping in the Atlantic andthe English Channel while peak VOC emissions are fromoil platforms in the North Sea
Aerosol size distributions for the black carbon (lt 1 microm)organic aerosol from domestic combustion (lt 25 microm) andorganic aerosol from traffic (and other emissions) (lt 25 microm)are calculated from log-normal fits made to measurementdata The data used for black carbon are taken from a UKmeasurement campaign conducted using the SP2 instrumentat Chilbolton as part of the APPRAISE-CLOUDS campaignin 2009 For organic aerosol wintertime AMS data fromManchester taken in 2007 (Allan et al 2010) and HolmeMoss in 2006 (Liu et al 2011) were used with the massspectral marker peaks atmz 57 and 60 taken as proxies fortraffic and domestic combustion respectively Note that thesemeasurements are deliberately taken at ldquobackgroundrdquo sitesso that the primary emissions will have undergone a degreeof ageing before measurement This gives size distributionsthat are more suitable for representing aerosol mixtures fromheterogeneous sources across the area of a model grid cellThe mode diameter and distribution width for each of these
wwwgeosci-model-devnet725572014 Geosci Model Dev 7 2557ndash2579 2014
2564 S Archer-Nicholls et al WRF-Chem developments
Discussion
Paper
|D
iscussionPaper
|D
iscussionPaper
|D
iscussionPaper
|
A B C
Figure 1 Emissions at 1200 UTC on 16 July 2010 for (A) NO (B) VOCs and (C) isoprene NO andVOC emissions are from the merged TNONAEI databases Isoprene emissions are generated onlineusing the MEGAN2 scheme
47
Figure 1 Emissions at 1200 UTC on 16 July 2010 for(a) NO (b) VOCs and(c) isoprene NO and VOC emissions are from the mergedTNONAEI databases Isoprene emissions are generated online using the MEGAN2 scheme
Table 4List of emitted VOC species for CRIv2R5 and CBM-Z as a fraction of total VOC emissions Emission factors by mass based onNAEI emissions of 124 VOC species (Utembe et al 2005) reduced to 25 CRIv5-R5 species byWatson et al(2008) Mappings to CBM-Zvariables made according to representation described in Table 10 ofZaveri and Peters(1999)
Name of VOC CRIv2-R5 CBM-Z VOC fraction
Ethane C2H6 ETH 247 Propane C3H8 3times PAR 429 Butane NC4H10 4times PAR 399 Ethene C2H4 OL2 315 Propene C3H6 OLT+ PAR 148 Trans-2-butene TBUT2ENE OLI+ 2times PAR 337 Ethyne C2H2 2times PAR 120 Formaldyhyde HCHO HCHO 133 Ethanal CH3CHO ALD 013 Propanal C2H5CHO ALD+ PAR 0209 Acetone KET KET 115 Methyl ethyl ketone MEK KET+ PAR 166 Methanol CH3OH CH3OH 116 Ethanol C2H5OH C2H5OH 134 Acetic acid CH3CO2H ORA2 0138 Benzene BENZENE TOL (minusPAR) 202 Toluene TOLUENE TOL 582 o-Xylene OXYL XYL 854 123-Trimethylbenzene TM123B XYL+ PAR 0355 124-Trimethylbenzene TM124B XYL+ PAR 118 Mesitylene TM135B XYL+ PAR 0408 2-Ethyltoluene OETHTOL XYL+ PAR 0324 3-Ethyltoluene METHTOL XYL+ PAR 0514 4-Ethyltoluene PETHTOL XYL+ PAR 0452 13-Dimethyl-5-ethylbenzene DIME35EB XYL+ 2times PAR 0926
fits are given in Table5 These fits are reduced to zero for sizebins whose lower edges are greater than 1 micron The ele-mental carbon (1ndash25 microm) emissions have been apportionedbetween the fifth and sixth largest size bins (which containthe size range 1ndash25 microm) with the fractions 04 and 06 re-spectively (see Table6) Emissions of particles larger than25 microm are apportioned using the default coarse mode frac-
tions in the MOSAIC aerosol emission code in WRF-Chemv341
Biogenic emissions were calculated ldquoon-linerdquo using theModel of Emissions of Gases and Aerosols from Nature(MEGAN) V204 (Guenther et al 2006 Sakulyanontvit-taya et al 2008) Emissions use a 1kmtimes 1km resolutionmap of vegetation to derive leaf area index (LAI) which
Geosci Model Dev 7 2557ndash2579 2014 wwwgeosci-model-devnet725572014
S Archer-Nicholls et al WRF-Chem developments 2565
Table 5Log normal mass distributions used for aerosol emissions
Source Mode diameter Width(microm)
SP2 BC 0170 16mz 57 0360 24mz 60 0340 18
is interpolated to the WRF-Chem model grid and scaledonline to calculate the emission rate of isoprene and otheremitted species using model-derived ambient solar radiancetemperature humidity wind speed and other physical fac-tors (Guenther et al 2006) MEGAN2 species are alreadymapped to CBM-Z variables within WRF-Chem for thiswork we have also added mappings to CRIv2-R5 variablesThe emissions for CBM-Z have a simpler speciation com-pared to CRIv2-R5 for example while monoterpene emis-sions are mapped to eitherα-pinene orβ-pinene in CRIv2-R5 they are emitted as isoprene in CBM-Z with one moleof monoterpene emitted as two moles of isoprene A map oftypical midday isoprene emissions over the domain is shownin Fig 1c
32 Lateral boundary conditions
While regional models can benefit from increased spatial res-olution compared to global modelling studies they requirehigh-quality lateral boundary conditions to function Theseare needed both to drive the meteorology and for realisticchemical and aerosol loadings as pollutants from many largeemissions sources that fall outside of the domain boundariesare transported into the region of interest Typically theseare generated from global model runs and interpolated at theboundaries of the regional model (Giorgi 1997) For thisstudy we have used European Centre for Medium RangeWeather Forecasts (ECMWF) ERA-Interim reanalysis data(Tavolato and Isaksen 2011) to drive the meteorology
For WRF-Chem runs data from the global Model forOzone and Related Chemical Tracers (MOZART-4) arefrequently used for lateral chemical boundary conditions(Emmons et al 2010) They provide fields for all of theMOZART-4 chemical tracers as well as bulk aerosol load-ings for sulfate ammonium nitrate organic carbon and blackcarbon Sea-salt and dust loadings are carried in sectionalsize bins The mozbc tool is freely available for interpolat-ing MOZART-4 products onto WRF-Chem domain lateralboundaries using species mappings for the various chemi-cal schemes in WRF-Chem such as CBM-Z as describedby Emmons et al(2010) MOZART-4 data and the map-ping scripts can be downloaded from thewwwacducareduwrf-chem website We have extended the mappings to in-clude the species in the CRIv2-R5 scheme and be internallyconsistent with emissions mapping for CBM-Z as describedin Table7
More recently the MACC (Monitoring Atmospheric Com-position and Climate) project has developed a reanalysisproduct that is ideal for use in regional coupled model (Steinet al 2012 Inness et al 2013) This uses the MOZART-3 chemical transport model with the ECMWF IntegratedForecast System (IFS) which has been expanded to inte-grate measurements of reactive gases greenhouse gases andaerosol to the ECMWF 4D-Var assimilation system (seeIn-ness et al 2013 and references therein) The aerosol schemecarries bulk aerosol loadings for sulfate black carbon andorganic particulate with three size bins for sea-salt anddust aerosol (Morcrette et al 2009) MODIS retrievals ofaerosol optical depth at 550 nm are used to constrain mod-elled aerosol improving its spatial distribution (Benedettiet al 2009) The gas-phase chemistry is similar to that ofthe MOZART-4 model although only a limited number ofspecies are available in the MACC product
For this study we have chosen to use a hybridisation ofthe MACC and MOZART-4 boundary conditions in orderto benefit from the better aerosol spatial distribution in theMACC model whilst retaining the more detailed MOZARTVOC speciation Given the relatively small size of our do-main and the detail of the CRIv2R5 chemical scheme wefelt it was important to have information of a broad rangeof VOC species at our model boundaries We therefore usedthe MOZART-4 product for all of our gas-phase chemicalboundary conditions and MACC for all available aerosolspecies The MACC sulfate aerosol product has been spe-ciated as a mix of 60 (by mass)(NH4)2SO4 and 40 NH4NO3 (more consistent with measured aerosol composi-tions seeDiacuteaz et al 2006 Morgan et al 2010)
4 Analysis of model results
We calculate an ldquoother inorganicrdquo (OIN) fraction for the par-ticulate emissions by subtracting the sum of the emitted or-ganic and black carbon aerosol mass from the PM25 emis-sions To avoid errors from mismatches between the differentdatabases used we remove any negative values of OIN whichmay occur from using this method The OIN fraction is dis-tributed across the size bins using the default fine-mode frac-tions in the MOSAIC aerosol emission code in WRF-Chemv341
For this study we use a constant oceanic DMS concentra-tion of 2 nM Lminus1 when calculating DMS emissions to rep-resent a low-level background activity (estimated from thedatabase ofKettle et al 1999)
41 Comparison of daytime and nighttime chemistryin CRIv2-R5 and CBM-Z
The CRIv2-R5 scheme compares very well (predicted ozoneconcentrations generally deviate by less than 5 across awide range of VOC NOx ratios) against the Master Chem-
wwwgeosci-model-devnet725572014 Geosci Model Dev 7 2557ndash2579 2014
2566 S Archer-Nicholls et al WRF-Chem developments
Table 6Fractional apportionment of particulate emissions across the eight MOSAIC size bins given in Table3
Bin 1 Bin 2 Bin 3 Bin 4 Bin 5 Bin 6 Bin 7 Bin 8
TNO black carbonlt 1 microm00494 03795 04714 00967 0003 00 00 00
TNO elemental carbon 1 micromndash25 microm00 00 00 00 04 06 00 00
TNO organic carbonlt 25 microm (domestic combustion)00358 01325 02704 03502 01904 00657 00 00
TNO organic carbonlt 25 microm (traffic and other sources)00063 00877 03496 04054 01376 00134 00 00
Discussion
Paper
|D
iscussionPaper
|D
iscussionPaper
|D
iscussionPaper
|
19 20 21 22 230
10
20
30
40
50
60
70
80
O3 [p
pbv]
Day of Month19 20 21 22 2310 3
10 2
10 1
100
101
NO
3 [ppt
v]
Day of Month19 20 21 22 23103
104
105
106
107
108
OH
[mol
ecul
es
scm
3 ]Day of Month
CBM ZCRIv2 R5
A CB
Figure 2 Timeseries of mixing ratios of key tropospheric oxidants O3 (A) NO3 (B) and OH (C) Datafrom ground level over entire domain minus the 10 grid points nearest the boundary covering four daysbetween 0000 UTC on 19 July 2010 and 0000 UTC on 23 July 2010 Solid lines show median valuefiner dashed lines show 5th and 95th percentiles Model runs using CBM-Z gas-phase chemistry (blue)and CRIv2-R5 (red)
48
Figure 2 Time series of mixing ratios of key tropospheric oxidants O3 (a) NO3 (b) and OH(c) Data from ground level over entire domainminus the 10 grid points nearest the boundary covering four days between 0000 UTC on 19 July 2010 and 0000 UTC on 23 July 2010Solid lines show median value finer dashed lines show 5th and 95th percentiles Model runs using CBM-Z gas-phase chemistry (blue) andCRIv2-R5 (red) Statistical information used to generate figure has been included in the Supplement
ical Mechanism (against which it is optimised) within boxmodels along trajectory simulations (Jenkin et al 2008Watson et al 2008) It has also been successfully run un-der global (3-D) conditions such as in the Met OfficersquosSTOchastic CHEMistry (STOCHEM) where it was found togreatly enhance O3 production compared to the STOCHEMscheme (Utembe et al 2010) However to our knowledgethis is the first time it has been applied in a regional 3-Dmodel such as WRF-Chem
In order to assess the performance of the schemewithin WRF-Chem we compare it against the widelyused Carbon Bond Mechanism version Z (CBM-Z)(Zaveri and Peters 1999 Fast et al 2006) We have modi-fied the release version of CBM-Z adding DMS chemistryand removing reactions for NO3 and N2O5 (see AppendixA for details)
This comparison focuses on a short period in the middleof the run between 19 and 23 July 2010 This period waschosen as it covers an interesting pollution episode whichoccurred over the 20 and 21 July Over this period a high-pressure system over the UK resulted in reduced washoutand a build-up of low-altitude pollutants While a subset was
chosen for these analyses to reduce the quantity of data pre-sented the results and differences between chemical schemesare indicative of simulations across a longer period from 14to 30 July 2010
Time series of key oxidants over the 4 days are shown inFig 2 The data are of ground-level concentrations over theentire domain minus the outer 10 grid cells Median O3 levelsare almost identical in both simulations As CRIv2-R5 is ex-pected to produce similar ozone levels to the full MCM thisis in effect a strong validation of the simpler CBM-Z abil-ity to produce realistic O3 levels However peaks in maxi-mum ozone shown by the track of the 95th percentile areslightly higher in CRIv2-R5 indicating that more productionis occurring in some regions The distributions of this extraproduction and implications of it will be discussed belowNighttime NO3 concentrations are consistently higher in theCRIv2-R5 with median concentrations almost twice as highduring the pollution episode
Maximum daytime OH concentrations between theschemes are very similar although there is somewhat morenighttime OH in CRIv2-R5 The increased OH and NO3 in
Geosci Model Dev 7 2557ndash2579 2014 wwwgeosci-model-devnet725572014
S Archer-Nicholls et al WRF-Chem developments 2567
Table 7 Approximate mappings of MOZART-4 VOCs to CBM-Zand CRIv2-R5 mechanisms used in WRF-Chem runs Based on Ta-ble 7 of Emmons et al(2010) the total number of carbon bondsare conserved between mappings of the two schemes with addedPAR and OLT bonds passed to CBM-Z where approximate map-pings need to be made (afterZaveri and Peters 1999)
MOZART-4 CBM-Z CRIv2-R5
CH4 CH4 CH4C2H6 ETH C2H6C3H8 3times PAR C3H8BIGALK 5 times PAR 125times NC4H10C2H4 OL2 C2H4C3H6 OLT+ PAR C3H6BIGENE OLI+ 2times PAR TBUT2ENETOLUENE TOL TOLUENEISOP ISO C5H8C10H16 2times ISO 067times APINENE
+ 033times BPINENECH3OH CH3OH CH3OHC2H5OH C2H5OH C2H5OHCH2O HCHO HCHOCH3CHO ALD CH3CHOCH3COOH ORA2 CH3CO2HGLYALD ALD HOCH2CHOCH3OOH CH3OOH OP1CH3COOOH PAACH3COCH3 KET KETHYAC KET KETCH3COCHO MGLYCH3COOH CH3CO2HMEK KET + PAR MEKPAN PAN PANMPAN PAN+ OLT MPANCRESOL CSL OXYL
the CRIv2-R5 run should result in higher nighttime oxidativecapacity this will be discussed further in Sect42
Figure3 shows ground-level mixing ratios of NO NO2O3 and OH plus the ratio of VOCs to NOx for midday on19 July 2010 NO2 levels and VOC NOx ratios are similarin both schemes However there is considerably less day-time NO over mainland Europe in CRIv2-R5 Here the largequantity of VOCs produce RO2 as they are oxidised Thesereact with NO to produce NO2 The longer more explicitchemical breakdown of VOCs in CRIv2-R5 produces moreRO2 depleting NO and producing net O3 This results in ap-proximately 5 ppbv more ground-level midday O3 over main-land Europe in CRIv2-R5
Low VOC NOx ratios occur along the shipping lanes overthe North Atlantic English Channel and North Sea due tothe high NOx and low VOC content of shipping emissions(see Fig1) In these regions O3 is depleted somewhat moreso in CRIv2-R5 than CBM-Z Midday OH concentrations are
Figure 3 NO (a andb) NO2 (c andd) and O3 (eandf) mixing ra-tios as well as OH concentrations (g andh) and the VOC NOx ra-tio (i andj ) in the lowest model level at 1200 UTC on 19 July 2010(a c e g andi) are from the CRIv2-R5 model run (b d f h andj )are from the CBM-Z model run
wwwgeosci-model-devnet725572014 Geosci Model Dev 7 2557ndash2579 2014
2568 S Archer-Nicholls et al WRF-Chem developments
Figure 4 NO2 (a and b) O3 (c and d) and NO3 (e and f) mixing ratios along a vertical transect through the model domain taken at0000 UTC on 20 July 2010 The transect runs roughly southndashnorth through the domain passing through London (515072 latitude 01275
longitude) (a c ande) are from the CRIv2-R5 model run (b d andf) are from the CBM-Z model run Panels(g) and(h) show NO3 mixingratios horizontally interpolated at 300 m agl for CRIv2-R5(g) and CBM-Z(h) runs
similar in both schemes showing a correlation with O3 asphotolysis of O3 is the main source of OH production
Near emission sources of NO such as over the EnglishChannel the North Sea and parts of the UK both O3 andNO3 levels are kept low by reaction with NO Further down-wind most NOx is in the form of NO2 and O3 is not so de-pleted providing the conditions for NO3 formation This is
most clearly seen in the vertical profiles (Fig4) where max-imum NO3 loadings occur in ageing pollution plumes some300ndash500 m agl Overall the distribution of nighttime NO3 isfar more heterogeneous than daytime OH There is consis-tently more NO3 produced in CRIv2-R5 compared to CBM-Z This can largely be attributed to the increased reaction rateof the NO2 and O3 reaction and moderately increased night-
Geosci Model Dev 7 2557ndash2579 2014 wwwgeosci-model-devnet725572014
S Archer-Nicholls et al WRF-Chem developments 2569Discussion
Paper
|D
iscussionPaper
|D
iscussionPaper
|D
iscussionPaper
|
15 20 25 3010
20
30
40
50
60
70
80
Time (day of July)
O3 (
microg
k
g)
Yarner Wood
AURN
CBMminusZ
CRIv2minusR5
15 20 25 3010
20
30
40
50
60
70
Time (day of July)
O3 (
microg
k
g)
Bush Estate
15 20 25 3010
20
30
40
50
60
70
80
Time (day of July)
O3 (
microg
k
g)
Aston Hill
15 20 25 300
20
40
60
80
100
120
140
Time (day of July)
O3 (
microg
k
g)
St Oysth
A
C D
B
Figure 5 Comparison of O3 8-hour means from AURN measurements (blue line) and model predic-tions (green and red lines for CBM-Z and CRIv2-R5 simulations respectively) Measurement sites are(A) Yarner Wood 5060 Lat -372 Lon (B) Bush Estate 5586 Lat -321 Lon (C) Aston Hill5250 Lat -303 Lon and (D) St Oysth 5178 Lat 105 Lon
51
Figure 5 Comparison of O3 8 h means from AURN measure-ments (blue line) and model predictions (green and red lines forCBM-Z and CRIv2-R5 simulations respectively) Measurementsites are(a) Yarner Wood 5060 lat minus372 lon (b) Bush Es-tate 5586 lat minus321 lon (c) Aston Hill 5250 lat minus303 lonand(d) St Oysth 5178 lat 105 lon Statistical information usedto generate figure is included in the Supplement
time concentrations of O3 and NO2 in plumes Figure6 fo-cuses on the 48 h period around 20 July 2010 at 300 m aboveground In the CRIv2-R5 scenario NO2 remains constantor increases at night whereas it decreases in CBM-Z Thethroughput of this NO2 results in steadily increasing NO3 andN2O5 in CRIv2-R5 as opposed to the stabilising or slowlydecreasing nighttime mixing ratios in CBM-Z
Limited measurement availability of the short-lived radi-cals and VOCs makes measurement evaluation of the differ-ences between the CBM-Z and CRIv2-R5 chemical schemeson a regional scale challenging However the UK AutomaticUrban and Rural Network (AURNhttpuk-airdefragovuknetworksnetwork-infoview=aurn) provides long-termmeasurements of O3 and NOx which can give an indicationof the photochemical state of the atmosphere Comparisonsof the 8 h running mean values of O3 for four sites acrossthe UK between 14ndash30 July with the CRIv2-R5 and CBM-Zschemes are shown Fig5 (similar plots for NO2 and NO aswell as a map of the measurement site locations are given inthe Supplement)
Both model scenario predictions exhibit diurnal cyclesroughly similar to those measured Variations in O3 mix-ing ratios in the model and measurements are in broadagreement at the Bush Estate (located in central Scotland5586 N minus321 E) and Aston Hill (central Wales 5250 Nminus303 E) measurement sites although modelled O3 mix-ing ratios tend to be slightly lower than measurements At
Discussion
Paper
|D
iscussionPaper
|D
iscussionPaper
|D
iscussionPaper
|
0 6 12 18 24 30 36 42 4820
30
40
50
60
O3 [p
pbv]
CBM ZCRIv2R5
0 6 12 18 24 30 36 42 480
01
02
03
04
NO
[ppb
v]
0 6 12 18 24 30 36 42 480
02
04
06
08
1
NO
2 [ppb
v]
0 6 12 18 24 30 36 42 480
5
10
15
20
25
30
NO
3 [ppt
v]
0 6 12 18 24 30 36 42 480
5
10
15
20
25
30
N2O
5 [ppt
v]
Hours from 0000z 19 July 2010
A B
C
E
D
Figure 6 Mixing ratios of O3 (A) NO (B) NO2 (C) NO3 (D) and N2O5 (E) interpolated at 300 m aglover 48 h period starting from 0000 UTC on 19 July 2010 Solid blue line median from CBM-Z runsolid red line median from CRIv2-R5 Thin dashed lines for 25th and 75th percentiles
52
Figure 6 Mixing ratios of O3 (a) NO (b) NO2 (c) NO3 (d) andN2O5 (e) interpolated at 300 m agl over a 48 h period startingfrom 0000 UTC on 19 July 2010 solid blue line median fromCBM-Z run solid red line median from CRIv2-R5 thin dashedlines for 25th and 75th percentiles The statistical information usedto generate figure is included in the Supplement
the Yarner Wood (SW England 5060 N minus372 E) and StOysth (SE England 5178 N 105 E) measurement sitesmodelled O3 mixing ratios are consistently lower than themeasurements The similarity between model predictions us-ing the two chemical schemes is very close much closerthan the fit between model predictions and measurementsThis is because the relative concentrations of these speciesis dominated by the photostationary state as well as errorsin emission sources meteorology or the radiation schemeAs such this comparison is not useful to evaluate which ifeither chemical scheme performs best in these conditionsalthough it does highlight that further work is needed toimprove model representation of the fundamental processesoutside the scope of this study
42 Evaluation of daytime and nighttime oxidationof VOCs
Figure7 shows the VOC tendencies with respect to oxidationby ground-level OH and NO3 for the CRIv2-R5 and CBM-Zchemical schemes The instantaneous tendencies (dVOCdt molecules cmminus3 sminus1) for the plots are calculated by summingthe number of molecules of VOC species that can react withOH per unit time and volume
dVOC
dt OH= minus[OH]
sumi
(kOH i times [VOCi]) (10)
wwwgeosci-model-devnet725572014 Geosci Model Dev 7 2557ndash2579 2014
2570 S Archer-Nicholls et al WRF-Chem developments
Discussion
Paper
|D
iscussionPaper
|D
iscussionPaper
|D
iscussionPaper
|
19 20 21 22 23101
102
103
104
105
106
107
108
dVO
Cd
t |O
H [m
olec
ules
cm
3 s1 ]
Day of Month19 20 21 22 23101
102
103
104
105
106
107
108
dVO
Cd
t |N
O3 [m
olec
ules
cm
3 s1 ]
Day of Month
CBM ZCRIv2 R5
A B
Figure 7 Timeseries of oxidation rate of VOCs by OH (A) and NO3 (B) Data from ground level overentire domain minus the 10 grid points nearest the boundary covering four days between 0000 UTCon 19 July 2010 and 0000 UTC on 23 July 2010 Solid blue line median of CBM-Z run solid red linemedian of CRIv2-R5 Finer dashed lines show 5th and 95th percentiles
53
Figure 7 Time series of oxidation rate of VOCs by OH(a) and NO3 (b) Data from ground level over entire domain minus the 10 gridpoints nearest the boundary covering 4 days between 0000 UTC on 19 July 2010 and 0000 UTC on 23 July 2010 Solid blue line medianof CBM-Z run solid red line median of CRIv2-R5 Finer dashed lines show 5th and 95th percentiles The statistical information used togenerate figure is included in the Supplement
Discussion
Paper
|D
iscussionPaper
|D
iscussionPaper
|D
iscussionPaper
|
16 17 18 19 20 210
1
2
3
4
NO
3 (pp
tv)
Day of Month
16 17 18 19 20 210
10
20
30
40
50
N2O
5 (pp
tv)
Day of Month
16 17 18 19 20 210
2
4
6
8
10
NO
2 (pp
bv)
Day of Month
16 17 18 19 20 210
5
10
15
NO
y (p
pbv)
Day of Month
16 17 18 19 20 210
02
04
06
08
HN
O3 (
ppbv
)
Day of Month
16 17 18 19 20 210
1
2
3
4
5
PM
10 N
O3minus (
microg
kg ai
r)
Day of Month
N2O
5 Het Off
N2O
5 Het On
A B
C D
E F
Figure 8 Domain averaged median (solid lines) and 25th and 75th percentiles (dashed lines) of groundlevel NO3 N2O5 NO2 gas-phase NOy and HNO3 mixing ratios as well as PM10 NOminus3 mass loadingsfor the model runs without (blue lines) and with (red lines) N2O5 heterogeneous uptake scheme areshown in (AndashF) respectively
54
Figure 8 Domain-averaged median (solid lines) and 25th and 75thpercentiles (dashed lines) of ground level NO3 N2O5 NO2 gas-phase NOy and HNO3 mixing ratios as well as PM10 NOminus
3 massloadings for the model runs without (blue lines) and with (red lines)N2O5 heterogeneous uptake scheme are shown in(andashf) respec-tively The statistical information used to generate figure is includedin the Supplement
wherekOH i is the reaction rate of[VOC]i with OH and maybe temperature andor pressure dependent Reaction rateswere taken from the KPP files for the relevant mechanismsand so differ slightly between CRIv2-R5 and CBM-Z Someerrors were found for three reaction rates within the releasedversion of the CRIv2-R5 scheme in WRF-Chem v351 as isdescribed in Appendix B and the Supplement The correctedrates were used for calculations of tendencies An equivalentequation to Eq (10) was used for NO3 using respective ratesfor NO3 and each VOC species it can react with
NO3 oxidation of VOCs is important during the night butit should be noted that the OH oxidation of VOCs is still non-negligible during this period indeed the rates for this arecomparable to those for NO3-driven oxidation While day-time OH oxidation is similar in both schemes nighttime NO3oxidation is slightly higher in CRIv2-R5 owing to the higherNO3 levels in CRIv2-R5 (see Fig2) The greater spatial het-erogeneity of NO3 compared to OH skews the results some-what Maximum NO3 levels are around 300 m above groundwith low NO3 at ground level However most reactive VOCsare near source at ground level The lower more stable night-time boundary layer plays a role here preventing transport offresh VOC emissions higher in the troposphere while main-taining high NO levels and low NO3 at the ground Thusthe dynamics of the nighttime atmosphere are also a factor inmaking OH a more significant oxidant than NO3
When looking at the whole VOC population oxidation viaOH pathways dominate over NO3 pathways However somespecies of VOC preferentially react with NO3 over OH Ofparticular interest are those species containing double car-bon bonds such as anthropogenic propene (C3H6) or bio-genic isoprene (C5H8) which react with NO3 to form organicnitrates (RONO2) While daytime oxidation via OH is still
Geosci Model Dev 7 2557ndash2579 2014 wwwgeosci-model-devnet725572014
S Archer-Nicholls et al WRF-Chem developments 2571
Figure 9 Wind fields and aerosol mass loadings at 1200 UTC on 16 July 2010(a) ground-level wind speeds and vectors(b) PM10 sea-saltaerosol mass loadings increasing in opacity from completely transparent at 4 microg kgminus1
air (c) and(d) total organic aerosol mass loadings for
low biogenic activity and high biogenic activity runs respectively with opacity increasing from completely transparent at 0 microg kgminus1air (bndashd)
generated using VAPOR (Clyne et al 2007) Vertical scale is shown by the axis on the right of each panel each line indicates a 1000 mincrease in altitude
higher at nighttime more double bonds are broken throughreaction with NO3 than OH
43 N2O5 heterogeneous uptake
Across the domain the effect of N2O5 heterogeneous chem-istry is to increase the processing of NOx to generate HNO3and aerosol nitrate The median nighttime mixing ratios ofNO3 and N2O5 are reduced by up to 30 (flattening thepeak in these mixing ratios observed around 0600 h with-out the heterogeneous processing) (see Fig8a and b) Re-duction of mixing ratios within pollution plumes is greaterwith the 75th percentile mixing ratios being reduced by upto 70 The build-up of NO2 and gas-phase NOy across thedomain during the night is reduced only slightly ndash again thegreatest effect is in the pollution plumes (Fig8c and d) Themajority of HNO3 and aerosol nitrate is formed during theday through the OH+ NO2 pathway nighttime productionthrough N2O5 heterogeneous chemistry adds to this (espe-
cially during the pollution episode from 19 to 21 July) butdoes not dominate (Fig8e and f)
The spatial distribution of gas-phase NO3 at 0000 h onthe 20 July can be seen in Fig4e and g The plumes of pol-lution rising up over the North Sea from the UK and main-land Europe are clearly visible An animation of the evolu-tion of NO3 mixing ratios both with and without N2O5 het-erogeneous chemistry over the centre of the domain from16 to 20 July is included in the Supplement (in this anima-tion NO3 data is only plotted for mixing ratios greater than30 pptv) In the animation it is clear that NO3 mixing ratiosare generally suppressed by the inclusion of N2O5 hetero-geneous chemistry This is most obvious over the UK andshipping channels through the English Channel (where NO3mixing ratios increase fromlt 30 pptv to 40ndash90 pptv with theremoval of N2O5 heterogeneous chemistry) but can also beseen in the widespread increase of NO3 mixing ratios overthe North Sea
wwwgeosci-model-devnet725572014 Geosci Model Dev 7 2557ndash2579 2014
2572 S Archer-Nicholls et al WRF-Chem developments
Discussion
Paper
|D
iscussionPaper
|D
iscussionPaper
|D
iscussionPaper
|
13 14 15 16 17 18 190
2
4
6
8
10
12
14
PM
10 N
a+ (
microg
kg ai
r)
Day of Month
13 14 15 16 17 18 190
05
1
15
PM
1 N
a+ (
microg
kg ai
r)
Day of Month
13 14 15 16 17 18 190
02
04
06
08
1
PM
10 o
rgan
ic (
microg
kg ai
r)
Day of Month
13 14 15 16 17 18 190
02
04
06
08
PM
1 or
gani
c (micro
g k
g air)
Day of Month
standard seasprayhigh biogenic activitylow biogenic activity
A B
C D
Figure 10 Domain averaged median (solid lines) and 25th and 75th percentiles (dashed lines) of groundlevel PM10 Na+ PM1 Na+ PM10 organics and PM1 organics mass loadings are shown in (AndashD)respectively starting from 0000 UTC on 13 July 2010 Values for model runs made with the originalseaspray scheme by the new scheme with high biogenic activity and by the new scheme with lowbiogenic activity (see text) are represented by black red and blue lines respectively
56
Figure 10Domain averaged median (solid lines) and 25th and 75th percentiles (dashed lines) of ground level PM10 Na+ PM1 Na+ PM10organics and PM1 organics mass loadings are shown in(andashd) respectively starting from 0000 UTC on 13 July 2010 Values for modelruns made with the original sea-spray scheme by the new scheme with high biogenic activity and by the new scheme with low biogenicactivity (see text) are represented by black red and blue lines respectively The statistical information used to generate figure is included inthe Supplement
More in-depth analysis of the influence of N2O5 heteroge-neous chemistry will be presented in the companion modelndashmeasurement comparison paper (Lowe et al 2014)
44 Marine aerosol emissions
A cyclonic weather system (with surface winds of up to24 m sminus1 see Fig9a) passed across the UK between 15 and17 July 2010 The increase in production of sea-spray aerosolis visible in the median PM10 Na+ mass loadings in the low-est model level which increase from 3 to 7 microg kgminus1
air duringthis period (Fig10a) To investigate the new sea-spray rou-tine we have run two scenarios using it one representing lowbiogenic activity and a second representing higher biogenicactivity These scenarios have been run without OC in theboundary conditions in order to focus just on contributionsto OC from local sea-spray and anthropogenic emissions Wewill compare these with the base model run described above
Whole-domain median and 25th and 75th percentile val-ues (calculated as described above) are shown in Fig10 forNa+ (representing the sea-salt content of the aerosol popu-lation) and (primary) organics (from both sea-spray and an-thropogenic aerosol) The total sea-salt aerosol mass load-ing is not significantly changed by the new parameterisation(represented by PM10 Na+ in Fig10a) due to the dominanceof the larger particles on the mass distribution
The new parameterisation changes the source term for sea-spray aerosol in size bins 1 to 4 and so it is in PM1 sizerange that Na+ mass loadings increase by up to 20 when
the wind speeds are high (Fig10b) The organic content ofPM10 and PM1 aerosol (Fig10c and d respectively) are verysimilar between the original scheme (black lines) and lowbiogenic activity scenario (blue lines) as would be expectedby the mass fractionation of emissions in that scenario (Ta-ble 2) The differences between these scenarios and the highbiogenic activity scenario (red lines) indicate the proportionof organic aerosol which comes from sea-spray emissions (asopposed to anthropogenic sources)
In the high-biogenic activity scenario sea-spray emissionsincrease the background unpolluted PM10 organic content(represented by the median and 25th percentile lines inFig 10c) by 01ndash02 microg kgminus1
air The increase in PM10 organicmass loadings within polluted regions (represented by the75th percentile lines) is proportionally lower when the sea-spray emissions are low (such as on 14 and 15 July) How-ever during periods of high wind speeds as observed on 16and 17 July this contribution increases to 02ndash03 microg kgminus1
air almost doubling the (primary) organic aerosol mass load-ings within these polluted regions Figure9c and d show thechange in distribution across the domain due to these emis-sions highlighting a significant increase in organic aerosolacross the North Atlantic in the high-biogenic activity sce-nario An animation showing the same for the period of the14th through to the 17th July is included in the Supplement
Geosci Model Dev 7 2557ndash2579 2014 wwwgeosci-model-devnet725572014
S Archer-Nicholls et al WRF-Chem developments 2573
5 Conclusions
In this study we have presented several developments madeto WRF-Chem to make the model more suitable for studyingnighttime chemical processes over the UK
The first was to add a detailed organic gas-phase scheme(CRIv2-R5) traceable to the MCM v31 to WRF-chem us-ing the KPP protocol This scheme was compared against theexisting CBM-Z in a test case over northern Europe Whilstthere was slightly more ozone production in the CRIv2-R5model in highly polluted regions average O3 mixing ratioswere comparable in both schemes There was significantlymore production of NO3 in pollution plumes at night a fewhundred metres agl in the CRIv2-R5 model Oxidation viaOH channels are around 3 orders of magnitude greater thanvia NO3 during the day whereas at night the two pathwaysare of a similar magnitude VOC tendencies with respect toNO3 oxidation are higher in the CRIv2-R5 scheme due tothe higher NO3 concentrations
An N2O5 heterogeneous chemistry parameterisation wasadded to the MOSAIC aerosol module based onBertramand Thornton(2009) This was coupled to the CRIv2-R5 andCBM-Z chemical schemes It has been shown to significantlyreduce the build-up of NO3 and N2O5 through the nightInclusion of the effects of organic aerosol and comparisonswith measurement data from the RONOCO flight campaignare made in the companion paper to verify the effectivenessof the parameterisation (Lowe et al 2014)
Finally we added a new sea-spray source term which ex-tends down to 3 nm particle size and allows the addition ofan organic fraction to the source term This was tested forlow and high biogenic activity scenarios and was shown togreatly increase the mass of organic aerosol over the oceanin windy conditions although organic particulate mass is stillsmall relative to sea-salt aerosol loadings
The developments have been released in version 351 ofWRF-Chem (available for download fromhttpwwwmmmucareduwrfusers)
wwwgeosci-model-devnet725572014 Geosci Model Dev 7 2557ndash2579 2014
2574 S Archer-Nicholls et al WRF-Chem developments
Appendix A CBM-Z changes
In order to facilitate comparison between CBM-Z andCRIv2-R5 we modified CBM-Z by adding the DMS chem-istry scheme ofvon Glasow and Crutzen(2004) (as was donefor CRIv2-R5) In addition a dummy reaction for ClNO2was added to the scheme in order that the full N2O5 het-erogeneous scheme could be used with CBM-Z (see below)Two changes have also been made to the reaction scheme toupdate the NO3 and N2O5 chemistry bringing this more inline with the most recent recommendations (Atkinson et al2004) (seehttpwwwiupac-kineticchcamacukfor latestevaluated data)
1 The NO3 + HO2 reaction rate has been increasedto 4times 10minus12 cm3 moleculesminus1 sminus1 and the productsare now just OH and NO2 (Rate last evaluatedon 16 August 2008 OH and NO2 pathway thoughtto dominate although branching ratios are uncer-tainhttpwwwiupac-kineticchcamacukdatasheetspdfNOx18_HO2_NO3pdf)
2 The N2O5 + H2O rarr 2HNO3 reaction has been re-moved (recommendation not to include in modelsuntil further field or lab experiments are availablehttpwwwiupac-kineticchcamacukdatasheetspdfNOx33_N2O5_H2Opdf)
Appendix B Additions to WRF-Chem
The majority of the developments detailed in this paper havebeen included in WRF-Chem version 351 the CRIv2-R5chemical scheme N2O5 heterogeneous chemistry new sea-spray emission schemes and emission speciation for theNorthwest European domain Since the release of WRF-Chem 351 we have corrected the calculations for three reac-tion rates in the code for CRIv2-R5 Details of these changesas well as the replacement KPP equation and definition filesfor WRF-Chem 351 are included in the Supplement Belowwe list the namelist options to use these developments
The new chemistry mechanism options are
chem_opt=600CRIv2-R5 chemical mechanism
chem_opt=601CRIv2-R5 chemical mechanism with8-bin MOSAIC aerosol including some aqueous reac-tions
chem_opt=611CRIv2-R5 chemical mechanism with4-bin MOSAIC aerosol including some aqueous reac-tions
The new emission scheme options are
emiss_opt=19CRIv2-R5 gas-phase emissions
emiss_opt=20CRIv2-R5MOSAIC emissions (config-ured for UK aerosol distributions)
emiss_inpt_opt=121UK aerosol emission size frac-tionation for MOSAIC
One new namelist flag has been added to WRF-Chem tocontrol the N2O5 heterogeneous scheme and which is setonce for all domains
n2o5_hetchem=0no N2O5 heterogeneous chemistry(default)
n2o5_hetchem=1N2O5 heterogeneous chemistry with-out Clminus pathway
n2o5_hetchem=2full inorganic N2O5 heterogeneouschemistry scheme
To use this scheme you have to select a chemistry optionwhich includes the MOSAIC aerosol module and which car-ries N2O5 and ClNO2 in the gas-phase The intermediate op-tion (which does not take into consideration the chloride con-tent of the aerosol) is provided for use where ClNO2 is notincluded in the gas-phase scheme
The new sea-spray emission scheme options are
seas_opt=3example low biogenic activity sea-sprayemissions
seas_opt=4example high biogenic activity sea-sprayemissions
These include the example settings used for this studyUsers wishing to use different organic concentrationsand fractionations can do this by editing the defini-tions of the oc02um org_frac_low_activityand org_frac_high_activity parameters inchemmodule_mosaic_addemissF
Geosci Model Dev 7 2557ndash2579 2014 wwwgeosci-model-devnet725572014
S Archer-Nicholls et al WRF-Chem developments 2575
The Supplement related to this article is available onlineat doi105194gmd-7-2557-2014-supplement
AcknowledgementsS Archer-Nicholls was supported by a NatureEnvironment Research Council (NERC) quota studentship workfunded on the RONOCO NERC grant NEF0046561 R Zaveriand J Fast were supported by the US Department of Energy (DOE)Atmospheric System Research (ASR) program at PNNL PNNL isoperated by the US DOE by Battelle Memorial Institute Oslash Hod-nebrog has received funding from the European Unionrsquos SeventhFramework Programme (FP72007-2013) under Grant Agreementno 212095 (CityZen) H Denier van der Gon was partly funded bythe EU Seventh Research Framework Programme (grant agreementNo 283576 MACC II) Our thanks to Thomas Pugh from KITfor help with developing the emissions processing script StacyWalters from UCAR for reworking the mozbc script for use withMACC boundary conditions and Johannes Kaiser from ECMWFfor help acquiring and processing MACC boundary conditionsdata Model runs were carried out on the High End ComputingTerascale Resources (HECToR) British national supercomputer
Edited by R Sander
References
Ackermann I J Hass H Memmesheimer M Ebel ABinkowski F S and Shankar U Modal aerosol dynamicsmodel for Europe development and first applications AtmosEnviron 32 2981ndash2999 1998
Allan B J McFiggans G and Plane J M C Coe Hand McFadyen G G The nitrate radical in the remote ma-rine boundary layer J Geophys Res 105 24191ndash24204doi1010292000JD900314 2000
Allan J D Williams P I Morgan W T Martin C LFlynn M J Lee J Nemitz E Phillips G J Gallagher M Wand Coe H Contributions from transport solid fuel burning andcooking to primary organic aerosols in two UK cities AtmosChem Phys 10 647ndash668 doi105194acp-10-647-2010 2010
Asaf D Tas E Pedersen D Peleg M and Luria M Long-term measurements of NO3 radical at a semiarid urban site 2Seasonal trends and loss mechanisms Environ Sci Technol 445901ndash5907 doi101021es100967z 2010
Atkinson R Atmospheric chemistry of VOCs and NOx AtmosEnviron 34 2063ndash2101 doi101016S1352-2310(99)00460-42000
Atkinson R Baulch D L Cox R A Crowley J N Hamp-son R F Hynes R G Jenkin M E Rossi M J and Troe JEvaluated kinetic and photochemical data for atmospheric chem-istry Volume I ndash gas phase reactions of Ox HOx NOx and SOxspecies Atmos Chem Phys 4 1461ndash1738 doi105194acp-4-1461-2004 2004
Baklanov A Mahura A and Sokhi R S (Eds) Integrated Sys-tems of Meso-Meteorological and Chemical Transport Mod-els Springer-Verlag Berlin Heidelberg doi101007978-3-642-13980-2 2011
Beck V Gerbig C Koch T Bela M M Longo K M Fre-itas S R Kaplan J O Prigent C Bergamaschi P andHeimann M WRF-Chem simulations in the Amazon regionduring wet and dry season transitions evaluation of methanemodels and wetland inundation maps Atmos Chem Phys 137961ndash7982 doi105194acp-13-7961-2013 2013
Benedetti A Morcrette J-J Boucher O Dethof A Enge-len R J Fisher M Flentje H Huneeus N Jones LKaiser J W Kinne S Mangold A Razinger M Sim-mons A J and Suttie M Aerosol analysis and forecast inthe European Centre for Medium-Range Weather Forecasts In-tegrated Forecast System 2 Data assimilation J Geophys Res114 D13205 doi1010292008JD011115 2009
Bertram T H and Thornton J A Toward a general parameteriza-tion of N2O5 reactivity on aqueous particles the competing ef-fects of particle liquid water nitrate and chloride Atmos ChemPhys 9 8351ndash8363 doi105194acp-9-8351-2009 2009
Brown S S and Stutz J Nighttime radical observa-tions and chemistry Chem Soc Rev 41 6405ndash6447doi101039c2cs35181a 2012
Carter W P L Development of ozone reactivity scales for volatileorganic-compounds J Air Waste Manage 44 881ndash899 1994
Carter W P L Implementation of the SAPRC-99 chemical mech-anism into the models-3 framework US EPA report available athttpwwwengrucredu~carterpubss99mod3pdf(last access17 January 2014) 2000
Chang W L Bhave P V Brown S B Riemer N Stutz Jand Dabdub D Heterogeneous atmospheric chemistry ambi-ent measurements and model calculations of N2O5 a reviewAerosol Sci Tech 45 665ndash695 2011
Chin M Rood R B Lin S-J Muumlller J-F and Thomp-son A M Atmospheric sulfur cycle simulated in the globalmodel GOCART model description and global properties JGeophys Res 105 24671ndash24687 doi1010292000JD9003842000
Clyne J Mininni P Norton A and Rast M Interactive desktopanalysis of high resolution simulations application to turbulentplume dynamics and current sheet formation New J Phys 9301 doi1010881367-263098301 2007
Damian V Sandu A Damian M Potra F andCarmichael G R The Kinetic PreProcessor KPP ndash a softwareenvironment for solving chemical kinetics Comput ChemEng 26 1567ndash1579 2002
Diacuteaz A M Diacuteaz J P Expoacutesito F J Hernaacutendez-Leal P ASavoie D and Querol X Air masses and aerosols chemicalcomponents in the free troposphere at the subtropical northeastAtlantic region J Atmos Chem 53 63ndash90 2006
Dee D P Uppala S M Simmons A J Berrisford P Poli PKobayashi S Andrae U Balmaseda M A Balsamo GBauer P Bechtold P Beljaars A C M van de Berg LBidlot J Bormann N Delsol C Dragani R Fuentes MGeer A J Haimberger L Healy S B Hersbach HHoacutelm E V Isaksen L Karingllberg P Koumlhler M Matricardi MMcNally A P Monge-Sanz B M Morcrette J-J Park B-K Peubey C de Rosnay P Tavolato C Theacutepaut J-N andVitart F The ERA-Interim reanalysis configuration and perfor-mance of the data assimilation system Q J Roy Meteor Soc137 553ndash597 doi101002qj828 2011
wwwgeosci-model-devnet725572014 Geosci Model Dev 7 2557ndash2579 2014
2576 S Archer-Nicholls et al WRF-Chem developments
Department for Environment Food and Rural Affairs (DEFRA)Fine Particulate Matter (PM25) in the UK Air Quality ExpertGroup pb13837 available athttpswwwgovukgovernmentpublicationsfine-particulate-matter-pm2-5-in-the-uk(last ac-cess 17 January 2014) 2012
de Leeuw G Andreas E L Anguelova M D Fairall C WLewis E R OrsquoDowd C Schulz M and Schwartz S EProduction flux of sea spray aerosol Rev Geophys 49 1ndash39doi1010292010RG000349 2011
Denier van der Gon H A C Visschedijk A van der Brugh Hand Droumlge R A high resolution European emission data basefor the year 2005 a contribution to UBA ndash Projekt PARESTParticle Reduction Strategies TNO report TNO-034-UT-2010-01895_RPT-ML Utrecht 2010
Dentener F J and Crutzen P J Reaction of N2O5 on troposphericaerosols ndash impact on the global distribution of NOx O3 and OHJ Geophys Res 98 7149ndash7163 1993
DeMore W B Sander S P Golden D M Hampson R FKurylo M J Howard C J Ravishankara A R Kolb C EMolina M J Chemical Kinetics and Photochemical Data forUse in Stratospheric Modeling Eval 12 NASA Jet Propul LabCalif Inst of Technol Pasadena 1997
Derwent R G The long range transport of ozone within Europeand its control Environ Pollut 63 299ndash318 1990
Dore C J Goodwin J W L Watterson J D Murrells T PPassant N R Hobson M M Haigh K E Baggott GThistlethwaite G Pye S T Coleman P J and King K RUK emissions of air pollutants 1970ndash2001 National atmosphericemissions inventory report AEATENVR1593 1-85580-033-02003
EMEP Transboundary Acidification Eutrophication and GroundLevel Ozone in Europe Norwegian Meteorological Institute Re-port 12003 2003
Emmons L K Walters S Hess P G Lamarque J-F Pfis-ter G G Fillmore D Granier C Guenther A Kinnison DLaepple T Orlando J Tie X Tyndall G Wiedinmyer CBaughcum S L and Kloster S Description and evaluation ofthe Model for Ozone and Related chemical Tracers version 4(MOZART-4) Geosci Model Dev 3 43ndash67 doi105194gmd-3-43-2010 2010
Fast J D Gustafson W I Easter R C Zaveri R ABarnard J C Chapman E G Grell G A and Peck-ham S E Evolution of ozone particulates and aerosol directradiative forcing in the vicinity of Houston using a fully coupledmeteorologyndashchemistryndashaerosol model J Geophys Res 1111ndash29 doi1010292005JD006721 2006
Forkel R Werhahn J Hansen A B McKeen S Peckham SGrell G and Suppan P Effect of aerosol-radiation feedback onregional air quality ndash a case study with WRF-Chem Atmos En-viron 53 202ndash211 doi101016jatmosenv201110009 2012
Fuchs N A and Sutugin A G High-dispersed aerosols in Topicsin Current Aerosol Research (Part 2) edited by Hidy G M andBrock J R Elsevier New York 1ndash200 1971
Fuentes E Coe H Green D de Leeuw G and McFiggans GOn the impacts of phytoplankton-derived organic matter on theproperties of the primary marine aerosol ndash Part 1 Source fluxesAtmos Chem Phys 10 9295ndash9317 doi105194acp-10-9295-2010 2010
Fuentes E Coe H Green D and McFiggans G On the impactsof phytoplankton-derived organic matter on the properties of theprimary marine aerosol ndash Part 2 Composition hygroscopicityand cloud condensation activity Atmos Chem Phys 11 2585ndash2602 doi105194acp-11-2585-2011 2011
Giorgi F Regional climate modeling status and perspectives JPhys IV 139 101ndash118 doi101051jp42006139008 2006
Goldstein A H and Galbally I E Known and unexplored organicconstituents in the Earthrsquos atmosphere Environ Sci Technol41 1514ndash1521 2007
Gong S L A parameterization of sea-salt aerosol source functionfor sub- and super-micron particles Global Biogeochem Cy 171097 doi1010292003GB002079 2003
Gong S L Bartie L A and Blanchet J-P Modeling sea-saltaerosols in the atmosphere 1 Model development J GeophysRes 102 3805ndash3818 1997
Grell G A Peckham S E Schmitz R McKeen S A Frost GSkamarock W C and Eder B Fully coupled ldquoonlinerdquo chem-istry within the WRF model Atmos Environ 39 6957ndash6975doi101016jatmosenv200504027 2005
Grell G A Freitas S R Stuefer M and Fast J Inclusion ofbiomass burning in WRF-Chem impact of wildfires on weatherforecasts Atmos Chem Phys 11 5289ndash5303 doi105194acp-11-5289-2011 2011
Grosjean D and Seinfeld J H Parameterization of the forma-tion potential of secondary organic aerosols Atmos Environ23 1733ndash1747 1989
Guenther A Hewitt C N Erickson D Fall R Geron CGraedel T Harley P Klinger L Lerdau M Mckay W APierce T Scholes B Steinbrecher R Tallamraju R Tay-lor J and Zimmerman P A global model of natural volatileorganic compound emissions J Geophys Res 100 8873ndash8892doi10102994JD02950 1995
Guenther A Karl T Harley P Wiedinmyer C Palmer P Iand Geron C Estimates of global terrestrial isoprene emissionsusing MEGAN (Model of Emissions of Gases and Aerosols fromNature) Atmos Chem Phys 6 3181ndash3210 doi105194acp-6-3181-2006 2006
Hodnebrog Oslash Stordal F and Berntsen T K Does the resolutionof megacity emissions impact large scale ozone Atmos Envi-ron 45 6852ndash6862 doi101016jatmosenv201101012 2011
Hodnebrog Oslash Solberg S Stordal F Svendby T M Simp-son D Gauss M Hilboll A Pfister G G Turquety SRichter A Burrows J P and Denier van der Gon H A CImpact of forest fires biogenic emissions and high tempera-tures on the elevated Eastern Mediterranean ozone levels duringthe hot summer of 2007 Atmos Chem Phys 12 8727ndash8750doi105194acp-12-8727-2012 2012
Inness A Baier F Benedetti A Bouarar I Chabrillat SClark H Clerbaux C Coheur P Engelen R J Errera QFlemming J George M Granier C Hadji-Lazaro J Huij-nen V Hurtmans D Jones L Kaiser J W Kapsomenakis JLefever K Leitatildeo J Razinger M Richter A Schultz M GSimmons A J Suttie M Stein O Theacutepaut J-N Thouret VVrekoussis M Zerefos C and the MACC team The MACCreanalysis an 8 yr data set of atmospheric composition AtmosChem Phys 13 4073ndash4109 doi105194acp-13-4073-20132013
Geosci Model Dev 7 2557ndash2579 2014 wwwgeosci-model-devnet725572014
S Archer-Nicholls et al WRF-Chem developments 2577
Jacobson M Z and Ginnebaugh D L Global-through-urbannested three-dimensional simulation of air pollution witha 13600-reaction photochemical mechanism J Geophys Res115 D14304 doi1010292009JD013289 2010
Jenkin M E Saunders S M Derwent R G and Pilling M JDevelopment of a reduced speciated VOC degradation mecha-nism for use in ozone models Atmos Environ 36 4725ndash47342002
Jenkin M E Saunders S M Wagner V and Pilling M JProtocol for the development of the Master Chemical Mecha-nism MCM v3 (Part B) tropospheric degradation of aromaticvolatile organic compounds Atmos Chem Phys 3 181ndash193doi105194acp-3-181-2003 2003
Jenkin M Watson L Utembe S and Shallcross D A CommonRepresentative Intermediates (CRI) mechanism for VOC degra-dation Part 1 Gas phase mechanism development Atmos Envi-ron 42 7185ndash7195 doi101016jatmosenv200807028 2008
Kettle A J Andreae M O Amouroux D Andreae T WBates T S Berresheim H Bingemer H Boniforti RCurran M A J DiTullio G R Helas G Jones G BKeller M D Kiene R P Leck C Levasseur M Ma-lin G Maspero M Matrai P McTaggart A R Mihalopou-los N Nguyen B C Novo A Putaud J P Rapsomanikis SRoberts G Schebeske G Sharma S Simoacute R Staubes RTurner S and Uher G A global database of sea surfacedimethylsulfide (DMS) measurements and a procedure to predictsea surface DMS as a function of latitude longitude and monthGlobal Biogeochem Cy 13 399ndash444 1999
Kulmala M Asmi A Lappalainen H K Baltensperger UBrenguier J-L Facchini M C Hansson H-C Hov OslashOrsquoDowd C D Poumlschl U Wiedensohler A Boers RBoucher O de Leeuw G Denier van der Gon H A C Fe-ichter J Krejci R Laj P Lihavainen H Lohmann U Mc-Figgans G Mentel T Pilinis C Riipinen I Schulz MStohl A Swietlicki E Vignati E Alves C Amann MAmmann M Arabas S Artaxo P Baars H Beddows DC S Bergstroumlm R Beukes J P Bilde M Burkhart J FCanonaco F Clegg S L Coe H Crumeyrolle S DrsquoAnnaB Decesari S Gilardoni S Fischer M Fjaeraa A M Foun-toukis C George C Gomes L Halloran P Hamburger THarrison R M Herrmann H Hoffmann T Hoose C HuM Hyvaumlrinen A Hotilderrak U Iinuma Y Iversen T JosipovicM Kanakidou M Kiendler-Scharr A Kirkevaringg A Kiss GKlimont Z Kolmonen P Komppula M Kristjaacutensson J-ELaakso L Laaksonen A Labonnote L Lanz V A LehtinenK E J Rizzo L V Makkonen R Manninen H E McMeek-ing G Merikanto J Minikin A Mirme S Morgan W TNemitz E OrsquoDonnell D Panwar T S Pawlowska H Pet-zold A Pienaar J J Pio C Plass-Duelmer C Preacutevocirct AS H Pryor S Reddington C L Roberts G Rosenfeld DSchwarz J Seland Oslash Sellegri K Shen X J Shiraiwa MSiebert H Sierau B Simpson D Sun J Y Topping DTunved P Vaattovaara P Vakkari V Veefkind J P Viss-chedijk A Vuollekoski H Vuolo R Wehner B Wildt JWoodward S Worsnop D R van Zadelhoff G-J ZardiniA A Zhang K van Zyl P G Kerminen V-M CarslawK and Pandis S N General overview European Integratedproject on Aerosol Cloud Climate and Air Quality interactions(EUCAARI) ndash integrating aerosol research from nano to global
scales Atmos Chem Phys 11 13061ndash13143 doi105194acp-11-13061-2011 2011
Lee J D McFiggans G Allan J D Baker A R Ball S MBenton A K Carpenter L J Commane R Finley B DEvans M Fuentes E Furneaux K Goddard A Good NHamilton J F Heard D E Herrmann H Hollingsworth AHopkins J R Ingham T Irwin M Jones C E Jones R LKeene W C Lawler M J Lehmann S Lewis A CLong M S Mahajan A Methven J Moller S JMuumlller K Muumlller T Niedermeier N OrsquoDoherty S Oet-jen H Plane J M C Pszenny A A P Read K ASaiz-Lopez A Saltzman E S Sander R von Glasow RWhalley L Wiedensohler A and Young D Reactive Halo-gens in the Marine Boundary Layer (RHaMBLe) the tropicalNorth Atlantic experiments Atmos Chem Phys 10 1031ndash1055 doi105194acp-10-1031-2010 2010
Liu D Allan J Corris B Flynn M Andrews E Ogren JBeswick K Bower K Burgess R Choularton T Dorsey JMorgan W Williams P I and Coe H Carbonaceous aerosolscontributed by traffic and solid fuel burning at a polluted rural sitein Northwestern England Atmos Chem Phys 11 1603ndash1619doi105194acp-11-1603-2011 2011
Liu X Easter R C Ghan S J Zaveri R Rasch P Shi XLamarque J-F Gettelman A Morrison H Vitt F Con-ley A Park S Neale R Hannay C Ekman A M LHess P Mahowald N Collins W Iacono M J Brether-ton C S Flanner M G and Mitchell D Toward a min-imal representation of aerosols in climate models descriptionand evaluation in the Community Atmosphere Model CAM5Geosci Model Dev 5 709ndash739 doi105194gmd-5-709-20122012
Lowe D Archer-Nicholls S Morgan W Allan J UtembeS Ouyang B Aruffo E Le Breton M Zaveri R A DiCarlo P Percival C Coe H Jones R and McFiggansG WRF-chem model predictions of the regional impacts ofN2O5 heterogeneous processes on nighttime chemistry overnorth-western Europe Atmos Chem Phys Discuss 14 20883ndash20943 doi105194acpd-14-20883-2014 2014
Monks P S Gas-phase radical chemistry in the troposphereChem Soc Rev 34 376ndash395 doi101039b307982c 2005
Morcrette J-J Boucher O Jones L Salmond D Bechtold PBeljaars A Benedetti A Bonet A Kaiser J W Razinger MSchulz M Serrar S Simmons A J Sofiev M Suttie MTompkins A M and Untch A Aerosol analysis and forecastin the European Centre for Medium-Range Weather ForecastsIntegrated Forecast System forward modeling J Geophys Res114 D06206 doi1010292008JD011235 2009
Morgan W T Allan J D Bower K N Highwood E J Liu DMcMeeking G R Northway M J Williams P I Krejci Rand Coe H Airborne measurements of the spatial distributionof aerosol chemical composition across Europe and evolutionof the organic fraction Atmos Chem Phys 10 4065ndash4083doi105194acp-10-4065-2010 2010
Ntelekos A Smith J A Donner L Fast L D Chapman E GGustafson Jr W I and Krajewski W F Effect of aerosols onintense convective precipitation in the northeastern US Q J RoyMeteor Soc 135 1367ndash1391 2009
wwwgeosci-model-devnet725572014 Geosci Model Dev 7 2557ndash2579 2014
2578 S Archer-Nicholls et al WRF-Chem developments
OrsquoDowd C D Smith M H Consterdine I E and Lowe J AMarine aerosol sea salt and the marine sulpher cycle a shortreview Atmos Environ 31 73ndash80 1997
OrsquoDowd C D Facchini M C Cavalli F Ceburnis DMircea M Decesari S Fuzzi S Yoon Y J and Putaud J-P Biogenically driven organic contribution to marine aerosolNature 431 676ndash680 doi101038nature02959 2004
Osthoff H D Pilling M J Ravishankara A R andBrown S S Temperature dependence of the NO3 absorp-tion cross-section above 298 K and determination of the equi-librium constant for NO3 + NO2 harr N2O5 at atmosphericallyrelevant conditions Phys Chem Chem Phys 9 5785ndash5793doi101039b709193a 2007
Qian Y Gustafson Jr W I Leung L R and Ghan S J Effectsof soot-induced snow albedo change on snowpack and hydrolog-ical cycle in western United States based on Weather Researchand Forecasting chemistry and regional climate simulations JGeophys Res 114 D03108 doi1010292008JD011039 2009
Riemer N Vogel H Vogel B Schell B Ackermann IKessler C and Hass H Impact of the heterogeneous hydrolysisof N2O5 on chemistry and nitrate aerosol formation in the lowertroposphere under photosmog conditions J Geophys Res 108D04144 doi1010292002JD002436 2003
Riemer N Vogel H Vogel B Anttila T Kiendler-Scharr AMentel T F Relative importance of organic coatings for theheterogeneous hydrolysis of N2O5 during summer in Europe JGeophys Res 114 D17307 doi1010292008JD011369 2009
Ritter M Muumlller M D Tsai M-Y and Parlow E Air pollu-tion modeling over very complex terrain an evaluation of WRF-Chem over Switzerland for two 1-year periods Atmos Res132ndash133 209ndash222 2013
Sakulyanontvittaya T Duhl T Wiedinmyer C Helmig D Mat-sunaga S Potosnak M Milford J and Guenther A Monoter-pene and sesquiterpene emission estimates for the United StatesEnviron Sci Technol 42 1623ndash1629 doi101021es702274e2008
Sarwar G Simon H Bhave P and Yarwood G Examining theimpact of heterogeneous nitryl chloride production on air qualityacross the United States Atmos Chem Phys 12 6455ndash6473doi105194acp-12-6455-2012 2012
Saunders S M Jenkin M E Derwent R G and Pilling M JProtocol for the development of the Master Chemical Mech-anism MCM v3 (Part A) tropospheric degradation of non-aromatic volatile organic compounds Atmos Chem Phys 3161ndash180 doi105194acp-3-161-2003 2003
Schell B Ackermann I J Hass H Binkowski F S andEbel A Modeling the formation of secondary organic aerosolwithin a comprehensive air quality modeling system J GeophysRes 106 28275ndash28293 2001
Sillman S The relation between ozone NOx and hydrocarbonsin urban and polluted rural environments Atmos Environ 331821ndash1845 doi101016S1352-2310(98)00345-8 1999
Simpson D Fagerli H Jonson J E Tsyro S Wind P andTuovinen J-P Transboundary acidification eutrophication andground level ozone in Europe Part I Unified EMEP model de-scription EMEP Rep 12003 104 pp Norw Meteorol InstOslo 2003
Sheehy P M Volkamer R Molina L T and Molina M J Ox-idative capacity of the Mexico City atmosphere ndash Part 2 A ROx
radical cycling perspective Atmos Chem Phys 10 6993ndash7008doi105194acp-10-6993-2010 2010
Skamarock W C Klemp J B Dudhia J Gill D OBarker D M Wang W and Powers J G A description ofthe Advanced Research WRF Version 2 NCAR Tech Notes-468+STR 2005
Solazzo E Bianconi R Pirovano G Matthias V Vautard RMoran M D Wyat Appel K Bessagnet B Brandt J RChristensen J H Chemel C Coll I Ferreira J Forkel RFrancis X V Grell G Grossi P Hansen A B Miranda A INopmongcol U Prank M Sartelet K N Schaap M Sil-ver J D Sokhi R S Vira J Werhahn J Wolke RYarwood G Zhang J Rao S T and Galmarini S Oper-ational model evaluation for particulate matter in Europe andNorth America in the context of AQMEII Atmos Environ 5375ndash92 doi101016jatmosenv201202045 2012a
Solazzo E Bianconi R Vautard R Appel K W Moran M DHogrefe C Bessagnet B Brandt J R Christensen J HChemel C Coll I Denier van der Gon H Ferreira JForkel R Francis X V Grell G Grossi P Hansen A BJericevic A Kraljevic L Miranda A I Nopmongcol UPirovano G Prank M Riccio A Sartelet K N Schaap MSilver J D Sokhi R S Vira J Werhahn J Wolke RYarwood G Zhang J Rao S and Galmarini S Model eval-uation and ensemble modelling of surface-level ozone in Europeand North America in the context of AQMEII Atmos Environ53 60ndash74 doi101016jatmosenv201201003 2012b
Stein O Flemming J Inness A Kaiser J W Schultz M GGlobal reactive gases forecasts and reanalysis in the MACCproject Journal of Integrative Environmental Sciences 9 57ndash70doi1010801943815X2012696545 2012
Stockwell W R Middleton P Chang J S and Tang XThe second-generation regional acid deposition model chemicalmechanism for regional air quality modeling J Geophys Res95 16343ndash16367 1990
Stockwell W R Kirchner F Kuhn M and Seefeld S A newmechanism for regional atmospheric chemistry modeling JGeophys Res 102 25847ndash25879 doi10102997JD008491997
Stockwell W R Lawson C V Saunders E and Goliff W SA review of tropospheric atmospheric chemistry and gas-phasechemical mechanisms for air quality modeling Atmosphere 31ndash32 doi103390atmos3010001 2011
Tavolato C and Isaksen L Data Usage and Quality Control forERA-40 ERA-Interim and the operational ECMWF data assim-ilation system ERA report series ECMWF Reading 2011
Thornton J A Braban C F and Abbatt J P D N2O5 hydrolysison sub-micron organic aerosols the effects of relative humidityparticle phase and particle size Phys Chem Chem Phys 54593ndash4603 2003
Thornton J A Kercher J P Riedel T P Wagner N L Cozic JHolloway J S Dub W P Wolfe G M Quinn P K Middle-brook A M Alexander B and Brown S S A large atomicchlorine source inferred from mid-continental reactive nitro-gen chemistry Nature 464 271ndash274 doi101038nature089052010
Tuccella P Curci G Visconti G Bessagnet B Menut L andPark R J Modelling of gas and aerosol with WRF-Chem over
Geosci Model Dev 7 2557ndash2579 2014 wwwgeosci-model-devnet725572014
S Archer-Nicholls et al WRF-Chem developments 2579
Europe evaluation and sensitivity study J Geophys Res 117D03303 doi1010292011JD016302 2012
Utembe S R Jenkin M E Derwent R G Lewis A C Hop-kins J R and Hamilton J F Modelling the ambient distri-bution of organic compounds during the August 2003 ozoneepisode in the southern UK Faraday Discuss 130 311ndash326doi101039b417403h 2005
Utembe S R Cooke M C Archibald A T Jenkin M E Der-went R G and Shallcross D E Using a reduced CommonRepresentative Intermediates (CRIv2-R5) mechanism to simu-late tropospheric ozone in a 3-D Lagrangian chemistry transportmodel Atmos Environ 44 1609ndash1622 2010
von Glasow R and Crutzen P J Model study of multiphase DMSoxidation with a focus on halogens Atmos Chem Phys 4 589ndash608 doi105194acp-4-589-2004 2004
Watson L A Shallcross D E Utembe S R andJenkin M E Common Representative Intermediates(CRI) mechanism for VOC degradation Part 2 Gas phasemechanism reduction Atmos Environ 42 7196ndash7204doi101016jatmosenv200807034 2008
Ying Q and Li J Implementation and initial application of thenear-explicit Master Chemical Mechanism in the 3D Commu-nity Multiscale Air Quality (CMAQ) model Atmos Environ45 3244ndash3256 2011
Zaveri R A and Peters L K A new lumped structure photochem-ical mechanism for large-scale applications J Geophys Res104 30387ndash30415 1999
Zaveri R A Easter R C Fast J D and Peters L K Model forSimulating Aerosol Interactions and Chemistry (MOSAIC) JGeophys Res 113 D13204 doi1010292007JD008782 2008
wwwgeosci-model-devnet725572014 Geosci Model Dev 7 2557ndash2579 2014
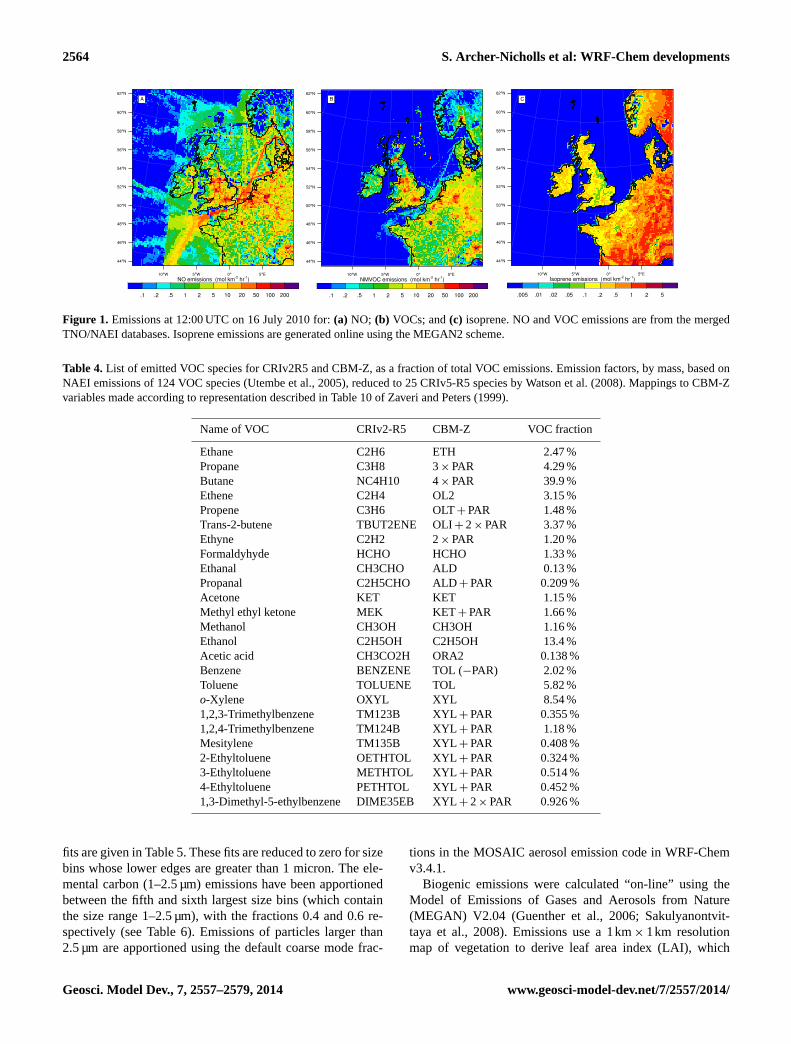
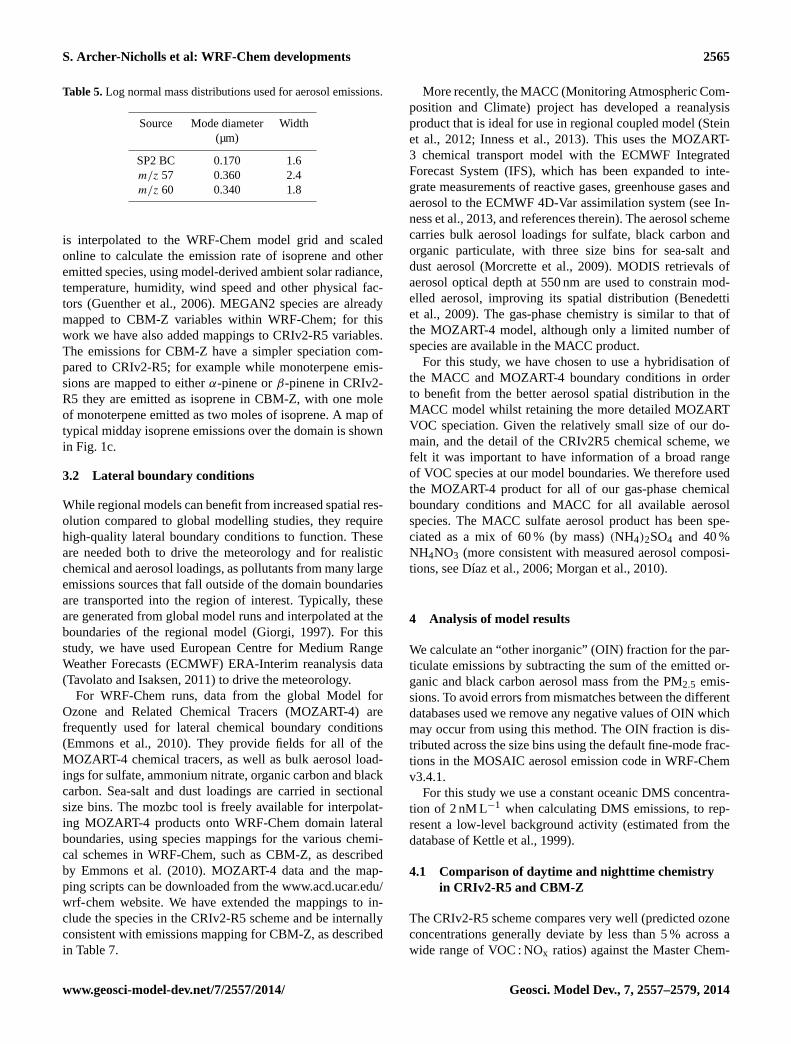
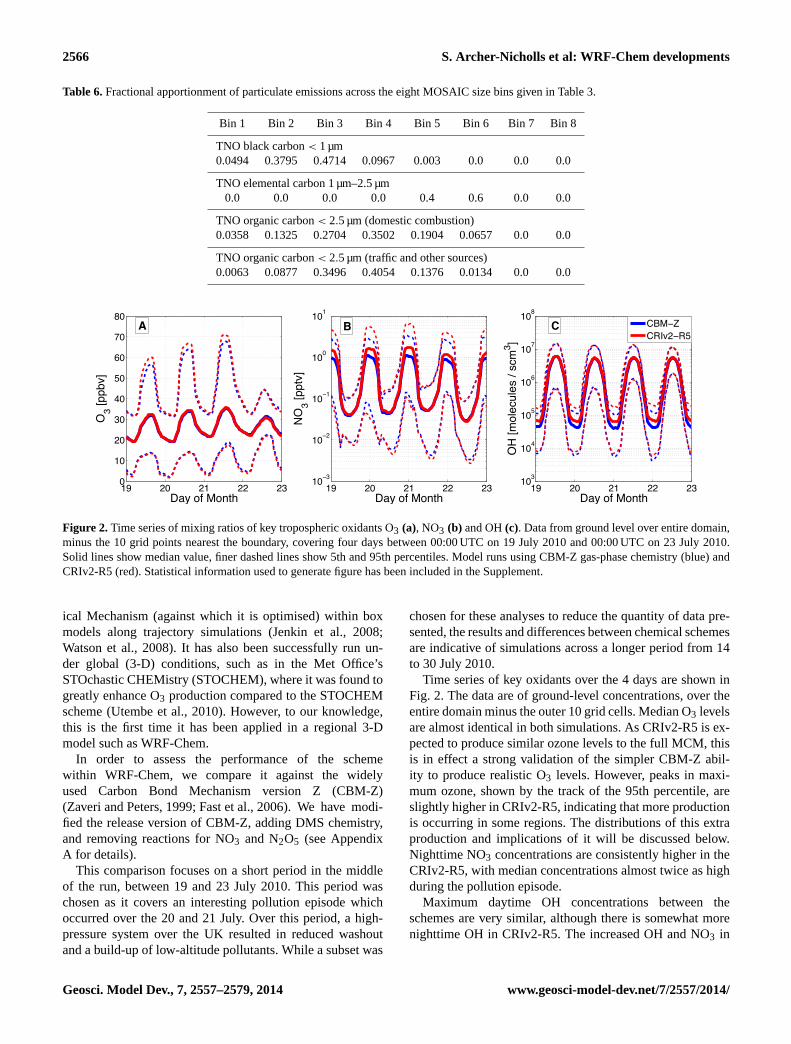
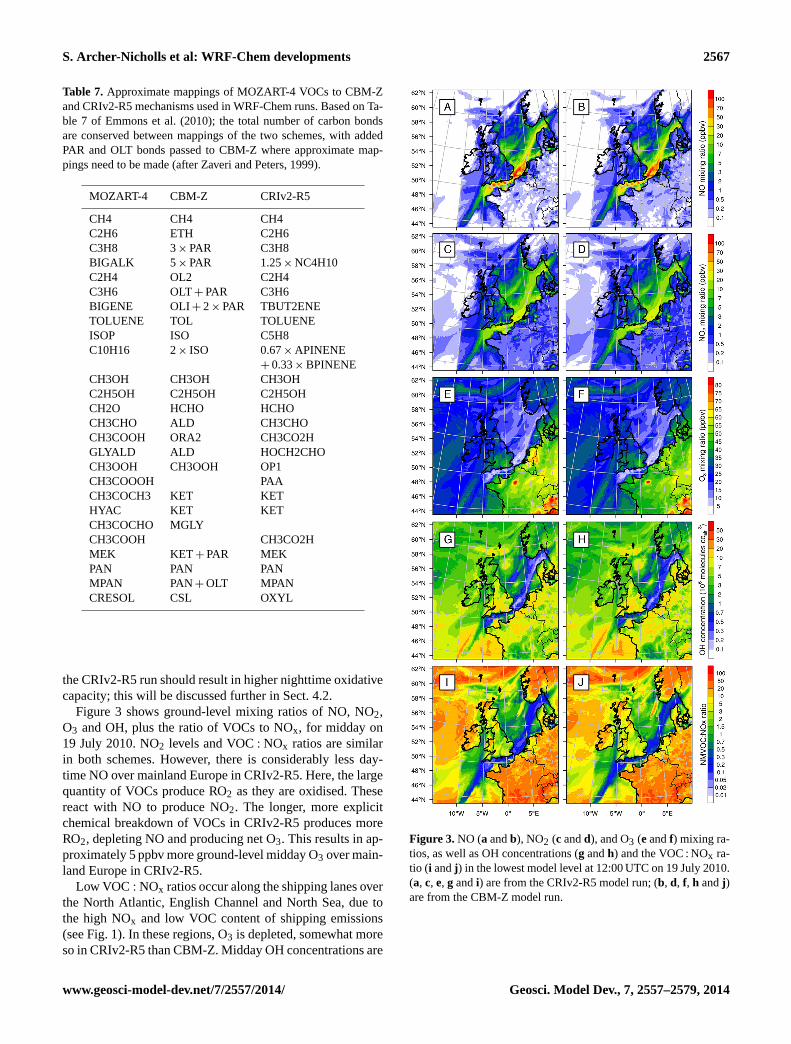
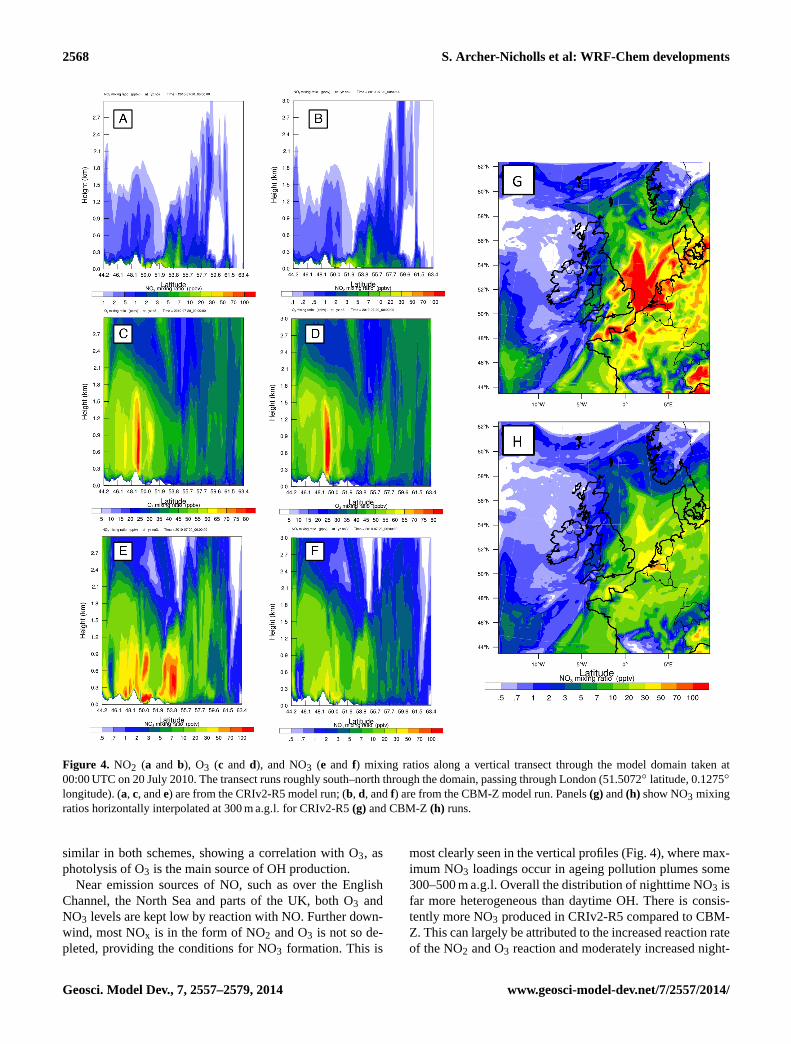
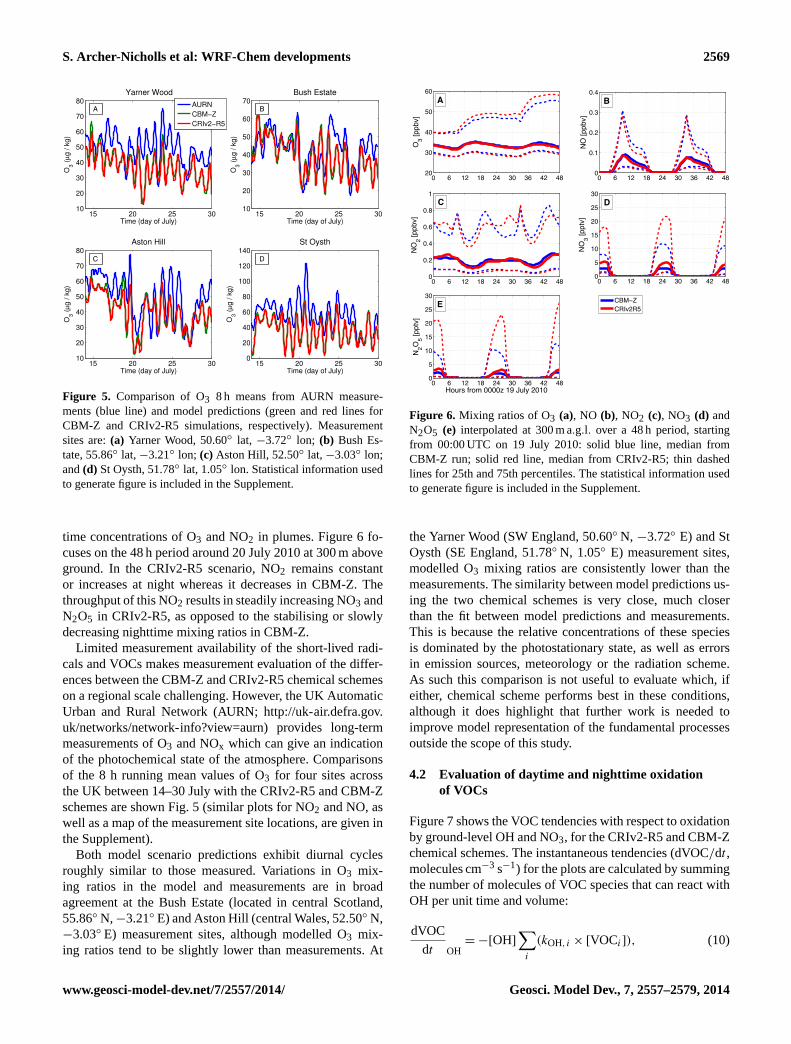
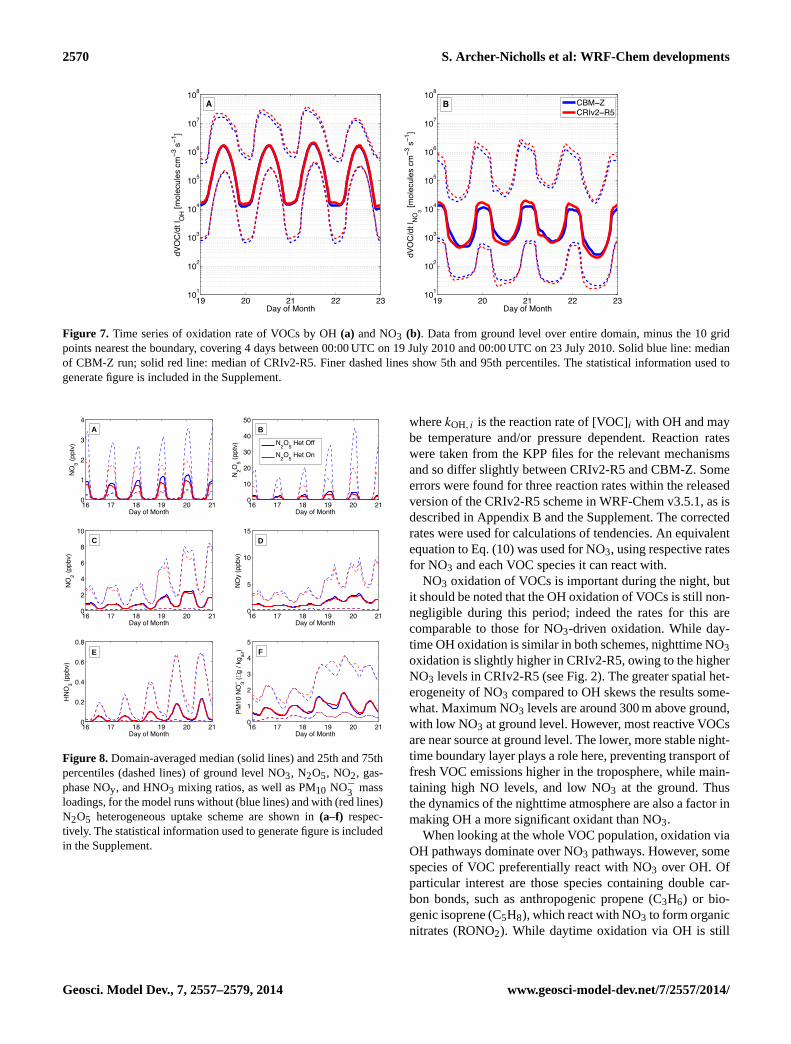
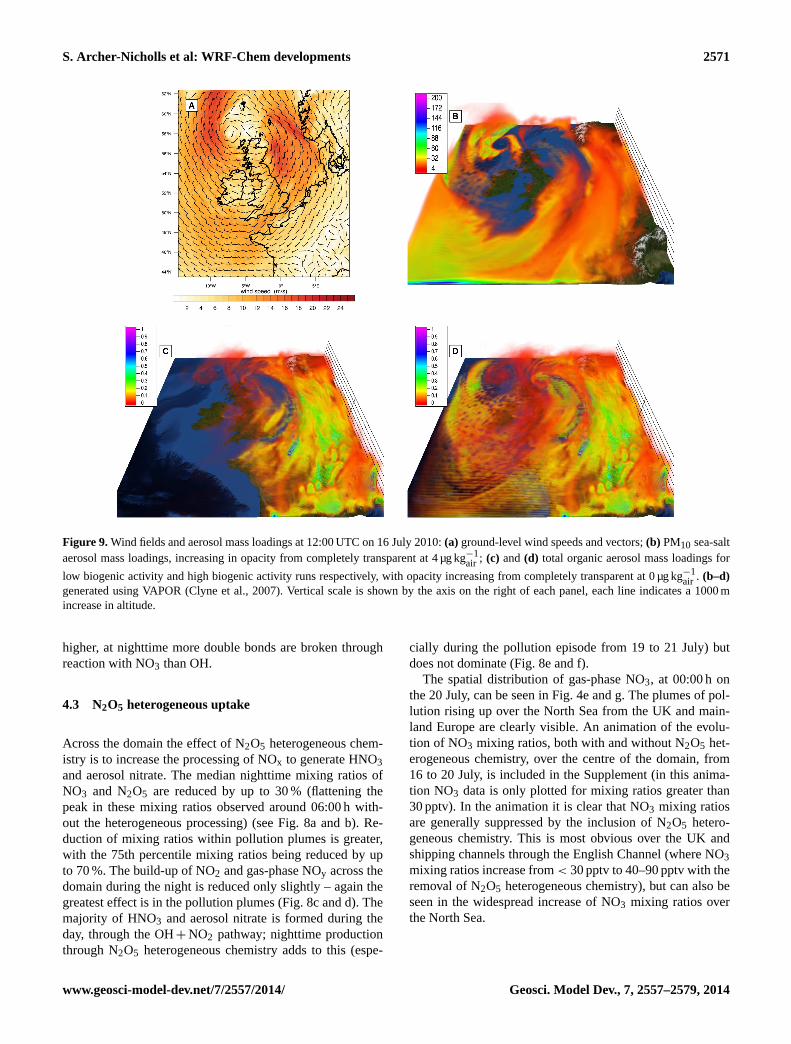
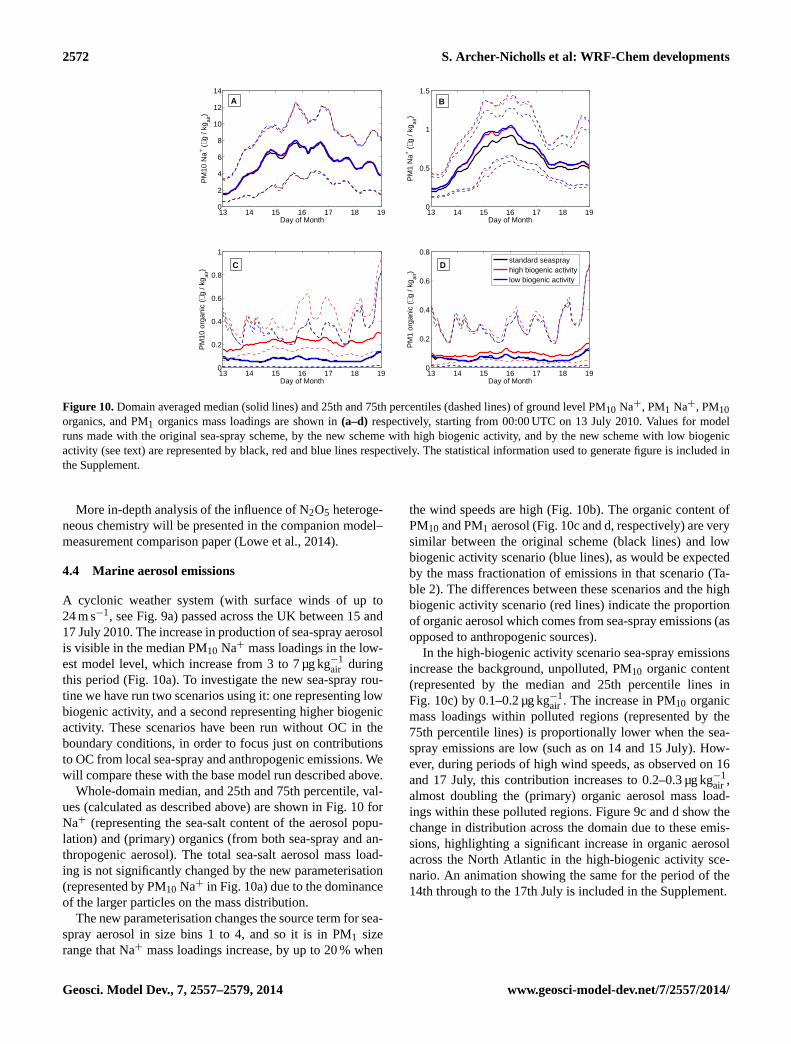