Embed Size (px)
Citation preview
Gas Transport Tariffs and the Dutch Gas Market
The Role of Gas Tariff Structures in Maintaining Desirable Features of the Dutch Gas Market
PREPARED FOR
Gasunie Transport Services B.V.
PREPARED BY
Dan Harris
Ying-Chin Chou
26 September, 2017
Disclaimer
The analyses and market overview provided in this report are necessarily based on
assumptions with respect to conditions or events which may or may not arise or occur in the
future. While we believe these assumptions to be reasonable for purposes of preparing our
analysis, they are dependent upon future events that are not within our control or the control
of any other person. Actual future outcomes can and will differ, perhaps materially, from
those evaluated in these projections. No one can give any assurance that the assumptions and
methodologies used will prove to be correct or that the projections will match actual results.
Indeed, the purpose of our analysis is not to anticipate actual events but to provide a
projection of how various market conditions tend to interact and as a result, what is a possible
expectation across a wide range of possibilities. We do not make any representation with
respect to the likelihood of any specific future outcome.
While the analyses presented may assist readers in rendering informed decisions, it is not
meant to be a substitute for the exercise of their own business judgment. Neither we nor
Brattle will accept any liability under any theory for losses suffered, whether direct or
consequential, arising from the reliance on the analyses presented, and cannot be held
responsible if any conclusions drawn from this presentation should prove to be inaccurate.
The views and opinions expressed in this report are strictly those of the Authors, and do not
necessarily represent the views or opinions of Brattle or any of its other employees.
Copyright © 2017 The Brattle Group Limited
i | brattle.com
Table of Contents I. Introduction and Summary ......................................................................................................... 4
I.A. Desirable Features of the Dutch Market ........................................................................... 5
I.B. Future Changes ................................................................................................................... 6
I.C. Changes and Desirable Market Features ........................................................................... 7
I.C.1. TTF Liquidity ............................................................................................................ 7
I.C.2. Security of Supply and Competition ........................................................................ 8
I.C.3. Transit........................................................................................................................ 8
I.D. Tariff Structures and Desirable Features ........................................................................... 8
II. Desirable Features for the Dutch Gas Market ......................................................................... 11
II.A. Features Specific to the Dutch Market ........................................................................... 11
II.A.1. Liquid Trading Hub ....................................................................................... 11
II.A.2. Security of Supply ......................................................................................... 14
II.A.3. A Competitive Gas Market ........................................................................... 16
II.A.4. Transit Flows ................................................................................................. 17
II.B. TAR NC Objectives .......................................................................................................... 18
III. Future Changes to the Dutch Gas Market ............................................................................... 18
III.A. Groningen Gas Production .............................................................................................. 18
III.B. Declines in non-Groningen Dutch Gas Production ....................................................... 20
III.C. Dutch Gas Demand .......................................................................................................... 21
III.C.1. Gas Demand from the Residential and Commercial Sector ........................ 25
III.C.2. Gas Demand from the Power Sector ............................................................ 26
III.D. Changing Import-Export Balance ................................................................................... 27
III.E. Risk of Reduced Transit Flows ........................................................................................ 29
III.F. Gas Storage Use ................................................................................................................ 32
IV. Changes and Desirable Features ............................................................................................... 34
IV.A. Drivers of Hub Liquidity ................................................................................................. 34
IV.A.1. Dutch Specific Factors .................................................................................. 34
IV.A.2. Factors Largely Resulting from EU Legislation ........................................... 36
IV.B. Market Changes and Hub Liquidity ................................................................................ 36
IV.B.1. Multiple Supply Sources ............................................................................... 37
IV.B.2. Availability of Gas Storage for Trading ........................................................ 39
IV.B.3. Reduced Trading from CCGTs ..................................................................... 40
IV.C. Market Changes and Transit............................................................................................ 40
IV.D. Market Changes, Security of Supply and Competition .................................................. 41
IV.D.1. Security of Supply ......................................................................................... 41
ii | brattle.com
IV.D.2. Competition ................................................................................................... 42
V. Tariff Structures and Desirable Features .................................................................................. 43
V.A. Tariff Structures, Imports and Transit ............................................................................ 44
V.B. LNG Imports ..................................................................................................................... 48
V.C. Gas Storage ....................................................................................................................... 51
V.D. Reduced Entry tariffs for Domestic Production ............................................................. 53
Table of Tables
Table 1: Historical Cap on Groningen Field Production ............................................................ 19
Table 2: Mapping of Changes in the Dutch Gas Market to the Liquidity Drivers .................... 37
Table 3: Results of the N-1 Test ................................................................................................... 42
Table of Figures
Figure 1: Development of TTF and NBP Churn Rates................................................................ 12
Figure 2: Development of TTF and NBP Trading Volumes ....................................................... 12
Figure 3: Supply Sources in 2015 in terms of the Geographical Origin of Gas ......................... 14
Figure 4: Consumer Switching Rates per Year ............................................................................ 17
Figure 5: Groningen Gas Production, 2010-2030 ........................................................................ 20
Figure 6: Production from the Small Gas Fields.......................................................................... 21
Figure 7: Four Gas Demand Scenarios – 2017 Network Development Plan ............................. 23
Figure 8: Gas Demand Forecast .................................................................................................... 25
Figure 9: Installed CCGT Capacity in the Netherlands 2010 - 2016 .......................................... 27
Figure 10: Net Export under the NEV 2016 Demand Scenario .................................................. 28
Figure 11: Import Projections ...................................................................................................... 29
Figure 12: Production Forecast – Norwegian Gas ....................................................................... 31
Figure 13: Current Contracted Transit Volumes......................................................................... 32
Figure 14: Groningen Gas – Seasonal Swing ............................................................................... 33
Figure 15: Gasterra’s Forecast Share of Gas Supply ..................................................................... 43
iii | brattle.com
Figure 16: Differences in Hub Prices vs the Regulated Cost of Cross-Border Capacity ........... 45
Figure 17: Entry Tariffs at Gate and Other LNG Terminals – Peakload Use ............................. 49
Figure 18: Entry Tariffs at Gate and Other LNG Terminals – Baseload Use ............................. 49
Figure 19: Gasterra Virtual Storage Bundle Price Compared to Gas Transport Costs .............. 52
13
4 | brattle.com
I. Introduction and Summary 1. The Dutch gas market is currently functioning well. The TTF is the most liquid gas hub
in Europe, there is effective competition and gas supplies are secure. For example, in a
recent report, the Dutch energy regulator (the ACM) noted that:
“physical characteristics and its historical background are important factors that lie behind the current relatively high level of functioning of the Dutch wholesale gas market. The Dutch market benefits from domestic gas production and is well-connected to other cross-border gas sources. In addition, TTF has been able to gain first-mover advantages as the market place on the European continent where market participants can manage their gas portfolio hedging and optimisation with confidence.”1
2. However, over the next 10 years or so a number of changes will take place, which could
disturb the well-functioning of the gas market.
3. Gasunie Transport Services B.V. (GTS) has retained The Brattle Group (Brattle) to
consider how changes in gas transport tariff structures could help mitigate the effect of
future changes to the Dutch gas market. By ‘tariff structures’, we mean the distribution
of the allowed revenue recovery between different entry and exit points in the Dutch
gas transport network.
4. This study takes place in the context of the recent finalization of the network code on
rules regarding harmonised transmission tariff structures for gas (the TAR NC), which
entered into force on 6 April 2017. While we note the objectives of the TAR NC, GTS
has asked us to consider and propose tariff structures without analysing whether they
are consistent with the detailed contents of the TAR NC. The reason is that the TAR NC
includes some flexibility for alternative tariff structures, if these can be justified. GTS
will ensure that any final tariff proposals are consistent with the TAR NC.
5. As part of GTS’s public consultation exercise with market participants regarding future
tariff structures, we prepared this report in two stages. We prepared the first draft
including questions to market participants. The first draft was published on GTS’s
website on the 8th of September 2017, and a workshop was held with the market
participants on the 15th of September 2017. This version of the report reflects comments
and questions from the market participants during the workshop.
1 ACM, Self-evaluation Gas Target Model II Functioning of the wholesale gas market in the Netherlands, ACM/DE/2016/207845, Case number: 16.0168.29, 20 December 2016, p.11.
5 | brattle.com
6. We structure the study as follows:
a) In section II we describe what we consider should be the ‘desirable features’ for the
Dutch gas market. By ‘desirable features’, we mean key features of the Dutch gas
market which we think most participants would agree are desirable and hence worth
keeping;
b) In section III we describe the main changes that are likely to affect the Dutch gas
market over the next 10-years or so;
c) In section IV we analyse how the changes might affect the desirable features;
d) And in section V we describe how GTS could change tariff structures to reduce the risk
of negative effects.
7. We supply details of the calculations underlying the numbers presented in this report in
a spreadsheet (2017_08_31 Tables for GTS Report.xlsb’) which GTS has put on their
website with this report.
I.A. DESIRABLE FEATURES OF THE DUTCH MARKET 8. In our view, the goal should be to maintain the following features of the Dutch gas
market:
• Liquid Trading Hub: The Dutch Title Transfer Facility (TTF) has developed into the most liquid gas trading hub in Europe by several measures. In July 2015, the TTF overtook Great Britain’s National Balancing Point (NBP) for the first time to become the most liquid gas hub in Europe. A liquid hub provides many benefits including price transparency, ease of risk management, and facilitation of competition, all of which contribute to lower costs for end users.
• Security of Supply: As a result of large volumes of indigenous production and strong import connections, the Netherlands enjoys a secure gas supply. Dutch gas supply is robust against major supply disruptions, including significant, ‘N-1’ type supply outages or interruptions of Russia gas.
• Competitive Gas Market: The Dutch gas market is relatively competitive at both the retail and wholesale levels. The Netherlands scores well on the competition metrics of the Gas Target Model (GTM) at the wholesale level, and the relatively high levels of end user switching between suppliers indicate that competition in the retail market is effective.
• Transit Flows: Historically, the Dutch gas network has been utilised for transiting gas flows from producing countries, such as Norway and Russia, to major Western European gas markets including the UK, Belgium, and France. Transit flows provide
6 | brattle.com
several benefits to the Dutch gas market, such as lowering gas costs to Dutch consumers, and contributing to hub liquidity.
9. All of the above features are consistent with both the Third Package and more recent
initiatives such as the EU Gas Target Model.
10. In addition to the features specific to the Dutch gas market, we also consider the TAR
NC objectives of contributing to market integration and promoting interconnections
between gas networks.
I.B. FUTURE CHANGES 11. While the Dutch gas market is currently operating effectively, it faces the following
challenges in the future:
• Decrease in Groningen gas production: to reduce the risk of earthquakes associated with gas production, the Groningen field's production has, since 2014, been capped at below its full potential. As a result, Groningen gas production has fallen from 42.5 bcm in 2014 to 24 bcm in 2016, and is expected to reduce to 21.6 bcm from October 2017.
• Declines in non-Groningen production: non-Groningen gas production, from so-called ‘small fields’, peaked in around 2000 at 50 bcm. Since then, this production has been in decline. In 2016, the small fields produced around 20 bcm, and their production is expected to decrease to around 6 bcm/year by 2030.
• Declines in Dutch gas demand: As with other EU Member States, decarbonisation and increased energy efficiency is expected to reduce Dutch gas demand. The degree to which this will happen is uncertain, but all of GTS’s future demand scenarios assume a decline in gas demand relative to 2016. GTS forecast gas demand will drop from 36 bcm in 2016 to between 30.5 bcm and 35.5 bcm by 2035.
– One reason for the decline in future demand is that the installed capacity of Combined Cycle Gas Turbine (CCGT) generators is forecast to decline by 1.3 GW between 2016 and 2030.
• Changing import-export balance: As a result of declining domestic production, under the GTS ‘base case’ demand scenario the Netherlands will become a net importer by 2026. However, the move to becoming a net importer will probably not require significant additional physical imports. While domestic Dutch gas production is declining, this is approximately matched by decreases in demand and export contracts.
• Possible decline in transit flows: The long-term contracts that underlie many of the current transit flows will are expected to expire by 2029. Transit flows could decline if new short term contracts do not fully replace the long-term contract volumes.
7 | brattle.com
• Increase in Gas Storage Use: As a result of declining Groningen production, it seems likely that the use of gas storage to meet peak demand may increase. The need to keep gas in storage to meet peak demand may reduce the use of fast-cycling storage for trading, which could reduce trading volumes and liquidity on the TTF.
I.C. CHANGES AND DESIRABLE MARKET FEATURES
I.C.1. TTF Liquidity 12. To analyse if the market changes could negatively affect hub liquidity, we first
document the main drivers of, or reasons for, liquidity. We differentiate between
drivers specific to the Dutch market, and drivers which result from EU legislation. For
each driver, we consider the effect of all of the changes listed above in a ‘mapping’
exercise.
13. ‘Multiple supply sources’ is one important driver of liquidity. While the number of
supply sources will not be reduced, imports, demand and gas production will all reduce.
For example, if transit contracts are not renewed, imports and gas production falls from
87.3 bcm in 2016 to 39.3 bcm in 2030. This fall in volume could diminish the
Netherlands’ role as a gas ‘roundabout’ and reduce the need for gas trading, reducing
liquidity.
14. If all types of gas storage facilities s are used to meet physical peak demands, fast-cycling
storage may be less available for trading and arbitrage as users keep gas in store to deal
with unexpected supply emergencies or high levels of peak demand. We estimate that
reduced storage-related trading could decrease TTF volumes by about 3%. As well as
contributing to liquidity directly by their role in arbitrage, storage facilities also provide
support for liquidity by providing a back-up supply, thereby ensuring that the required
firmness of deliveries can be guaranteed.
15. Reductions in the output from CCGTs could also have a negative effect on trading
volumes, since CCGTs balance their gas positions by trading on the TTF, and have gas
supply contracts linked to TTF prices, which they hedge by trading forward TTF
products. Hence, a reduction in CCGT capacity and power sector gas demand could
result in lower trading volumes. Mitigating this effect, the CCGTs that remain
operational will likely have a more variable gas demand, because they will be providing
back-up for intermittent renewable energy sources including wind and solar. This could
result in increased volumes of trading at TTF. CCGT demand relative to TTF traded
volumes is in any case relatively small.
16. We note that the ‘virtuous circle’ of liquidity building that led to TTF becoming the
most liquid hub in Europe can also turn onto a ‘vicious circle’ of decline if liquidity
8 | brattle.com
starts to fall below a certain level. Traders could be attracted to other, more liquid hubs,
leading to further declines in liquidity. However, the risk of liquidity at TTF falling to a
level where a vicious circle of decline results should not be exaggerated, given TTF’s
structural advantages relative to NBP – such as trading in Euros and location on the
continent – and that even a much less liquid TTF would still be much more liquid than
the second most liquid continental hub, NCG.
I.C.2. Security of Supply and Competition 17. While the market changes discussed above will reduce the margin between supply and
demand, there seems to be no threat to security of supply. We carry out an ‘N-1’ test for
2030, and measure the available gas supply relative to peak demand in the event that
the largest single source of gas supply – the Grijpskerk storage facility– failed. The
margin between gas supply and demand in the N-1 scenario is actually larger than in
2014. The reason is that declines in gas demand and increase in import capacity more
than offset the decrease in domestic Dutch gas production.
18. Similarly, the tightening supply-demand balance seems unlikely to have adverse effects
for competition. As Dutch domestic production declines, the incumbent’s share of the
wholesale market tends to decrease over time relative to third-party imports. The
wholesale market is likely to become less concentrated, and more competitive.
19. At the retail level, we do not see any reason why the market changes identified would
reduce competition directly. However, if TTF liquidity were to reduce, for the reasons
given above, then this could negatively affect market entry and hence competition in
the retail sector.
I.C.3. Transit 20. While transit volumes are to certain extent independent of events in the Dutch gas
market, reducing TTF liquidity could make it less desirable to transit gas across the
Netherlands. This is because shippers prefer to transit across a liquid hub, which
facilitates unexpected changes in supply or demand, and provides short-term arbitrage
opportunities. Second, decreases in domestic Dutch gas production could mean that
more of the network revenue must be recovered from border points. This would make
Dutch transit more expensive and hence could have a negative effect on transit
volumes.
I.D. TARIFF STRUCTURES AND DESIRABLE FEATURES 21. The Netherlands is forecast to become a net importer sometime in the early 2020s. This
should not be a problem for TTF liquidity and market functioning more generally, as
long as a reliable and diverse set of imports replace domestic production. Accordingly, a
9 | brattle.com
natural focus for future tariff structures should be on facilitating the smooth transition
from the Netherlands being a net exporter to a net importer.
22. To attract imports and maintain transit flows, TTF prices will need to increase relative
to other hubs so as to recover the cost of importing gas from other countries. If imports
are the marginal, or price setting, source of gas then the increase in prices needed to
recover cross-border transport cost will affect not only the price of imported gas but of
all gas in the Netherlands. Hence one possibility for mitigating the price effects on
consumers of the Netherlands becoming an importer would be to reduce cross-border
transportation costs.
23. For example, in the most extreme case would be for GTS to set the border entry tariffs
to zero. Setting Dutch entry tariffs to zero would decrease domestic gas costs by about
€38 million per year, relative to a scenario with unchanged import costs. GTS would
also need to recover the missing revenue, and some of the cost would come from exit
points which domestic consumers would pay for. GTS estimate that exit costs would
need to increase by around €11 million to offset the revenue that it was previously
obtaining from the import points. Therefore, in the scenario where imports were the
marginal source of gas, Dutch consumers would be better off if GTS reduced import
tariffs, as they would save €38 million on gas costs and only pay an additional €11
million in gas transport costs.
24. We conclude that, while Dutch import costs are already relatively low, further
reductions are likely to be beneficial to consumers as the Netherlands moves to
becoming a net importer of gas. Conversely, increases in import tariffs should be
resisted. The current level of import tariffs resulting in a 35/65 revenue split between
entry and exit seems appropriate to maintaining the desirable features of the Dutch gas
market. It is also possible that the German border exit tariffs increase further as a result
of the TAR NC. To the extent possible, it would be desirable to mitigate this effect by
avoiding tariff increases for Dutch import charges. This would be consistent with the
desire to promote transit flows and maintain TTF liquidity.
25. A second option would be to adjust entry charges for LNG imports. LNG could become
an increasingly important part of the supply mix, particularly as a back-up source of gas
in future. GTS could reduce the cost of system entry at the Gate LNG terminal, either
via a straightforward reduction, or by auctioning entry capacity with a zero reserve
price. Logically, participants in the auction would bid for entry capacity until the
netback was just less than the netback for an alternative destination, such as the UK.
The TAR NC already allows for transmission system operators (TSOs) to discount entry
tariffs for LNG facilities so as to enhance security of supply. As well as enhancing
10 | brattle.com
security of supply, if LNG is the marginal source of gas, reducing entry tariffs could also
lower the costs of all Dutch gas. GTS could also reduce the monthly factors for the Gate
LNG terminal entry point to encourage short-term LNG imports.
26. However, we recognise that reducing monthly factors for LNG terminals would in
effect be a form of subsidy. While this seems justified in the case of LNG – because of
the specific characteristics of LNG imports and the benefits to security of supply and
competition – it does not seem justified for other network users. For example, reducing
monthly factors for pipeline imports would make it cheaper to import flexibility from
outside of the Netherlands. However, it is generally more efficient to import at a higher
load factor, and then use storage nearer the final customer to provide flexibility. Using
Dutch storages to provide flexibility for imports would also assist with TTF liquidity
support and security of supply.
27. We noted that gas storage facilities could become more heavily used for meeting peak
demand and for providing flexibility, and so be less available for trading. However, the
commercial value of gas storage – being the value obtainable from temporal arbitrage –
is still relatively low, compared to the cost of the entry and exit charges from and to gas
storage facilities. To encourage the construction of further storage facilities, which
could help with security of supply and support trading and liquidity, GTS could
consider lowering entry and exit tariffs for gas storage facilities. We note that The TAR
NC allows for a 50% discount for entry and exit tariffs to and from gas storage facilities.
28. One objective could be to set entry and exit tariffs for storage to a level whereby the
remaining operating profit for the storage operator is at least sufficient to cover fixed
and variable operating costs, plus the cost of keeping the cushion gas in the ground.
This would reduce the chance that storage operators want to decommission existing gas
storages.
29. Finally, GTS could mitigate the decline in domestic Dutch gas production by reducing
entry tariffs for small fields. Reducing entry tariffs could potentially prolong the life of
existing fields by reducing their costs, prolonging the period for which they are
economically viable. Lower entry tariffs could also help make viable undeveloped fields
that were previously uneconomic. This could increase security of supply and make
more gas available for trading on TTF, thereby providing support for liquidity.
11 | brattle.com
II. Desirable Features for the Dutch Gas Market 30. In this section we describe the features that we consider desirable for the Dutch gas
market. Below we differentiate between features specific to the Dutch market, and the
desirable features of the Dutch market which result from the TAR NC, which applies
across the EU.
II.A. FEATURES SPECIFIC TO THE DUTCH MARKET
II.A.1. Liquid Trading Hub 31. ‘Liquidity’ can be measured and defined in various ways, but in essence when we
discuss a ‘liquid’ hub we mean a hub where relatively large volumes of gas can be traded
quickly without significant movements in the price, where there are a large number of
participants, and where prices are reliable and robust against attempts at manipulation.
Liquidity can also vary by time horizon – some hubs have relatively liquid day-ahead
and ‘prompt’ markets, but may be less liquid in forward product markets.
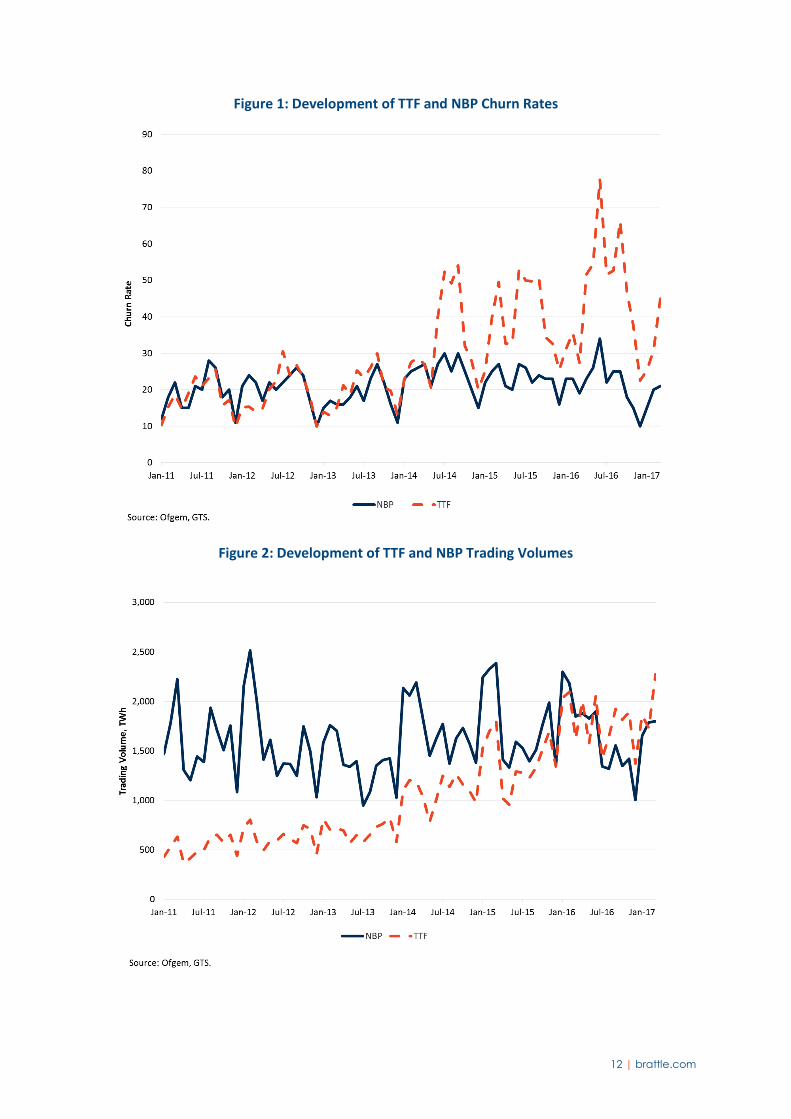
32. The Dutch Title Transfer Facility (TTF) has developed into the most liquid gas trading
hub in Europe by several measures. In July 2015, Platts reported that the volumes
traded at TTF exceeded those traded at Great Britain’s National Balancing point (NBP)
for the first time and the TTF became the most liquid gas hub in Europe.2 Figure 1 and
Figure 2 illustrate how churn rates and trading volumes have developed over time.3
2 Platts, TTF natural gas traded volume overtakes NBP for first time in July, 18 August 2015,
https://www.platts.com/latest-news/natural-gas/london/ttf-natural-gas-traded-volume-overtakes-nbp-for-26181334.
3 Churn is a common measure of overall market liquidity, and refers to the ratio of traded volumes to physically delivered volumes. In essence, churn refers to the numbers of times a gas molecule is traded before it is delivered.
12 | brattle.com
Figure 1: Development of TTF and NBP Churn Rates
Figure 2: Development of TTF and NBP Trading Volumes
13 | brattle.com
33. A liquid hub provides many benefits to consumers, producers, and gas marketers
including:
a) Price Transparency: TTF prices indicate the current value of gas for different points in
time. This allows gas to change hands at an ‘efficient’ price, being a price which
reflects the value of gas relative to other resources. This means that gas is used
efficiently.4 In addition, a wide range of gas contracts can include references to TTF
prices in pricing formulae.
b) Risk Management: Gas users and marketers can use TTF forward products to hedge
their exposure to future gas prices. This allows market participants to allocate risk
efficiently. A liquid hub also enables producers to manage and balance their portfolios
more easily, which reduces the risk faced by producers as the market condition shifts.
c) Efficient Investment: Forward prices can lead to more efficient investments, as
investors can more easily evaluate the economics of projects. This, in turn, helps
reduce the risk of supply shortages and enhance the security of supply.
d) Gas Market Competition: A liquid hub makes it easier for new marketers to enter the
gas market.New entrants can easily source gas at TTF with which they can supply
their customersand existing gas suppliers can easily buy or sell incremental volumes of
gas as they win or lose customers in the market. Both these possibilities lead to greater
competition to supply customers. A liquid hub makes it difficult for players to
manipulate the market.
34. All of the benefits above contribute to lowering costs to end customers.5 The EU’s Gas
Target Model (GTM) has as its goal the creation of hubs similar to the TTF around
Europe, so that other countries can enjoy similar benefits to the Netherlands.6
35. For all these reasons maintaining TTF liquidity is a key desirable feature.
4 For example, if decisions as to whether to generate electricity or not are made on the basis of TTF
prices, this will result in the most efficient allocation of resources. So when gas is relatively valuable, coal-fired plants will generate and the gas can be put to use in activities which the market values more.
5 Baringa, The Benefits of TTF Liquidity, 25 September 2015, pp. 23-25.
6 Agency for the Cooperation of Energy Regulators (ACER), European Gas Target Model Review and Update, January 2015, pp. 21-22.
14 | brattle.com
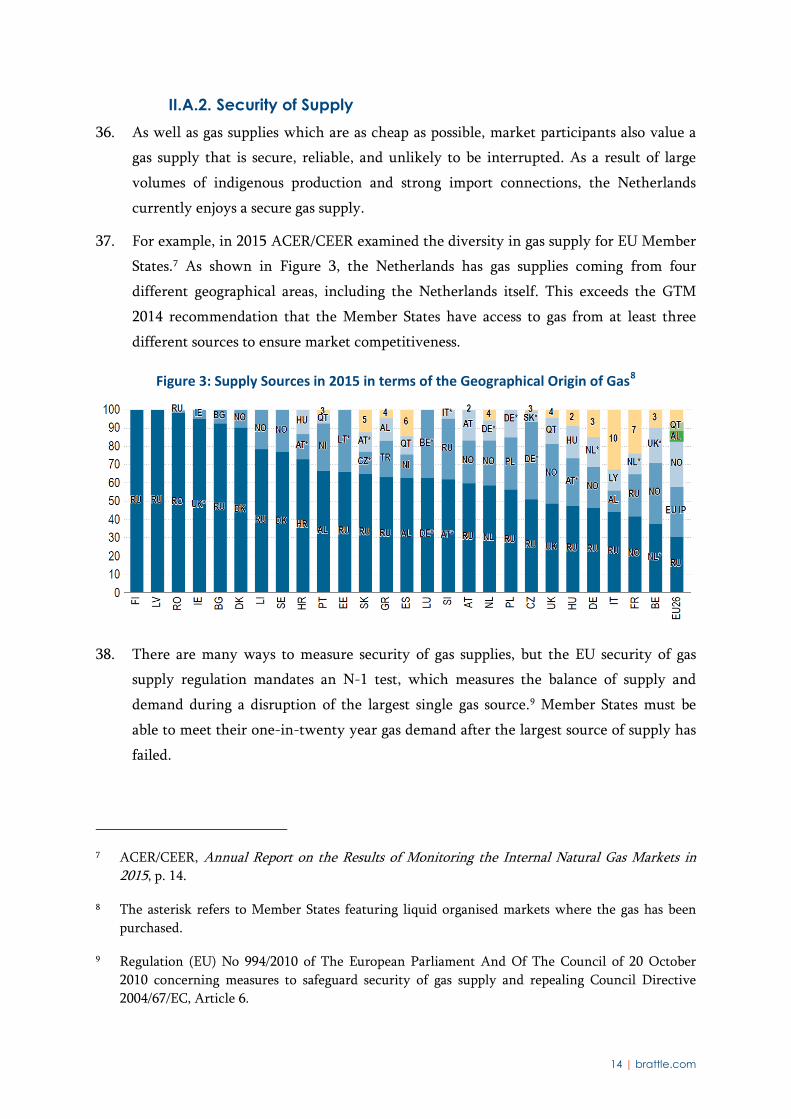
II.A.2. Security of Supply 36. As well as gas supplies which are as cheap as possible, market participants also value a
gas supply that is secure, reliable, and unlikely to be interrupted. As a result of large
volumes of indigenous production and strong import connections, the Netherlands
currently enjoys a secure gas supply.
37. For example, in 2015 ACER/CEER examined the diversity in gas supply for EU Member
States.7 As shown in Figure 3, the Netherlands has gas supplies coming from four
different geographical areas, including the Netherlands itself. This exceeds the GTM
2014 recommendation that the Member States have access to gas from at least three
different sources to ensure market competitiveness.
Figure 3: Supply Sources in 2015 in terms of the Geographical Origin of Gas8
38. There are many ways to measure security of gas supplies, but the EU security of gas
supply regulation mandates an N-1 test, which measures the balance of supply and
demand during a disruption of the largest single gas source.9 Member States must be
able to meet their one-in-twenty year gas demand after the largest source of supply has
failed.
7 ACER/CEER, Annual Report on the Results of Monitoring the Internal Natural Gas Markets in
2015, p. 14.
8 The asterisk refers to Member States featuring liquid organised markets where the gas has been purchased.
9 Regulation (EU) No 994/2010 of The European Parliament And Of The Council of 20 October 2010 concerning measures to safeguard security of gas supply and repealing Council Directive 2004/67/EC, Article 6.
15 | brattle.com
39. For the Netherlands, the Grijpskerk storage in the Netherlands is the largest source of
supply (64 mcm/d). A 2014 GTS study concluded that excluding Grijpskerk, the
remaining capacity can still serve 162% of the domestic demand – a very large margin
of security.10
40. The 2014 GTS Report also quantifies the level of security in supplying protected
customers under three scenarios: a) a 7-day high demand period due to extreme
temperatures such as occur only once every 20 years; b) a 30-day high demand period,
again with demand set according to a one in every 20 years criterion; and c) a 30-days
disruption from the largest single gas infrastructure. The results show that the
Netherlands can easily supply its protected customers under all three scenarios.11
41. The 2014 GTS Report also considers assessments carried out by ENTSOG. ENTSOG
modelled the consequence of a potential disruption of Russian flows by Ukraine or by
Russia under four different demand patterns.12 A disruption from Ukraine would have
no impact on the Netherlands under all demand patterns considered. A disruption from
Russia would have no impact on the Netherlands under average demand scenarios even
though the disruption lasts for the entire 2014/2015 winter or across seasons from June
2014 to March 2015. However, if a disruption from Russia occurs on a peak day in
January or during a cold spell in March, a maximum 20% of the total demand would
need to be interrupted. The relative low impact of such a disruption is explained by the
Netherlands’ relatively low reliance on Russian gas, and good connectivity with
neighbouring countries.
42. In the 2012 Ten Year Network Development Plan, ENTSOG also assessed whether
there was enough capacity at the border points to offset various infrastructure
disruptions and the assessment shows that the Netherlands has a sufficiently robust
infrastructure.13 From these risk assessments GTS concludes that there is currently a
10 Gasunie Transport Services, Risk Assessment, 10 June 2014, Section 5, “Infrastructure Standard”.
11 Ibid., pp. 28-29.
12 Ibid., pp. 39-41.
13 Ibid., pp. 42-44.
16 | brattle.com
negligible risk for a disruption of the gas supply in the Netherlands.14 Maintaining this
high level of supply security should be a key desirable feature.
II.A.3. A Competitive Gas Market 43. The Dutch gas market is relatively competitive at both the retail and wholesale levels.
For example, the ACM recently conducted an evaluation of the Dutch wholesale market
against the GTM metrics.15 The ACM concluded that the volumes on offer for trading
on the buy and sell side (the ‘order books’) met the GTM targets for all gas products.
The bid-offer spread and the order book price sensitivity usually fell within the range
deemed acceptable for the GTM.16,17
44. The Dutch gas market demonstrates a well-diversified supply structure with more than
three supply sources. While the market concentration for the wholesale market exceeds
the GTM threshold, for the trading market it is below the falls threshold.18
45. The ACM concluded that:
“[i]n general, the metrics’ results show that the Dutch wholesale gas market is functioning well, with a sufficient level of liquidity. ACM concludes that based on the revised GTM II metrics and keeping in mind the data limitations, TTF still appears to meet the market participants’ needs which indicates that products and liquidity are available which makes it possible for market participants to effectively manage their wholesale market risks. Moreover,
14 Gasunie Transport Services, Preventive Action Plan The Netherlands, 09 January 2015, Section
2.1, “Measures to be Taken”.
15 ACM, Consultation paper: Self-evaluation Gas Target Model II, Functioning of the wholesale gas market in the Netherlands, 27 October 2016.
16 Although one of the studies suggests that the spreads on DA and MA prices are too high for the review period November 2015-April 2016. The GTM thresholds for the bid-ask spreads are 0.4% of bid price for DA and 0.2% of bid price for MA. The MMR 2015 study shows that the spread can sometimes be as high as 0.75% for DA products traded and 0.5% for DA products.
17 One of the studies shows that the sensitivity for the DA and MA products might be outside the range. The GTM thresholds for the order book sensitivity are 0.02% of price distance between average price for 120 MW and the best bid on each bid- and offer-side for DA products. WECOM study shows that sometimes the price sensitivity can be up to 0.025%. The threshold for the MA products is 0.1%. The WECOM study shows that sometimes the price sensitivity can be up to 0.16%.
18 op. cit., p. 11.
17 | brattle.com
evaluation of the market health metrics indicates that the Dutch wholesale market is competitive [and] resilient”19
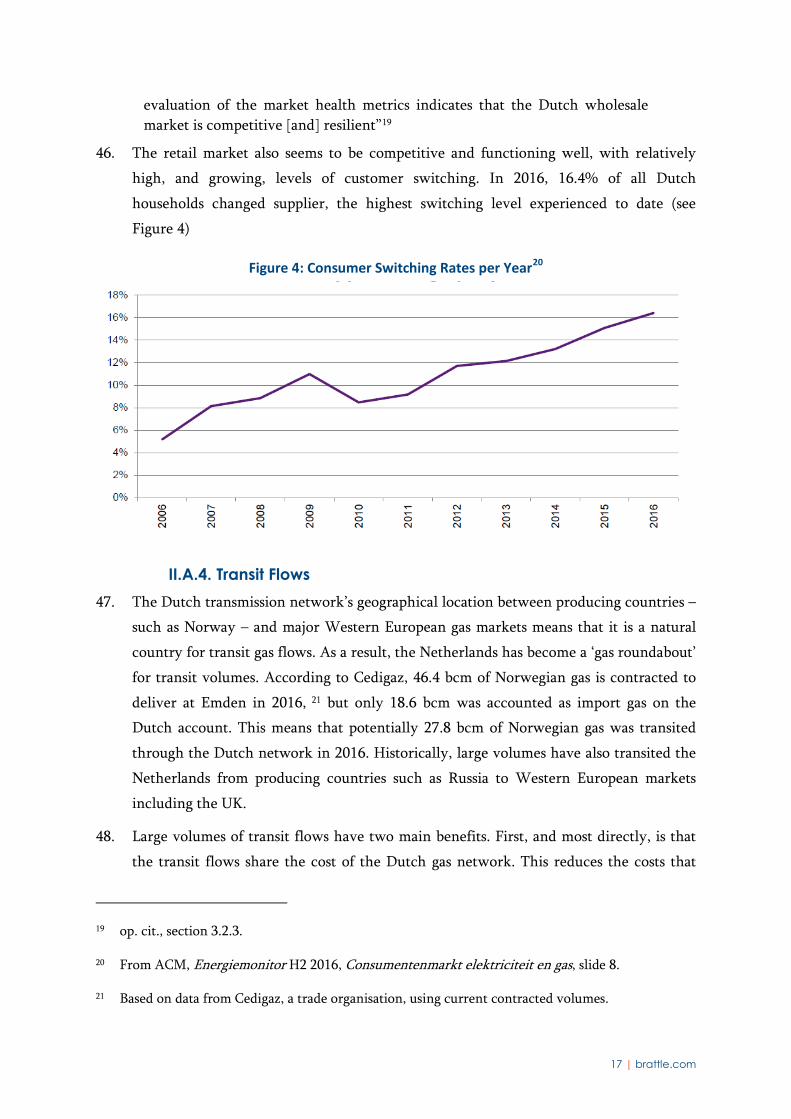
46. The retail market also seems to be competitive and functioning well, with relatively
high, and growing, levels of customer switching. In 2016, 16.4% of all Dutch
households changed supplier, the highest switching level experienced to date (see
Figure 4)
Figure 4: Consumer Switching Rates per Year20
II.A.4. Transit Flows 47. The Dutch transmission network’s geographical location between producing countries –
such as Norway – and major Western European gas markets means that it is a natural
country for transit gas flows. As a result, the Netherlands has become a ‘gas roundabout’
for transit volumes. According to Cedigaz, 46.4 bcm of Norwegian gas is contracted to
deliver at Emden in 2016, 21 but only 18.6 bcm was accounted as import gas on the
Dutch account. This means that potentially 27.8 bcm of Norwegian gas was transited
through the Dutch network in 2016. Historically, large volumes have also transited the
Netherlands from producing countries such as Russia to Western European markets
including the UK.
48. Large volumes of transit flows have two main benefits. First, and most directly, is that
the transit flows share the cost of the Dutch gas network. This reduces the costs that
19 op. cit., section 3.2.3.
20 From ACM, Energiemonitor H2 2016, Consumentenmarkt elektriciteit en gas, slide 8.
21 Based on data from Cedigaz, a trade organisation, using current contracted volumes.
18 | brattle.com
need to be recovered from Dutch consumers.22 Second, transit flows increase the
potential supply of gas that can be traded at the TTF, and therefore enhances the hub
liquidity. Transit flows may also increase the utilisation of other elements of gas
infrastructure in the Netherlands, such as gas storage. Accordingly, maintaining transit
flows is a desirable feature of the Dutch gas market.
II.B. TAR NC OBJECTIVES 49. In addition to the features specific for the Dutch market, we also consider the TAR NC
objectives. General objectives of the TAR NC include:23
a. Contributing to Market Integration: The TAR NC aims to avoid barriers to
cross border trade and transit by, for example, preventing a TSO from loading
costs onto a cross-border exit point in a way that does not reflect underlying
costs.
b. Ensuring Security of Supply: The TAR NC proposes the granting of discounted
charges for connection points to and from a storage facility, an LNG facility, or
infrastructures which reduce the isolation of Member States in respect of their
gas transmission system.
c. Promoting the Interconnection between Gas Networks: The TAR NC aims to
promote investment in cross-border interconnectors by, for example, ensuring
that recovery of cross-border investments will take place in a cost reflective
way that promotes system use.
III. Future Changes to the Dutch Gas Market 50. In this section we outline the key changes that the Dutch gas market faces in the next
10 years, and which might disturb the desirable features set out in the previous section.
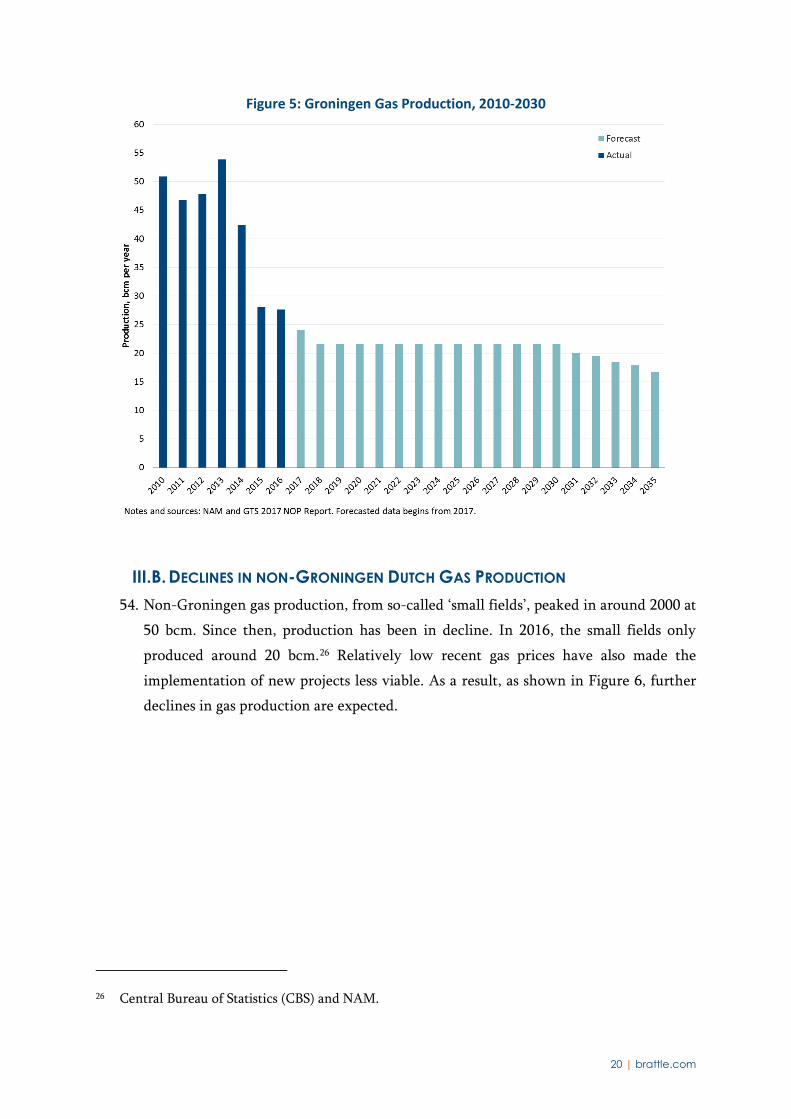
III.A. GRONINGEN GAS PRODUCTION 51. Gas produced from the Groningen field has been the foundation of the Dutch gas
market since the early 1960s. Production from the Groningen field has declined over
22 While GTS has made investments to accomodate transit flows, thereby increasing costs, transit flows
also share parts of the network used by Dutch consumers, and so the overall effect of transit flows is a reduction in costs for Dutch consumers.
23 COMMISSION REGULATION (EU) 2017/460 of 16 March 2017, establishing a network code on harmonised transmission tariff structures for gas.
19 | brattle.com
time, as the reservoir pressure decreases, though investments in compression have
mitigated the decline.
52. However, recently a series of earthquakes in the Groningen region have been linked to
gas production from the partially depleted field. To reduce the risk of more earthquakes,
the Dutch government has imposed a production cap on the Groningen field, which is
significantly lower than the field’s production potential. The government has lowered
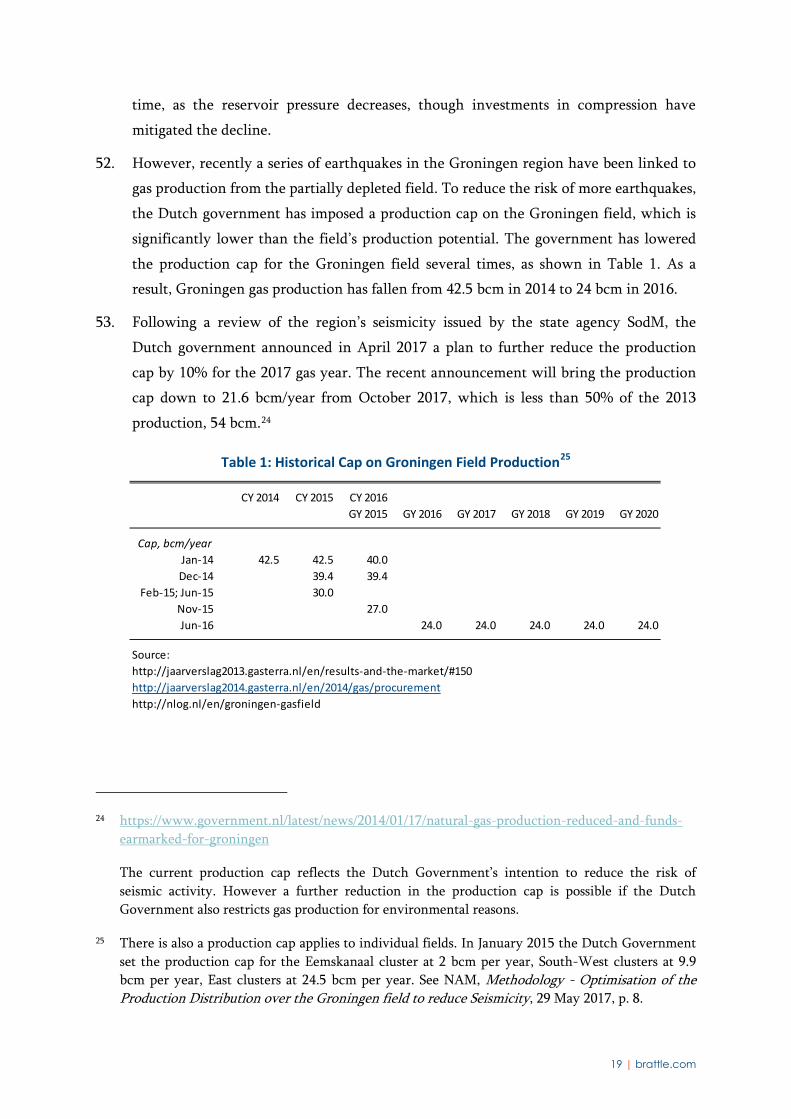
the production cap for the Groningen field several times, as shown in Table 1. As a
result, Groningen gas production has fallen from 42.5 bcm in 2014 to 24 bcm in 2016.
53. Following a review of the region’s seismicity issued by the state agency SodM, the
Dutch government announced in April 2017 a plan to further reduce the production
cap by 10% for the 2017 gas year. The recent announcement will bring the production
cap down to 21.6 bcm/year from October 2017, which is less than 50% of the 2013
production, 54 bcm.24
Table 1: Historical Cap on Groningen Field Production25
24 https://www.government.nl/latest/news/2014/01/17/natural-gas-production-reduced-and-funds-
earmarked-for-groningen
The current production cap reflects the Dutch Government’s intention to reduce the risk of seismic activity. However a further reduction in the production cap is possible if the Dutch Government also restricts gas production for environmental reasons.
25 There is also a production cap applies to individual fields. In January 2015 the Dutch Government set the production cap for the Eemskanaal cluster at 2 bcm per year, South-West clusters at 9.9 bcm per year, East clusters at 24.5 bcm per year. See NAM, Methodology - Optimisation of the Production Distribution over the Groningen field to reduce Seismicity, 29 May 2017, p. 8.
CY 2014 CY 2015 CY 2016GY 2015 GY 2016 GY 2017 GY 2018 GY 2019 GY 2020
Cap, bcm/yearJan-14 42.5 42.5 40.0Dec-14 39.4 39.4
Feb-15; Jun-15 30.0Nov-15 27.0Jun-16 24.0 24.0 24.0 24.0 24.0
Source: http://jaarverslag2013.gasterra.nl/en/results-and-the-market/#150http://jaarverslag2014.gasterra.nl/en/2014/gas/procurementhttp://nlog.nl/en/groningen-gasfield
20 | brattle.com
Figure 5: Groningen Gas Production, 2010-2030
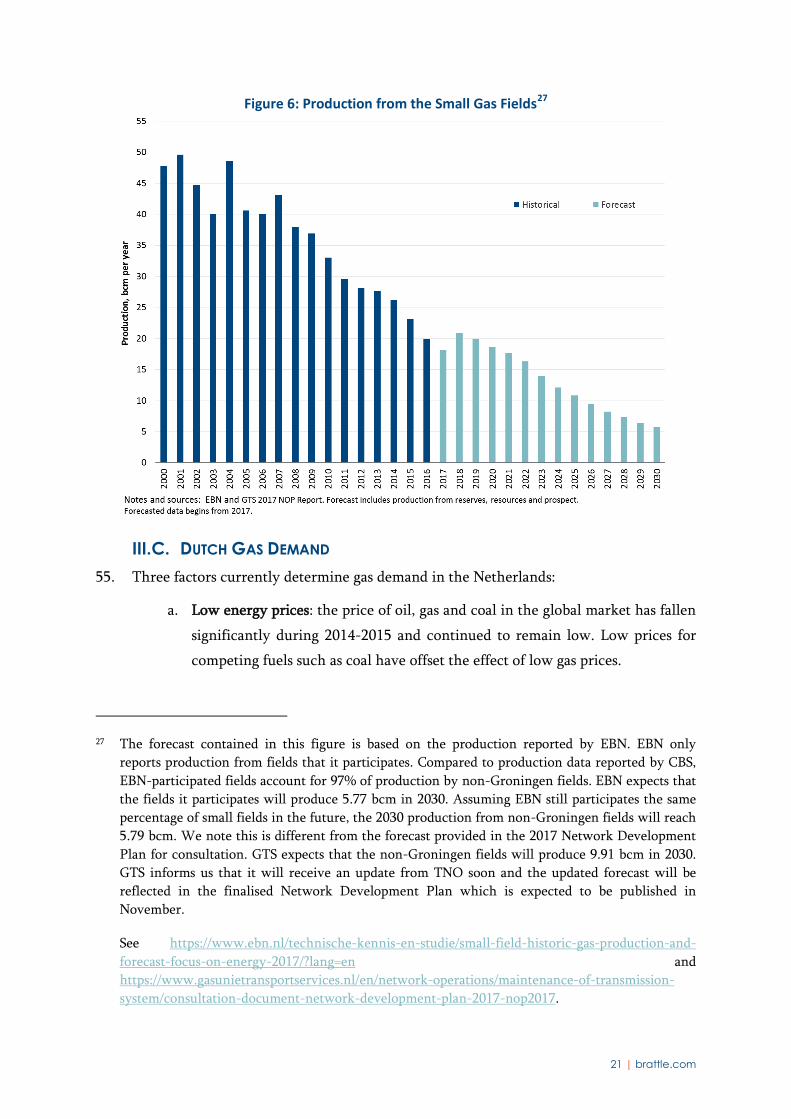
III.B. DECLINES IN NON-GRONINGEN DUTCH GAS PRODUCTION 54. Non-Groningen gas production, from so-called ‘small fields’, peaked in around 2000 at
50 bcm. Since then, production has been in decline. In 2016, the small fields only
produced around 20 bcm.26 Relatively low recent gas prices have also made the
implementation of new projects less viable. As a result, as shown in Figure 6, further
declines in gas production are expected.
26 Central Bureau of Statistics (CBS) and NAM.
21 | brattle.com
Figure 6: Production from the Small Gas Fields27
III.C. DUTCH GAS DEMAND 55. Three factors currently determine gas demand in the Netherlands:
a. Low energy prices: the price of oil, gas and coal in the global market has fallen
significantly during 2014-2015 and continued to remain low. Low prices for
competing fuels such as coal have offset the effect of low gas prices.
27 The forecast contained in this figure is based on the production reported by EBN. EBN only
reports production from fields that it participates. Compared to production data reported by CBS, EBN-participated fields account for 97% of production by non-Groningen fields. EBN expects that the fields it participates will produce 5.77 bcm in 2030. Assuming EBN still participates the same percentage of small fields in the future, the 2030 production from non-Groningen fields will reach 5.79 bcm. We note this is different from the forecast provided in the 2017 Network Development Plan for consultation. GTS expects that the non-Groningen fields will produce 9.91 bcm in 2030. GTS informs us that it will receive an update from TNO soon and the updated forecast will be reflected in the finalised Network Development Plan which is expected to be published in November.
See https://www.ebn.nl/technische-kennis-en-studie/small-field-historic-gas-production-and-forecast-focus-on-energy-2017/?lang=en and https://www.gasunietransportservices.nl/en/network-operations/maintenance-of-transmission-system/consultation-document-network-development-plan-2017-nop2017.
22 | brattle.com
b. Decreasing energy demand: The demand for primary energy in the
Netherlands has fallen by 10.5% between 2010 and 2016. In 2014/2015, Dutch
energy demand was at its lowest level since 2000.28 The decline in energy
demand is partly due to subdued economic growth and partly due to initiatives
to decarbonise energy and improve energy efficiency.
c. Rapid growth in the use of renewable energy for electricity production: The
growth in wind farms has been particularly strong: wind farm capacity has
increased from 2,237 MW in 2010 to 4,240 MW in 2016. In particular,
offshore wind capacity increased by 600 MW in 2016 alone.29 Increasing use of
renewable energy reduces the demand for gas-fired powered generation and,
this, as noted above, has been one of the drivers of the reduction in gas
demand.
56. Each year ECN publishes an energy outlook for the Netherlands. The 2016 National
Energy Outlook (“NEV 2016”)30 expects that the price of gas, coal and oil will not reach
2013 levels again until 2030. This is due to excessive supply in the market, stagnating
global demand, and the continuous global effort to decarbonise energy use. The NEV
2016 also expects the Dutch economy to grow more rapidly in the coming years.31
However, the NEV 2016 still projects falling demand for primary energy in the
Netherlands, reflecting the current energy policies.
57. As with the other EU countries, sustainability objectives largely drive Dutch energy
policies. Accordingly, the main future uncertainty for demand lies around the
effectiveness with which this policy is implemented and whether the ambitious target
levels of decarbonisation can be achieved, both in Netherlands and in its neighbouring
countries. To reflect this uncertainty, GTS has created four gas demand scenarios for its
2017 network development plan (“NDP 2017”).32 The four scenarios all project a decline
in gas demand, but the extent of the decline varies according to t the level of energy
28 Central Bureau of Statistics, accessed 11 August 2017. The 2014/15 winter was particularly mild.
29 Central Bureau of Statistics, accessed 11 August 2017.
30 ECN, National Energy Outlook 2016 (Nationale Energieverkenning 2016).
31 Ibid., p. 6. CBS projected a 2% annual growth in GDP between 2016 and 2020, compared to the average GDP growth between 2010 and 2015 at 0.5%.
32 GTS, Network Development Plan 2017, 27 July 2017, pp. 10-15.
23 | brattle.com
efficiency and the degree of transition to sustainable (non-hydrocarbon) energy that is
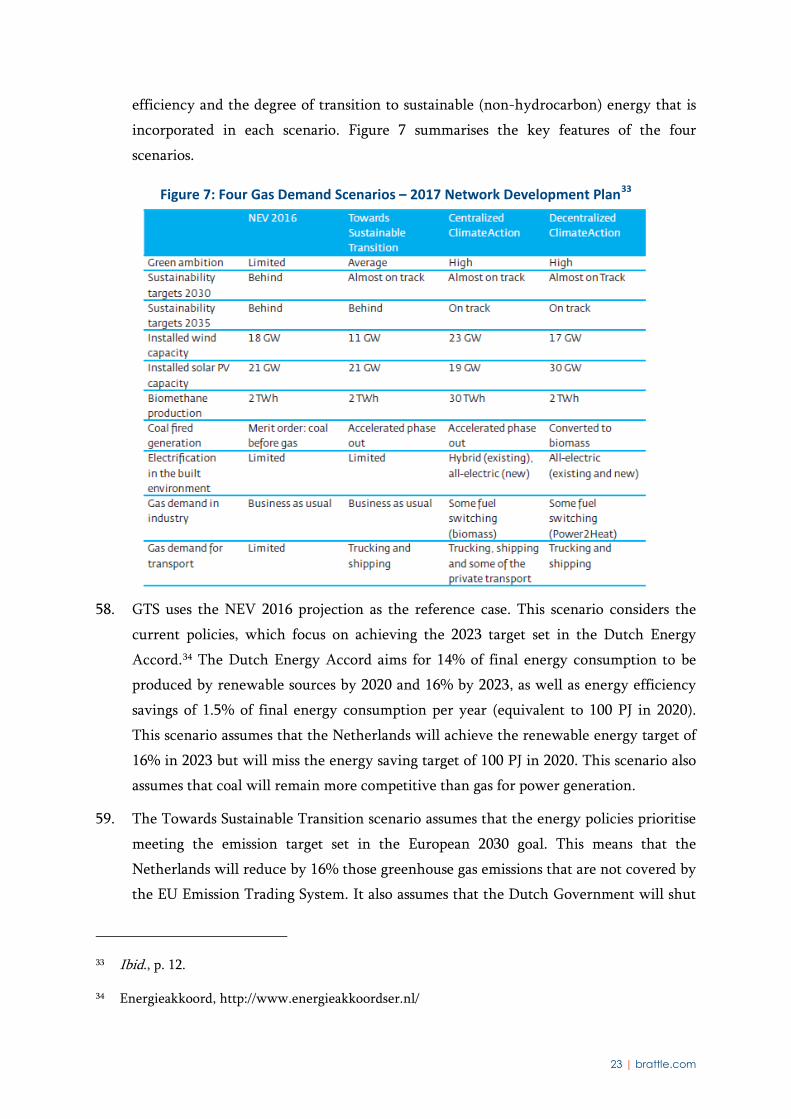
incorporated in each scenario. Figure 7 summarises the key features of the four
scenarios.
Figure 7: Four Gas Demand Scenarios – 2017 Network Development Plan33
58. GTS uses the NEV 2016 projection as the reference case. This scenario considers the
current policies, which focus on achieving the 2023 target set in the Dutch Energy
Accord.34 The Dutch Energy Accord aims for 14% of final energy consumption to be
produced by renewable sources by 2020 and 16% by 2023, as well as energy efficiency
savings of 1.5% of final energy consumption per year (equivalent to 100 PJ in 2020).
This scenario assumes that the Netherlands will achieve the renewable energy target of
16% in 2023 but will miss the energy saving target of 100 PJ in 2020. This scenario also
assumes that coal will remain more competitive than gas for power generation.
59. The Towards Sustainable Transition scenario assumes that the energy policies prioritise
meeting the emission target set in the European 2030 goal. This means that the
Netherlands will reduce by 16% those greenhouse gas emissions that are not covered by
the EU Emission Trading System. It also assumes that the Dutch Government will shut
33 Ibid., p. 12.
34 Energieakkoord, http://www.energieakkoordser.nl/
24 | brattle.com
down all the coal-fired power stations by 2025, leading to an increase in gas-fired power
generation. This scenario also assumes that the price of gas is relatively low compared to
the price of coal, leading to gas-fired generation substituting for coal-fired generation
even before the coal-fired stations are all closed. Due to attractive gas prices, the
transport sector also increases its use of LNG in lieu of fuel oil and diesel. The total gas
demand is therefore higher in this scenario than in the NEV 2016 scenario.
60. Both the Centralised Climate Action and Decentralised Climate Action scenarios
assume that the energy policies will focus on achieving the European 2050 goal, in
addition to the 2030 goal. These two scenarios assume that the carbon prices are high so
the ETS becomes an effective tool for reducing emissions in the industrial and power
sectors, in addition to the regulatory efforts to phase out coal-fuelled power plants or
convert coal-fired power stations to biomass.35 There is also assumed to be a coordinated
European effort to encourage investment in renewable power generation. This leads to a
continuous decline in their investment costs, which encourages further investments in
the sector. These two scenarios therefore see a significant increase in renewable energy
in the power sector, including green gas.36 Industrial users will reduce emissions
through using biomass in the higher temperature processes or carbon capture and
storage (CCS). Energy policies also encourage electrification in the residential sector,
and the use of electricity and natural gas in transport.
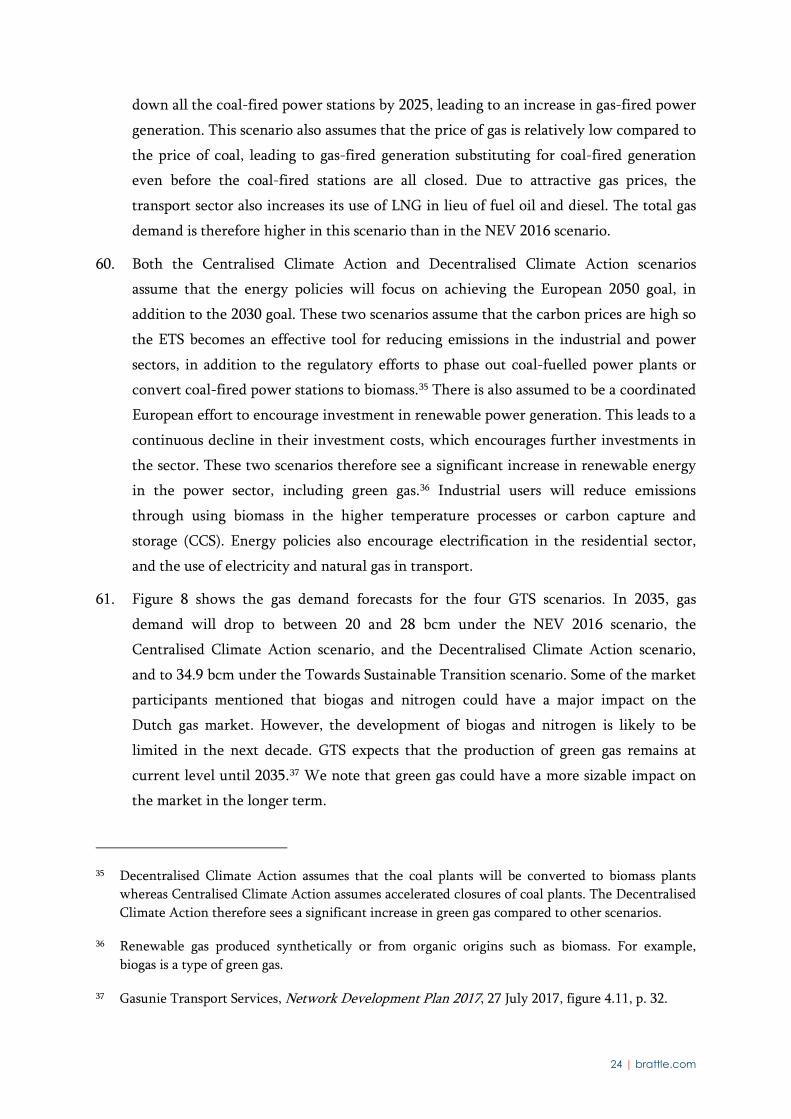
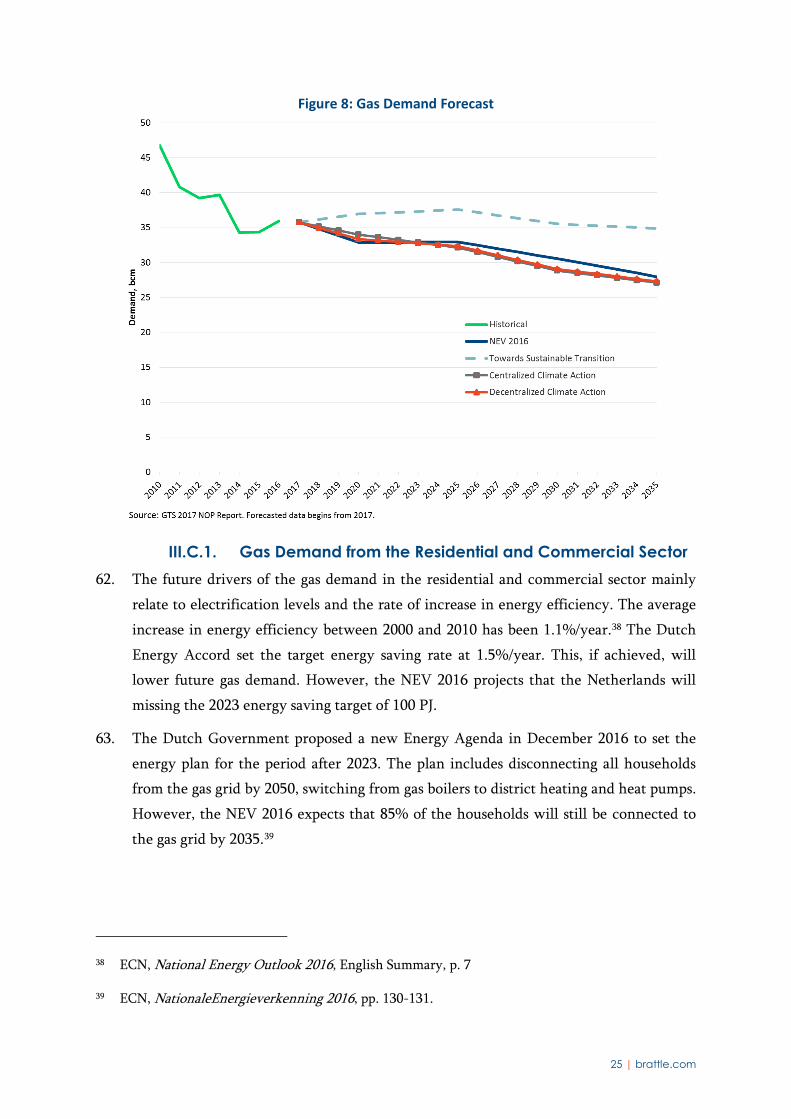
61. Figure 8 shows the gas demand forecasts for the four GTS scenarios. In 2035, gas
demand will drop to between 20 and 28 bcm under the NEV 2016 scenario, the
Centralised Climate Action scenario, and the Decentralised Climate Action scenario,
and to 34.9 bcm under the Towards Sustainable Transition scenario. Some of the market
participants mentioned that biogas and nitrogen could have a major impact on the
Dutch gas market. However, the development of biogas and nitrogen is likely to be
limited in the next decade. GTS expects that the production of green gas remains at
current level until 2035.37 We note that green gas could have a more sizable impact on
the market in the longer term.
35 Decentralised Climate Action assumes that the coal plants will be converted to biomass plants
whereas Centralised Climate Action assumes accelerated closures of coal plants. The Decentralised Climate Action therefore sees a significant increase in green gas compared to other scenarios.
36 Renewable gas produced synthetically or from organic origins such as biomass. For example, biogas is a type of green gas.
37 Gasunie Transport Services, Network Development Plan 2017, 27 July 2017, figure 4.11, p. 32.
25 | brattle.com
Figure 8: Gas Demand Forecast
III.C.1. Gas Demand from the Residential and Commercial Sector 62. The future drivers of the gas demand in the residential and commercial sector mainly
relate to electrification levels and the rate of increase in energy efficiency. The average
increase in energy efficiency between 2000 and 2010 has been 1.1%/year.38 The Dutch
Energy Accord set the target energy saving rate at 1.5%/year. This, if achieved, will
lower future gas demand. However, the NEV 2016 projects that the Netherlands will
missing the 2023 energy saving target of 100 PJ.
63. The Dutch Government proposed a new Energy Agenda in December 2016 to set the
energy plan for the period after 2023. The plan includes disconnecting all households
from the gas grid by 2050, switching from gas boilers to district heating and heat pumps.
However, the NEV 2016 expects that 85% of the households will still be connected to
the gas grid by 2035.39
38 ECN, National Energy Outlook 2016, English Summary, p. 7
39 ECN, NationaleEnergieverkenning 2016, pp. 130-131.
26 | brattle.com
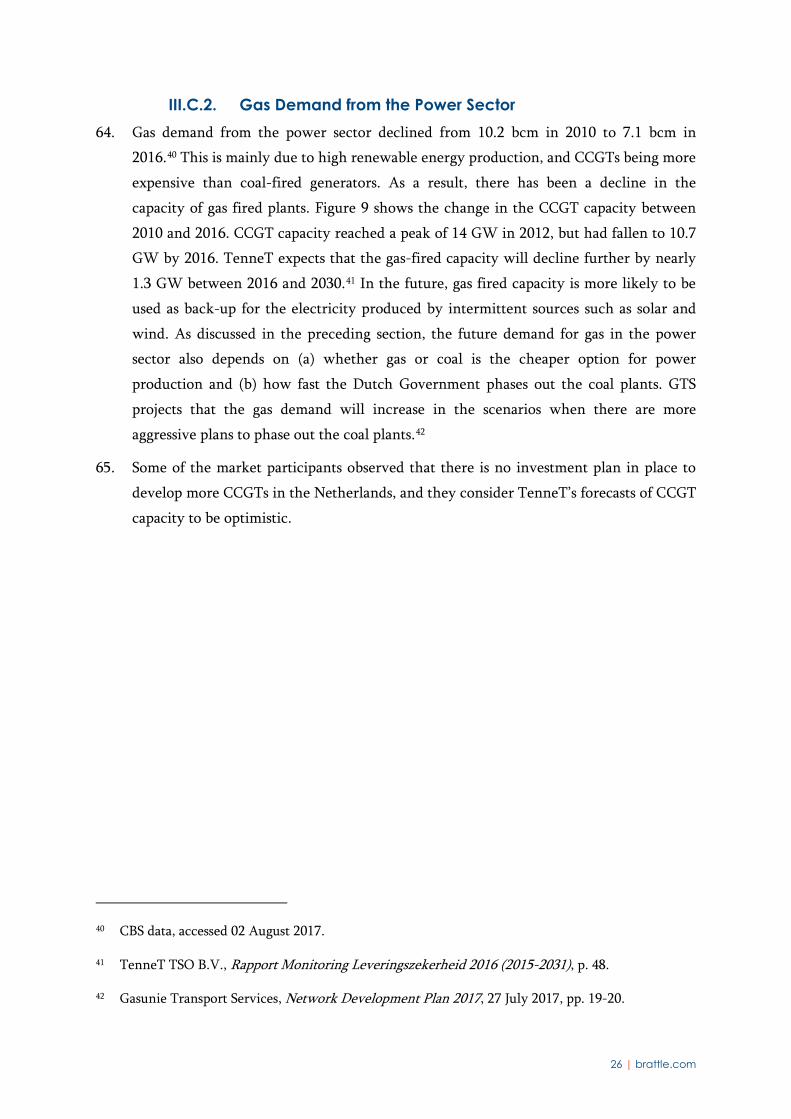
III.C.2. Gas Demand from the Power Sector 64. Gas demand from the power sector declined from 10.2 bcm in 2010 to 7.1 bcm in
2016.40 This is mainly due to high renewable energy production, and CCGTs being more
expensive than coal-fired generators. As a result, there has been a decline in the
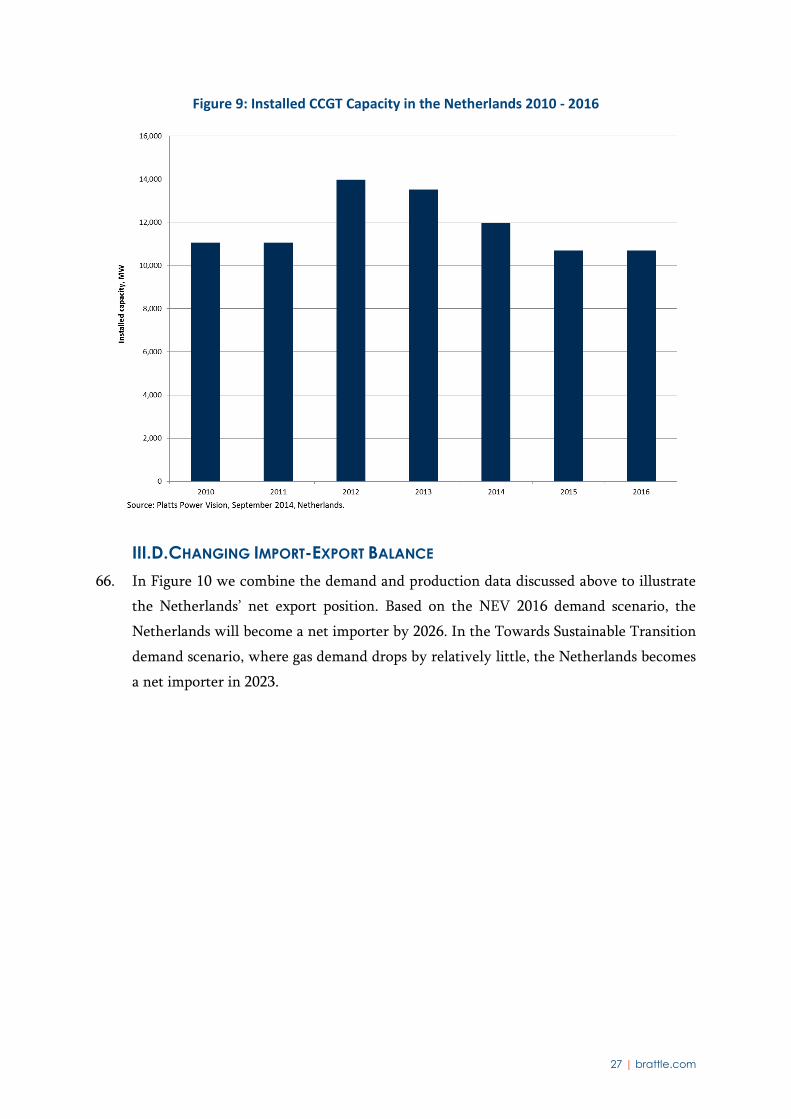
capacity of gas fired plants. Figure 9 shows the change in the CCGT capacity between
2010 and 2016. CCGT capacity reached a peak of 14 GW in 2012, but had fallen to 10.7
GW by 2016. TenneT expects that the gas-fired capacity will decline further by nearly
1.3 GW between 2016 and 2030.41 In the future, gas fired capacity is more likely to be
used as back-up for the electricity produced by intermittent sources such as solar and
wind. As discussed in the preceding section, the future demand for gas in the power
sector also depends on (a) whether gas or coal is the cheaper option for power
production and (b) how fast the Dutch Government phases out the coal plants. GTS
projects that the gas demand will increase in the scenarios when there are more
aggressive plans to phase out the coal plants.42
65. Some of the market participants observed that there is no investment plan in place to
develop more CCGTs in the Netherlands, and they consider TenneT’s forecasts of CCGT
capacity to be optimistic.
40 CBS data, accessed 02 August 2017.
41 TenneT TSO B.V., Rapport Monitoring Leveringszekerheid 2016 (2015-2031), p. 48.
42 Gasunie Transport Services, Network Development Plan 2017, 27 July 2017, pp. 19-20.
27 | brattle.com
Figure 9: Installed CCGT Capacity in the Netherlands 2010 - 2016
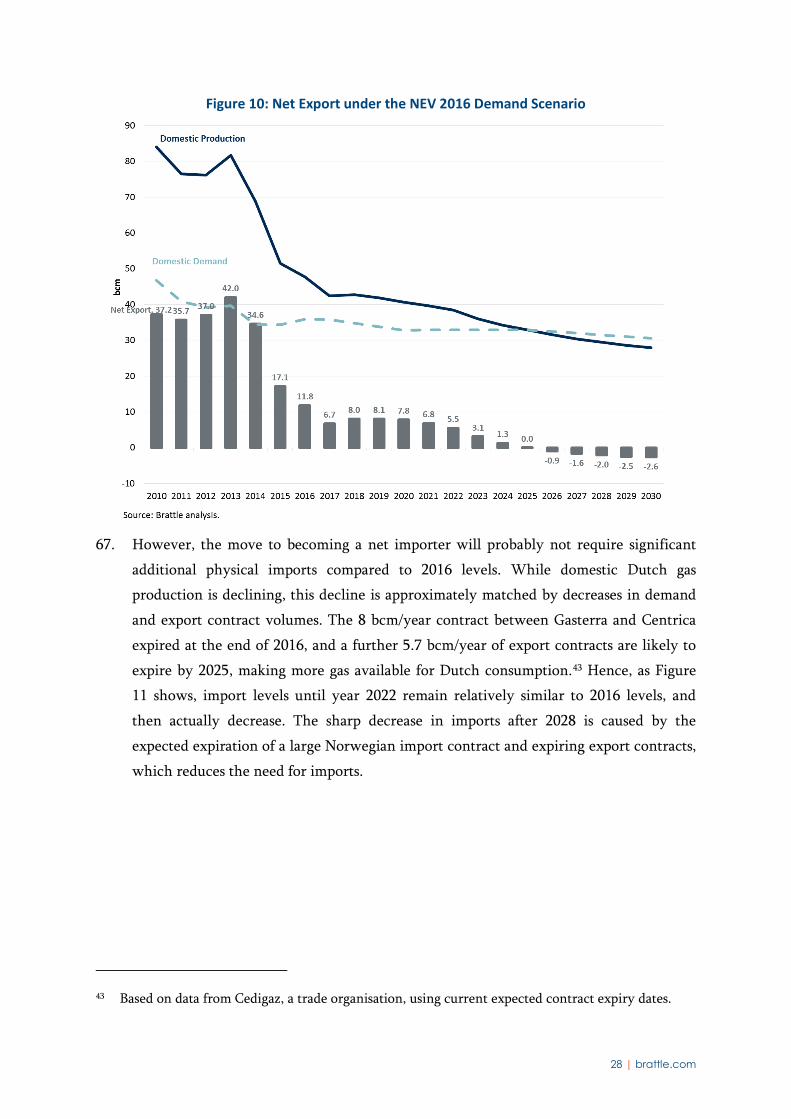
III.D. CHANGING IMPORT-EXPORT BALANCE 66. In Figure 10 we combine the demand and production data discussed above to illustrate
the Netherlands’ net export position. Based on the NEV 2016 demand scenario, the
Netherlands will become a net importer by 2026. In the Towards Sustainable Transition
demand scenario, where gas demand drops by relatively little, the Netherlands becomes
a net importer in 2023.
28 | brattle.com
Figure 10: Net Export under the NEV 2016 Demand Scenario
67. However, the move to becoming a net importer will probably not require significant
additional physical imports compared to 2016 levels. While domestic Dutch gas
production is declining, this decline is approximately matched by decreases in demand
and export contract volumes. The 8 bcm/year contract between Gasterra and Centrica
expired at the end of 2016, and a further 5.7 bcm/year of export contracts are likely to
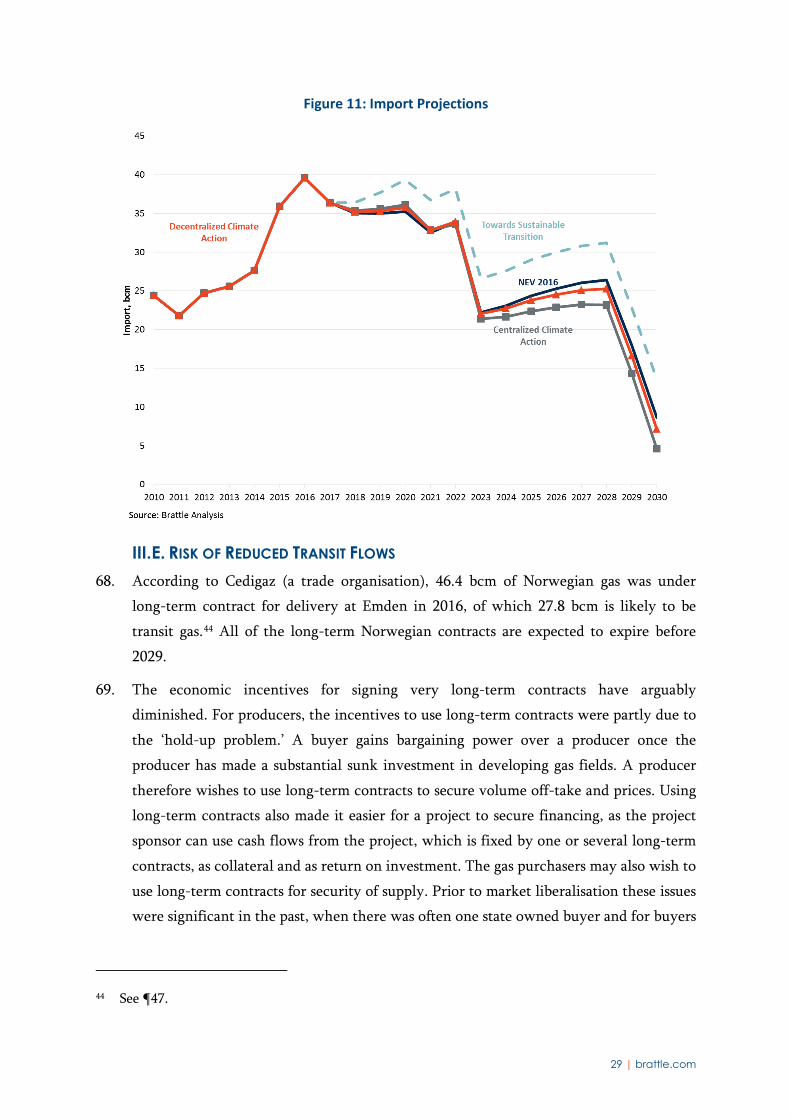
expire by 2025, making more gas available for Dutch consumption.43 Hence, as Figure
11 shows, import levels until year 2022 remain relatively similar to 2016 levels, and
then actually decrease. The sharp decrease in imports after 2028 is caused by the
expected expiration of a large Norwegian import contract and expiring export contracts,
which reduces the need for imports.
43 Based on data from Cedigaz, a trade organisation, using current expected contract expiry dates.
29 | brattle.com
Figure 11: Import Projections
III.E. RISK OF REDUCED TRANSIT FLOWS 68. According to Cedigaz (a trade organisation), 46.4 bcm of Norwegian gas was under
long-term contract for delivery at Emden in 2016, of which 27.8 bcm is likely to be
transit gas.44 All of the long-term Norwegian contracts are expected to expire before
2029.
69. The economic incentives for signing very long-term contracts have arguably
diminished. For producers, the incentives to use long-term contracts were partly due to
the ‘hold-up problem.’ A buyer gains bargaining power over a producer once the
producer has made a substantial sunk investment in developing gas fields. A producer
therefore wishes to use long-term contracts to secure volume off-take and prices. Using
long-term contracts also made it easier for a project to secure financing, as the project
sponsor can use cash flows from the project, which is fixed by one or several long-term
contracts, as collateral and as return on investment. The gas purchasers may also wish to
use long-term contracts for security of supply. Prior to market liberalisation these issues
were significant in the past, when there was often one state owned buyer and for buyers
44 See ¶47.
30 | brattle.com
there were also a limited choices of supply. However, over the past decade, the
movements to liberalise and privatise the gas markets (by introducing third-party
access, unbundling vertically integrated business) have transformed the gas markets
from monopolistic to more competitive.
70. Against the liberalising trend, long-term contracts can be seen as anti-competitive by
preventing new market entrants from procuring gas from the producers. Liquid hubs
enable producers to participate wholesale market directly. Liquid hubs with diversified
sources could replace long-term contracts to provide a security of supply. For these
reasons, existing long-term contracts in their current form are unlikely to be renewed.
71. Regardless of whether long-term contracts will be renewed, arguably the Dutch
network will continue to be used for transit if there is sufficient gas being produced
‘upstream’ off the Netherlands and sufficient demand ‘downstream. For example,
Norwegian gas has relatively limited options in terms of expert routes – either it can
be liquefied into LNG at the Snøhvit LNG terminal, or it can flow by pipe to North
Germany, the Netherlands (via Emden) or to the UK. Hence, continued high levels of
Norwegian gas production would indicate that Norwegian gas will continue to transit
across the Netherlands, even if the long-term contracts expire.
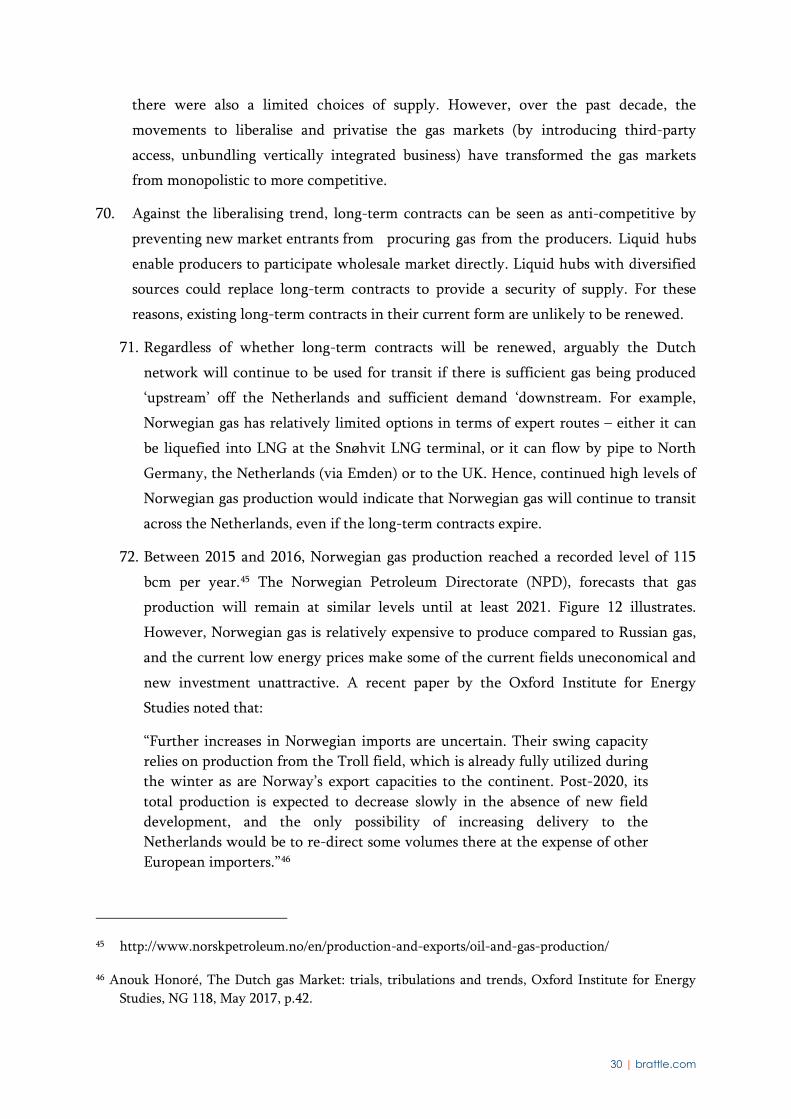
72. Between 2015 and 2016, Norwegian gas production reached a recorded level of 115
bcm per year.45 The Norwegian Petroleum Directorate (NPD), forecasts that gas
production will remain at similar levels until at least 2021. Figure 12 illustrates.
However, Norwegian gas is relatively expensive to produce compared to Russian gas,
and the current low energy prices make some of the current fields uneconomical and
new investment unattractive. A recent paper by the Oxford Institute for Energy
Studies noted that:
“Further increases in Norwegian imports are uncertain. Their swing capacity relies on production from the Troll field, which is already fully utilized during the winter as are Norway’s export capacities to the continent. Post-2020, its total production is expected to decrease slowly in the absence of new field development, and the only possibility of increasing delivery to the Netherlands would be to re-direct some volumes there at the expense of other European importers.”46
45 http://www.norskpetroleum.no/en/production-and-exports/oil-and-gas-production/
46 Anouk Honoré, The Dutch gas Market: trials, tribulations and trends, Oxford Institute for Energy Studies, NG 118, May 2017, p.42.
31 | brattle.com
73. Some market analysts forecast that the Norwegian gas production will fall gradually
and by 2027 produce less than half of the current production level.47
Figure 12: Production Forecast – Norwegian Gas
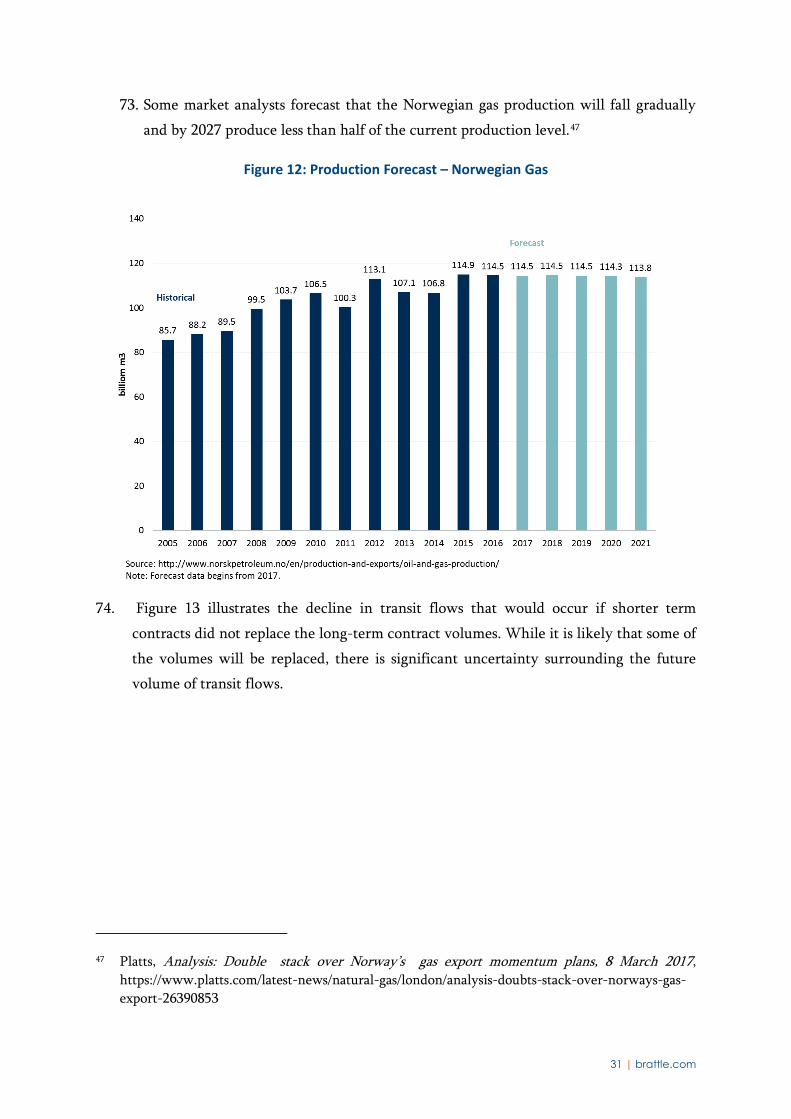
74. Figure 13 illustrates the decline in transit flows that would occur if shorter term
contracts did not replace the long-term contract volumes. While it is likely that some of
the volumes will be replaced, there is significant uncertainty surrounding the future
volume of transit flows.
47 Platts, Analysis: Double stack over Norway’s gas export momentum plans, 8 March 2017,
https://www.platts.com/latest-news/natural-gas/london/analysis-doubts-stack-over-norways-gas-export-26390853
32 | brattle.com
Figure 13: Current Contracted Transit Volumes
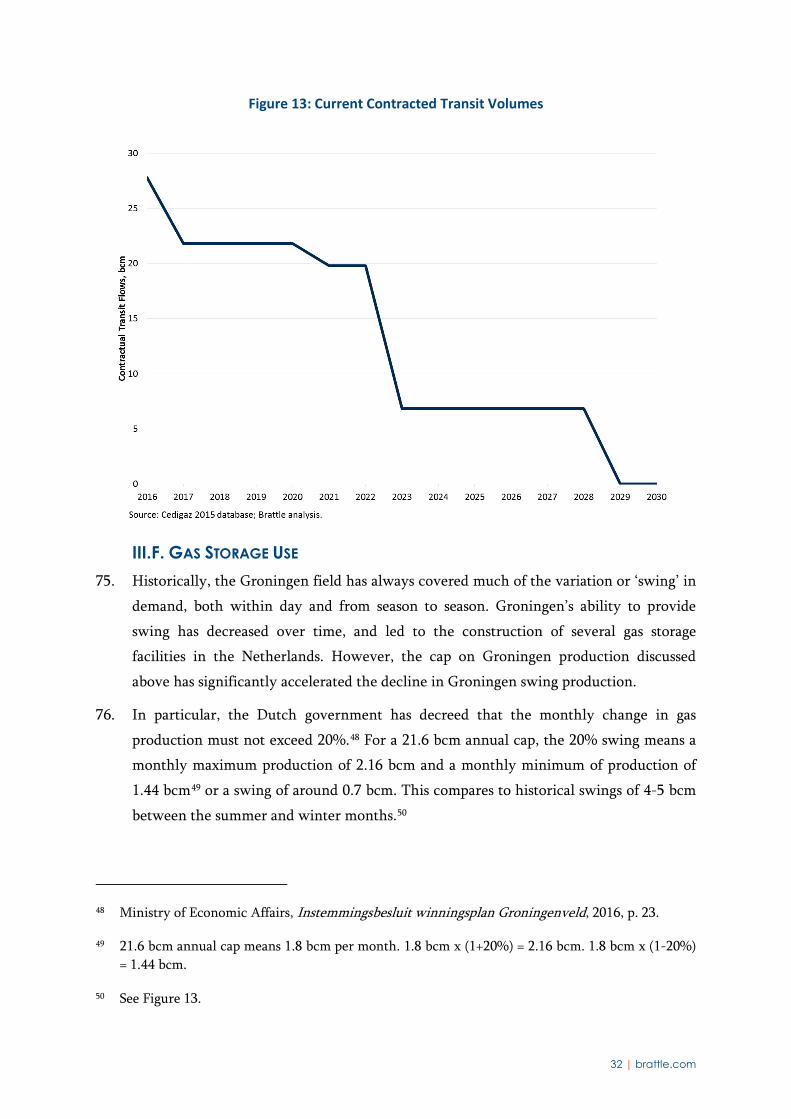
III.F. GAS STORAGE USE 75. Historically, the Groningen field has always covered much of the variation or ‘swing’ in
demand, both within day and from season to season. Groningen’s ability to provide
swing has decreased over time, and led to the construction of several gas storage
facilities in the Netherlands. However, the cap on Groningen production discussed
above has significantly accelerated the decline in Groningen swing production.
76. In particular, the Dutch government has decreed that the monthly change in gas
production must not exceed 20%.48 For a 21.6 bcm annual cap, the 20% swing means a
monthly maximum production of 2.16 bcm and a monthly minimum of production of
1.44 bcm49 or a swing of around 0.7 bcm. This compares to historical swings of 4-5 bcm
between the summer and winter months.50
48 Ministry of Economic Affairs, Instemmingsbesluit winningsplan Groningenveld, 2016, p. 23.
49 21.6 bcm annual cap means 1.8 bcm per month. 1.8 bcm x (1+20%) = 2.16 bcm. 1.8 bcm x (1-20%) = 1.44 bcm.
50 See Figure 13.
33 | brattle.com
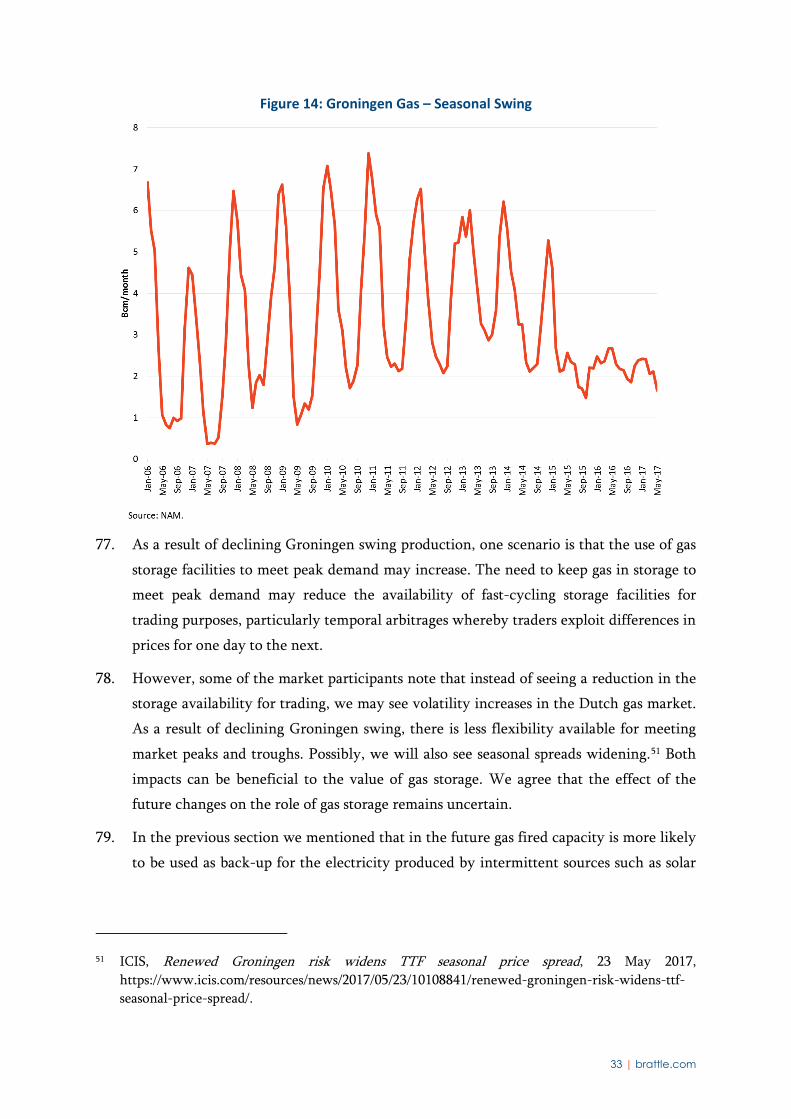
Figure 14: Groningen Gas – Seasonal Swing
77. As a result of declining Groningen swing production, one scenario is that the use of gas
storage facilities to meet peak demand may increase. The need to keep gas in storage to
meet peak demand may reduce the availability of fast-cycling storage facilities for
trading purposes, particularly temporal arbitrages whereby traders exploit differences in
prices for one day to the next.
78. However, some of the market participants note that instead of seeing a reduction in the
storage availability for trading, we may see volatility increases in the Dutch gas market.
As a result of declining Groningen swing, there is less flexibility available for meeting
market peaks and troughs. Possibly, we will also see seasonal spreads widening.51 Both
impacts can be beneficial to the value of gas storage. We agree that the effect of the
future changes on the role of gas storage remains uncertain.
79. In the previous section we mentioned that in the future gas fired capacity is more likely
to be used as back-up for the electricity produced by intermittent sources such as solar
51 ICIS, Renewed Groningen risk widens TTF seasonal price spread, 23 May 2017,
https://www.icis.com/resources/news/2017/05/23/10108841/renewed-groningen-risk-widens-ttf-seasonal-price-spread/.
34 | brattle.com
and wind. This can be another driver for demand in gas storage as there is more variable
demand for gas from CCGTs.
IV. Changes and Desirable Features 80. In this section we discuss how the market changes discussed above could influence
whether the key desirable features of hub liquidity, security of supply and competition
can be met.
IV.A. DRIVERS OF HUB LIQUIDITY 81. Before considering the effect of the market changes on hub liquidity, it is important to
consider the main drivers of hub liquidity, which we list below.52 We group the factors
into those which are specific to the Dutch market, and those which are largely a result
of EU legislation.
IV.A.1. Dutch Specific Factors a) Network effects53 and the ‘first mover advantage’: Liquid hubs are attractive to traders,
because they make it easy for traders to find counter parties, bid-offer spreads tend to
be low, and prices are reliable and robust. Hence, liquidity will attract traders which,
in turn, generates more liquidity, in a virtuous circle. The result is that the hub that is
most liquid will likely continue to build liquidity at a faster rate than other hubs.
b) Use of TTF Indexation in Contracts: The high liquidity at the TTF compared to other
continental hubs has resulted in many long-term gas contracts adopting TTF price
indexation – typically month-ahead or day-ahead indexation. Parties with TTF
indexation in their contracts will have an incentive to trade at the TTF to hedge their
contracts, which leads to more trading and liquidity.
c) Exchange rate effects: Arguably, the TTF has overtaken the NBP as the most liquid
hub in Europe because trades at NBP are denominated in Sterling, rather than Euros.
This means that continental traders using the NBP to trade gas that will ultimately be
52 For further discussion of the drivers of TTF liquidity see ACER/CEER Annual Report on the
Results of Monitoring the Internal Natural Gas Markets in 2015 September 2016, Case study 1: Reasons for TTF liquidity development – historical account, pp.23-24 and Baringa, The Benefits of TTF Liquidity, 25 September 2015, prepared for ACM, section 6.5 p. 22.
53 By network effects, we mean the phenomena whereby a product or service gains additional value as more people use it. Examples include telephone and payment systems, as well as commodity exchanges.
35 | brattle.com
delivered to Europe must also hedge currency risks, which increases their transaction
costs. The TTF does not face the same problem.
d) Liberalisation and Competition: in a liberalised market, as gas suppliers gain and lose
customers, they will need to buy or sell gas. Hence, while the development of
competition is helped by a liquid market helps, since it makes market entry easier,
competition also creates a driver for trading as participants must trade gas with one
another. This is another example of a virtuous circle.
e) Involvement of the unbundled Dutch incumbent, Gasterra, on the TTF, and in
particular Gasterra’s agreement to deliver gas at the TTF (as opposed to at the city
gate) since 2011.
f) Creation of a single gas hub and quality. While the Dutch network physically has
several different gas qualities, gas on the TTF is traded in terms of energy assuming a
standard calorific value of gas. The cost of quality conversion is socialised, and so a
shipper can inject low calorific value (L-cal) gas at an entry point and extract Hi-cal at
an exit point without having to book quality conversion services. Arguable, liquidity
at other hubs, for example in Germany, has suffered because trading was initially
divided into smaller market areas based on gas quality and physical network
constraints, which limited the number of trading participants at each ‘mini hub’.
While the German market has since consolidated into two market areas, to the
German hubs still lag behind the TTF in terms of liquidity.
g) Multiple Supply Sources: Trading will tend to occur naturally at points where
different sources of gas supply meet. The sources of supply will typically have
different supply costs and characteristics, and these differences create the possibility
for arbitrage and trade. Multiple supply sources also tend to mean that it is possible for
more parties to access gas, which encourages competition and trade. The Netherlands
happens to have a fortunate mix of both domestic gas production – from Groningen
and small fields – and the ability to import pipeline gas from Norway, the UK,
Germany, and Russia, as well as to import LNG from many countries via the Gate
terminal. The Netherlands also acts as a transit country or gas roundabout for gas
flows from and to, for example, Norway to France. This increases the volumes flowing
through the Netherlands that are available to trade. Multiple physical supply sources
(including gas storage, see below) also give market participants confidence that they
will still be able to deliver gas, if one supply source fails.
h) Increase in the available storage capacity: Around 396 mcm/d (161 TWh/d) of gas can
be extracted from storage, and third-party access to storage has improved over the
years. This is both as a result of the construction of new independent gas storage
36 | brattle.com
facilities, and the introduction by Gasterra of a substantial amount of ‘virtual’ gas
storage. The availability of gas storage helps liquidity because it provides traders with
the opportunity to arbitrage price differences across time, helps ensure the firmness of
supplies, and can provide flexibility to meet varying customer demand which
facilitates market entry, competition and hence liquidity.
i) Firm contracts: the use of ‘firm’ TTF contracts is also important – under the standard
TTF ‘EFET’ contract,54 very few circumstances excuse sellers or buyers from
delivering or taking gas at the TTF. This provides buyers and sellers with the
confidence that the risk of interruption and unexpected costs is minimised.
IV.A.2. Factors Largely Resulting from EU Legislation j) Entry-Exit transportation contracts: entry-exit systems make possible the creation of
virtual hubs, such as theTTF,, and facilitate trading. Typically, a virtual hub allows
many more parties to buy and sell gas from one another than a physical hub, where
gas transactions take place at a specific point in the network. With a physical hub,
only parties with point-to-point capacity to or from the hub can transact there.
k) Cost-reflective balancing rules: Traders have commented that strict balancing regimes
with punitive charges act as a deterrent to trading. With punitive charges, even a
small imbalance can wipe out any profits from the trade. Hence, cost reflective
balancing rules encourage trading and liquidity.
l) Management of the gas transport system, including the TTF, by a neutral, unbundled
TSO (GTS) which has an interest in growing traded volumes.
m) Transparency: data on the available transmission capacity, the available storage
capacity, use of storage and gas flows are made available to market participants.
Transparency alleviates concerns of discrimination, attracts entry, and improves
competition. Liquidity improves as a consequence.
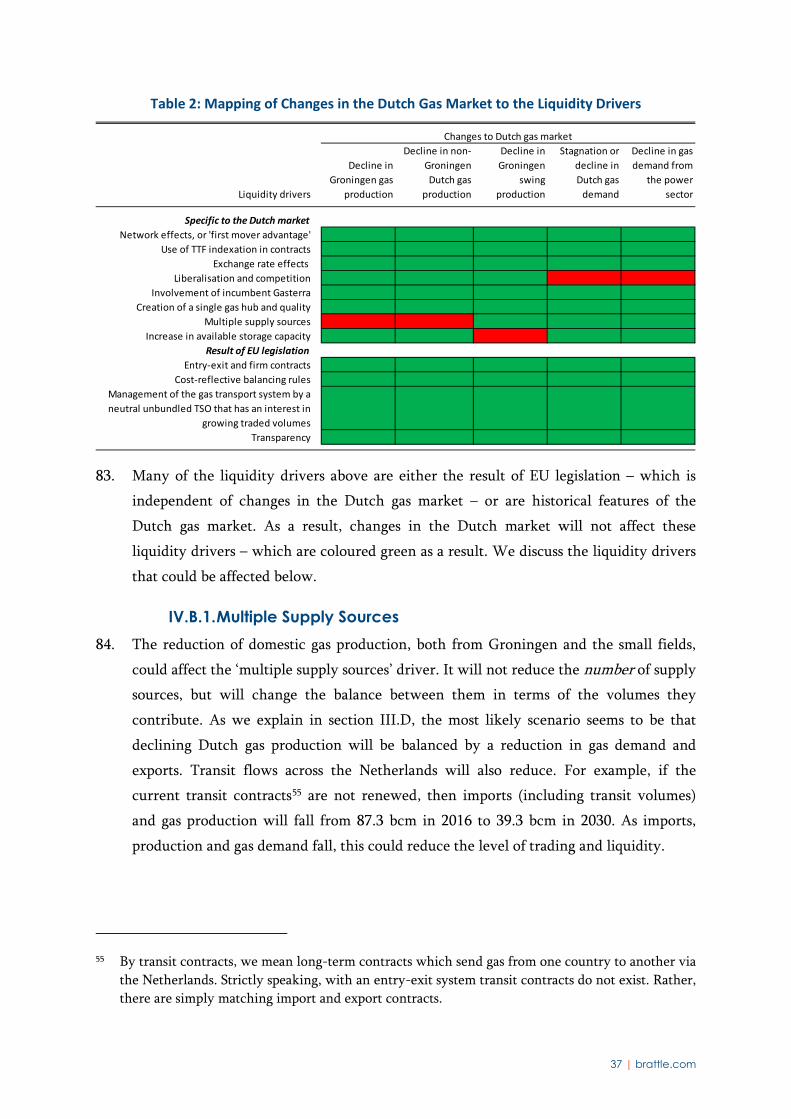
IV.B. MARKET CHANGES AND HUB LIQUIDITY 82. Table 2 below maps the effect of future changes in the Dutch gas market to the liquidity
drivers. Where we do not think there is an effect, we colour the relevant square green –
where there is an effect, we colour the square red.
54 We refer to the standard European Federation of Energy Traders (EFET) standard contract. See:
www.efet.org/standardisation/standard-contracts--gas--power/gas-master-agreement--annexes/
37 | brattle.com
Table 2: Mapping of Changes in the Dutch Gas Market to the Liquidity Drivers
83. Many of the liquidity drivers above are either the result of EU legislation – which is
independent of changes in the Dutch gas market – or are historical features of the
Dutch gas market. As a result, changes in the Dutch market will not affect these
liquidity drivers – which are coloured green as a result. We discuss the liquidity drivers
that could be affected below.
IV.B.1. Multiple Supply Sources 84. The reduction of domestic gas production, both from Groningen and the small fields,
could affect the ‘multiple supply sources’ driver. It will not reduce the number of supply
sources, but will change the balance between them in terms of the volumes they
contribute. As we explain in section III.D, the most likely scenario seems to be that
declining Dutch gas production will be balanced by a reduction in gas demand and
exports. Transit flows across the Netherlands will also reduce. For example, if the
current transit contracts55 are not renewed, then imports (including transit volumes)
and gas production will fall from 87.3 bcm in 2016 to 39.3 bcm in 2030. As imports,
production and gas demand fall, this could reduce the level of trading and liquidity.
55 By transit contracts, we mean long-term contracts which send gas from one country to another via
the Netherlands. Strictly speaking, with an entry-exit system transit contracts do not exist. Rather, there are simply matching import and export contracts.
Liquidity drivers
Decline in Groningen gas
production
Decline in non-Groningen Dutch gas
production
Decline in Groningen
swing production
Stagnation or decline in Dutch gas
demand
Decline in gas demand from
the power sector
Specific to the Dutch marketNetwork effects, or 'first mover advantage'
Use of TTF indexation in contractsExchange rate effects
Liberalisation and competitionInvolvement of incumbent Gasterra
Creation of a single gas hub and qualityMultiple supply sources
Increase in available storage capacityResult of EU legislation
Entry-exit and firm contractsCost-reflective balancing rules
Management of the gas transport system by a neutral unbundled TSO that has an interest in
growing traded volumesTransparency
Changes to Dutch gas market
38 | brattle.com
85. We note that in its market monitoring report, the ACM has noted the decline of the
Groningen field and its possible effect:
“A possible development that might thwart these positive trends [a liquid and well-functioning Dutch wholesale gas market] is the reduction of the domestic gas production, especially from the Groningen field. For 2017, ACM expects that this will have no impact (negative or otherwise) on the functioning of Dutch wholesale gas market. The lower production cap on the Groningen field implies a greater reliance on imported gas for the Netherlands and Northwest Europe. The fact that TTF is well-connected to other foreign gas sources and the fact that the available capacity of import facilities in the Netherlands is not congested (contractually or otherwise), suggests that sufficient gas will be available to meet the needs of market participants in 2017.
Certainly for 2017, because of the well-functioning TTF, ACM has sufficient confidence to assume that the Dutch gas market will not be negatively impacted by lower domestic gas supply. On the contrary, ACM is of the opinion that a well-functioning gas hub like TTF is an important element in ensuring that the market can continue to respond effectively to the reduction in future Groningen production.”56
86. The ACM concludes that imports will make up for the reduction in Groningen supply,
and that liquidity on the TTF is sufficiently well developed that it will be self-
sustaining. Rather than the reduction in Groningen production threatening TTF
liquidity, ACM concludes that TTF liquidity will help mitigate the effect of the
Groningen reduction, by helping to attract imports.
87. However, we note that the ‘virtuous circle’ of liquidity building we described in section
IV.A can also turn onto a ‘vicious circle’ of decline if liquidity starts to fall below or
close to the level of liquidity in other ‘rival’ hubs. Traders are then attracted to these
other, more liquid hubs, leading to further declines in liquidity. However, in practise
the risk of liquidity at the TTF falling to a level where a vicious circle of decline results
seems small, given (a) the TTF’s structural advantages relative to the NBP – such as
trading in Euros and location on the continent – and (b) the fact that even a much less
liquid TTF would still be much more liquid than the second most liquid continental
hub, NCG.57 We understand that NCG and Gaspool will merge as one market area in
56 ACM, Consultation paper: Self-evaluation Gas Target Model II, Functioning of the wholesale gas
market in the Netherlands, 27 October 2016, p.12.
57 In 2016, traded volumes on TTF were about 21,000 TWh, compared to 2,100 TWh on NCG. NCG ranked the 3rd place in terms of the trading volumes among other European hubs. See ACER, The
Continued on next page
39 | brattle.com
2022. In 2016, a total volume of 3,600 TWh was traded at NCG and Gaspool, which is
still far below the trading volumes at TTF.
IV.B.2. Availability of Gas Storage for Trading 88. Even if the number of gas storage facilities does not decline further, the use of gas
storage may change in a way that could affect TTF liquidity. Specifically, gas storages
will likely increasingly to be used to meet physical peak demands, to compensate for
reduced Groningen swing. As a result, fast-cycling storage facilities may be less
available to use for trading purposes as gas is kept in storage to deal with unexpected
supply emergencies or high levels of peak demand.
89. To give a sense of the possible contribution of gas storage to trading activity, we
estimate that the total working volume of ‘fast-cycling’ storages connected to the Dutch
network is about 58 TWh.58 Assuming that all this working volume is bought and then
sold several times in a year, and that the number of storage cycles fell from 10 to 5, this
would correspond to a drop in potential traded volume of 580 TWh per year.59 This is
about 3% of the total TTF traded volume of about 21,000 TWh in 2016. However, this
calculation does not reflect the indirect support that storage gives to trading volumes, in
terms of ensuring secure supply and providing a back-up service.
90. One possible development is that, as a result of the reduction in the high-swing
Groningen production, market volatility and summer-winter spreads could increase,
which could prompt the construction of more storage facilities. However, there seems
to be no sign of this so far and, indeed, several planned storage projects have cancelled.
It is possible that over the medium term, the cost of new storage will continue to exceed
its value, and so no new storage facilities will be built. We conclude that changes in the
market could reduce the use of gas storage for trading, and hence have a negative effect
on TTF liquidity.
Continued from previous page
5th Annual Market Monitoring Report covering 2015: Gas Wholesale Markets findings, 21 September 2016, p.14.
58 For the purpose of this exercise, we assume that all salt-cavern storages are fast-cycling storages, which can be filled and emptied multiple times over a year.
59 Calculated assuming that gas is sold on the TTF when withdrawn, and is bought on the TTF prior to injection. Hence, with a total working volume of 58 TWh, one cycle of storage results in 116 TWh of traded volumes. If the number of storage cycles reduced by five, then the drop in traded volume is 5 x 116 = 580 TWh.
40 | brattle.com
IV.B.3. Reduced Trading from CCGTs 91. While clearly the future market changes we have identified will not reverse
liberalisation, reductions in gas demand in general, and particularly in the power sector,
could have a negative effect on trading volumes. In the past, gas demand from CCGTs
varied over the day, and CCGTs adjusted their gas positions by trading on the TTF. It is
also likely that CCGTs will have gas supply contracts linked to TTF prices, and so will
hedge prices by trading forward TTF products. Hence, a reduced CCGT capacity could
result in lower trading volumes.
92. Mitigating this effect, we note that the CCGTs that do operate will likely have an even
more variable gas demand than in the past, because they will be providing back-up for
intermittent renewable energy sources including wind and solar. If, for example,
production from these sources reduces suddenly, CCGT production will need to
increase suddenly, thus increasing gas demand. This could result in increased trading at
TTF, albeit only in the prompt market.
93. We also note that the reduction in power sector gas demand is likely to be relatively
small, compared to overall TTF traded volumes. For example, section III.C.2 showed a
reduction in installed CCGT capacity of 3.3 GW between 2012 and 2016. Assuming a
25% load factor and 50% plant efficiency, this is equivalent to a reduction in gas
demand of around 1.5 bcm (14.4 TWh), which is only 0.07% of the traded TTF volumes
in 2016.
94. Hence, while the reduction in CCGT capacity could lead to lower traded volumes on
TTF, the significance of the effect is uncertain.
IV.C. MARKET CHANGES AND TRANSIT 95. To a certain extent, since by definition transit flows across the Netherlands, it could be
argued that transit flows are independent of events in the Dutch market. However,
there could be two important interactions. First, traders will generally prefer to transit
across a liquid hub, like the TTF, because it is easier to adjust their positions. For
example, if there is a shortfall in supply, this could be made up relatively easily by
buying volumes on the TTF. Similarly, if the final customer demands less gas, the excess
volumes can be sold relatively easily at the TTF. A drop in TTF liquidity could therefore
make transit across the Netherlands less attractive. There could be a ‘feedback loop’
involving falling transit, which reduces liquidity, and makes further transit less
desirable.
96. Second, as we described earlier, domestic volumes of Dutch gas production will fall.
This means that the revenue recovered from Dutch entry points will also fall. If tariffs
41 | brattle.com
at IP points need to increase to compensate for this revenue drop, this could make
transit across the Netherlands more expensive, leading to a reduction in transit volumes,
which would lead to further tariff increases.
IV.D. MARKET CHANGES, SECURITY OF SUPPLY AND COMPETITION
IV.D.1. Security of Supply 97. In section II.A.2, we discussed the N-1 test that GTS had carried out for 2014 – before
the latest cuts to Groningen production were announced. To determine the effect of
market changes on future security of gas supply, we have carried out an ‘N-1’ test for
2017 and 2030.60
98. Peak Groningen production capacity has decreased from 337 mcm/d in 2014 to 287
mcm/d in 2017, and GTS forecasts that the it will decrease to 130 mcm/d by 2030. On
the other hand, cross-border capacity is expected to increase from 178 mcm/d in 2014 to
229 mcm/d in 2017.
99. On the demand side, GTS estimated that maximum gas demand could be as high as 509
mcm/d on an exceptionally cold day, being a day which will only occur once every 20
years. The GTS 2017 Network Development Plan projects a decrease both in overall
demand and in peak demand between now and 2030. Assuming that this projection will
translate into an equivalent demand decrease on extremely cold days, we estimate that
the peak demand will decrease to between 310-364 mcm/d in 2030. The demand range
represents the lower and upper bounds in the four demand scenarios assumed by GTS in
the 2017 Network Development Plan.
100. Combining the fall in maximum demand and domestic production with the increase in
import capacity, we find that the level of infrastructure security increases relative to
2014, as shown in Table 3. Specifically, if the largest single source of supply fails (the
Grijpskerk gas storage), the remaining capacity can serve 178% of the domestic demand
in 2017 and 201-236% of the domestic demand in 2030, compared to only 164% in
2014.
60 We base the test on the capacity and the demand projection in the 2017 Network Development
Plan.
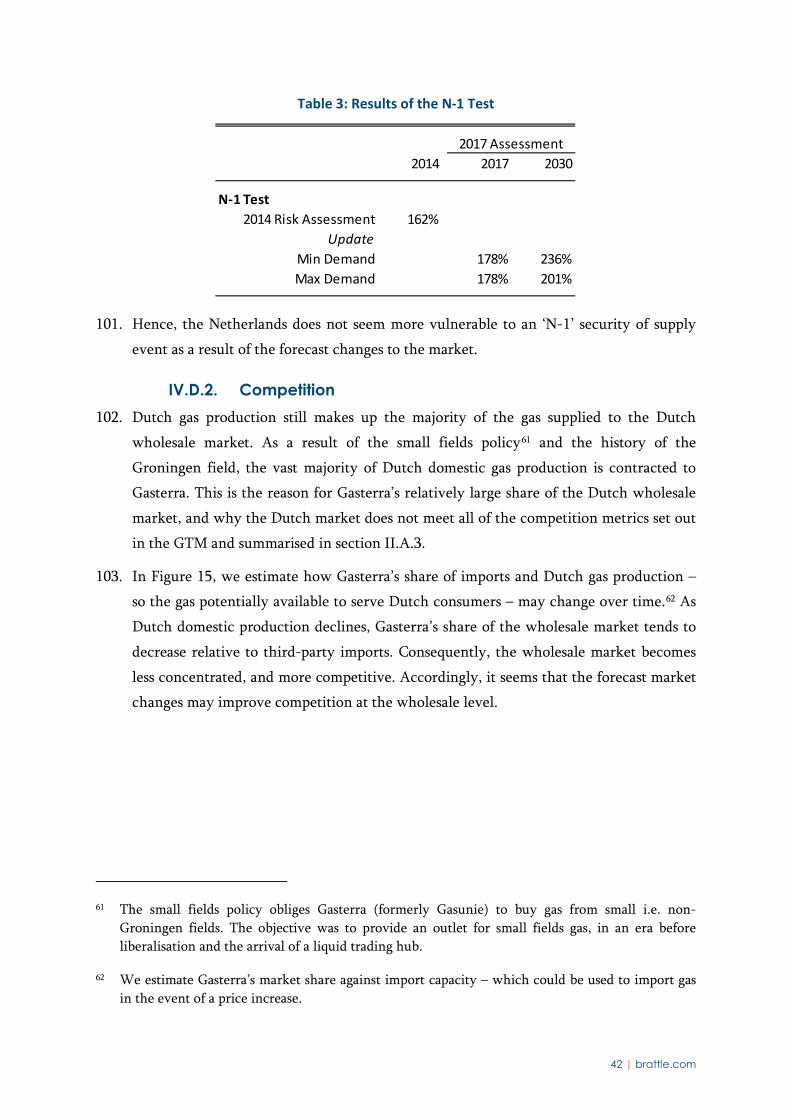
42 | brattle.com
Table 3: Results of the N-1 Test
101. Hence, the Netherlands does not seem more vulnerable to an ‘N-1’ security of supply
event as a result of the forecast changes to the market.
IV.D.2. Competition 102. Dutch gas production still makes up the majority of the gas supplied to the Dutch
wholesale market. As a result of the small fields policy61 and the history of the
Groningen field, the vast majority of Dutch domestic gas production is contracted to
Gasterra. This is the reason for Gasterra’s relatively large share of the Dutch wholesale
market, and why the Dutch market does not meet all of the competition metrics set out
in the GTM and summarised in section II.A.3.
103. In Figure 15, we estimate how Gasterra’s share of imports and Dutch gas production –
so the gas potentially available to serve Dutch consumers – may change over time.62 As
Dutch domestic production declines, Gasterra’s share of the wholesale market tends to
decrease relative to third-party imports. Consequently, the wholesale market becomes
less concentrated, and more competitive. Accordingly, it seems that the forecast market
changes may improve competition at the wholesale level.
61 The small fields policy obliges Gasterra (formerly Gasunie) to buy gas from small i.e. non-
Groningen fields. The objective was to provide an outlet for small fields gas, in an era before liberalisation and the arrival of a liquid trading hub.
62 We estimate Gasterra’s market share against import capacity – which could be used to import gas in the event of a price increase.
2014 2017 2030
N-1 Test2014 Risk Assessment 162%
UpdateMin Demand 178% 236%Max Demand 178% 201%
2017 Assessment
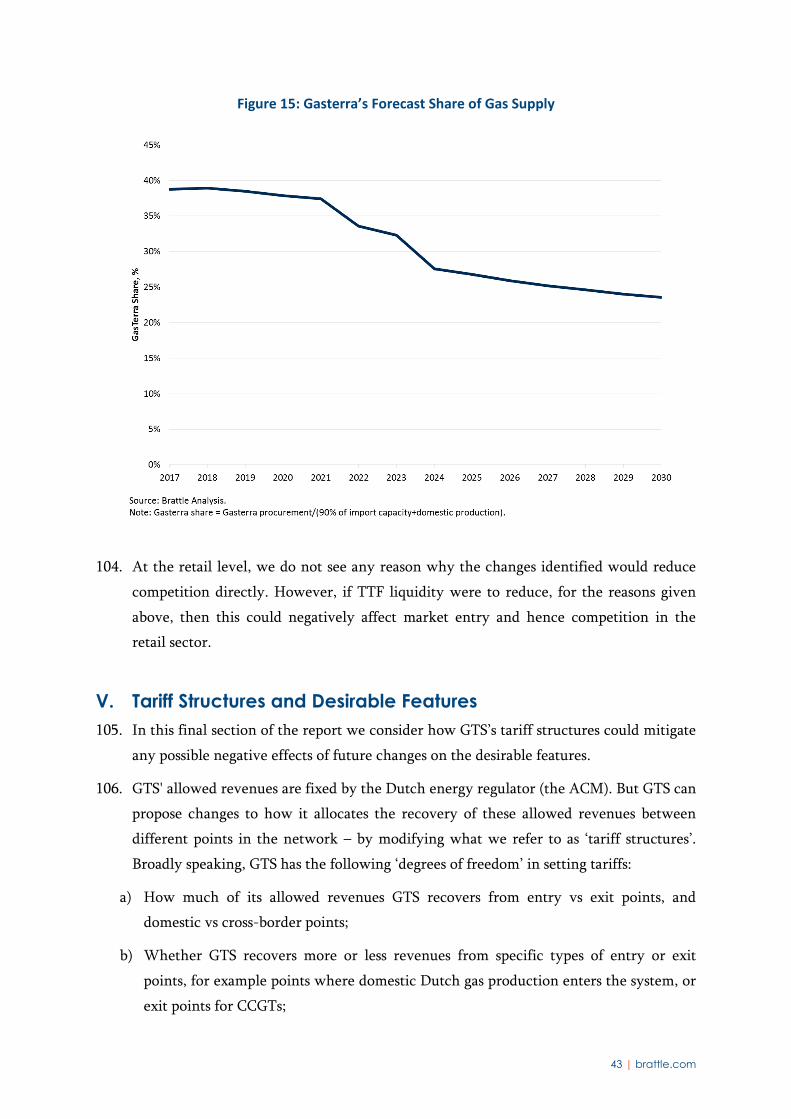
43 | brattle.com
Figure 15: Gasterra’s Forecast Share of Gas Supply
104. At the retail level, we do not see any reason why the changes identified would reduce
competition directly. However, if TTF liquidity were to reduce, for the reasons given
above, then this could negatively affect market entry and hence competition in the
retail sector.
V. Tariff Structures and Desirable Features 105. In this final section of the report we consider how GTS’s tariff structures could mitigate
any possible negative effects of future changes on the desirable features.
106. GTS' allowed revenues are fixed by the Dutch energy regulator (the ACM). But GTS can
propose changes to how it allocates the recovery of these allowed revenues between
different points in the network – by modifying what we refer to as ‘tariff structures’.
Broadly speaking, GTS has the following ‘degrees of freedom’ in setting tariffs:
a) How much of its allowed revenues GTS recovers from entry vs exit points, and
domestic vs cross-border points;
b) Whether GTS recovers more or less revenues from specific types of entry or exit
points, for example points where domestic Dutch gas production enters the system, or
exit points for CCGTs;
44 | brattle.com
c) The degree to which prices vary for short-term and long-term, or seasonal, capacity
products.
107. The current split of revenue recovery between entry and exit is around 35%/65%
respectively. Below we describe how GTS could modify the current tariff structures so
as to reduce the risk that future market changes could disrupt the functioning of the
Dutch gas market.
V.A. TARIFF STRUCTURES, IMPORTS AND TRANSIT 108. As set out above, the main expected change in the Dutch market is a decline in
domestic Dutch gas production, accompanied by a decrease in exports and, eventually,
an increase in imports. The Netherlands is forecast to become a net importer sometime
in the early 2020s.63 Liquidity and market functioning should not be a problem as long
as a reliable and diverse set of imports replaces domestic production. Hence a natural
focus of future tariff structures should be on facilitating the smooth transition from the
Netherlands being a net exporter to a net importer.
109. At present there is little or no congestion on the cross-border interconnector points. As
a result hub prices are similar in the Netherlands and neighbouring countries such as
Germany. Moreover, some market participants noted in the workshop that for most of
the long-term contracts, transportation costs are sunk costs. However, with the
increasing use of shorter-term contracts, the pricing for border entry/exit will become
more important for transit routes to be competitive.
110. The regulated price of cross border capacity, expressed on a €/MWh basis, is
significantly higher than the average difference in hub prices. Figure 16 shows the
difference in day-ahead hub prices between TTF and the German hubs, NCG and
Gaspool, and the range of costs of moving gas from Germany to the Netherlands,
depending on published cross border tariffs of the alternative German gas networks.
63 Section III.D.
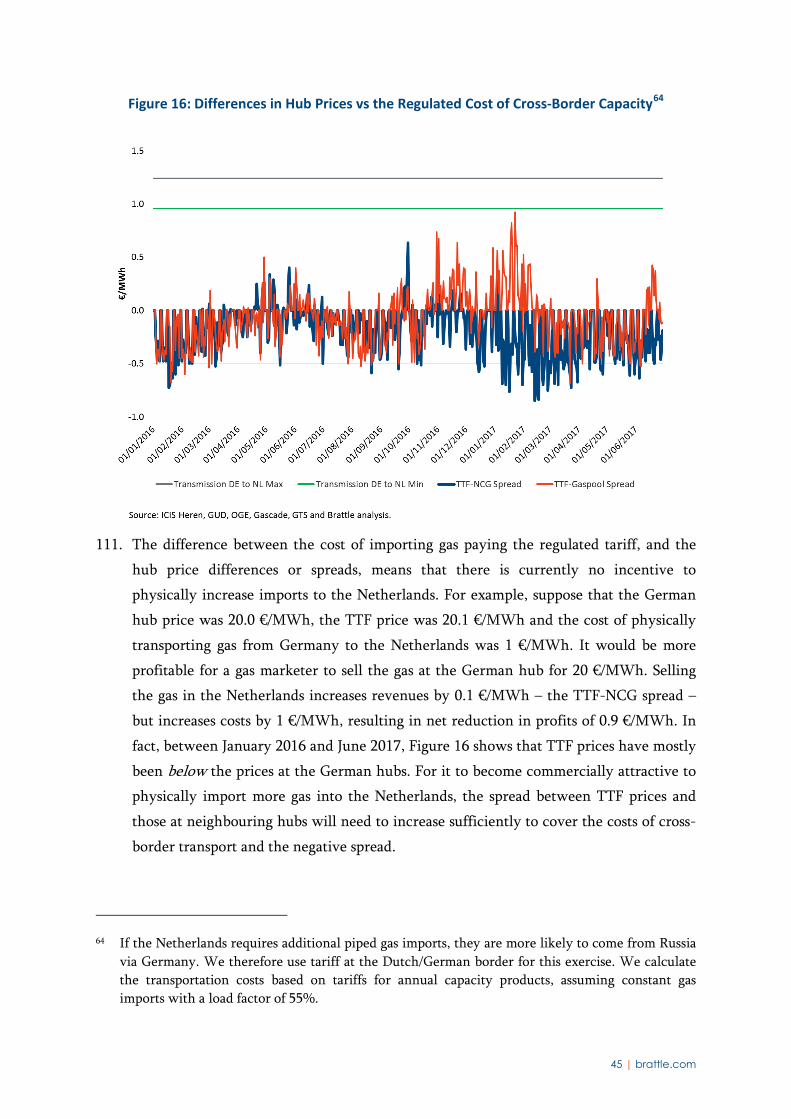
45 | brattle.com
Figure 16: Differences in Hub Prices vs the Regulated Cost of Cross-Border Capacity64
111. The difference between the cost of importing gas paying the regulated tariff, and the
hub price differences or spreads, means that there is currently no incentive to
physically increase imports to the Netherlands. For example, suppose that the German
hub price was 20.0 €/MWh, the TTF price was 20.1 €/MWh and the cost of physically
transporting gas from Germany to the Netherlands was 1 €/MWh. It would be more
profitable for a gas marketer to sell the gas at the German hub for 20 €/MWh. Selling
the gas in the Netherlands increases revenues by 0.1 €/MWh – the TTF-NCG spread –
but increases costs by 1 €/MWh, resulting in net reduction in profits of 0.9 €/MWh. In
fact, between January 2016 and June 2017, Figure 16 shows that TTF prices have mostly
been below the prices at the German hubs. For it to become commercially attractive to
physically import more gas into the Netherlands, the spread between TTF prices and
those at neighbouring hubs will need to increase sufficiently to cover the costs of cross-
border transport and the negative spread.
64 If the Netherlands requires additional piped gas imports, they are more likely to come from Russia
via Germany. We therefore use tariff at the Dutch/German border for this exercise. We calculate the transportation costs based on tariffs for annual capacity products, assuming constant gas imports with a load factor of 55%.
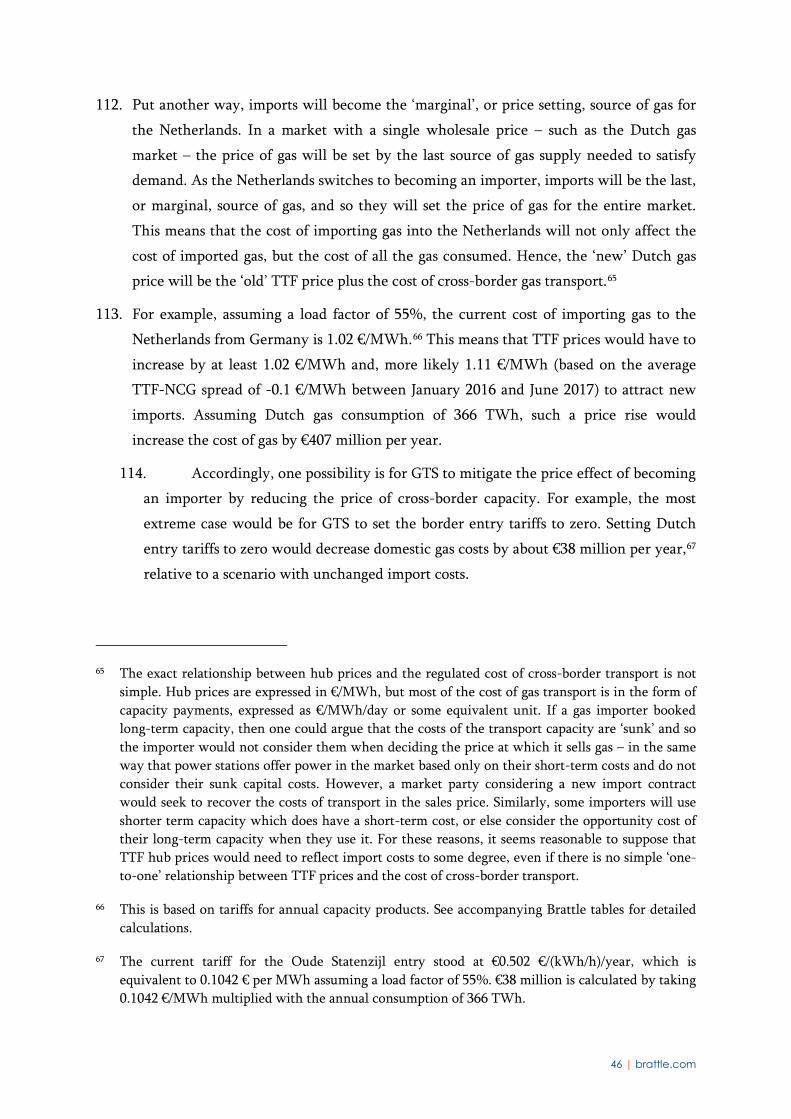
46 | brattle.com
112. Put another way, imports will become the ‘marginal’, or price setting, source of gas for
the Netherlands. In a market with a single wholesale price – such as the Dutch gas
market – the price of gas will be set by the last source of gas supply needed to satisfy
demand. As the Netherlands switches to becoming an importer, imports will be the last,
or marginal, source of gas, and so they will set the price of gas for the entire market.
This means that the cost of importing gas into the Netherlands will not only affect the
cost of imported gas, but the cost of all the gas consumed. Hence, the ‘new’ Dutch gas
price will be the ‘old’ TTF price plus the cost of cross-border gas transport.65
113. For example, assuming a load factor of 55%, the current cost of importing gas to the
Netherlands from Germany is 1.02 €/MWh.66 This means that TTF prices would have to
increase by at least 1.02 €/MWh and, more likely 1.11 €/MWh (based on the average
TTF-NCG spread of -0.1 €/MWh between January 2016 and June 2017) to attract new
imports. Assuming Dutch gas consumption of 366 TWh, such a price rise would
increase the cost of gas by €407 million per year.
114. Accordingly, one possibility is for GTS to mitigate the price effect of becoming
an importer by reducing the price of cross-border capacity. For example, the most
extreme case would be for GTS to set the border entry tariffs to zero. Setting Dutch
entry tariffs to zero would decrease domestic gas costs by about €38 million per year,67
relative to a scenario with unchanged import costs.
65 The exact relationship between hub prices and the regulated cost of cross-border transport is not
simple. Hub prices are expressed in €/MWh, but most of the cost of gas transport is in the form of capacity payments, expressed as €/MWh/day or some equivalent unit. If a gas importer booked long-term capacity, then one could argue that the costs of the transport capacity are ‘sunk’ and so the importer would not consider them when deciding the price at which it sells gas – in the same way that power stations offer power in the market based only on their short-term costs and do not consider their sunk capital costs. However, a market party considering a new import contract would seek to recover the costs of transport in the sales price. Similarly, some importers will use shorter term capacity which does have a short-term cost, or else consider the opportunity cost of their long-term capacity when they use it. For these reasons, it seems reasonable to suppose that TTF hub prices would need to reflect import costs to some degree, even if there is no simple ‘one-to-one’ relationship between TTF prices and the cost of cross-border transport.
66 This is based on tariffs for annual capacity products. See accompanying Brattle tables for detailed calculations.
67 The current tariff for the Oude Statenzijl entry stood at €0.502 €/(kWh/h)/year, which is equivalent to 0.1042 € per MWh assuming a load factor of 55%. €38 million is calculated by taking 0.1042 €/MWh multiplied with the annual consumption of 366 TWh.
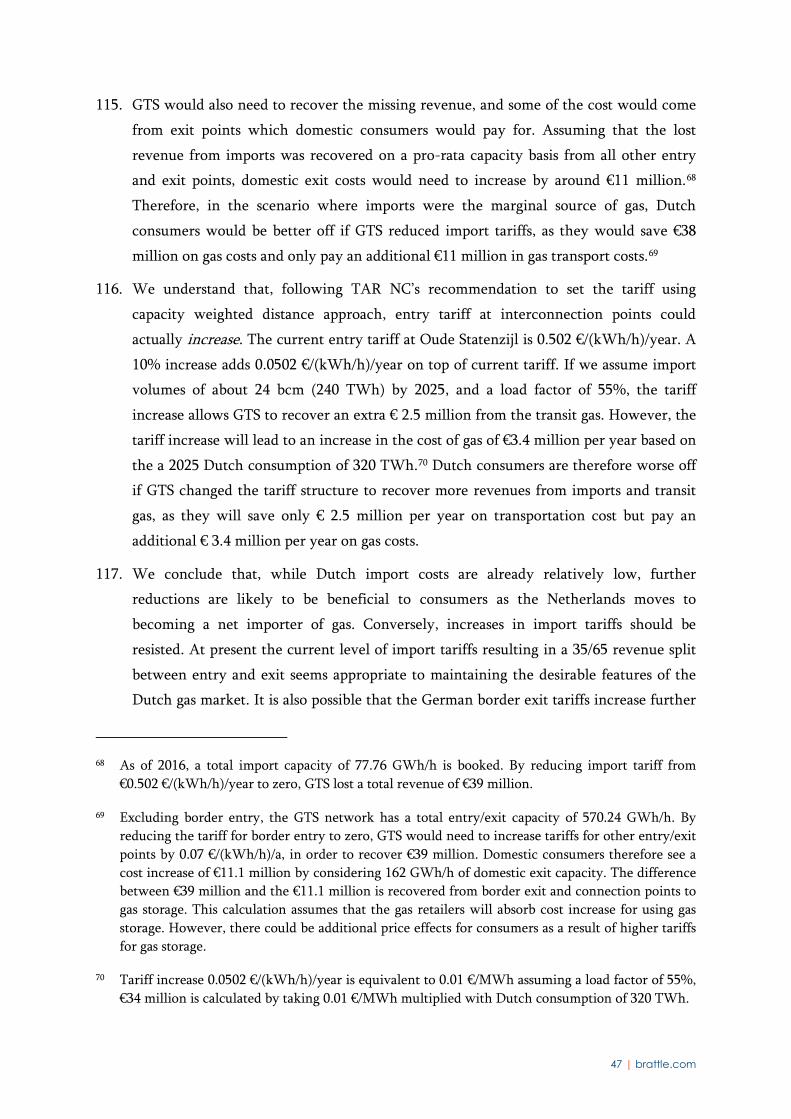
47 | brattle.com
115. GTS would also need to recover the missing revenue, and some of the cost would come
from exit points which domestic consumers would pay for. Assuming that the lost
revenue from imports was recovered on a pro-rata capacity basis from all other entry
and exit points, domestic exit costs would need to increase by around €11 million.68
Therefore, in the scenario where imports were the marginal source of gas, Dutch
consumers would be better off if GTS reduced import tariffs, as they would save €38
million on gas costs and only pay an additional €11 million in gas transport costs.69
116. We understand that, following TAR NC’s recommendation to set the tariff using
capacity weighted distance approach, entry tariff at interconnection points could
actually increase. The current entry tariff at Oude Statenzijl is 0.502 €/(kWh/h)/year. A
10% increase adds 0.0502 €/(kWh/h)/year on top of current tariff. If we assume import
volumes of about 24 bcm (240 TWh) by 2025, and a load factor of 55%, the tariff
increase allows GTS to recover an extra € 2.5 million from the transit gas. However, the
tariff increase will lead to an increase in the cost of gas of €3.4 million per year based on
the a 2025 Dutch consumption of 320 TWh.70 Dutch consumers are therefore worse off
if GTS changed the tariff structure to recover more revenues from imports and transit
gas, as they will save only € 2.5 million per year on transportation cost but pay an
additional € 3.4 million per year on gas costs.
117. We conclude that, while Dutch import costs are already relatively low, further
reductions are likely to be beneficial to consumers as the Netherlands moves to
becoming a net importer of gas. Conversely, increases in import tariffs should be
resisted. At present the current level of import tariffs resulting in a 35/65 revenue split
between entry and exit seems appropriate to maintaining the desirable features of the
Dutch gas market. It is also possible that the German border exit tariffs increase further
68 As of 2016, a total import capacity of 77.76 GWh/h is booked. By reducing import tariff from
€0.502 €/(kWh/h)/year to zero, GTS lost a total revenue of €39 million.
69 Excluding border entry, the GTS network has a total entry/exit capacity of 570.24 GWh/h. By reducing the tariff for border entry to zero, GTS would need to increase tariffs for other entry/exit points by 0.07 €/(kWh/h)/a, in order to recover €39 million. Domestic consumers therefore see a cost increase of €11.1 million by considering 162 GWh/h of domestic exit capacity. The difference between €39 million and the €11.1 million is recovered from border exit and connection points to gas storage. This calculation assumes that the gas retailers will absorb cost increase for using gas storage. However, there could be additional price effects for consumers as a result of higher tariffs for gas storage.
70 Tariff increase 0.0502 €/(kWh/h)/year is equivalent to 0.01 €/MWh assuming a load factor of 55%, €34 million is calculated by taking 0.01 €/MWh multiplied with Dutch consumption of 320 TWh.
48 | brattle.com
as a result of the TAR NC. To the extent possible, it would be desirable to mitigate this
effect by avoiding tariff increases for Dutch import charges. This would be consistent
with the desire to promote transit flows and maintain TTF liquidity. We note that the
cost-benefit analysis above focuses on the Dutch consumers. However, there are other
stakeholders such as foreign consumers, and re-distributing allow revenues to border
exits will have an impact on these stakeholders.
V.B. LNG IMPORTS 118. As domestic Dutch gas production declines, LNG is likely to become an increasingly
important part of the supply mix. LNG could be particularly important as a source of
gas, particularly as a way of dealing with winter gas demand which the Groningen field
is no longer able to serve. On the other hand, some of the market participants note the
difficulties to book LNG capacity on short notice, so recommend that GTS should focus
on developing LNG for meeting baseload demand.
119. When considering where to send their LNG, exporters will look at the ‘netback’ value –
that is, the price of LNG they receive after deducting the relevant shipping, system
entry and regasification costs. Accordingly, the lower the system entry charges, the
higher the netback value and the more attractive the destination for LNG importers.
We consider cost of using LNG terminals for both meeting baseload demand and for
meeting peakload demand. Figure 17 and Figure 18 illustrates that, whether for short-
term or for longer-term booking, the Gate LNG terminal entry tariffs are already
relatively low compared to other nearby LNG terminals in Belgium and the UK.
However, an importer would consider the total costs, including regasification, and we
do not have data on how overall costs compare.
49 | brattle.com
Figure 17: Entry Tariffs at Gate and Other LNG Terminals – Peakload Use
Figure 18: Entry Tariffs at Gate and Other LNG Terminals – Baseload Use
50 | brattle.com
120. For enhancing LNG imports for meeting baseload demand, we see two possible tariff
structure measures to enhance LNG imports. First GTS could reduce the cost of system
entry at the Gate LNG terminal, and any future LNG terminals. In 2016, less than 3% of
GTS’s revenues were collected from the gate entry point. Redistributing some or all of
these costs would have a relatively minor impact.
121. GTS could make a straightforward administrative reduction in the Gate terminal entry
charges. Alternatively GTS could auction entry capacity at the Gate terminal with a
zero reserve price. Logically, participants in the auction would bid for entry capacity
until the netback was just less than the netback for the next best alternative destination,
such as the UK. Using an auction would be an efficient way to ‘discover’ the maximum
entry price which makes importing LNG to the Netherlands attractive relative to the
next best destination.71 GTS would then need to recover the difference, if any, between
the auction price and the regulated tariff from other network points. The TAR NC
already allows for TSOs to discount entry tariffs for LNG facilities so as to enhance
security of supply.72
122. As well as enhancing security of supply, if LNG is the marginal, or price setting source
of gas, reducing entry tariffs could also lower the costs of all Dutch gas, in the same way
as we discussed in the previous section.
123. For enhancing LNG imports for meeting peakload demand, GTS could make it more
attractive for spot LNG cargoes to be delivered to the Netherlands. Spot imports might
require short-term entry capacity to be booked, which is often relatively expensive,
especially in winter. For example, to book capacity in a winter month73 GTS currently
charges 30% of the annual tariff, as opposed to 1/12 or 8.3% of the annual tariff.
Reducing the monthly factors for the Gate LNG terminal entry point would encourage
LNG short-term imports, promoting security of supply and reducing overall gas costs for
Dutch consumers.
124. However, we recognise that reducing monthly factors for LNG terminals would in
effect be a form of subsidy. GTS and other TSOs apply monthly factors, because users
typically want to import more gas in winter than in the summer. Absent monthly
71 It is also possible that the auction actually results in an increase relative to the current entry
tariffs.
72 TAR NC, Article 9 (2).
73 December, January and February.
51 | brattle.com
factors, users would book less capacity in the summer, leaving capacity unpaid for part
of the year. Monthly factors avoid this incentive, by making the costs of booking
‘profiled’ capacity and a constant annual level of capacity similar. Hence, removing
monthly factors would leave capacity unpaid for, the cost of which would need to be
born by other network users. While this seems justified in the case of LNG – because of
the specific characteristics of LNG imports and the benefits to security of supply and
competition – it does not seem justified for other network users. For example, reducing
monthly factors for pipeline imports would make it cheaper to import flexibility from
outside of the Netherlands. However, it is generally more efficient to import at a higher
load factor, and then use storage nearer the final customer to provide flexibility. Using
Dutch storages to provide flexibility for imports would also assist with TTF liquidity
support and security of supply.
V.C. GAS STORAGE 125. In section IV.B.2 we noted that gas storage could become more heavily used to meet
peak demand, and so be less available for trading. However, the commercial value of gas
storage is still relatively low, compared to the cost of the entry and exit charges from
and to gas storage facilities. Figure 19 below compares the value of a Gasterra virtual
storage ‘bundle’ delivered at the TTF for the 2017/2018 storage year, to the gas transport
costs associated with injected and withdrawing the gas associated with the bundle.74 Gas
transport costs make up about two-thirds of the value of storage at the TTF, leaving
relatively little value left for the storage owner to recover operating and investment
costs.
74 We have used entry and exit costs from and to the Grijpskerk storage for this example. In practice
the Gasterra product is virtual, and so it is not associated with any specific storage facility.
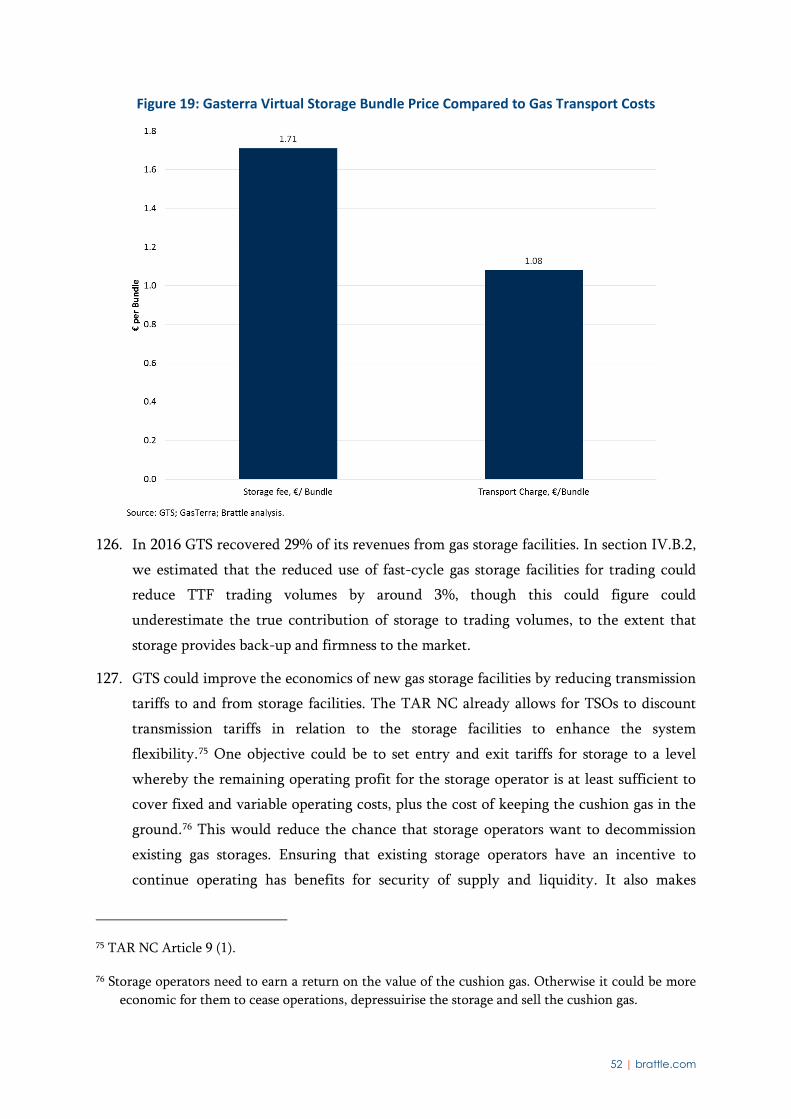
52 | brattle.com
Figure 19: Gasterra Virtual Storage Bundle Price Compared to Gas Transport Costs
126. In 2016 GTS recovered 29% of its revenues from gas storage facilities. In section IV.B.2,
we estimated that the reduced use of fast-cycle gas storage facilities for trading could
reduce TTF trading volumes by around 3%, though this could figure could
underestimate the true contribution of storage to trading volumes, to the extent that
storage provides back-up and firmness to the market.
127. GTS could improve the economics of new gas storage facilities by reducing transmission
tariffs to and from storage facilities. The TAR NC already allows for TSOs to discount
transmission tariffs in relation to the storage facilities to enhance the system
flexibility.75 One objective could be to set entry and exit tariffs for storage to a level
whereby the remaining operating profit for the storage operator is at least sufficient to
cover fixed and variable operating costs, plus the cost of keeping the cushion gas in the
ground.76 This would reduce the chance that storage operators want to decommission
existing gas storages. Ensuring that existing storage operators have an incentive to
continue operating has benefits for security of supply and liquidity. It also makes
75 TAR NC Article 9 (1).
76 Storage operators need to earn a return on the value of the cushion gas. Otherwise it could be more economic for them to cease operations, depressuirise the storage and sell the cushion gas.
53 | brattle.com
economic sense to set tariffs at no more than this level since, if the storage shuts down,
the network costs that the storage paid would have to be born by other network users.
V.D. REDUCED ENTRY TARIFFS FOR DOMESTIC PRODUCTION 128. As we discuss in section III, domestic Dutch gas production is declining, though the
drivers for the declines in Groningen and small-field production differ. The decrease in
Groningen production is a result of the imposition of production limits designed to
reduce the risk of earthquakes. Hence, there is a step reduction in Groningen volumes
in 2017 and 2018, but production thereafter remains stable until at least 2030.
Consequently, reducing entry tariffs for Groningen production would not affect the rate
of production, since it is limited by non-economic factors.
129. In contrast, the production from small fields is declining because gas from existing fields
is being depleted, and new production from new fields is not increasing fast enough to
offset this decline. Broadly, production from an existing field will stop once its variable
costs of production exceed its variable revenues.77 Hence, reducing entry tariffs for
small fields could potentially prolong the life of existing fields by reducing costs. Lower
entry tariffs could also help make new fields that are currently uneconomic viable,
though it seems likely that the cost of entering the transmission system is a relatively
small part of the overall cost of a new development.
130. Hence, one policy option would be to reduce entry fees for the small fields. This could
increase security of supply and make more gas available for trading on TTF, thereby
providing liquidity support.
77 Producers may also factor in the deferred cost of abandonment in their decision, which is a more
complex calculation.