Embed Size (px)
Citation preview
Scientific end Technical Information, Notional Bureau of Standards,
U.S. Department of Commerce, Springfield, Virginia 22151 Price: Printed Copy $3.00; Microfiche $0.65
nor the Commission, nor any person acting on behalf of the Commission:
A. Mokes any warranty or representotion, expressed or implied, with respect i o the accuracy,
completeness, or usefulness of the information contained in this report, or that the use of
privately owned rights; or
any information, opparotus, method, or process disclosed in th is report.
contractor of the Commission, or employee of such i o the axtent that such employee
or contractor of the Commission, or omployee of actor prepares, disseminates, or provides access io, any information pursuant to his or contract with the Commisaion, or h is employment with such contractor
- 'k
-W ORNL-4389
UC-80 - Reactor Technology
Con tract No. W -7405-eng-26
REACTOR CHEMISTRY DIVISION
GAS TRANSPORT IN MSRE MODERATOR GRAPHITE
I I . EFFECTS OF IMPREGNATION
111. VARIATION OF FLOW PROPERTIES
R. 6. Evans I l l J. L. Rutherford A. P. Malinauskas
L E G A L N O T I C E This report r n s prepared as (~11 account of Qovernment Bponsored work. Neither the United 8tates. nor the Commlsaion, nor my person acting on behalf of the Commlssion:
A. Makes my warranty or representation. expressed or implied, with renpect to the Lccu- racy. cbmpletsneas, or wfnlnena of the Information contalned in thin report, or that the use of my information. appuabrs. method. or prwena dlnclosed in this report may not infringe priv8tely 04 rlghta or
8. Asmmes my UabiUties with respect to the use of, or for damages resultlq from *e use of any hformation. mmratue. metbod, or process dinclosed in this report.
As uwd in the e v e . "per- lctlag on behalf of the Commisdon*~ includes my em- ployee or cootractor of the Commission, or employee of such eontractor. to the axtent that auch employee or contrsctor of the Commlssioa, or employee of mch contractor preparss. dl#scmfrutea. or provides accesn to. my information pursuaut to hi. employment o r contract with the Commlsaion. or hi# employment with ouch eontractor.
MAY 1969
OAK RIDGE,NAflONAL LABORATORY Oak Ridge, Tennessee
operated by UNION CARBIDE CORPORATION
for the U. 5. ATOMIC ENERGY COMMISSION
k
c 3
t
a c U
ACKNOWLEDGMENTS
This report is the culmination of the efforts not only of the authors, but of several associates,
specialists, and artisans whose names understandably do not appear on the cover. Many of these
colleagues have contributed in a significant manner, so that special acknowledgments are in
order.
Much of the experimental work which is reported has been performed on a remarkably defect-
free specimen, bar No. 23. This sample, along with a similar sample of the base stock, gave
considerable insight into the effects of permeability reduction by fluid impregnation techniques.
The selection of these samples fell totally to W. H. Cook and J. L. Griffith. We are likewise
grateful to these two for performing the thankless task of maintaining a detailed record of the
location, fate, and identification of various surveillance specimens which were employed in re-
lated in-pile investigations. Without these records it would have been virtually impossible to
resolve several discrepancies which arose in the course of this study. With the assistance of
M. D. Allen, Mr. Cook has a lso been involved in the selection, preparation, and interpretation of
some of the photomicrographs which appear in this report.
All of the graphite specimens which were used in this work were prepared by L. D. Love.
He also serviced the permeability apparatus and was responsible for the design, fabrication,
and testing of special leak-tight specimen holders which were employed. These aspects were
most critical to the present work.
Some of the permeabi€ity measurements and the attendant calculations were performed by two summer participants, D. E. Bruins, a student a t Carnegie Institute of Technology, and D. M.
Bolinger, a student at Manchester College.
Special thanks are also due to Carol A. Proaps and Ruby N. Thurmer for their patience and cooperation in the Preparation of this manuscript, Finally, we wish to acknowledge the efforts
and cooperation of many other colleagues whose contributions were perhaps of lesser importance
but nonetheless instrumental in preparing this report.
iii I

Y
4 3
CONTENTS
Acknowledgments .................................................................................................................................... iii
Abstract ............................................................ ....................................................................................... 1
I. Introduction .................... ............ ........................ ............ .......
11. Nomenclature .........................................................................
111. Description of the MSRE Graphite ............................................................... ........................ 4 The Base Stock ............................................................................................................................ 4 Multiple Impregnations ................................................................................................................ 5 Microscopic Examinations .......................................................................................................... 5
IV. Effect of Impregnation Treatment on Flow Properties ..... ............................................
Comparison of Base Stock and Impregnated Graphite ............................. General Considerations ................................................... Characterization Parameters ............................. Flow Parameters ................................................. Comparison of Results ......... ,.................
Variation of Structural and Flow Properties with Limitations of Sampling Procedures ............... Density Determinations ..................................... Total Porosity Determinations ...... ...................
. . . . . . . . . . . . . . Porosimetry Determinations ....................................... ..................................
Permeability Determinations ...................................................................................................... Basic Considerations ............................................................................................................ Procedure ................................................................................................................................ Results.. . . . . ._. . . . . . . . . . . .. . . . . . . . . .. . . _. . . . . . . . . .. . . . . . . . . . . . . . . . . . . . . .. . . . . . . . . . . . . .. . . .. . . . . . . .. . . . . . . . . . . . . . . . . . . . . . . .. . . . . . . . . . . . . . . .
10 10 10 10 11 11 14 14 16 16 17 20 20 22 24
V. Theoretical Description of Gaseous Fission Product Transport in MSRE Moderator Graphite ...................... .............................................................................................. 26
General Description of Diffusion with Sink Terms .................................................................. 26
Steady-State Transport in Uniform Porous Media .................................................................... 28
Steady-State Transport in Nonuniform Porous Media (MSRE Graphite) ................................ 28
VI. Related Studies ............................................................................................................................ 33 Early Investigations ...... ...... ................ ............ .............. .......... ............ ............ .......... .. ............ .... 33
5Xe Migration in the MSRE .................................................................................................... , 35 36
40 41
Graphite Surveillance Specimen Results .................................................................................. ORR Molten-Salt In-Pile Loop 2 ........................................................................ ........ ................ Reconciliation of Flow and In-Pile Results ............................................................................
V
vi
VI1 .
VIII.
Discussion .................................................................................................................................... Short-Range MSRE Considerations ............................................................................................ Features Relative to MSBR Application .................................................................................. Useful Approximations in Describing Gas Transport Through Porous Media ...................... Summary ........................................................................................................................................
Appendix. ................................................................................................................................................
Moderator Graphite .................................................................................................................... Partial Survey of the Gas Transport Characteristics of the MSRE
43
44
45
47
50
52
52
L J
v*
t
7
b
c V
I
GAS TRANSPORT IN MSRE MODERATOR GRAPHITE
II. EFFECTS O F IMPREGNATION
111. VARIATION O F FLOW PROPERTIES
R. B. Evans Ill J. L. Rutherford A. P. Malinauskas
ABSTRACT
A detailed investigation of the gas transport characteristics of MSRE moderator graphite has been conducted. These studies demonstrate that the impregnation treat- ments which had been applied for purposes of permeability reduction yield a material which is nonhomogeneous with respect to gas transport. For the specimen on which the most extensive measurements had been made, the inhomogeneity imparted to the sample as a result of impregnation was such that the characteristic transport coefficients were found to increase apphoximately exponentially from the surface to the core of the graphite.
A l l of the moderator graphite which was surveyed was sufficiently impermeable that gas transport at conditions of reactor operation could be approximated reasonably well by considering only the free-molecule or Knudsen mechanism, although the overall variieon of the Knudsen transport coefficient was observed to be of the order of lo3. /
A simple mathematical model was developed to predict the transport characteristics of fission product gases in the MSRE graphite. Comparison with in-pile experimental data yielded amazingly good agreement for the short-lived isotopes. On the basis of this com- parison, it appears feasible to eliminate expensive sectioning and counting techniques employed to determine concentration profiles of the fission products in the MSRE moderator graphite in favor of gas transport measurements for those species which have noble-gas precursors. W e hasten to note, however, that in-pile experiments have special merit in other respects; for example, they yield information about nuclides that do not have gaseous precursors.
c *.
W
I. INTRODUCTION
In the original design concepts of the Molten-Salt Reactor Experiment (MSRE), intrusion of the
salt and the gaseous fission products into the moderator graphite was considered to be an in-
tolerable contingency. For this reason a material with very small pore diameters was specified,
and very low permeability coefficients were requested. To meet these requirements, it is neces-
sary to include additional, special treatments in the graphite fabrication process.
These treatments commonly entail impregnation of the graphite with a suitable fluid which
is then decomposed within the graphite to produce a char. However, a material whose permeability
(or penetrability) has been lessened in this manner is logically expected to exhibit a fair degree
1
2
of inhomogeneity, s ince the impregnation technique should be particularly effective at the sur-
face, but becoming less effective as one proceeds inward.
This view, after confirmation through exploratory experiments, suggested that a detailed in-
vestigation be made of the gas transport characteristics of the MSRE graphite. Accordingly, we had undertaken a task of this nature and have carried the studies as far as is practicable at the
present time.
Our original intent was to proceed in three phases. The first of these primarily concerned a review of the theoretical and experimental aspects which would be encountered throughout the
course of the studies, as well as several permeability and counterdiffusion experiments of a
scoping nature. This aspect forms the content of Report I.' Although the results of Report I were limited and impregnation effects were not considered, the data were nonetheless significant.
As an example, one of the main findings was that normal diffusion effects (which ar ise from gas-
gas, as opposed to gas-surface, interactions) can be ignored in gas transport computations under
the operational conditions of the MSRE. This result simplifies the mathematical description of
the problem considerably.
The effects of impregnation on gas transport had been taken up in the second phase of the study, and this aspect constitutes a major portion of the present report. In particular, we sought
first to investigate the nature of the inhomogeneity of the graphite which results from impregnation
and, second, to ascertain whether or not such an inhomogeneity could significantly affect the
migration and retention characteristics of gaseous fission products within the graphite moderator.
The final phase of the study was to involve a detailed survey of the gas flowcharacteristics
of the MSRE graphite. In essence, we sought to examine the reproducibility of the gas transport
characteristics from sample to sample. However, after due deliberation, and partly because of
our previous experience with similarly impregnated graphites in connection with early versions of
high-temperature gascooled reactors, we concluded that the expenditure of time and effort which
would be required in order to derive meaningful results simply was not justified. We therefore
terminated the work at essentially the conclusion of the second phase; however, a partial survey
of the MSRE graphite had been made, and the results are presented here.
The report can be divided into five major sections. In the first of these we describe the
base stock (before impregnation) and the actual MSRE graphite and speculate to some extent on
the method of fabrication. Next, the base stock and the impregnated, material a re compared from
the standpoint of gas transport. Inhomogeneity of the latter is also discussed at th i s t ime. These
results are then analyzed in terms of the behavior of short-lived fission products which had been
observed in various samples of 'MSRE graphite. The fourth part, on the other hand, is a discus-
sion of our findings as reviewed from short-range MSRE considerations and longer-range MSBR
'A. P. Malinauskas, J. L. Rutherford, and R. B. Evans 111, Gas Transport in MSRE Moderator Graphite. I. Review of Theory and Counterdiffusion Experiments, ORNL4148 (September 1967). A more detailed description of the theoretical aspects appears in the paper by E. A. Mason, A. P. Malinauskas, and R. B. Evans 111, J . Chem. Phys. 46, 3199 (1967).
Y
L
i
-
(4 ' C
e
c
I
3
(molten-salt breeder reactor) considerations. Finally, the significant results are summarized in
the fifth section.
II. NOMENCLATURE
In order t o provide a ready reference, we have tabulated in this section the numerous symbols which are interspersed throughout this report.
A Cross-sectional area normal t o gas transport
B o Viscous flow parameter of a porous septum
cg Gas concentration at the surface of a porous medium
d Apparent or bulk density of a porous medium
DjK Knudsen, or free-molecule, diffusion coefficient of gas component j characteristic of a porous septum
through a porous medium; Diz = D Z j D j z Effective diffusion coefficient characteristic of mutual diffusion of the gas pair j-2
Biz Binary free space diffusion coefficient of the gas pair j-2; fij, = 8, D j Overall diffusion coefficient of gas j in a porous septum; (Dj)-' = (DjK) - ' + (Di2)-'
J Molecular flux, the rate of transport of molecules per unit area normal to the transport direction
K j Permeability coefficient of gas component j through a porous septum L Length of a porous medium in the direction of gas flow, that is, the apparent flow
length of the sample
Flow-averaged length of a capillary or pore within the porous medium in the direction of flow; this is the actual flow length characteristic of the septum
Lc
nj Number density of type j molecules
n Total number density of the gas; n =
p Gas pressure ni i
p ( 0 ) Gas pressure on the entrance side of a porous septum p ( L ) Gas pressure at the gas effluent s ide of a porous septum
( p ) Average pressure; ( p ) = (1/2) [p(O) + p(L)] A p Pressure drop; A p = p ( 0 ) - p ( L ) q' Tortuosity factor for binary mutual diffusion in a porous septum; q'= {L, /L)2
ro Pore entrance radius Y Volume
Sj A measure of the relative effect of gas-surface collisions on gas transport; Si = DiK/
et Total porosity or fractional void volume of a porous septum E' Flow porosity, that part of et which actually contributes to gas transport
vi Viscosity coefficient of gas j
( D p + D j J
8 Mercury-graphite contact angle
hi Radioactive decay constant of component j
4
heff Decay constant including burnup; heff = hi + 9 4 Z Surface area of a given pore in a porous medium
CT Surface tension
Q. Neutron capture cross section of species j
4 Neutron flux t
W
111. DESCRIPTION OF THE MSRE GRAPHITE
The Molten-Salt Reactor Experiment utilizes Carbon Products Division (Union Carbide Corpora-
tion) CGB graphite in the form of 6-ft-long bars which have a cross section of 3.08 in.2. The bars
(565 in all) are stacked vertically in the reactor core to yield a graphite moderator volume of 77 ft3. The s ides of each bar are slotted along the entire 6-ft length; these slots constitute the flow
channels for the molten salt.
The Base Stock
Details of the actual fabrication of the moderator material are considered to be proprietary information and thus have not been made available to us. For the present study, however, specula-
tions regarding the fabrication process seem warranted, inasmuch as the results obviously depend
upon the manner in which the material was made. We have therefore liberally construed what
might be at least a reasonable method for fabricating the MSRE graphite in v ie4 of the specifica-
tions and the production techniques described in the open literature.2
If the dimensions of the finished product must adhere to close tolerance specifications, a
major cost i t em in the production of graphite is machine work. This remains true even if special
procedures and materials must be employed in the manufacture of the graphite. Standard machin-
ing practice therefore allows us to fix the dimensions of the starting bil lets (or base-stock bars)
in the neighborhood of 2.5 in. x 2.5 in. x 6 ft. These values have recently been verified by meas- urement. The desire for maximum crystallite perfection suggests that the green mix employed to
fabricate the base stock be composed of needlecoke graphite flour with a coal-tar pitch binder.
Photomicrographs indicated that the flour was “fine grained.” In view of the size of the billets,
a logical choice for forming the mix is extrusion; this s e t s the binder-flour weight ratio at about
3/10. After forming, the billets are baked t o about 1OOOOC to produce a material with a density
around 1.56 g/cm3 and a porosity of about 25%. The stock is then impregnated with a light pitch
and graphitized at 280oOC in an Acheson furnace. At this stage the graphite characteristically
has a density of about 1.70 g/cm3. The base stock employed in the present work was found to
have an average density of 1.67 g/cm3 and a porosity of 21%. (Henceforth this base stock will
be denoted as CGB-BS.)
%ee, for example, W. P. Eatherly and E. L. Piper, “Manufacture (of Graphite),” chap. 2, pp. 21-51 in Nuclear Graphite, R. E. Nightingale, ed.. Academic, New York, 1962.
t
. V
bj
5
It has been established that a base stock suitable for impregnation must possess pores with
sizes that range closely about a well-defined distribution peak;3’ CGB-BS meets this requirement.
It a lso has very large, but widely dispersed, voids that we term “vugs.” These vugs are well connected t o the overall open-pore system; thus small specimens used in certain characterization
evaluations were selected to avoid as many vugs as possible. Examination of impregnant residues within regions that originally constitute vugs in the base stock permits reasonable speculation
as to the impregnation schedule.
Mu I ti ple lmpregna tions
Once the base stock with suitable pore sizes has been acquired, the success of subsequent
impregnation treatments is governed by the proper selection of the impregnant and careful control
of the heat treatments. In each succeeding impregnation it becomes increasingly difficult t o
force the impregnant into the pores, because their size and number become smaller than they
were in the previous treatment. Similarly, the heat treatment necessary to decompose the im-
pregnant in the pores becomes more crucial; the rate of the operations must be retarded to avoid
pressure buildups and s t resses which invariably lead to spalling and fracture of the stock.
W e now speculate about the types of impregnant which might be employed. Pitch yields well-
graphitized residues but is difficult to inject, whereas fluids which can be readily injected frequently yield rather poor residues. Obviously the latter would be chosen for the final im-
pregnations, but the early impregnations would utilize pitch. Furfuryl alcohol polymers are
a logical choice for the final impregnation treatments, since the viscosities of these fluids
can be adjusted over a sufficiently broad range by careful control of phosphoric acid catalyst
concentration and preimpregnation temperatures.’ Ideally, the alcohol would break down in
the following manner:
10000c HC-CH II II H A
HC C - & - OH (2H, + H,O + CO) + 4C (amorphous char) . \I A - 0
(Polymer intermediates have not been shown in this simplified formula.) Permeability reductions of about lo4, a s a result of furfuryl alcohol impregnation treatments, have been cited in the
l i t e r a t ~ r e ; ~ comparisons between the base stock and the impregnated graphite, presented later,
are in reasonable agreement with the reduction factor cited.
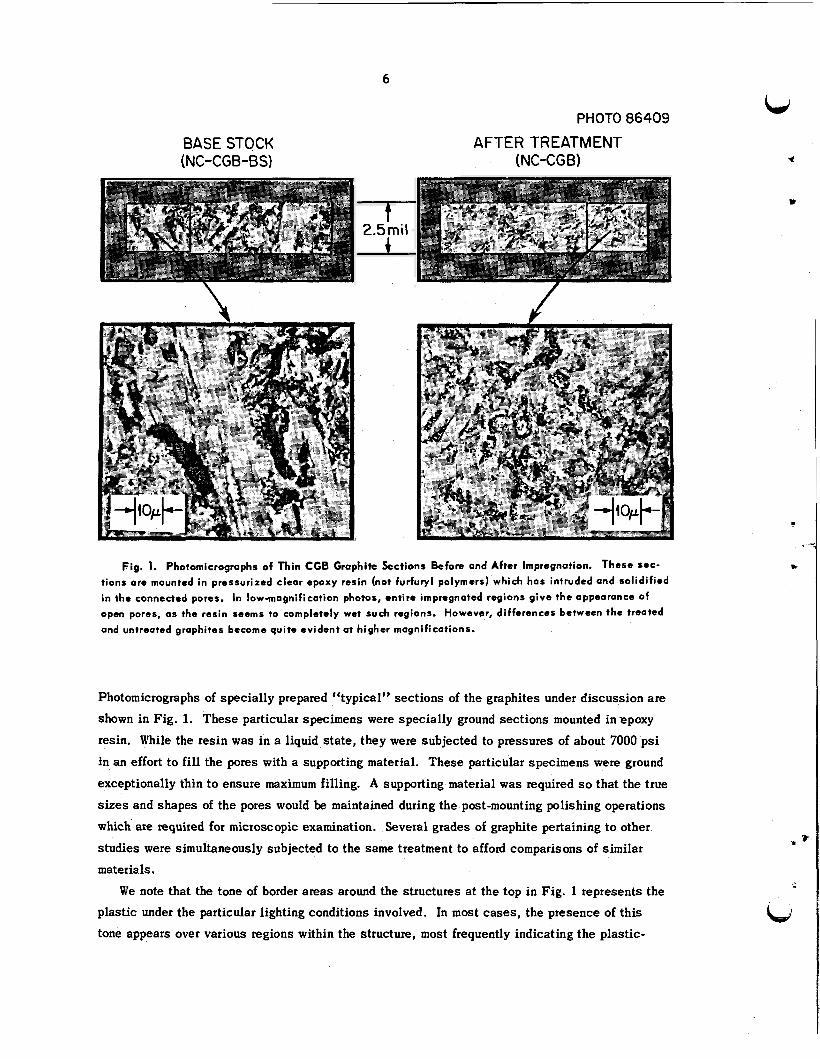
Microscopic Examinotions
Inspection of photographs of base stock before and after treatment turns out t o be one of the
most revealing methods for demonstrating the structural changes resulting from impregnation.
3L. W. Graham e t e l . , “The Development of Low Permeability Graphite for the Dragon Reactor Experi- ment,” Proceedings of the Fifth Carbon Conference, vol. II, pp. 387-404, Pergamon, New York, 1963.
6
PHOTO86409
BASE STOCK (NC-CGB-BS)
AFTER TREATMENT (NC-CGB)
t “t““
Fig. 1. Photomicrographs of Thin CGB Grap..ite Sections Before and After Impregnation. These see-
tions are mounted in pressurized clear epoxy resin (not furfuryl polymers) which has intruded and solidif ied in the connected pores. In Iow-magnification photos, entire impregnated regions give the appearance of open pores, as the resin seems to completely wet such regions. Howevor, differences between the treated and untreated graphites become quite evident at higher magnifications.
Photomicrographs of specially prepared “typical” sections of the graphites under discussion are
shown in Fig. 1. These particular specimens were specially ground sections mounted in epoxy
resin. While the resin was in a liquid state, they were subjected to pressures of about 7000 psi
in an effort to fill the pores with a supporting material. These partictdar specimens were ground
exceptionally thin t o ensure maximum filling. A supporting material was required so that the true
sizes and shapes of the pores would be maintained during the post-mounting polishing operations
which are required for microscopic examination. Several grades of graphite pertaining to other
studies were simultaneously subjected to the same treatment to afford comparisons of similar
materials.
We note that the tone of border areas around the structures a t the top in Fig. 1 represents the
plastic under the particular lighting conditions involved. In most cases, the presence of this
tone appears over various regions within the structure, most frequently indicating the plastic-
7
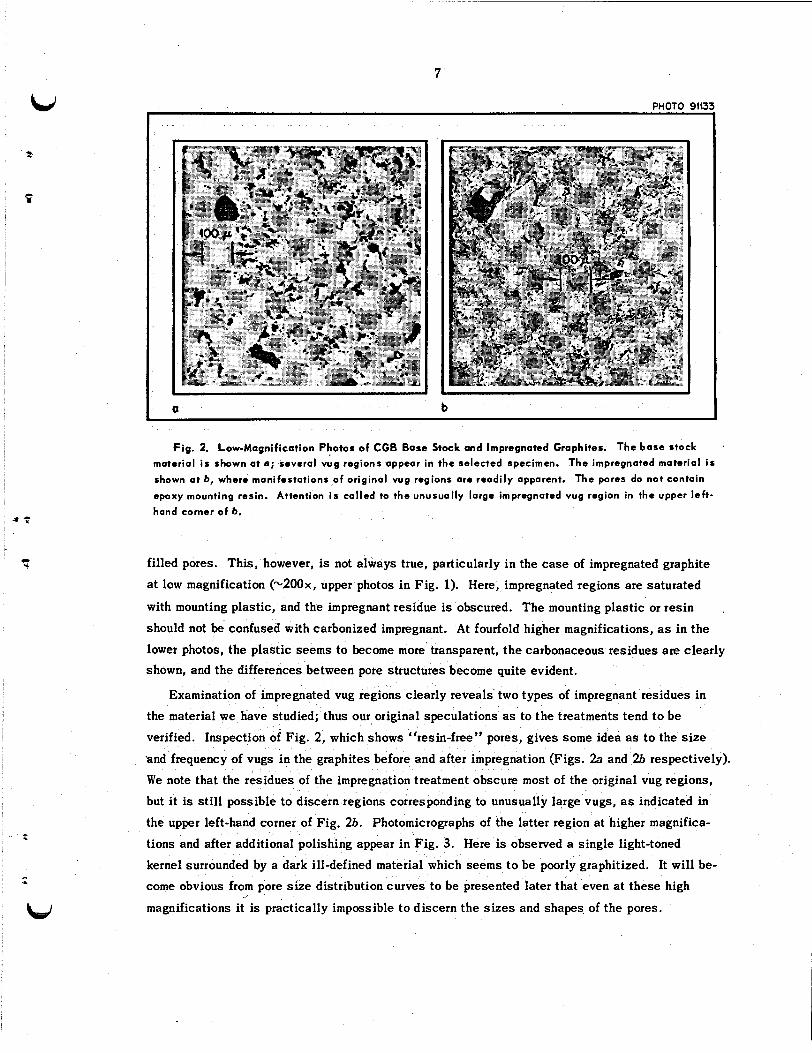
PHOTO 9t13
I
b a
Fig. 2. Low-Magnification Photos of CGB Base Stock ond Impregnated Graphites. The base stock
material i s shown a t a; several vug regions oppear in the selected specimen. The impregnated material i s
shown a t b, where manifestations of original vug regions are readily apparent. The pores do not contain
epoxy mounting resin. Attention i s called to the unusually large impregnated vug region in the upper left- hand corner of b.
c c
filled pores. This, however, is not always true, particularly in the case of impregnated graphite
a t low magnification (*2OOx, upper photos in Fig. 1). Here, impregnated regions are saturated
with mounting plastic, and the impregnant residue is obscured. The mounting plastic or resin
should not be confused with carbonized impregnant. At fourfold higher magnifications, as in the
lower photos, the plastic seems to become more‘ transparent, the carbonaceous residues are clearly shown, and the differences between pore structures become quite evident.
.
Examination of impregnated vug regions clearly reveals two types of impregnant residues in
the material we have studied; thus our original speculations as to the treatments tend to be
verified. Inspection
,and frequency of vugs in the graphites before and after impregnation (Figs. 2a and 2b respectively).
We note that the residues of the impregnation treatment obscure most of the original vug regions,
but i t is sti l l possible to discern regions corresponding to unusually large vugs, a s indicated in
the upper left-hand corner of Fig. 2b. Photomicrographs of the latter region at higher magnifica-
tions and after additional polishing appear in Fig. 3. Here is observed a single light-toned kernel surrounded by a dark ill-defined material which seems t o be poorly graphitized. It will be- come obvious from pore size distribution curves t o be presented later that even a t these high
magnifications i t is practically impossible t o discern the s i zes and shapes of the pores.
Fig. 2, which shows “resin-free” pores, gives some idea a s t o the size
8
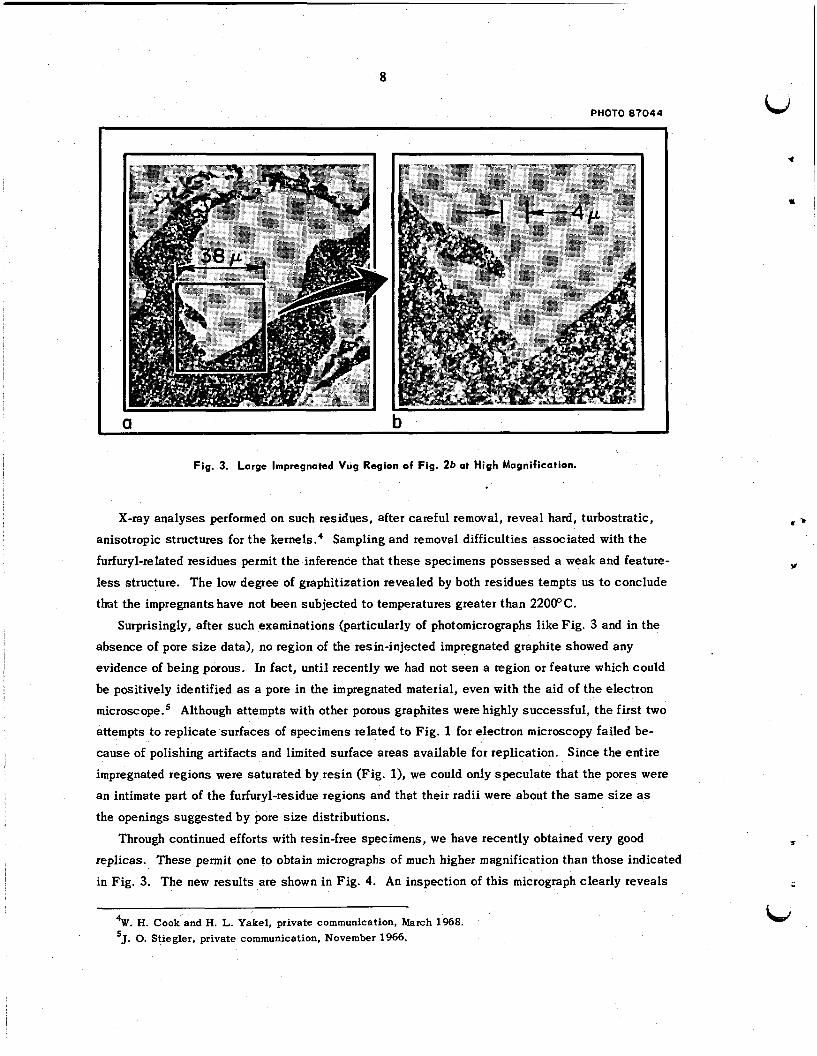
PHOTO87044
a
Fig. 3. Large Impregnated Vug Region of Fig. 26 at High Magnification.
X-ray analyses performed on such residues, after careful removal, reveal hard, turbostratic,
anisotropic structures for the kernels.' Sampling and removal difficulties associated with the
furfuryl-related residues permit the inference that these specimens possessed a weak and feature-
less structure. The low degree of graphitization revealed by both residues tempts us to conclude
that the impregnants have not been subjected to temperatures greater than 22000C. Surprisingly, after such examinations (particularly of photomicrographs like Fig. 3 and in the
absence of pore size data), no region of the resin-injected impregnated graphite showed any
evidence of being porous. In fact, until recently we had not seen a region or feature which could
be positively identified as a pore in the impregnated material, even with the aid of the electron
m i c r o ~ c o p e . ~ Although attempts with other porous graphites were highly successful, the first two
attempts to replicate surfaces of specimens related to Fig. 1 for electron microscopy failed be-
cause of polishing artifacts and limited surface areas available for replication. Since the entire
impregnated regions were saturated by resin (Fig. l), we could only speculate that the pores were
an intimate part of the furfuryl-residue regions and that their radii were about the same s i ze as
the openings suggested by pore size distributions.
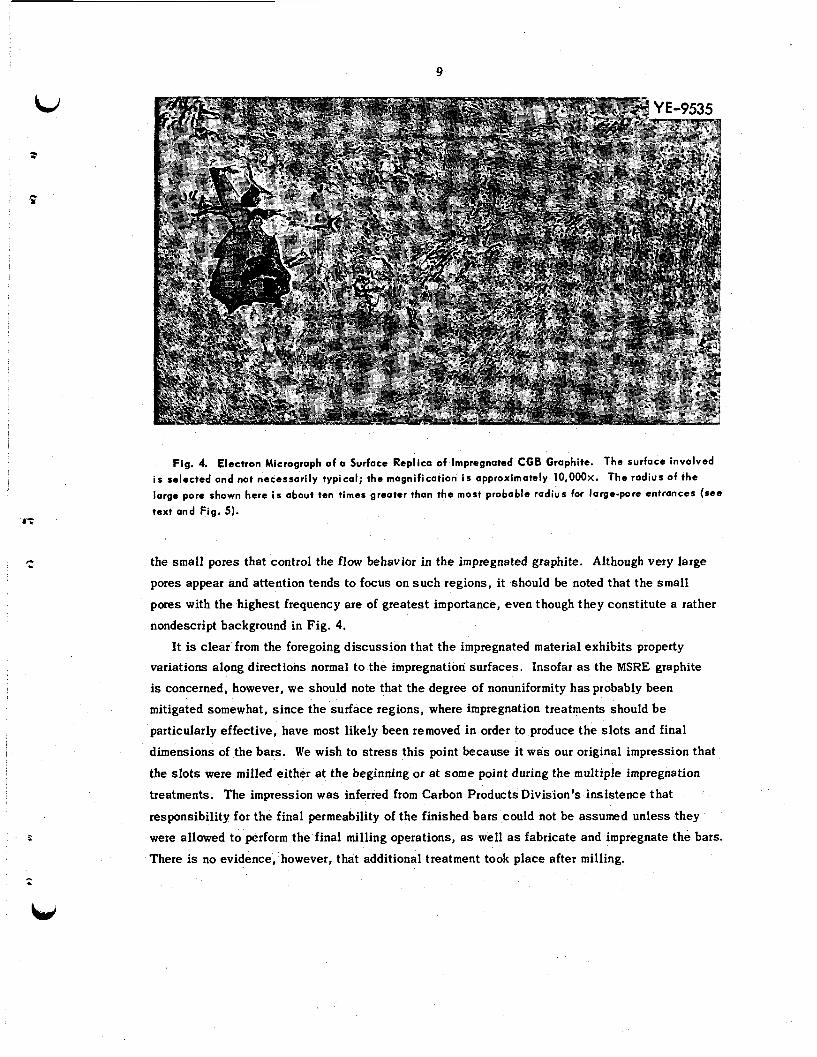
Through continued efforts with resin-free specimens, we have recently obtained very good
replicas. These permit one to obtain micrographs of much higher magnification than those indicated
in Fig. 3. The new results are shown in Fig. 4. An inspection of this micrograph clearly reveals
4W. H. Cook and H. L. Yakel, private communication, March 1968. '5. 0. Stiegler, private communication, November 1966.
t -
V
L,
9
Fig. 4. Electron Micrograph o f a Surface Replica of Impregnated CGB Graphite. The surface involved
i s selected and not necessarily typical; the magnification i s apprbximately 10,000~. The radius of the
large pore shown here i s obout ten times greater than the most probable radius for large-pore entrances (see text and Fig. 5).
the small pores that control the flow behavior in the impregnated graphite. Although very large
pores appear and attention tends to focus on such regions, i t should be noted that the small
pores with the highest frequency are of greatest importance, even though they constitute a rather
nondescript background in Fig. 4.
It is clear from the foregoing discussion that the impregnated material exhibits property variations along directions normal to the impregnation surfaces. Insofar as the MSRE graphite
is concerned, however, we should note that the degree of nonuniformity has probably been
mitigated somewhat, s ince the surface regions, where impregnation treatments should b e
particularly effective, have most likely been removed in order to produce the s lots and final
dimensions of the bars. We wish to s t ress this point because i t was our original impression that
the slots were milled either a t the beginning or a t some point during the multiple impregnation
treatments. The impression was inferred from Carbon Products Division’s insistence that
responsibility for the final permeability of the finished bars could not be assumed unless they
were allowed to perform the final milling operations, as well as fabricate and impregnate the bars.
There is no evidence, however, that additional treatment took place after milling.

10
cd IV. EFFECT OF IMPREGNATION TREATMENT ON FLOW PROPERTIES
9 Comparison of Base Stock and impregnated Graphite
General Considerations. - In the preceding sections we have presented visual evidence con-
cerning the effects of impregnation on CGB graphite structures. While this is pertinent and of
interest, we are primarily concerned with the manifestations of impregnation treatments in a
quantitative sense. Although the ultimate objective is to ascertain wriations as a function of
position in an impregnated bar, we shall first compare flow-related properties of base stock with
those of impregnated materials presented in Report I. This approach has the particular advantage
of demonstrating a maximum variation in values but is somewhat awkward in that we must pre-
maturely preempt some definitions which would otherwise appear in other sections; thus it is
immediately necessary to consider the subject of nonuniformity of the flow specimen studied in
Report I. The specimen used for these experiments was machined from the central portion of a
bar that possessed a minimum number of large-scale defects and cracks (bar 23, lot 1). The cor- responding data were treated as though they were representative of a more or less uniformly im- pregnated material, even though this was not the case.
To recapitulate, our purpose in this section is t o compare the properties of the impregnated
sample just described with like properties of the base stock in order t o demonstrate the overall
effect of impregnation on the gas transport characteristics of the graphite. W e wish t o re- , , ,
emphasize, however, that the impregnated-sample data should be considered as representative of
Characterization Parameters. - The first parameter we shall compare is the density d; next is
a material which has been subjected to moderate degrees of uniform impregnations. I
, I
I the total porosity as “seen” by fluids (fraction of th$ bulk volume comprising connected pores), and third, the so-called pore size distribution fqnction f E ( r O ) . The latter is of particular
usefulness in our work; it is defined so that it represents the fraction of the total porosity et associated with pores having entrance radii between ro and ro + dr,. Thus
I
00 $0 fE(rO) dr, = 1 .
Many porous materials display a multidisperse pore structure in that the distribution function
exhibits several maxima. In such cases it is convenient to divide the distribution function into
several parts, corresponding to the distribution in pore sizes about given maxima. These dis-
tribution functions are defined by the relations
c 8
R
1 dEi f iE(rO)= -(T) , i = 1 , 2 , ... ,
E t (3)
11
* -. c I
m 4
W
in which ei is the porosity contribution from the pores assigned to the ith group. The maxima
frequently appear at considerably different values of the pore entrance radius, so i t is generally
not too difficult to make the apportionment.
Flow Parameters. - We demonstrated in Report I that only three parameters are required to completely specify the gas transport characteristics of a porous medium. These are the viscous
flow parameter B o , the Knudsen diffusion coefficient D j K for any experimentally convenient gas
j , and the diffusion coefficient D j , which describes the diffusion characteristics of any gas pair
j-1 through the septum. In addition, i t was a l so shown how these parameters can be obtained
experimentally; the first two coefficients are derived from determinations of the pressure depend-
ence of the permeability coefficient K j of given samples to a single pure gas j . The permeability
coefficient relates to pressure in the following manner:
where ( p ) is the arithmetic average of the pressures p ( 0 ) and p(L) on the two s ides of the
sample and ‘Ij is the viscosit‘y coefficient of the gas.
The third coefficient, D j l , on the other hand, can be obtained from only a few measurements
of the counterdiffusion process for any two gases j and 1 through the septum under isobaric,
isothermal conditions. Accordingly, just a few measurements of this kind involving base stock
were made in the present study. The reader is referred to Report I for further details regarding
procedures, equations, etc. Our present interest in D j , stems from the fact that this parameter
gives an indirect measure of the fraction of pores actually engaged in a linear flow situation;
that is, we are interested in the ratio ( E ’ / q ’ ) which appears in the equation
in which Io,, is the so-called “free space” diffusion coefficient. Unlike D j r , the quantity is independent of geometry. (Details regarding the experimental determination of the free space
diffusion coefficient are adequately described elsewhere.6)
We wish also t o point out that the porosity E’ should not be confused with the total porosity
Et introduced earlier. It is unfortunate that both quantities carry the same nomenclature, but
Et refers to the total interconnected void volume, whereas E’ is only that part of et which is in- volved in gas transport. Furthermore, E’ cannot be determined directly; in the simplest case,
Eq. (S), i t appears as the ratio (c’/q’). In the majority of graphites that we have encountered,
the quantity (Wet) ( E ’ / q ’ ) ranges between 1W2 and lo-’. Comparison of Results. - Nominal values of the characterization and flow parameters for
each of the two types of graphite are listed in Table 1. First , we note the 12% increase in bulk
density of the treated material and the 57% decrease in the nominal porosity values, the latter
6A. P. Malinauskas, J . Chem. Phys. 42, 156 (1965); 45, 4704 (1966).
12
Table 1. Nominal Values of the Characterization Parameters of CGB Graphite
Before and After Impregnation
Base Stock Impregnated Graphite (C GB-BS) (C GB)
Bulk density, g/cm3 1.67 1.87
Apparent solid density, g/cm3 2.09 2.05
Connected porosity,' % of bulk volume
Pore entrance radius a t porosity distribution peaks, p
21.4
At primary peak 0.85 At secondary peak 0.01
Porosityb associated with pore-size distribution, % of bulk volume At primary peak 17.3 At secondary peak 3.0
9.2
0.080 0.01
7.2 3.1
Modified viscous flow parameter (Bo/?) for helium a t 23OC, c m z sec-' atm-l 1.57 X lo-' 5.18 x 10⁻⁵
Knudsen diffusion coefficient DiK for helium a t 23OC, c m 2 / s e c
1.43 x lo-' 4.70 x 10-~
Normal diffusion coefficient D for the pair He-Ar 1.04 x 10⁻² 7.00 x 10-~ i t
a t 23OC and 1 atm pressure, c m 2 / s e c
*Determined by helium expansion. 'Determined by mercury injection; see Fig. 5.
having been determined in each case by the standard gasexpansion method.' The information in
Table 1 relative to pore s i zes and their distribution is clarified by an examination of the distribu-
tion plots shown in Fig. 5, where typical bidispersed systems for graphite are displayed. The
upper plot represents the porosity distribution function for the base stock, where maxima occur
a t about 0.85 and 0.01 p. The lower plot illustrates themaxima exhibited by the impregnated
material a t about 0.08 and 0.01 p. Insofar as characterization parameters are concerned, a ten-
fold reduction in the size of the primary (large) pores is one of the major effects of the impregna-
tion. (The reader should note that a split abscissa with two scales has been employed for the
base stock plot at the top of the figure in order to show the entire dispersion of the primary large-
pore peak in a proper perspective and also that the ordinates differ by a fivefold scale.) :
There are virtually no pores which contribute to the porosity of the base stock in the region
between 0.1 and 0.5 p. Also, the primary pores account for 85% of the total porosity of the base
stock. For impregnated graphite, however, a fair amount of overlap between the two maxima is
in evidence. Nevertheless, the primary mode sti l l represents about the same percentage (70%) of the total available porosity. We should note further that our experience with these and other
'C. G. Rall, H. C. Hamontre, and D. B. Taliaferro, Determination of the Porosity by a Bureau of Mines Method, U.S. Bur. Mines, Rept. Invest. 5025 (July 1953).
Fig. 5.
l4 I
13
O L E o 0
60
50
40
30
20
Oo om om 006 008 0 1 0.12 a14 016 om 02 022 024 ro. PORE ENTRANCE RADIUS (PI
Effect of Impregnation on the Distribution of Pore Entrance Radii in CGB Graphiter. Upper plot, base stock; lower plot, impregnated material.
graphites suggests that the percent of bulk volume associated with secondary peaks ranges about a constant value of approximately 3% of the bulk volume, even though the primary values
might vary considerably. We conclude that the size or number of the secondary pores is not
altered by the impregnation treatments; but the diffusion and flow behavior are nearly always
controlled by the primary, not the secondary, pores. Therefore, since primary pores sustain the
highest degree of alteration via impregnation treatment, i t is not surprising that we found marked
differences in the diffusion and flow behavior of the two graphites cited in Table 1. We shal l reserve further discussion of the flow parameters in Table 1 for the general discus-
sion, since our major objective here is to demonstrate, on a magnified scale, some of the less dramatic variations one might expect along the radial direction of an impregnated bar. One may
anticipate in the latter case that the density would remain essentially constant and the porosity
could change slightly, but the pore size distributions (and diffusion coefficients) might vary
appreciably.
14
Varjation of Structural and Flow Properties with Position
Limitations of Sampling Procedures. - So far we have demonstrated that the overall effect
of impregnation, even for a “poorly impregnated” material, is a significant decrease in the large- sized pores in the graphite and consequently a marked permeability reduction of the material t o
fluids. In this section we consider the extent of permeability reduction; that is, we examine the
structural and flow properties as a function of position from the surface to the core of the bar.
Thus it is pertinent to review the history of the source material which we employed in the
previous and present investigations. We received a 15-in. section’ of the original 6-ft bar 23. X-ray analyses of this section revealed that the bar was of exceptionally good quality in compari-
son to some of the other source materials available to us, even though there were two s m a l l
cracks approximately 4 in. from each end of the 15-in. section. We selected an unusually good
portion for the fabrication of a 6-in. diffusion cell and a 2-in.-OD porosity plug, data for which
appear i n Report I. After fabricating these two specimens, some 6 in. was available for the present investigation,
thus precluding a study of variations along the bar axis; we were limited therefore to a study of properties along the equivalent radius. Nevertheless, the axial variations could be estimated by
comparisons of the present data with comparable data which were reported for the specimens of
Report I. A study of property variations as a function of position demands small specimen sizes that
would produce results equivalent to differential measurements. However, the need for small
sizes must be balanced by the need for good representation of the material, particularly when the
presence of macroflaws is suspected. Acquisition of representative samples is of great im-
portance in permeability (diffusion) studies. For these reasons, we chose to fabricate two ser ies
(and types) of specimens.
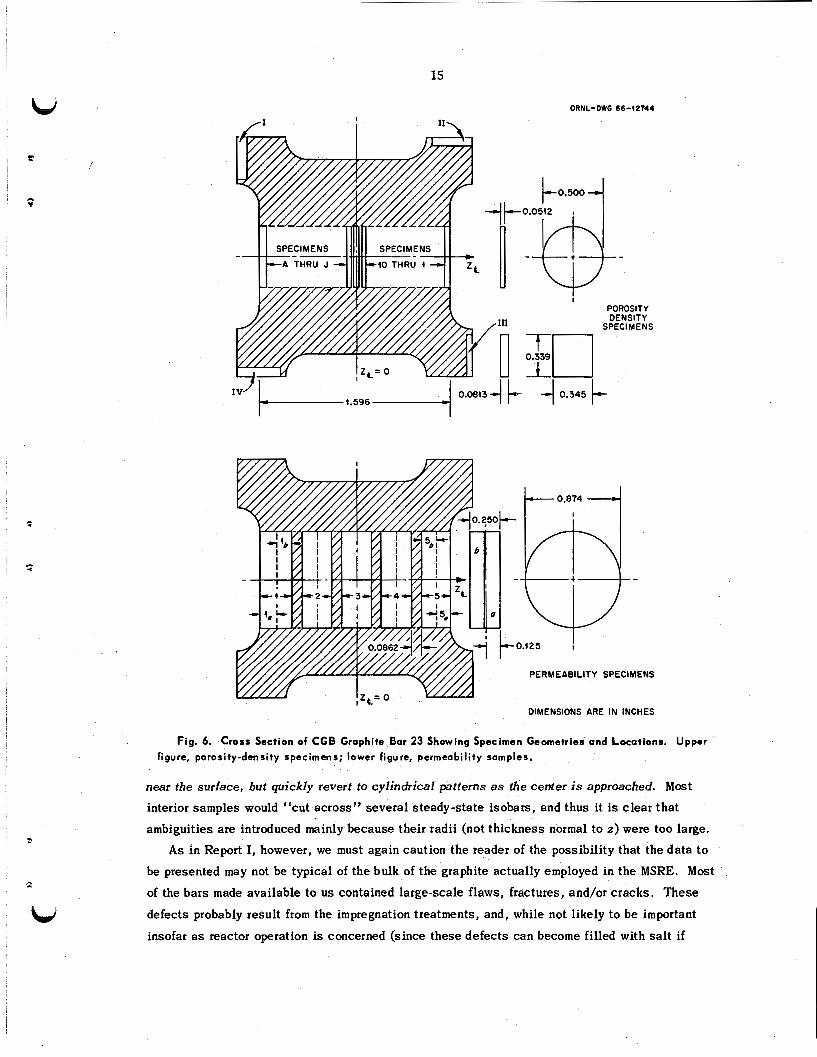
The first series, shown at the top of Fig. 6, comprised relatively small specimens that were
used for density and porosity determinations. Samples from both s ides of the midpoint were ob-
tained to ascertain the degree of symmetry of the property variations. Each of these samples was
smaller than a dime. Such sizes could be employed for porosity and density determinations be-
cause of the availability of a suitable volumetric mercury-porosimeter pressure cup and the rela-
tive insensitivity of these parameters to macrocracks and fractures (not, however, to poorly im-
pregnated vugs). Specimens comprising the second series, shown at the bottom of Fig. 6, were considerably
larger than the density-porosity samples, for reasons given above. Although it might seem that
a weakness of the sampling technique might s t e m primarily from employing large increments
(thicknesses) along the z direction, this is not the case. When a steady-state flow pattern is
visualized, wherein the outer surface of an entire bar is held at a constant potentia1 while a sink
or source acts at the center of the bar, one realizes that the isobars fend to be nearly rectangular
I
T
z
h-, ‘The specimen bar was furnished by W. H. Cook, April 1964.
ORNL-DWG 66-12744
,111
[I I I
POROSITY DENSITY
SPEC1 MENS
4 0.345
DIMENSIONS ARE IN INCHES
Fig. 6. Cross Section of CGB Graphite Bar 23 Showing Specimen Geometries and Locations. Upper figure, porosity-density specimens; lower figure, permeability samples.
near the surface, but quickly revert to cylindrical patterns as the center is approached. Most
interior samples would “cut across” several steady-state isobars, and thus i t is clear that
ambiguities are introduced mainly because their radii (not thickness normal to z ) were too large.
As in Report I, however, we must again caution the reader of the possibility that the data to
be presented may not be typical of the bulk of the graphite actually employed in the MSRE. Most
of the bars made available to us contained large-scale flaws, fractures, and/or cracks. These
defects probably result from the impregnation treatments, and, while not likely to be important
insofar as reactor operation is concerned (since these defects can become filled with sa l t if
16
Table 2. Variation of Density with Location Relative to the Center of a CGB Graphite Bar
(Porosity-Density Specimens)
Density '(gl- 3, Distance from Center'
Lettered Numbered Lettered Numbered
Specimen Identification
(4
I m 3.180 1.874 1.871 . Iv I1 3.180 1.868 1.867 A 1 1.962 1.853 1.865 B 2 1.766 1.854 1.865 C 3 1.570 1.862 1.863 D 4 1.374 1.853 Lost E 5 1.177 1.864 1.864 F 6 0.981 1.860 1.858 G 7 0.785 1.856 1.856 H 8 0.589 1.862 1.861 I 9 0.392 1.859 1.850 J 10 0.1% 1.855 1.856 Center Center 0 1.850 1.850
'Relative position in bar shown in Fig. 6.
near the surface), they do render the samples unsuitable for gas transport characterization. In- spection and selection of the stock we received was performed with these facts in mind, so that
our choice of a particular section of one bar (bar No. 23) was made on the basis of a minimum
number of such flaws.
Density Determinations. - The apparent or bulk density of a regular geometric body is
probably the mos t convenient property to determine accurately; one merely weighs the sample
and then calculates the volume in which the solids are contained from appropriate measurements
of the geometry. The densities derived in this manner for the porositydensity specimens a re
listed in Table 2. All of the samples which were employed t o obtain the density and porosity
data were machined from the graphite bar normal to the extrusion axis; the position, geometry, and
identification of these specimens are shown in the upper portion of Fig. 6.
On preliminary examination, the material as a whole appears to be quite uniform; indeed, the
average density of the bar is 1.86 f 0.03 g/cm3. On closer inspection, however, we note a
slight decrease in density near the center of the bar. This becomes obvious when one compares
results for specimens I-IV with those taken at the center of the bar. Results for all other
samples indicate no definite trends. For a more sensitive test , we now focus on the porosity
determinations.
Total Porosity Determinations: - The porosities exhibited by selected disks of the porosity- density specimens are listed in Table 3. These results have been obtained as an adjunct to
those obtained by the standard mercury-penetration technique, in which mercury is injected into
a previously evacuated sample by compression and the difference in weight of the sample after
?
t
bi
17
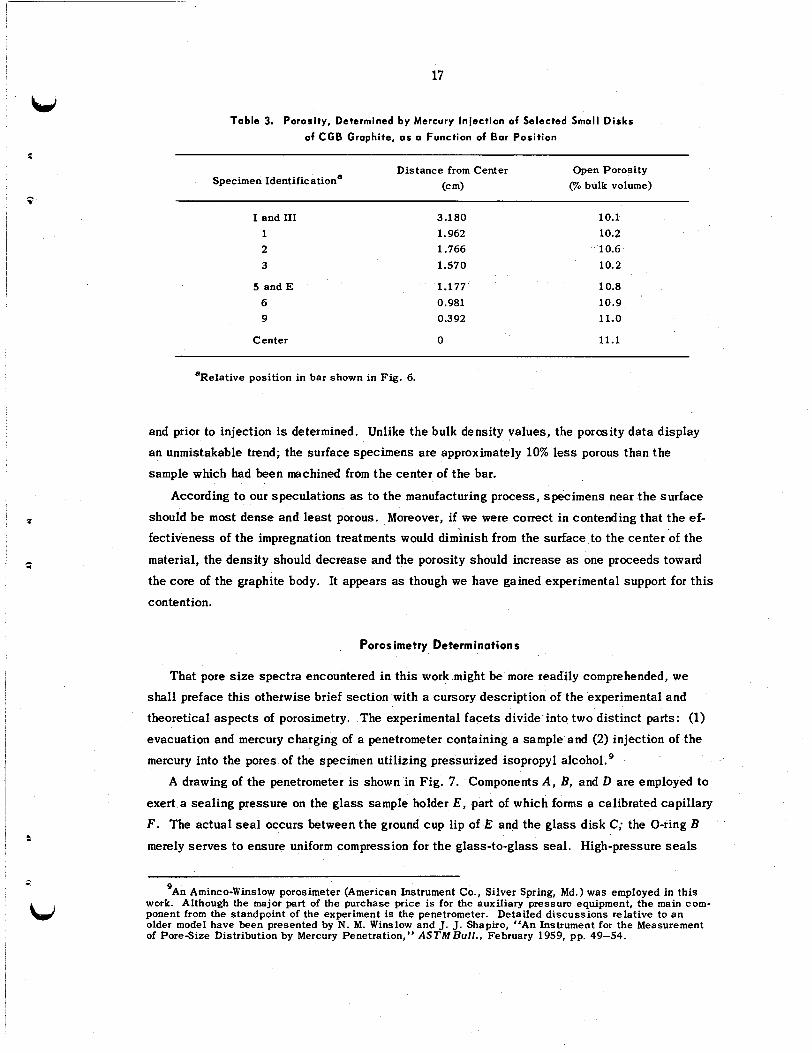
’ :
P
Table 3. Porosity, Determined by Mercury Injection of Selected Small Disks
of CGB Graphite, a s a Function of Bar Position
Distance from Center Open Porosity (70 bulk volume) ( 4 Specimen Identificatione
I and I11 1 2 3
5 and E 6 9
3.180 1.962 1.766 1.570
1.177- 0.981 0.392
10.1 10.2 10.6 10.2
10.8 10.9 11.0
Center 0 11.1
eRelative position in bar shown in Fig. 6.
and prior to injection is determined. Unlike the bulk density values, the porosity data display an unmistakable trend; the surface specimens are approximately 10% less porous than the
sample which had been machined from the center of the bar.
According t o our speculations as to the manufacturing process, specimens near the surface
should be m o s t dense and least porous. Moreover, if we were correct in contending that the ef- fectiveness of the impregnation treatments would diminish from the surface to the center of the
material, the density should decrease and the porosity should increase as one proceeds toward
the core of the graphite body. It appears as though we have gained experimental support for this
contention.
Porosimetry Determinations
That pore size spectra encountered in this work might be more readily comprehended, we shall preface this othetwise brief section with a cursory description of the experimental and
theoretical aspects of porosimetry. The experimental facets divide into two distinct parts: (1)
evacuation and mercury charging of a penetrometer containing a sample and (2) injection of the
mercury into the pores of the specimen utilizing pressurized isopropyl alcohol.
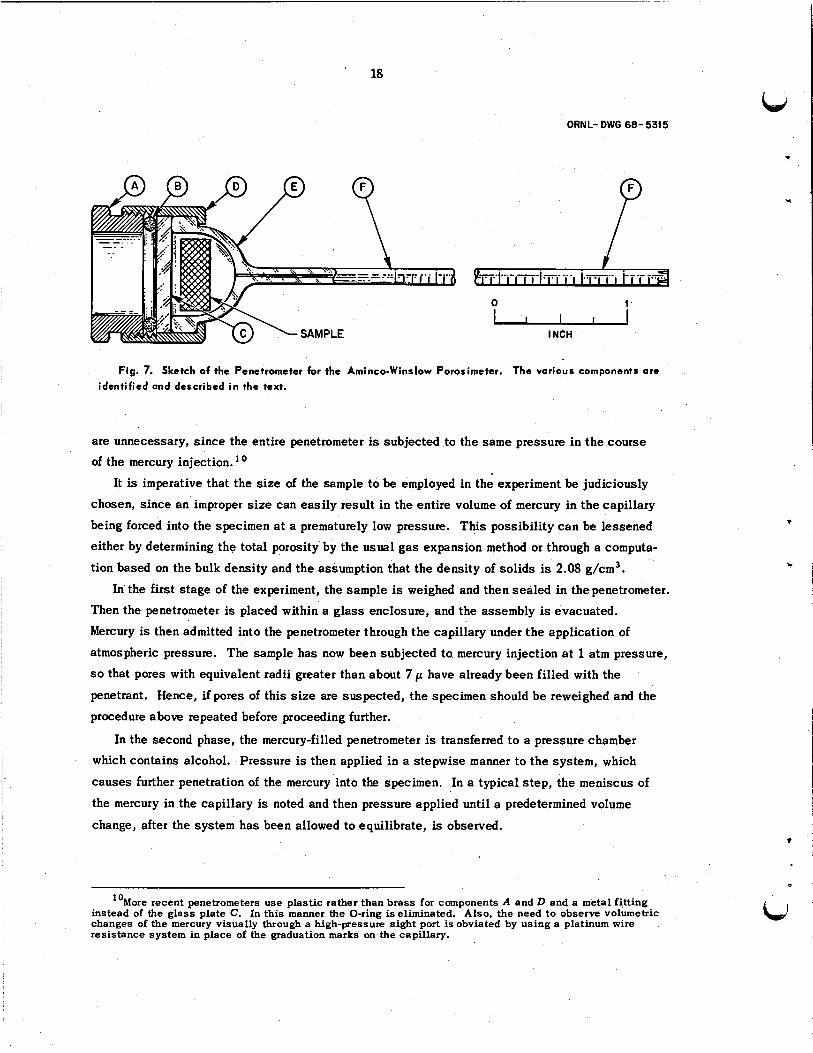
A drawing of the penetrometer is shown in Fig. 7. Components A , B, and D are employed to
exert a sealing pressure on the glass sample holder E, part of which forms a calibrated capillary
F. The actual seal occurs between the ground cup lip of E and the glass disk C; the O-ring B merely serves to ensure uniform compression for the glass-to-glass seal. High-pressure seals
’An Aminco-Winslow porosimetet (American Instrument Co., Silver Spring, Md.) was employed in this work. Although the major part of the purchase price is for the auxiliary pressure equipment, the main com- ponent from the standpoint of the experiment is the penetrometer. Detailed discussions relative to an older model have been presented by N. M. Winslow and J. J. Shapiro, “An Instrument for the Measurement of PoreSize Distribution by Mercury Penetration,” ASTM Bull., February 1959, pp. 49-54.
f
(i
T
U
' 18
ORNL-DWG 68-5315
P --
INCH
Fig. 7. Sketch of the Penetrometer for the Aminco-Winslow Porosimeter. The various components are
identified and described in the text.
are unnecessary, since the entire penetrometer is subjected to the same pressure in the course of the mercury injection.'O
It is imperative that the size of the sample t o be employed in the experiment be judiciously
chosen, since an improper size can easily result in the entire volume of mercury in the capillary
being forced into the specimen at a prematurely low pressure. This possibility c a n be lessened either by determining the total porosity by the usual gas expansion method or through a computa-
tion based on the bulk density and the assumption that the density of solids is 2.08 g/cm3.
In the first stage of the experiment, the sample is weighed and then sealed in the penetrometer.
Then the penetrometer is placed within a glass enclosure, and the assembly is evacuated.
Mercury is then admitted into the penetrometer through the capillary under the application of
atmospheric pressure. The sample has now been subjected to mercury injection a t 1 atm pressure,
so that pores with equivalent radii greater than about 7 p have already been filled with the
penetrant. Hence, if pores of this size are suspected, the specimen should be reweighed and the
procedure above repeated before proceeding further.
"More recent penetrometers use plastic rather than brass for components A and D and a metal fitting instead of the glass plate C. In this manner the O-ring is eliminated. Also, the need to observe volumetric changes of the mercury visually through a high-pressure sight port is obviated by using a platinum wire resistance system in place of the graduation marks on the capillary.
In the second phase, the mercury-filled penetrometer is transferred t o a pressure chamber
which contains alcohol. Pressure is then applied in a stepwise manner t o the system, which
causes further penetration of the mercury into the specimen. In a typical step, the meniscus of
the mercury in the capillary is noted and then pressure applied until a predetermined volume
change, after the system has been allowed to equilibrate, is observed.
CJ
19
The capillarity formula which relates the pore dimension to the applied pressure is given by
v -ocose I: P - =
9
where V represents the volume of a pore which has been filled with mercury a t the hydrostatic
pressure p,
and 8 represents the mercury-graphite contact angle (130 or 1420 is commonly used). In the case of cylindrical pores of radius r and length 1,
is the surface area of the pore, 0 is the surface tension of mercury (473 dynedcm),
V mr21 r
2 2mrI 2 ’ - =-=-
and if we employ this relationship as the definition of the “equivalent pore entrance radius,”
then Eq. (6) takes the form
(7) -20 cos e
ro = P
The experimental data are thus of the form of a series of pore volume - A r o (or Ap) pairs;
these are plotted as a continuous pore size distribution curve by first defining the porosity dis-
tribution function,
:
I
td
1 AV f(E)= - -,
yo Aro
in which V, is the total volume of mercury injected, and by referring each f(e) t o a characteristic radius which is calculated from the relation
i- 1
0 ro = r,” + (Ar0Ij/2 + Z [(ArJiI . (9)
The calculations are made in reverse order; r l represents the pore entrance radius corresponding
to the minimum value of ro as determined by Eq. (7), that is, at the maximum applied pressure,
and the (ArO)j represent succeeding increments.
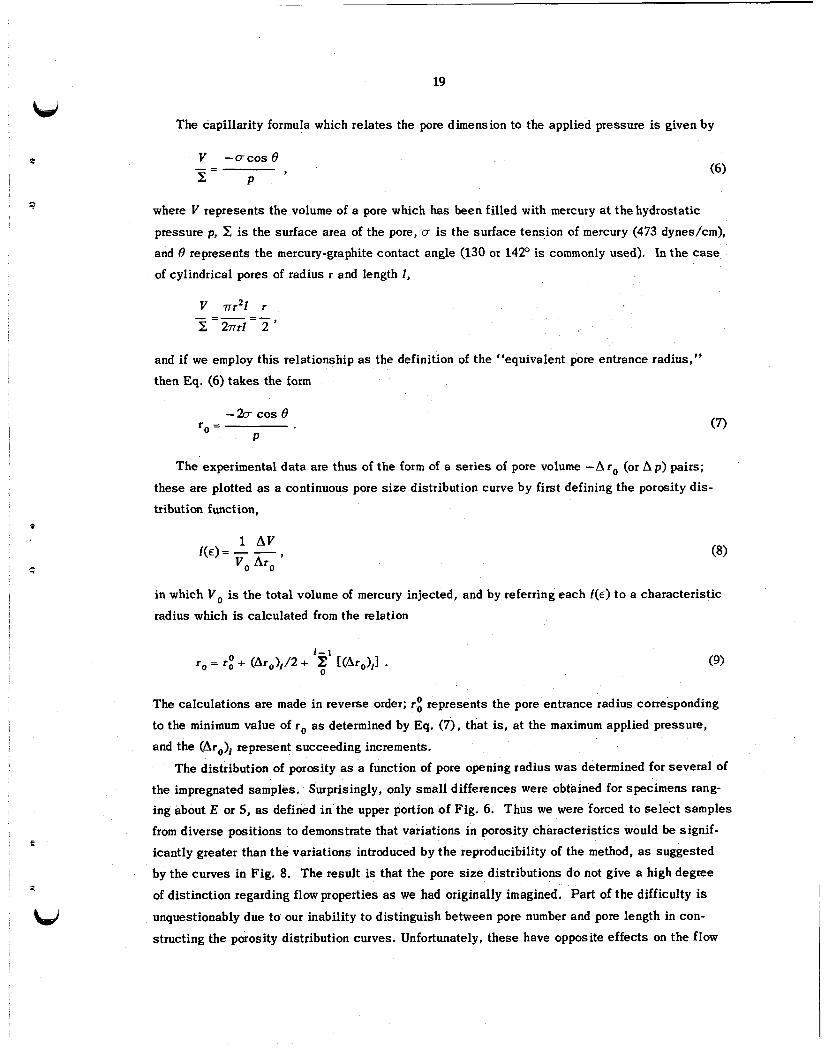
The distribution of porosity as a function of pore opening radius was determined for several of the impregnated samples. Surprisingly, only small differences were obtained for specimens rang- ing about E or 5, as defined i n the upper portion of Fig. 6. Thus we were forced t o select samples
from diverse positions to demonstrate that variations in porosity characteristics would be signif-
icantly greater than the variations introduced by the reproducibility of the method, as suggested
by the curves in Fig. 8. The result is that the pore size distributions do not give a high degree
of distinction regarding flow properties a s we had originally imagined. Part of the difficulty is
unquestionably due to our inability to distinguish between pore number and pore length in con-
structing the porosity distribution curves. Unfortunately, these have opposite effects on the flow
20
ORNL-MNG 66-42745 50 - z
0 SPECIMEN NO. BAR CENTER POROSITY DENSITY I- (VOI% (g/cm3 1 " 40 2 - 3
a. z u 0 - 30 I- *LO
ID
k n
- 0 ILL ---A -------. 3 -la E lw- v) CI 20 E LO
k
a
Y
> k w
v) 0
10
8 0 0 0.02 0.04 0.06 0.08 0.10 0.12 0.14 0.16 0.18 0.20
6, PORE ENTRANCE RADIUS (p)
Fig. 8. Porosity Distribution in Impregnated Graphite Bor 23 for Three Positions Within the Bar.
properties. The fluid measurements themselves thus remain as themost reliable means for de-
termining gas transport properties within a given MSRE bar.
Permeability Determinations
Basic Considerations. - Before proceeding to an examination of variations of the permeability
coefficient with position, it is instructive to again compare the untreated and impregnated speci- mens. The decrease in permeability to helium a t atmospheric pressure due to impregnation may
be defined by the ratio
KHe (untreated) 3 . 0 ~ lo-' cm2/sec 52.2 x lo-' cm2/sec
- - = 5.7x 10² , KHe (treated)
in which the values presented in Table 1 have been employed. This ratio is less than the lo4 reduction which was cited in the description of materials, but i t should be recalled that the
treated sample referred to in Table 1 must be regarded as a poorly impregnated graphite. Reduc-
tion factors which compare favorably with the value above will be encountered in a later portion
of this work. Of more importance is a comparison.of the quantity f
which is a measure of the relative effect of free-molecule and hydrodynamic mechanisms on the overall gas transport in that it denotes the normal fraction of the total resistance. At 1 atm
7
LJ
21
E
pressure, this quantity is found to be only 7% less than the hydrodynamic value of unity in the case of the base stock, but for the impregnated material 6,. = 0.40, a value which is 60% less than the hydrodynamic result.
This effect retains i t s importance even when we convert from helium and argon parameters to corresponding values for typical fission products (e.g., xenon) a t reactor conditions (2.36 a t m
and 936'K, as discussed about Table 6 in Report I). Here i t is found that axe is 91% less than
the hydrodynamic value. Furthermore, the overall coefficient is
DXeK x DXeHe (1.45 x (1.52 x - = 1 . 3 2 ~ 10-4 . (12)
(0.145 + 1.52) x Dxe =
D X e K i- D X e H e
From these values i t is clear that D x e is essentially the same a s the Knudsen coefficient DXeK.
[The subscript jK denotes gas-wall (or dust) collisions of the type described by Knudsen. l 1
These were first investigated experimentally by Kundt and Warburg in 1875 and were studied
theoretically by Maxwell in 1879. 2] From the foregoing discussion, i t is evident that the combination of the impregnation effects
and the characteristically high molecular weights of fission products induces a shift from the
hydrodynamic (or continuum) t o the Knudsen regime as well as a marked decrease in the values
of the diffusion coefficients. In the results reported here, this is significant, because a good
estimate of the diffusion behavior c a n be obtained from permeability measurements alone. T h e
acquisition of such data, however, presents a special problem by virtue of the low permeabilities
encountered.
The permeability coefficient Kj presented in Eq. (4) is actually defined by the differential
form of the permeability equation,
J = -Kj(dnj/dz) , (134
which relates the flux of molecules of type j through the porous medium to the density gradient
causing the transport. The steady-state, isothermal, linear-flow form, to which Eq. (4) relates,
is obtained from Eq. (1%) upon integration:"
A(pV>/At = (A/L)Kj IApl = (A/L) (DjK + Bo( p)/qj) 1 Apl . (13b)
"The following monograph is recommended to the reader who is interested in a discussion of simplified treatments of certain flow and related coefficients: M. Knudsen, The Kinetic Theory of Gases, 2d ed., pp. 21-23, Methuen andCo., Ltd., London, 1946.
291-311, McGraw-Hill, New York, 1938. Implications of these studies are also discussed in ref. 13.
Media, pp. 63-77, Butterworths, London, 1956.
12References to these and other early studies appear in: E. H. Kennard, Kinetic Theory Of Gases, pp.
13This relationship has been exhaustively discussed by P. C. Carmen, Flow of Gases Through Porous
22
The parameter of primary interest for present purposes is DjK. However, since this is the
intercept a t ( p ) = 0, at least two measurements of K j VS( p ) must be made in order t o enable
extrapolation to find values of DjK . large enough so that we could work with a low Ap over a whole range of pressures and sti l l
avoid turbulent flow. The volume rate of flow was measured by a wet-test meter or a bubble-o-
meter under a constant atmospheric pressure.
In the constant-pressure apparatus used in the experimentation for Report I, the specimen was
As mentioned previously in the present work, we encounter a very special probiem regarding
permeability measurements, in that we must attempt a compromise between two contradictory
specifications pertinent to specimen size. To obtain maximum detail as to permeability varia-
tions as a function of position, very small specimens should be employed. On the other hand, to obtain a good average and/or representative value, a large, thick specimen should be employed.
Our compromise is depicted in Fig. 6. Specimens of this size have relatively lowvalues of A / L , and these in turn lead to low flow rates. Thus we are forced to employ systems with evacuated
constant-volume receivers wherein J is measured via small pressure r ises as a function of t ime.
This method enables u s to work with these low permeability specimens. While such systems
were suited to our problems, they have two distinct disadvantages. First, we can stumbleinto
the turbulent region if the permeability is greater than lom3 because Ap is greater than or equal
to 2( p} . Second, a support grid is required to keep the specimen from blowing out under the
sometimes-high Ap employed. In view of these rather drastic differences in procedure from
Report I, we have chosen to describe the procedures and equipment in some detail, particularly
since the permeability measurements represent the heart of our experimental efforts.
Procedure. - The samples with which the variation of permeability with respect to position
was investigated were in the form of cylindrical disks. The identification and thegeometrical
characteristics of the disks are presented in Fig. 6. A view of the mounted permeability specimens and the associated pressure chamber is shown
in Fig. 9. The sample, A , is sealed with epoxy resin, E, to the specimen holder B, which is an
interconnectedgrill fabricated from brass to give the sample support. This holder is in turn
soldered at C to a stainless steel tube D which connects the sample-holding device to the
receiver system. Next, the sample and holder are secured in a two-part brass chamber (F and F ') which screws together and is sealed via a neoprene O-ring G. Swagelok fittings H s e a l the
stainless s teel tubing to the brass chamber and to the receiver system.
After the sample holder is connected into the system a s shown in Fig. 10, the air-contaminated
components are evacuated through the cleanup line through t h e use of a vacuum' pump, and the
system is then flushed with helium. A controlled positive pressure is then applied to the up-
stream side of the sample, while the vacuum pump continues to pump on the downstream side,
until a steady-state flow is established. At this point the vacuum pump is disconnected, and
the pressure rise in the receiver volume is measured. Either a pressure gage or a manometer is
used to measure the constant pressure on the upstream side; a Hastings vacuum gage (for extremely
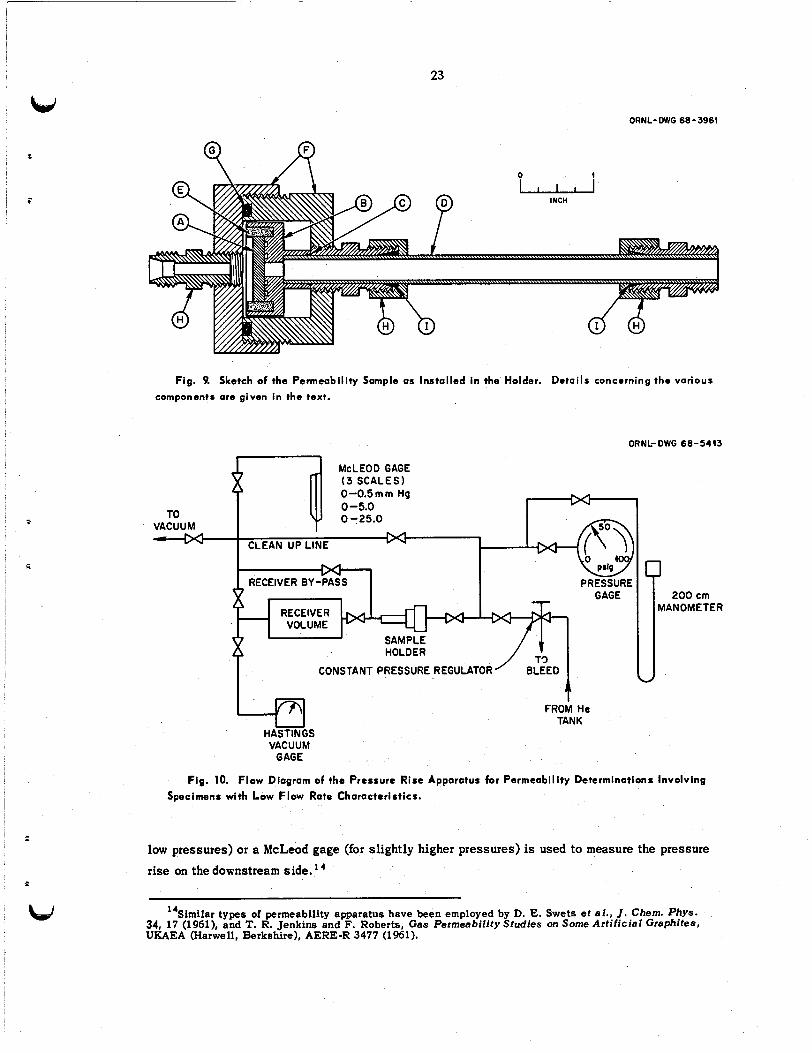
23
ORNL-WVG 68-3961
f
INCH
- Fig. 9. Sketch of the Permeability Sample as Installed in the Holder. Details concerning the various
components are given i n the text.
ORNL-DWG 68-5413
McLEOD GAGE ( 3 SCALES)
I I 1. -1.. ..-. ... r 1
L L t A N UrL lNC
200 cm MANOMETER
RECEIVER VOLUME I GAGE I I SAMPLE
CONSTANT PRESSURE HOLDER REGULATOR /.a.i u 43 HASTINGS
i FROM He
TANK
VACUUM GAGE
Fig. 10. Flow Diagram of the Pressure Rise Apparatus for Pcrmcabil lty Determinations Involving Specimens with Low Flow Rate Characteristics.
low pressures) or a McLeod gage (for slightly higher pressures) is used to measure the pressure
rise on thedownstream side.I4
14Similar types of permeability apparatus have been employed by D. E. Swets e t al., J . Chem. Phys. 34, 17 (1961), and T. R. Jenkins and F. Roberts, Gas Permeability Studies on Some Ar t i f ic ia l Graphites, UKAEA (Harwell, Berkshire), AERE-R 3477 (1961).
24
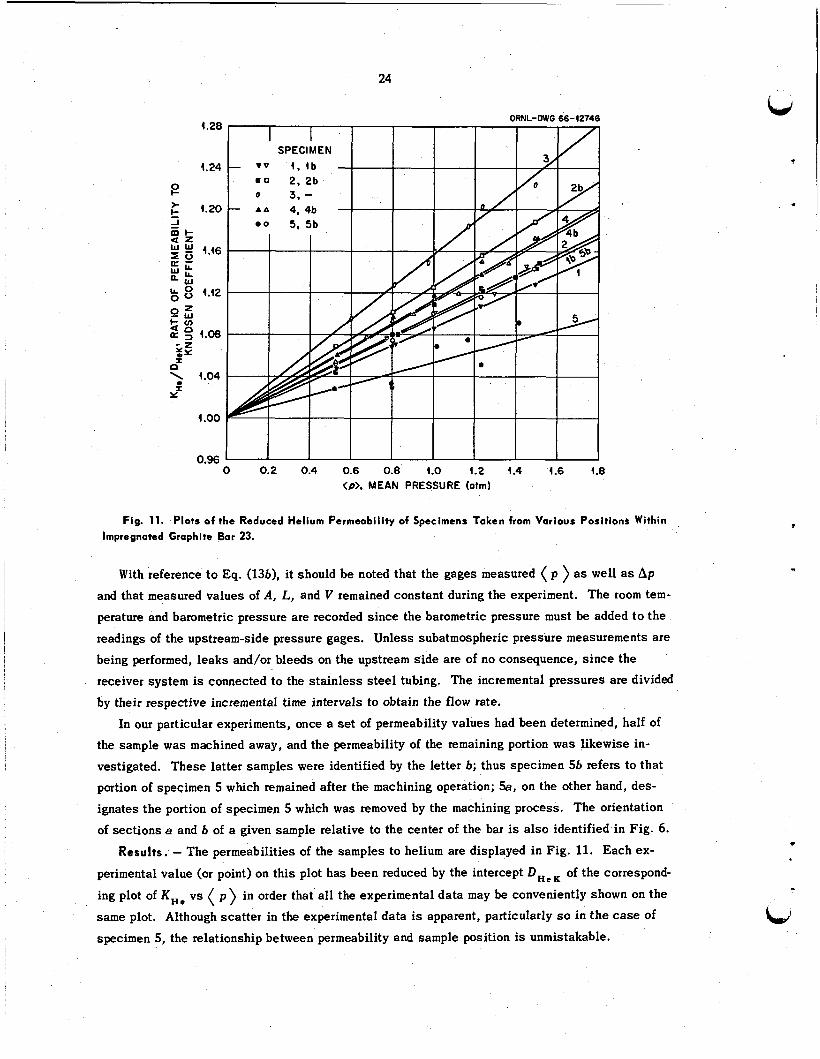
4.28
4.24
e 4.20 c-
4.46
1.12
4.08
4.04
4 .oo
0.96
ORNL-DWG 66-42746
0 0.2 0.4 0.6 0.8 4.0 1.2 1.4 4.6 4.8 <p>, MEAN PRESSURE ( a h )
Fig. 11. Plots of the Reduced Helium Permeability of Specimens Taken from Various Positions Within
Impregnated Graphite B a r 23.
With reference to Eq. (13b), it should be noted that the gages measured ( p ) as well as Ap
and that measured values of A, L, and V remained constant during the experiment. The room tem-
perature and barometric pressure are recorded since the barometric pressure must be added to the
readings of the upstream-side pressure gages. Unless subatmospheric pressure measurements are
being performed, leaks and/or bleeds on the upstream side are of no consequence, since the
receiver system is connected to the stainless steel tubing. The incremental pressures are divided
by their respective incremental t ime intervals to obtain the flow rate.
In our particular experiments, once a set of permeability values had been determined] half of the sample was machined away, and the permeability of the remaining portion was likewise in-
vestigated. These latter samples were identified by the letter b; thus specimen 5b refers to that
portion of specimen 5 which remained after the machining operation; 5, on the other hand, des-
ignates the portion of specimen 5 which was removed by the machining process. The orientation
of sections a and b of a given sample relative to the center of the bar is also identified in Fig. 6. Results. - The permeabilities of the samples to helium are displayed in Fig. 11. Each ex-
perimental value (or point) on this plot has been reduced by the intercept D H c K of the correspond-
ing plot of KHe vs ( p ) in order that all the experimental data may be conveniently shown on the
same plot. Although scatter in the experimental data is apparent] particularly so in t he case of
specimen 5, the relationship between permeability and sample position is unmistakable.
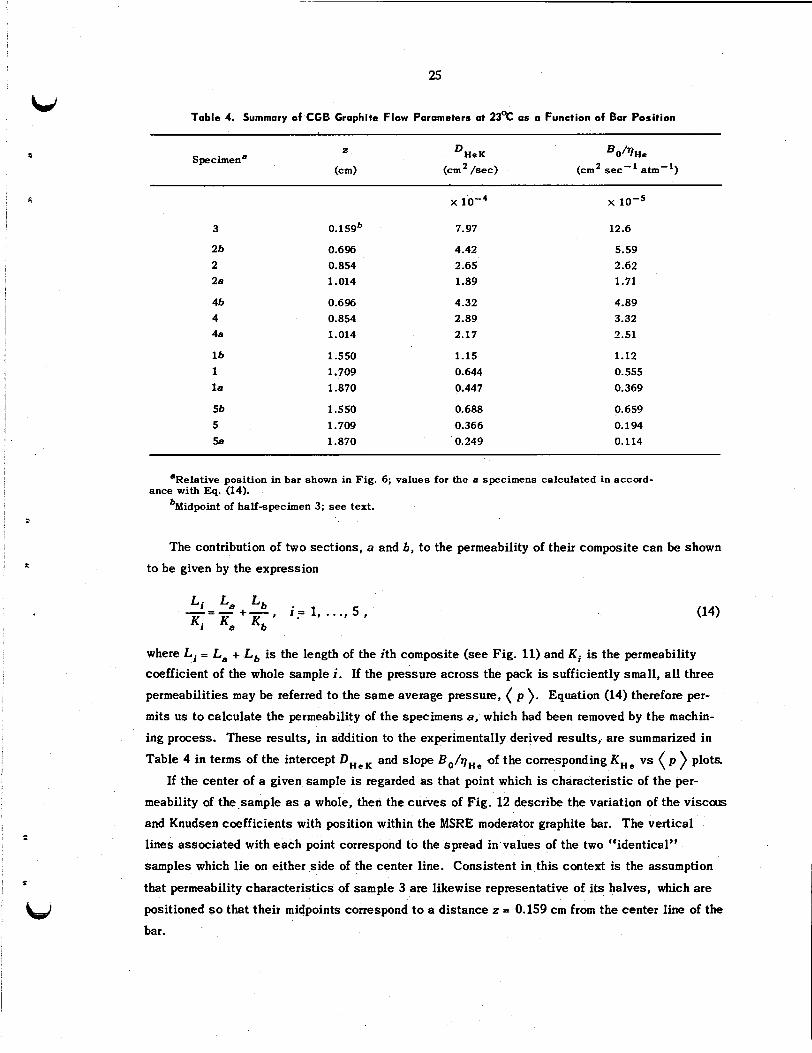
Table 4. Summary of CGB Graphite Flow Parameters at 23% as a Function of Bar Position
Specimen’
3
26 2 2a
4b 4 4a
lb 1 la
5b 5 sa
0.159b
0.6% 0.854 1.014
0.6% 0.854 1.014
1.550 1.709 1.870
1.550 1.709 1.870
x io-‘
7.97
4.42 2.65 1.89
4.32 2.89 2.17
1.15 0.644 0.447
0.688 0.366 0.249
x 1 0 - ~
12.6
5.59 2.62 1.71
4.89 3.32 2.51
1.12 0.555 0.369
0.659 0.194 0.114
*Relative position in bar shown in Fig. 6; values for the a specimens calculated in accord-
%fidpoint of half-specimen 3; see text. ance with Eq. (14).
The contribution of two sections, a and b, t o the permeability of their composite can be shown
to be given by the expression
Li ‘a Lb -=- +-, K i Ka Kb
i? 1, ..., 5 ,
where Li = La + L, is the length of the i th composite (see Fig. 11) and Ki is the permeability coefficient of the whole sample i. If the pressure across the pack is sufficiently small, all three
permeabilities may be referred to the same average pressure, ( p ). Equation (14) therefore per-
m i t s us to calculate the permeability of the specimens a, which had been removed by the machin-
ing process. These results, in addition to the experimentally derived results, are summarized in
Table 4 in terms of the intercept D H e K and slope Bo/qH, of the corresponding K , , v s ( p ) plo ts
If the center of a given sample is regarded as that point which is characteristic of the per-
meability of the sample as a whole, then the curves of Fig. 12 describe the variation of the v i s c a s
and Knudsen coefficients with position within the MSRE moderator graphite bar. The vertical
lines associated with each point correspond to the spread in values of the two “identical”
samples which lie on either side of the center line. Consistent in this context is the assumption
that permeability characteristics of sample 3 are likewise representative of its halves, which are
positioned so that their midpoints correspond to a distance z = 0.159 c m from the center line of the
bar.
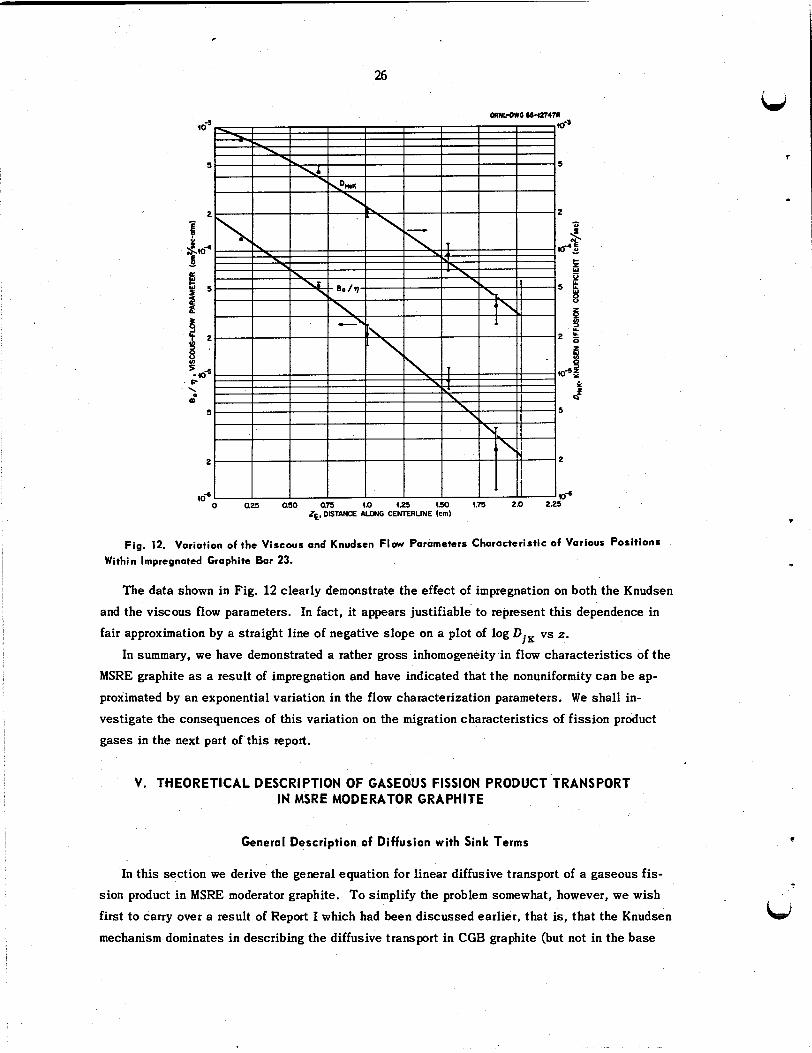
26
Fig. 12. Variation of the Viscous and Knudsen Flow Parameters Characteristic of Various Positions
Within Impregnated Graphite Bar 23.
The data shown in Fig. 12 clearly demonstrate the effect of impregnation on both the Knudsen
and the viscous flow parameters. In fact, it appears justifiable to represent this dependence in
fair approximation by a straight line of negative slope on a plot of log DjK vs z.
MSRE graphite as a result of impregnation and have indicated that the nonuniformity c a n be ap-
proximated by an exponential variation in the flow characterization parameters. We shall in-
vestigate the consequences of this variation on the migration characteristics of fission product
gases in the next part of this report.
In summary, we have demonstrated a rather gross inhomogeneity in flow characteristics of the
V. THEORETICAL DESCRIPTION OF GASEOUS FISSION PRODUCT TRANSPORT IN MSRE MODERATOR GRAPHITE
General Description of Diffusion with Sink Terms
In this section we derive the general equation for linear diffusive transport of a gaseous fis-
sion product in MSRE moderator graphite. To simplify the problem somewhat, however, we wish -
first to carry over a result of Report I which had been discussed earlier, that is, that the Knudsen LJ mechanism dominates in describing the diffusive transport in CGB graphite (but not in the base
27
td stock!). To a good approximation, we can therefore describe the flux J. of any gaseous fission
product j by the relation J
J j = - DiK(dni/dz) ,
where D j K is the Knudsen diffusion coefficient characteristic of component j and ahj/dz represents the gradient of molecular density which causes transport.
If we consider the rate of accumulation of species j in a volume element A dz which is located
about the point z within the graphite, one readily obtains the expression
..
I
W
in which et is the fraction of the bulk volume which is accessible t o the gaseous species and hj is the decay constant of the fission product. [Burnup 'of component j can be handled by merely
redefining hi as = hi + ai+, where q5 represents the neutron flux and 5j is an appropriately
averaged capture cross section. We shall forgo this contingency, however.] It is important to
note the appearance of E t in every term except the diffusion term which contains D j K . This is
frequently a point of confusion, and so we digress momentarily to elaborate on this subject. The
factor Et actually ar ises because we consider a volume element A dz of thegraphite. In count-
ing up the number of j-type molecules, we must of course exclude that volume which is already
taken up by the graphite or is otherwise inaccessible to the j molecules. Thus, for example, the
total number of molecules of type j within the volume element is given by (et A dz)nj. In the
diffusion term, however, we have already provided for this contingency in our definition of D j K ,
so i t s inclusion once again would be erroneous.
Equation (16) is easily recognized as a diffusion equation with a sink term. In order to ob-
tain an expression for the dependence of ni on position and t ime, the equation needs only to be
solved in a manner which is consistent with the appropriate initial and boundary conditions. This can lead to quite complicated expressions in many cases , however, including those of interest
in t h i s work. In a large number of applications, the problem is considerably simplified if only a
steady-state solution is sought, for under this condition
dni/dt= 0 ,
and Eq. (16) reduces to the form
In the next sections we seek solutions of Eq. (18). Note also that we can write Eq. (18) for
every gaseous fission product j; no coupling terms arise (i.e., t e r m s which contain the subscript
i for instance) by virtue of the Knudsen mechanism.

28
Steady-State Transport i n Uniform Porous Media
Here we consider the transport of a gaseous fission product in a slab of a uniform graphite
which can only be penetrated a t the surfaces z = - L and z = + L. Uniformity in this context
implies that D j K and et are independent of position, so that Eq. (18) becomes
d2nj/dz2 - E 1 1 1 n . A . / D j K = 0 . (19)
If the gas concentration is identical a t the two surfaces, our choice of coordinate system
allows us to formulate the boundary conditions
A second consequence of the choice of coordinates is that now only half of the problem, so to speak, need be solved; the two halves are completely symmetrical. Some attention must be given
to algebraic signs, however, since Eq. (15) refers to diffusion in the + z 'direction. Diffusion into
the s lab from the surface z = - L will therefore appear as a positive value of J j , but transport into the s lab from the surface z = + L , since i t is obviously in the opposite direction, will be charac-
terized by a negative value of Jj.
The solution of Eq. (19), subject to the boundary conditions of Eq. (20), can be written in the
form
n j ( z ) = c8 cash (#3jz)/cosh W j L ) ,
where
If we ignore the distinction between positive and negative values of J j , the flux of component j into the graphite is obtained by insertingEq. (21) into Eq. (15) and evaluating the result at the
boundary. In this manner we obtain
J j = tanh [ ( E ~ A ~ / D ~ ~ ) ~ / ~ L I . (23)
Steady-State Transport i n Nonuniform Porous Media (MSRE Graphite)
The situation involving a nonuniform medium likewise begins with Eq. (18), except that two
complications arise. The first of these is a dependence of the void fraction et on position; but
in view of the data given earlier, in which only a 10% variation had been noted, we may, if we
wish, regard this parameter as effectively constant. The second complication, unfortunately,
cannot be dismissed as easily. This concerns the dependence of D j K on position, and, as we
have seen earlier, the dependence is quite marked. In fact, we had suggested the relation
L
.
D j K ( z ) = D j K ( 0 ) e-(?'
29
to describe approximately the variation with position. The equation to which we seek a solution
is thus of the form
where we have indicated those parameters which are functions of distance.
Unfortunately, Eq. (25) is not readily amenable to solution. One can concoct an iteration
technique by which the problem might be attacked, but such methods ordinarily yield series
solutions which may or may not converge rapidly. In the present case we can formally integrate
Eq. (25) twice and, with the aid of the boundary conditions discussed previously, obtain the
formal solution
The second approximation to nj(z) evolves from Eq. (26) by inserting a trial function for nj ( z ) in
the integral expression and performing the indicated operations. As a first approximation, we
can employ the result for the uniform case, Eq. (211, with a constant, but the resultant form of nj (z ) in second approximation already takes on the appearance of a rather formidable com-
putational problem. In addition, although one builds up the solution from both ends simultaneously,
that is, from nj(0) and n.(L), there is no way in which one can test the convergence without
knowing the answer beforehand. This convergence c a n be painfully slow. I
T o gain some concept of the effect of nonuniformity on gaseous fission product transport, l e t us therefore consider a situation in which the nonuniformity is discrete rather than continuous. That is, let the transport characteristics of the medium be given by
DjK = D , , et = E,, 27 2 z 5 L (region 1) ,
< < D j r = D , , et = E,, O = z = a'(region 2) ,
where we have dropped the species subscript and the subscripts K and t in favor of the numerical
subscripts which indicate the regions involved. (Note that we once again consider only half of
the medium. The entire medium is described by placing absolute value signs on Zi and L.) It turns out that an exposition of this particular case provides considerable insight into the
problem a t hand. The physical situation under consideration comprises a s lab of graphite (region
2) which is contacted on each of its two sides with another type of graphite. Insofar as gas
transport is concerned, both graphites are uniform, but each possesses different flow properties.
In line with our experimental results we shall eventually specify that D , > D,.
30
The mathematical treatment of the problem’ ’ proceeds in a manner similar t o that for com-
pletely uniform media, except that two similar solutions of a second-order differential equation
are involved and are now subject to the four boundary conditions ?
n , W = cg ,
n 1 ( 3 = n , G > ,
Dl(dnl /dz)= D,(dn,/dz) at z = Z ,
and
(dn, /dz)= 0 at z = 0.
The solution of the equations is straightforward but tedious. After much manipulation one
obtains the mathematical. expressions
Beta values for several isotopes are listed in Table 5. The values of D , which are required in the calculation were derived from the extreme outer D H e K value (4 x
23, as shown in Fig. 12, and were converted to refer to the particular isotope at reactor tempera-
ture.
cm2/sec) for bar
Although we found it mathematically expedient to position the origin of the coordinate system at the center of the slab, this system is awkward from an applied point of view, particularly since
penetration profiles of fission products universally refer to the ,surface of the graphite as the
origin. To convert to this system, which we hereafter denote the “y-coordinate system,” we merely employ the transformations y = L - z and a = L - B.
”H. S. Carslaw and J. C. Jeager, Conduction of Heat in Solids, 2d ed., pp. 156-57, Oxford University Press, New York, 1959.
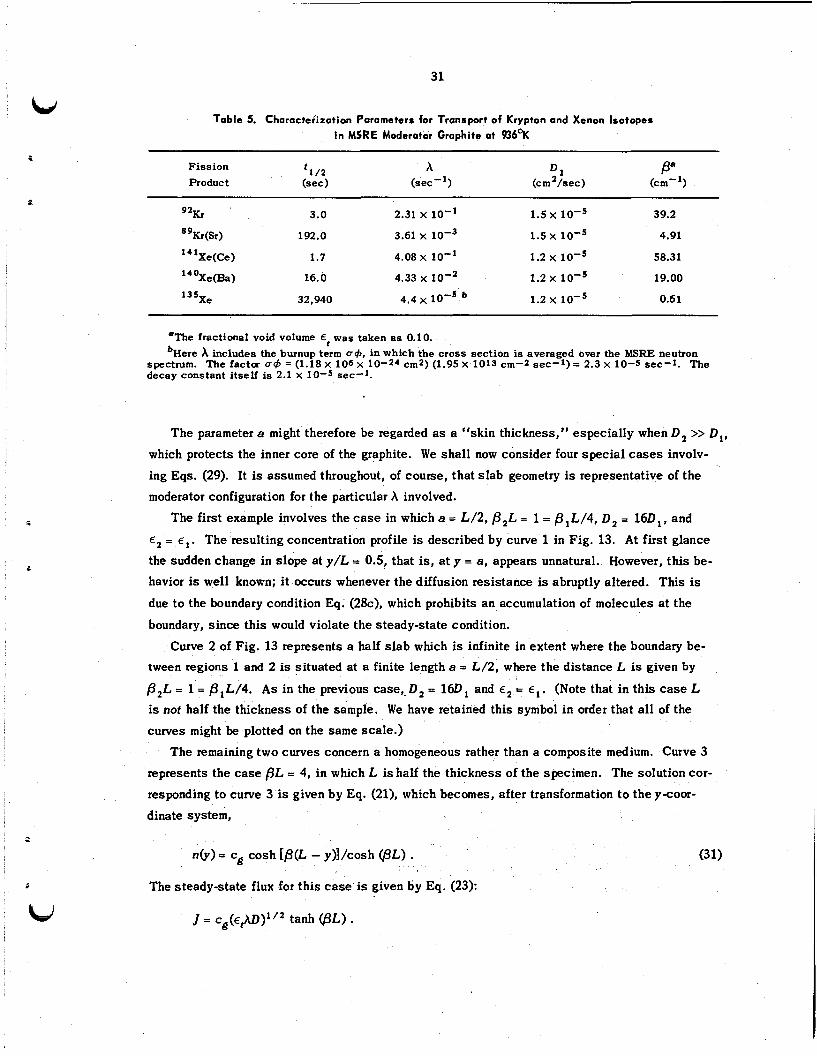
31
L d Table 5. Characteiiration Parameters for Transport of Krypton and Xenon Isotopes
i n MSRE Moderator Graphite at 936%
. B"
(cm-') t l /2 x Dl Fission
Product (sec) (sec - (cm2/sec) _____
9% 3.0 2.31 x 10⁻¹ 1.5 x 1 0 - ~ 39.2
"~r(sr) 192.0 3.61 x 1 0 - ~ 1.5 x 1 0 - ~ 4.91
Xe(Ce) 1.7 4.08 x lo-' 1.2 x 1 0 - ~ 58.31 141
l4 Oxe(Ba) 16.0 4.33 x 10⁻² 1.2 x 1 0 - ~ 19.00
135x, 32,940 4.4 1.2 x 1 0 - ~ 0.61
.The fractional void volume E , was taken a s 0.10. bHere
spectrum. The fac ta e4 = (1.18 x 106 x 10-24 cm2) (1.95 X 1013 cm-2 sec-1) = 2.3 x 10⁻⁵ sec-1. The decay constant itself is 2.1 x 10⁻⁵ sec-1.
includes the burnup term e&, in which the cross section is averaged over the MSRE neutron
The parameter a might therefore be regarded as a "skin thickness," especially when D, >> D,, which protects the inner core of the graphite. We shal l now consider four special cases involv-
ing Eqs. (29). It is assumed throughout, of course, that s lab geometry is representative of the
moderator configuration for the particular A involved.
The first example involves the case in which a = L / 2 , p , L = 1 = P , L / 4 , D, = 160,, and
E 2 = E ~ . The resulting concentration profile is described by curve 1 in Fig. 13. At first glance
the sudden change in slope at y/L = 0.5, that is, a t y = a, appears unnatural. However, th i s be-
havior is well known; it occurs whenever the diffusion resistance is abruptly altered. This is due t o the boundary condition Eq. (28c), which prohibits an accumulation of molecules a t the
boundary, s ince this would violate the steady-state condition.
Curve 2 of Fig. 13 represents a half s lab which is infinite in extent where the boundary be- tween regions l and 2 is situated at a finite length a = L / 2 , where the distance L is given by
@,L = 1 = B , L / 4 . As in the previous case, D, E 160, and eg = el. (Note that in this case L is not half the thickness of the sample. We have retained this symbol in order that all of the
curves might be plotted on the same scale.)
The remaining two curves concern a homogeneous rather than a composite medium. Curve 3
represents the case @ L = 4, in which L is half the thickness of the specimen. The solution cor-
responding to curve 3 is given by Eq. (21), which becomes, after transformation t o theycoor -
dinate system,
The steady-state flux for this case is given tiy Eq. (23):
1 = C ~ ( E & D ) " ~ tanh @ L ) .
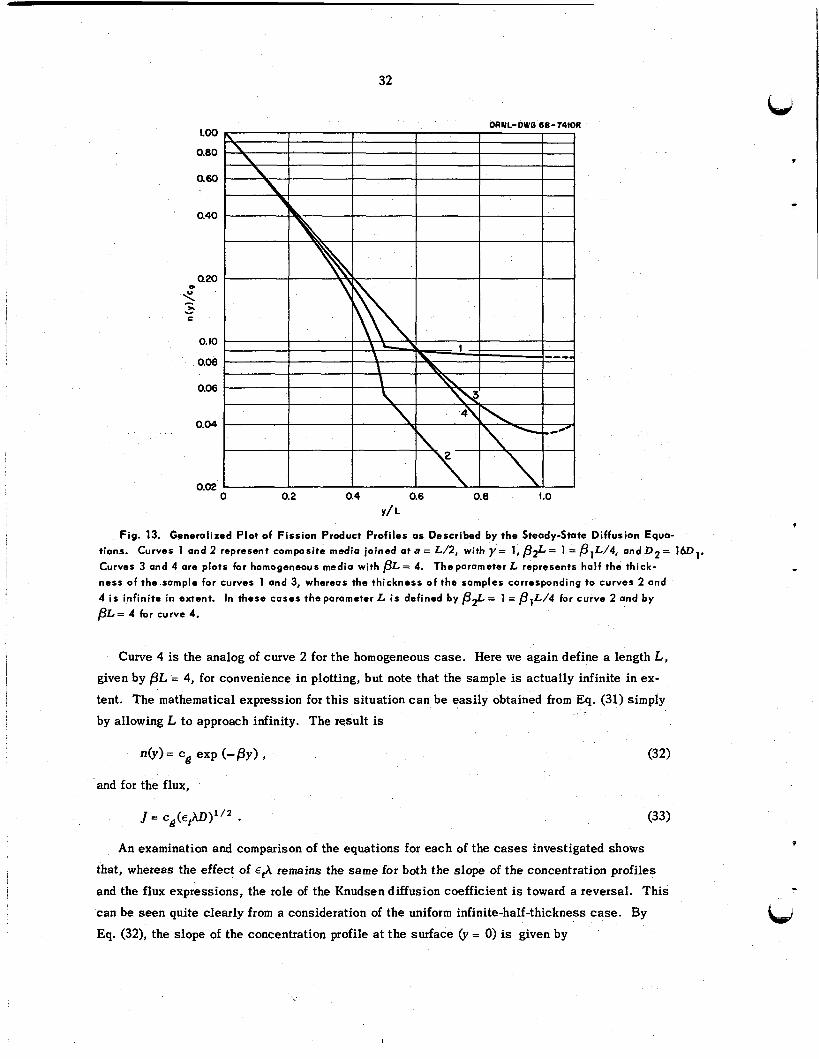
32
ORNL-DWQ 68-7410R Loo 0.80
0.60
0.40
0.20 0
5 Y
c
0.10
0.08
0.06
0 . 0 4 ~ 0.02 0 0.2 0.4 Y/L 0.6 0. 8 1.0
Fig. 13. Generalized Plot of Fission Product Profiles as Described by the Steady-State Diffusion Equa- tions. Curves 1 and 2 represent composite medio joined at B = L / 2 , with y = l , @$ = l = p 1 L / 4 , and D 2 = 1 6 0 1 . Curves 3 and 4 are plots for homogeneous media with PL = 4. Theparameter L represents half the thick- ness of the sample for curves 1 and 3, whereas the thickness o f the samples corresponding to curves 2 and 4 i s infinite i n extent. In these cases the parameter L i s defined by p+ = 1 = p 1 L / 4 far curve 2 and by p L = 4 for curve 4 .
Curve 4 is the analog of curve 2 for the homogeneous case. Here we again define a length L, given by BL = 4, for convenience in plotting, but note that the sample is actually infinite in ex-
tent. The mathematical expression for this situation c a n be easily obtained from Eq. (31) simply
by allowing L to approach infinity. The result is
nO.)= cg exp (-BY) ,
J = C g ( E t h D ) ” 2 .
l
and for the flux,
(33)
An examination and comparison of the equations for each of the cases investigated shows
that, whereas the effect of E& remains the same for both the slope of the concentration profiles
and the flux expressions, the role of the Knudsen diffusion coefficient is toward a reversal. This
can be seen quite clearly from a consideration of the uniform infinite-half-thickness case. By Eq. (32), the slope of the concentration profile at the surface 0. = 0) is given by
U 33
4'
.
_t
W
d d d y = -c,(~,h/D)'/l ;
thus an increase in D reduces the slope. From Eq. (33), however, we see that an increase in D yields an increase in the flux J . This reversal is mitigated somewhat for the bounded cases.
For example, Eq. (31) yields
d d d y = - C , ( ~ / D ) ' / ~ tanh [(EA/D)'/'LI ,
whereas
J = tanh [(d/D)'/'L] . For small values of the argument, we can write tanh u = u, so the two equations are given ap-
proximately by
dn/dy= - c g ~ x L / D , J = c g d L .
In this instance the slope varies inversely as the Knudsen diffusion coefficient, but J is in-
variant to this parameter.
Preparatory to our discussions in later sections of this work, we wish to mention that very
little interest has been given t o the s teady-state diffusion of gaseous fission products with long
half-lives, ' SXe excepted. Most current attention has focused on easily identified, immobile
daughters of short-lived precursors. For these isotopes the total penetrations are much smaller
than the overall thickness of the specimens employed, so that the homogeneous infinite-half-slab
model should be reasonably representative of the experimental conditions. W e shal l therefore
restrict ourselves only to Eqs. (32) and (33) for the remainder of this work. In this connection,
i t is advantageous t o point out that Eq. (32) is a universal function in terms of the reduced
parameters n/c, and p y . In other words, we should be able to fit all the experimental data on a
single curve, regardless of the value of t he Knudsen diffusion coefficient or isotope. The isotope
135Xe, however, should display rather deep penetration. This invalidates the use of a uniform
infinite-half-slab geometry and possibly even linear diffusion. For this isotope a radial, rather
than a linear, flow model might be more appropriate. With these thoughts in mind, we now con-
sider studies of pertinence to this work.
VI. RELATEDSTUDIES
Early Investigations
Before discussing current studies of fission product migration in MSRE graphite, it seems ap-
propriate to review some of the pioneering researches of molten-salt breeder systems as con-
ducted by members of the Reactor Chemistry Division and allied divisions during the period 1958 to 1961. One might regard this period as a sort of interim between the completion of conceptual
design studies and the initial s tages of specifying and producing the MSRE components. As
34
viewed now, the early supporting researches that had particular application t o fission product
problems involved xenon adsorption on graphite,’
chromium migration in container alloys, * alloy-salt compatibility tests,’
neutron losses resulting from
noble-gas solubility in molten salts, ’ and considerations of
5Xe sorption as influenced by moderator graphite characteristics.
Of all these activities, the noble-gas solubility studies’ received the most research atten-
tion because i t was not at all clear a t the outset of the molten-salt reactor program research how
a “spongy” moderator material like graphite might behave in direct contact with the salt and f is-
sion gases. It was therefore presumed that most of the 135Xe would reside in the core in the form
of small quantities of dissolved gases. It turned out that the quantity of xenon dissolved in
molten LiF-BeF, mixtures would be indeed small and that the degree of solubility would de-
crease as the sal t temperature increased. The solubility behavior here was thus quite different
from that exhibited by either CO, in water or H F in fluoride salts, where bicarbonates or bi-
fluorides are formed. In all the systems studied, Henry’s law was followed, and Arrhenitkplots
* permitted a computation of the enthalpy of solution. A simple model relating the free energy of
solution to that required to overcome the salt surface tension associated with the formation of a hole (wherein the gas might reside) gave a good description of the solution mechanism and permitted order of magnitude estimates of the solubility constants.
Investigations of the diffusivity of chromium” and nickel-base alloys were initiated because thermal convection loops indicated marked transfer of the chromium alloy constituent from hot t o
cold zones. Surprisingly enough, metallographic examination of the exposed alloys andCrF,
concentrations in the sa l t suggested that the rate of transfer was controlled by the rate a t which
chromium could move up t o or away from the salt-metal interface; such transfer might beinduced
via reversible redox reactions relative t o the UF,/UF, ratio in the salt.lsb Moreover, an over-
all chromium leaching (not just a transfer) could be induced by the presence of HF, NiF,, or
FeF, in trace quantities. ’ 8c Experimentally derived diffusion coefficients, coupled with the limited amount of equilibrium data available a t that time, along with some reasonable guesses,
permitted one to conclude that corrosion would be minimal unless appreciable amounts of NiF,
or HF were present, particularly if the alloy employed were INOR-8 (now called Hastelloy N).
16M. C. Cannon e t at., Nucl. Sci. EM. 12, 4 (1962). 17(a) G. M. Watson e t at., J. Chem. E @ . Data 7, 285 (1962); (b) M. Blander e t al., J. Phys. Chem. 63,
1164 (1959); (c) W. R. Grimes et at., J . Phys. Chem. 62, 862 (1958). 18(a) R. B. Evans 111 e t at., Self-Diffusion of Chromium in Nickel-Base Alloys, ORNL-2982 (January
1961); (b) W. R. Grimes e t al., “Radio-Tracer Techniques in the Study of Corrosion by Molten Fluorides,” Radioisotopes in Physical Sciences and Industry, vol. 3, p. 559, IAEA, Vienna, Austria, 1962; (c) J. H. deVan and R. B. Evans 111, “Corrosion Behavior of Reactor Materials in Fluoride Salt Mixtures,” Corrosion of Reactor Materials, p. 557, IAEA, Vienna, Austria, 1962.
”The first report of this work, authorized for limited external distribution, was prepared by R. J. Sheil, R. B. Evans 111, and G. M. Watson, Molten Salt-Graphite Compatibility Test. Results of Physical and Chemical Measurements, ORNLCF-59-8-133 (August 1959). Most of the results were later presented with additional data in a report by R. B. Schulze e t el., INOR-8-Graphite-Fused Salt Compatibility Test, ORNL-3124 (June 1961).
,‘The results were initially issued for internal distribution by G. M. Watson and R. B. Evans 111, Xenon Diffusion in Graphite: Effects of Xenon Absorption in Molten Salt Reactors Containin& Graphite, ORNL-CFdl-2-59 (February 1961). The report has since been released for external distribution as ORNL- TM-262 (1964).
. hd
35
In addition to the static and thermalconvection-loop corrosion studies described above, a
long-tetm pump-loop experiment’ was begun on May 9, 1958, and terminated on May 20, 1959. The average experimental temperature was 65CPC, and the salt was LiF-BeF,-UF, (62-37-1
mole %). The objectives were to test salt-alloy-graphite compatibility, with emphasis on the
corrosion of the alloy and behavior of the graphite. As anticipated from earlier results and
thermodynamic calculations, almost negligible amounts of alloy corrosion and/or carburization
occurred. The condition of the 1.91-g/cm3 graphite attracted considerable interest, however, for
only trace amounts of sa l t invaded the graphite matrices; i n fact, 82% of the samples suffered a
minute weight loss, indicating a tolerable degree of erosion. Obviously sal t did not adhere to the
graphite surfaces. Wet analyses gave some idea as to the amount of beryllium and uranium in the
graphite. The mode of their invasion was somewhat complicated by the fact that the as-received
graphite possessed cracks and fractures, a ubiquitous feature of high-density, low-permeability
graphite. Since a flush salt (no uranium) treatment may have filled these cracks initially, i t was
not surprising that the U/Be ratio in the graphite was lower than that of the pumped salt , which
contained * 1 mole % UF,.
Finally, ‘we review the short-term ’ 5Xe poisoning studies and associated out-of-pile experi-
ments where water was used as a make-believe molten salt . This work” entailed a very simple
parametric study carried out with an outdated manual computerized system, a 12-in. sl ide rule.
The study was based on an optimistic first assumption that the pump-bowl stripper would operate
at 100% efficiency. T,his was done in an effort to compensate for the pessimistic second assump-
tion that no resistance film would be present t o help guard against transfer of the xenon poison
from the salt to the graphite. Since i t was realized that the graphite specifications would not
be written specifically to ensure a low gas permeability or porosity (low fluid permeabilities were
specified, however), t he results were expressed in terms of a bypass or recycle ratio t and the
combination D X e X i e , where DXe is the effective diffusion coefficient of xenon relative to the
graphite and
Aie 5 [et(XXe + # ~ r ~ ~ ) / D , , l ” ~
Thus X ‘ i s equivalent t o B as defined by Eq. (22), in which the burnup term 40 is included.
As had been anticipated, a knowledge of the solubility of xenon in the molten sa l t proved to
be invaluable in performing the necessary calculations. Furthermore, i t was clearly pointed out
that Et and D play equal roles in determining the overall behavior and that unless the value
EtDXe were very low, approximately IO-’, the sparging and stripping rates would have t o be quite high and efficient.
13’Xe Migration in the MSRE ’
The 13SXe poisoning investigations were reactivated in 1963, about two years after con-
struction of the MSRE began. The major portion of this work was performed by R. J. Ked1 of the
Reactor Division, although several others participated in and contributed to these efforts. The
b,
i
I i
36
significant advances which resulted from the investigations under discussion involved a con- sideration of transient conditions, that is, cases in which the accumulation term dnj/dt of Eq. (16) is nonzero; refinements of the older studies to provide for bubbles which circulated with
the molten salt ;21 and diffusion of the xenon through the salt itself.
To evaluate the m a s s transfer coefficients which were employed t o describe the xenon-salt
diffusion in both the core and the pump bowl stripper regions, a ser ies of 85Kr addition-stripping
experiments were performed during the barren salt flushing procedures which signaled the startup
of the MSRE operations. One of the more important conclusions regarding these investigations
was the finding that diffusion through the sal t primarily controlled the 35Xe characteristics of
the reactor.
Esentially the same conclusion could have been inferred from our first reported23 Dxe values
for MSRE graphite (viz., 1.32 x
Dxe were considerably less than pected on the part of the graphite in the absence of xenon-salt diffusion (which were called
“film effects”) and/or very high and efficient stripping rates.
cm2/sec) and the previous demonstrationZo that unless
cm2/sec, little or no absorption resistance could be ex-
Repeat computations verified Kedl’s results, not only for the MSRE but for the MSBR (breeder reactor) as
lessen the effective diffusion path (film) of the xenon through the salt .
In the latter design the sa l t is to be in turbulent flow; this condition will
Graphite Surveillance Specimen Results
The recent emphasis which has been placed upon mass transfer in the sal t constitutes a
major justification for the expenditure of much of the effort t o be described in the succeeding
portions of this report. Most of the work has several features in common: short-lived isotopes
were involved, concentration profiles were quite steep, and the penetration data were laboriously
garnered using mechanical sectioning and counting techniques.
If short-lived isotopes are involved, one can in principle evaluate the surface concentration
cg of a given gaseous fission product from the timecorrected count data. A comparison of this value with that obtained in the bulk salt thus yields an additional check on f i lm e f f e c t i v e n e s ~ . ~ ~
Our interests, however, are concerned with the behavior within the graphite. As we had seen
earlier, each of the mathematical relationships which we had developed in this connection could
21R. J . Kedl and J. R. Engel, “Circulating Bubbles (in the MSRE),” pp. 22-24 in MSR Program
22R. J . Kedl and A. Houtzeel, Development of a Model for Computing 135Xe Migration in the MSRE,
23A. P. Malinauskas, J. L. Rutherford, and R. B. Evans 111, Gas Transport in MSBR Moderator Graphite.
24C. F. Baes, Jr., and R. B. Evans 111, “Xenon Diffusion and Possible Formation of Cesium Carbide
Semiann. Progr. Rept. Aug. 31, 1966, ORNL-4037 (January 1967).
ORNL-4069 (June 1967).
1. Review of Theory and Counterdiffusion Experiments, ORNL-4148 (September 1967).
in an MSBR,” pp. 158-65 in MSR Program Semiann. Progr. Rept. Aug. 31, 1966, ORNL-4037 (January 1967).
Graphite, ORNL-TM-1810 (July 1967). 25R. J. Kedl, A Model for Computing the Migration of Very Short-Lived Noble Gases into MSRE
di
37
U
ORNL-DWG 68-648W
7 yz in.-I
1 1
r- -+ ]Gin.
( 0 ) (b I
Fig. 14. Location of MSRE Graphite Specimens Employed by Kirslis and Co-Workers.
to are: (a) locations in original unmochined bar 635 os they relate to machined bars and associated perme-
ability specimens; (b) locations in surveillance-specimen bundles which are insertqd in the MSRE core.
Regions A comprise graphite specimens; regions B comprise cross sections of Hastelloy N (INOR-8) tensile
specimens; region C locates a flux monitor.
Positions referred
be expressed in terms of n/cg, and s ince cg is by definition of steady-state conditions a con-
stant, an absolute value of the surface concentration is unnecessary for our purposes. In l ike manner, film effects (i.e., diffusion through the sal t ) should not alter the behavior in the
graphite.
In essence, our primary concern here is to ascertain whether or not we could have obtained the same information regarding the concentration profiles through out-of-pile (and out-of-hot cell)
experiments. As a corollary, we should a l so be able to determine whether or not the pores at the
graphite surface have been plugged with liquid or solid, or whether the graphite itself has become
more permeable under reactor conditions. Our intent should in no way be construed as a demon-
stration that the in-pile studies were performed inefficiently; the efforts of Kirslis and co-workers,
as an example, embrace several important facets of the overall problem of fission product trans-
port, whereas our involvement concerns only gaseous fission product migration in the graphite.
The present review is thus restricted as described above.
Of pertinence to th is work are the first graphite surveillance specimen data, which were pub-
lished by Kirslis26 in 1966. Location of the sample with respect to position within the original
unmachined graphite bar 635 and within the reactor package is shown in Fig. 14.
26S. S. Kirslis, “Fission Product Behavior in the MSRE,” pp. 165-91 in MSR Program Semiam. Progr. Rept. Aug. 32, 2966, ORNL-4037 (January 1967).
38
The rectangular samples utilized by Kirslis were exposed in the MSRE for 7800 Mwhr at
temperatures ranging about 65OOC. After withdrawal from the MSRE, the specimens were sectioned
in a rather ingenious manner to obtain the time-corrected concentration profile data which have
been partially reproduced in Table 6. In this work we attempt to correlate the experimental data by considering the homogeneous
case involving a semi-infinite slab; the corresponding mathematical expression i s given by Eq. (32):
Table 6. Selected Penetration Results for Daughters of Short-Lived Fission Products That
Diffused into CGB Graphite" as Noble Gases
' ~ e 140xe * 'Kr y, Average
Penetration 8 PY n(y)/c Counts Counts BY n(y)/c, Counts By n(v>/c,
(cm) (dis min-' g-') (dis min-' g-') (dis min-' g-')
x
0.00 0.79
2.59 4.86 6.82
10.11
0.00 1.45 4.41
0.00 0.76 2.71 4.84
6.67 8.44
10.37
0.00 0.98 3.23 5.21 6.36 7.79
10'
23.0' 8.6
0.19
0.04
23.0'
5.0 0.21
62.0' 31.7 6.5 1.4
0.73
1oo.oc 33.8
2.5
0.84
x 1010
VH5 (Wide Face - Surface Sample)b
0.00 1.00 15.oc 0.00 1.00 0.83 0.37 10.4 0.36 0.69
1.6 1.2 0.11 5.1 0.008 2.0 2.2 0.13
0.72 3.1 0.048 10.7d 0.002d 0.17 4.6 0.011
VH5 (Side Face - Surface Sample)
0.00 1.00 0.95c 0.00 1.00 1.50 0.22 0.49 0.66 0.52 4.60 0.009 0.14 2.00d 0.022d
Y2 (Wide Face - Interior Sample)b
0.00 1.00 15.0' 0.00 1.00 0.64 0.51 14.4 0.25 0.96 2.3 0.10 6.6 0.88 0.44 4.1 0.023 2.8 1.6 0.18 5.6d 0.012d 1.6 2.2 0.11
0.97 2.7 0.065
0.76 3.4 0.051
Y2 (Side Face - Interior Sample)
0.00 1.00 22.0' 0.00 1.00
0.82 0.34 14.1 0.32 0.64
7.7 1.0 0.35 4.4 0.025 3.9 1.7 0.18
3.0 2.1 0.14 6.6d 0.008d 1.5 2.5 0.069
x 1010
12.0' 0.00 1.00 11.9 0.14 0.99
5.7 0.45 0.48 6.2 0.85 0.52 4.0 1.19 0.33 1.5 1.76 0.13
16.0' 0.00 1.00 12.8 0.11 0.80 11.0 0.38 0.69
7.6 0.67 0.48 7.1 0.93 0.44
4.6 1.2 0.28 4.3 1.4 0.27
"Moderator bar 635; data reported by Kirslis.26 bBar position; see Fig. 14. 'Extrapolated value from count vs penetration data. dNot plotted in Fig. 15.
.
39
Iili
i
i
*
LJ
This relationship obviously describes a universal function in terms of the reduced parameters
njO.)/cg and P j y ; hence a plot of In nib) v s In y should be superposable on a plot of In X v s In Y, where
Y BjY ,
simply by translating the axes distances corresponding to -In cg and In pj respectively. Hence
concentration profile data, provided they can be described by the universal relationship, yield
values of Pj and D j directly.
and Dj which appear in the figure have been determined as outlined above. A comparison of the D j re-
sults for the interior and the surface specimen suggests that the variation of diffusion coefficient
A generalized plot of the data listed in Table 6 is given in Fig. 15; the values of
OWL-DWG 68-6480 5
2
0 440 4.0 4 A 09 4.9
D < = 0.5 -
if B 0.1
!l 0.05
0.2
0
lb 0 2
0.02 LL
0.01
0 440 2.4
0.002 0 I 2 3 4 5
REDUCED PENETRATH)N, 81 y
Fig. 15. Generalized Profiles for Short-Lived Noble-Gas Fission Products in Specimens from Bar 635. Profiles are based on concentrations of immobile daughters o f the noble-gas precursors. The interior speci-
men corresponds to Y2 in Fig. 14; the exterior, to VH5. Raw data were compiled by Kirslis et Sf.; correlated
values appear in Table 6.
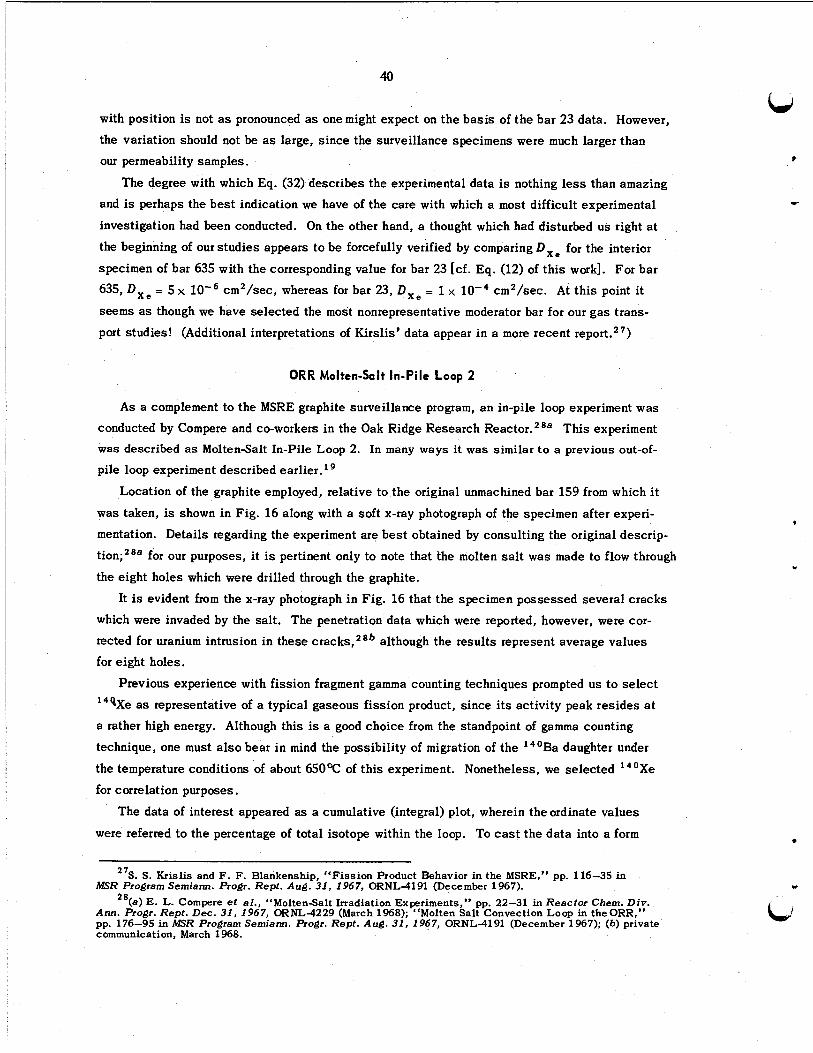
40
with position is not as pronounced as one might expect on the basis of the bar 23 data. However, the variation should not be as large, since the surveillance specimens were much larger than
our permeability samples.
The degree with which Eq. (32) describes the experimental data is nothing less than amazing
and is perhaps the best indication we have of the care with which a most difficult experimental
investigation had been conducted. On the other hand, a thought which had disturbed us right a t
the beginning of our studies appears to be forcefully verified by comparing Dxe for the interior
specimen of bar 635 with the corresponding value for bar 23 [cf. Eq. (12) of this work]. For bar
635, Dxe = 5 x
s e e m s as though we have selected the most nonrepresentative moderator bar for our gas trans-
port studies! (Additional interpretations of Kirslis’ data appear in a more recent report.27)
cm2/sec, whereas for bar 23, Dxe = 1 x cm2/sec. At this point i t
ORR Molten-Salt In-Pile Loop 2
As a complement to the MSRE graphite surveillance program, a n in-pile loop experiment was
conducted by Compere and co-workers in the Oak Ridge Research Reactor.28a This experiment was described as Molten-Salt In-Pile Loop 2. In many ways it was s i m i l a r to a previous out-of-
pile loop experiment described earlier.Ig
Location of the graphite employed, relative to the original unmachined bar 159 from which i t
was taken, is shown in Fig. 16 along with a soft x-ray photograph of the specimen after experi-
mentation. Details regarding the experiment are best obtained by consulting the original descrip-
tion;28a for our purposes, i t is pertinent only to note that the molten salt was made to flow through
the eight holes which were drilled through the graphite.
It is evident from the x-ray photograph in Fig. 16 that the specimen possessed several cracks
which were invaded by the salt. The penetration data which were reported, however, were cor-
rected for uranium intrusion in these cracks,28b although the results represent average values
for eight holes.
Previous experience with fission fragment gamma counting techniques prompted us to select
l4QXe as representative of a typical gaseous fission product, since i t s activity peak resides a t
a rather high energy. Although this is a good choice from the standpoint of gamma counting
technique, one must a l so bear in mind the possibility of migration of the 14’Ba daughter under
the temperature conditions of about 650% of this experiment. Nonetheless, we selected 14’Xe
for correlation purposes.
The data of interest appeared as a cumulative (integral) plot, wherein the ordinate values
were referred to the percentage of total isotope within the loop. To cast the data into a form
LJ r
c
27S. S. Krislis and F . F. Blankenship, “Fission Product Behavior in the MSRE,” pp. 116-35 in
28(a) E. L. Compere et af., “Molten-Salt Irradiation Experiments,” pp. 22-31 in Reactor Chem. Div. MSR Program Semiann. Pro&. Rept. Aug. 31, 1967, ORNL-4191 (December 1967).
Ann. Progr. Rept. Dec. 31, 1967, ORNL-4229 (March 1968); “Molten Salt Convection Loop in theORR,” pp. 176-95 in MSR Program Semiann. Progr. Rept. Aug. 31, 1967, ORNL-4191 (December 1967); (b) private communication, March 1968.
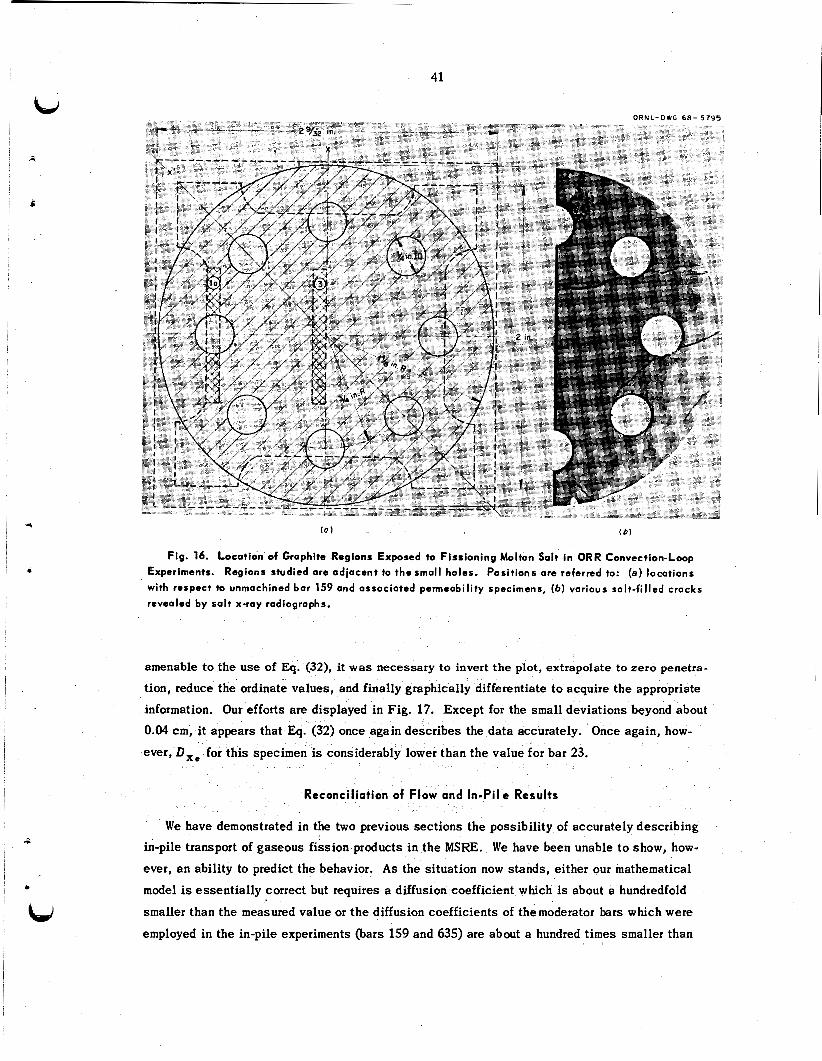
41
O R N L - O W G 6 8 - 5 7 9 5
( a 1 (bl
Fig. 16. Location of Graphite Regions Exposed to Fissioning Molten Salt in ORR Convection-Loop 0 Experiments. Regions studied are adjacent to the small holes. Positions are referred to: ( a ) locations
with respect to unmachined bar 159 ond associated permeability specimens, (b) various solt-filled cracks
revealed by salt x-ray radiographs.
amenable to the use of Eq. (32), it was necessary to invert the plot, extrapolate to zero penetra-
tion, reduce the ordinate values, and finally graphical1
information. Our efforts are displayed in Fig. 17. Except for the small deviations beyond about
0.04 cm, it appears that Eq. (32) once again describes the data accurately. Once again, how-
ever, Dxe for this specimen is considerably lower than the value for bar 23.
ifferentiate to acquire the appropriate
Reconciliation of Flow and In-Pi1 e Results
We have demonstrated in the two previous sections the possibility of accurately describing in-pile transport of gaseous fission products in the MSRE. We have been unable to show, how-
ever, a n ability to predict the behavior, As the situation now stands, either our mathematical
model is essentially correct but requires a diffusion coefficient which is about a hundredfold
smaller than the measured value or the diffusion coefficients of the moderator bers which were
employed in the in-pile experiments (bars 159 and 635) are about a hundred times smaller than
42
0
e 0.2
t- 2 L
0.4
\, \- . \ -..-
I
bar 23. To resolve this question we thus sought to measure the permeabilities of samples re-
moved from bars 159 and 635. In each case two specimens were removed, one from the position
designated la in Figs. 6 and 14, that is, a Surface specimen, and an interior sample, as desig-
nated by position 3. The permeability results are presented in Table 7 along with corresponding
values for bars 23 and 788.
If we focus on the interior specimen (position 3), it is immediately obvious that the diffusion coefficients of the graphites employed in the in-pile experiments are indeed about a hundred
t i m e s less than bar 23. In fact, the four specimens show about a thousandfold variation in dif-
fusion coefficient, with bar 23 being the most porous. Furthermore, comparison of position la
specimens with the corresponding interior samples indicates bar 23 to a l so be most nonuniform with respect to gas transport.
A comparison of the diffusion coefficient values obtained from the permeability data and those *
derived from the in-pile experiments for moderator bar 635 is given in Table 8. The agreement
is nothing less than amazing in view of the difficulties in obtaining the in-pile data and possible -
id normal variations in the actual diffusion coefficients of the permeability and the in-pile speci-
mens even though they were obtained from the same source. In summary, we have demonstrated
43
Table 7. Selected CGB Graphite Flow Parameters as Determined from Helium Permeability Data at 23%'
Position* la Positionb 3
B O / T ) H e d D H e KC 'BO/vHe (DHe K ) d D H e K)1 a Modera tor Bar No. D H e K C
(cm2/sec) (cm2 sec-1 atm-l) (cm2/sec) (cm2 sec-* atm-')
x lo-' x 10-6 x io-'
788 0.28 0.06 3.09 0.27
159
635
2.41
3.13
1.16 15.8
2.05 11.4
8.88
9.33
11.0
6.56
3.64
23 44.7 36.9 797.0 1260.0 17.8
'All of the specimens have bulk densities in the range 1.85 to 1.86 g/cm3. bSee Figs. 6 and 14. cIntercept of helium permeability vs average pressure plot. dThe modified viscous flow coefficient. Slope of KHe v s ( p ) plot.
Table 8. Comparison of Fission Product Migration Results Based on Permeobility and Grinding
Experiments with Moderator Bar 635 Specimens
D,,, Predicted Fission Fragment Coefficient (cm2/sec>
Fission Decay Position' la Position' 3
Concentration Fragment 'Onstant By Flow Concentration By Flow (sec-')
x x 10-6 x 10⁻⁶ x lo-6 x 10⁻⁶
Experimentsb ProfilesC Experiments Profiles
* 'Kr 0.36 1.17 1.2 4.26 1.9
141xe 40.8 0.93 . 3.7 3.39 5.7
I4%e 4.33 0.93 2.1 3.40 4.0
'See Figs. 6 and 14. bComputed from values in Table 7 assuming a reactor temperature of 922% (1200%). 'Data from ref. 26; see Fig. 15.
that a relatively uncomplicated mathematical model can be employed to quantitatively predict
the behavior of short-lived gaseous fission products in MSRE moderator graphite.
VII. DISCUSSION
One of the unfortunate situations which ar ises in presenting the experimental data as we have
done, without adding the "color," so to speak, is that the reader often receives the impression
that the experimental aspects proceeded smoothly and in a straightforward fashion. This was
not the case in the present study. The sample employed by Compere et al., as illustrated in
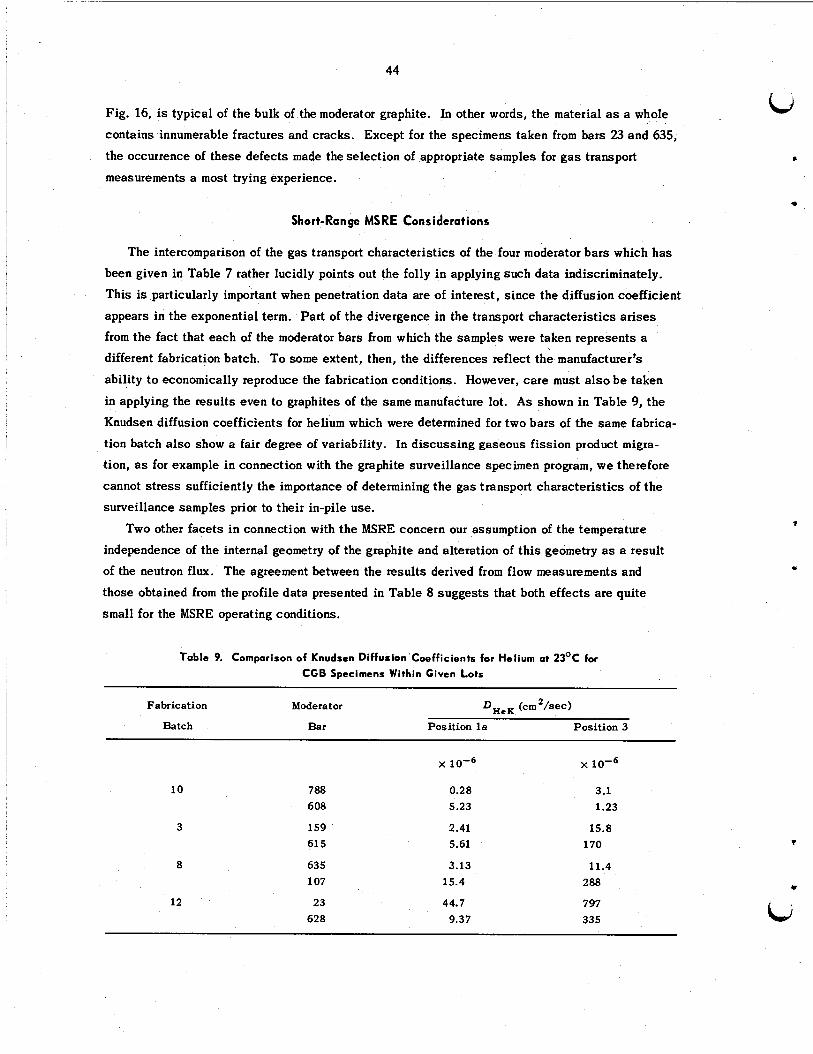
44
Fig. 16, is typical of the bulk of the moderator graphite. In other words, the material as a whole
contains innumerable fractures and cracks. Except for the specimens taken from bars 23 and 635, the occurrence of these defects made the selection of appropriate samples for g a s transport
measurements a most trying experience.
Short-Range MSRE Considerations
The intercomparison of the gas transport characteristics of the four moderator bars which has
been given in Table 7 rather lucidly points out the folly in applying such data indiscriminately.
This is particularly important when penetration data are of interest, since the diffusion coefficient
appears in the exponential term. Part of the divergence in the transport characteristics ar ises
from the fact that each of the moderator bars from which the samples were taken represents a
different fabrication batch. To some extent, then, the differences reflect the manufacturer’s
ability t o economically reproduce the fabrication conditions. However, care must also b e taken
in applying the results even to graphites of the same manufacture lot. As shown in Table 9, the
Knudsen diffusion coefficients for helium which were determined for two bars of the same fabrica-
tion batch also show a fair degree of variability. In discussing gaseous fission product migra-
tion, as for example in connection with the graphite surveillance specimen program, we therefore
cannot stress sufficiently the importance of determining the gas transport characteristics of the
surveillance samples prior to their in-pile use.
Two other facets in connection with the MSRE concern our assumption of the temperature
independence of the internal geometry of the graphite and alteration of this geometry as a result
of the neutron flux. The agreement between the results derived from flow measurements and
those obtained from the profile data presented in Table 8 suggests that both effects are quite
small for the MSRE operating conditions.
Table 9. Comparison of Knudsen Diffusion Coefficients for Helium at 23OC for
CGB Specimens Within Given Lots
Fabrication Moderat or D~~~ (crn2/sec)
Batch Bar Position la Position 3
x 10-6 x 10-6
10
3
8
12
788 608
159 61 5
635 107
23 62 8
0.28 5.23
2.41 5.61
3.13 15.4
44.7 9.37
3.1 1.23
15.8 170
11.4 288
797 335
t
I
bi
Some attention has been given to the effect of temperature on the pores of the graphite.
Napier and
creases with temperature. On the other hand, Hutcheon30 found no temperature dependence of as an example, have demonstrated that the porosity of the graphite in-
the graphite on permeability, within experimental error. More recently, these studies have been
extended by Hawtin and Dawson” to gaseous diffusion through graphite. These workers also
find no temperature dependence of the graphite on gas transport over the temperature range 20 to
600OC. Apparently the porosity increase does not significantly affect the “through-pores”;
that is, although
rise, however, this aspect should be reinvestigated. increases with temperature, E’ does not. As teactor operation temperatures
In like manner, we are unaware of any definitive work which has been performed regarding the
effects of neutron damage on the gas transport characteristics of moderator graphite. Studies of this problem should also be considered.
Features Relative to MSBR Application
The MSBR imposes far more stringent conditions on the migration of fission products into
the graphite to achieve prolonged, successful operation than those required for the MSRE. AS
an example, it has been estimated that a permeability of less than lo-* cm2/sec is required in order to maintain the xenon concentration in the core at the desired level.32 (It is obvious that a
permeability value of lo-’ cm2/sec in terms of the Knudsen diffusion coefficient alone.) Since the MSRE graphite is typically
characterized by a value of
rmits us to descr s transport through the graphite
cm2/sec at the surface, additional reduction is clearly required.
Although a hundredfold reduction of the Knudsen coefficient is still probably attainable by
liquid hydrocarbon impregnation, but with cons iderable difficulty, attention has recently focused
on sealingor gas impregnation methods t o effect the desired value.33 To date, the most promis-
ing technique involves the decomposition of a low-molecular-weight gaseous hydrocarbon in the pores of the graphite. Reduction of the permeability i n this manner is visually demonstrated in
Fig. 18. A graphite specimen which was subjected t o permeability reduction by gas impregnation
was then sectioned, and mercury was injected into one of the sections under an applied pressure of 1000 psig. Figure 18 is a radiograph of this section; the portion of the sample whose pores
have been filled with mercury is now opaque to x rays and thus appears as the light section.
Conversely, that section where permeability reduction has been effected retairis its transparency
to the x rays. Furthermore, i t is possible to use the radiographic technique to ascertain the
29B. A. Napier and D. H. T. Spencer, Nature 218, 948 (1968). ”J. M. Hutcheon, B. Longstaff, and R. K. Warner, “The Flow of Gases Through a Fine Pore Graphite,”
31P. Hawtin, R. W, Dawson, and J. Roberts, Trans. Inst. Chem. Engis. (in press). W e are indebted to
32P. R. Kasten et al., Graphite Behavior and Its Effects on MSBR Performance, ORNL-TM-2136,
33R. L. Beatty and D. V. Kiplinger, “Gas Impregnation of Graphite with Carbon,” MSR Program Semiann.
Industrial Carbon and Graphite, pp. 259-70, SOC. of Chem. Ind., London, 1957.
P. Hawtin for making the paper available to us prior to its publication.
chap. 3 (in press).
Progr. Rept. Aug. 31, 1968, ORNL-4344.
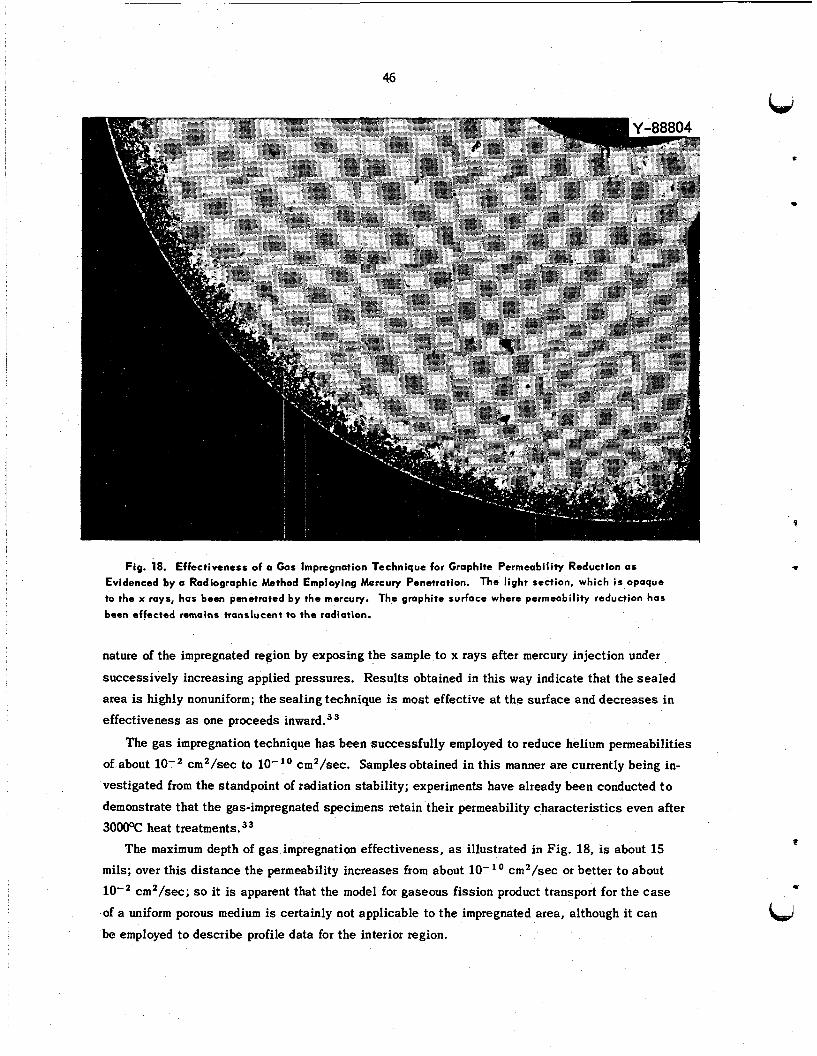
46
Lo+
Fig. 18. Effectiveness of a Gas Impregnation Technique for Graphite Permeability Reduction as
Evidenced by a Radiographic Method Employing Mercury Penetration. The light section, which i s opaque
to the x rays, has been penetrated by the mercury. The graphite surface where permeability reduction has
been effected remains translucent to the radiation.
nature of the impregnated region by exposing the sample to x rays after mercury injection under
successively increasing applied pressures. Results obtained in this way indicate that the sealed area is highly nonuniform; the sealing technique is most effective at the surface and decreases in
effectiveness a s one proceeds i n ~ a r d . ~
The gas impregnation technique has been successfully employed to reduce helium permeabilities
of about lom2 cm2/sec to vestigated from the standpoint of radiation stability; experiments have already been conducted to
demonstrate that the gas-impregnated specimens retain their permeability characteristics even after
300ooC heat treatments.33
cm2/sec. Samples obtained in this manner are currently being in-
The maximum depth of gas impregnation effectiveness, as illustrated in Fig. 18, is about 15 mils ; over this distance the permeability increases from about lo-" cm2/sec or better to about
cm2/sec; so it is apparent that the model for gaseous fission product transport for the case
of a uniform porous medium is certainly not applicable to the impregnated area, although i t can
be employed to describe profile data for the interior region.
47
b,
t
0
hp,
Except for the inferences which were made in discussing the in-pile fission product migra-
tion studies, we know of no definitive work which has been performed regarding the effect of radiation-induced dimensional changes on the gas transport properties of the material. Since the
MSBR graphite will be exposed to rather high neutron fluxes, and particularly in view of the
desired extent of gas impenetrability, we believe investigations of th i s nature are of prime im-
portance. In like manner, again because of the stringent permeability requirements, we strongly
suggest that the possible temperature dependence of E ’ / q ’ be reinvestigated.
Useful Approximations in Describing Gas Transport Through Porous Media
Throughout this report we have utilized pore size distribution data in only a qualitative
sense; mos t of the discussion of a quantitative nature has relied upon the permeability and
counterdiffusion data. Although all three se t s of data have more or less been considered es
independent of one another, an intercomparison of sorts is possible, provided we a re willing to
make a few approximations. In a similar manner, this intercomparison may be employed to ob-
tain approximate values of one parameter from another.
The entire argument involves a grouping which was introduced in Report I, namely,
in which r, is the equivalent radius of the mth pore of equivalent length 1, = qm”2 L in terms of the length L of the graphite. If we assume at this point that the average of a product or quotient
is equal to the product or quotient of the average values, then the equation takes the approximate
form
Unfortunately, whereas pore size spectra yield information regarding the distribution of pore
radii, information relative to the distribution of equivalent pore length does not appear possible;
thus little is lost if we further simplify the expression by combining the averages in q, thus:
The next obvious s t ep is to specify a n analytical form of the distribution function in terms of
the pore entrance radius ro. The simplest form of course is to define the most probable radius
(rJm as the distribution, so that
(rj) = r’o .
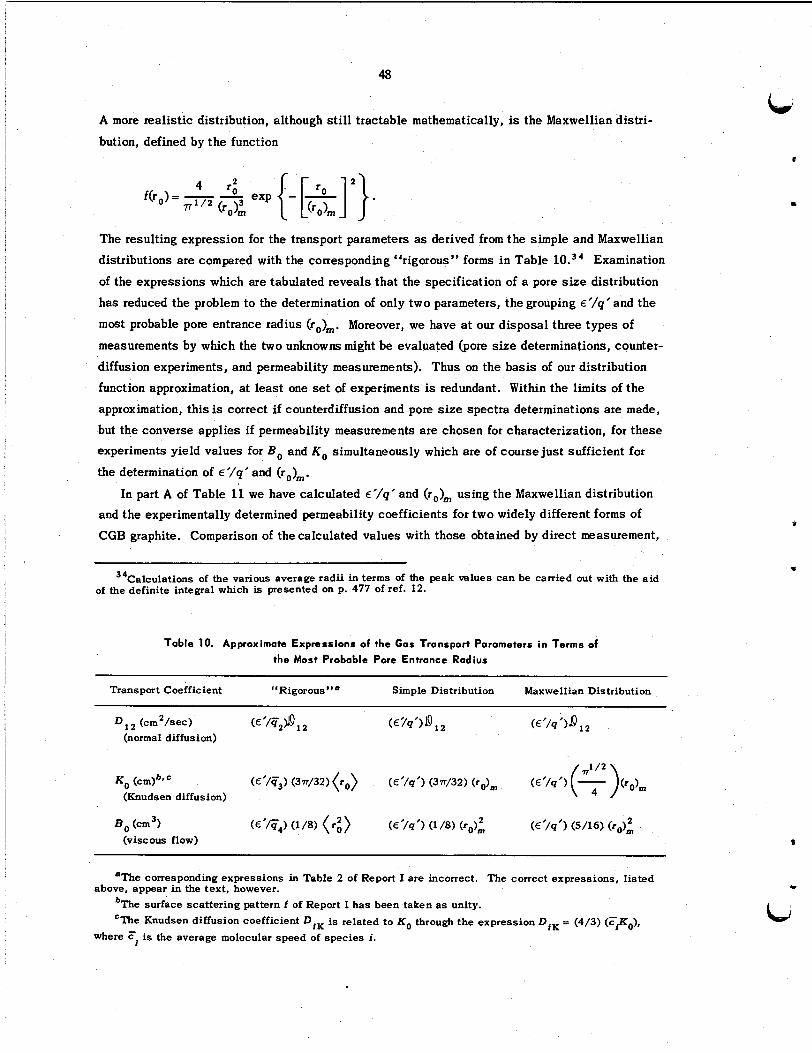
48
Ld A more realistic distribution, although still tractable mathematically, is the Maxwellian distri-
bution, defined by the function
The resulting expression for the transport parameters as derived from the simple and Maxwellian
distributions are compared with the corresponding “rigorous” forms in Table Examination
of the expressions which are tabulated reveals that the specification of a pore size distribution
has reduced the problem to the determination of only two parameters, the grouping E ‘ / q ‘ and the
m o s t probable pore entrance radius (r0),. Moreover, we have a t our disposal three types of
measurements by which the two unknowns might be evaluated (pore size determinations, counter-
diffusion experiments, and permeability measurements). Thus on the basis of our distribution
function approximation, at least one set of experiments is redundant. Within the l i m i t s of the
approximation, this is correct i f counterdiffusion and pore size spectra determinations are made,
but the converse applies i f permeability measurements are chosen for characterization, for these experiments yield values for Bo and KO simultaneously which are of course just sufficient for
the determination of E ’/q’ and (r0), . In part A of Table 11 we have calculated E‘ /q ‘ and (r0), using the Maxwellian distribution
and the experimentally determined permeability coefficients for two widely different forms of
CGB graphite. Comparison of the calculated values with those obtained by direct measurement,
34Calculations of the various average radii in terms of the peak values can be carried out with the aid of the definite integral which is presented on p. 477 of ref. 12.
Table 10. Approximate Expressions of the Gas Tronsport Parameters in T e r m s of the Most Probable Pore Entrance Radius
Transport Coefficient “Rigorous”’ Simple Distribution Maxwellian Distribution
D (cm2/sec) (E‘//iT;$,, ( E ?q’) 19 2 (E‘/q‘)J912 (normal diffusion)
2 B, (cm3) (E’fi4) (1/8) (r;) ( E ’ l q ’ ) (118) (ro)i ( E ’ / q ’ ) ( S / W (ro)rn (viscous flow)
‘The corresponding expressions in Table 2 of Report I are incorrect. The correct expressions, listed
‘The surface scattering pattern f of Report I has been taken a s unity. ‘The Knudsen diffusion coefficient D , , is related to KO through the expression DIK = (4/3) (.?,KO).
above, appear in the text, however.
where r, is the average molecular speed of species i.
c
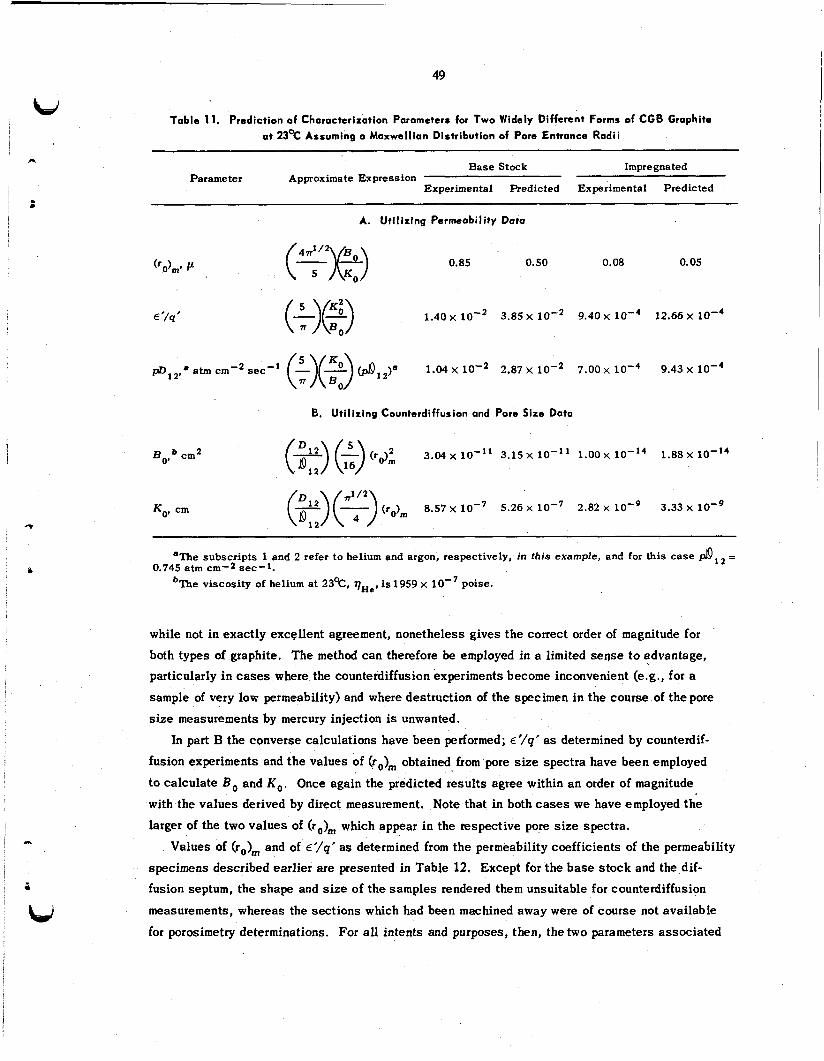
49
Table 11. Prediction of Characterization Parameters for Two Widely Different Forms of CGB Graphite
a t 23% Assuming a Maxwellion Distribution of Pore Entrance Radii
Base Stock Impregnated Parameter Approximate Expression
Experimental Predicted Experimental Predicted
A. Util izing Permeability Data
($12) 0.85 0.50 0.08 0.05
€'/I?'
B ~ , cm2
1.40 x lo-' 3.85 x 9.40 x 12.66 x lo-'
1.04 x 2.87 x 7.00 x
6. Utilizing Counterdiffusion and Pore Sire Data
9.43 x io-'
(2) (7) (ro)m 8.57 x 5.26 x 2.82 x lo-' 3.33 x lo-'
'The subscripts 1 and 2 refer to helium and argon, respectively, in this example, and for this case d12 = 0.745 atm cm-2 sec-1.
viscosity of helium at 23%, qH,, is 1959 x poise.
while not in exactly excgllent agreement, nonetheless gives the correct order of magnitude for
both types of graphite. The method can therefore be employed in a limited sense t o advantage, particularly in cases where the counterdiffusion experiments become inconvenient (e.g., for a
sample of very low permeability) and where destruction of the specimen in the course of the pore
size measurements by mercury injection is unwanted.
In part B the converse calculations have been performed; E'/q' as determined by counterdif-
fusion experiments and the values of (r0), obtained from pore size spectra have been employed
to calculate Bo and KO. Once again the predicted results agree within an order of magnitude with the values derived by direct measurement. Note that in both c a s e s we have employed the
larger of the two values of Go), which appear in the respective pore s ize spectra.
specimens described earlier are presented in Table 12. Except for the base stock and the dif-
fusion septum, the shape and size of the samples rendered them unsuitable for counterdiffusion
measurements, whereas the sections which had been machined away were of course not available
for porosimetry determinations. For all intents and purposes, then, the two parameters associated
Values of (ro)m and of E'/q' as determined from the permeability coefficients of the permeability
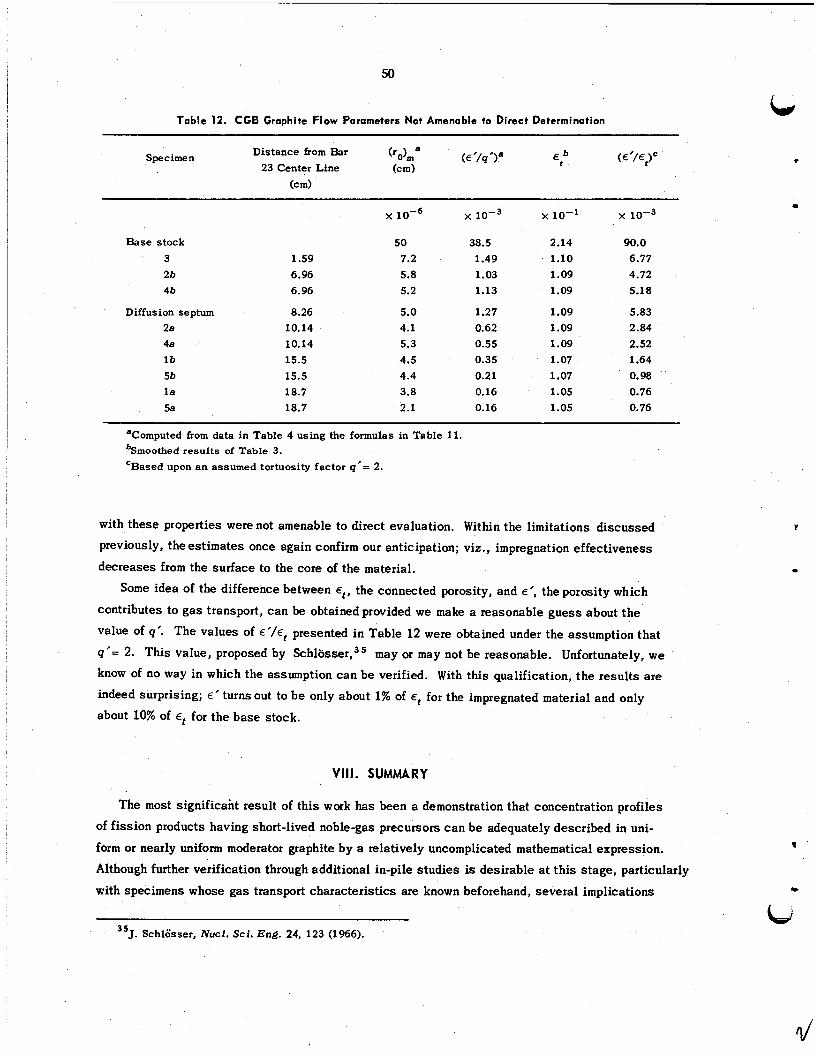
50
Table 12. CGB Grophite Flow Parameters Not Amenable to Direct Determination
Specimen ('o>m a (E'/q 'la (E'/Et)C Distance from Bar 23 Center Line (cm)
(c m)
Base stock 3 2b 4b
Diffusion septum 2a 4a lb 56 la 5e
1.59 6.96 6.96
8.26 10.14 10.14 15.5 15.5 18.7 18.7
x
50 7.2 5.8 5.2
5.0 4.1 5.3 4.5 4.4 3.8 2.1
x
38.5 1.49 1.03 1.13
1.27 0.62 0.55 0.35 0.21 0.16 0.16
x 10-1
2.14 1.10 1.09 1.09
1.09 1.09 1.09 1.07 1.07 1.05 1.05
x 1 0 - ~
90.0 6.77 4.72 5.18
5.83 2.84 2.52 1.64 0.98 0.76 0.76
%omputed from data in Table 4 using the formulas in Table 11. 'Smoothed results of Table 3. 'Based upon an assumed tortuosity factor q'= 2.
with these properties were not amenable to direct evaluation. Within the limitations discussed previously, the estimates once again confirm our anticipation; viz., impregnation effectiveness
decreases from the surface to the core of the material.
Some idea of the difference between et, the connected porosity, and E', the porosity which
contributes to gas transport, can be obtained provided we make a reasonable guess about the
value of q'. The values of €'/et presented in Table 12 were obtained under the assumption that
q'= 2. This value, proposed by S c h l a s ~ e r , ~ ~ may or may not be reasonable. Unfortunately, we know of no way in which the assumption can be verified. With this qualification, the results are
indeed surprising; E' turns out to be only about 1% of
about 10% of for the impregnated material and only
for the base stock.
VIII. SUMMARY
The most significant result of this work has been a demonstration that concentration profiles
of fission products having short-lived noble-gas precursors can be adequately described in uni-
form or nearly uniform moderator graphite by a relatively uncomplicated mathematical expression.
Although further verification through additional in-pile studies is desirable a t this stage, particularly
with specimens whose gas transport characteristics are known beforehand, several implications
3
~
35J. Schlosser, Nucl. Sci. En& 24, 123 (1966).
51
i
1 “ .
I
warrant serious consideration. In the first phase, the adequacy of the mathematical model c a n be
tested through only a few experiments. Once established, however, the relatively expensive hot-cell
sectioning and counting techniques can be eliminated in favor of gas transport characterizations
for information concerning short-lived noble-gas transport. Alternatively, the concentration pro-
file data can yield values of the surface concentration; these results, coupled with information concerning the concentration of a given species in the bulk salt , c a n be employed in studies of
“film effects.” With appropriate modification to account for geometrical effects, the mathemati-
cal model should also b e adequate in describing the migration of longer-lived gaseous fission
products.
Throughout this report we have indicated in several ways that impregnation techniques which
are presently used for purposes of permeability reduction necessarily impart inhomogeneity in
the direction normal to the impregnation surfaces. Although this condition complicates the
problem of gaseous fission product transport to some extent, the solution poses no insurmount-
able difficulties. In this ca se numerical methods must be employed, but even this approach should
be less expensive than one which is purely experimental. In view of the extent of the research which has been conducted in support of the molten-salt
reactor concept, surprisingly little attention has been given to aspects involving gas transport
in the moderator graphite. With respect to successful MSBR operation, some of these aspects
take on a character of paramount importance. Dimensional changes due to radiation effects and
temperature itself must be investigated for the role they play on g a s transport, particularly in
graphites which have been sealed by gas impregnation. Attention should a l s o be given to the
possibility of removing xenon using countercurrent diffusion through the graphite.
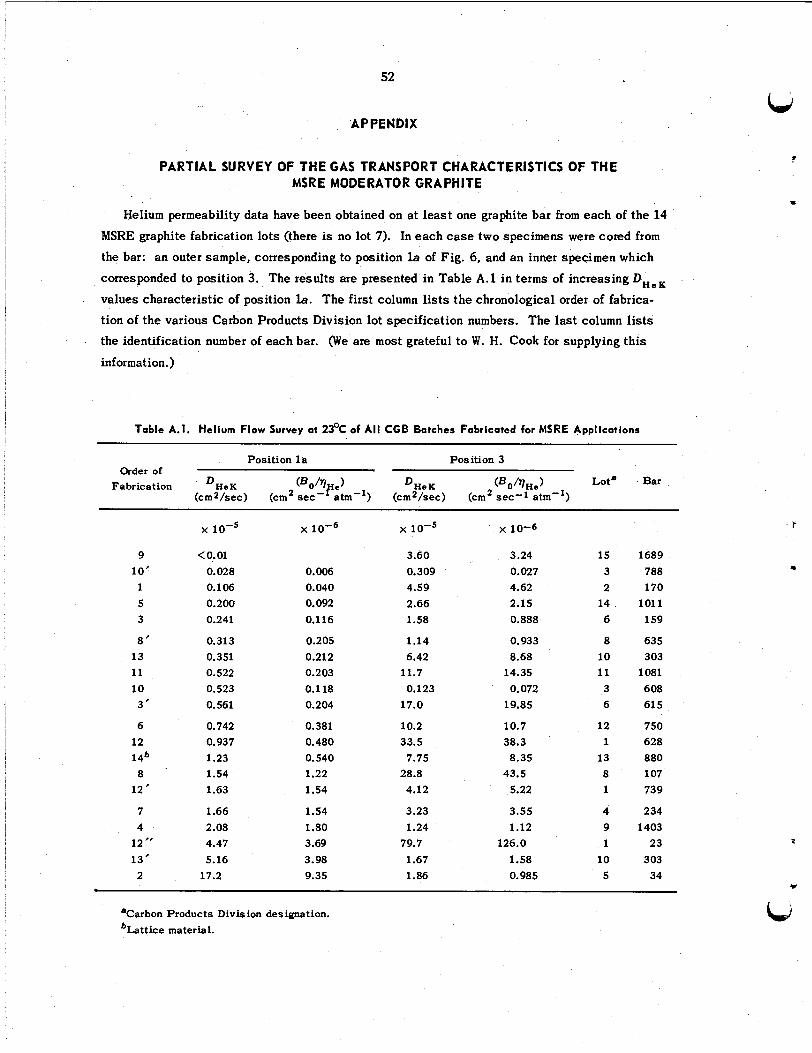
52
APPENDIX
PARTIAL SURVEY OF THE GAS TRANSPORT CHARACTERISTICS OF THE MSRE MODERATOR GRAPHITE
Helium permeability data have been obtained on a t least one graphite bar from each of the 14
MSRE graphite fabrication lots (there is no lot 7). In each c a s e two specimens were cored from
the bar: an outer sample, corresponding to position la of Fig. 6, and an inner specimen which
corresponded to position 3. The results are presented in Table A . l in t e r m s of increasing DHeK values characteristic of position la. The first column lists the chronological order of fabrica- tion of the various Carbon Products Division lot specification numbers. The last column lists the identification number of each bar. (We are most grateful to W. H. Cook for supplying this
information.)
Table A.l. Helium Flow Survey at 23OC of Al l CGB Batches Fabricated for MSRE Applications
Position la Position 3 Order of
Fabrication D H e K D ~ e ~ ( B O / ' l H e ) Lot' Bar (cmz/sec) (cm' (cmZ/sec) (cm' sec-1 atm-'1
9 10' 1 5 3
8' 13 11 10 3'
6 12 14b 8 12'
7 4 12 " 13' 2
<0.01 0.028 0.106 0.200 0.241
0.313 0.351 0.522 0.523 0.561
0.742 0.937 1.23 1.54 1.63
1.66 2.08 4.47 5.16 17.2
x 10-6
0.006 0.040 0.092 0.116
0.205 0.212 0.203 0.1 18 0.204
0.381 0.480 0.540 1.22 1.54
1.54 1.80 3.69 3.98 9.35
x 1 0 - ~
3.60 0.309 4.59 2.66 1.58
1.14 6.42 11.7 0.123 17.0
10.2 33.5 7.75 28.8 4.12
3.23 1.24 79.7 1.67 1.86
x 10-6
3.24 0.027 4.62 2.15 0.888
0.933 8.68 14.35 0.072 19.85
10.7 38.3 8.35 43.5 5.22
3.55 1.12
126.0 1.58 0.985
15 3 2 14 6
8 10 11 3 6
12 1 13 8 1
4 9 1 10 5
1689 788 170 1011 159
635 303 1081 608 61 5
750 628 880 107 739
234 1403 23 303 34
LJ
?
I
P
V
td 'Carbon Products Division designation. bLattice material.

53
W
“1
Most of these data are plotted in Fig. A . l . With few exceptions, the results can be correlated
reasonably well by a linear function on a logarithmic scale. Note also that bar 23 (fabrication order 12”) properties define the end points for both the interior and the surface specimens.
-4.0
-4.5
-5.0
-6.5
- 7.0
-7.5
-8.0
Fig. A.l. Plot of theHelium Permeability Parameters Characteristic of the MSRE Graphite Bars Which
Have Been Surveyed.
i
id
L
ORNL-4389 UC-80 - Reactor Technology
IN TERNPL DISTRi BU Ti0 N
4
W
1. R. E. Adoms 57. A. Houtzeel 2. G. D. Alton 58. J. E. lnman 3. C. F. Baes 59. G. H. Jenks 4. C. D. Baumann 60. R. S. Jones 5. R. L. Beatty 61. S. I. Kaplan 6. R. L. Bennett 62. P. R. Kasten 7. E. S. Bettis 63, R. J. Ked1 8. F. F. Blankenship 64. G. W. Keilholtz 9. W. A. Blevins 65. C. R. Kennedy
10. C. M. Blood 66. R. B. Korsmeyer 11. E. G. Bolhmann 67. K. A. Kraus 12. E. S. Bomar 68. M. E. Lackey 13. G. E. Boyd 69. C. E. Larson 14. R. B. Briggs 70. K. H. Lin 15. H. R. Brmstein 71. T. B. Lindemer 16. T. J. Bumett 72. R. A. Lorenz
17. R. S. Carlsmith 73. L. D. Love 18. 0. B. Covin 74. T. S. Lundy 19. M. M. Chiles 75. H. G. MacPherson 20. J. A. Conlin 76. R. E. MacPherson 21. J. H. Coobs 77. A. P. M,alinauskas 22. W. H. Cook 78. E. A. Mason (consultant) 23. W. B. CottreII 79. H. E. McCoy 24. S. J. Cromer 80. H. C. McCurdy 25. F. L. Culler 81. H. A. McLain 26. D. R. Cuneo 82. J. R. McWherter 27. W. Davis, Jr. 83. J. P. Moore 28. J. H. de Nordwall 84. R. L. Moore 29. J. H. Devan 85. C. S. Morgan 30. S. J. Ditto 86. J. G. Morgan 31. L. Dresner 87. E. L. Nicholson 32. W. P. Eatherly 88. L. C. Oakes 33. J. R. Engel 89. 0. S. Oen
44. R. M. Evans 91. L. G. Overholser 45. J. 1. Federer 92. R. 8. Parker 46. D. E. Ferguson 93. P. Patriarca 47. M. Fontana 94. R. B. Perez 48. S. H. Freid 95. A.M. Perry 49. J. H. Frye, Jr. 96. J. W. Prados 50. W. R. Grimes 97. G. L. Ragan 51. A. G. Grindell 98. G. D. Robbins 52 R. M. Hamley 99. M. W. Rosenthal 53. W. 0. Harms 100-101. J. L. Rutherford 54. P. N. Haubenreich 102. G. Samuels 55. D. M. Hewette II 103. A. W. Savolainen 56. M. R. H i l i
34-43. R. B. Evans Ill 90. M. F. Osborne
104.. D. Scott
55
56
105. J. L. Scott 106. C. E. Sessions 107. 0. S' I sman 108. M. J. Skinner 109. I. Spiewak 110. R. C. Steffr 111. J. 0. Stiegler 112. R. A. Strehlow 113. D. A. Sundberg 114. J. R. Tatlackson 115. R. E. Thoma 116. D. B. Trauger 117. J. Truitt 118. J. L. Wantland
119. G. M. Watson 120. A. M. Weinberg 121. J. R. Weir 122. R. C. Weir 123. M. E. Whatley 124. J. C. White 125. R. P. Wichner 126. J. L. Margrave (consultant) 127. R. C. Vogle (consultant)
128-130. Central Research Library 131. Document Reference Section
132-166. Laboratory Records Department 167. Laboratory Records, ORNL R.C.
EXTERNAL DISTRIBUTION
168. J. A. Swartout, Union Carbide Corporation, New York, N.Y. 169. Laboratory and University Division, AEC, OR0
170-388. Given distribution as shown in TID-4500 under Reactor Technology category (25 copies - CFSTI)
t
c
.


![4389 calculus1 review - UHalmus/4389_calculus1_review_after.pdf · 5lhpdqq 6xpv 5hfdoo ± ohiw hqgsrlqw uljkw hqg srlqw plgsrlqw 7udsh]rlg dssurdfkhv 8sshu vxp /rzhu vxp](https://img.pdfslide.us/doc/110x75/5fc3519fda29b351c521eb83/4389-calculus1-review-uh-almus4389calculus1reviewafterpdf-5lhpdqq-6xpv.jpg)


![MSRE NEUTRON SOURCE REQUIREMENTS [Disc 6] -](https://img.pdfslide.us/doc/110x75/620618ef8c2f7b173004908c/msre-neutron-source-requirements-disc-6-.jpg)