Embed Size (px)
Citation preview
Global NEST Journal, Vol XX, No X, pp XX-XX, 2014 Copyright© 2014 Global NEST
Printed in Greece. All rights reserved
Ortega M.F., Rincones, M., Elío J., Gutiérrez Del Olmo J., Nisi B., Mazadiego L.F., Iglesias L., Vaselli O., Grandia F., García R., De La Vega R. and Llamas B. (2014), Gas monitoring methodology and application to CCS projects as defined by atmospheric and remote sensing survey in the natural analogue of Campo de Calatrava, Global NEST Journal, 16(X), XX-XX
GAS MONITORING METHODOLOGY AND APPLICATION TO CCS PROJECTS AS DEFINED BY ATMOSPHERIC AND REMOTE SENSING SURVEY IN THE NATURAL
ANALOGUE OF CAMPO DE CALATRAVA
ORTEGA M.F.1,*, 1E.T.S. Ingenieros de Minas.
RINCONES, M. 1 Universidad Politécnica de Madrid (UPM), Madrid, Spain
ELÍO J.1 2E.T.S. Ingenieros de Agrónomos.
GUTIÉRREZ DEL OLMO J.2 Universidad Politécnica de Madrid (UPM), Madrid, Spain
NISI B.3 3CNR-IGG Institute of Geosciences and Earth Resources, Pisa, Italy
MAZADIEGO L.F.1 4Department of Earth Sciences, Florence, Italy
IGLESIAS L.1 5CNR-IGG Institute of Geosciences and Earth Resources
VASELLI O.4,5, Florence, Italy
GRANDIA F.6 6AMPHOS21, Barcelona, Spain.
GARCÍA, R. 2
DE LA VEGA R. 1
LLAMAS, B. 1
Received: 25/09/13 : Accepted: 30/01/14 *to whom all correspondence should be addressed Available online: 03/02/2014 e-mail: [email protected]
ABSTRACT
CO2 capture and storage (CCS) projects are presently developed to reduce the emission of anthropogenic CO2 into the atmosphere. CCS technologies are expected to account for the 20% of the CO2 reduction by 2050. Geophysical, ground deformation and geochemical monitoring have been carried out to detect potential leakage, and, in the event that this occurs, identify and quantify it. This monitoring needs to be developed prior, during and after the injection stage. For a correct interpretation and quantification of the leakage, it is essential to establish a pre-injection characterization (baseline) of the area affected by the CO2 storage at reservoir level as well as at shallow depth, surface and atmosphere, via soil gas measurements. Therefore, the methodological approach is important because it can affect the spatial and temporal variability of this flux and even jeopardize the total value of CO2 in a given area.
In this sense, measurements of CO2 flux were done using portable infrared analyzers (i.e., accumulation chambers) adapted to monitoring the geological storage of CO2, and other measurements of trace gases, e.g. radon isotopes and remote sensing imagery were tested in the natural analogue of Campo de Calatrava (Ciudad Real, Spain) with the aim to apply in CO2 leakage detection; thus, observing a high correlation between CO2 and radon (r=0,858) and detecting some vegetation indices that may be successfully applied for the leakage detection.
Keywords: monitoring, CO2 capture and storage, radon, natural analogues, Remote Sensing 1. Introduction
The detection and control of potential leakage from storage formation is mandatory in a project of capture and geological storage of CO2. Such detection requires the comparison of monitoring data with
2 ORTEGA M.F. et al.
that collected in the undisturbed, pre-injection stage. This set of data is commonly referred as “baseline” and includes a large number of geochemical, geophysical and biological parameters. Complementary, the study of CO2 natural analogues is useful to validate leakage detection methodologies.
One of the monitoring techniques is soil-atmosphere CO2 flux estimation. However, it is convenient to monitor other gases whose concentration can be related to deep sources, since CO2 flux can also be produced from natural aerobic respiration and can mask early low-intensity leakage. Therefore, Rn isotopes have been commonly used to trace deep gas migration and could provide clues of the origin of the CO2. Recently, researches in natural analogues have increased in order to study the relationship between CO2 and 222Rn and 220Rn isotopes. It seems well established that CO2 acts as a carrier gas for trace gases (e.g. radon), which can thus be transported at much greater distances than those suggested by their short half-lives (Etiope and Martinelli, 2002). Radon measurement techniques at soil-atmosphere interface for leakage detection are already used in some projects where geological storage of CO2 is effective: e.g. IEA GHG Weyburn (Riding and Rochelle, 2005). In this work we measured CO2 flux and Rn isotope concentration in a natural analogue in the Neogene Basin of Granátula Moral de Calatrava (Campo de Calatrava, Spain) where point-source leakages have presented relatively high CO2
fluxes (González-Cárdenas, 2003).
Another approach to study CO2 leaks from natural analogues is remote sensing. This technique has the advantage to cover large areas with less efforts and costs, and it could be used as first-level detection for further studies in field. In this research the Campo de Calatrava area was also used. The gathered data consists of multispectral and/or hyperspectral images, where spectral characteristics of the different land covers are observed. For example, vegetation has a specific spectral signature if it is healthy or stressed (Male et al., 2009); whereas Rouse et al. (2010) studied vegetation exposed to elevated CO2 concentrations in soil, highlighting alterations in vegetation that were detected by multispectral sensors; and Govindan et al. (2010) used hyperspectral imagery combined with information from vegetation and soil mineralogy to determine possible CO2 leaks in different natural analogues. Analysis of spectral characteristics can be made using several vegetation indexes like PRI, NDVI, PWI, G, Edge Red, EVI etc. In this research several of these indices were used, based on the properties of plants.
The main aims of this study are to obtain 222Rn and 220Rn measurements and remote sensing images in natural analogues of CO2 leakage in order to evaluate the relationships between CO2 flux measurements and the other previously mentioned.
2. Instrumentation and-methodology
The study area and geological outlines
The Campo de Calatrava is located in Ciudad Real, Spain (38°49'N, 3°46'W); in an area of Hercynian basement covered by late Cenozoic sediments. This basement is unconformably overlain by upper Miocene to Quaternary fluvial and lacustrine sediments deposited within a series of fault-bounded Tertiary-Quaternary sedimentary basins of up to 200 km2. A complex fracture pattern controls the basins geometries. At least three different Neogene tectonic episodes can be recognized in the Calatrava Volcanic Province (CVP). A first extensional phase of late Miocene age, which resulted in the initial opening of the sedimentary basins was followed in time by two Pliocene tectonic episodes: the opening of the so-called La Mancha basin and a final regional-scale weak compressional phase. The Campo de Calatrava hosts the late Miocene-Quaternary Calatrava volcanic province and comprises a series of scattered vents and outcrops of mafic lava flows and pyroclastic deposits of alkaline composition. The area is characterized by several gas and water discharges that are distributed almost throughout the whole CVP. It is interesting to point out that the geochemical and isotopic features of the gas seeps indicate a high concentration of CO2 (up to 98,5% by vol.) and helium isotopic ratios
GAS MONITORING METHODOLOGY AND APPLICATION TO CCS PROJECTS 3
affected by a deep mantle-related source. The CVP along with that of Selva-Empordá (NE Spain) likely represents the highest output zone of CO2 in the whole continental Spain.
The CO2 flux, radon activity, and remote sensing methodologies were performed individually by different researcher; afterwards their results were compared in order to establish relationships between them, considering the CO2 flux estimations previously obtained as reference or ground truth information.
1. CO2 flux
The CO2 flux measurement method is performed with the accumulation chamber which is based on dynamic (continuous) measurement of CO2 concentrations within an inverted chamber placed on the ground. A low-flux pump (20 ml s-1) continuously conveys the gas from the chamber to the IR spectrophotometer (equipped with a Li-820 IR sensor) and then again into the chamber, to minimize the disturbance effects due to changes of barometric conditions into the chamber (Elío et al., 2012).
2. Radon activity
Radon is probably the most natural tracer used to detect faults and fractures. However, there are many environmental and instrumental factors that influence the determination of surface radon concentration. Thus, it is necessary to compare different measurement techniques to assess potential differences between them and consider which one(s) offer the most reliable response to the objectives of the various stages of a project of geological storage of CO2. The records of the radon activity were performed with two Sarad RTM 2100 devices and a ionization chamber radon V.O.S. bran, model RM-2.
The measurement of the concentration of radon in air by Sarad RTM 2100 is performed by using the Rn daughter isotopes (218Po/214Po and 216Po). These isotopes are ionized and collected on the surface of a semiconductor detector. The radioactive decay recorded with an alpha spectrometry analyzer is then transformed to radon concentration in Bq·m-3. Soil air was collected with a stainless-steel hollow probe, which was hammered into the soil, down to a depth of 75–100 cm in order to minimize the influence of atmospheric factors (García-Gonzalez et al., 2008). The Rn monitor was fitted with a canister filled with drierite (97% CaSO4 + 3% CoCl2) and a hydrophobic Teflon filter to minimize the humidity content within the instrument and prevent fine particles from entering the ionization chamber. After each series of measurements, the internal pump was set at high flow for 20–30 min to clean the ionization chamber before starting with the next measurement.
The RM-2 ionization consists of an ionization chamber where a potential difference between the metal outer positively charged and the electrode located along the longitudinal axis (0 V) is created. When radon enters the camera, the two main isotopes (222Rn and 220Rn) emit alpha particles. The ions are moved towards the electrode of opposite sign and an ionization current is formed, measured and converted to concentration of radon in Bq·m-3. The initial protocol is the same as the RTM SARAD 2100. The difference is that the soil sample gas is sucked with a 150 ml syringe. Once the ionization chambers are evacuated, the soil gas is transferred into the camera. The syringe was fitted with a canister filled with drierite (97% CaSO4 + 3% CoCl2) and a hydrophobic Teflon filter was used for the same purposes as before.
3. Remote Sensing Images
Multispectral and hyperspectral observations were used as a main source of data to study remote sensing techniques. The imagery consists of digital values of reflected energy intensity for each pixel, and it was acquired from two complementary sources.
The first sets of data were provided by two satellite images, Quick Bird and WorldView-2, over an enlarged area of interest in Campo de Calatrava. Their main features are listed in Table 1 and Figure 1.
The other set of data is provided by two hypersepectral airborne images acquired with AHS and CASI 1500i sensors by Aerospatiale Technologies National Institute (INTA). Their specifications are listed in Table 2. When the hyperspectral images are taken, reflective and thermal measurements were simultaneously acquired over 20 different land covers, including bare soil, water, wetlands, cultivated
4 ORTEGA M.F. et al.
vegetation and non-cultivated vegetation, with a spectroradiometer ASD Field Spec 3; therefore, obtaining 27 average reflective spectral signatures.
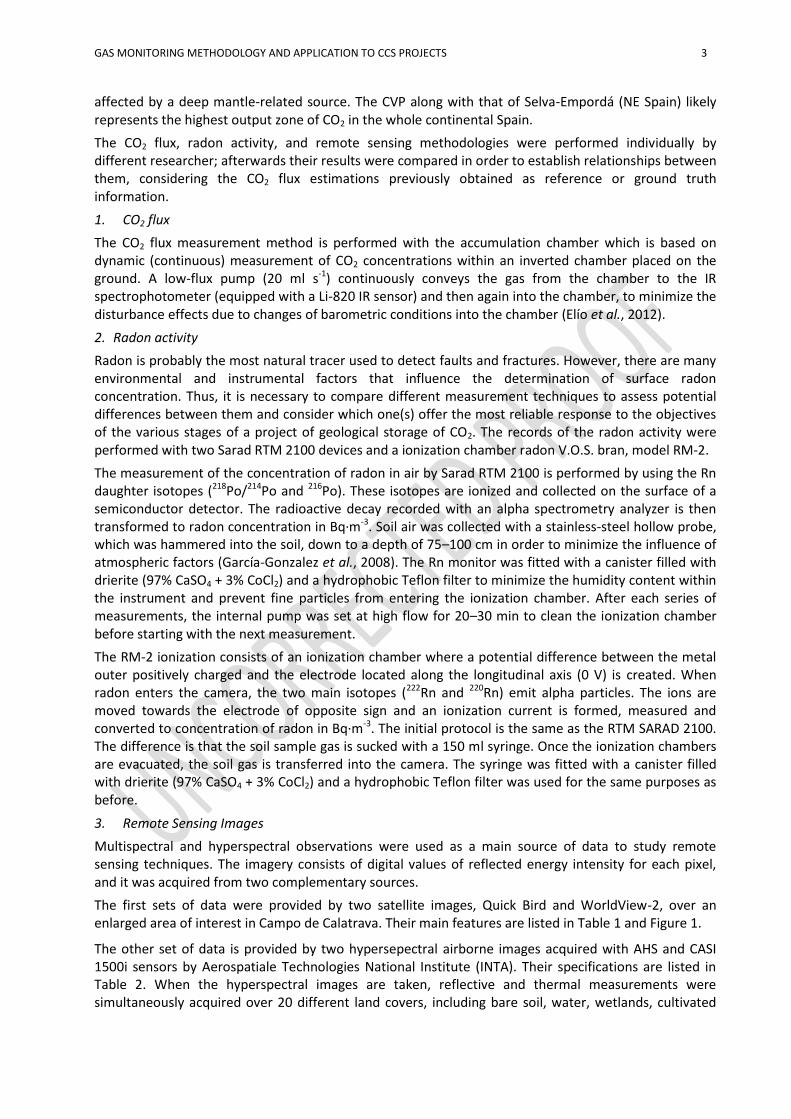
Table 1. Satellite imagery specifications
Satellite / Sensor Acquisition
date Band
Center Wavelength
Mean GSD (m) Bits per pixel
QuickBird 11/10/2009
1 – Blue 0,4793
2,456 16 2 – Green 0,547
3 – Red 0,654
4 – NIR 0,8146
WorldView-2 21/08/2008
1 – Coastal 0,427
1,978/1,901 16
2 – Blue 0,478
3 – Green 0,546
4 – Yellow 0,608
5 – Red 0,659
6 – Red Edge 0,724
7 – NIR 1 0,831
8 – NIR 2 0,908
Figure 1. Bands for QuickBird (left) and WorldView-2 (right).
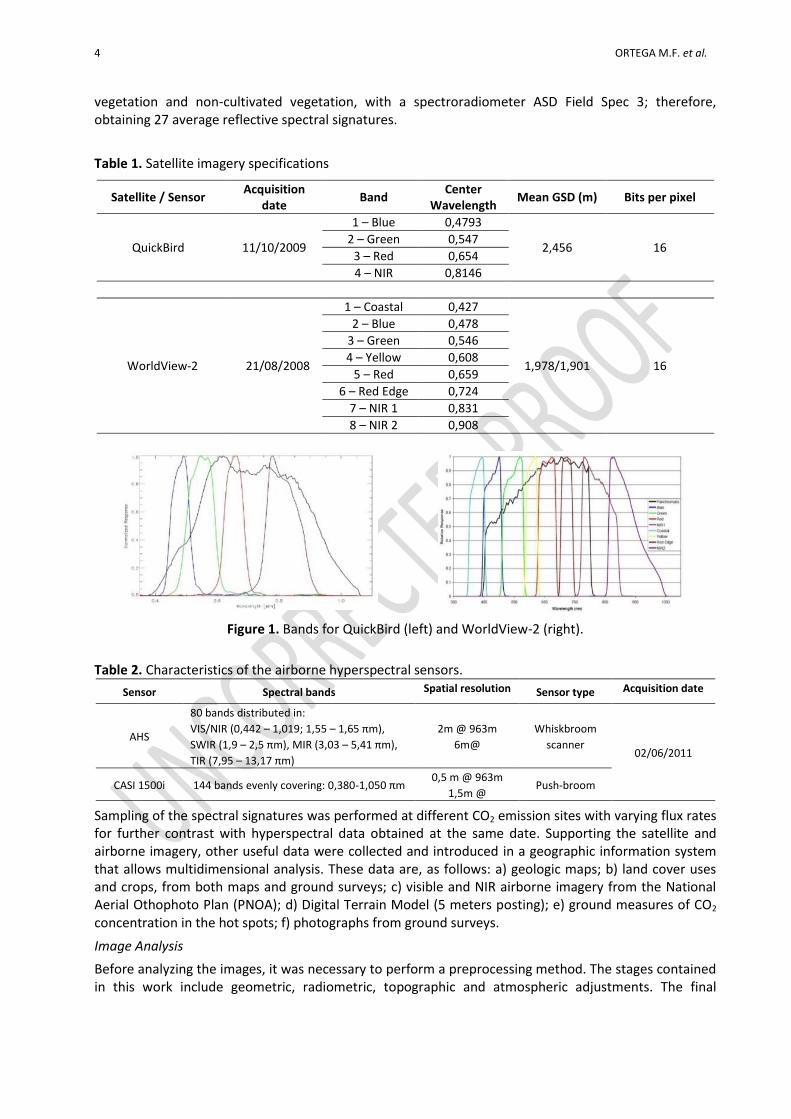
Table 2. Characteristics of the airborne hyperspectral sensors.
Sensor Spectral bands Spatial resolution Sensor type Acquisition date
AHS
80 bands distributed in:
VIS/NIR (0,442 – 1,019; 1,55 – 1,65 πm),
SWIR (1,9 – 2,5 πm), MIR (3,03 – 5,41 πm),
TIR (7,95 – 13,17 πm)
2m @ 963m
6m@
Whiskbroom
scanner 02/06/2011
CASI 1500i 144 bands evenly covering: 0,380-1,050 πm 0,5 m @ 963m
1,5m @ Push-broom
Sampling of the spectral signatures was performed at different CO2 emission sites with varying flux rates for further contrast with hyperspectral data obtained at the same date. Supporting the satellite and airborne imagery, other useful data were collected and introduced in a geographic information system that allows multidimensional analysis. These data are, as follows: a) geologic maps; b) land cover uses and crops, from both maps and ground surveys; c) visible and NIR airborne imagery from the National Aerial Othophoto Plan (PNOA); d) Digital Terrain Model (5 meters posting); e) ground measures of CO2
concentration in the hot spots; f) photographs from ground surveys.
Image Analysis
Before analyzing the images, it was necessary to perform a preprocessing method. The stages contained in this work include geometric, radiometric, topographic and atmospheric adjustments. The final
GAS MONITORING METHODOLOGY AND APPLICATION TO CCS PROJECTS 5
product is an image of the area with the absolute reflectance in digital values, as a base for further analyses.
The satellite imagery was delivered by European Space Imaging as digital numbers (DN). It is required to convert the DNs to spectral radiance, at a minimum, before radiometric/spectral analysis or comparison with other data from either the same platform or other platforms or sensors. However, owing to topographic, atmospheric, and other artifacts, it is preferable to transform even the top-of-the-atmosphere radiance values to ground reflectance in order to obtain more precise and accurate results. Ground reflectance values exclusively depend on the terrain conditions.
The hyperspectral imagery provided by INTA had a first level of treatment, for this reason these were expressed in units of radiance (nW·sr−1·cm−2·nm−1) at each pixel. Georeferencing was performed, as well as the topographic and atmospheric corrections afterwards. Two different approaches for image analysis were carried out: (i) generation, correlation and analysis of vegetation indices from satellite images, and (ii) correlation of hyperspectral images and spectral signatures obtained in situ.
(i) Vegetation Indices
Vegetation Indices are usually referred to specific bands or wavelengths. As a consequence, it is possible that a certain vegetation index cannot be obtained starting from imagery if the required bands are missing.
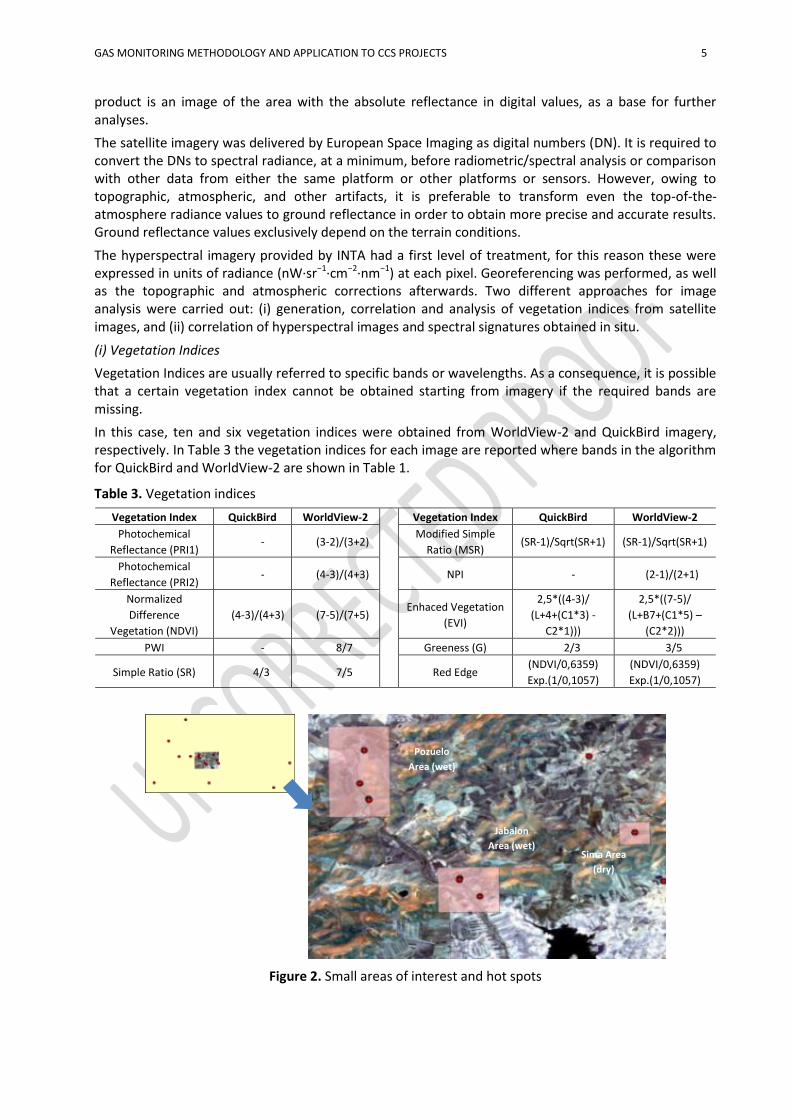
In this case, ten and six vegetation indices were obtained from WorldView-2 and QuickBird imagery, respectively. In Table 3 the vegetation indices for each image are reported where bands in the algorithm for QuickBird and WorldView-2 are shown in Table 1.
Table 3. Vegetation indices
Vegetation Index QuickBird WorldView-2 Vegetation Index QuickBird WorldView-2
Photochemical
Reflectance (PRI1) - (3-2)/(3+2)
Modified Simple
Ratio (MSR) (SR-1)/Sqrt(SR+1) (SR-1)/Sqrt(SR+1)
Photochemical
Reflectance (PRI2) - (4-3)/(4+3) NPI - (2-1)/(2+1)
Normalized
Difference
Vegetation (NDVI)
(4-3)/(4+3) (7-5)/(7+5) Enhaced Vegetation
(EVI)
2,5*((4-3)/
(L+4+(C1*3) -
C2*1)))
2,5*((7-5)/
(L+B7+(C1*5) –
(C2*2)))
PWI - 8/7 Greeness (G) 2/3 3/5
Simple Ratio (SR) 4/3 7/5 Red Edge (NDVI/0,6359)
Exp.(1/0,1057)
(NDVI/0,6359)
Exp.(1/0,1057)
Figure 2. Small areas of interest and hot spots
Pozuelo
Area (wet)
Jabalon
Area (wet) Sima Area
(dry)
6 ORTEGA M.F. et al.
These vegetation indices have been generated, as mentioned above, in three areas where a bigger concentration of CO2 leak hot-spots is present. The CO2 leak hot-spots are represented as red points, while the three small areas of interest are pink rectangles in Figure 2.
(ii) Hyperspectral imagery and spectral signatures correlation
A spectral signature is the combination of electromagnetic energy emitted, absorbed and/or reflected at varying wavelengths for a given material. This means that an object (mineral, vegetation, soil, among others) can be identified and mapped if its spectral signature is known. On this basis, the following technique is proposed to achieve the goal of identifying CO2 leakage hot-spots. The cross correlogram spectral matching (CCSM; Van der Meer and Bakker, 1997) is a spectral matching technique, focused towards mineral mapping from imaging spectrometer data using the cross correlogram of pixel and reference spectra. A cross correlogram is constructed by calculating the cross correlation (equivalent to the linear correlation coefficient which is defined as the ratio of the covariance to the product of the sum of the standard deviations) at different match positions (m) between a test spectrum (pixel spectrum) and a reference spectrum (a laboratory mineral spectrum or a pixel spectrum known to represent a mineral of interest) by shifting the reference spectrum over subsequent channel positions.
The statistical significance of the cross correlation coefficient can be assessed by the student’s t test and the skewness can be calculated as an estimator of the goodness-of-fit. The cross correlogram for a perfectly matching reference and test spectrum is a parabola around the central matching number (m=0) with a peak correlation of 1 and the deviations from this shape indicate a different surface type. This information was then compared with other data such as CO2 emissions readings, aerial photography, and field observations, in order to corroborate the efficiency of the statistical procedure. 3. Results and discussion
The measurements in the Campo de Calatrava were taken in an area near the Jabalón River in two sets on 01-06-2011. A first set was used to compare measurements of CO2 flux and radon activity, while the other set with the remote sensing imagery (vegetation indices and spectral matching technique).
Table 4. Summary of 222Rn, 220Rn and CO2 measurements. NF (No Flux); b.d.l. (<0,01) for those negative values of CO2 flux
ID SARAD [Bq.m
-3] RM-2 [Bq.m
-3] Flux CO2
[g·m-2
·d-1
] ID
SARAD [Bq.m-3
] RM-2 [Bq.m-3
] Flux CO2
[g·m-2
·d-1
] 222Rn
220Rn
222Rn
222Rn
220Rn
222Rn
1 NF NF NF 1 21 32800 30800 35700 25,68
2 32400 1,36 22 195000 35200 170000 44,65
3 NF NF NF 1,13 23 89542 31648 92700 102,00
4 73900 27000 92300 43,67 24 NF NF NF 4,38
5 29000 9000 29300 5,34 29 26100 19400 22400 (<0,01)
6 NF NF NF 2,93 30 NF NF NF (<0,01)
7 NF NF NF 2,47 31 NF NF NF 1,09
8 28200 21,85 32 12900 24000 13500 5,75
9 29000 28500 20100 12,27 33 173100 18396 194000 141,45
10 29000 15500 22300 (<0,01) 34 NF NF NF 0,40
11 NF NF NF (<0,01) 35 NF NF NF 0,36
12 11600 17800 12900 5,09 42 NF NF NF (<0,01)
13 46000 10500 48100 11,63 43 NF NF NF (<0,01)
14 NF NF NF 6,85 44 NF NF NF 0,93
15 <2443 <844 49700 9,64 45 7800 5,23
18 18000 11180 19300 (<0,01) 46 15300 13900 19250 0,50
19 NF NF NF (<0,01) 47 NF NF NF 1,28
20 22400 12300 23000 2,95 48 NF NF NF 2,49
GAS MONITORING METHODOLOGY AND APPLICATION TO CCS PROJECTS 7
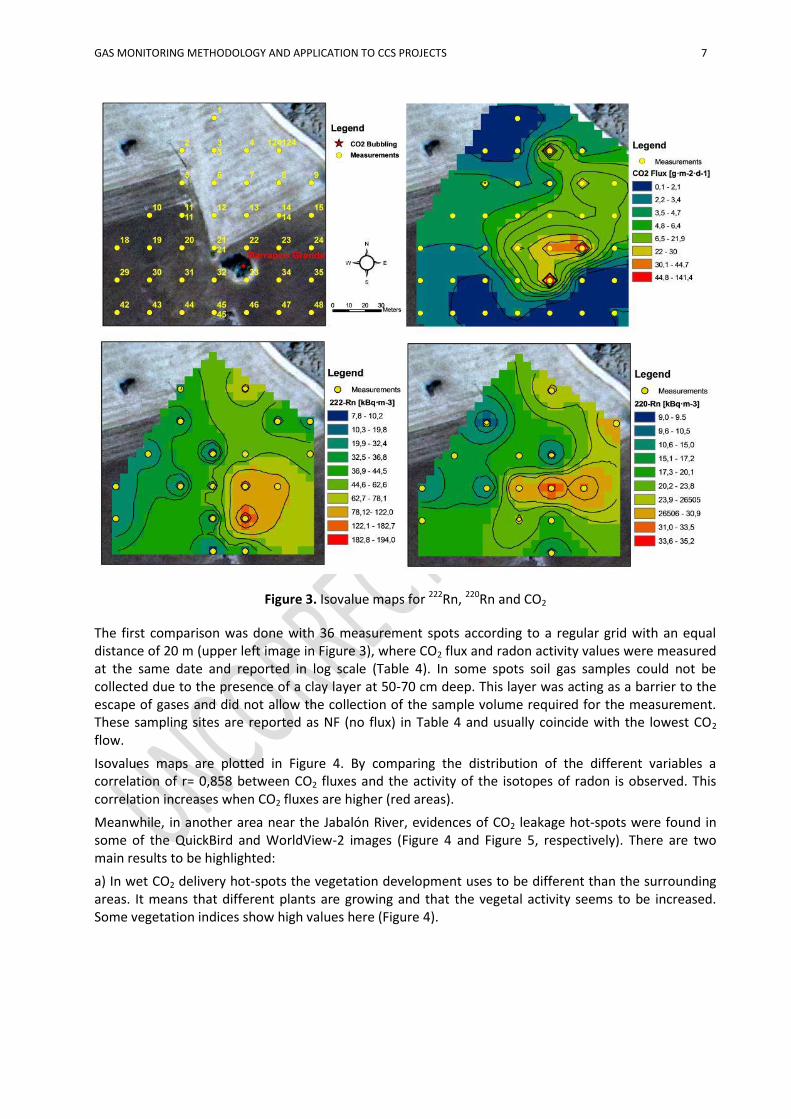
Figure 3. Isovalue maps for 222Rn, 220Rn and CO2
The first comparison was done with 36 measurement spots according to a regular grid with an equal distance of 20 m (upper left image in Figure 3), where CO2 flux and radon activity values were measured at the same date and reported in log scale (Table 4). In some spots soil gas samples could not be collected due to the presence of a clay layer at 50-70 cm deep. This layer was acting as a barrier to the escape of gases and did not allow the collection of the sample volume required for the measurement. These sampling sites are reported as NF (no flux) in Table 4 and usually coincide with the lowest CO2 flow.
Isovalues maps are plotted in Figure 4. By comparing the distribution of the different variables a correlation of r= 0,858 between CO2 fluxes and the activity of the isotopes of radon is observed. This correlation increases when CO2 fluxes are higher (red areas).
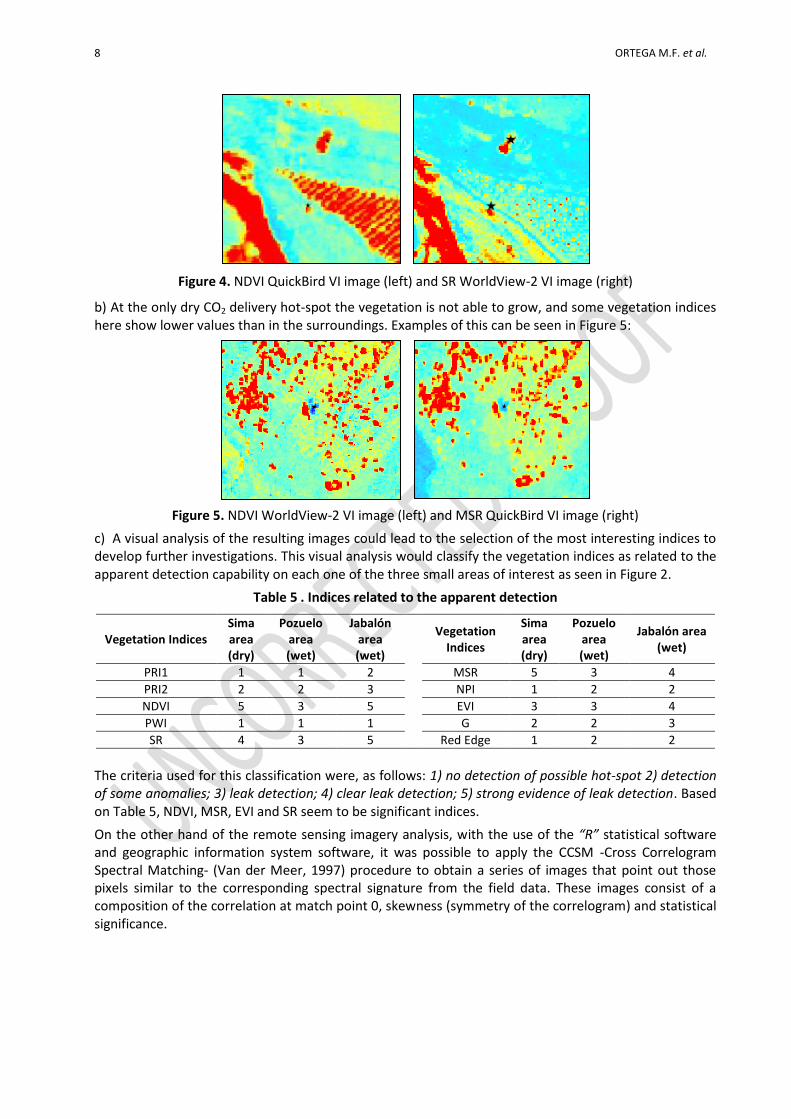
Meanwhile, in another area near the Jabalón River, evidences of CO2 leakage hot-spots were found in some of the QuickBird and WorldView-2 images (Figure 4 and Figure 5, respectively). There are two main results to be highlighted:
a) In wet CO2 delivery hot-spots the vegetation development uses to be different than the surrounding areas. It means that different plants are growing and that the vegetal activity seems to be increased. Some vegetation indices show high values here (Figure 4).
8 ORTEGA M.F. et al.
Figure 4. NDVI QuickBird VI image (left) and SR WorldView-2 VI image (right)
b) At the only dry CO2 delivery hot-spot the vegetation is not able to grow, and some vegetation indices here show lower values than in the surroundings. Examples of this can be seen in Figure 5:
Figure 5. NDVI WorldView-2 VI image (left) and MSR QuickBird VI image (right)
c) A visual analysis of the resulting images could lead to the selection of the most interesting indices to develop further investigations. This visual analysis would classify the vegetation indices as related to the apparent detection capability on each one of the three small areas of interest as seen in Figure 2.
Table 5 . Indices related to the apparent detection
Vegetation Indices Sima area (dry)
Pozuelo area (wet)
Jabalón area (wet)
Vegetation Indices
Sima area (dry)
Pozuelo area (wet)
Jabalón area (wet)
PRI1 1 1 2 MSR 5 3 4
PRI2 2 2 3 NPI 1 2 2
NDVI 5 3 5 EVI 3 3 4
PWI 1 1 1 G 2 2 3
SR 4 3 5 Red Edge 1 2 2
The criteria used for this classification were, as follows: 1) no detection of possible hot-spot 2) detection of some anomalies; 3) leak detection; 4) clear leak detection; 5) strong evidence of leak detection. Based on Table 5, NDVI, MSR, EVI and SR seem to be significant indices.
On the other hand of the remote sensing imagery analysis, with the use of the “R” statistical software and geographic information system software, it was possible to apply the CCSM -Cross Correlogram Spectral Matching- (Van der Meer, 1997) procedure to obtain a series of images that point out those pixels similar to the corresponding spectral signature from the field data. These images consist of a composition of the correlation at match point 0, skewness (symmetry of the correlogram) and statistical significance.
GAS MONITORING METHODOLOGY AND APPLICATION TO CCS PROJECTS 9
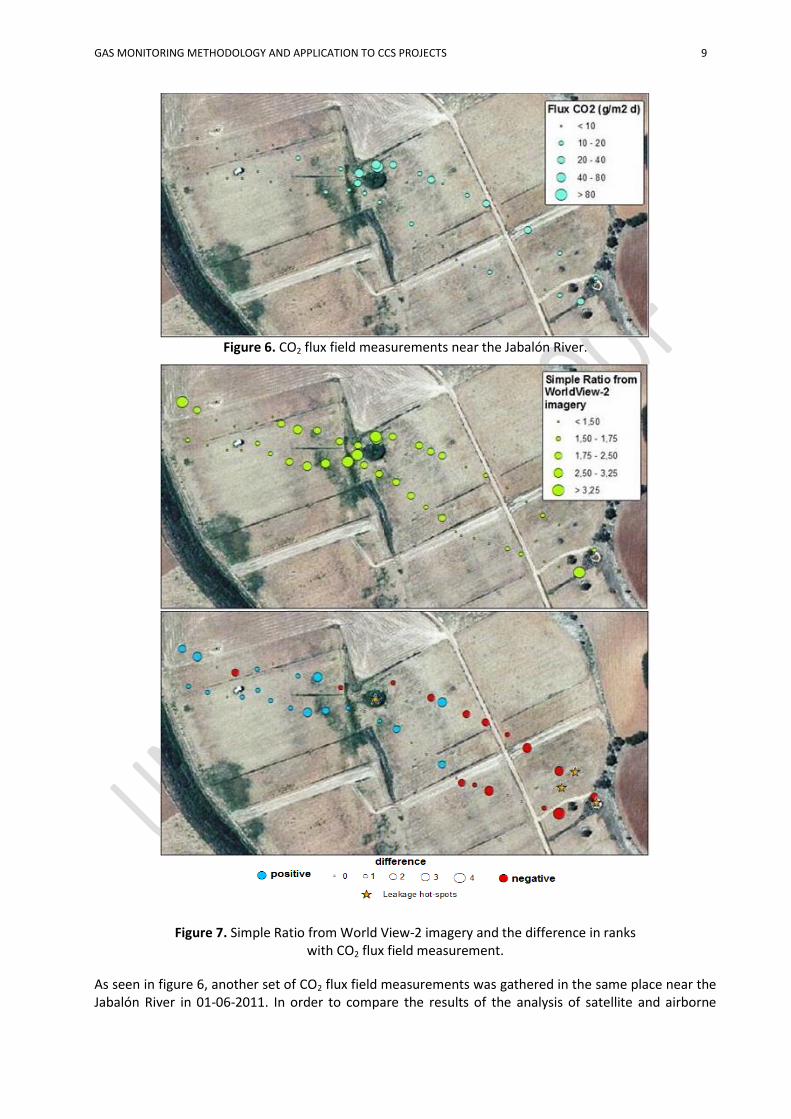
Figure 6. CO2 flux field measurements near the Jabalón River.
Figure 7. Simple Ratio from World View-2 imagery and the difference in ranks with CO2 flux field measurement.
As seen in figure 6, another set of CO2 flux field measurements was gathered in the same place near the Jabalón River in 01-06-2011. In order to compare the results of the analysis of satellite and airborne
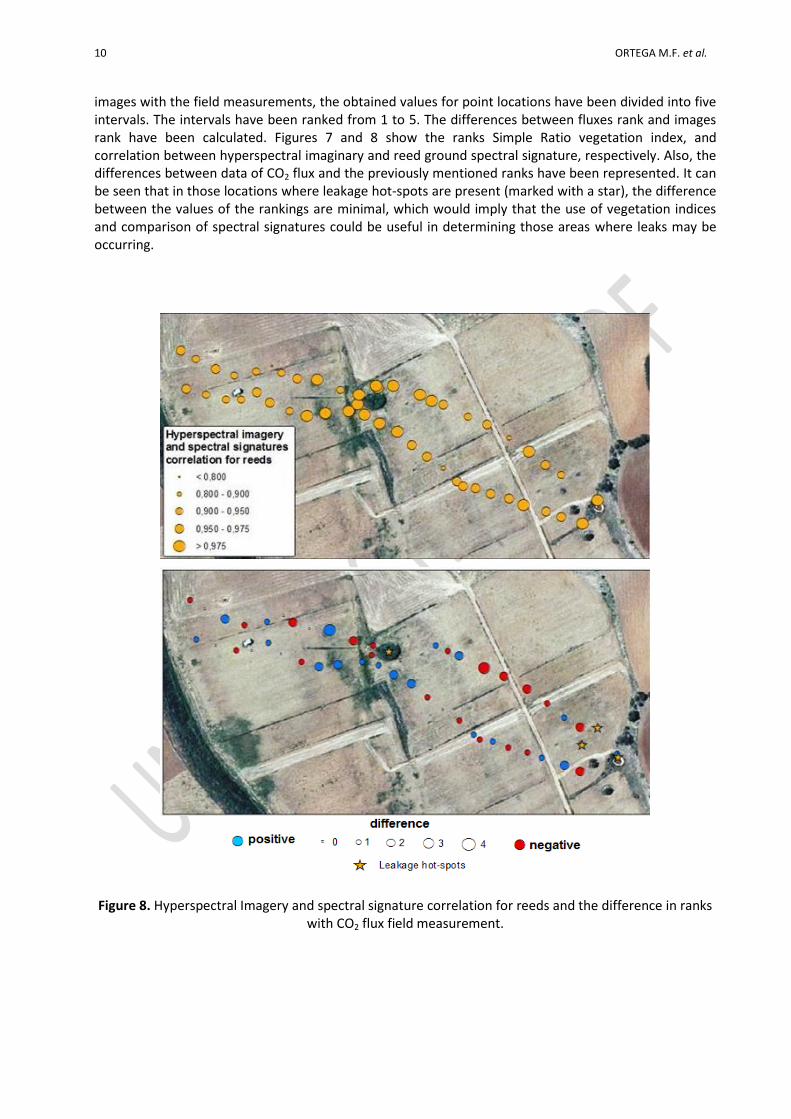
10 ORTEGA M.F. et al.
images with the field measurements, the obtained values for point locations have been divided into five intervals. The intervals have been ranked from 1 to 5. The differences between fluxes rank and images rank have been calculated. Figures 7 and 8 show the ranks Simple Ratio vegetation index, and correlation between hyperspectral imaginary and reed ground spectral signature, respectively. Also, the differences between data of CO2 flux and the previously mentioned ranks have been represented. It can be seen that in those locations where leakage hot-spots are present (marked with a star), the difference between the values of the rankings are minimal, which would imply that the use of vegetation indices and comparison of spectral signatures could be useful in determining those areas where leaks may be occurring.
Figure 8. Hyperspectral Imagery and spectral signature correlation for reeds and the difference in ranks with CO2 flux field measurement.
GAS MONITORING METHODOLOGY AND APPLICATION TO CCS PROJECTS 11
4. Conclusions
In areas with point-source releases of CO2, such as the volcanic area of Campo de Calatrava, a positive correlation between high CO2 fluxes and radon (222Rn and 220Rn) activities was observed, suggesting that CO2 is behaving as the main carrier gas.
The image analysis techniques indicate that some vegetation indices for the detection of diffuse emissions of CO2 can successfully be applied, such as NDVI, SR, MSR and EVI. Correlations between some of the vegetation indices and CO2 flux and radon activity were indeed recognized. However, it does not seem possible to discriminate vegetated areas with high or low CO2 flux; because the results of the indices and CCSM enhance vegetation characteristics instead of the direct detection of CO2. 5. Acknowledgements This work has been financed by the Ciudad de la Energía Foundation, through the ALM-08-006 contract, and co-financed by the European Union (European Energy Program for Recovery). The sole responsibility of this publication lies with the authors. The European Union is not responsible for any use that may be made of the information contained therein.
References
Arozarena A., Villa G. and Valcárchavezcel N. The National Aerial Ortophoto Program in Spain (PNOA). International Cartographic Conference. La Coruña, Spain. 2005.
Chavez P. (1988), An improved dark-object subtraction technique for atmospheric scattering correction of multispectral data, Remote Sensing of Environment, 24, 459-479.
Elío J., Ortega M.F., Chacón E., Mazadiegob L.F., Grandia F. (2012), Sampling strategies using the “accumulation chamber” for monitoring geological storage of CO2, International Journal of Greenhouse Gas Control, 9, 303–311.
Etiope G. and Martinelli G. (2002), Migration of carrier and trace gases in the geosphere: an overview, Physics of the Earth and Planetary Interiors, 129, 185-204.
García-González J.E., Ortega M.F., Chacón E., Mazadiego L.F. and De Miguel E. (2008), Field validation of radon monitoring as a screening methodology for NAPL-contaminated sites, Applied Geochemistry, 23, 2753-2758.
González Cárdenas E. (2003), Geomorphology of volcanic structures at the western edge of the Campo de Calatrava: La Cubeta de Piedrabuena (In Spanish). At Piedrabuena, Historical and Natural Site. Ed. UCLM - Diputación Provincial - Ayuntamiento de Piedrabuena, Ciudad Real, 402-420.
Govindan R. et al. A geostatistical and probabilistic spectral image processing methodology for monitoring potential CO2 leaks on the surface, Int. J. Greenhouse Control, 2010.
Intergovernmental Panel of Climate Change (IPCC) Special Report on Carbon Dioxide Capture and Storage. 2005. Prepared by Working Group III [Metz, B., O. Davidson, H. C. de Coninck, M. Loos, and L. A. Meyer (eds.)]. Cambridge University Press, Cambridge, United Kingdom and New York, NY, USA, 442 pp.Krause, K. Radiometric use of QuickBird imagery. Digital Globe Inc. Technical Note. 2005.
International Energy Agency GreenHouse Gas R&D Programme (IEAGHG). 2012. Informe Técnico: Quantification Techniques for CO2 Leakage.
Krause K. (2005), Radiometric use of QuickBird imagery. Digital Globe Inc. Technical Note.
Male E.J., et al. Using hyperspectral plant signatures for CO2 leak detection during the 2008 ZERT CO2 sequestration field experiment in Bozeman, Montana. Environ Earth Sci. 2010.
Riding J.B. and C.A. Rochelle. "The IEA Weyburn CO2 Monitoring and Storage Project. Final Report of the European Research Team." British Geological Survey Research Report, 2005: RR/05/03 54pp.
Rouse, J., et al. Multi-spectral imaging of vegetation for detecting CO2 leaking from underground. Environ Earth Sci. 2010.
Updike T. and Comp C. Radiometric use of WorldView-2 imagery. Digital Globe Inc. Technical Note. 2010.
Van der Meer F. and W. Bakker W. (1997), CCSM: Cross correlogram spectral matching, International Journal of Remote Sensing, 18(5), 1197-1201.

12 ORTEGA M.F. et al.
Zarco-Tejada P.J. 1998. Correlations between CO2 fluxes and high spatial resolution reflectance imagery. Master of Science in Remote Sensing. University of Dundee (Scotland, United Kingdom).