Embed Size (px)
Citation preview

7/29/2019 Gas Emergency Policy
http://slidepdf.com/reader/full/gas-emergency-policy 1/16
James simpson and Kyung-seoK min
INFORMATION PAPER
GAS EMERGENCY POLICY:
WHERE DO IEA COUNTRIES STAND?
2011May

7/29/2019 Gas Emergency Policy
http://slidepdf.com/reader/full/gas-emergency-policy 2/16

7/29/2019 Gas Emergency Policy
http://slidepdf.com/reader/full/gas-emergency-policy 3/16
James simpson and Kyung-seoK min
INFORMATION PAPER
GAS EMERGENCY POLICY:
WHERE DO IEA COUNTRIES STAND?
2011May
This information paper was prepared for the IEA Governing Board meeting in May 2011. It was drafted by the Emergency Policy Division. This paper reects the views of the International Energy Agency (IEA) Secretariat,
but does not necessarily reect those of individual IEA member countries. For further information, pleasecontact James Simpson or Kyung-Seok Min at [email protected] and [email protected].

7/29/2019 Gas Emergency Policy
http://slidepdf.com/reader/full/gas-emergency-policy 4/16
INTERNATIONAL ENERGY AGENCY
The International Energy Agency (IEA), an autonomous agency, was established in November 1974.Its primary mandate was – and is – two-fold: to promote energy security amongst its membercountries through collective response to physical disruptions in oil supply, and provide authoritative
research and analysis on ways to ensure reliable, affordable and clean energy for its 28 membercountries and beyond. The IEA carries out a comprehensive programme of energy co-operation amongits member countries, each o which is obliged to hold oil stocks equivalent to 90 days o its net imports.The Agency’s aims include the following objectives:
n Secure member countries’ access to reliable and ample supplies o all orms o energy; in particular,through maintaining eective emergency response capabilities in case o oil supply disruptions.
n Promote sustainable energy policies that spur economic growth and environmental protectionin a global context – particularly in terms o reducing greenhouse-gas emissions that contributeto climate change.
n Improve transparency of international markets through collection and analysis of energy data.
n Support global collaboration on energy technology to secure uture energy supplies
and mitigate their environmental impact, including through improved energyefciency and development and deployment o low-carbon technologies.
n Find solutions to global energy challenges through engagement anddialogue with non-member countries, industry, international
organisations and other stakeholders.IEA member countries:
Australia
Austria
Belgium
Canada
Czech Republic
Denmark
Finland
France
Germany
Greece
Hungary
Ireland
Italy
Japan
Korea (Republic o)
Luxembourg
NetherlandsNew Zealand
Norway
Poland
Portugal
Slovak Republic
Spain
Sweden
Switzerland
Turkey
United Kingdom
United States
The European Commission
also participates in
the work o the IEA.
Please note that this publication
is subject to specifc restrictions
that limit its use and distribution.
The terms and conditions are available
online at www.iea.org/about/copyright.asp
© OECD/IEA, 2011
International Energy Agency 9 rue de la Fédération
75739 Paris Cedex 15, France
www.iea.org
7/29/2019 Gas Emergency Policy
http://slidepdf.com/reader/full/gas-emergency-policy 5/16
© OECD/IEA 2011 Gas Emergency Policy: Where do IEA Member Countries Stand?
Page | 3
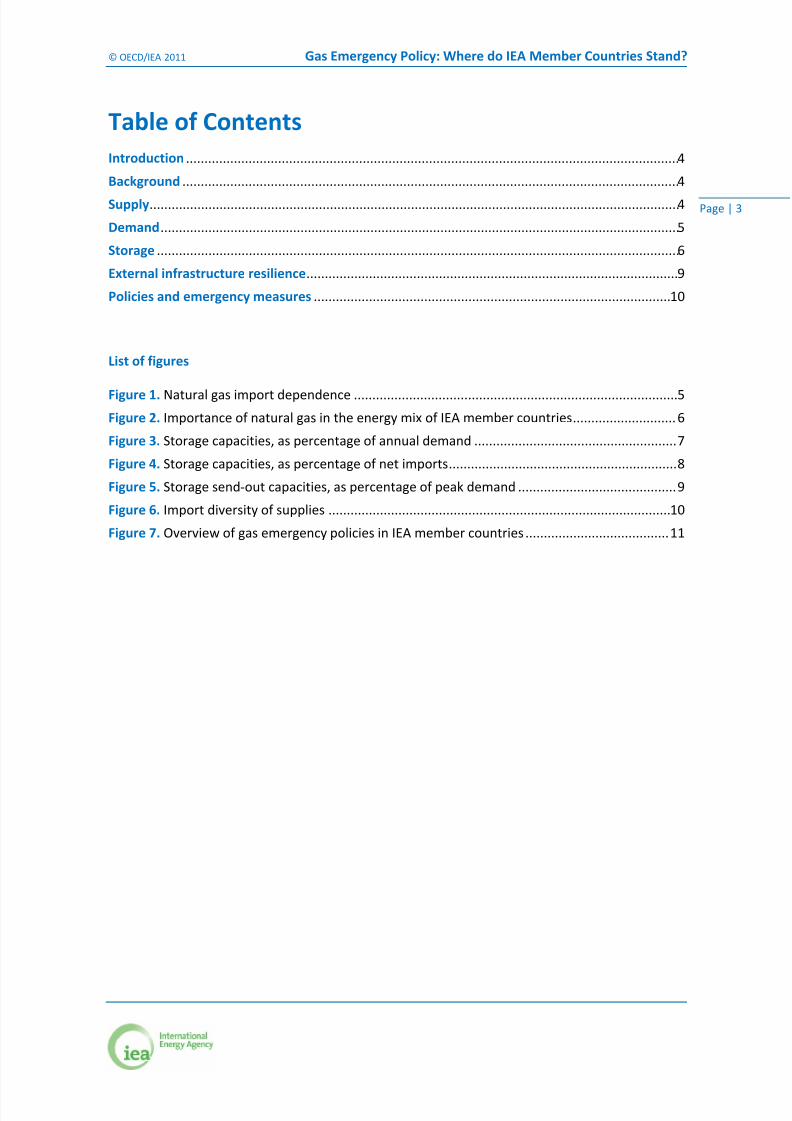
Table of Contents Introduction ...................................................................................................................................... 4
Background ....................................................................................................................................... 4
Supply ................................................................................................................................................
4
Demand ............................................................................................................................................. 5
Storage .............................................................................................................................................. 6
External infrastructure resilience ..................................................................................................... 9
Policies and emergency measures ................................................................................................. 10
List of figures Figure 1. Natural gas import dependence ........................................................................................ 5
Figure 2. Importance of natural gas in the energy mix of IEA member countries ............................ 6
Figure 3. Storage capacities, as percentage of annual demand ....................................................... 7
Figure 4. Storage capacities, as percentage of net imports .............................................................. 8
Figure 5. Storage send‐out capacities, as percentage of peak demand ........................................... 9
Figure 6. Import diversity of supplies ............................................................................................. 10
Figure 7. Overview of gas emergency policies in IEA member countries ....................................... 11

7/29/2019 Gas Emergency Policy
http://slidepdf.com/reader/full/gas-emergency-policy 6/16
Gas Emergency Policy: Where do IEA Member Countries Stand? © OECD/IEA 2011
Page | 4
Introduction In the final communiqué of the meeting of the IEA Governing Board at Ministerial Level in
October 2009, Ministers agreed that:
“The IEA
can
play
a strong
role
in
helping
member
countries
improve
their
preparedness
for
possible gas supply disruptions, and co‐ordinate their actions in case of an emergency, when
appropriate”. More specifically, “With respect to emergency response capabilities for natural gas,
we [Ministers] agreed […] to endorse a role for the IEA to monitor progress in gas market and gas
security policy of its member countries.”
This Information Paper summarises the results of a questionnaire on natural gas emergency
policies and practices, developed by the IEA in co‐ordination with the European Commission. All
responses were received by November 2010.
Background
The questionnaire aimed to collect information on the emergency preparedness of IEA member
countries in general and, more specifically, to assess and improve the natural gas emergency
preparedness of these countries and of the IEA as a whole. It also sought to provide the IEA
Secretariat with a better understanding of the functioning of countries’ gas markets in times
of crisis.
To clearly assess a given country’s exposure to a potential gas supply disruption, it is important to
have detailed information – both qualitative and quantitative – on key infrastructure aspects, as well
as a strong understanding of government’s and/or industry players’ options and abilities to react
quickly to disturbances in their domestic markets. There is no simple or single solution for addressing
a country’s
gas
security
concerns;
a variety
of
measures
are
available,
spanning
both
external
resilience (e.g. diversification of supply routes and suppliers) and internal resilience (e.g. storage).
The IEA Secretariat developed a “scorecard” to assess and compare the levels of preparedness
according to certain numerical criteria. When individual country responses proved to be
insufficient in terms of data disclosure or quality, the Secretariat also used information available
from the data submissions that are made to the IEA.1
Supply Most IEA member countries depend on imports to meet their domestic gas needs. Only six
member countries are not dependent on imports; of the six, five are net exporters.
On the opposite end of the spectrum, 8 member countries are 100% import dependent while 16
have an import dependence exceeding 90%. On a regional level, high levels of dependence on
foreign gas are mainly found in most of Europe and Asia (Japan/Korea). Member countries in
North America, Oceania and the peripheral European countries of the North Sea are relatively
well‐endowed in terms of gas resources and thus not exposed to the same inherent import risk.
1 Regarding specific policies mentioned in the questionnaire, a lack of response is assumed to mean that such a policy does
not currently exist in the country.

7/29/2019 Gas Emergency Policy
http://slidepdf.com/reader/full/gas-emergency-policy 7/16
© OECD/IEA 2011 Gas Emergency Policy: Where do IEA Member Countries Stand?
Page | 5
Figure 1. Natural gas import dependence
0%
10%
20%
30%
40%
50%
60%70%
80%
90%
100%
B e l g i u m
F i n l a n d
L u x e m b o u r g
P o r t u g a l
S w e d e n
S w i t z e r l a n d
G r e e c e
S p a i n
K o r e a
F r a n c e
S l o v a k R e p u b l i c
T u r k e y
C z e
c h R e p u b l i c
J a p a n
I r e l a n d
I t a l y
G e r m a n y
A u s t r i a
H u n g a r y
P o l a n d
U n i t e d K i n g d o m
U
n i t e d S t a t e s
A u s t r a l i a
C a n a d a
D e n m a r k
N e t h e r l a n d s
N
e w
Z e a l a n d
N o r w a y
Note: All figures in this document are based on 2010 data, unless indicated otherwise.
Source: IEA Monthly Gas Statistics.
Only 2 member countries report an increase in their domestic supplies in the upcoming 5 to 10
years, whereas 16 countries indicate that their dependence on foreign imports is set to grow. Of
note, over the past five years, the United Kingdom has moved from being almost self ‐sufficient
on an annual basis to a situation in which 40% of its annual demand is imported. Only the United
States has reduced its import dependency in recent years, due to the impressive growth in
unconventional gas production.
On a more positive note, most IEA member countries benefit from relatively diversified sources
of imported gas. This is particularly the case for countries dependent on liquefied natural gas
(LNG) supplies, in both Asia and Europe, where specific policies have been put in place in order to
limit import reliance on any one country. The greatest exposure to a single supplier is in Eastern
Europe, where countries from the Baltic to the Balkans show a common structural infrastructure
reliance on Russian gas imports.
Demand Gas
accounts
for
over
10%
of
total
primary
energy
supply
(TPES)
in
26
out
of
28
IEA
member
countries: 16 of these countries are dependent on gas for more than 20% of their TPES; in seven
countries, the share of gas exceeds 30%.
In many IEA member countries, the power sector is particularly dependent on natural gas, and
this dependence is growing. Gas accounts for over 20% of power generation in 14 countries, and
over 30% in 9 countries; five countries rely on gas for over half of their power generation.
More importantly, 17 IEA member countries expect their demand for gas to increase in the
future. This is notably because natural gas carries a lower carbon footprint than other fossil fuels
and its flexibility (both technically and economically) as back‐up generation is highly desirable as
a means of counterbalancing the growing share of variable renewable energies. In effect, gas and

7/29/2019 Gas Emergency Policy
http://slidepdf.com/reader/full/gas-emergency-policy 8/16
Gas Emergency Policy: Where do IEA Member Countries Stand? © OECD/IEA 2011
Page | 6
electricity security are becoming enmeshed. Combined with the fact that a similar number of
countries expect their dependence on foreign imports to grow, this highlights the need for
countries to address the dual pressures of growing demand and import dependency.
Figure 2. Importance of natural gas in the
energy
mix
of
IEA
member
countries
0%
10%
20%
30%
40%
50%
60%
70%
80%
N e t h e r l a n d s
U n i t e d K i n g d o m
I t a l y
H u n g a r y
T u r k e y
C a n a d a
I r e l a n d
S l o v a k R e p u b l i c
L u x e m b o u r g
B e l g i u m
U n i t e d S t a t e s
S p a i n
G e r m a n y
A u s t r i a
D e n m a r k
A u s t r a l i a
N e w
Z e a l a n d
C z e c h R e p u b l i c
P o r t u g a l
J a p a n
F r a n c e
K o r e a
P o l a n d
F i n l a n d
G r e e c e
S w i t z e r l a n d
S w e d e n
N o r w a y
Share of gas in TPES Share of gas in electricity output
Source: IEA Monthly Gas Statistics.
Peak demand exceeds average demand by more than 50% in 25 of 28 IEA member countries, and
exceeds average demand by a factor of as much as 100% for more than one‐third of IEA member
countries. This can be due to seasonal factors where heating is the main end use; in France, for
example, January demand can be four times August demand. This volatility of demand can be
exacerbated by the increasing role of gas in power – especially where such power meets peak
demand, fills gaps when other plants are unexpectedly unavailable, and/or is increasingly used as
back‐up for variable renewables – resulting in quite sharp demand peaks for gas. Regions with
these demand patterns will need flexible arrangements to ensure secure supply, including
differing types of storage (including storage with quicker drawdown rates to meet power sector
needs), as well as the more traditional long‐term supply contracts. Flexible infrastructure and
markets will
also
be
especially
important
in
these
cases.
Storage Storage is a valuable tool for responding to demand swings. Of note, Hungary has a dedicated
stockholding agency with 1.2 billion cubic metres (bcm) of gas held as government‐controlled
strategic storage as of 2010, and seven other European countries have imposed some form of gas
storage obligation. In some countries, the transmission system operator (TSO) books a share of
the country’s commercial storage capacity to meet its security standards. These storage
measures provide a powerful tool for correcting acute, short‐term market shortages.
7/29/2019 Gas Emergency Policy
http://slidepdf.com/reader/full/gas-emergency-policy 9/16
© OECD/IEA 2011 Gas Emergency Policy: Where do IEA Member Countries Stand?
Page | 7
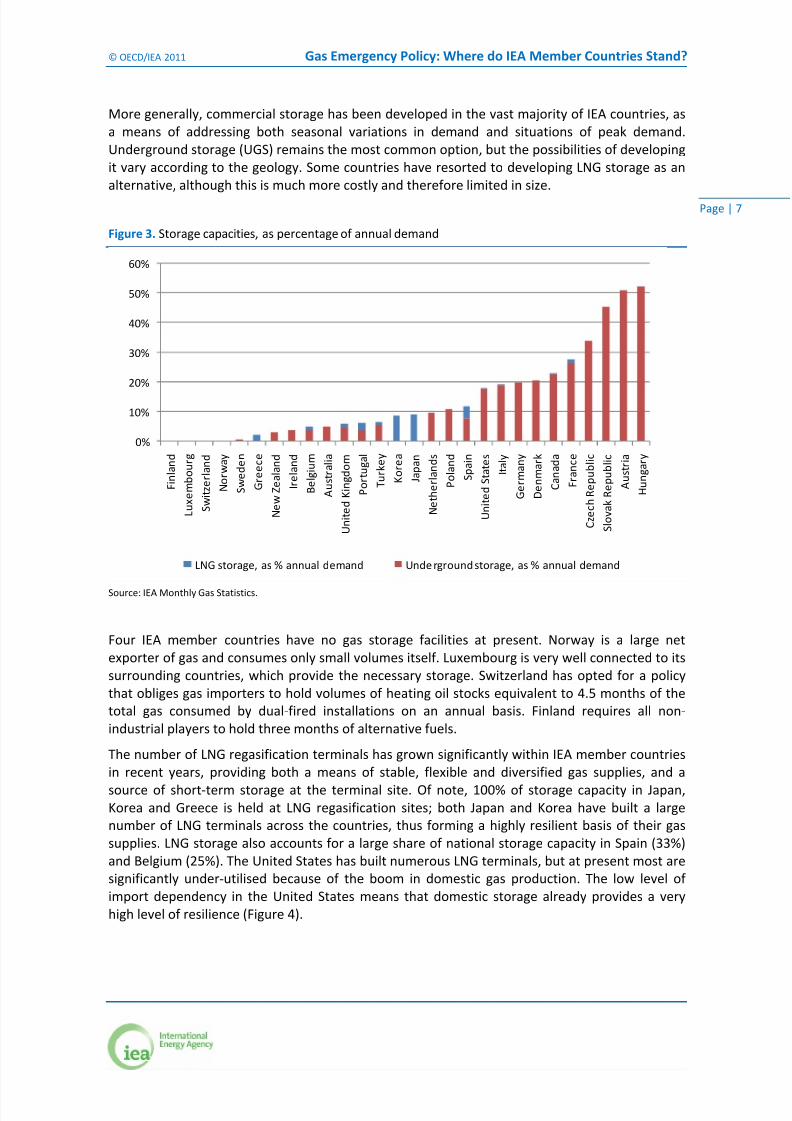
More generally, commercial storage has been developed in the vast majority of IEA countries, as
a means of addressing both seasonal variations in demand and situations of peak demand.
Underground storage (UGS) remains the most common option, but the possibilities of developing
it vary according to the geology. Some countries have resorted to developing LNG storage as an
alternative, although this is much more costly and therefore limited in size.
Figure 3. Storage capacities, as percentage of annual demand
0%
10%
20%
30%
40%
50%
60%
F i n l a n d
L u x e m b o u r g
S w i t z e r l a n d
N o r w a y
S w e d e n
G r e e c e
N e w
Z e a l a n d
I r e l a n d
B e l g i u m
A u s t r a l i a
U n i t e d K i n g d o m
P o r t u g a l
T u r k e y
K o r e a
J a p a n
N e t h e r l a n d s
P o l a n d
S p a i n
U n i t e d S t a t e s
I t a l y
G e r m a n y
D e n m a r k
C a n a d a
F r a n c e
C z e c h R e p u b l i c
S l o v a k R e p u b l i c
A u s t r i a
H u n g a r y
LNG storage, as % annual demand Unde rground storage, as % annual demand
Source: IEA
Monthly
Gas
Statistics.
Four IEA member countries have no gas storage facilities at present. Norway is a large net
exporter of gas and consumes only small volumes itself. Luxembourg is very well connected to its
surrounding countries, which provide the necessary storage. Switzerland has opted for a policy
that obliges gas importers to hold volumes of heating oil stocks equivalent to 4.5 months of the
total gas consumed by dual‐fired installations on an annual basis. Finland requires all non‐
industrial players to hold three months of alternative fuels.
The number of LNG regasification terminals has grown significantly within IEA member countries
in recent years, providing both a means of stable, flexible and diversified gas supplies, and a
source of
short
‐term
storage
at
the
terminal
site.
Of
note,
100%
of
storage
capacity
in
Japan,
Korea and Greece is held at LNG regasification sites; both Japan and Korea have built a large
number of LNG terminals across the countries, thus forming a highly resilient basis of their gas
supplies. LNG storage also accounts for a large share of national storage capacity in Spain (33%)
and Belgium (25%). The United States has built numerous LNG terminals, but at present most are
significantly under‐utilised because of the boom in domestic gas production. The low level of
import dependency in the United States means that domestic storage already provides a very
high level of resilience (Figure 4).

7/29/2019 Gas Emergency Policy
http://slidepdf.com/reader/full/gas-emergency-policy 10/16
Gas Emergency Policy: Where do IEA Member Countries Stand? © OECD/IEA 2011
Page | 8
Figure 4. Storage capacities, as percentage of net imports
0%
10%
20%
30%
40%
50%
60%
70%
80%
90%
100%
F i n l a n d
L u x
e m b o u r g
S w
i t z e r l a n d
S w e d e n
G r e e c e
I r e l a n d
B e l g i u m
P o r t u g a l
T u r k e y
K o r e a
J a p a n
S p a i n
U n i t e d
K i n g d o m
P o l a n d
I t a l y
G e r m a n y
F r a n c e
C z e c h
R e p u b l i c
S l o v a k
R e p u b l i c
A u s t r i a
H u n g a r y
U n i t
e d S t a t e s
A u s t r a l i a
C a n a d a
D e n m a r k
N e t h e r l a n d s
N e w
Z e a l a n d
N o r w a y
LNG storage, as % net imports Underground storage, as % net imports
not appplicable*
* net exporter or no imports
165%
Source: IEA Monthly Gas Statistics.
Taking both underground and LNG storage capacities together, 12 countries have storage
capacity that can meet at least 10% of annual demand; storage capacity surpasses 20% of annual
demand for eight countries. Only two countries – Hungary and Austria – have gas storage
capacity that surpasses 50% of annual demand. In Hungary, this has been achieved through
government‐designed public stockbuilding; Austria’s high gas storage levels are commercially
developed depleted fields.
The IEA Secretariat was unable to collect precise data from all countries, but available data
suggest that 13 of member countries could meet 80% or more of their peak demand by means of
a theoretical maximum drawdown on their storage. Nine countries could theoretically cover all of
their peak demand in this way. These figures are based on two key assumptions, notably: that
their storage capacities would be filled to their maximum level (usually only true at the beginning
of winter), as storage send‐out capacities decline when storage is emptied; and that the dispatch
of these volumes could be delivered to the area in which the demand originates.2
2 Note that in Northern Europe, some storage and gas networks are L‐gas, whereas most are H‐gas.

7/29/2019 Gas Emergency Policy
http://slidepdf.com/reader/full/gas-emergency-policy 11/16
© OECD/IEA 2011 Gas Emergency Policy: Where do IEA Member Countries Stand?
Page | 9
Figure 5. Storage send‐out capacities, as percentage of peak demand
0%
20%
40%
60%
80%
100%
120%
140%
160%
180%
F i n l a n d
L u x e m b o u r g
N o r w a y
S w i t z e r l a n d
N e w
Z e a l a n d
I r e l a n d
S w e d e n
A u s t r a l i a
U n i t e
d K i n g d o m
T u r k e y
B e l g i u m
P o l a n d
I t a l y
D e n m a r k
S l o v a k R e p u b l i c
C z e c h R e p u b l i c
C a n a d a
G e r m a n y
F r a n c e
S p a i n
H u n g a r y
G r e e c e
N
e t h e r l a n d s
A u s t r i a
U n
i t e d S t a t e s
P o r t u g a l
J a p a n
K o r e a
Maximum send‐out from LNG, as % peak demand Maximum send‐out from UGS, as % peak demand
282%
Note: Defined as the maximum forecast daily demand under current market conditions, as indicated by each member country in their
questionnaire response.
Source: IEA Monthly Gas Statistics
External infrastructure resilience Developing domestic storage capacity is not the only way to enhance gas security: establishing
interconnections with
neighbouring
countries
is
another
key
means
of
improving
a country’s
resilience. Indeed, it is worth noting that some countries (e.g. Czech Republic Luxembourg, Slovak
Republic, Sweden and Switzerland) are connected to storage sites located in neighbouring countries.
Eight IEA member countries have a maximum inflow pipeline capacity that exceeds their peak
demand, thus providing a large degree of security of supply; maximum inflow capacity could
theoretically cover more than 70% of peak demand in 11 countries. It should be noted, however,
that the pipeline infrastructure in most of these countries is well‐developed because they often
serve as transit routes. As such, although the capacities are high, the totality of the gas transiting
through these inflow points cannot be considered accessible to the countries themselves.
Not all member countries are reliant on pipeline supplies, however; as mentioned above, LNG
regasification capacity
has
seen
strong
growth
in
IEA
member
countries
in
recent
years.
This
has
allowed for a strong increase in LNG imports into OECD Europe, which grew by 30% between
mid‐2009 and end‐2010. LNG supplies are of vital importance for otherwise isolated gas markets
such as Japan and Korea, but have also served an important role in strengthening the resilience
of the gas markets of Western Europe. Five countries (Greece, Japan, Korea, Portugal and Spain)
theoretically could cover their peak demand with their LNG import capacity alone.
Diversification of entry points and supplies is a key measure of external resilience, although the
ability of a country to diversify its supply sources depends significantly on its inherent geography.
The external resilience of certain Central and Eastern European countries is inherently weak, with
many depending on just one dominant entry point and supplier (namely, Russia). Interestingly, a
similar weakness is seen in Finland (depending on Russia) and Sweden (depending on Denmark),

7/29/2019 Gas Emergency Policy
http://slidepdf.com/reader/full/gas-emergency-policy 12/16
Gas Emergency Policy: Where do IEA Member Countries Stand? © OECD/IEA 2011
Page | 10
both of which are 100% dependent on a single entry point and supplier. Many European
countries are currently investing in making key gas pipelines reversible, so as to provide
additional resilience in the event of a crisis.
Figure 6. Import diversity of supplies
‐
0.10
0.20
0.30
0.40
0.50
0.60
0.70
0.80
0.90
1.00
F i n l a n d
I r e l a n d
S w e d e n
P o l a n d
C z e c h R e p u b l i c
U n i t e d S t a t e s
S l o v a k R e p u b l i c
H u n g a r y
S w i t z e r l a n d
L u x e m b o u r g
P o r t u g a l
A u s t r i a
G r e e c e
U n i t e d K i n g d o m
G e r m a n y
T u r k e y
I t a l y
B e l g i u m
F r a n c e
S p a i n
J a p a n
K o r e a
A u s t r a l i a
C a n a d a
D e n m a r k
N e t h e r l a n d s
N e w
Z e a l a n d
N o r w a y
Herfindahl ‐Hirschman index
not applicable*
* net exporter or no imports
Note: The Herfindahl‐Hirschman Index, an economic concept widely applied in anti‐trust and competition law, is defined in this
context as the sum of the squares of the market shares of the countries of imports for any given country. The index ranges from 0
(high diversified supplies) to 1.0 (one monopolistic supplier).
Source: IEA Monthly Gas Statistics.
The vast
majority
of
IEA
member
countries
identified
their
largest
entry
point.
Reassuringly,
some
24 countries indicated that their system would be able to cope, at least in the short‐term, if this
key entry point were disrupted (“N‐1” measurement). Predictably, the inherently less diversified
countries of Central and Eastern Europe would experience the most difficulties in sustaining gas
supplies in such an “N‐1” infrastructure environment in the longer term.
Policies and emergency measures To date, 21 IEA member countries have taken specific steps to develop natural gas emergency
policies. A similar number have designed a gas‐specific National Emergency Strategy Organisation
(NESO) or
dedicated
emergency
organisation
structure
for
dealing
with
gas
disruptions.
Countries
that have not designed any such policies or NESO structure are for the most part either gas
exporters and/or have highly resilient systems with numerous entry points (e.g. North America
and Japan/Korea).
Based on the questionnaire responses, nine IEA member countries have specific policies designed
around implementing interruptible contracts, or have based the resilience of their systems partly
on flexible interruptible contracts. Six IEA member countries have developed fuel‐switching
policies. It should be noted that the percentage of gas‐fired plants that can switch fuels has
decreased over the last decade, reflecting the progressive roll‐out of combined cycle gas turbine
(CCGT) plants. Indeed, the higher efficiencies from these plants mean that they are less flexible
and thus less able to switch fuel easily.

7/29/2019 Gas Emergency Policy
http://slidepdf.com/reader/full/gas-emergency-policy 13/16
© OECD/IEA 2011 Gas Emergency Policy: Where do IEA Member Countries Stand?
Page | 11
One interesting conclusion to be drawn from the questionnaire responses is that a number of IEA
member countries (all of which are in Europe) have placed some form of stockholding obligation
on their gas industry. Seven countries have placed a gas stock obligation on their domestic
players,3 and seven countries have imposed an obligation on certain gas‐consuming industry
players to hold stocks of an alternative fuel (e.g. gasoil, for gas‐fired power plants) to be used in
the event
of
a gas
disruption.
Combined
with
Hungary’s
public
stocks
at
its
disposal,
half
of
the
IEA’s member countries have developed specific stockholding measures related to gas that would
provide strong resilience in the event of a disruption.
Figure 7. Overview of gas emergency policies in IEA member countries
NESO for gas
disruption
Able tocope in an
N-1situation
Policypromoting
interruptiblecontracts
Policypromoting
fuelswitching
Government/agency
stockholding
Gas stockobligation
Alternativefuel
obligation
Australia yes yes
Austria yes yes
Belgium yes
Canada yes
Czech Republic yes yes
Denmark yes yes yes
Finland yes yes yes
France yes yes yes
Germany yes yes
Greece yes yes yes yes
Hungary yes yes yes yes
Ireland yes yes yes yes
Italy yes yes yes yes yesJapan yes
Korea yes
Luxembourg yes
Netherlands yes
New Zealand yes yes yes yes
Norway yes
Poland yes yes yes yes
Portugal yes yes yes yes
Slovak Republic yes yes yes
Spain yes yes yes yes
Sweden yes
Switzerland yes yes yes yes
Turkey yes yes yes yes yes
United Kingdom yes yes yes yes
United States yes
21 24 9 6 1 7 7
Source: Questionnaire responses from countries.
3 In Denmark the gas stockholding obligation is only placed on the transmission system operator.
7/29/2019 Gas Emergency Policy
http://slidepdf.com/reader/full/gas-emergency-policy 14/16
Gas Emergency Policy: Where do IEA Member Countries Stand? © OECD/IEA 2011
Page | 12
The IEA emphasises three overarching principles with regards to gas security, so as to minimise
the consequences of a gas disruption:
a) it is in every country’s interest to seek to maximise its diversification of sources of supply,
both in terms of entry points and suppliers;
b) because of
the
inherently
less
‐fungible
nature
of
natural
gas
compared
to
oil,
an
adequate
and resilient infrastructure network (both external and internal) and a flexible market that
can speedily redeploy gas are of vital importance; and
c) all countries should aim to develop a well‐balanced and flexible set of emergency policies
that can be implemented quickly and effectively in the event of a gas disruption.
The findings from this questionnaire demonstrate that most IEA member countries are
developing policies in this area, and overall emergency preparedness for gas crises is improving.

7/29/2019 Gas Emergency Policy
http://slidepdf.com/reader/full/gas-emergency-policy 15/16

7/29/2019 Gas Emergency Policy
http://slidepdf.com/reader/full/gas-emergency-policy 16/16
9 rue de la Fédération
75739 Paris Cedex 15
www.iea.org