Embed Size (px)
Citation preview
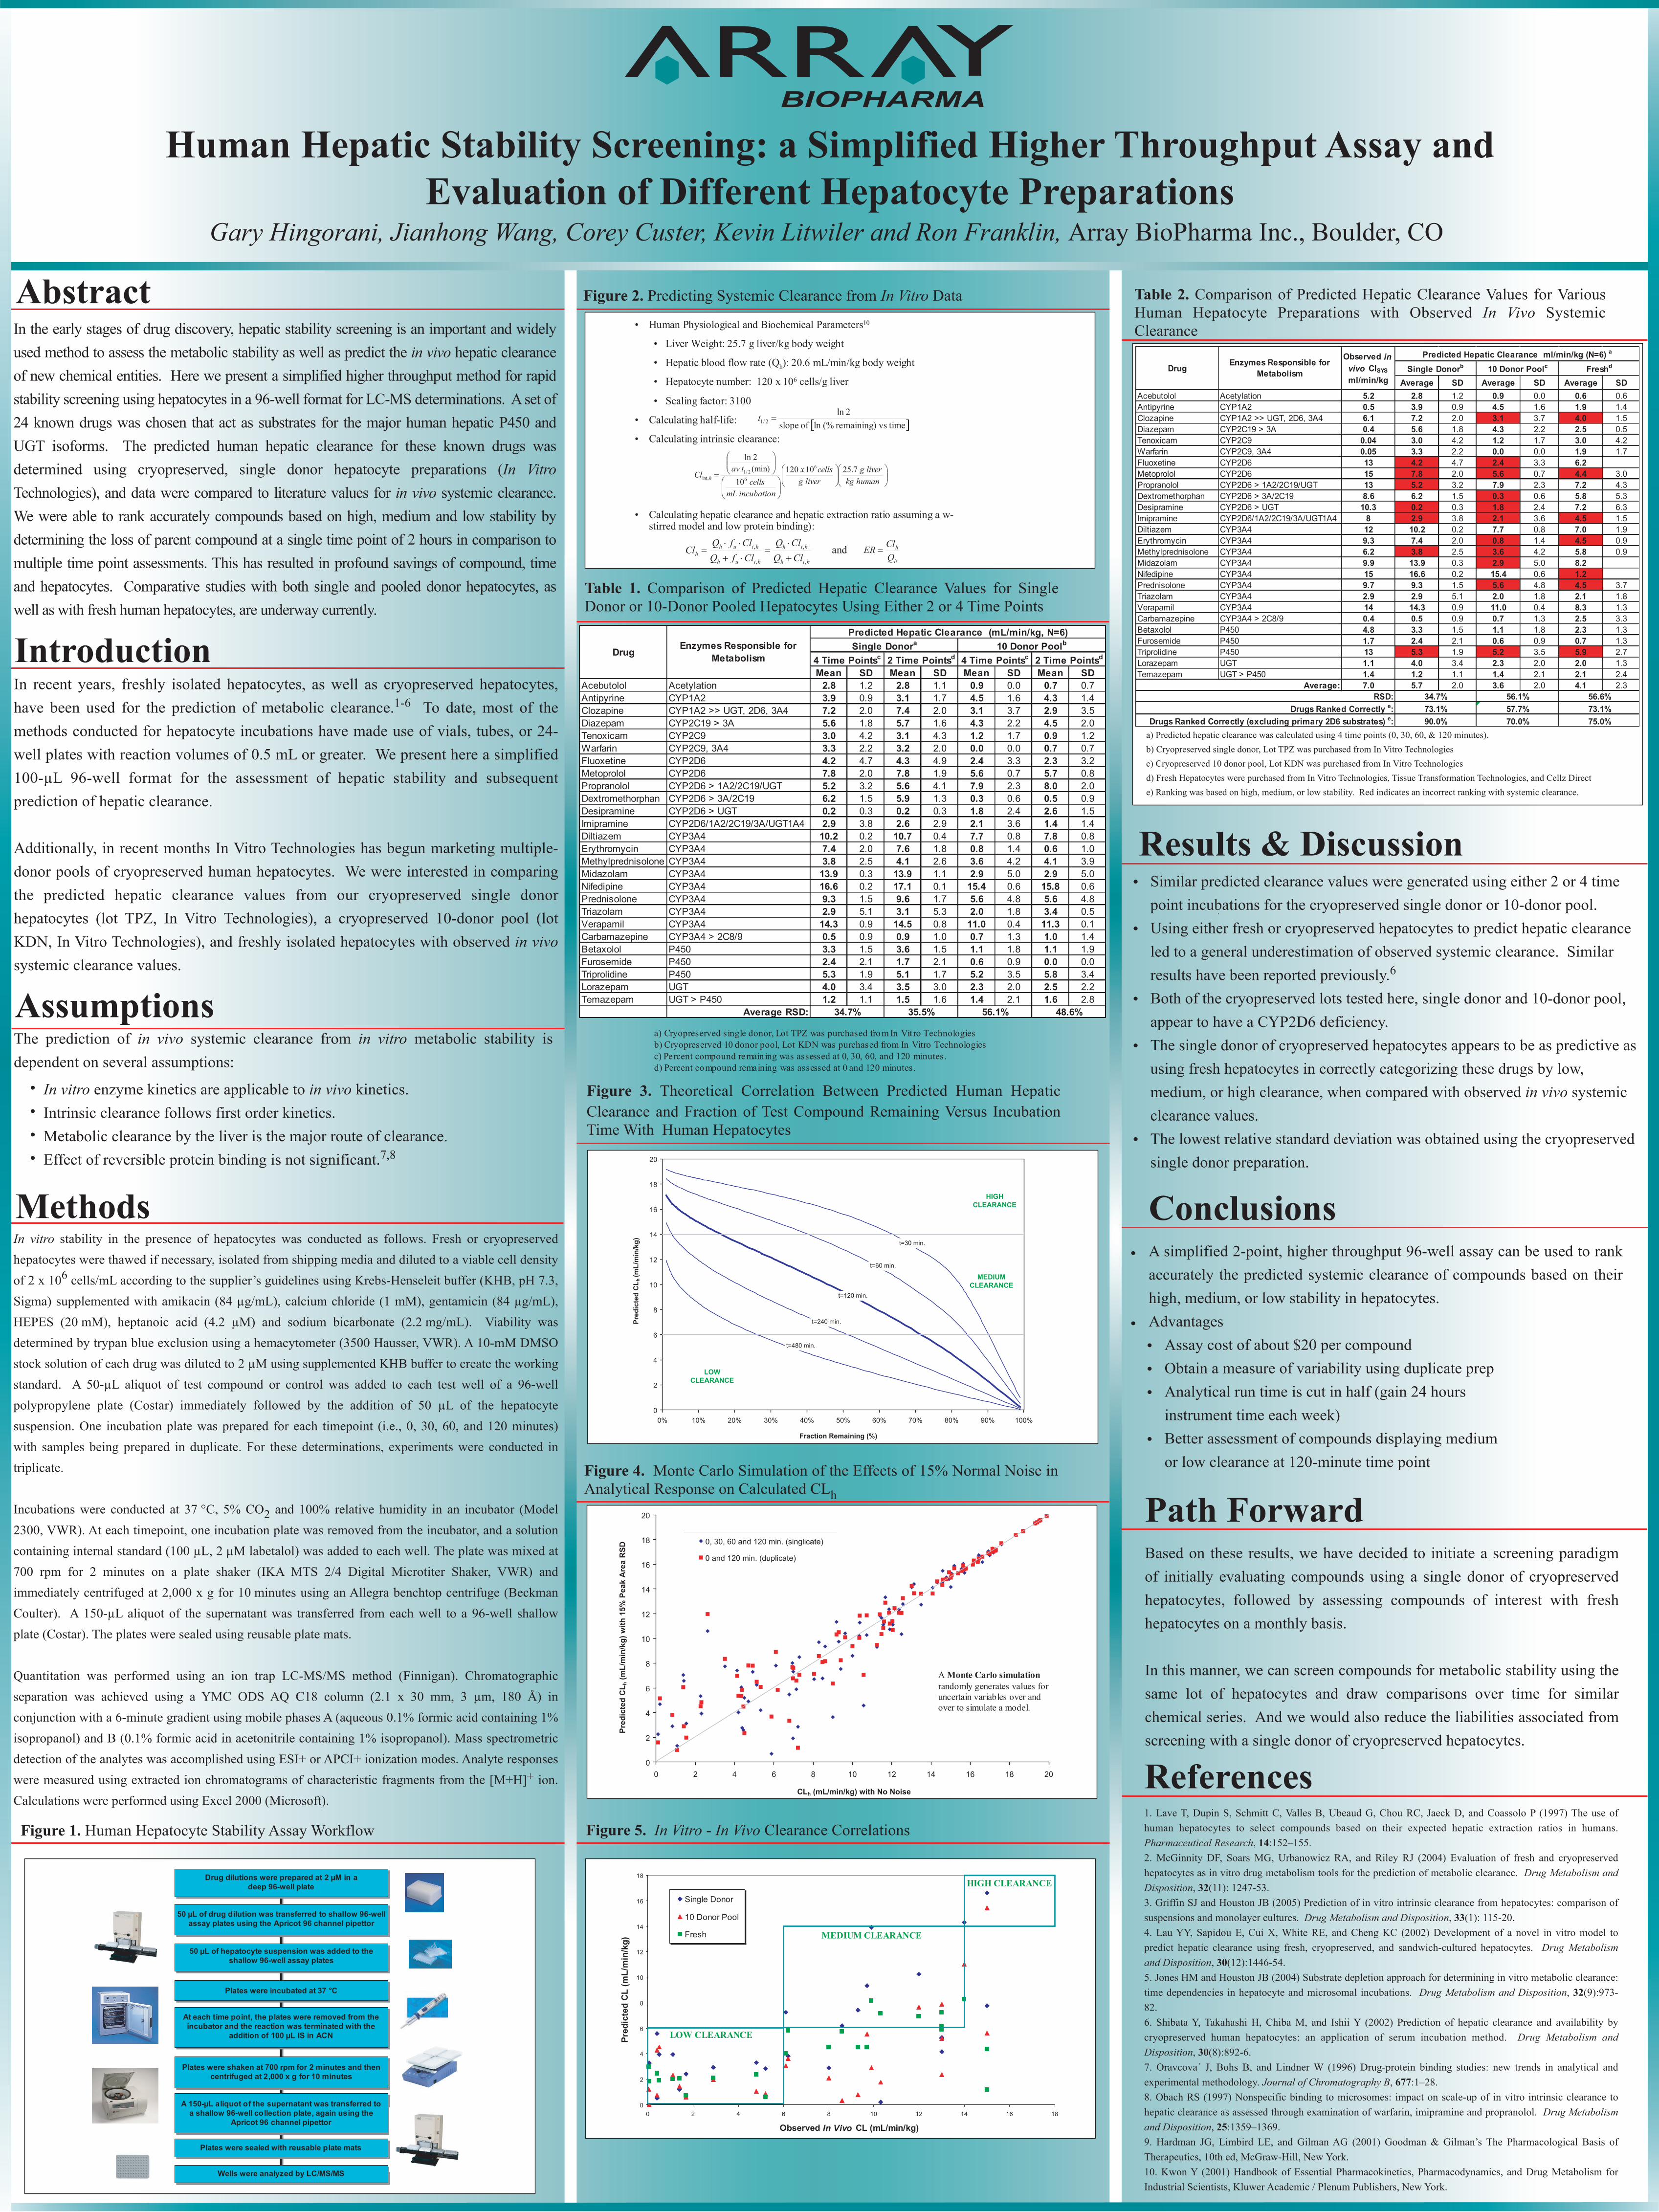
Human Hepatic Stability Screening: a Simplified Higher Throughput Assay and Evaluation of Different Hepatocyte Preparations
Gary Hingorani, Jianhong Wang, Corey Custer, Kevin Litwiler and Ron Franklin, Array BioPharma Inc., Boulder, CO
In the early stages of drug discovery, hepatic stability screening is an important and widely used method to assess the metabolic stability as well as predict the in vivo hepatic clearance of new chemical entities. Here we present a simplified higher throughput method for rapid stability screening using hepatocytes in a 96-well format for LC-MS determinations. A set of 24 known drugs was chosen that act as substrates for the major human hepatic P450 and UGT isoforms. The predicted human hepatic clearance for these known drugs was determined using cryopreserved, single donor hepatocyte preparations (In Vitro Technologies), and data were compared to literature values for in vivo systemic clearance. We were able to rank accurately compounds based on high, medium and low stability by determining the loss of parent compound at a single time point of 2 hours in comparison to multiple time point assessments. This has resulted in profound savings of compound, time and hepatocytes. Comparative studies with both single and pooled donor hepatocytes, as well as with fresh human hepatocytes, are underway currently.
In recent years, freshly isolated hepatocytes, as well as cryopreserved hepatocytes, have been used for the prediction of metabolic clearance.1-6 To date, most of the methods conducted for hepatocyte incubations have made use of vials, tubes, or 24-well plates with reaction volumes of 0.5 mL or greater. We present here a simplified 100-µL 96-well format for the assessment of hepatic stability and subsequent prediction of hepatic clearance.
Additionally, in recent months In Vitro Technologies has begun marketing multiple-donor pools of cryopreserved human hepatocytes. We were interested in comparing the predicted hepatic clearance values from our cryopreserved single donor hepatocytes (lot TPZ, In Vitro Technologies), a cryopreserved 10-donor pool (lot KDN, In Vitro Technologies), and freshly isolated hepatocytes with observed in vivo systemic clearance values.
Similar predicted clearance values were generated using either 2 or 4 time point incubations for the cryopreserved single donor or 10-donor pool.Using either fresh or cryopreserved hepatocytes to predict hepatic clearance led to a general underestimation of observed systemic clearance. Similar results have been reported previously.6
Both of the cryopreserved lots tested here, single donor and 10-donor pool, appear to have a CYP2D6 deficiency.The single donor of cryopreserved hepatocytes appears to be as predictive as using fresh hepatocytes in correctly categorizing these drugs by low, medium, or high clearance, when compared with observed in vivo systemic clearance values. The lowest relative standard deviation was obtained using the cryopreserved single donor preparation.
In vitro stability in the presence of hepatocytes was conducted as follows. Fresh or cryopreserved hepatocytes were thawed if necessary, isolated from shipping media and diluted to a viable cell density of 2 x 10⁶ cells/mL according to the supplier’s guidelines using Krebs-Henseleit buffer (KHB, pH 7.3, Sigma) supplemented with amikacin (84 µg/mL), calcium chloride (1 mM), gentamicin (84 µg/mL), HEPES (20 mM), heptanoic acid (4.2 µM) and sodium bicarbonate (2.2 mg/mL). Viability was determined by trypan blue exclusion using a hemacytometer (3500 Hausser, VWR). A 10-mM DMSO stock solution of each drug was diluted to 2 µM using supplemented KHB buffer to create the working standard. A 50-µL aliquot of test compound or control was added to each test well of a 96-well polypropylene plate (Costar) immediately followed by the addition of 50 µL of the hepatocyte suspension. One incubation plate was prepared for each timepoint (i.e., 0, 30, 60, and 120 minutes) with samples being prepared in duplicate. For these determinations, experiments were conducted in triplicate.
Incubations were conducted at 37 °C, 5% CO2 and 100% relative humidity in an incubator (Model 2300, VWR). At each timepoint, one incubation plate was removed from the incubator, and a solution containing internal standard (100 µL, 2 µM labetalol) was added to each well. The plate was mixed at 700 rpm for 2 minutes on a plate shaker (IKA MTS 2/4 Digital Microtiter Shaker, VWR) and immediately centrifuged at 2,000 x g for 10 minutes using an Allegra benchtop centrifuge (Beckman Coulter). A 150-µL aliquot of the supernatant was transferred from each well to a 96-well shallow plate (Costar). The plates were sealed using reusable plate mats.
Quantitation was performed using an ion trap LC-MS/MS method (Finnigan). Chromatographic separation was achieved using a YMC ODS AQ C18 column (2.1 x 30 mm, 3 µm, 180 Å) in conjunction with a 6-minute gradient using mobile phases A (aqueous 0.1% formic acid containing 1% isopropanol) and B (0.1% formic acid in acetonitrile containing 1% isopropanol). Mass spectrometric detection of the analytes was accomplished using ESI+ or APCI+ ionization modes. Analyte responses were measured using extracted ion chromatograms of characteristic fragments from the [M+H]+ ion. Calculations were performed using Excel 2000 (Microsoft).
Methods
Figure 2. Predicting Systemic Clearance from In Vitro Data
Conclusions
A simplified 2-point, higher throughput 96-well assay can be used to rank accurately the predicted systemic clearance of compounds based on their high, medium, or low stability in hepatocytes.AdvantagesAssay cost of about $20 per compound Obtain a measure of variability using duplicate prep Analytical run time is cut in half (gain 24 hours instrument time each week) Better assessment of compounds displaying medium or low clearance at 120-minute time point
Results & Discussion•
•
•
•
•
Figure 1. Human Hepatocyte Stability Assay Workflow
Table 1. Comparison of Predicted Hepatic Clearance Values for Single Donor or 10-Donor Pooled Hepatocytes Using Either 2 or 4 Time Points
In vitro enzyme kinetics are applicable to in vivo kinetics.Intrinsic clearance follows first order kinetics.Metabolic clearance by the liver is the major route of clearance.Effect of reversible protein binding is not significant.7,8
Assumptions
••••
The prediction of in vivo systemic clearance from in vitro metabolic stability is dependent on several assumptions:
Wells were analyzed by LC/MS/MS
Plates were shaken at 700 rpm for 2 minutes and then centrifuged at 2,000 x g for 10 minutes
Plates were incubated at 37 °C
50 µL of hepatocyte suspension was added to the shallow 96-well assay plates
Drug dilutions were prepared at 2 µM in a deep 96-well plate
50 µL of drug dilution was transferred to shallow 96-well assay plates using the Apricot 96 channel pipettor
At each time point, the plates were removed from the incubator and the reaction was terminated with the
addition of 100 µL IS in ACN
A 150-µL aliquot of the supernatant was transferred to a shallow 96-well collection plate, again using the
Apricot 96 channel pipettor
Plates were sealed with reusable plate mats
• Human Physiological and Biochemical Parameters10
• Liver Weight: 25.7 g liver/kg body weight
• Hepatic blood flow rate (Qh): 20.6 mL/min/kg body weight
• Hepatocyte number: 120 x 106 cells/g liver
• Scaling factor: 3100
• Calculating half-life:
• Calculating intrinsic clearance:
• Calculating hepatic clearance and hepatic extraction ratio assuming a w-stirred model and low protein binding):
=humankg
livergliverg
cellsx
incubationmLcells
tavCl h
7.251012010
(min)2ln
6
62/1
int,
hih
hih
hiuh
hiuhh ClQ
ClQClfQClfQ
Cl,
,
,
,
+⋅
=⋅+⋅⋅
=
[ ] time vsremaining) (%ln of slope2ln
2/1 =t
h
h
QClER =and
a) Cryopreserved single donor, Lot TPZ was purchased from In Vit ro Technologiesb) Cryopreserved 10 donor pool, Lot KDN was purchased from In Vitro Technologiesc) Percent compound remain ing was assessed at 0, 30, 60, and 120 minutes. d) Percent compound remaining was assessed at 0 and 120 minutes.
Mean SD Mean SD Mean SD Mean SDAcebutolol Acetylation 2.8 1.2 2.8 1.1 0.9 0.0 0.7 0.7Antipyrine CYP1A2 3.9 0.9 3.1 1.7 4.5 1.6 4.3 1.4Clozapine CYP1A2 >> UGT, 2D6, 3A4 7.2 2.0 7.4 2.0 3.1 3.7 2.9 3.5Diazepam CYP2C19 > 3A 5.6 1.8 5.7 1.6 4.3 2.2 4.5 2.0Tenoxicam CYP2C9 3.0 4.2 3.1 4.3 1.2 1.7 0.9 1.2Warfarin CYP2C9, 3A4 3.3 2.2 3.2 2.0 0.0 0.0 0.7 0.7Fluoxetine CYP2D6 4.2 4.7 4.3 4.9 2.4 3.3 2.3 3.2Metoprolol CYP2D6 7.8 2.0 7.8 1.9 5.6 0.7 5.7 0.8Propranolol CYP2D6 > 1A2/2C19/UGT 5.2 3.2 5.6 4.1 7.9 2.3 8.0 2.0Dextromethorphan CYP2D6 > 3A/2C19 6.2 1.5 5.9 1.3 0.3 0.6 0.5 0.9Desipramine CYP2D6 > UGT 0.2 0.3 0.2 0.3 1.8 2.4 2.6 1.5Imipramine CYP2D6/1A2/2C19/3A/UGT1A4 2.9 3.8 2.6 2.9 2.1 3.6 1.4 1.4Diltiazem CYP3A4 10.2 0.2 10.7 0.4 7.7 0.8 7.8 0.8Erythromycin CYP3A4 7.4 2.0 7.6 1.8 0.8 1.4 0.6 1.0Methylprednisolone CYP3A4 3.8 2.5 4.1 2.6 3.6 4.2 4.1 3.9Midazolam CYP3A4 13.9 0.3 13.9 1.1 2.9 5.0 2.9 5.0Nifedipine CYP3A4 16.6 0.2 17.1 0.1 15.4 0.6 15.8 0.6Prednisolone CYP3A4 9.3 1.5 9.6 1.7 5.6 4.8 5.6 4.8Triazolam CYP3A4 2.9 5.1 3.1 5.3 2.0 1.8 3.4 0.5Verapamil CYP3A4 14.3 0.9 14.5 0.8 11.0 0.4 11.3 0.1Carbamazepine CYP3A4 > 2C8/9 0.5 0.9 0.9 1.0 0.7 1.3 1.0 1.4Betaxolol P450 3.3 1.5 3.6 1.5 1.1 1.8 1.1 1.9Furosemide P450 2.4 2.1 1.7 2.1 0.6 0.9 0.0 0.0Triprolidine P450 5.3 1.9 5.1 1.7 5.2 3.5 5.8 3.4Lorazepam UGT 4.0 3.4 3.5 3.0 2.3 2.0 2.5 2.2Temazepam UGT > P450 1.2 1.1 1.5 1.6 1.4 2.1 1.6 2.8
Average RSD: 34.7% 35.5% 56.1% 48.6%
Predicted Hepatic Clearance (mL/min/kg, N=6)
Drug Enzymes Responsible for Metabolism
Single Donora 10 Donor Poolb
4 Time Pointsc 2 Time Pointsd 4 Time Pointsc 2 Time Pointsd
0
2
4
6
8
10
12
14
16
18
20
0% 10% 20% 30% 40% 50% 60% 70% 80% 90% 100%
Fraction Remaining (%)
Pred
icte
d C
L h (m
L/m
in/k
g) t=30 min.
t=60 min.
t=120 min.
t=240 min.
t=480 min.
HIGH CLEARANCE
MEDIUM CLEARANCE
LOW CLEARANCE
Figure 3. Theoretical Correlation Between Predicted Human Hepatic Clearance and Fraction of Test Compound Remaining Versus Incubation Time With Human Hepatocytes
0
2
4
6
8
10
12
14
16
18
20
0 2 4 6 8 10 12 14 16 18 20
CLh (mL/min/kg) with No Noise
Pred
icte
d C
L h (m
L/m
in/k
g) w
ith 1
5% P
eak
Are
a R
SD
0, 30, 60 and 120 min. (singlicate)
0 and 120 min. (duplicate)
Figure 4. Monte Carlo Simulation of the Effects of 15% Normal Noise in Analytical Response on Calculated CLh
Average SD Average SD Average SDAcebutolol Acetylation 5.2 2.8 1.2 0.9 0.0 0.6 0.6Antipyrine CYP1A2 0.5 3.9 0.9 4.5 1.6 1.9 1.4Clozapine CYP1A2 >> UGT, 2D6, 3A4 6.1 7.2 2.0 3.1 3.7 4.0 1.5Diazepam CYP2C19 > 3A 0.4 5.6 1.8 4.3 2.2 2.5 0.5Tenoxicam CYP2C9 0.04 3.0 4.2 1.2 1.7 3.0 4.2Warfarin CYP2C9, 3A4 0.05 3.3 2.2 0.0 0.0 1.9 1.7Fluoxetine CYP2D6 13 4.2 4.7 2.4 3.3 6.2Metoprolol CYP2D6 15 7.8 2.0 5.6 0.7 4.4 3.0Propranolol CYP2D6 > 1A2/2C19/UGT 13 5.2 3.2 7.9 2.3 7.2 4.3Dextromethorphan CYP2D6 > 3A/2C19 8.6 6.2 1.5 0.3 0.6 5.8 5.3Desipramine CYP2D6 > UGT 10.3 0.2 0.3 1.8 2.4 7.2 6.3Imipramine CYP2D6/1A2/2C19/3A/UGT1A4 8 2.9 3.8 2.1 3.6 4.5 1.5Diltiazem CYP3A4 12 10.2 0.2 7.7 0.8 7.0 1.9Erythromycin CYP3A4 9.3 7.4 2.0 0.8 1.4 4.5 0.9Methylprednisolone CYP3A4 6.2 3.8 2.5 3.6 4.2 5.8 0.9Midazolam CYP3A4 9.9 13.9 0.3 2.9 5.0 8.2Nifedipine CYP3A4 15 16.6 0.2 15.4 0.6 1.2Prednisolone CYP3A4 9.7 9.3 1.5 5.6 4.8 4.5 3.7Triazolam CYP3A4 2.9 2.9 5.1 2.0 1.8 2.1 1.8Verapamil CYP3A4 14 14.3 0.9 11.0 0.4 8.3 1.3Carbamazepine CYP3A4 > 2C8/9 0.4 0.5 0.9 0.7 1.3 2.5 3.3Betaxolol P450 4.8 3.3 1.5 1.1 1.8 2.3 1.3Furosemide P450 1.7 2.4 2.1 0.6 0.9 0.7 1.3Triprolidine P450 13 5.3 1.9 5.2 3.5 5.9 2.7Lorazepam UGT 1.1 4.0 3.4 2.3 2.0 2.0 1.3Temazepam UGT > P450 1.4 1.2 1.1 1.4 2.1 2.1 2.4
7.0 5.7 2.0 3.6 2.0 4.1 2.3
73.1%75.0%
73.1%90.0%
57.7%70.0%
10 Donor PoolcPredicted Hepatic Clearance ml/min/kg (N=6) a
Freshd
56.1% 56.6%
Drug Enzymes Responsible for Metabolism
Observed in vivo ClSYS
ml/min/kg
34.7%
Single Donorb
Drugs Ranked Correctly e:Drugs Ranked Correctly (excluding primary 2D6 substrates) e:
Average:RSD:
a) Predicted hepatic clearance was calculated using 4 time points (0, 30, 60, & 120 minutes).b) Cryopreserved single donor, Lot TPZ was purchased from In Vitro Technologiesc) Cryopreserved 10 donor pool, Lot KDN was purchased from In Vitro Technologiesd) Fresh Hepatocytes were purchased from In Vitro Technologies, Tissue Transformation Technologies, and Cellz Directe) Ranking was based on high, medium, or low stability. Red indicates an incorrect ranking with systemic clearance.
Table 2. Comparison of Predicted Hepatic Clearance Values for Various Human Hepatocyte Preparations with Observed In Vivo Systemic Clearance
0
2
4
6
8
10
12
14
16
18
0 2 4 6 8 10 12 14 16 18
Observed In Vivo CL (mL/min/kg)
Pred
icte
d CL
(mL/
min
/kg)
Single Donor
10 Donor Pool
Fresh
Figure 5. In Vitro - In Vivo Clearance Correlations
•
••••
•
Path Forward
Based on these results, we have decided to initiate a screening paradigm of initially evaluating compounds using a single donor of cryopreserved hepatocytes, followed by assessing compounds of interest with fresh hepatocytes on a monthly basis.
In this manner, we can screen compounds for metabolic stability using the same lot of hepatocytes and draw comparisons over time for similar chemical series. And we would also reduce the liabilities associated from screening with a single donor of cryopreserved hepatocytes.
Introduction
Abstract
References
1. Lave T, Dupin S, Schmitt C, Valles B, Ubeaud G, Chou RC, Jaeck D, and Coassolo P (1997) The use of human hepatocytes to select compounds based on their expected hepatic extraction ratios in humans. Pharmaceutical Research, 14:152–155.2. McGinnity DF, Soars MG, Urbanowicz RA, and Riley RJ (2004) Evaluation of fresh and cryopreserved hepatocytes as in vitro drug metabolism tools for the prediction of metabolic clearance. Drug Metabolism and Disposition, 32(11): 1247-53.3. Griffin SJ and Houston JB (2005) Prediction of in vitro intrinsic clearance from hepatocytes: comparison of suspensions and monolayer cultures. Drug Metabolism and Disposition, 33(1): 115-20. 4. Lau YY, Sapidou E, Cui X, White RE, and Cheng KC (2002) Development of a novel in vitro model to predict hepatic clearance using fresh, cryopreserved, and sandwich-cultured hepatocytes. Drug Metabolism and Disposition, 30(12):1446-54.5. Jones HM and Houston JB (2004) Substrate depletion approach for determining in vitro metabolic clearance: time dependencies in hepatocyte and microsomal incubations. Drug Metabolism and Disposition, 32(9):973-82.6. Shibata Y, Takahashi H, Chiba M, and Ishii Y (2002) Prediction of hepatic clearance and availability by cryopreserved human hepatocytes: an application of serum incubation method. Drug Metabolism and Disposition, 30(8):892-6.7. Oravcova´ J, Bohs B, and Lindner W (1996) Drug-protein binding studies: new trends in analytical and experimental methodology. Journal of Chromatography B, 677:1–28.8. Obach RS (1997) Nonspecific binding to microsomes: impact on scale-up of in vitro intrinsic clearance to hepatic clearance as assessed through examination of warfarin, imipramine and propranolol. Drug Metabolism and Disposition, 25:1359–1369.9. Hardman JG, Limbird LE, and Gilman AG (2001) Goodman & Gilman’s The Pharmacological Basis of Therapeutics, 10th ed, McGraw-Hill, New York.10. Kwon Y (2001) Handbook of Essential Pharmacokinetics, Pharmacodynamics, and Drug Metabolism for Industrial Scientists, Kluwer Academic / Plenum Publishers, New York.
LOW CLEARANCE
MEDIUM CLEARANCE
HIGH CLEARANCE
A Monte Carlo simulationrandomly generates values for uncertain variables over and over to simulate a model.