Embed Size (px)
Citation preview
GAPS BETWEEN PATENT
APPLICATIONS AND GRANTS
IN JOINT LICENSING NETWORKS
IN A JAPANESE BIOCLUSTER
International Workshop:
Regional Innovation Capability and Technology Transfer in Biotechnology Clusters :
New Recipes in Japan and Europe?
Sep. 20, 2013
CEEJA, Kientzheim, France
Naoki Wakabayashi Graduate School of Management
Content
1. Introduction
2. Technology Transfer Networks in Bioclusters
3. Frameworks
4. Hypothesis
5. Research Context
6. Comparison of Application and Grant Networks
7. Factors for Successful Partnership
8. Conclusion
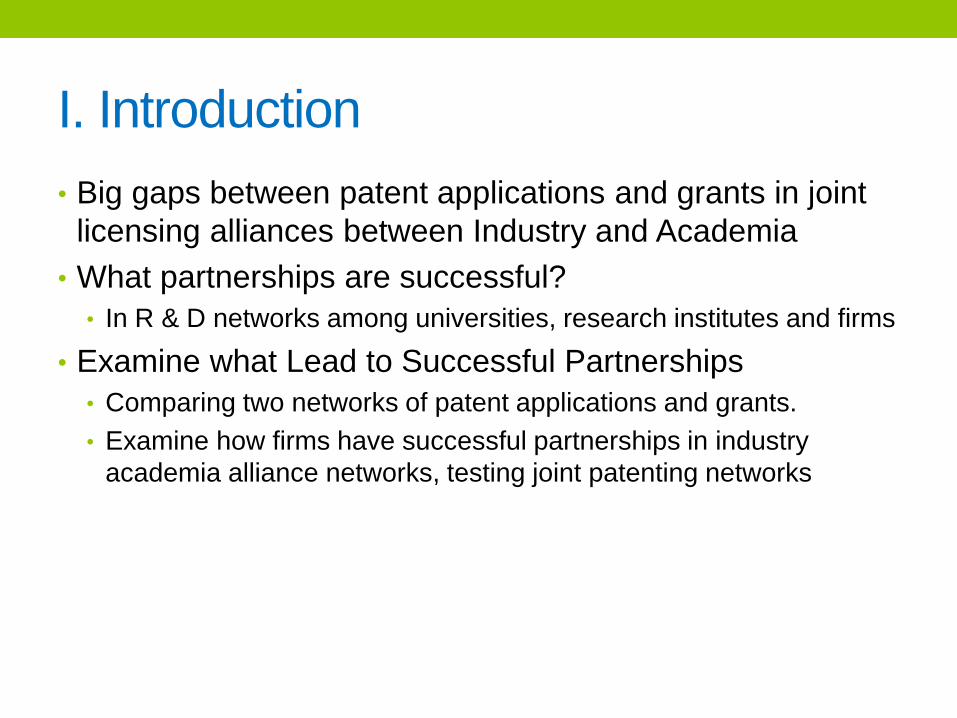
I. Introduction
• Big gaps between patent applications and grants in joint
licensing alliances between Industry and Academia
• What partnerships are successful?
• In R & D networks among universities, research institutes and firms
• Examine what Lead to Successful Partnerships
• Comparing two networks of patent applications and grants.
• Examine how firms have successful partnerships in industry
academia alliance networks, testing joint patenting networks
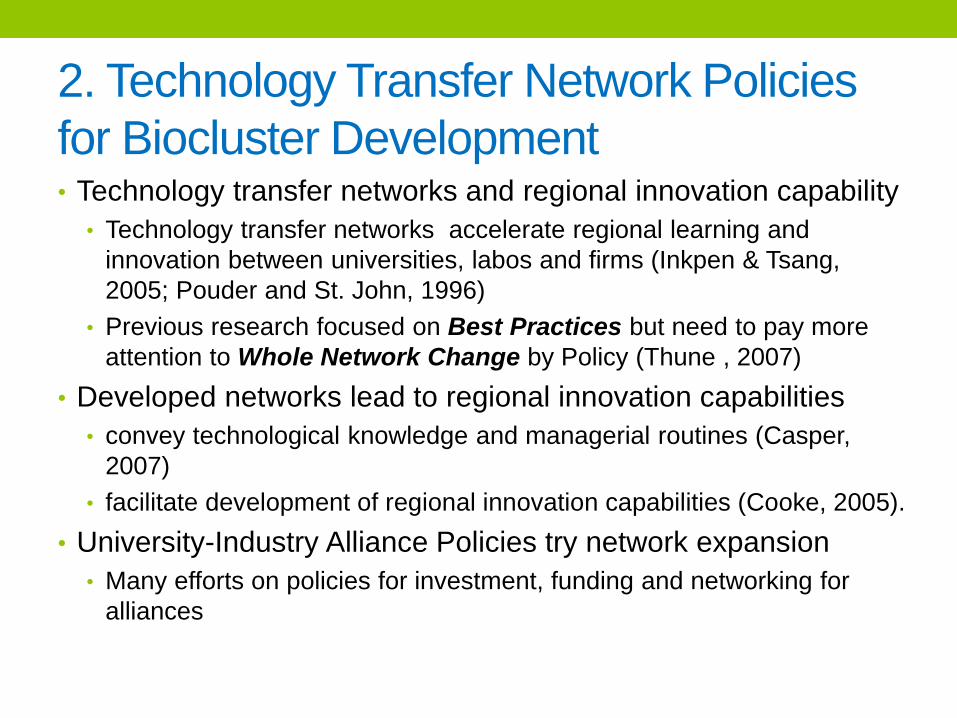
2. Technology Transfer Network Policies
for Biocluster Development • Technology transfer networks and regional innovation capability
• Technology transfer networks accelerate regional learning and
innovation between universities, labos and firms (Inkpen & Tsang,
2005; Pouder and St. John, 1996)
• Previous research focused on Best Practices but need to pay more
attention to Whole Network Change by Policy (Thune , 2007)
• Developed networks lead to regional innovation capabilities
• convey technological knowledge and managerial routines (Casper,
2007)
• facilitate development of regional innovation capabilities (Cooke, 2005).
• University-Industry Alliance Policies try network expansion
• Many efforts on policies for investment, funding and networking for
alliances
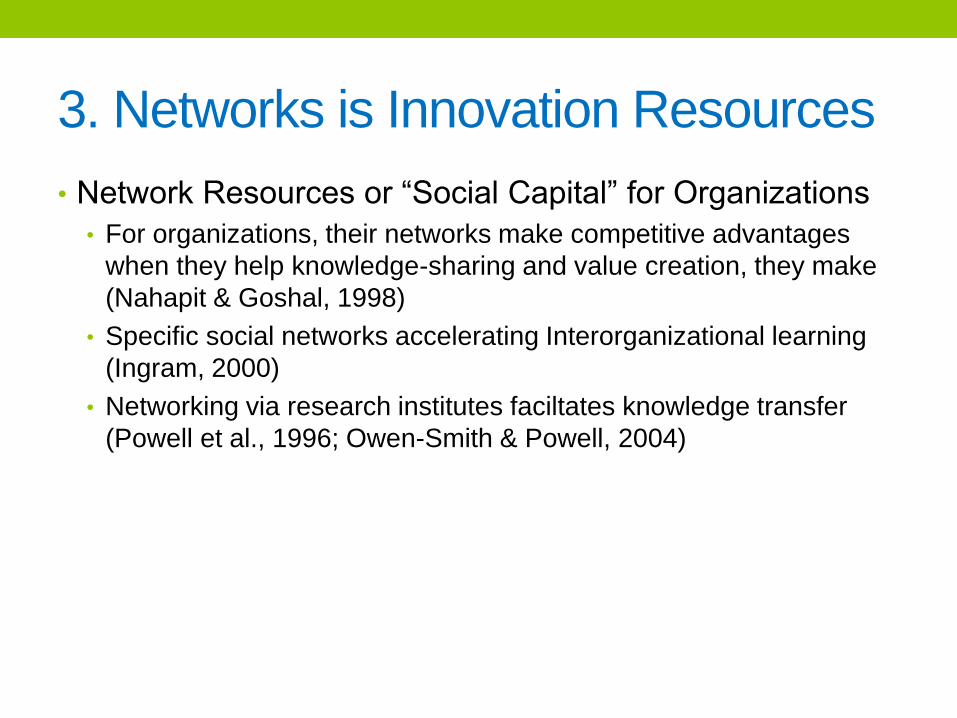
3. Networks is Innovation Resources
• Network Resources or “Social Capital” for Organizations
• For organizations, their networks make competitive advantages
when they help knowledge-sharing and value creation, they make
(Nahapit & Goshal, 1998)
• Specific social networks accelerating Interorganizational learning
(Ingram, 2000)
• Networking via research institutes faciltates knowledge transfer
(Powell et al., 1996; Owen-Smith & Powell, 2004)
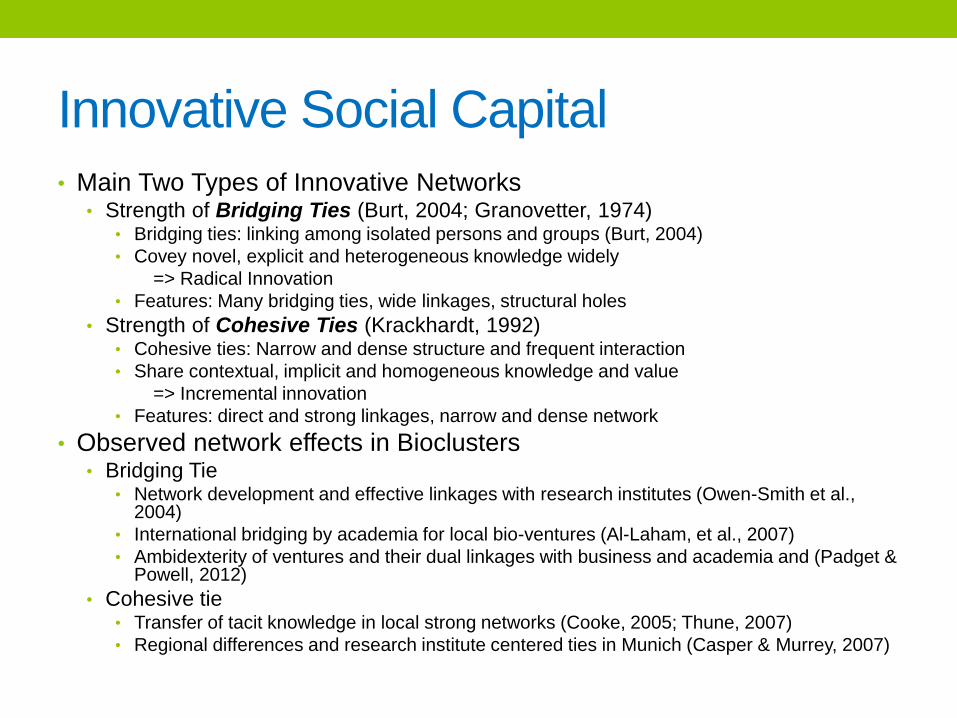
Innovative Social Capital
• Main Two Types of Innovative Networks • Strength of Bridging Ties (Burt, 2004; Granovetter, 1974)
• Bridging ties: linking among isolated persons and groups (Burt, 2004)
• Covey novel, explicit and heterogeneous knowledge widely
=> Radical Innovation
• Features: Many bridging ties, wide linkages, structural holes
• Strength of Cohesive Ties (Krackhardt, 1992) • Cohesive ties: Narrow and dense structure and frequent interaction
• Share contextual, implicit and homogeneous knowledge and value
=> Incremental innovation
• Features: direct and strong linkages, narrow and dense network
• Observed network effects in Bioclusters • Bridging Tie
• Network development and effective linkages with research institutes (Owen-Smith et al., 2004)
• International bridging by academia for local bio-ventures (Al-Laham, et al., 2007)
• Ambidexterity of ventures and their dual linkages with business and academia and (Padget & Powell, 2012)
• Cohesive tie • Transfer of tacit knowledge in local strong networks (Cooke, 2005; Thune, 2007)
• Regional differences and research institute centered ties in Munich (Casper & Murrey, 2007)
4. Three Major Hypothesis
• H1: Bridging tie effects
• In regional industry academia networks, firms with bridging ties are
likely to meet high performing partners and succeed in patenting.
• H2: Cohesive tie effects
• In regional industry academia networks, firms with cohesive ties are
likely to intensively collaborate with high performing partners and
succeed in patenting.
• H3: Laboratory tie effects
• In regional industry academia networks, firms with many laboratory
ties are likely to have many successful partners in patenting
• I will attempt to check these network effects with my data.
5-1. University Industry Alliance Policies in
Japan • Network Dynamics and Institutional Policy
• New Japanese institutional policies accelerate formation of industry
and academia interfaces (Woolgar, 2007)
• Strong Government policy pushing for life science
industries in Japan in 2000’s (Motohashi ed., 2009)
• Increase of university industry alliances and bio-ventures from
universities
• Increase of patenting from academia
• Japanese Contexts in Life Science Industry
• Dominance of big companies of food, pharmaceutical, chemical
industry (Goto & Odagiri, eds, 2003)
• Higher value of licenses from industry than acadmia (Nakamura,
2009)
TLO Policy Changes during 2000’s
1. Partial Privatization: National University become State Agencies
• National University Corporation Act from 2004
• More contribution of national universities to industrial development
2. Organizational Intellectual Property Policy Changes
• IPO Policy Changes from 2004
• Reinforcement of IPO Management in University
• Change of IPO Ownership: From Researcher to University
3. Promotion of Industry Academia Alliances
• Rapid increase of alliances from universities
• Rapid growth of Joint R & D alliance networks in Bioclusters
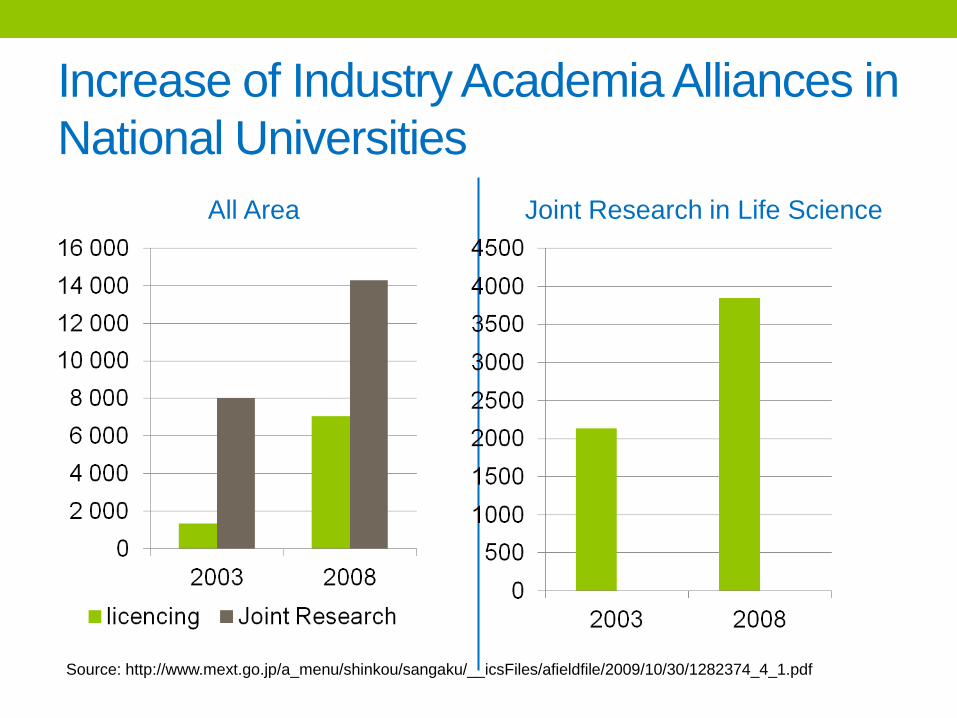
Increase of Industry Academia Alliances in
National Universities
All Area Joint Research in Life Science
Source: http://www.mext.go.jp/a_menu/shinkou/sangaku/__icsFiles/afieldfile/2009/10/30/1282374_4_1.pdf
5-2. Kansai Biotechnology Cluster
• One of the Biggest Biotechnology Clusters
• Kansai Area: West Japan
• 200 firms, 36 universities, 14 institutions, 12 incubators in 9
prefectures (Ibata-Arens, 2005)
• Main Industries
• Pharmaceutical, Food, Medical Equipment
• National Development Program set by METI
• Kansai Bio Cluster Development Program in 2000’s
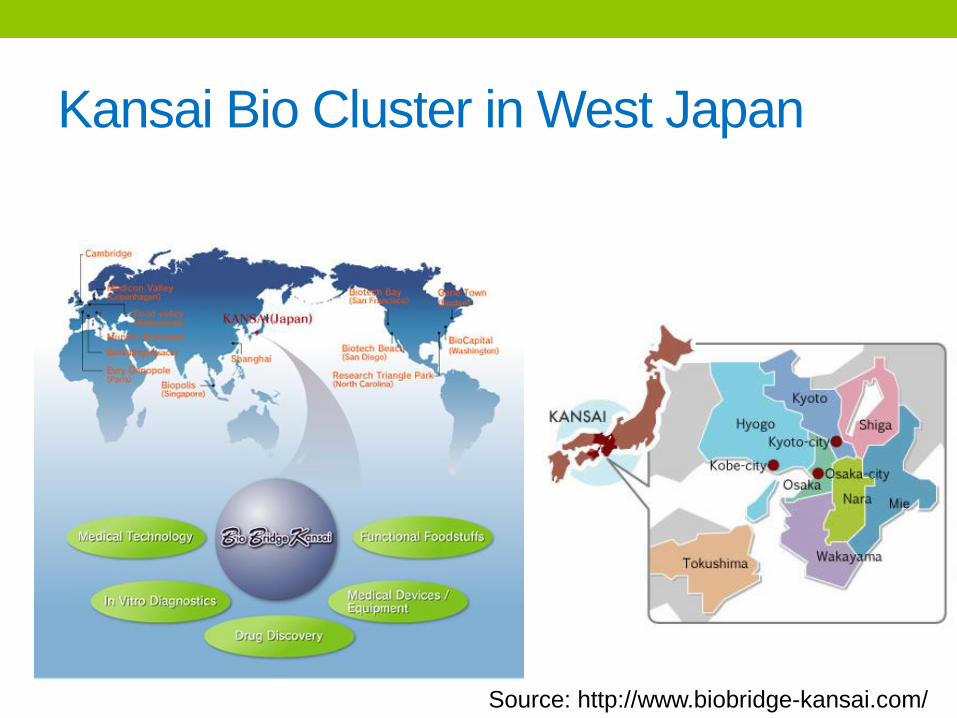
Kansai Bio Cluster in West Japan
Source: http://www.biobridge-kansai.com/
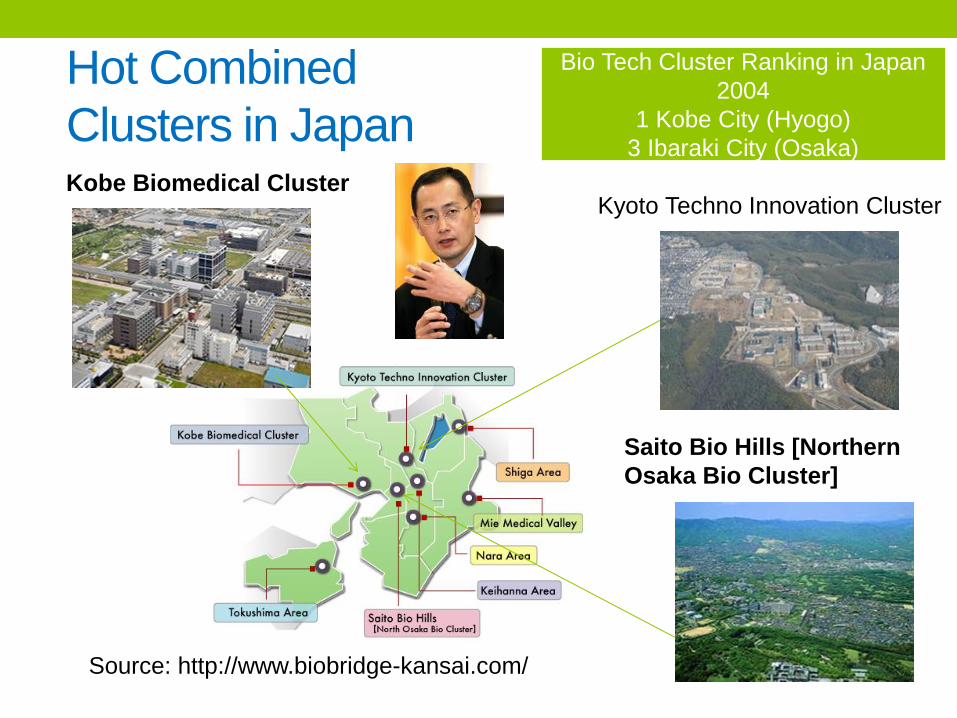
Kobe Biomedical Cluster
Saito Bio Hills [Northern
Osaka Bio Cluster]
Kyoto Techno Innovation Cluster
Source: http://www.biobridge-kansai.com/
Hot Combined
Clusters in Japan
Bio Tech Cluster Ranking in Japan
2004
1 Kobe City (Hyogo)
3 Ibaraki City (Osaka)
Three Main Players
14
1. Pharmaceutical firms
• Tanabe Mitsubishi, Dainihon Sumitomo, Shionogi, Takeda
Pharma
2. University
• Osaka University, Kyoto University, Kinki University
3. Local and National Governmental Research
Institutes
• The National Institute of Advanced Industrial Science and
Technology , Japan Science and Technology Agency
• Osaka Bio Science Institute
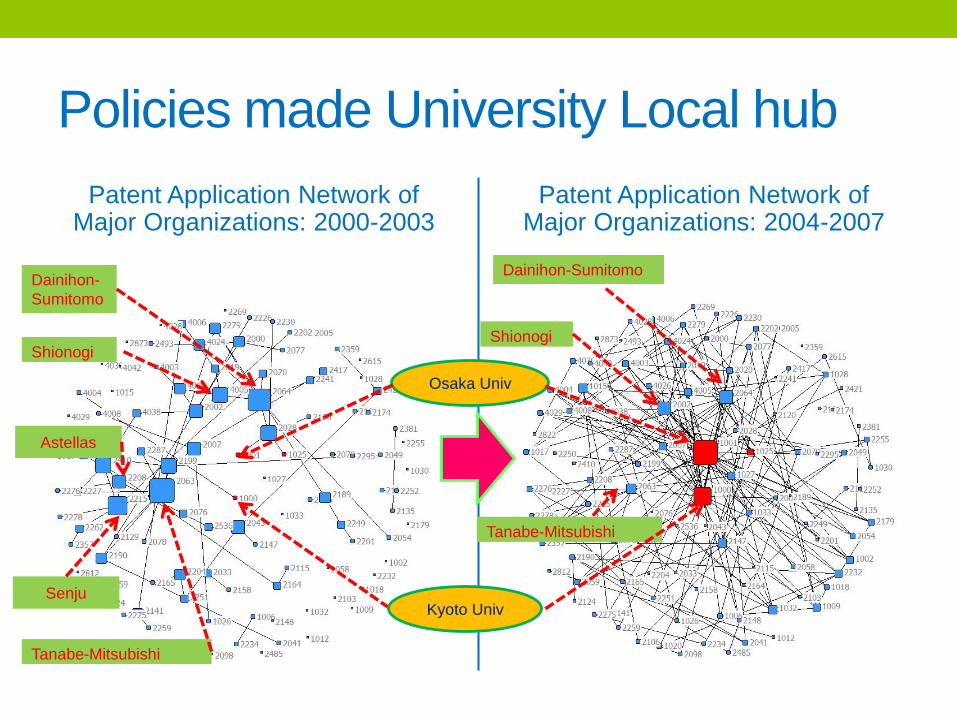
Policies made University Local hub
Patent Application Network of Major Organizations: 2000-2003
Patent Application Network of Major Organizations: 2004-2007
Tanabe-Mitsubishi
Astellas
Senju
Dainihon-
Sumitomo
Shionogi Shionogi
Tanabe-Mitsubishi
Dainihon-Sumitomo
Osaka Univ
Kyoto Univ
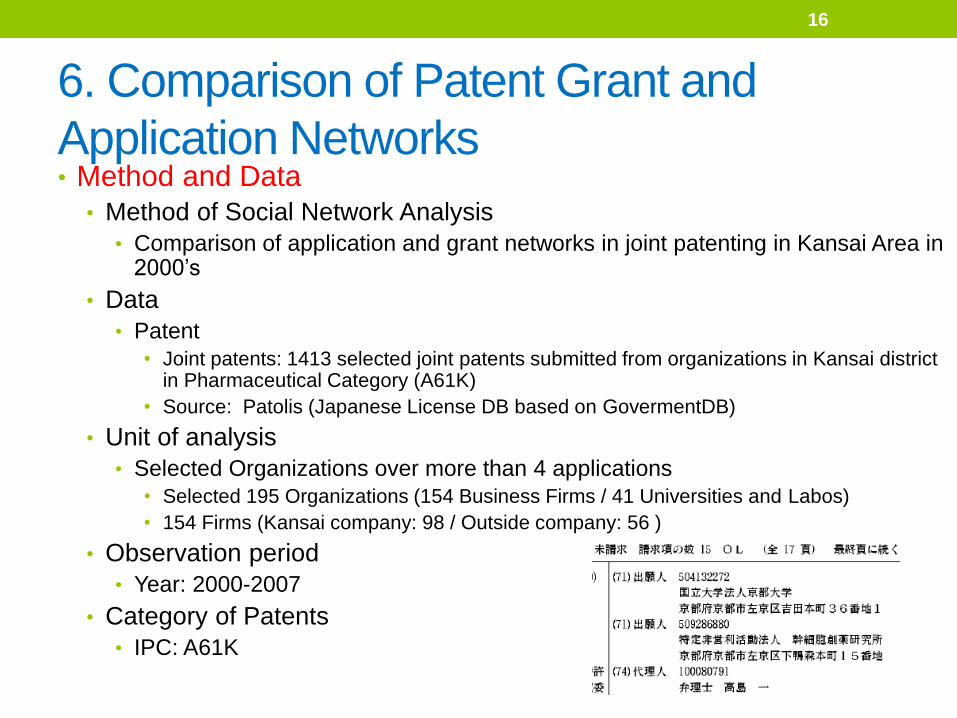
6. Comparison of Patent Grant and
Application Networks • Method and Data
• Method of Social Network Analysis
• Comparison of application and grant networks in joint patenting in Kansai Area in 2000’s
• Data
• Patent
• Joint patents: 1413 selected joint patents submitted from organizations in Kansai district in Pharmaceutical Category (A61K)
• Source: Patolis (Japanese License DB based on GovermentDB)
• Unit of analysis
• Selected Organizations over more than 4 applications
• Selected 195 Organizations (154 Business Firms / 41 Universities and Labos)
• 154 Firms (Kansai company: 98 / Outside company: 56 )
• Observation period
• Year: 2000-2007
• Category of Patents
• IPC: A61K
16
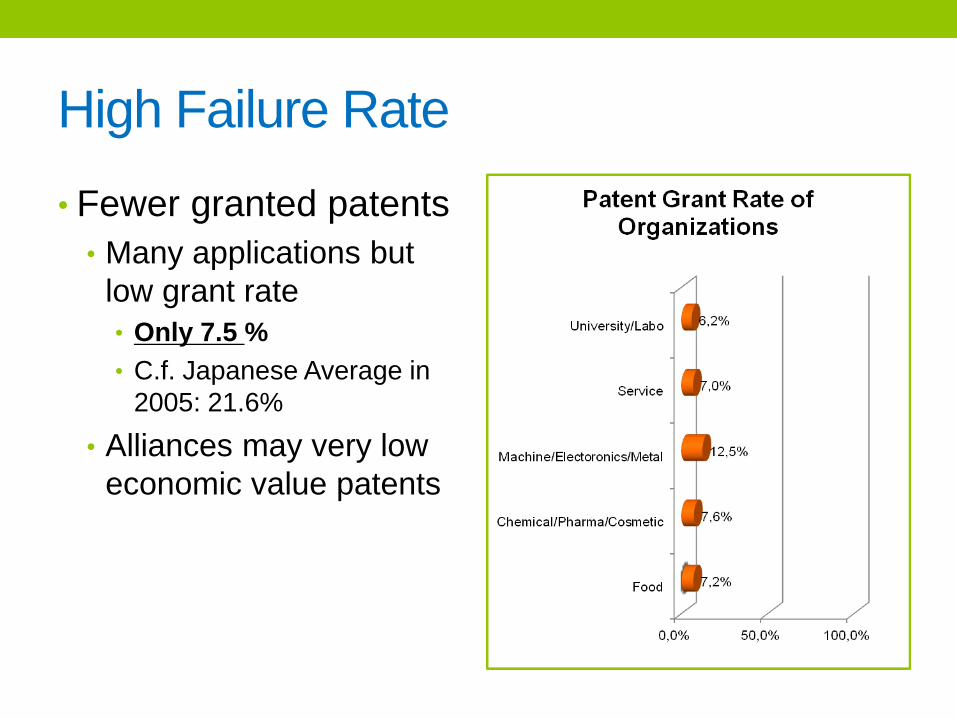
High Failure Rate
• Fewer granted patents
• Many applications but
low grant rate
• Only 7.5 %
• C.f. Japanese Average in
2005: 21.6%
• Alliances may very low
economic value patents
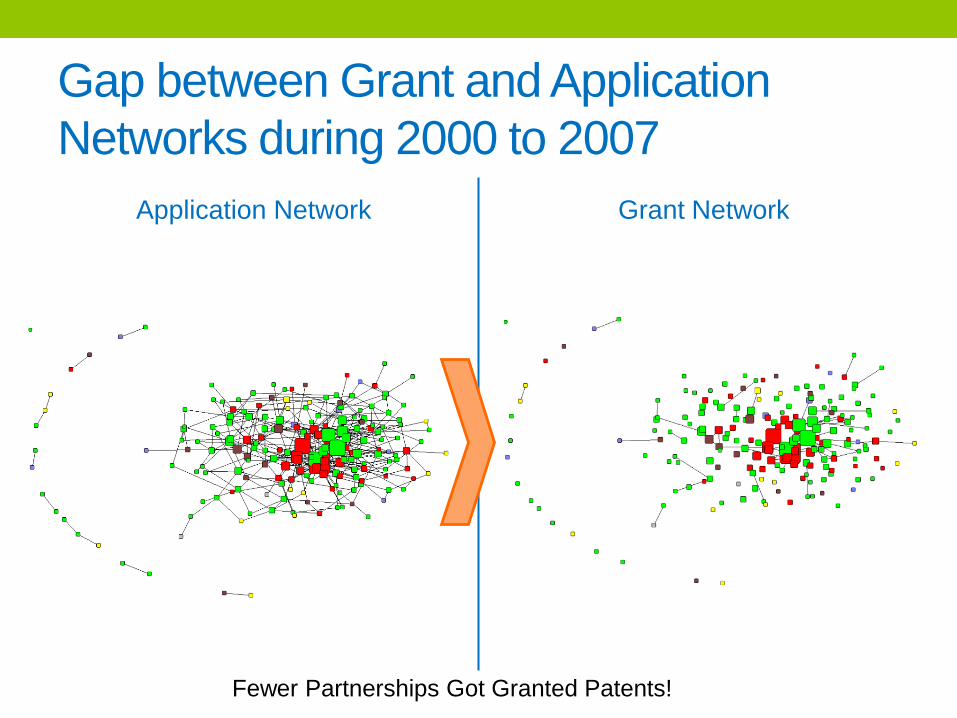
Gap between Grant and Application
Networks during 2000 to 2007
Application Network Grant Network
Fewer Partnerships Got Granted Patents!
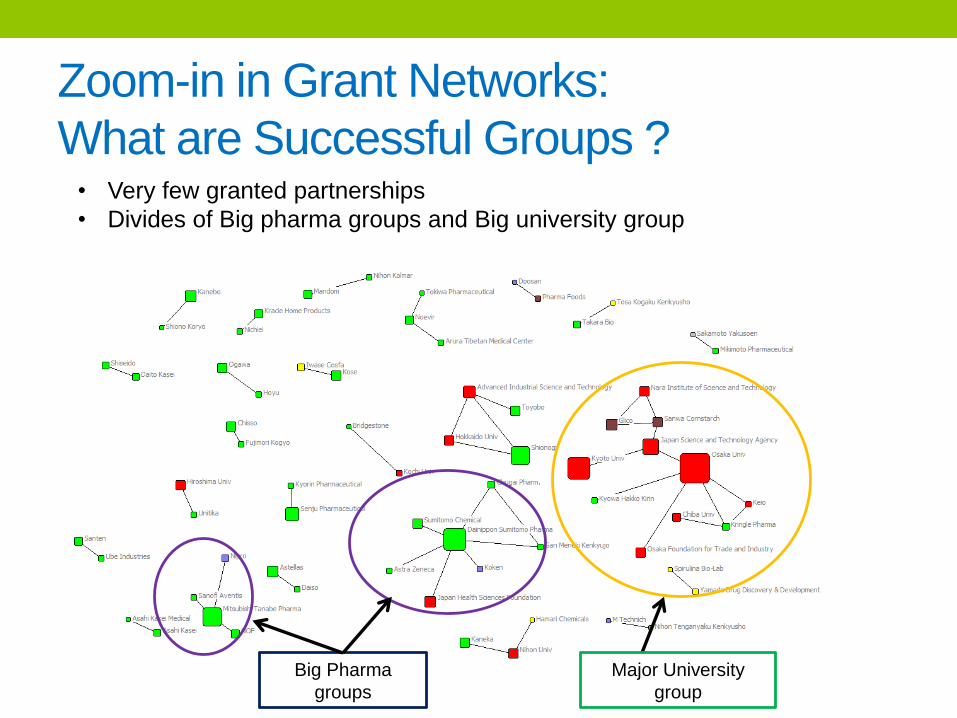
Zoom-in in Grant Networks:
What are Successful Groups ? • Very few granted partnerships
• Divides of Big pharma groups and Big university group
Big Pharma
groups
Major University
group
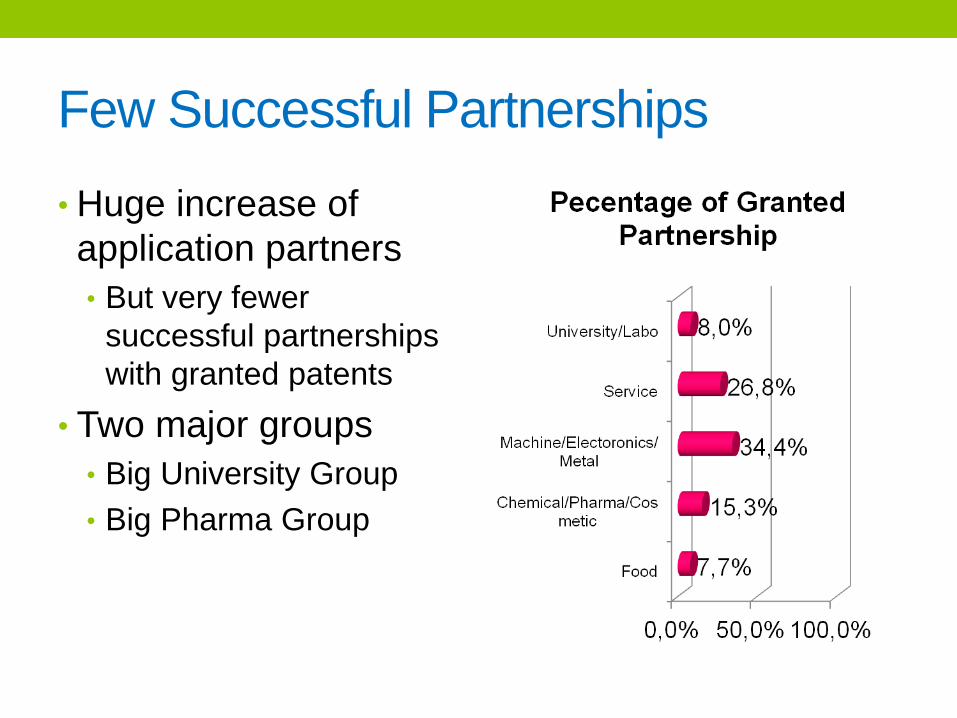
Few Successful Partnerships
• Huge increase of
application partners
• But very fewer
successful partnerships
with granted patents
• Two major groups
• Big University Group
• Big Pharma Group
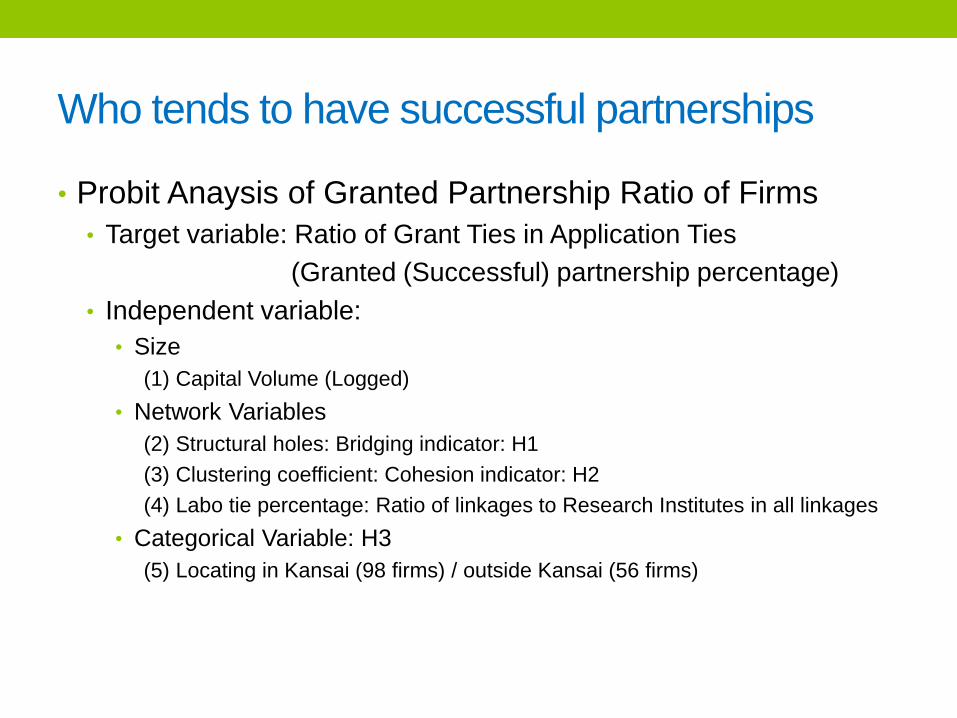
Who tends to have successful partnerships
• Probit Anaysis of Granted Partnership Ratio of Firms
• Target variable: Ratio of Grant Ties in Application Ties
(Granted (Successful) partnership percentage)
• Independent variable:
• Size
(1) Capital Volume (Logged)
• Network Variables
(2) Structural holes: Bridging indicator: H1
(3) Clustering coefficient: Cohesion indicator: H2
(4) Labo tie percentage: Ratio of linkages to Research Institutes in all linkages
• Categorical Variable: H3
(5) Locating in Kansai (98 firms) / outside Kansai (56 firms)
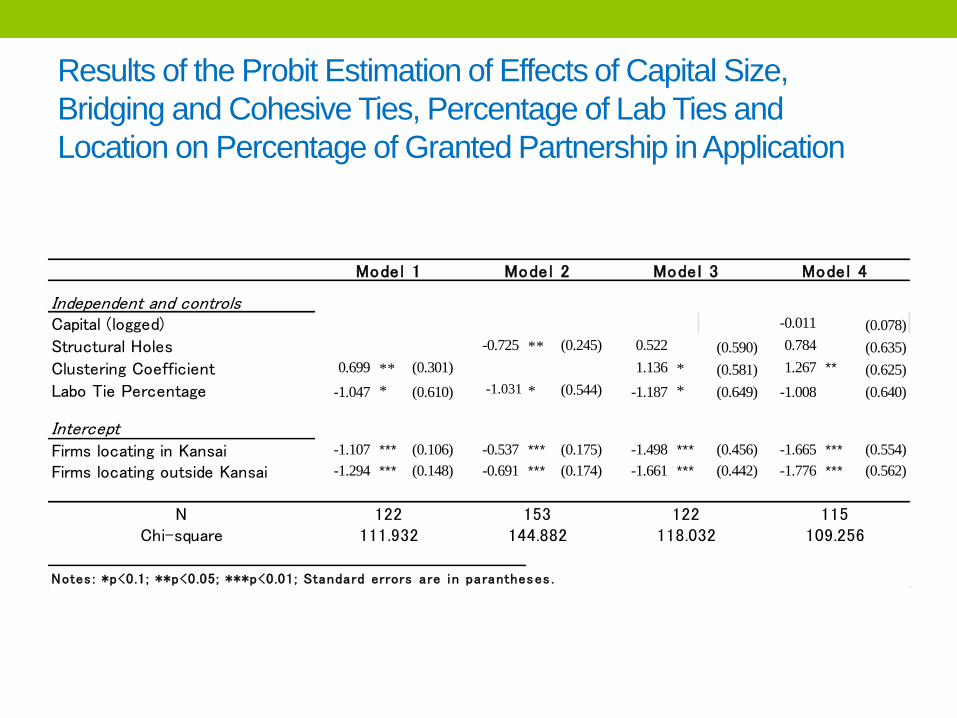
Results of the Probit Estimation of Effects of Capital Size,
Bridging and Cohesive Ties, Percentage of Lab Ties and
Location on Percentage of Granted Partnership in Application
Independent and controlsCapital (logged) -0.011 (0.078)
Structural Holes -0.725 ** (0.245) 0.522 (0.590) 0.784 (0.635)
Clustering Coefficient 0.699 ** (0.301) 1.136 * (0.581) 1.267 ** (0.625)
Labo Tie Percentage -1.047 * (0.610) -1.031 * (0.544) -1.187 * (0.649) -1.008 (0.640)
InterceptFirms locating in Kansai -1.107 *** (0.106) -0.537 *** (0.175) -1.498 *** (0.456) -1.665 *** (0.554)
Firms locating outside Kansai -1.294 *** (0.148) -0.691 *** (0.174) -1.661 *** (0.442) -1.776 *** (0.562)
NChi-square
Notes : *p<0.1; **p<0.05; ***p<0.01; Standard errors are i n parantheses .
Model 1 Model 2 Model 3 Model 4
122 153 122 115111.932 144.882 118.032 109.256
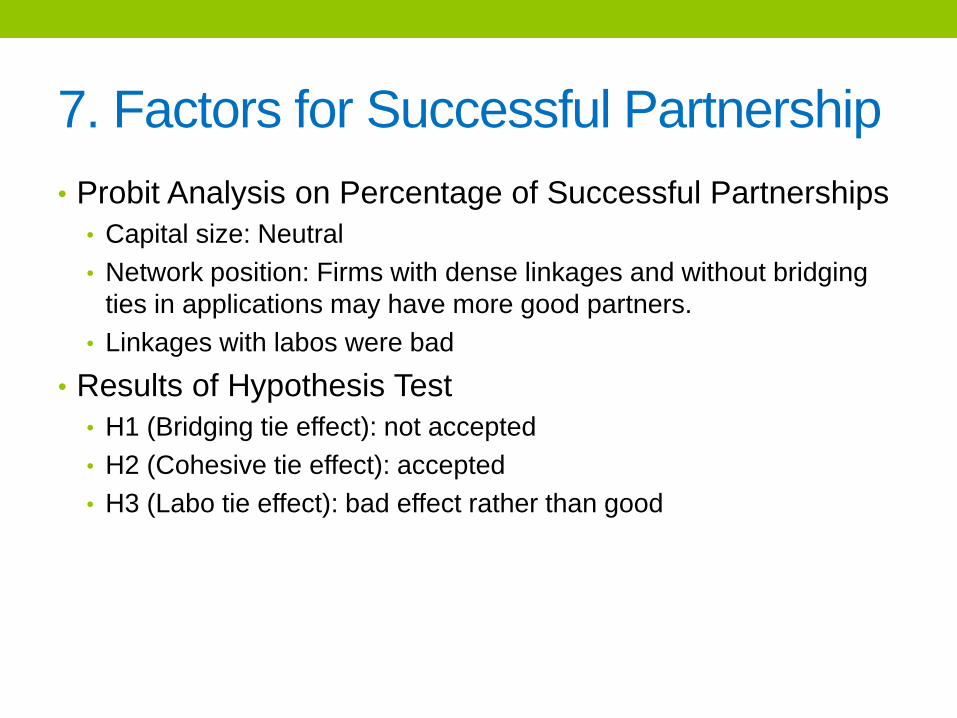
7. Factors for Successful Partnership
• Probit Analysis on Percentage of Successful Partnerships
• Capital size: Neutral
• Network position: Firms with dense linkages and without bridging
ties in applications may have more good partners.
• Linkages with labos were bad
• Results of Hypothesis Test
• H1 (Bridging tie effect): not accepted
• H2 (Cohesive tie effect): accepted
• H3 (Labo tie effect): bad effect rather than good
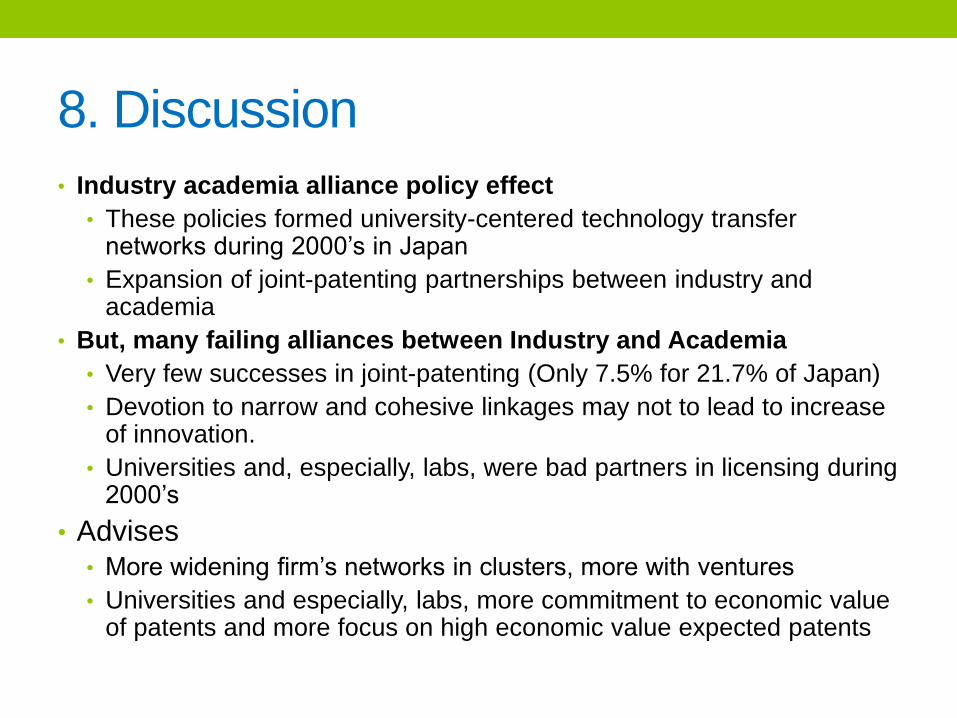
8. Discussion
• Industry academia alliance policy effect
• These policies formed university-centered technology transfer networks during 2000’s in Japan
• Expansion of joint-patenting partnerships between industry and academia
• But, many failing alliances between Industry and Academia
• Very few successes in joint-patenting (Only 7.5% for 21.7% of Japan)
• Devotion to narrow and cohesive linkages may not to lead to increase of innovation.
• Universities and, especially, labs, were bad partners in licensing during 2000’s
• Advises
• More widening firm’s networks in clusters, more with ventures
• Universities and especially, labs, more commitment to economic value of patents and more focus on high economic value expected patents

Je vous remercie de votre attention!
25
Major Reference
26
Adler, P. S. and Kwon, S., 2002, “Social capital: Prospects for a new concept,” Academy of Management Review, 27 (1): 17-40.
Al-Laham, A., and Souitaris, V., 2007, “Network embeddedness and new venture internationalization,” Journal of Business Venturing, 23, 567-586.
Borgatti, S.P., Everett, M.G. and Freeman, L.C. 2002, Ucinet VI for Windows: Software for Social Network Analysis. Harvard, MA: Analytic
Technologies.
Burt, R. S. (2004) “Structural Holes and Good Idea,” American Journal of Sociology, Vol.110: 349-399.
Casper, S., 2007, Creating Silicon Valley in Europe: Public Policy towards New Technology Industries, Oxford : Oxford University Press.
Cooke,P., 2006, Global Bioregions: Knowledge Domains, Capabilities and Innovation System Networks , Industry and Innovation, 13(4): 437–458.
Etzkowitz, H., 2008, The Triple Helix : University-Industry-Government Innovation in Action, New York : Routledge.
Garnsey, E. and Hefferman, P., 2005,“High-technology Clustering through Spin-out and Attraction: The Cambridge Case,” Regional Studies, 39:1127–
1144.
Goto, A. and Odagiri, H. (eds.), 2003, Saiensu Gata Sangyo (Scientific Industries), Tokyo: NTT Shuppan. (in Japanese).
Ibata-Arens, K., 2005, Innovation and Entrepreneurship in Japan : Politics, Organizations, and High Technology Firms, Cambridge : Cambridge
University Press.
Ingram, P. and Roberts, P.R., 2000, “Friendships among Competitors in the Sydney Hotel Industry,” American Journal of Sociology, 106: 387-423.
Inkpen, A. C. and Tsang, E. W., 2005, “Social capital, networks and knowledge transfer,” Academy of Management Review, 30: 146–165.
Krackhardt,D.,1992, ”The strength of Strong Ties: The Importance of Philos in Organizations,” In N.Nrhia and R. G. Eccles, Networks and Organizations:
Structure, Forms and Action, Boston, MA: Harvard Business School Press,pp.216-239.
Padgett, J. F. and Powell, W. W., 2012, “Organizational and Institutional Genesis: The Emergence of High-Tech Clusters in the Life Sciences,” in The
Emergence of Organizations and Markets, eds. by Walter W. Powell et al., Princeton, NJ and Oxford: Princeton University Press, 435-457
Owen-Smith, J. and Powell, W. W, ,2004, “Knowledge Networks as Channels and Conduits,” Organization Science, 15(1) : 5-21. Powell, W.W., Koput, K.
W., and Smith-Doerr, L., 1996, “Interorganizational Collaboration and the Locus of Innovation: Networks of Learning in Biotechnology.”
Administrative Science Quarterly 41(1):116-45.
Thune, T., 2007, "University-industry collaboration: the network embeddedness," Science & Public Policy, 34(3): 158-168.
Woolgar, L., 2007, “New institutional policies for university–industry links in Japan,” Research Policy, 36: 1261–1274
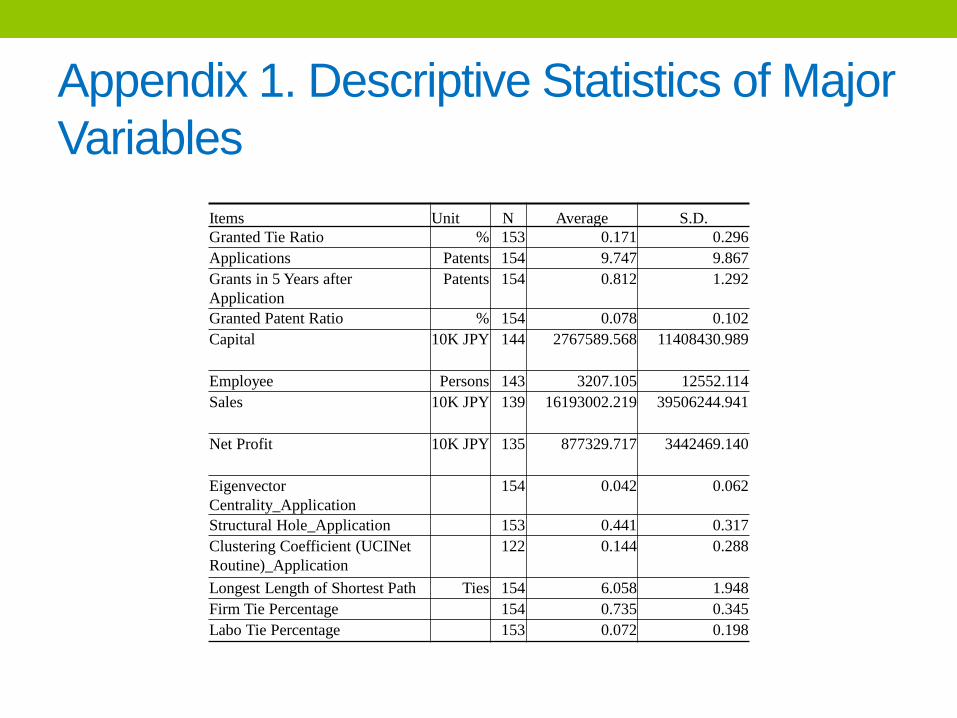
Appendix 1. Descriptive Statistics of Major
Variables
Items Unit N Average S.D.
Granted Tie Ratio % 153 0.171 0.296
Applications Patents 154 9.747 9.867
Grants in 5 Years after
Application
Patents 154 0.812 1.292
Granted Patent Ratio % 154 0.078 0.102
Capital 10K JPY 144 2767589.568 11408430.989
Employee Persons 143 3207.105 12552.114
Sales 10K JPY 139 16193002.219 39506244.941
Net Profit 10K JPY 135 877329.717 3442469.140
Eigenvector
Centrality_Application
154 0.042 0.062
Structural Hole_Application 153 0.441 0.317
Clustering Coefficient (UCINet
Routine)_Application
122 0.144 0.288
Longest Length of Shortest Path Ties 154 6.058 1.948
Firm Tie Percentage 154 0.735 0.345
Labo Tie Percentage 153 0.072 0.198
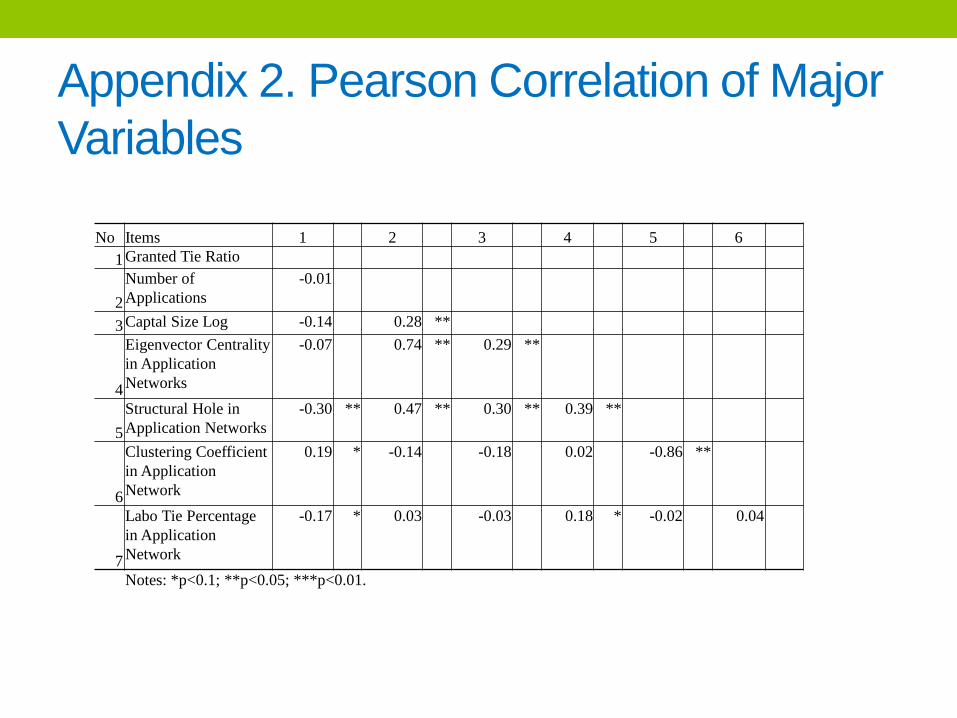
Appendix 2. Pearson Correlation of Major
Variables
No Items 1 2 3 4 5 6
1 Granted Tie Ratio
2
Number of
Applications
-0.01
3 Captal Size Log -0.14 0.28 **
4
Eigenvector Centrality
in Application
Networks
-0.07 0.74 ** 0.29 **
5
Structural Hole in
Application Networks
-0.30 ** 0.47 ** 0.30 ** 0.39 **
6
Clustering Coefficient
in Application
Network
0.19 * -0.14 -0.18 0.02 -0.86 **
7
Labo Tie Percentage
in Application
Network
-0.17 * 0.03 -0.03 0.18 * -0.02 0.04
Notes: *p<0.1; **p<0.05; ***p<0.01.