Embed Size (px)
Citation preview
JID:YGAME AID:1939 /FLA [m3G; v 1.55; Prn:12/07/2011; 15:00] P.1 (1-20)
Games and Economic Behavior ••• (••••) •••–•••
Contents lists available at ScienceDirect
Games and Economic Behavior
www.elsevier.com/locate/geb
Behavioral spillovers and cognitive load in multiple games:An experimental study!
Jenna Bednar a,b,!, Yan Chen c, Tracy Xiao Liu c, Scott Page d,b
a Department of Political Science, University of Michigan, Ann Arbor, MI 48109, United Statesb Santa Fe Institute, Santa Fe, NM, United Statesc School of Information, University of Michigan, Ann Arbor, MI 48109, United Statesd Center for the Study of Complex Systems, Departments of Political Science and Economics, University of Michigan, Ann Arbor, MI 48109, United States
a r t i c l e i n f o a b s t r a c t
Article history:Received 14 December 2009Available online xxxx
JEL classification:C72C91D03
Keywords:Multiple gamesBehavioral spilloverCognitive loadEntropyExperiment
We present evidence from laboratory experiments of behavioral spillovers and cognitiveload that spread across strategic contexts. In the experiments, subjects play two distinctgames simultaneously with different opponents. We find that the strategies chosen and thee!ciency of outcomes in one game depends on the other game that the subject plays, andthat play is altered in predictable directions. We develop a measure of behavioral variationin a normal form game, outcome entropy, and find that prevalent strategies in games withlow outcome entropy are more likely to be used in the games with high outcome entropy,but not vice versa. Taken together, these findings suggest that people do not treat strategicsituations in isolation, but may instead develop heuristics that they apply across games.
! 2011 Elsevier Inc. All rights reserved.
1. Introduction
In this paper, we describe laboratory experiments in which individuals simultaneously and repeatedly play two gameswith different opponents. We test whether an individual’s play in one game is influenced by the other strategic interactionshe faces. Multiple games can increase cognitive load preventing individuals from choosing e!cient or even equilibriumbehaviors. They can also induce behavioral spillovers in which individuals choose similar strategies in the two games. Wefind evidence of both psychological processes.
First, we find that although individuals are free to apply distinct strategies in each game, they instead develop andapply common behaviors across the two games. For example, when playing the prisoner’s dilemma paired with a game of
! This research was sponsored by grants from the National Science Foundation, the James S. McDonnell Foundation, the United States Air Force O!ce ofScientific Research MURI, and the U.S. Army Research O!ce. We are indebted to those who have supplied thoughtful reactions to our project, includingJasmina Arifovic, David Cooper, Vincent Crawford, Rachel Croson, John Duffy, Catherine Eckel, Simon Gächter, Ernan Haruvy, John Ledyard, Tom Palfrey,Rahul Sami, Rajiv Sethi, Roberto Weber, Kan Takeuchi, an anonymous referee, and seminar participants at the annual meeting of the Midwest PoliticalScience Association (Chicago, March 2007), ICER (Turin, June 2007), the Third Asia Pacific Regional Meetings of the ESA (Shanghai, July 2007), the SantaFe Institute (July 2007), USC Gould School of Law (November 2007), Shanghai Jiaotong University (June 2008), UT-Dallas (March 2008), the 2008 DFG-NSFResearch Conference (New York, August 2008), the North America Regional Meetings of the ESA (Tucson, AZ, November 2008), the Allied Social ScienceAssociation Meetings (San Francisco, CA, January 2009). We would like to thank Andrea Jones-Rooy for excellent assistance.
* Corresponding author at: Department of Political Science, University of Michigan, Ann Arbor, MI 48109, United States.E-mail addresses: [email protected] (J. Bednar), [email protected] (Y. Chen), [email protected] (T.X. Liu), [email protected] (S. Page).
0899-8256/$ – see front matter ! 2011 Elsevier Inc. All rights reserved.doi:10.1016/j.geb.2011.06.009
JID:YGAME AID:1939 /FLA [m3G; v 1.55; Prn:12/07/2011; 15:00] P.2 (1-20)
2 J. Bednar et al. / Games and Economic Behavior ••• (••••) •••–•••
chicken, players alternate on the off-diagonals more often than they cooperate, as compared to when the prisoner’s dilemmais played alone. Thus, behavior in one game appears to spill over into the second game.
The extent and direction of that spillover appear to depend on the complexity of the outcome dynamics. We introducea measure game complexity: entropy of outcomes. Entropy captures behavioral variation, which should be correlated withthe cognitive load induced by the game. For example, in a game with a dominant strategy, the e!cient equilibrium isnot complex. In the control sessions, when subjects play a single game of this type, the play of this game produces thesame outcome in almost every period, and therefore has low entropy. Thus, using entropy as a measure, this game is lesscognitively taxing than a prisoner’s dilemma game, which produces substantial behavioral variation.
In our experiments, we compare outcomes in single-game controls to outcomes in two-game ensembles, as well asoutcomes between ensembles. Using entropy of outcomes measured in the single-game control sessions, we can then makean out-of-sample forecast of game play in treatments with two-game ensembles. We find that in these two-game ensembles,prevalent strategies in games with low entropy are more likely to be used in the games with high entropy, but not viceversa.1 In other words, subjects develop strategies for easier games and apply them to more complex games.
The subjects’ performance in the two-game ensembles supports hypotheses of both cognitive load and behavioralspillovers. By cognitive load, we mean that subjects’ cognitive constraints prevent them from playing both games opti-mally. By behavioral spillovers, we mean that strategies in one game bleed over into the other game. Cognitive load neednot imply behavioral spillovers. A subject suffering from overload could opt to play a simple strategy unrelated to her strat-egy in the other game. Nor is cognitive load necessary for behavioral spillovers. For example, cooperation in the prisoner’sdilemma could be enforced through either Tit for Tat or a grim trigger strategy. Either of these strategies could behaviorallyalign with an e!cient strategy in some other game. Thus, the spillover would exist even though the subjects were notoverloaded. That said, spillovers do imply a cognitive cost reduction. Also, given the games that we consider in this paper,the spillovers that we identify all include loss of e!ciency, which is consistent with cognitive load.
To test for behavioral spillovers we posit hypotheses that are distinct from those that would be created by cognitiveload alone. As just mentioned, cognitive load would imply that behavior varies significantly from control sessions whenmultiple games are played simultaneously but that the form of that variation would be independent of the other game inthe ensemble (provided that game demands equal cognitive attention). That is, cognitive load would not be su!cient toenable the direction of behavioral deviance. Yet, we find that behavior in one game depends significantly and predictablyupon what other game is included in the two-game ensemble. This finding suggests that variance in actions cannot beattributed exclusively to cognitive load but instead indicates the presence of behavioral spillovers.
Our findings have an important implication for the study of games and for social science research more generally. Ifbehavior in one game depends on other games an individual plays, then social scientists, whether doing experimental, the-oretical, or empirical research, may need to consider the full ensemble of games that an individual faces (Samuelson, 2001;Bednar and Page, 2007). To date, almost all game-theoretic research focuses on individual games, as do most experiments.That norm is changing. A recent flurry of multiple-game experiments demonstrates the existence and magnitude of ensem-ble effects. Our theory of behavioral spillovers can explain some of the findings in these experiments (Section 2).
The interest in multiple-game experiments can be attributed partly to their ability to generate deeper insights intoboth individual and collective behavior. For learning about individual behavior, these experiments provide a laboratoryin which subjects find themselves in a more cognitively taxing environment, one that resembles real world situations inwhich multiple stimuli simultaneously demand a person’s attention. At the collective level, the findings from multiple-gameexperiments may contribute to an institutional explanation for behavioral variations in the play of common games. Distinctsets of experiences or cases lead distinct communities to draw different analogies when constructing strategies (Gilboa andSchmeidler, 1995). Institutional interventions that take into account the behavioral repertoire of the relevant individualsmay be more likely to succeed. A better understanding of behavioral spillovers can contribute to the analyses and design ofinstitutions.
We have organized the paper as follows. In Section 2, we summarize the relevant theoretical and experimental literature.Section 3 describes the specific games included in this study and our experimental design. Somewhat unusually, in Section 4we first present the results from the control sessions, where participants play a single game, and then develop our multiple-game hypotheses in Section 5, which are based on theory as well as results from the control sessions. Section 6 reports ourfindings on the ensemble effects. In Section 7, we discuss what these findings might mean and comment on potential futuredirections.
2. Literature review
In this section we review the theoretical and experimental literature on multiple games. Samuelson (2001) formallymodels behavioral spillovers and cognitive load when people play multiple games. He assumes that people pay a cognitivecost to analyze a strategic interaction. More sophisticated analyses require more cognitive load. In his model, individualsmaintain a stock of analogies to organize their reasoning. In the analysis of three different bargaining games, the ultimatum
1 Our results are distinct from but complement earlier research on sequential behavioral spillovers, which have been interpreted as a form of priming orframing (Tversky and Kahneman, 1986).

JID:YGAME AID:1939 /FLA [m3G; v 1.55; Prn:12/07/2011; 15:00] P.3 (1-20)
J. Bednar et al. / Games and Economic Behavior ••• (••••) •••–••• 3
game, the Rubinstein (1982) alternating offer bargaining game, and a tournament, he characterizes two equilibria, one inwhich the two bargaining games are played separately, and one in which they are played jointly. In the latter, players applycommon analogies to disparate bargaining situations.
Samuelson’s analysis is restricted to bargaining games. Bednar and Page (2007) examine behavioral spillovers and cogni-tive load effects in a broader class of six 2" 2 games. They prove conditions for the existence and e!ciency of behavioralexternalities, using computational agent based models (Miller and Page, 2007). Their agent based models show that sim-ple learning rules could locate the proposed equilibria when played in isolation. When agents needed to solve multiplegames simultaneously, the agents often created routines that they applied across strategic domains. The agent based modelgenerates behavioral spillovers; agents employed identical strategies in distinct games. The model also shows evidence ofcognitive load: some ensembles of games outstrip the capacity of the agents to play each game optimally. In those cases,they find especially strong ensemble effects. Given their focus on ensemble effects, Bednar and Page (2007) provide themain theoretical foundation for the current paper.
In comparison to the action-bundling results of Samuelson (2001) and Bednar and Page (2007), Jehiel (2005) uses abelief-bundling approach, where a player forms expectations about the behavior of the other players by pooling togetherseveral contingencies (analogy class) in which these other players must move, and forms an expectation about the averagebehavior in each analogy class. In his analogy-based expectation equilibrium, a player with coarser beliefs could still adoptdifferent actions in different normal form games.
We now review the emerging multiple-game experiments, and use our entropy measure to explain some of the findingsin these experiments. Falk et al. (forthcoming) investigate social interaction effects when two identical coordination orpublic goods games are played simultaneously with different opponents, and find no behavioral spillovers between the twogames, which is consistent with our prediction that two identical games with the same entropy should not influence eachother. In comparison, Savikhin and Sheremeta (2010) study simultaneous play of a public goods game (low entropy) anda competitive lottery contest (high entropy). They find that cooperation in the public goods game reduces overbidding inthe lottery, while contributions to the public good are not affected by the simultaneous participation in the lottery. Thisresult is consistent with our prediction that game influence flows from low entropy games to high entropy games. In athird study, using both a sequential and a simultaneous treatment, Cason et al. (2010) report cooperation spillovers fromthe median-effort game (low entropy) to the subsequent minimum-effort game (high entropy) when the games are playedsequentially, but not simultaneously. Again, this result is consistent with our predictions based on entropy. Finally, Casonand Gangadharan (2010) investigate behavioral spillovers between a threshold public goods game and a competitive doubleauction market. They find that cooperation in public goods provision is less common when players simultaneously competein the market.
There also exist sequential multiple-game experiments. These studies identify significant framing (Tversky and Kahne-man, 1986) and learning transfer effects. Both of these phenomena are related to behavioral spillovers (Cooper and Kagel,2008; Haruvy and Stahl, 2010). Consider the experiments that first auction off the right to play in a game. These exper-iments produce different outcomes in subsequent games. If we think of the auction as an initial game, we can interpretthe resulting improved outcomes as resulting from some sort of behavioral spillover. For example, Van Huyck et al. (1993)demonstrate that without a pre-play auction, the median-effort coordination game played in isolation leads to ine!cientequilibrium but that auctioning off the right to play before the coordination game leads to the payoff-dominant equilibrium.Crawford and Broseta (1998) explore the e!ciency-enhancing effect of auctions theoretically using a model of stochas-tic, history-dependent learning dynamics, giving an analytic explanation for these results.2 Lastly, Huck et al. (2010) studyfeedback spillovers in sequential multiple games and find empirical support for an analogy-based expectation equilibrium(Jehiel, 2005). They use a different protocol from the multiple-game experiments discussed above. In their experiment,a player plays one of two games in each round, and sometimes receives the aggregate distribution of the play of the op-ponents over the two games, a design feature aimed to compare the long-run behavior in the presence and absence offeedback spillovers. Grimm and Mengel (2010) use a similar protocol where a player plays one of several games each round,and find that their data can be rationalized by either action- or belief-bundling.
The experiments in this paper differ from these aforementioned studies, in that we consider pairs of games chosen froman ensemble of similar games. Therefore, we are not only able to show the presence of spillovers and cognitive load acrossa specific pair, but also we are able to demonstrate the comparative size of those effects based on the characteristics ofthe games being played. Thus, these experimental results provide a foundation for the behaviors exhibited in the follow upstudies that we mention above.
3. Experimental design
In this section, we describe the specific games included in our study and then provide a detailed description of ourexperimental procedures.
2 An additional strand of research that complements our findings looks at the emergence of cooperation. Weber (2006) reports the results of a minimum-effort game experiment where successful coordination is achieved in large groups by starting with small groups and adding entrants who are aware of thegroup’s history. Successful coordination in large groups can be interpreted as learning transfer from small groups that find it easier to coordinate.
JID:YGAME AID:1939 /FLA [m3G; v 1.55; Prn:12/07/2011; 15:00] P.4 (1-20)
4 J. Bednar et al. / Games and Economic Behavior ••• (••••) •••–•••
3.1. The games
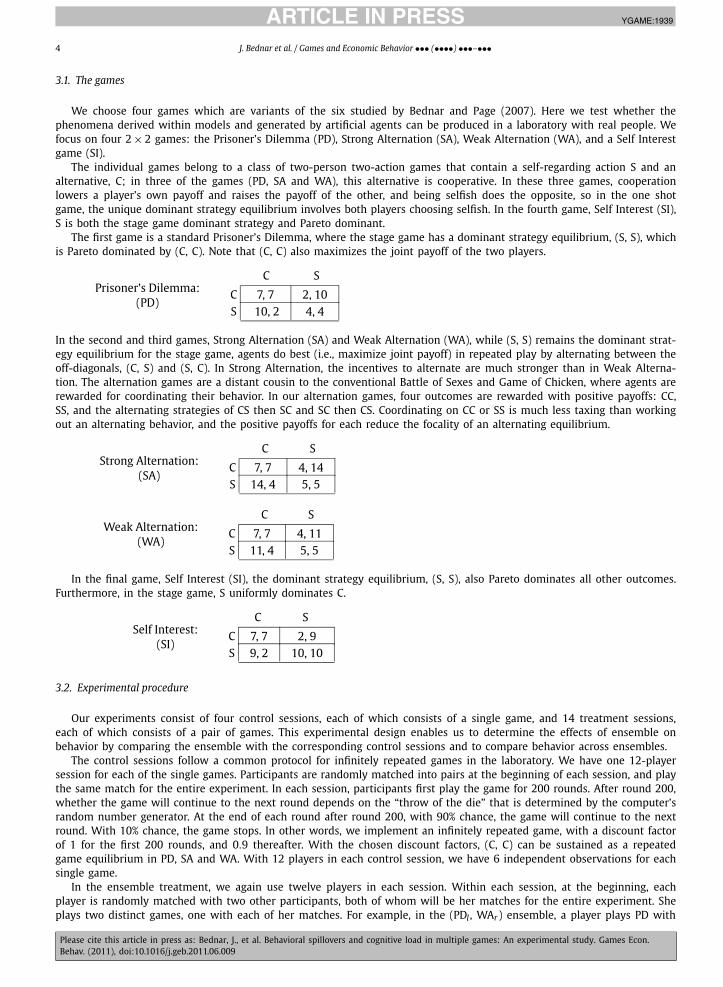
We choose four games which are variants of the six studied by Bednar and Page (2007). Here we test whether thephenomena derived within models and generated by artificial agents can be produced in a laboratory with real people. Wefocus on four 2" 2 games: the Prisoner’s Dilemma (PD), Strong Alternation (SA), Weak Alternation (WA), and a Self Interestgame (SI).
The individual games belong to a class of two-person two-action games that contain a self-regarding action S and analternative, C; in three of the games (PD, SA and WA), this alternative is cooperative. In these three games, cooperationlowers a player’s own payoff and raises the payoff of the other, and being selfish does the opposite, so in the one shotgame, the unique dominant strategy equilibrium involves both players choosing selfish. In the fourth game, Self Interest (SI),S is both the stage game dominant strategy and Pareto dominant.
The first game is a standard Prisoner’s Dilemma, where the stage game has a dominant strategy equilibrium, (S, S), whichis Pareto dominated by (C, C). Note that (C, C) also maximizes the joint payoff of the two players.
Prisoner’s Dilemma:(PD)
C S
C 7, 7 2, 10S 10, 2 4, 4
In the second and third games, Strong Alternation (SA) and Weak Alternation (WA), while (S, S) remains the dominant strat-egy equilibrium for the stage game, agents do best (i.e., maximize joint payoff) in repeated play by alternating between theoff-diagonals, (C, S) and (S, C). In Strong Alternation, the incentives to alternate are much stronger than in Weak Alterna-tion. The alternation games are a distant cousin to the conventional Battle of Sexes and Game of Chicken, where agents arerewarded for coordinating their behavior. In our alternation games, four outcomes are rewarded with positive payoffs: CC,SS, and the alternating strategies of CS then SC and SC then CS. Coordinating on CC or SS is much less taxing than workingout an alternating behavior, and the positive payoffs for each reduce the focality of an alternating equilibrium.
Strong Alternation:(SA)
C S
C 7, 7 4, 14S 14, 4 5, 5
Weak Alternation:(WA)
C S
C 7, 7 4, 11S 11, 4 5, 5
In the final game, Self Interest (SI), the dominant strategy equilibrium, (S, S), also Pareto dominates all other outcomes.Furthermore, in the stage game, S uniformly dominates C.
Self Interest:(SI)
C S
C 7, 7 2, 9S 9, 2 10, 10
3.2. Experimental procedure
Our experiments consist of four control sessions, each of which consists of a single game, and 14 treatment sessions,each of which consists of a pair of games. This experimental design enables us to determine the effects of ensemble onbehavior by comparing the ensemble with the corresponding control sessions and to compare behavior across ensembles.
The control sessions follow a common protocol for infinitely repeated games in the laboratory. We have one 12-playersession for each of the single games. Participants are randomly matched into pairs at the beginning of each session, and playthe same match for the entire experiment. In each session, participants first play the game for 200 rounds. After round 200,whether the game will continue to the next round depends on the “throw of the die” that is determined by the computer’srandom number generator. At the end of each round after round 200, with 90% chance, the game will continue to the nextround. With 10% chance, the game stops. In other words, we implement an infinitely repeated game, with a discount factorof 1 for the first 200 rounds, and 0.9 thereafter. With the chosen discount factors, (C, C) can be sustained as a repeatedgame equilibrium in PD, SA and WA. With 12 players in each control session, we have 6 independent observations for eachsingle game.
In the ensemble treatment, we again use twelve players in each session. Within each session, at the beginning, eachplayer is randomly matched with two other participants, both of whom will be her matches for the entire experiment. Sheplays two distinct games, one with each of her matches. For example, in the (PDl , WAr ) ensemble, a player plays PD with
JID:YGAME AID:1939 /FLA [m3G; v 1.55; Prn:12/07/2011; 15:00] P.5 (1-20)
J. Bednar et al. / Games and Economic Behavior ••• (••••) •••–••• 5
Table 1Features of experimental sessions.
Control Ensemble treatment
Game n Pairs (Left, Right) n Groups
(PD, WA) 12 3(WA, PD) 12 3(PD, SI) 12 3
PD 12 6 (SI, PD) 12 3
(SA, WA) 12 3(WA, SA) 12 3(SA, PD) 12 3
SA 12 6 (PD, SA) 12 3
(SI, WA) 12 + 12 6(WA, SI) 12+ 8 5(SI, SA) 12 3
SI 12 6 (SA, SI) 12 3
WA 12 6
Total 48 24 164 41
her left match, and WA with her right match, as displayed in the following table using neutral action labels. This designallows us to analyze whether or not behavior in one game is influenced by the nature of the other game.
Column Player Column PlayerLeft (A) Right (B) Left (A) Right (B)
Row Top (A) 7, 7 2, 10 Top (A) 7, 7 4, 11Player Bottom (B) 10, 2 4, 4 Bottom (B) 11, 4 5, 5
As in the control sessions, we implement an infinitely repeated game, with a discount factor of 1 for the first 200rounds, and 0.9 thereafter. Within each session, the twelve players are partitioned into independent groups of 4 each,yielding 3 independent observations. We number our players from one to twelve. The matching protocol is the following:4# 2# 1# 3! "# $, 6# 5# 7# 8! "# $, 10# 9# 11# 12! "# $ form three independent groups, each with four participants positioned on a
circle, and each participant plays her left and right match.As the two games are displayed side by side, we conduct two independent sessions for each game ensemble, changing
the order of the display to avoid the order effect within each round. For example, for the game ensemble of SA and WA, wedisplay SA as the left game in one session, and WA as the left game in another session. This way, if a player always makesdecisions from left to right, we have a balanced number of observations for each order.
We used z-Tree (Fischbacher, 2007) to program our experiments. As z-Tree does not record the mouse movements withineach stage, we ran two additional sessions with ensembles, (SI, WA) and (WA, SI), where we use the software Morae torecord the mouse movement. These two sessions enable us to determine the order of decisions within each round. The (SI,WA) session has 12 subjects, while the (WA, SI) has only eight subjects.3
Table 1 reports features of experimental sessions, including the name of the game, the number of players in each session,the number of independent pairs for each control session, the ensemble of games, the number of players in each session,as well as the number of independent groups in each ensemble session.
Overall, 18 independent computerized sessions were conducted in the RCGD lab at the University of Michigan fromMarch to October 2007, yielding a total of 212 subjects. Our subjects were students from the University of Michigan, re-cruited by email from a subject pool for economic experiments.4 Participants were allowed to participate in only onesession. Each ensemble treatment session lasted approximately 90 minutes, whereas each control session lasted about 45minutes. The exchange rate was set to 100 tokens for $1. In addition, each participant was paid a $5 show-up fee. Averageearnings per participant were $37.49 for those in the treatment sessions and $22.77 for those in the control sessions. Dataare available from the authors upon request.
4. Results: Control sessions
In this section, we report the results from the control sessions at the outcome level. This analysis provides a benchmarkfrom which we can identify the presence of cognitive load and behavioral spillovers results in Section 6. In Subsection 6.2,we infer the repeated game strategies emerged in each game in the control and compare them with those in the ensembles.In this section, we treat each pair as an independent observation.
3 We recruited for twelve subjects, however, only eight showed up.4 Graduate students from the Economics Department are excluded from the list.
JID:YGAME AID:1939 /FLA [m3G; v 1.55; Prn:12/07/2011; 15:00] P.6 (1-20)
6 J. Bednar et al. / Games and Economic Behavior ••• (••••) •••–•••
Table 2Distribution of outcomes and entropy in control sessions.
SI PD SA WA
C S C S C S C S
C 0.00 0.14 55.68 11.67 5.02 39.81 33.18 21.57S 0.00 99.86 14.82 17.82 40.37 14.81 22.74 22.51
Entropy 0.02 1.68 1.68 1.98
We first introduce an empirical measure of cognitive load. To measure the behavioral variation in a game, we apply astandard entropy measure to the outcome distributions.5 The entropy of a random variable X with a probability densityfunction, p(x) = Pr{X = x}, is defined by
H(X) = #%
x
p(x) log2 p(x).
Entropy measures the amount of stochastic variation in a random variable that can assume a finite set of values. Thereforeit is also a measure of the amount of information required to describe that distribution. When using logarithms to base two,that measure captures the number of binary variables (bits) needed to describe the data.
For the analysis of two-person games, we model individual stage game strategies as a discrete random variable, X , withrealizations in one of the four cells. Throughout the analysis, we use the convention that 0 log0 = 0.6 The entropy in ageneric 2" 2 game is in the interval [0,2], with the lower bound indicating certainty, i.e., all outcomes are in one cell, andthe upper bound indicating a uniform distribution among the four cells. The cause of behavioral variation could be strategicuncertainty over what the other player will do.
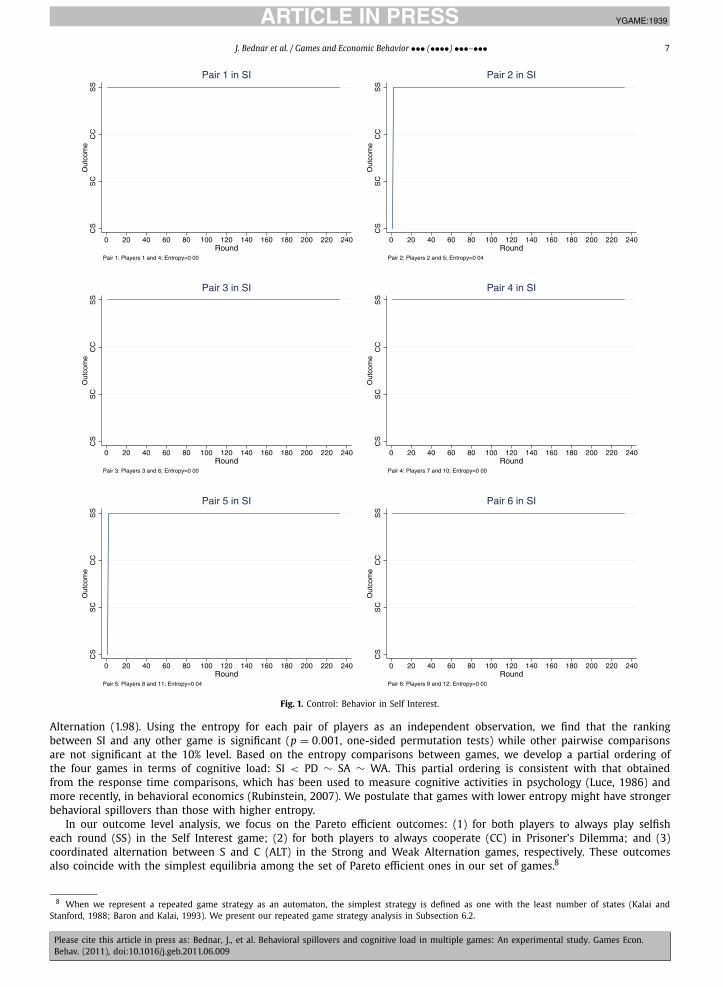
In Figs. 1–4, we present time series data for each pair in each of the control sessions, with the entropy for each pairpresented at the bottom of each graph.
Fig. 1 presents outcomes in the Self Interest game. In this game, all six pairs converge to the Pareto dominant stagegame equilibrium quickly and stay there. The entropy for each pair ranges from 0 to 0.04, indicating very little behavioralvariation. This behavioral consistency is likely attributable to the uniform dominance property of the dominant strategyequilibrium in the stage game. Additionally, participants take an average of 0.62 seconds per round to make a decision inSI, significantly shorter than in any other game (p ! 0.01, one-sided permutation tests). Based upon the uniform dominanceproperty of the unique Pareto e!cient stage game equilibrium, its low entropy, and response time, we posit that SI imposesthe least cognitive load.
Fig. 2 presents behavior in the Prisoner’s Dilemma game. In this game, over half of the pairs play CC, the e!cientoutcome, which is consistent with findings from previous experiments (Andreoni and Miller, 2002). Curiously, one pair alsoalternate for a fair number of rounds. The entropy for each pair ranges from 0.08 to 1.79, indicating changing behavioralvariation. In addition, participants take an average of 1.00 second per round to make a decision in PD, significantly longerthan SI, but shorter than SA (p ! 0.01, one-sided permutation tests). As a “context” this game does not establish as stronga behavioral norm as the Self Interest game. Based upon this finding, we anticipate that PD will have a weaker behavioralpull than SI. The di!culty of learning to cooperate in the PD game may limit its spillover effects on play in other games.
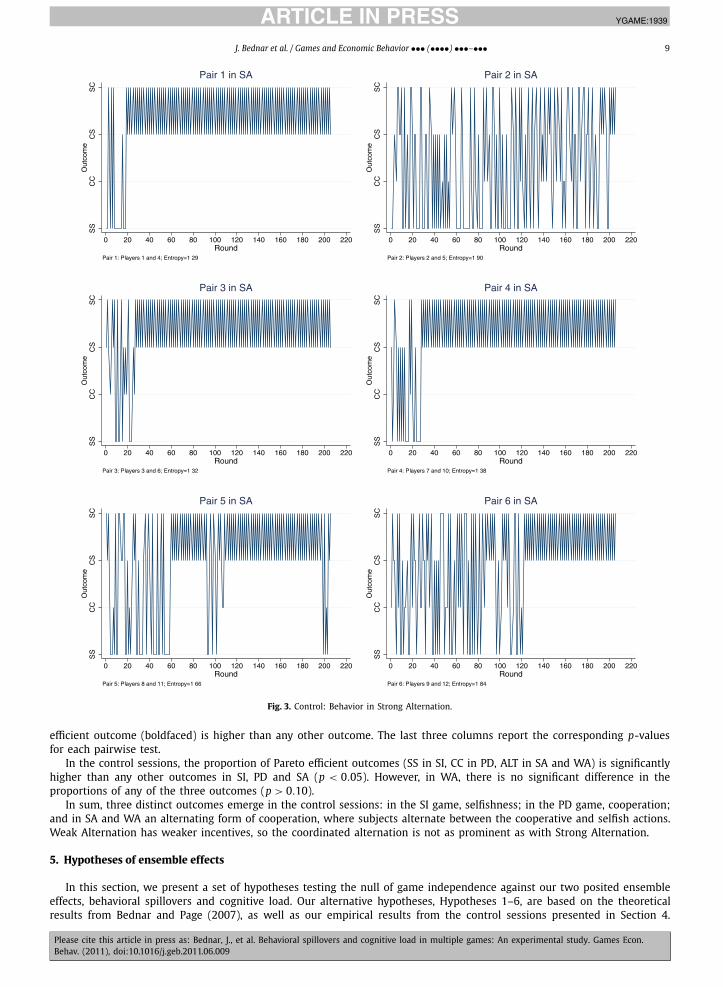
Fig. 3 presents behavior in the Strong Alternation game, where 5/6 of the pairs successfully establish the alternationoutcomes. Pair 2 also attempts alternation on and off during the experiment. The entropy for each pair ranges from 1.29to 1.90, indicating substantial behavioral variation.7 In addition, participants take an average of 2.72 seconds per round tomake a decision in SA, significantly longer than in any other game (p ! 0.01, one-sided permutation tests). We interpretthe longer response time in SA as evidence that coordinated alternation requires greater cognitive effort. Since successfulalternation is established in five out of six pairs, this game also provides a strong context from which spillovers might occur.
Last, Fig. 4 presents the dynamics from the Weak Alternation game. In this game, only two out of six pairs develop analternating behavior, two pairs cooperate, one (pair 4) converges to SS, and the last pair (pair 6) does not seem to haveconverged to a stable outcome. The entropy for each pair ranges from 0.44 to 1.91, with the highest aggregate entropyamong all four games. In addition, participants take an average of 1.24 seconds per round to make a decision in WA,significantly longer than SI, shorter than SA (p ! 0.01, one-sided permutation tests), not significantly different from PD(p = 0.138, one-sided permutation test). As WA results in higher behavioral variation, we speculate that subject behavior inWA is more likely to be influenced by the other game in an ensemble.
To summarize our findings, Table 2 reports the aggregate distribution of outcomes in each of the four games in thecontrol sessions, and the respective entropy for each game in the last line. The behavioral variation measured by entropyis the lowest in the Self Interest game (0.02), followed by Prisoner’s Dilemma and Strong Alternation (1.68), and Weak
5 Shannon (1948) is credited with the development of the concept of entropy and the birth of information theory. Many basic concepts and findings inthis field are summarized in Cover and Thomas (2006).6 This convention is easily justified by continuity, since x log x $ 0 as x $ 0.7 Perfect coordinated alternation results in an entropy of 1.
JID:YGAME AID:1939 /FLA [m3G; v 1.55; Prn:12/07/2011; 15:00] P.7 (1-20)
J. Bednar et al. / Games and Economic Behavior ••• (••••) •••–••• 7
Fig. 1. Control: Behavior in Self Interest.
Alternation (1.98). Using the entropy for each pair of players as an independent observation, we find that the rankingbetween SI and any other game is significant (p = 0.001, one-sided permutation tests) while other pairwise comparisonsare not significant at the 10% level. Based on the entropy comparisons between games, we develop a partial ordering ofthe four games in terms of cognitive load: SI < PD % SA % WA. This partial ordering is consistent with that obtainedfrom the response time comparisons, which has been used to measure cognitive activities in psychology (Luce, 1986) andmore recently, in behavioral economics (Rubinstein, 2007). We postulate that games with lower entropy might have strongerbehavioral spillovers than those with higher entropy.
In our outcome level analysis, we focus on the Pareto e!cient outcomes: (1) for both players to always play selfisheach round (SS) in the Self Interest game; (2) for both players to always cooperate (CC) in Prisoner’s Dilemma; and (3)coordinated alternation between S and C (ALT) in the Strong and Weak Alternation games, respectively. These outcomesalso coincide with the simplest equilibria among the set of Pareto e!cient ones in our set of games.8
8 When we represent a repeated game strategy as an automaton, the simplest strategy is defined as one with the least number of states (Kalai andStanford, 1988; Baron and Kalai, 1993). We present our repeated game strategy analysis in Subsection 6.2.

JID:YGAME AID:1939 /FLA [m3G; v 1.55; Prn:12/07/2011; 15:00] P.8 (1-20)
8 J. Bednar et al. / Games and Economic Behavior ••• (••••) •••–•••
Fig. 2. Control: Behavior in Prisoner’s Dilemma.
Table 3Average proportion of Pareto e!cient outcomes in control sessions.
% Outcomes p-values of permutation tests
Games SS CC ALT CC v. SS CC v. ALT SS v. ALT
SI 99.86 0.00 0.00 0.000 0.500 0.000PD 17.82 55.68 15.44 0.039 0.031 0.389SA 14.81 5.02 71.12 0.040 0.000 0.001WA 22.51 33.18 36.14 0.308 0.430 0.317
Table 3 reports the proportion of three outcomes in each game over the entire series. Boldfaced numbers are the modeof the distribution. Within each game (row), we compare the proportion of pairs of outcomes, using one-sided permutationtests. The general null hypothesis is equal proportions, while the alternative hypothesis is that the proportion of the Pareto
JID:YGAME AID:1939 /FLA [m3G; v 1.55; Prn:12/07/2011; 15:00] P.9 (1-20)
J. Bednar et al. / Games and Economic Behavior ••• (••••) •••–••• 9
Fig. 3. Control: Behavior in Strong Alternation.
e!cient outcome (boldfaced) is higher than any other outcome. The last three columns report the corresponding p-valuesfor each pairwise test.
In the control sessions, the proportion of Pareto e!cient outcomes (SS in SI, CC in PD, ALT in SA and WA) is significantlyhigher than any other outcomes in SI, PD and SA (p < 0.05). However, in WA, there is no significant difference in theproportions of any of the three outcomes (p > 0.10).
In sum, three distinct outcomes emerge in the control sessions: in the SI game, selfishness; in the PD game, cooperation;and in SA and WA an alternating form of cooperation, where subjects alternate between the cooperative and selfish actions.Weak Alternation has weaker incentives, so the coordinated alternation is not as prominent as with Strong Alternation.
5. Hypotheses of ensemble effects
In this section, we present a set of hypotheses testing the null of game independence against our two posited ensembleeffects, behavioral spillovers and cognitive load. Our alternative hypotheses, Hypotheses 1–6, are based on the theoreticalresults from Bednar and Page (2007), as well as our empirical results from the control sessions presented in Section 4.

JID:YGAME AID:1939 /FLA [m3G; v 1.55; Prn:12/07/2011; 15:00] P.10 (1-20)
10 J. Bednar et al. / Games and Economic Behavior ••• (••••) •••–•••
Fig. 4. Control: Behavior in Weak Alternation.
These hypotheses are also broadly consistent with the analogy-based model of Jehiel (2005) and the case based reasoningof Gilboa and Schmeidler (1995).
Our general null hypothesis is of game independence: play in one game is not be affected by the existence of anothergame to play. If the independence hypothesis is correct then we should see no difference between behaviors in the controlsessions (games played in isolation) and when games are presented to subjects as part of ensembles, nor should we see anydifference in behavior in one game when it is paired with different games.
Based on results from Bednar and Page (2007), we anticipate that the ensemble play will depend upon which other gameis in the ensemble. Since SI has significantly lower entropy than any of the three other games, we expect the dominantoutcome in SI more likely to appear in the game it is paired with, but not vice versa. Specifically, we expect:
Hypothesis 1 (Effects of SI). Compared to the corresponding control or other ensembles, games paired with Self Interest willexhibit more selfishness.

JID:YGAME AID:1939 /FLA [m3G; v 1.55; Prn:12/07/2011; 15:00] P.11 (1-20)
J. Bednar et al. / Games and Economic Behavior ••• (••••) •••–••• 11
Table 4Distribution of outcomes in the control and ensembles.
SI PD SA WA
(SS CC ALT) (SS CC ALT) (SS CC ALT) (SS CC ALT)
SI paired with (100 0 0) (99 0 0) (99 0 0) (99 0 0)PD paired with (46 42 5) (18 56 15) (23 41 21) (39 40 9)SA paired with (32 7 48) (24 15 48) (15 5 71) (39 10 38)WA paired with (28 44 21) (40 31 18) (40 11 37) (23 33 36)
Note. The diagonal is the outcome distribution for the control sessions. Boldfaced numbers are the mode of distribution for the control sessions.
Since pairwise entropy comparisons among PD, SA and WA are not significant, behavior in each game could influence orbe influenced by the game it is paired with. We base the following alternative hypotheses on other results from Bednar andPage (2007).
Hypothesis 2 (Effects of PD). Compared to the corresponding control or other ensembles, games (excluding SI) paired withthe Prisoner’s Dilemma will exhibit more cooperation.
Hypothesis 3 (Effects of SA). Compared to the corresponding control or other ensembles, games (excluding SI) paired withStrong Alternation will exhibit more alternation.
Hypothesis 4 (Effects of WA). Compared to the corresponding control or other ensembles, games (excluding SI) paired withWeak Alternation will exhibit more alternation.
Payoff parameters for the two alternation games produce stronger incentives to alternate in Strong Alternation comparedto Weak Alternation. This is confirmed by outcomes in the control sessions, with 71% (resp. 36%) of alternation in SA (resp.WA). Therefore, in ensembles, we expect to see more alternation in games paired with SA.
Hypothesis 5 (E!cient outcomes: ensemble vs. control). Compared to the corresponding control sessions, subjects in a ensembletreatment will less often achieve e!cient outcomes in any game with non-trivial entropy.
Specifically, Hypothesis 5 implies that subjects in PD, SA or WA (each with non-trivial entropy) will less often producee!cient outcomes when each game is part of an ensemble compared to the corresponding control, while those in SI (withtrivial entropy) will not behave differently in ensembles compared to the SI control.
In Section 4, we develop a partial ordering of the four games based upon the entropy of each game in the controlsessions, i.e., the behavioral variation follows the order of SI < PD % SA % WA. Based on the entropy, response time andthe payoff structure of each game, we posit that Self Interest is the only easy game to play so it will be the only game forwhich we do not expect to see a significant falloff in e!cient outcomes in the game SI is paired with. Thus, we formulatea hypothesis based on the cognitive load of the context game.
Hypothesis 6 (E!cient outcomes: ensemble vs. ensemble). Participants are more likely to achieve Pareto e!cient outcomes ina game when it is paired with SI than when it is paired with other games.
6. Results: Ensemble effects
In this section, we present ensemble effects at the outcome level (Subsection 6.1) as well as those at the strategy level(Subsection 6.2). In all our analysis in this section, a pair in a control session or a group of four in an ensemble session istreated as an independent observation.
6.1. Ensemble effects at the outcome level
Our anticipation was that subjects would play particular games differently between the control sessions, where theyplayed a single game, and when that game appeared as part of an ensemble. This prediction emerges from the two corehypotheses: both behavioral spillovers and cognitive load will affect play in ensembles. Consequently, we expect differentoutcomes between the control sessions and the corresponding ensembles. To establish the existence of behavioral spilloversin the presences of cognitive load, we compare outcomes between ensembles.
Table 4 presents the outcome distribution for the control and ensemble treatments. Each cell contains the proportion ofSS, CC and ALT for the row game, when it is paired with the column game. The dominant diagonal contains the outcomedistribution for the control sessions. We can then test Hypotheses 1 to 4 using information in this table. For example,Hypothesis 1 predicts that, row-by-row (excluding the SI row), the proportion of SS is largest when a game is paired
JID:YGAME AID:1939 /FLA [m3G; v 1.55; Prn:12/07/2011; 15:00] P.12 (1-20)
12 J. Bednar et al. / Games and Economic Behavior ••• (••••) •••–•••
Table 5Effects of SI on other games: permutation tests.
SS in PD control (PD, SA) (PD, WA)(PD, SI) 0.070 0.109 0.371
(SA, SI) (SA, PD) SA control (SA, WA)0.290 0.065 0.680
(WA, SI) (WA, PD) (WA, SA) WA control0.846 0.813 0.364
Table 6Effects of PD on other games: permutation tests.
CC in SI control (SI, SA) (SI, WA)(SI, PD) 1.000 1.000 1.000
(SA, PD) (SA, SI) SA control (SA, WA)0.119 0.049 0.299
(WA, PD) (WA, SI) (WA, SA) WA control0.897 0.024 0.566
with SI. In what follows, we present the results testing each hypothesis and tabulate the statistical support in a separatetable for each hypothesis.
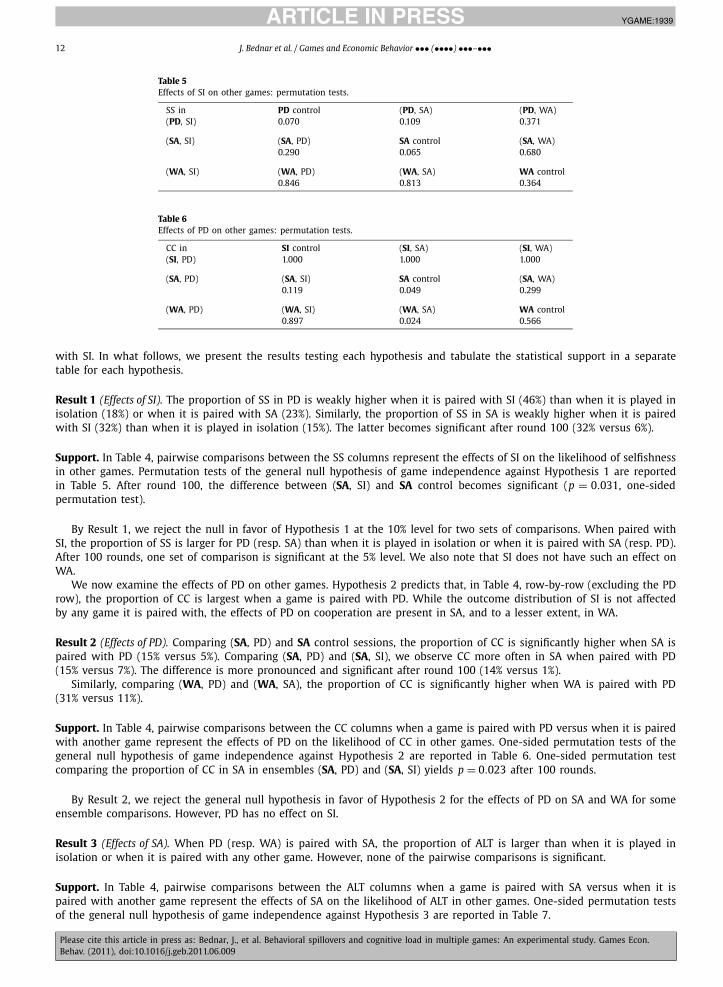
Result 1 (Effects of SI). The proportion of SS in PD is weakly higher when it is paired with SI (46%) than when it is played inisolation (18%) or when it is paired with SA (23%). Similarly, the proportion of SS in SA is weakly higher when it is pairedwith SI (32%) than when it is played in isolation (15%). The latter becomes significant after round 100 (32% versus 6%).
Support. In Table 4, pairwise comparisons between the SS columns represent the effects of SI on the likelihood of selfishnessin other games. Permutation tests of the general null hypothesis of game independence against Hypothesis 1 are reportedin Table 5. After round 100, the difference between (SA, SI) and SA control becomes significant (p = 0.031, one-sidedpermutation test).
By Result 1, we reject the null in favor of Hypothesis 1 at the 10% level for two sets of comparisons. When paired withSI, the proportion of SS is larger for PD (resp. SA) than when it is played in isolation or when it is paired with SA (resp. PD).After 100 rounds, one set of comparison is significant at the 5% level. We also note that SI does not have such an effect onWA.
We now examine the effects of PD on other games. Hypothesis 2 predicts that, in Table 4, row-by-row (excluding the PDrow), the proportion of CC is largest when a game is paired with PD. While the outcome distribution of SI is not affectedby any game it is paired with, the effects of PD on cooperation are present in SA, and to a lesser extent, in WA.
Result 2 (Effects of PD). Comparing (SA, PD) and SA control sessions, the proportion of CC is significantly higher when SA ispaired with PD (15% versus 5%). Comparing (SA, PD) and (SA, SI), we observe CC more often in SA when paired with PD(15% versus 7%). The difference is more pronounced and significant after round 100 (14% versus 1%).
Similarly, comparing (WA, PD) and (WA, SA), the proportion of CC is significantly higher when WA is paired with PD(31% versus 11%).
Support. In Table 4, pairwise comparisons between the CC columns when a game is paired with PD versus when it is pairedwith another game represent the effects of PD on the likelihood of CC in other games. One-sided permutation tests of thegeneral null hypothesis of game independence against Hypothesis 2 are reported in Table 6. One-sided permutation testcomparing the proportion of CC in SA in ensembles (SA, PD) and (SA, SI) yields p = 0.023 after 100 rounds.
By Result 2, we reject the general null hypothesis in favor of Hypothesis 2 for the effects of PD on SA and WA for someensemble comparisons. However, PD has no effect on SI.
Result 3 (Effects of SA). When PD (resp. WA) is paired with SA, the proportion of ALT is larger than when it is played inisolation or when it is paired with any other game. However, none of the pairwise comparisons is significant.
Support. In Table 4, pairwise comparisons between the ALT columns when a game is paired with SA versus when it ispaired with another game represent the effects of SA on the likelihood of ALT in other games. One-sided permutation testsof the general null hypothesis of game independence against Hypothesis 3 are reported in Table 7.
JID:YGAME AID:1939 /FLA [m3G; v 1.55; Prn:12/07/2011; 15:00] P.13 (1-20)
J. Bednar et al. / Games and Economic Behavior ••• (••••) •••–••• 13
Table 7Effects of SA on other games: permutation tests.
ALT in SI control (SI, PD) (SI, WA)(SI, SA) 1.000 1.000 0.647
(PD, SA) (PD, SI) PD control (PD, WA)0.110 0.355 0.183
(WA, SA) (WA, SI) (WA, PD) WA control0.142 0.119 0.485
Table 8Effects of WA on other games: permutation tests.
SS in SI control (SI, PD) (SI, SA)(SI, WA) 0.997 0.695 0.630
(PD, WA) (PD, SI) PD control (PD, SA)0.630 0.030 0.036
(SA, WA) (SA, SI) (SA, PD) SA control0.321 0.174 0.043
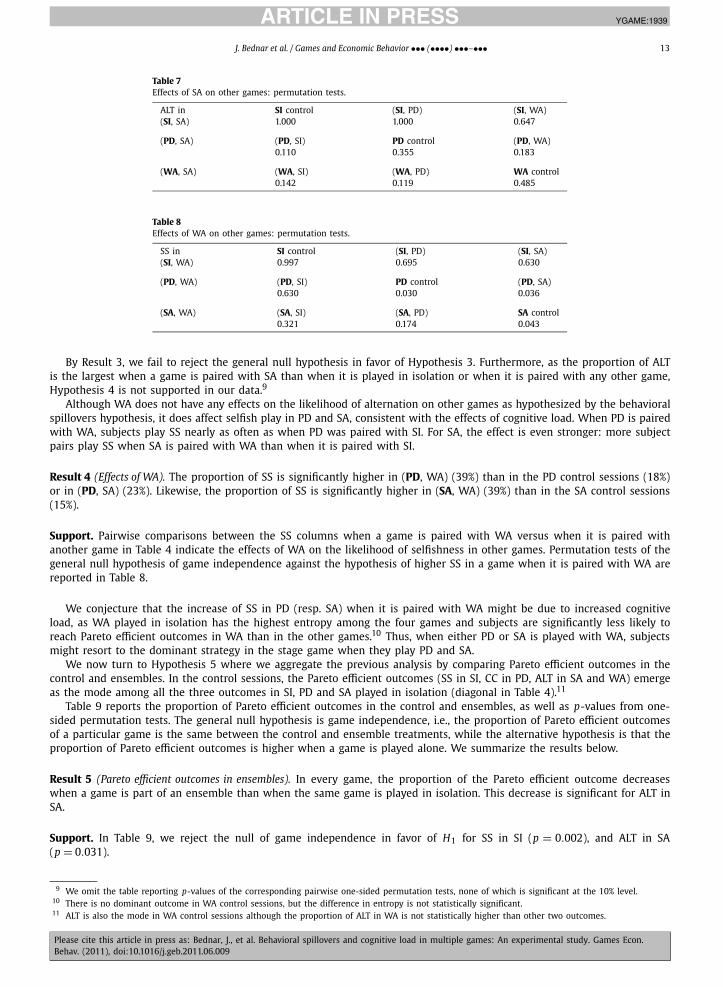
By Result 3, we fail to reject the general null hypothesis in favor of Hypothesis 3. Furthermore, as the proportion of ALTis the largest when a game is paired with SA than when it is played in isolation or when it is paired with any other game,Hypothesis 4 is not supported in our data.9
Although WA does not have any effects on the likelihood of alternation on other games as hypothesized by the behavioralspillovers hypothesis, it does affect selfish play in PD and SA, consistent with the effects of cognitive load. When PD is pairedwith WA, subjects play SS nearly as often as when PD was paired with SI. For SA, the effect is even stronger: more subjectpairs play SS when SA is paired with WA than when it is paired with SI.
Result 4 (Effects of WA). The proportion of SS is significantly higher in (PD, WA) (39%) than in the PD control sessions (18%)or in (PD, SA) (23%). Likewise, the proportion of SS is significantly higher in (SA, WA) (39%) than in the SA control sessions(15%).
Support. Pairwise comparisons between the SS columns when a game is paired with WA versus when it is paired withanother game in Table 4 indicate the effects of WA on the likelihood of selfishness in other games. Permutation tests of thegeneral null hypothesis of game independence against the hypothesis of higher SS in a game when it is paired with WA arereported in Table 8.
We conjecture that the increase of SS in PD (resp. SA) when it is paired with WA might be due to increased cognitiveload, as WA played in isolation has the highest entropy among the four games and subjects are significantly less likely toreach Pareto e!cient outcomes in WA than in the other games.10 Thus, when either PD or SA is played with WA, subjectsmight resort to the dominant strategy in the stage game when they play PD and SA.
We now turn to Hypothesis 5 where we aggregate the previous analysis by comparing Pareto e!cient outcomes in thecontrol and ensembles. In the control sessions, the Pareto e!cient outcomes (SS in SI, CC in PD, ALT in SA and WA) emergeas the mode among all the three outcomes in SI, PD and SA played in isolation (diagonal in Table 4).11
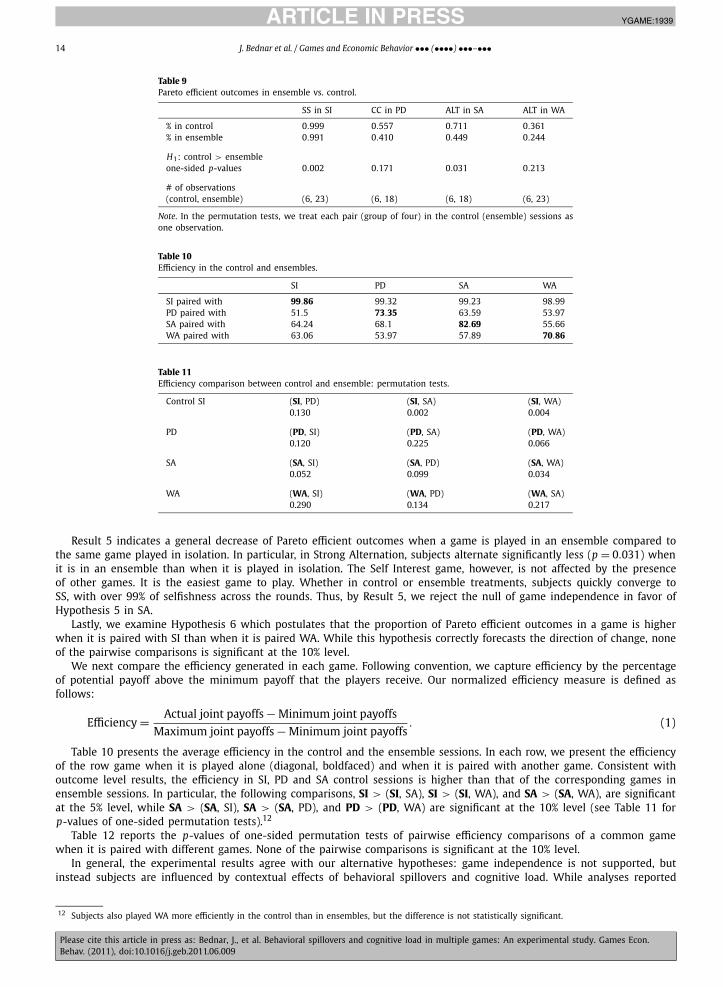
Table 9 reports the proportion of Pareto e!cient outcomes in the control and ensembles, as well as p-values from one-sided permutation tests. The general null hypothesis is game independence, i.e., the proportion of Pareto e!cient outcomesof a particular game is the same between the control and ensemble treatments, while the alternative hypothesis is that theproportion of Pareto e!cient outcomes is higher when a game is played alone. We summarize the results below.
Result 5 (Pareto e!cient outcomes in ensembles). In every game, the proportion of the Pareto e!cient outcome decreaseswhen a game is part of an ensemble than when the same game is played in isolation. This decrease is significant for ALT inSA.
Support. In Table 9, we reject the null of game independence in favor of H1 for SS in SI (p = 0.002), and ALT in SA(p = 0.031).
9 We omit the table reporting p-values of the corresponding pairwise one-sided permutation tests, none of which is significant at the 10% level.10 There is no dominant outcome in WA control sessions, but the difference in entropy is not statistically significant.11 ALT is also the mode in WA control sessions although the proportion of ALT in WA is not statistically higher than other two outcomes.
JID:YGAME AID:1939 /FLA [m3G; v 1.55; Prn:12/07/2011; 15:00] P.14 (1-20)
14 J. Bednar et al. / Games and Economic Behavior ••• (••••) •••–•••
Table 9Pareto e!cient outcomes in ensemble vs. control.
SS in SI CC in PD ALT in SA ALT in WA
% in control 0.999 0.557 0.711 0.361% in ensemble 0.991 0.410 0.449 0.244
H1: control > ensembleone-sided p-values 0.002 0.171 0.031 0.213
# of observations(control, ensemble) (6, 23) (6, 18) (6, 18) (6, 23)
Note. In the permutation tests, we treat each pair (group of four) in the control (ensemble) sessions asone observation.
Table 10E!ciency in the control and ensembles.
SI PD SA WA
SI paired with 99.86 99.32 99.23 98.99PD paired with 51.5 73.35 63.59 53.97SA paired with 64.24 68.1 82.69 55.66WA paired with 63.06 53.97 57.89 70.86
Table 11E!ciency comparison between control and ensemble: permutation tests.
Control SI (SI, PD) (SI, SA) (SI, WA)0.130 0.002 0.004
PD (PD, SI) (PD, SA) (PD, WA)0.120 0.225 0.066
SA (SA, SI) (SA, PD) (SA, WA)0.052 0.099 0.034
WA (WA, SI) (WA, PD) (WA, SA)0.290 0.134 0.217
Result 5 indicates a general decrease of Pareto e!cient outcomes when a game is played in an ensemble compared tothe same game played in isolation. In particular, in Strong Alternation, subjects alternate significantly less (p = 0.031) whenit is in an ensemble than when it is played in isolation. The Self Interest game, however, is not affected by the presenceof other games. It is the easiest game to play. Whether in control or ensemble treatments, subjects quickly converge toSS, with over 99% of selfishness across the rounds. Thus, by Result 5, we reject the null of game independence in favor ofHypothesis 5 in SA.
Lastly, we examine Hypothesis 6 which postulates that the proportion of Pareto e!cient outcomes in a game is higherwhen it is paired with SI than when it is paired WA. While this hypothesis correctly forecasts the direction of change, noneof the pairwise comparisons is significant at the 10% level.
We next compare the e!ciency generated in each game. Following convention, we capture e!ciency by the percentageof potential payoff above the minimum payoff that the players receive. Our normalized e!ciency measure is defined asfollows:
E!ciency = Actual joint payoffs#Minimum joint payoffsMaximum joint payoffs#Minimum joint payoffs
. (1)
Table 10 presents the average e!ciency in the control and the ensemble sessions. In each row, we present the e!ciencyof the row game when it is played alone (diagonal, boldfaced) and when it is paired with another game. Consistent withoutcome level results, the e!ciency in SI, PD and SA control sessions is higher than that of the corresponding games inensemble sessions. In particular, the following comparisons, SI > (SI, SA), SI > (SI, WA), and SA > (SA, WA), are significantat the 5% level, while SA > (SA, SI), SA > (SA, PD), and PD > (PD, WA) are significant at the 10% level (see Table 11 forp-values of one-sided permutation tests).12
Table 12 reports the p-values of one-sided permutation tests of pairwise e!ciency comparisons of a common gamewhen it is paired with different games. None of the pairwise comparisons is significant at the 10% level.
In general, the experimental results agree with our alternative hypotheses: game independence is not supported, butinstead subjects are influenced by contextual effects of behavioral spillovers and cognitive load. While analyses reported
12 Subjects also played WA more e!ciently in the control than in ensembles, but the difference is not statistically significant.
JID:YGAME AID:1939 /FLA [m3G; v 1.55; Prn:12/07/2011; 15:00] P.15 (1-20)
J. Bednar et al. / Games and Economic Behavior ••• (••••) •••–••• 15
Table 12E!ciency comparison between ensembles: permutation test results.
Game in Game ensemble p-values of permutation tests
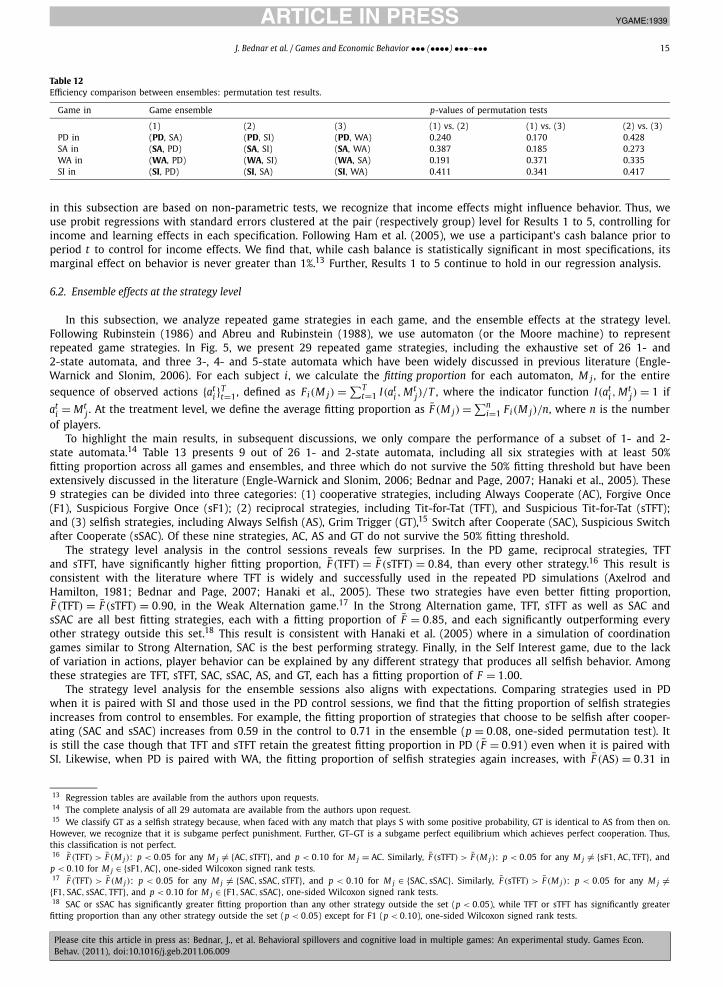
(1) (2) (3) (1) vs. (2) (1) vs. (3) (2) vs. (3)PD in (PD, SA) (PD, SI) (PD, WA) 0.240 0.170 0.428SA in (SA, PD) (SA, SI) (SA, WA) 0.387 0.185 0.273WA in (WA, PD) (WA, SI) (WA, SA) 0.191 0.371 0.335SI in (SI, PD) (SI, SA) (SI, WA) 0.411 0.341 0.417
in this subsection are based on non-parametric tests, we recognize that income effects might influence behavior. Thus, weuse probit regressions with standard errors clustered at the pair (respectively group) level for Results 1 to 5, controlling forincome and learning effects in each specification. Following Ham et al. (2005), we use a participant’s cash balance prior toperiod t to control for income effects. We find that, while cash balance is statistically significant in most specifications, itsmarginal effect on behavior is never greater than 1%.13 Further, Results 1 to 5 continue to hold in our regression analysis.
6.2. Ensemble effects at the strategy level
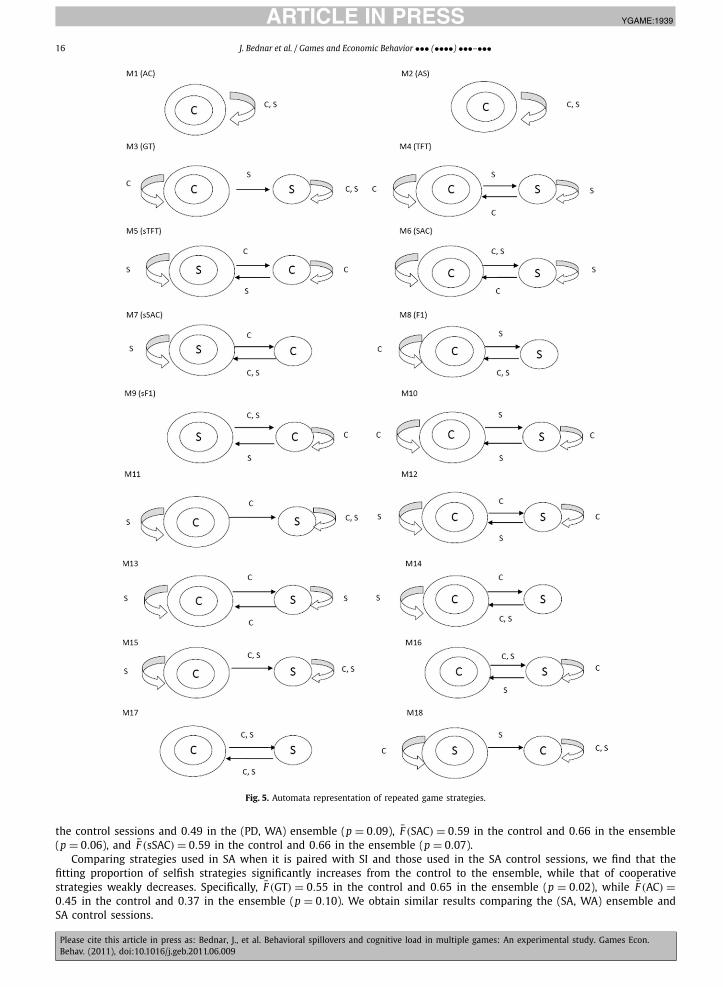
In this subsection, we analyze repeated game strategies in each game, and the ensemble effects at the strategy level.Following Rubinstein (1986) and Abreu and Rubinstein (1988), we use automaton (or the Moore machine) to representrepeated game strategies. In Fig. 5, we present 29 repeated game strategies, including the exhaustive set of 26 1- and2-state automata, and three 3-, 4- and 5-state automata which have been widely discussed in previous literature (Engle-Warnick and Slonim, 2006). For each subject i, we calculate the fitting proportion for each automaton, M j , for the entiresequence of observed actions {ati }Tt=1, defined as Fi(M j) = &T
t=1 I(ati ,Mtj)/T , where the indicator function I(ati ,M
tj) = 1 if
ati = Mtj . At the treatment level, we define the average fitting proportion as F̄ (M j) = &n
i=1 Fi(M j)/n, where n is the numberof players.
To highlight the main results, in subsequent discussions, we only compare the performance of a subset of 1- and 2-state automata.14 Table 13 presents 9 out of 26 1- and 2-state automata, including all six strategies with at least 50%fitting proportion across all games and ensembles, and three which do not survive the 50% fitting threshold but have beenextensively discussed in the literature (Engle-Warnick and Slonim, 2006; Bednar and Page, 2007; Hanaki et al., 2005). These9 strategies can be divided into three categories: (1) cooperative strategies, including Always Cooperate (AC), Forgive Once(F1), Suspicious Forgive Once (sF1); (2) reciprocal strategies, including Tit-for-Tat (TFT), and Suspicious Tit-for-Tat (sTFT);and (3) selfish strategies, including Always Selfish (AS), Grim Trigger (GT),15 Switch after Cooperate (SAC), Suspicious Switchafter Cooperate (sSAC). Of these nine strategies, AC, AS and GT do not survive the 50% fitting threshold.
The strategy level analysis in the control sessions reveals few surprises. In the PD game, reciprocal strategies, TFTand sTFT, have significantly higher fitting proportion, F̄ (TFT) = F̄ (sTFT) = 0.84, than every other strategy.16 This result isconsistent with the literature where TFT is widely and successfully used in the repeated PD simulations (Axelrod andHamilton, 1981; Bednar and Page, 2007; Hanaki et al., 2005). These two strategies have even better fitting proportion,F̄ (TFT) = F̄ (sTFT) = 0.90, in the Weak Alternation game.17 In the Strong Alternation game, TFT, sTFT as well as SAC andsSAC are all best fitting strategies, each with a fitting proportion of F̄ = 0.85, and each significantly outperforming everyother strategy outside this set.18 This result is consistent with Hanaki et al. (2005) where in a simulation of coordinationgames similar to Strong Alternation, SAC is the best performing strategy. Finally, in the Self Interest game, due to the lackof variation in actions, player behavior can be explained by any different strategy that produces all selfish behavior. Amongthese strategies are TFT, sTFT, SAC, sSAC, AS, and GT, each has a fitting proportion of F = 1.00.
The strategy level analysis for the ensemble sessions also aligns with expectations. Comparing strategies used in PDwhen it is paired with SI and those used in the PD control sessions, we find that the fitting proportion of selfish strategiesincreases from control to ensembles. For example, the fitting proportion of strategies that choose to be selfish after cooper-ating (SAC and sSAC) increases from 0.59 in the control to 0.71 in the ensemble (p = 0.08, one-sided permutation test). Itis still the case though that TFT and sTFT retain the greatest fitting proportion in PD (F̄ = 0.91) even when it is paired withSI. Likewise, when PD is paired with WA, the fitting proportion of selfish strategies again increases, with F̄ (AS) = 0.31 in
13 Regression tables are available from the authors upon requests.14 The complete analysis of all 29 automata are available from the authors upon request.15 We classify GT as a selfish strategy because, when faced with any match that plays S with some positive probability, GT is identical to AS from then on.However, we recognize that it is subgame perfect punishment. Further, GT–GT is a subgame perfect equilibrium which achieves perfect cooperation. Thus,this classification is not perfect.16 F̄ (TFT) > F̄ (M j): p < 0.05 for any M j &= {AC, sTFT}, and p < 0.10 for M j = AC. Similarly, F̄ (sTFT) > F̄ (M j): p < 0.05 for any M j &= {sF1,AC,TFT}, andp < 0.10 for M j ' {sF1,AC}, one-sided Wilcoxon signed rank tests.17 F̄ (TFT) > F̄ (M j): p < 0.05 for any M j &= {SAC, sSAC, sTFT}, and p < 0.10 for M j ' {SAC, sSAC}. Similarly, F̄ (sTFT) > F̄ (M j): p < 0.05 for any M j &={F1,SAC, sSAC,TFT}, and p < 0.10 for M j ' {F1,SAC, sSAC}, one-sided Wilcoxon signed rank tests.18 SAC or sSAC has significantly greater fitting proportion than any other strategy outside the set (p < 0.05), while TFT or sTFT has significantly greaterfitting proportion than any other strategy outside the set (p < 0.05) except for F1 (p < 0.10), one-sided Wilcoxon signed rank tests.
JID:YGAME AID:1939 /FLA [m3G; v 1.55; Prn:12/07/2011; 15:00] P.16 (1-20)
16 J. Bednar et al. / Games and Economic Behavior ••• (••••) •••–•••
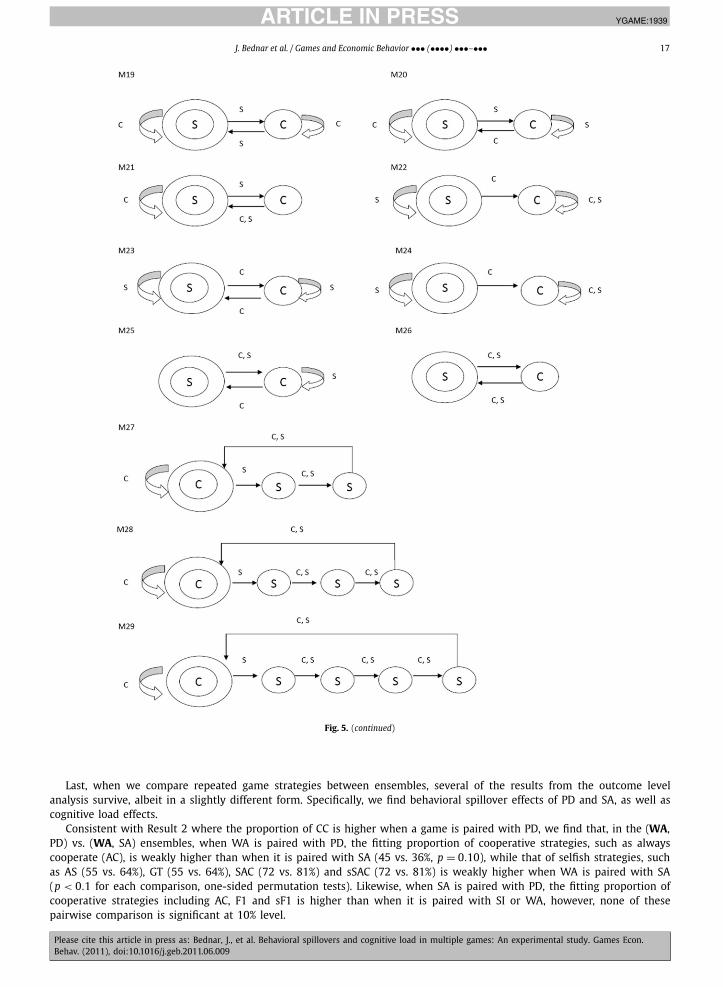
Fig. 5. Automata representation of repeated game strategies.
the control sessions and 0.49 in the (PD, WA) ensemble (p = 0.09), F̄ (SAC) = 0.59 in the control and 0.66 in the ensemble(p = 0.06), and F̄ (sSAC) = 0.59 in the control and 0.66 in the ensemble (p = 0.07).
Comparing strategies used in SA when it is paired with SI and those used in the SA control sessions, we find that thefitting proportion of selfish strategies significantly increases from the control to the ensemble, while that of cooperativestrategies weakly decreases. Specifically, F̄ (GT) = 0.55 in the control and 0.65 in the ensemble (p = 0.02), while F̄ (AC) =0.45 in the control and 0.37 in the ensemble (p = 0.10). We obtain similar results comparing the (SA, WA) ensemble andSA control sessions.
JID:YGAME AID:1939 /FLA [m3G; v 1.55; Prn:12/07/2011; 15:00] P.17 (1-20)
J. Bednar et al. / Games and Economic Behavior ••• (••••) •••–••• 17
Fig. 5. (continued)
Last, when we compare repeated game strategies between ensembles, several of the results from the outcome levelanalysis survive, albeit in a slightly different form. Specifically, we find behavioral spillover effects of PD and SA, as well ascognitive load effects.
Consistent with Result 2 where the proportion of CC is higher when a game is paired with PD, we find that, in the (WA,PD) vs. (WA, SA) ensembles, when WA is paired with PD, the fitting proportion of cooperative strategies, such as alwayscooperate (AC), is weakly higher than when it is paired with SA (45 vs. 36%, p = 0.10), while that of selfish strategies, suchas AS (55 vs. 64%), GT (55 vs. 64%), SAC (72 vs. 81%) and sSAC (72 vs. 81%) is weakly higher when WA is paired with SA(p < 0.1 for each comparison, one-sided permutation tests). Likewise, when SA is paired with PD, the fitting proportion ofcooperative strategies including AC, F1 and sF1 is higher than when it is paired with SI or WA, however, none of thesepairwise comparison is significant at 10% level.

JID:YGAME AID:1939 /FLA [m3G; v 1.55; Prn:12/07/2011; 15:00] P.18 (1-20)
18 J. Bednar et al. / Games and Economic Behavior ••• (••••) •••–•••
Table 13Description of nine strategies.
Strategy category Name of strategy Strategy number Initial action Continued play
Cooperative Always Cooperate (AC) M1 C Always play cooperateForgive Once (F1) M8 C Go to S if other plays S and
go to C when the last period is SSuspicious Forgive Once (sF1) M9 S Go to S if other plays S and
go to C when the last period is S
Reciprocal Tit-for-Tat (TFT) M4 C Copy other’s previous actionSuspicious Tit-for-Tat (sTFT) M5 S Copy other’s previous action
Selfish Always Selfish (AS) M2 S Always play selfishGrim Trigger (GT) M3 C C until other plays S, then S foreverSwitch after C (SAC) M6 C After C, play S until other plays CSuspicious Switch after C (sSAC) M7 S After C, play S until other plays C
Consistent with Result 3 where the proportion of ALT is higher when a game is paired with SA, we find that, in the (WA,SA) vs. (WA, SI) ensembles, when WA is paired with SA, the fitting proportion of SAC (sSAC) in WA is significantly higherthan when it is paired with SI (SAC: 81 vs. 71%, p = 0.033; sSAC: 81 vs. 71%, p = 0.035, one-sided permutation tests).
While Hypothesis 6 on cognitive load is only supported directionally at the outcome level, we find statistically significanteffects at the strategy level. Comparing PD strategies in the (PD, SI) vs. (PD, WA) ensembles, when PD is paired with SI, thefitting proportion of TFT and sTFT is significantly higher than when it is paired with WA (TFT: 91 vs. 83%, p = 0.039; sTFT:91 vs. 83%, p = 0.042, one-sided permutation tests).
In sum, analysis of behavioral spillovers at both the outcome and strategy levels yields largely consistent results, i.e.,when games are paired in ensembles, play differs from isolated controls, and in predictable ways. In some cases, the twolevels of analysis provide different lenses on the same phenomenon. For example, both analyses demonstrate that a gamepaired with the PD game exhibits more cooperative outcomes and strategies than observed in the control or when it ispaired with another game. In other cases, the strategy level analysis highlights a different feature of the results. For example,the strategy analysis allows us to see how often pairs are able to coordinate on alternating strategies.
7. Discussion
In this paper, we present an experimental study to test for ensemble effects in game playing behavior. We test forthese effects looking both at outcomes and strategies. Our study reveals evidence of behavioral spillovers that dependin predictable ways on features of the games in the ensemble. In particular, if subjects play one game in an ensemblethat encourages selfishness or cooperation, then they are more likely to exhibit that behavior in the other game in theirensemble, even though they play the other game with a different player. We also see evidence of cognitive load.
To derive our hypotheses about cognitive load and behavioral spillovers, we introduce a new measure of behavioralvariance, entropy, which is consistent with response time, an alternative measure of cognitive load used in psychology. Wecompute the entropy of a game played in isolation and make out-of-sample predictions of its effect in game ensembles. Weposit that in ensembles that include games that produce high entropy outcomes, cognitive load will be most pronounced.Consistent with our expectations, cognitive load has the greatest effect when ensembles include Weak Alternation, ourhighest-entropy game. In contrast, we hypothesize that low entropy games would produce stronger behavioral spilloversand are less influenced by other games. Both predictions are supported by our data.
Our findings provide an initial demonstration of how a person’s behavior in a given game depends on the ensemble ofstrategic situations that the person faces. In doing so, they call into question the focus on isolated games in most theoret-ical and empirical analyses. This critique extends to mechanism design, which assumes that incentives can be consideredindependent of the broader behavioral context.
To summarize, our multiple-game experiments demonstrate that significant ensemble effects emerge in the laboratorysetting. Outcome level and strategy level analysis show consistent ensemble effects. Subjects with incentives to behavecooperatively (resp. selfishly) in one game, tend to behave similarly in another game even if that behavior is not e!cient.Our results provide a behavioral explanation for observations in other ensemble experiments using more complex games,such as the public goods game and lottery contest (Savikhin and Sheremeta, 2010), the median- and minimum-effort games(Cason et al., 2010), and the threshold public goods and double auctions (Cason and Gangadharan, 2010). This emergingliterature indicates that context affects behavior.
Appendix A. Experimental instructions
We present the instructions for the (PD, WA) ensemble. Instructions for other ensemble treatments are identical except for thespecific game forms. Instructions for the control sessions are identical to the ensemble instructions except that two games and twoother participants are replaced with one game and one other participant everywhere. Hence we omit them here.

JID:YGAME AID:1939 /FLA [m3G; v 1.55; Prn:12/07/2011; 15:00] P.19 (1-20)
J. Bednar et al. / Games and Economic Behavior ••• (••••) •••–••• 19
Name: PCLAB: Total Payoff:
Introduction
• You are about to participate in a decision process in which you will play two games with two other participants. Eachgame will be played with a different participant and will be played for many rounds. This is part of a study intendedto provide insight into certain features of decision processes. If you follow the instructions carefully and make gooddecisions, you may earn a considerable amount of money. You will be paid in cash at the end of the experiment.
• During the experiment, we ask that you please do not talk to each other. If you have a question, please raise your handand an experimenter will assist you.
Procedure
• Matching: At the beginning of the experiment, you will be matched randomly with two other participants, both ofwhom will be your matches for the entire experiment. You will be matched with these same two people in all rounds.You will play a different game with each of these people.
• Roles: Throughout the game, you will be designated as the “row” player and your matches will be the “column” players.You will be a “row” player in all rounds, and your matches will be “column” players in all rounds.
• Actions: In each round, you and your two matches will simultaneously and independently make decisions in two differ-ent games. One is the left game and the other is the right game. You will play the left game with one of your matches(Left Game Match) and play the right game with the other match (Right Game Match). In each game, the row player(you) will click either the Top (A) or the Bottom (B) button. The column player (your Left or Right Game Match) willchoose either the Left (A) or Right (B) button. These choices determine which part of the matrix is relevant (Top Left,Top Right, Bottom Left, Bottom Right).
• Interdependence: A player’s earnings depend on the decision made by the player and on the decision made by his orher two matches as shown in the matrix below. In each cell, the row player’s payoff is shown in red and the columnplayer’s payoff is shown in blue.
Row Player Row PlayerLeft (A) Right (B) Left (A) Right (B)
Row Top (A) 7, 7 2, 10 Top (A) 7, 7 4, 11Player Bottom (B) 10, 2 4, 4 Bottom (B) 11, 4 5, 5
For example, if the row player (you) chooses Top (A) and the column player (your left game match) chooses Right (B)in the left game, then the row player (you) will get 2 points, while the column player (your left game match) will get10 points in this game. Meanwhile, if the row player (you) chooses Bottom (B) and the column player (your right gamematch) chooses right (B) in the right game, then the row player (you) will get 5 points, and the column player (yourright game match) will also get 5 points in this game. So as the row player in both games, you will get 7 points in thisround totally.
• Rounds: You will first play the two games for 200 rounds. After round 200, whether the games will continue to thenext round depends on the “throw of a die” that is determined by the computer’s random number generator. At theend of each round after round 200, with 90% chance, the games will continue to the next round. With 10% chance, thegames stop.
• Earnings: Your earnings are determined by the choices that you and your two matches make in every round. Your totalearning is the sum of your earnings in all rounds.The exchange rate is $1 for 100 points.You can round up your total earning to the next dollar. For example, if you earn $15.23, you can round it up to $16.
• History: In each round, your and your two matches’ decisions in all previous rounds will be displayed in a historywindow.
We encourage you to earn as much money as you can. Do you have any questions?
References
Abreu, Dilip, Rubinstein, Ariel, 1988. The structure of Nash equilibrium in repeated games with finite automata. Econometrica 56 (6), 1259–1281.Andreoni, James, Miller, John, 2002. Giving according to GARP: An experimental test of the consistency of preferences for altruism. Econometrica 70 (2),
737–753.Axelrod, Robert, Hamilton, William D., 1981. The evolution of cooperation. Science 211 (4489), 1390–1396.Baron, David, Kalai, Ehud, 1993. The simplest equilibrium of a majority-rule division game. J. Econ. Theory 61, 290–301.Bednar, Jenna, Page, Scott E., 2007. Can game(s) theory explain culture?: The emergence of cultural behavior in multiple games. Rationality and Society 19
(1), 65–97.Cason, Timothy N., Gangadharan, Lata, 2010. Cooperation spillovers and price competition in experimental markets. Working paper.Cason, Timothy N., Gangadharan, Lata, Savikhin, Anya, Sheremeta, Roman M., 2010. Cooperation spillovers in coordination games. Working paper.

JID:YGAME AID:1939 /FLA [m3G; v 1.55; Prn:12/07/2011; 15:00] P.20 (1-20)
20 J. Bednar et al. / Games and Economic Behavior ••• (••••) •••–•••
Cooper, David J., Kagel, John H., 2008. Learning and transfer in signaling games. Econ. Theory 34 (3), 415–439. March.Cover, Thomas M., Thomas, Joy A., 2006. Elements of Information Theory. Wiley–Interscience.Crawford, Vincent, Broseta, Bruno, 1998. What price coordination? The e!ciency-enhancing effect of auctioning the right to play. Amer. Econ. Rev. 88 (1),
198–225.Engle-Warnick, Jim, Slonim, Robert L., 2006. Inferring repeated-game strategies from actions: evidence from trust game experiments. Econ. Theory 28 (3),
603–632. August.Falk, Armin, Fischbacher, Urs, Gaechter, Simon, forthcoming. Living in two neighborhoods — Social interaction effects in the lab. Econ. Inquiry 49,
doi:10.1111/j.1465-7295.2010.00332.x.Fischbacher, Urs, 2007. z-Tree: Zurich toolbox for ready-made economic experiments. Exper. Econ. 10 (2), 171–178.Gilboa, Itzhak, Schmeidler, David, 1995. Case-based decision theory. Quart. J. Econ. 110 (3), 605–639.Grimm, Veronika, Mengel, Friederike, 2010. An experiment on learning in a multiple games environment. Working paper.Ham, John C., Kagel, John H., Lehrer, Steven F., 2005. Randomization, endogeneity and laboratory experiments: the role of cash balances in private value
auctions. J. Econometrics 125 (1–2), 175–205. Experimental and non-experimental evaluation of economic policy and models.Hanaki, Nobuyuki, Sethi, Rajiv, Erev, Ido, Peterhansl, Alexander, 2005. Learning strategies. J. Econ. Behav. Organ. 56, 523–542.Haruvy, Ernan, Stahl, Dale O., 2010. Learning transference between dissimilar symmetric normal-form games. Working paper.Huck, Steffen, Jehiel, Philippe, Rutter, Tom, 2010. Feedback spillover and analogy-based expectations: a multi-game experiment. Games Econ. Behav. 71 (2),
351–365.Jehiel, Philippe, 2005. Analogy-based expectation equilibrium. J. Econ. Theory 123, 81–104.Kalai, E., Stanford, W., 1988. Finite rationality and strategic complexity in repeated games. Econometrica 56 (2), 397–410.Luce, R. Duncan, 1986. Response Times: Their Role in Inferring Elementary Mental Organization. Oxford University Press, New York.Miller, John H., Page, Scott E., 2007. Complex Adaptive Systems: An Introduction to Computational Models of Social Life. Princeton University Press, Prince-
ton, NJ.Rubinstein, Ariel, 1982. Perfect equilibrium in a bargaining model. Econometrica 50, 97–109.Rubinstein, Ariel, 1986. Finite automata play the repeated prisoner’s dilemma. J. Econ. Theory 39 (1), 83–96.Rubinstein, Ariel, 2007. Instinctive and cognitive reasoning: a study of response times. Econ. J. 117, 1243–1259. October.Samuelson, Larry, 2001. Analogies, adaptations, and anomalies. J. Econ. Theory 97 (2), 320–366.Savikhin, Anya, Sheremeta, Roman M., 2010. Simultaneous decision-making in competitive and cooperative environments. Working paper.Shannon, Claude E., 1948. A mathematical theory of communication. Bell Syst. Techn. J. 27, 379–423.Tversky, Amos, Kahneman, Daniel, 1986. Rational choice and the framing of decisions. J. Bus. 59 (s4), S251.Van Huyck, John B., Battalio, Raymond C., Beil, Richard O., 1993. Asset markets as an equilibrium selection mechanism: coordination failure, game form
auctions, and tacit communication. Games Econ. Behav. 5 (3), 485–504.Weber, Roberto A., 2006. Managing growth to achieve e!cient coordination in large groups. Amer. Econ. Rev. 96 (1), 114–126.


![[ECON 4039] Markets, Games & Strategic Behavior](https://img.pdfslide.us/doc/110x75/552606205503467c6f8b4b7e/econ-4039-markets-games-strategic-behavior.jpg)