Embed Size (px)
Citation preview

1
Gakuji KURATA, Soichi MORIMOTO, Minna GUO, Yuzuru MATSUOKA
17th AIM International Workshop 17th – 18th February, 2012 NIES, Tsukuba, JAPAN
Kyoto University
Setsunan University Yoko SHIMADA
2
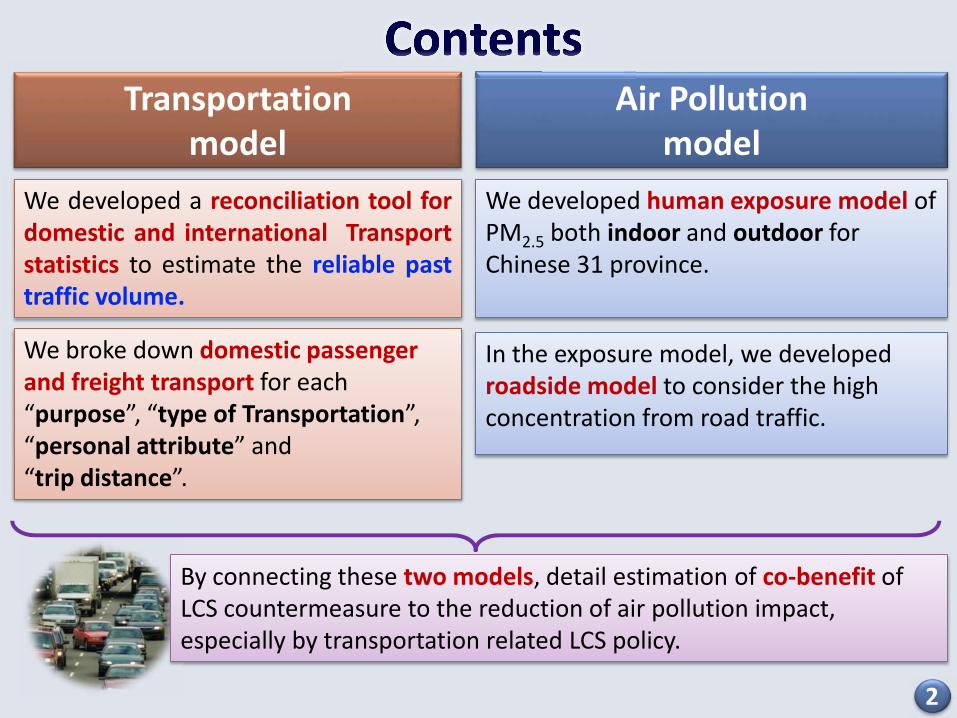
Transportation model
Air Pollution model
We developed a reconciliation tool for domestic and international Transport statistics to estimate the reliable past traffic volume.
We broke down domestic passenger and freight transport for each “purpose”, “type of Transportation”, “personal attribute” and “trip distance”.
We developed human exposure model of PM2.5 both indoor and outdoor for Chinese 31 province.
In the exposure model, we developed roadside model to consider the high concentration from road traffic.
By connecting these two models, detail estimation of co-benefit of LCS countermeasure to the reduction of air pollution impact, especially by transportation related LCS policy.
3
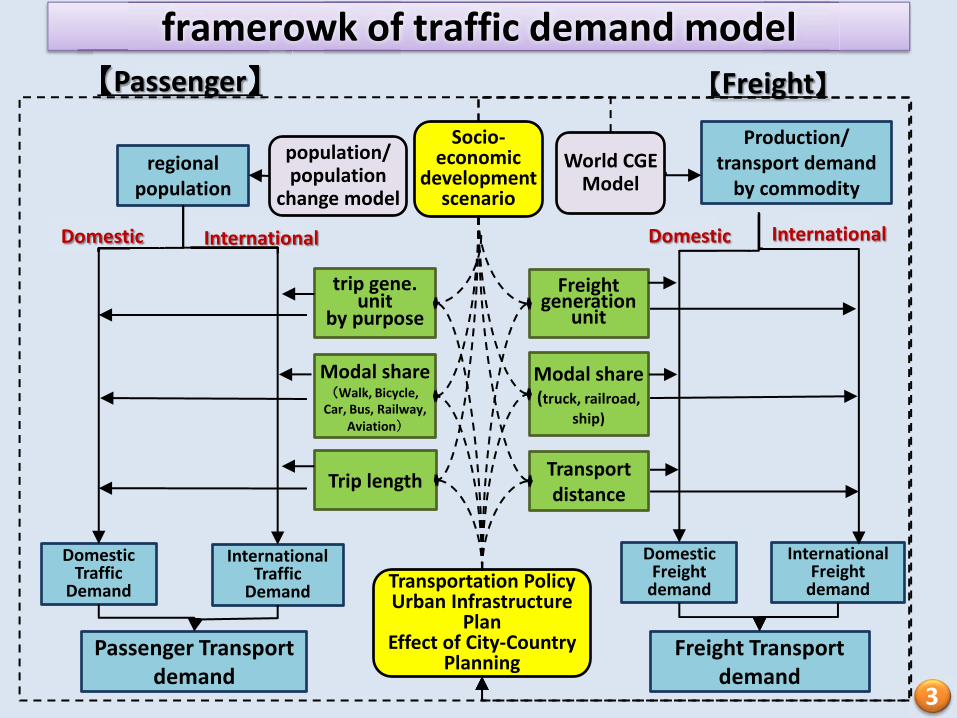
framerowk of traffic demand model
regional population
Domestic Traffic
Demand
trip gene. unit
by purpose
Modal share (Walk, Bicycle,
Car, Bus, Railway, Aviation)
Trip length
International Traffic
Demand
Passenger Transport demand
Domestic International
population/ population
change model
Production/ transport demand
by commodity
Domestic Freight
demand
Freight generation
unit
Modal share (truck, railroad,
ship)
Transport distance
International Freight
demand
Freight Transport demand
Domestic International
World CGE Model
【Passenger】 【Freight】
Socio-economic
development scenario
Transportation Policy Urban Infrastructure
Plan Effect of City-Country
Planning
4
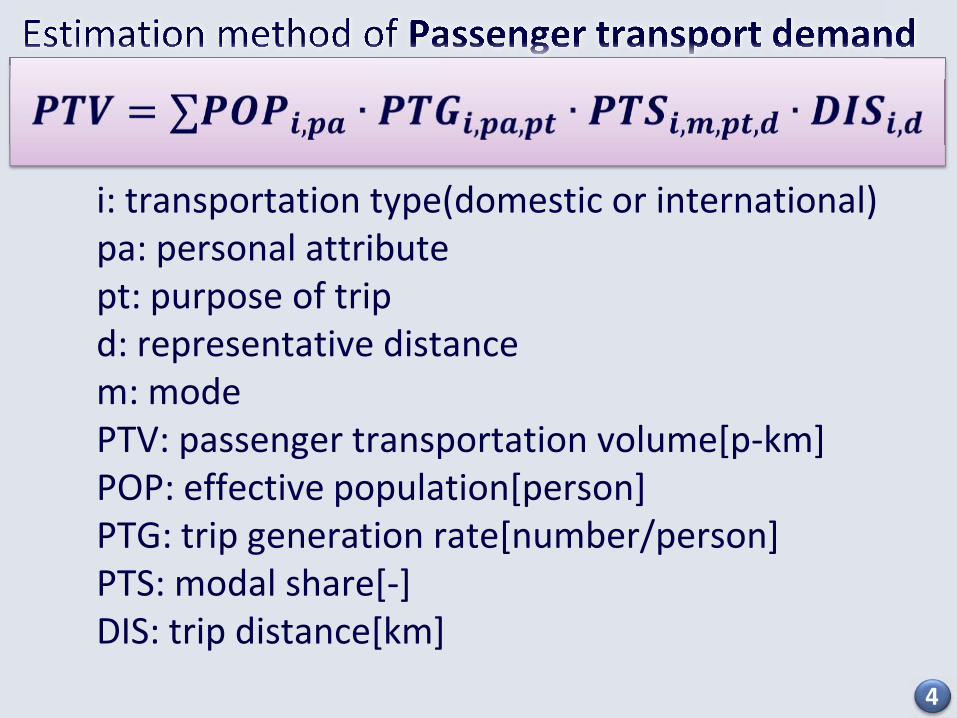
i: transportation type(domestic or international)pa: personal attribute pt: purpose of trip d: representative distance m: mode PTV: passenger transportation volume[p-km] POP: effective population[person] PTG: trip generation rate[number/person] PTS: modal share[-] DIS: trip distance[km]
5
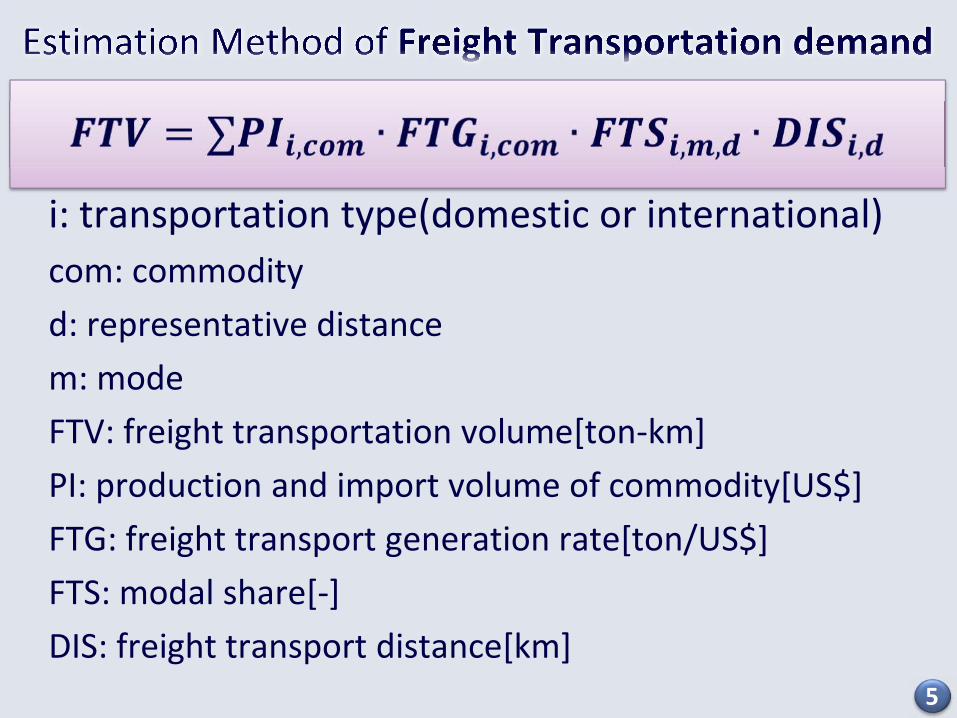
i: transportation type(domestic or international) com: commodity
d: representative distance
m: mode
FTV: freight transportation volume[ton-km]
PI: production and import volume of commodity[US$]
FTG: freight transport generation rate[ton/US$]
FTS: modal share[-]
DIS: freight transport distance[km]

6
STEP1
STEP2-F STEP2-P
Reconciliation of traffic data 1971-2005,
Possession of vehicle, transport, Total transport, energy consumption using statistical data
Decomposition of Passenger Transport
Estimation of the parameters of passenger transportation
at 2005
Decomposition of Freight Transport
Estimation of the parameter of Freight transportation
at 2005
Traffic Statistics Energy Statistics
Each type of Transport Total Passenger Transport
Each type of Transport Total Freight Transport
STEP2• Population • Trip generation unit • Trip distance share by type • Trip distance share by Purpose
• Production + import • Freight generation unit • Distance share by type
Freight generation unitmodal share
transportation distance
Trip generation unitmodal share trip distance
Task Data
Possession Total transportation
Energy consumption
Each type of transport
regional population
DomesticTraffic Demand
trip gene. unit
by purpose
Modal split(Walk, Bicycle,
Car, Bus, Railway, Aviation)
Trip length
International Traffic Demand
Passenger Transportdemand
Domestic International
population/population
change model
Production/transport demand
by commodity
DomesticFreight demand
Freight generation
unit
Modal Split(truck, railroad,
ship)
Transport distance
International Freight demand
Freight Transport demand
domestic international
World CGE Model
(35 region)
【Passenger】 【Freight】
Socio-economic
development scenario
Transportation PolicyUrban Infrastructure Plan
Effect of City-Country Planning
7
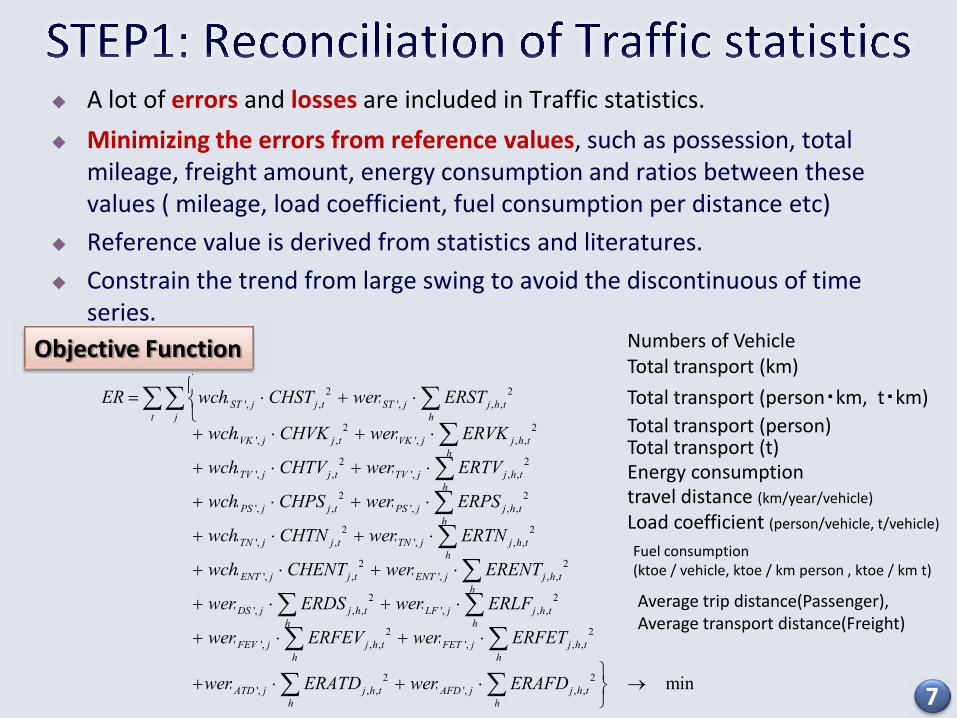
A lot of errors and losses are included in Traffic statistics.
Minimizing the errors from reference values, such as possession, total mileage, freight amount, energy consumption and ratios between these values ( mileage, load coefficient, fuel consumption per distance etc)
Reference value is derived from statistics and literatures.
Constrain the trend from large swing to avoid the discontinuous of time series.
Numbers of Vehicle Total transport (km)
Total transport (person・km, t・km) Total transport (person) Total transport (t) Energy consumption travel distance (km/year/vehicle)
Load coefficient (person/vehicle, t/vehicle)
Fuel consumption (ktoe / vehicle, ktoe / km person , ktoe / km t)
Average trip distance(Passenger), Average transport distance(Freight)
2 2' ', , ' ', , ,
2 2' ', , ' ', , ,
2 2' ', , ' ', , ,
2 2' ', , ' ', , ,
2' ', ,
ST j j t ST j j h tt j h
VK j j t VK j j h th
TV j j t TV j j h th
PS j j t PS j j h th
TN j j t
ER wch CHST wer ERST
wch CHVK wer ERVK
wch CHTV wer ERTV
wch CHPS wer ERPS
wch CHTN wer
2
' ', , ,
2 2' ', , ' ', , ,
2 2' ', , , ' ', , ,
2 2' ', , , ' ', , ,
2' ', , , ' ',
TN j j h th
ENT j j t ENT j j h th
DS j j h t LF j j h th h
FEV j j h t FET j j h th h
ATD j j h t AFD j
ERTN
wch CHENT wer ERENT
wer ERDS wer ERLF
wer ERFEV wer ERFET
wer ERATD wer ERAF
2, , minj h t
h hD
Objective Function
8
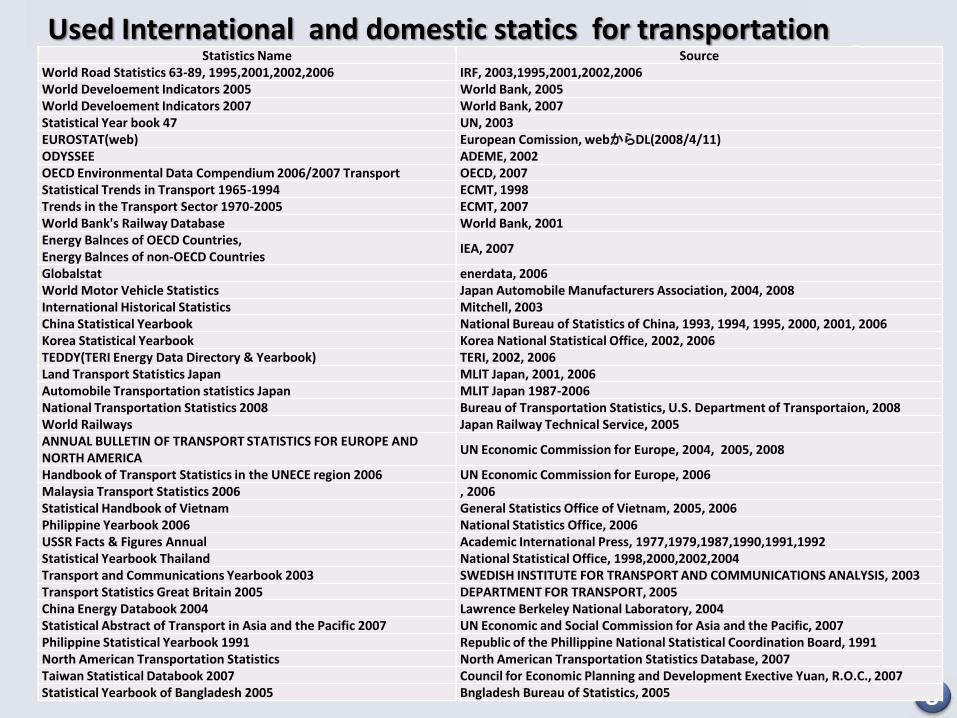
Statistics Name SourceWorld Road Statistics 63-89, 1995,2001,2002,2006 IRF, 2003,1995,2001,2002,2006World Develoement Indicators 2005 World Bank, 2005World Develoement Indicators 2007 World Bank, 2007Statistical Year book 47 UN, 2003EUROSTAT(web) European Comission, webからDL(2008/4/11)ODYSSEE ADEME, 2002OECD Environmental Data Compendium 2006/2007 Transport OECD, 2007Statistical Trends in Transport 1965-1994 ECMT, 1998Trends in the Transport Sector 1970-2005 ECMT, 2007World Bank's Railway Database World Bank, 2001Energy Balnces of OECD Countries, Energy Balnces of non-OECD Countries
IEA, 2007
Globalstat enerdata, 2006World Motor Vehicle Statistics Japan Automobile Manufacturers Association, 2004, 2008International Historical Statistics Mitchell, 2003China Statistical Yearbook National Bureau of Statistics of China, 1993, 1994, 1995, 2000, 2001, 2006Korea Statistical Yearbook Korea National Statistical Office, 2002, 2006TEDDY(TERI Energy Data Directory & Yearbook) TERI, 2002, 2006Land Transport Statistics Japan MLIT Japan, 2001, 2006Automobile Transportation statistics Japan MLIT Japan 1987-2006National Transportation Statistics 2008 Bureau of Transportation Statistics, U.S. Department of Transportaion, 2008World Railways Japan Railway Technical Service, 2005ANNUAL BULLETIN OF TRANSPORT STATISTICS FOR EUROPE AND NORTH AMERICA
UN Economic Commission for Europe, 2004, 2005, 2008
Handbook of Transport Statistics in the UNECE region 2006 UN Economic Commission for Europe, 2006Malaysia Transport Statistics 2006 , 2006Statistical Handbook of Vietnam General Statistics Office of Vietnam, 2005, 2006Philippine Yearbook 2006 National Statistics Office, 2006USSR Facts & Figures Annual Academic International Press, 1977,1979,1987,1990,1991,1992Statistical Yearbook Thailand National Statistical Office, 1998,2000,2002,2004Transport and Communications Yearbook 2003 SWEDISH INSTITUTE FOR TRANSPORT AND COMMUNICATIONS ANALYSIS, 2003Transport Statistics Great Britain 2005 DEPARTMENT FOR TRANSPORT, 2005China Energy Databook 2004 Lawrence Berkeley National Laboratory, 2004Statistical Abstract of Transport in Asia and the Pacific 2007 UN Economic and Social Commission for Asia and the Pacific, 2007Philippine Statistical Yearbook 1991 Republic of the Phillippine National Statistical Coordination Board, 1991North American Transportation Statistics North American Transportation Statistics Database, 2007Taiwan Statistical Databook 2007 Council for Economic Planning and Development Exective Yuan, R.O.C., 2007Statistical Yearbook of Bangladesh 2005 Bngladesh Bureau of Statistics, 2005
Statistics Name
Used International and domestic statics for transportation

9 9
Sample image of Result output
Mil-
p-km
p-km of passenger car (Australia) Example of the Result

10
STEP1
STEP2-F STEP2-P
Reconciliation of traffic data 1971-2005,
Possession of vehicle, transport, Total transport, energy consumption using statistical data
Decomposition of Passenger Transport
Estimation of the parameters of passenger transportation
at 2005
Decomposition of Freight Transport
Estimation of the parameter of Freight transportation
at 2005
Traffic Statistics Energy Statistics
Each type of Transport Total Passenger Transport
Each type of Transport Total Freight Transport
STEP2• Population • Trip generation unit • Trip distance share by type • Trip distance share by Purpose
• Production + import • Freight generation unit • Distance share by type
Freight generation unitmodal share
transportation distance
Trip generation unitmodal share trip distance
Task Data
Possession Total transportation
Energy consumption
Each type of transport
regional population
DomesticTraffic Demand
trip gene. unit
by purpose
Modal split(Walk, Bicycle,
Car, Bus, Railway, Aviation)
Trip length
International Traffic Demand
Passenger Transportdemand
Domestic International
population/population
change model
Production/transport demand
by commodity
DomesticFreight demand
Freight generation
unit
Modal Split(truck, railroad,
ship)
Transport distance
International Freight demand
Freight Transport demand
domestic international
World CGE Model
(35 region)
【Passenger】 【Freight】
Socio-economic
development scenario
Transportation PolicyUrban Infrastructure Plan
Effect of City-Country Planning
11
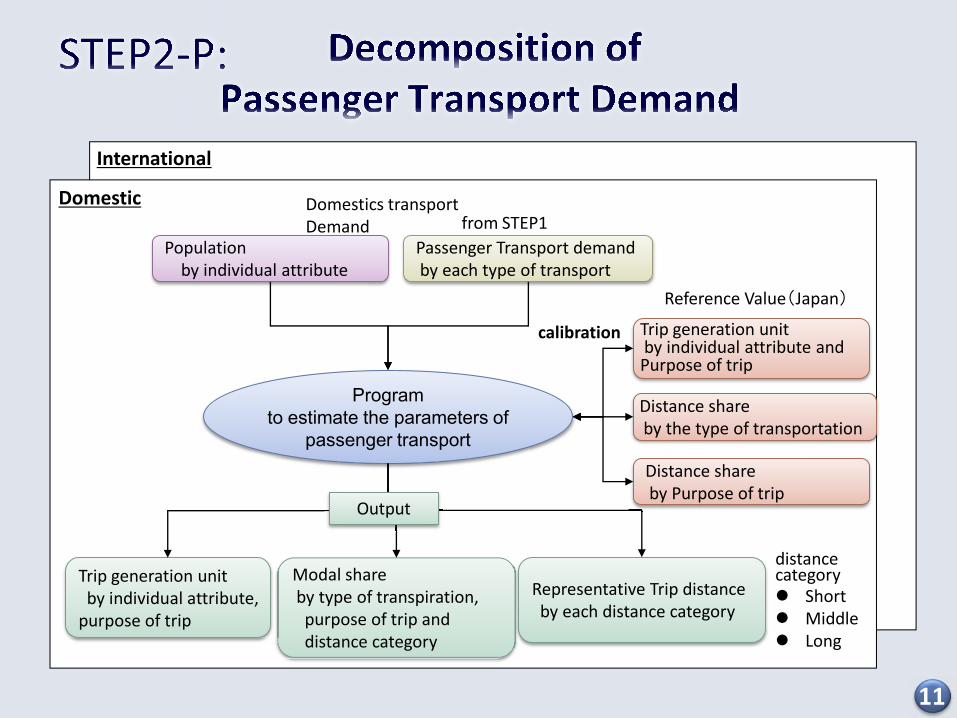
Population by individual attribute
Passenger Transport demand by each type of transport
Program to estimate the parameters of
passenger transport
Modal share by type of transpiration, purpose of trip and distance category
Trip generation unit by individual attribute, purpose of trip
Representative Trip distance by each distance category
Trip generation unit by individual attribute and Purpose of trip
Distance share by the type of transportation
Distance share by Purpose of trip
calibration
Output
from STEP1
Reference Value(Japan)
Domestics transport Demand
Domestic
International
distance category Short Middle Long

12
Production + import by each commodity
Freight transportation amount by each type of transportation
Program to estimate the parameters for Freight transportation
Modal share by type of transportation and distance category
Freight generation unit by commodity
Representative distance for each distance category
Freight generation unit by each commodity
Distance category share by each type of transportation
calibration
Output
from STEP1
Reference Value(Japan)
Each country Domestic
International
distance category Short Middle Long
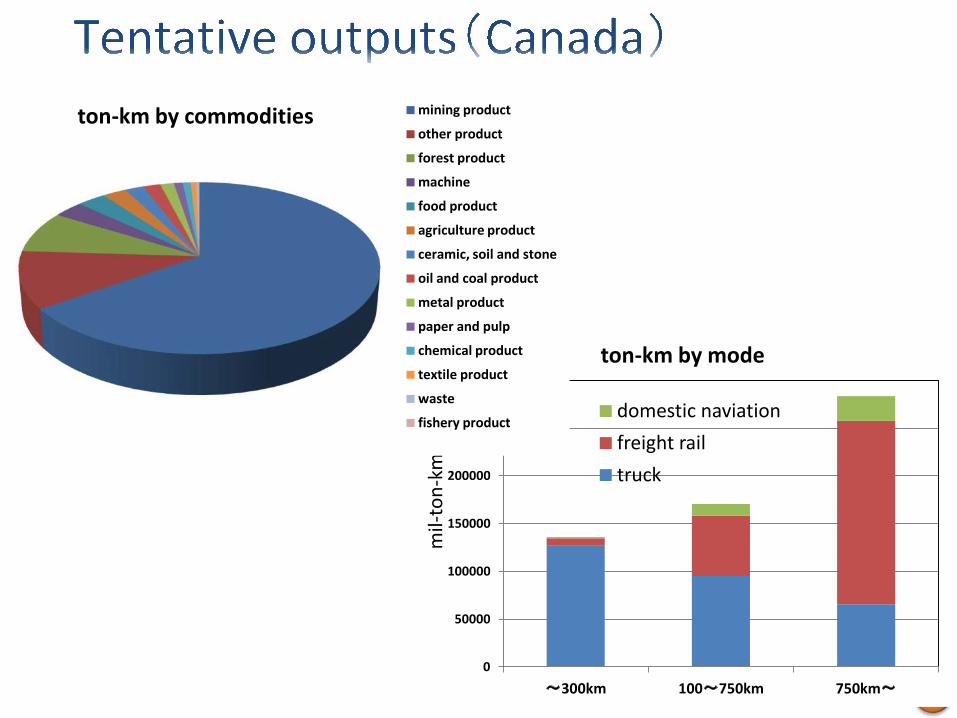
13 0
50000
100000
150000
200000
250000
300000
~300km 100~750km 750km~
mil-
ton-
km
ton-km by mode
domestic naviation
freight rail
truck
total: 5.9×10¹¹ton-km
ton-km by commodities mining product
other product
forest product
machine
food product
agriculture product
ceramic, soil and stone
oil and coal product
metal product
paper and pulp
chemical product
textile product
waste
fishery product
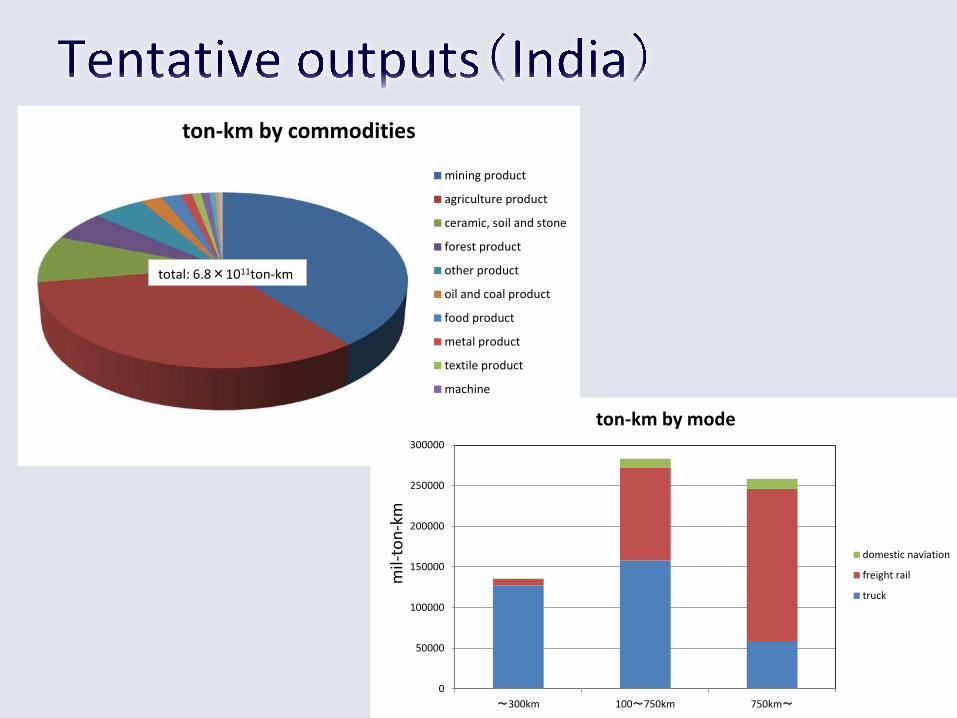
14
ton-km by commodities
mining product
agriculture product
ceramic, soil and stone
forest product
other product
oil and coal product
food product
metal product
textile product
machine
chemical product
fishery product
total: 6.8×10¹¹ton-km
0
50000
100000
150000
200000
250000
300000
~300km 100~750km 750km~
mil-
ton-
kmton-km by mode
domestic naviation
freight rail
truck
15
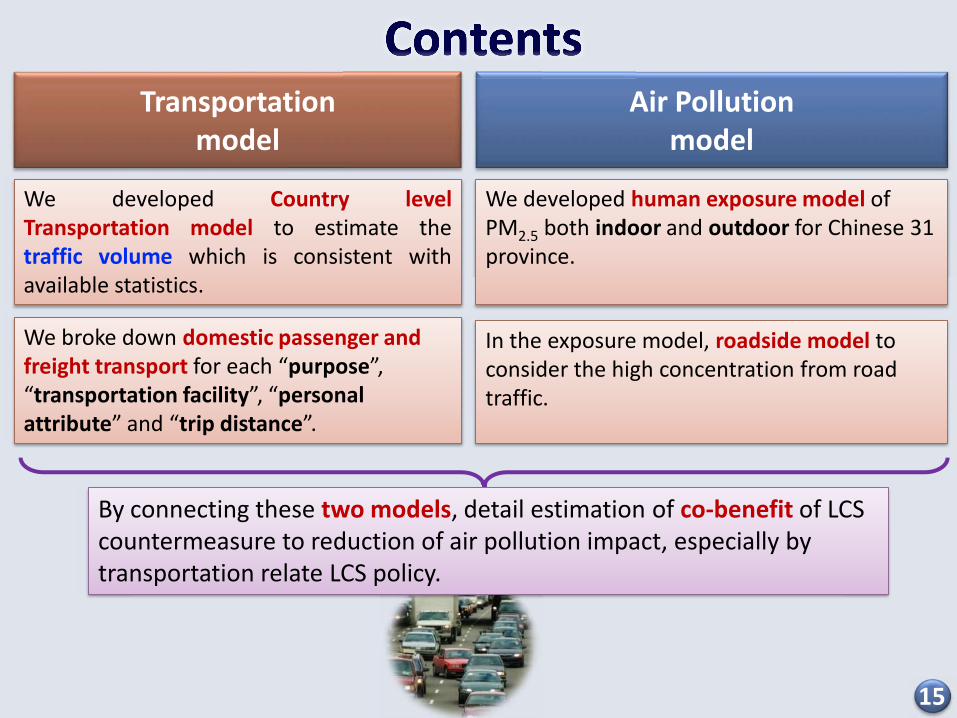
Transportation model
Air Pollution model
We developed Country level Transportation model to estimate the traffic volume which is consistent with available statistics.
We broke down domestic passenger and freight transport for each “purpose”, “transportation facility”, “personal attribute” and “trip distance”.
We developed human exposure model of PM2.5 both indoor and outdoor for Chinese 31 province.
In the exposure model, roadside model to consider the high concentration from road traffic.
By connecting these two models, detail estimation of co-benefit of LCS countermeasure to reduction of air pollution impact, especially by transportation relate LCS policy.

16
Emission inventory
Traffic by province Time use
survey
Energy / Fuelconsumption in Household
Micro-environment individual Exposure Model
Traffic by each road
Roadside Model
Background concentration
Concentration from road traffic
Staying duration in each
micro-environment for each age group
Indoor PM Emission
Concentration
Information about Housing
Estimation of Individual Exposure to PM2.5
Exposure to each age group
WRF / CMAQ
Duration
17
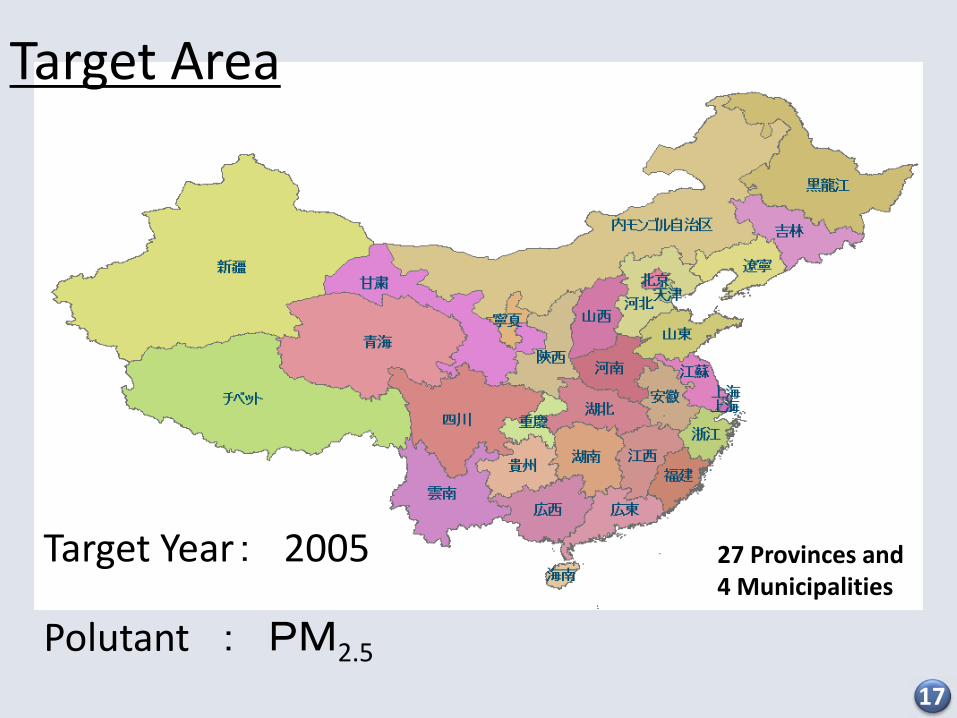
Target Area
Target Year: 2005
Polutant : PM2.5
27 Provinces and 4 Municipalities
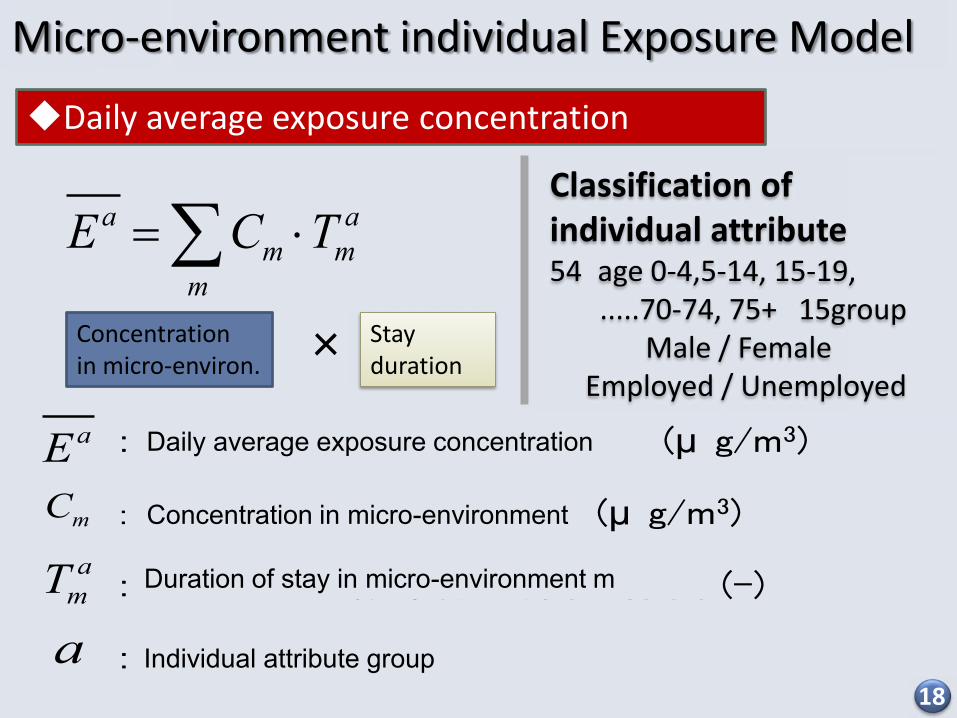
18
Daily average exposure concentration
Micro-environment individual Exposure Model
a am m
mE C T
コホート の 日平均曝露濃度 μ
微環境 の汚染物質濃度 μ
コホート の微環境 滞在時間率
コホート
aE
amTa
a
a mmC m
Classification of individual attribute 54 age 0-4,5-14, 15-19, .....70-74, 75+ 15group Male / Female Employed / Unemployed
× Concentration in micro-environ.
Stay duration
Daily average exposure concentration
Concentration in micro-environment
Duration of stay in micro-environment m
Individual attribute group
19 19
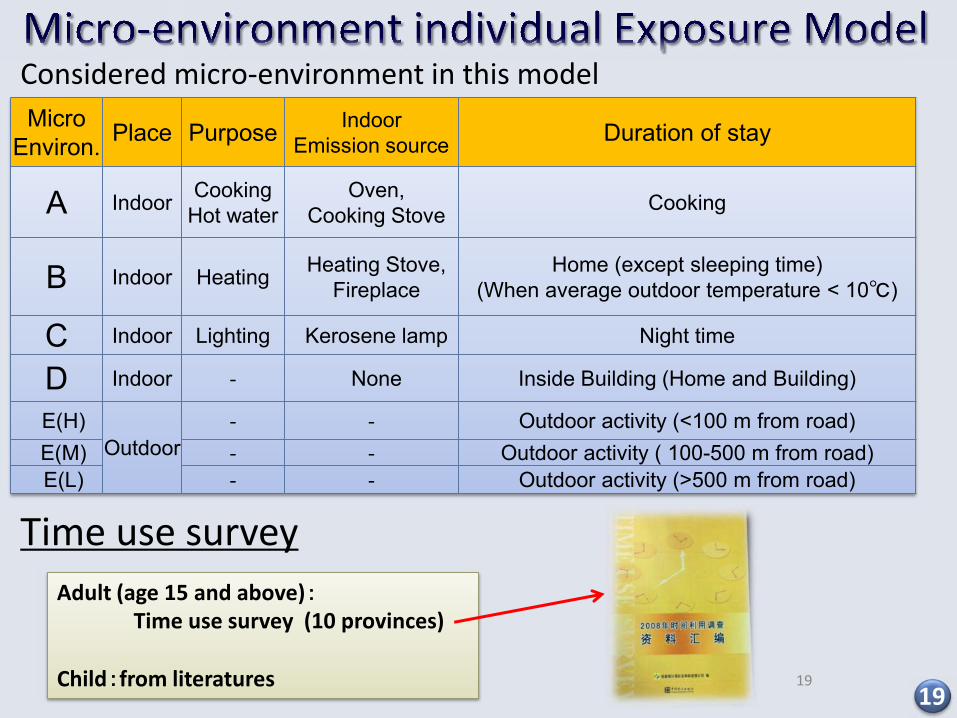
Considered micro-environment in this model Micro
Environ. Place Purpose Indoor Emission source Duration of stay
A Indoor Cooking Hot water
Oven, Cooking Stove Cooking
B Indoor Heating Heating Stove, Fireplace
Home (except sleeping time) (When average outdoor temperature < 10℃)
C Indoor Lighting Kerosene lamp Night time
D Indoor ‐ None Inside Building (Home and Building)
E(H) Outdoor
‐ ‐ Outdoor activity (<100 m from road) E(M) ‐ ‐ Outdoor activity ( 100-500 m from road) E(L) ‐ ‐ Outdoor activity (>500 m from road)
Time use survey Adult (age 15 and above): Time use survey (10 provinces) Child:from literatures
20
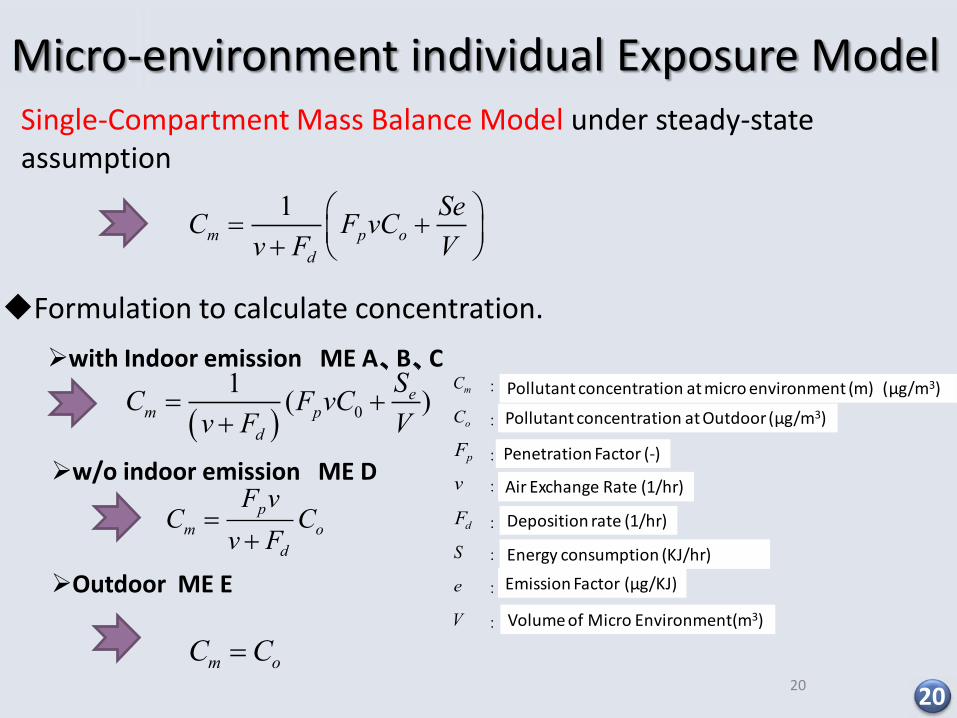
with Indoor emission ME A、B、C
w/o indoor emission ME D p
m od
F vC C
v F
Micro-environment individual Exposure Model
0
1 ( )em p
d
SC F vCv F V
Formulation to calculate concentration.
Outdoor ME E
m oC C
1m p o
d
SeC F vCv F V
Single-Compartment Mass Balance Model under steady-state assumption
20
mC 微環境mにおける大気汚染物質濃度 μ
oC 屋外大気汚染物質濃度 μ
pF 浸透率
v 換気回数
dF 除去率
S 一時間当たり燃料消費量
e 排出係数 μ
V 部屋の体積
Pollutant concentration at micro environment (m) (μg/m3)
Penetration Factor (-)
Pollutant concentration at Outdoor (μg/m3)
Air Exchange Rate (1/hr)
Deposition rate (1/hr)
Energy consumption (KJ/hr)
Emission Factor (μg/KJ)
Volume of Micro Environment(m3)
21
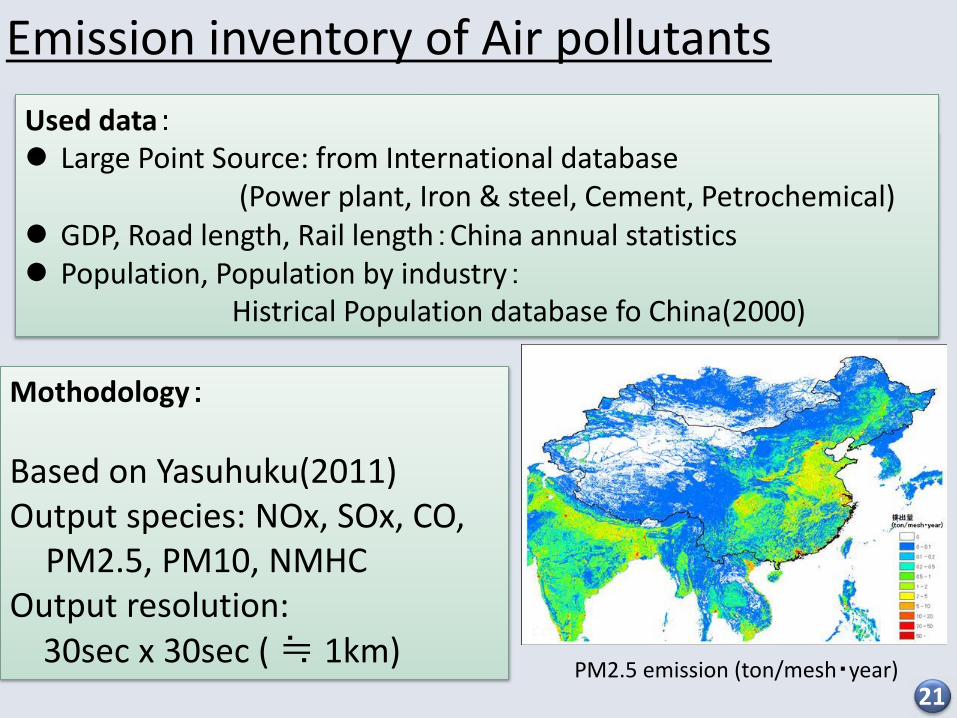
Emission inventory of Air pollutants Used data: Large Point Source: from International database (Power plant, Iron & steel, Cement, Petrochemical) GDP, Road length, Rail length:China annual statistics Population, Population by industry: Histrical Population database fo China(2000)
Mothodology: Based on Yasuhuku(2011) Output species: NOx, SOx, CO,
PM2.5, PM10, NMHC Output resolution: 30sec x 30sec ( ≒ 1km)
PM2.5 emission (ton/mesh・year)
22 22
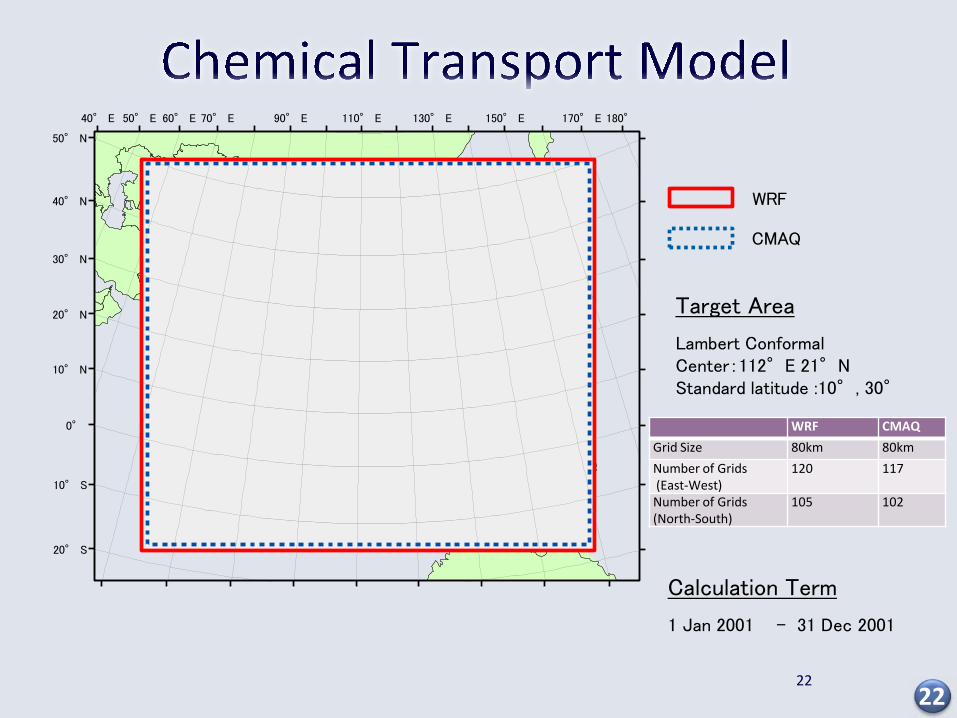
: ° °° °
WRF CMAQ
Grid Size 80km 80km
Number of Grids (East-West)
120 117
Number of Grids (North-South)
105 102
23
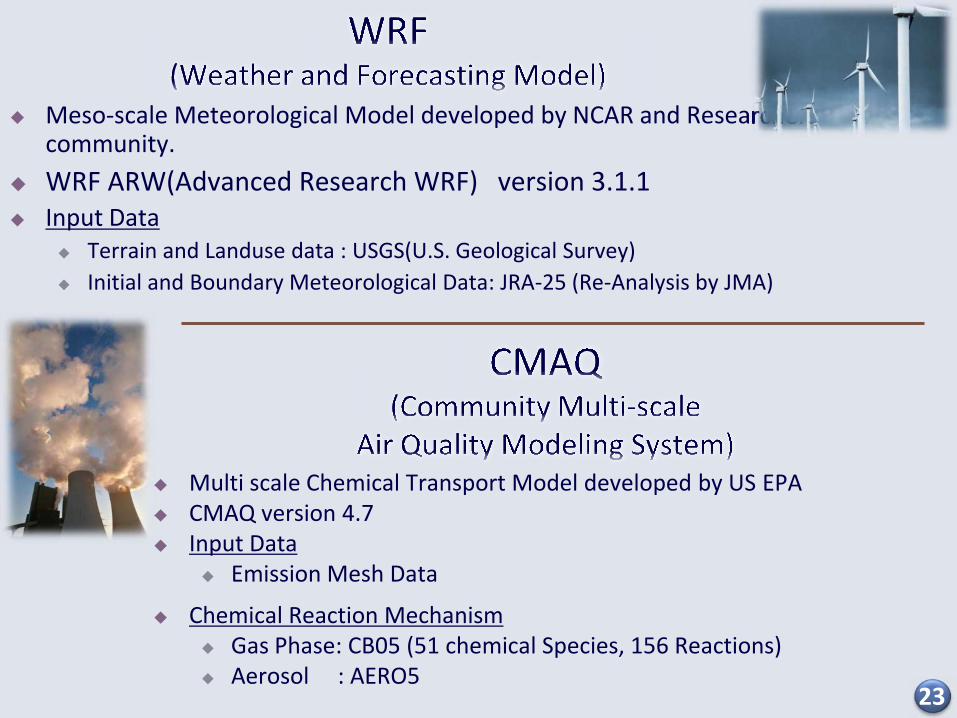
Meso-scale Meteorological Model developed by NCAR and Researchers community.
WRF ARW(Advanced Research WRF) version 3.1.1 Input Data
Terrain and Landuse data : USGS(U.S. Geological Survey) Initial and Boundary Meteorological Data: JRA-25 (Re-Analysis by JMA)
scale Meteorological Model developed by NCAR and Researchers
Multi scale Chemical Transport Model developed by US EPA CMAQ version 4.7 Input Data
Emission Mesh Data
Chemical Reaction Mechanism Gas Phase: CB05 (51 chemical Species, 156 Reactions) Aerosol : AERO5
24
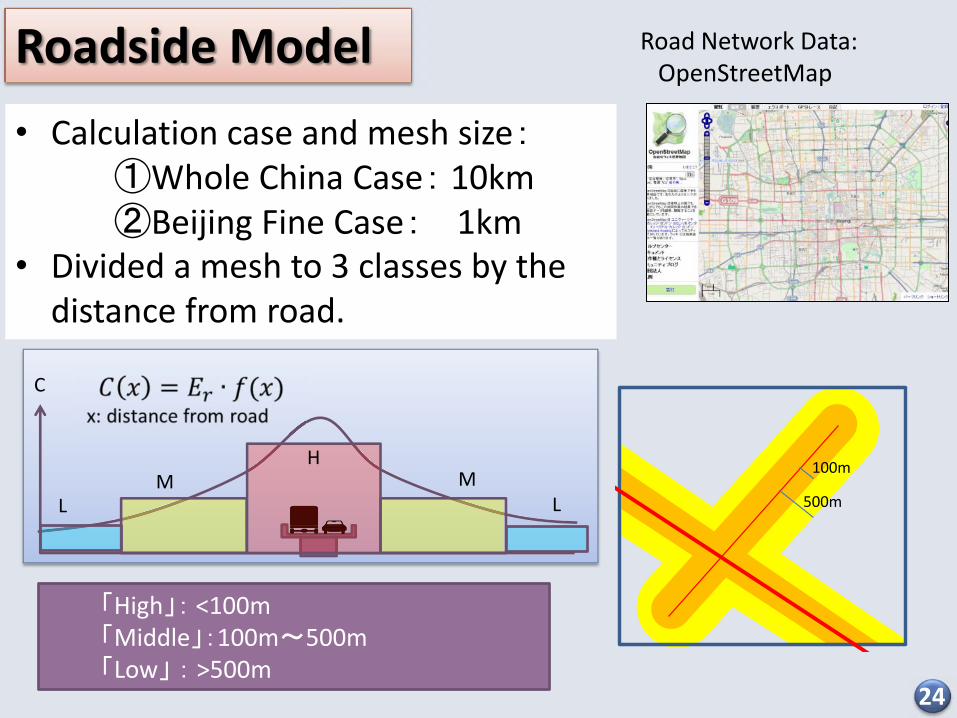
Roadside Model
• Calculation case and mesh size: ①Whole China Case: 10km②Beijing Fine Case: 1km
• Divided a mesh to 3 classes by the distance from road.
100m
500m
「High」: <100m 「Middle」:100m~500m 「Low」 : >500m
C
H M
L M
L
Road Network Data: OpenStreetMap
25 25
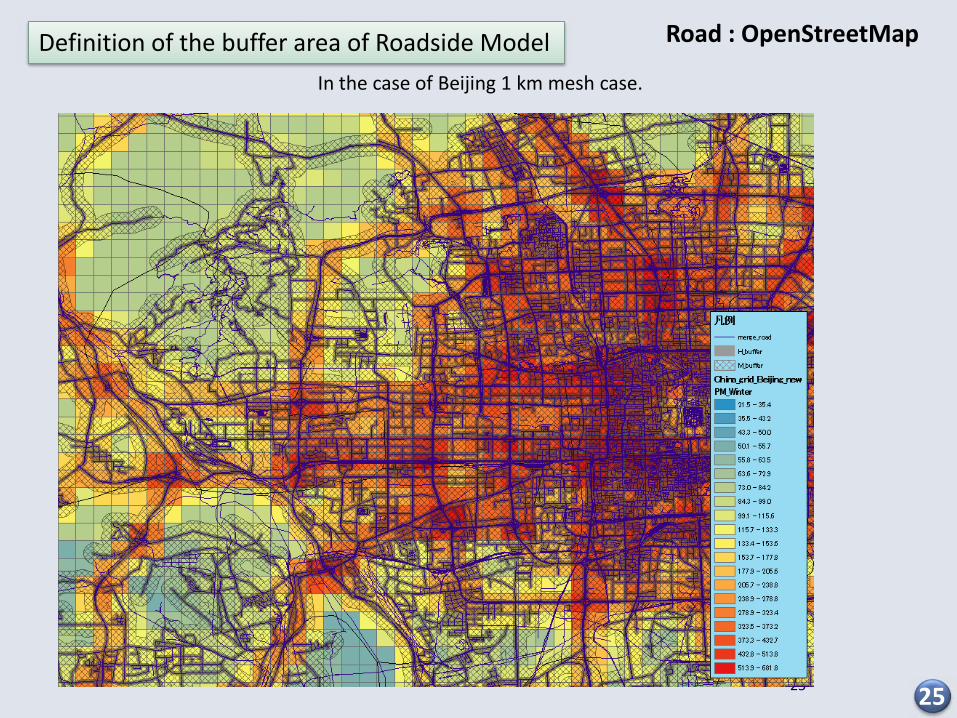
Definition of the buffer area of Roadside Model
In the case of Beijing 1 km mesh case.
Road : OpenStreetMap
26
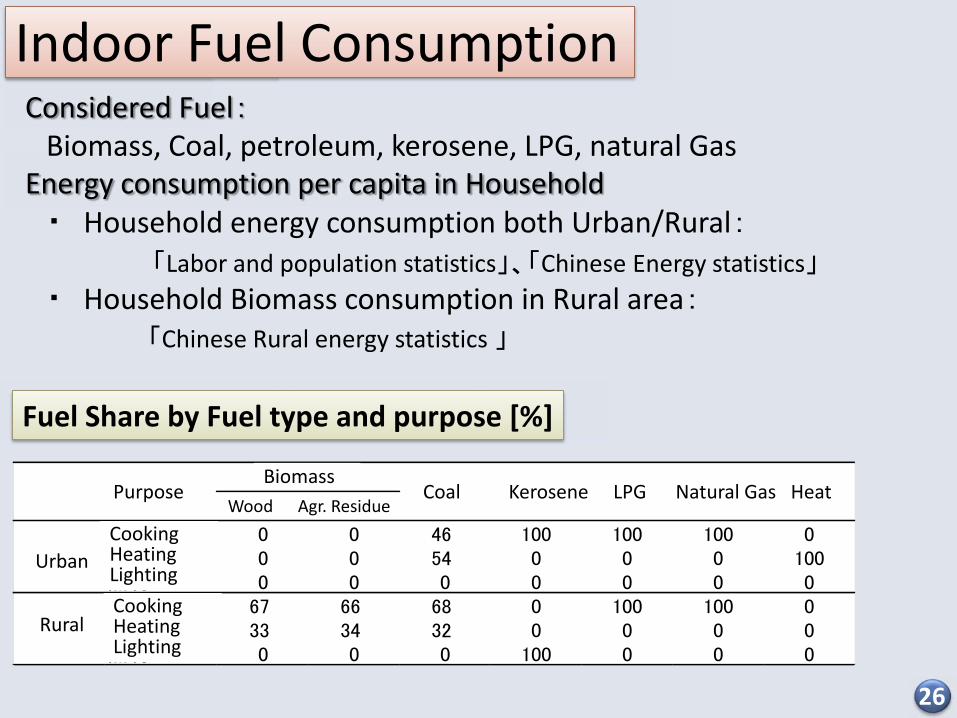
Considered Fuel: Biomass, Coal, petroleum, kerosene, LPG, natural Gas
Energy consumption per capita in Household ・ Household energy consumption both Urban/Rural:
「Labor and population statistics」、「Chinese Energy statistics」 ・ Household Biomass consumption in Rural area:
「Chinese Rural energy statistics 」
薪 作物残渣
調理・給湯暖房照明料理・給湯暖房照明
都市
農村
灯油 天然ガス 熱用途バイオマス
石炭
Indoor Fuel Consumption
Fuel Share by Fuel type and purpose [%]
Purpose Biomass
Wood Agr. Residue Coal Kerosene LPG Natural Gas Heat
Urban
Rural
Cooking Heating Lighting
Cooking Heating Lighting

27 27
28
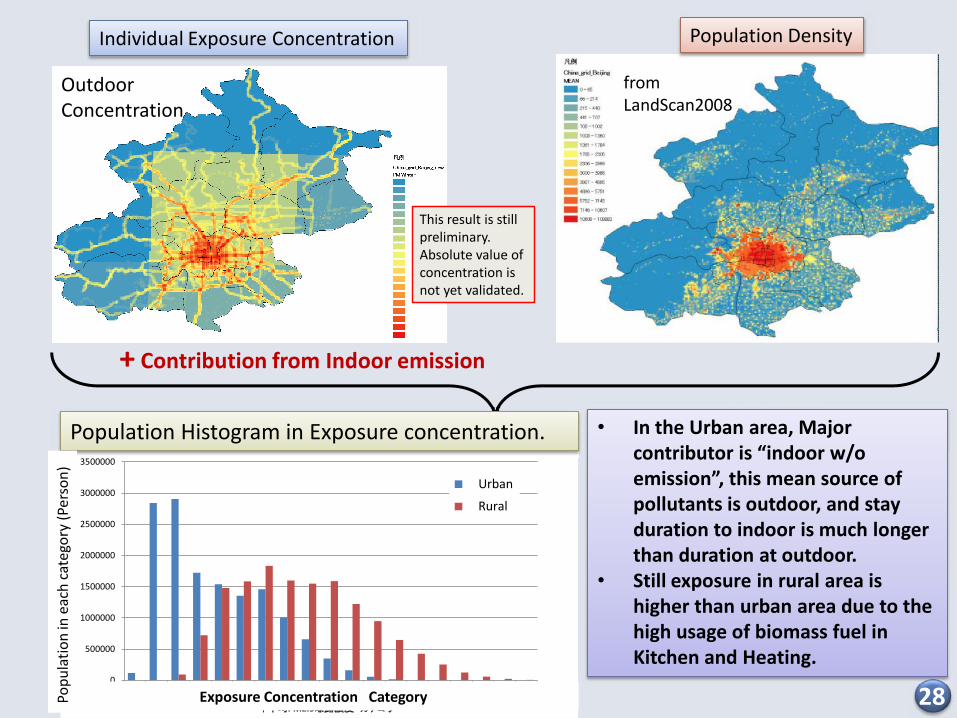
This result is stillpreliminary.Absolute value of concentration is not yet validated.
Individual Exposure Concentration Population Density
from LandScan2008
0
500000
1000000
1500000
2000000
2500000
3000000
3500000
50 100 150 200 250 300 350 400 450 500 550 600 650 700 750 800 850 900 950
曝露人口
(人)
年平均PM2.5曝露濃度 カテゴリー
Urban
Rural
Exposure Concentration Category
Population Histogram in Exposure concentration.
Popu
latio
n in
eac
h ca
tego
ry (P
erso
n)
+ Contribution from Indoor emission
• In the Urban area, Major contributor is “indoor w/o emission”, this mean source of pollutants is outdoor, and stay duration to indoor is much longer than duration at outdoor.
• Still exposure in rural area is higher than urban area due to the high usage of biomass fuel in Kitchen and Heating.
Outdoor Concentration
29
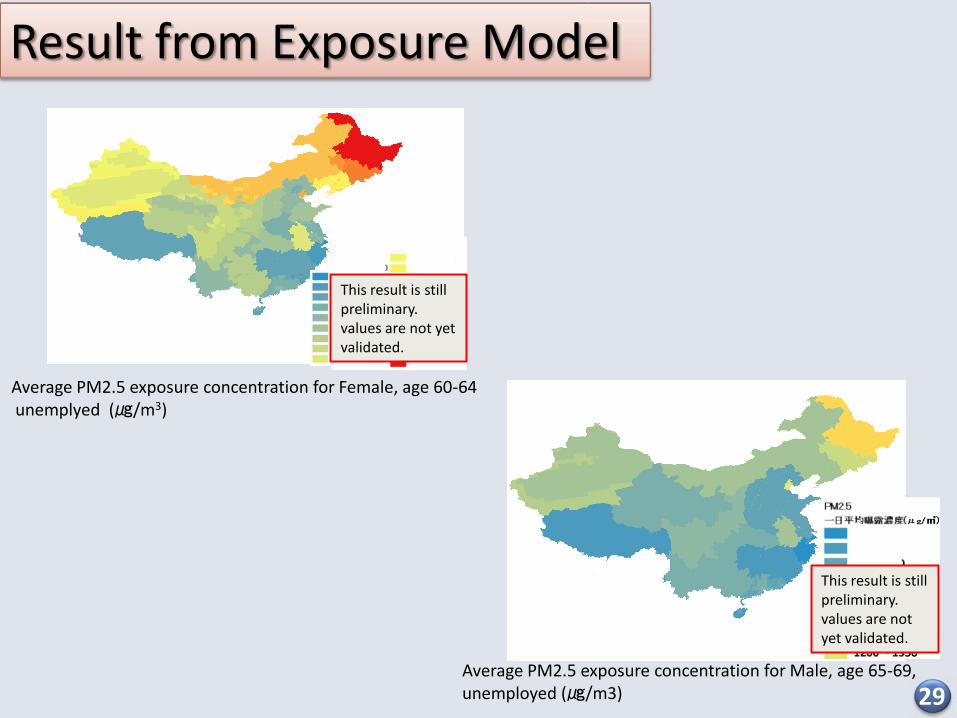
Average PM2.5 exposure concentration for Female, age 60-64 unemplyed (㎍/m3)
Result from Exposure Model
Average PM2.5 exposure concentration for Male, age 65-69, unemployed (㎍/m3)
This result is still preliminary. values are not yet validated.
This result is still preliminary. values are not yet validated.

30
北京
天津
河北
山西
内モンゴル
遼寧
吉林
黒龍江
上海
江蘇
浙江
安徽
福建
江西
山東
河南
湖北
湖南
広東
広西
海南
重慶
四川
貴州
雲南
チベット
陝西
甘粛
青海
寧夏
新疆
微環境 屋外 低
微環境 屋外 中
微環境 屋外 高
微環境 屋内・発生源なし
微環境C 照明)
微環境B 暖房)
微環境A 調理 給湯)
北京
天津
河北
山西
内モンゴル
遼寧
吉林
黒龍江
上海
江蘇
浙江
安徽
福建
江西
山東
河南
湖北
湖南
広東
広西
海南
重慶
四川
貴州
雲南
チベット
陝西
甘粛
青海
寧夏
新疆
微環境 屋外 低微環境 屋外 中微環境 屋外 高微環境 屋内・発生源なし微環境C 照明)微環境B 暖房)微環境A 調理 給湯)
Average PM2.5 exposure (Upper: Urban Lower: Rural)
Comparison between all province (Urban / Rural) 30
This result is still preliminary. values are not yet validated.
This result is stillpreliminary. values are not yet validated.
ME-E(L) (Outdoor-Low)ME-E(M) (Outdoor-Mid)ME-E(H) (Outdoor-High)ME-D (Indoor-w/o-emission)ME-C (Indoor-Lighting)ME-B (Indoor-Heating)ME-A (Indoor-Cooking)
ME-E(L) (Outdoor-Low)ME-E(M) (Outdoor-Mid)ME-E(H) (Outdoor-High)ME-D (Indoor-w/o-emission)ME-C (Indoor-Lighting)ME-B (Indoor-Heating)ME-A (Indoor-Cooking)

31
歳 歳 歳
歳・有職
歳・無職
歳・有職
歳・無職
歳・有職
歳・無職
歳・有職
歳・無職
歳・有職
歳・無職
歳・有職
歳・無職
歳・有職
歳・無職
歳・有職
歳・無職
歳・有職
歳・無職
歳・有職
歳・無職
歳・有職
歳・無職
歳・有職
歳・無職 歳 歳 歳
歳・有職
歳・無職
歳・有職
歳・無職
歳・有職
歳・無職
歳・有職
歳・無職
歳・有職
歳・無職
歳・有職
歳・無職
歳・有職
歳・無職
歳・有職
歳・無職
歳・有職
歳・無職
歳・有職
歳・無職
歳・有職
歳・無職
歳・有職
歳・無職
一日平均暴露濃度
μ
微環境 屋外 低微環境 屋外 中微環境 屋外 高微環境 屋内・発生源なし微環境C 照明)微環境B 暖房)微環境A 調理 給湯)
Comparison between all Individual attribute group
PM2.5 average Exposure concentration in Each age group ( Beijing, Uraban)
歳 歳 歳
歳・有職
歳・無職
歳・有職
歳・無職
歳・有職
歳・無職
歳・有職
歳・無職
歳・有職
歳・無職
歳・有職
歳・無職
歳・有職
歳・無職
歳・有職
歳・無職
歳・有職
歳・無職
歳・有職
歳・無職
歳・有職
歳・無職
歳・有職
歳・無職 歳 歳 歳
歳・有職
歳・無職
歳・有職
歳・無職
歳・有職
歳・無職
歳・有職
歳・無職
歳・有職
歳・無職
歳・有職
歳・無職
歳・有職
歳・無職
歳・有職
歳・無職
歳・有職
歳・無職
歳・有職
歳・無職
歳・有職
歳・無職
歳・有職
歳・無職
一日平均暴露濃度
μ
微環境 屋外 低微環境 屋外 中微環境 屋外 高微環境 屋内・発生源なし微環境C 照明)微環境B 暖房)微環境A 調理 給湯)
0
200
400
600
800
1000
1200
1400
0歳・男
1-4歳・男
5-14歳・男
15-1
9歳・有職・男
15-1
9歳・無職・男
20-2
4歳・有職・男
20-2
4歳・無職・男
25-2
9歳・有職・男
25-2
9歳・無職・男
30-3
4歳・有職・男
30-3
4歳・無職・男
35-3
9歳・有職・男
35-3
9歳・無職・男
40-4
4歳・有職・男
40-4
4歳・無職・男
45-4
9歳・有職・男
45-4
9歳・無職・男
50-5
4歳・有職・男
50-5
4歳・無職・男
55-5
9歳・有職・男
55-5
9歳・無職・男
60-6
4歳・有職・男
60-6
4歳・無職・男
65-6
9歳・有職・男
65-6
9歳・無職・男
70-7
4歳・有職・男
70-7
4歳・無職・男
0歳・女
1-4歳・女
5-14歳・女
15-1
9歳・有職・女
15-1
9歳・無職・女
20-2
4歳・有職・女
20-2
4歳・無職・女
25-2
9歳・有職・女
25-2
9歳・無職・女
30-3
4歳・有職・女
30-3
4歳・無職・女
35-3
9歳・有職・女
35-3
9歳・無職・女
40-4
4歳・有職・女
40-4
4歳・無職・女
45-4
9歳・有職・女
45-4
9歳・無職・女
50-5
4歳・有職・女
50-5
4歳・無職・女
55-5
9歳・有職・女
55-5
9歳・無職・女
60-6
4歳・有職・女
60-6
4歳・無職・女
65-6
9歳・有職・女
65-6
9歳・無職・女
70-7
4歳・有職・女
70-7
4歳・無職・女
微環境E(屋外)微環境D(屋内・発生源なし)微環境C(照明)微環境B(暖房)微環境A(調理+給湯)
0歳・女
1-4歳・女
5-14歳・女
15-1
9歳・有職・女
歳・女
歳・有職・女
歳・女
15-1
9歳・無職・女
20-2
4歳・有職・女
歳・無職・女
歳・有職・女
歳・無職・女
20-2
4歳・無職・女
25-2
9歳・有職・女
歳・無職・女
歳・有職・女
歳・無職・女
25-2
9歳・無職・女
30-3
4歳・有職・女
歳・無職・女
歳・有職・女
歳・無職・女
30-3
4歳・無職・女
35-3
9歳・有職・女
歳・無職・女
歳・有職・女
歳・無職・女
35-3
9歳・無職・女
40-4
4歳・有職・女
歳・無職・女
歳・有職・女
歳・無職・女
40-4
4歳・無職・女
45-4
9歳・有職・女
歳・無職・女
歳・有職・女
歳・無職・女
45-4
9歳・無職・女
50-5
4歳・有職・女
歳・無職・女
歳・有職・女
歳・無職・女
50-5
4歳・無職・女
55-5
9歳・有職・女
歳・無職・女
歳・有職・女
歳・無職・女
55-5
9歳・無職・女
60-6
4歳・有職・女
歳・無職・女
歳・有職・女
歳・無職・女
60-6
4歳・無職・女
65-6
9歳・有職・女
歳・無職・女
歳・有職・女
歳・無職・女
65-6
9歳・無職・女
70-7
4歳・有職・女
歳・無職・女
歳・有職・女
歳・無職・女
70-7
4歳・無職・女
黒龍江省・農村におけるコホート別PM2.5曝露濃度
歳・有職
歳・無職
歳・有職
歳・無職
歳・有職
歳・無職
歳・有職
歳・無職
歳・有職
歳・無職
歳・有職
歳・無職
歳・有職
歳・無職
歳・有職
歳・無職
歳・有職
歳・無職
歳・有職
歳・無職
歳・有職
歳・無職
歳・有職
歳・無職
PM2.5 average Exposure concentration in Each age group ( Beijing, Uraban)
ME-E(L) (Outdoor-Low)ME-E(M) (Outdoor-Mid)ME-E(H) (Outdoor-High)ME-D (Indoor-w/o-emission)ME-C (Indoor-Lighting)ME-B (Indoor-Heating)ME-A (Indoor-Cooking)
ME-E(L) (Outdoor-Low)ME-E(M) (Outdoor-Mid)ME-E(H) (Outdoor-High)ME-D (Indoor-w/o-emission)ME-C (Indoor-Lighting)ME-B (Indoor-Heating)ME-A (Indoor-Cooking)
This result is still preliminary. values are not yet validated.
This result is still preliminary. values are not yet validated.

32
Summary We developed the reconciliation method to estimate more reliable
international and domestic traffic data. We are developing the method to decompose the passenger and
freight transportation demand by individual attribute, trip purpose, type of transportation and trip distance.
This analysis may improve the future prediction of transportation demand and its structure.
We developed the individual exposure model to estimate the
human exposure from both indoor and outdoor air pollution, using WRF, CMAQ, roadside model and Exposure model.
We calculated individual exposure at the 1km or 10km mesh, so that we can estimate the population histogram of exposure concentration.
We developed the emission data from each road segment and the roadside model. More detail co-benefit analysis will be possible.
We developed the reconciliation method Transportation Model
We developed the individual exposure model to estimate the Air Pollution Model

33
Thank you for your attention
![2019 Study Schedule Workfile · 2018. 12. 23. · î W ì ì r î X ï ì u î W ï ì r ï W ì ì u ï W ì ì r ï W ï ì u ï W ï ì r ð W ì ì u W µ i D ] ] } v ] } µ ^](https://img.pdfslide.us/doc/110x75/60b29117a77734443e07c109/2019-study-schedule-workfile-2018-12-23-w-r-x-u-w-.jpg)


![W ( ] o o Dividend-15-16-I4.pdfWK>/ ^d d/KE ZK d,z ' Z : E ' Z E' >KZ /E / < v l ñ ò ì ì î ô D/E ì ì ì ì ì ì ì ì ì ì î ó î ï u } µ v ( } µ v o ] u v](https://img.pdfslide.us/doc/110x75/5f320c9c1c0d9679bb0f5acb/w-o-o-dividend-15-16-i4pdf-wk-d-dke-zk-dz-z-e-z-e-kz-e.jpg)
![s ] Ì µ o ] u ¾ Ì ( À ] Ì P o ] o & } v ] > Ì o Xs X < Ì u ... · & } v ] > Ì o Xs X < Ì u v l U & À ] Ì P o Ì l u v l. & } v ] > Ì o Xs X < Ì u v](https://img.pdfslide.us/doc/110x75/5f8f123ca6c5bb06e55e0a65/s-oe-o-u-oe-oe-p-o-o-v-oe-o-xs-x-oe-u-.jpg)

![2( q>0>+>6>&>/>' H Ì0Û oH >Ì ] ¦ >Ì >Ì Ì0Û o N L = i1 Â2( q>Ì >Ì2( q>0>+>6>&>/>' >Ì ] >Ì >Ì >Ì Ì0Û o N L = i1 Â2( q>Ì >Ì ³ 7 ]%$3 ] 5 >Ì >Ì >Ì ¹ BH H º Ø>Ì](https://img.pdfslide.us/doc/110x75/600feefac6099e3de479f008/2-q06-h-oe0-oh-oe-oe-oe-oe0.jpg)

![VCE presentation bis [modalità compatibilità ]...ì ñ ì ì í ì ì ì í ñ ì ì î ì ì ì î ñ ì ì ï ì ì ì ï ñ ì ì ð ì ì ì ð ñ ì ì ñ ì ì ì ì ñ ì](https://img.pdfslide.us/doc/110x75/5e378739bcb7c064f14877d2/vce-presentation-bis-modalitf-compatibilitf-.jpg)
![[2019.03]ì ì ì ë¬¸ì ¸í °ë · í ì ¬ì ê° ì (KOR)€¦ · Microsoft PowerPoint - [2019.03]ì ì ì ë¬¸ì ¸í °ë ·_í ì ¬ì ê° ì (KOR).pptx Author: freshj](https://img.pdfslide.us/doc/110x75/5f7278849163c419dd65e175/201903-kor-microsoft-powerpoint.jpg)


![Z } Ì v Á } Ì v ] u Ç } Ç Ì v Ì Ì ] s o v } ] } P v ] Ì i ... · s v ] } v i Ì Ì } Ì Ì P o v Ç Z Ì s } v l Á } P v µ Ì Ì Ì i P } / u ] ' ] v Ì Á ] l }Funkcja](https://img.pdfslide.us/doc/110x75/5fb0ed6a34374f058d3f1985/z-oe-v-oe-v-u-oe-v-oe-oe-s-o-v-p-v-oe-i-s-v-v.jpg)
![2018 HC Points for PDF 2018-08-13-1425...^ } v o W o Ç } ( ( v v } v î ì í ô r ì ñ r ì òd ì ì W ì ì W ì ì X ì ì ì } } v } o ò õ µ } ò v ( } u o ] v P õ ] v u,](https://img.pdfslide.us/doc/110x75/5f0cf19c7e708231d437e69e/2018-hc-points-for-pdf-2018-08-13-1425-v-o-w-o-v-v-v-.jpg)


![ZKD < U í õ o ] î ì î ì · î õ í ìdhD/BKt/ ^ Ç o Á ] < î ì Z > ò ð r^dK ð ò ì ñ ì ì õ ò ì X ì ì ï ñ í ì< D Z < t } v ] l < î ì](https://img.pdfslide.us/doc/110x75/5f67527405909476d76ae24d/zkd-u-o-dhdbkt-o-z-.jpg)