Embed Size (px)
Citation preview

Gait-based Frailty Assessment using Image Representation of IMUSignals and Deep CNN *
Muhammad Zeeshan Arshad1, Dawoon Jung1, Mina Park1, Hyungeun Shin2,Jinwook Kim1, and Kyung-Ryoul Mun1
©2021 IEEE. Personal use of this material is permitted. Permission from IEEE must be obtained for all other uses, in any current or future media,including reprinting/republishing this material for advertising or promotional purposes, creating new collective works, for resale or redistribution to serversor lists, or reuse of any copyrighted component of this work in other works. DOI: ¡DOI No.¿
Abstract— Frailty is a common and critical condition inelderly adults, which may lead to further deterioration ofhealth. However, difficulties and complexities exist in traditionalfrailty assessments based on activity-related questionnaires.These can be overcome by monitoring the effects of frailtyon the gait. In this paper, it is shown that by encoding gaitsignals as images, deep learning-based models can be utilizedfor the classification of gait type. Two deep learning models(a) SS-CNN, based on single stride input images, and (b) MS-CNN, based on 3 consecutive strides were proposed. It wasshown that MS-CNN performs best with an accuracy of 85.1%,while SS-CNN achieved an accuracy of 77.3%. This is becauseMS-CNN can observe more features corresponding to stride-to-stride variations which is one of the key symptoms of frailty.Gait signals were encoded as images using STFT, CWT, andGAF. While the MS-CNN model using GAF images achievedthe best overall accuracy and precision, CWT has a slightlybetter recall. This study demonstrates how image encoded gaitdata can be used to exploit the full potential of deep learningCNN models for the assessment of frailty.
I. INTRODUCTIONAdvancements in healthcare and medical technologies in
the last few decades have dramatically changed the worlddemographics. According to a recent UN report, our societyis aging so rapidly that by the year 2050 the number ofolder persons worldwide would double to over 1.5 billioncompared to the year 2020 [1]. This continuous trend has putforward new challenges to sustain healthcare and eldercarewhich must be dealt with major focus shift in healthcareservices towards early diagnosis and preventive interventionsand strategies.
Frailty, a condition that prevails in old age, is consideredas a state of increased vulnerability or a precursor to moreadverse outcomes like morbidity, falls, institutionalization,disabilities, and mortality [2]–[5]. Frailty can be defined asa gradual decrease in physiological and functional reservesas well as resistance to internal or external stressors. [3],[6], [7]. However, if identified and treated at an early stage,the onset of frailty and the consequent effects could bedelayed and in some cases avoided altogether for examplethrough early implementation of fall prevention strategies
*This research was supported by the Korea Institute of Science andTechnology Institutional Program (Project No. 2E31051) and in part bythe High-Tech Based National Athletic Performance Improvement (Winter)Project from the Korea Sports Promotion Foundation.
1Muhammad Zeeshan Arshad, Dawoon Jung, Mina Park, Jinwook Kim,and Kyung-Ryoul Mun are with the Center for Artificial Intelligence, KIST,Seoul, Republic of Korea. [email protected]
2Hyungeun Shin is with Department of Biomedical Science and Tech-nology, Graduate School, Kyung Hee University, Seoul, Republic of Korea.
Fig. 1. Flow chart of proposed frailty classification methodology
[8] and multicomponent exercises (i.e. strength, endurance,flexibility, and balance training) focused on improving thefunctional capacity of the elderly [9]. These would help toreduce the serious personal and societal impact that comeswith falling, resulting injuries, and their healthcare costs.
One of the most common methods to assess frailty ina clinical setting is the ”Fried Criteria” [10] which iden-tified five frailty phenotypes, namely, shrinking, weakness,slowness, exhaustion, and low activity. The other widelyused criteria include the Study of Osteoporotic Fractures(SOF) scale [11] and the FRAIL scale [12]. However, thesecriteria rely on answers from the patient to activity-relatedquestionnaires. Trained professionals are required to explainthe questions, measure different phenotypes, and assess theanswers carefully to overcome subjective interpretation andjudgments. Furthermore, medical history may be essentialfor more accurate assessment in some cases. All these factorsmake these frailty assessments too cumbersome to use in theacute hospital environment.
Gait has been strongly linked with frailty since the declinein mobility and balance is one of the major indicators offrailty and can be assessed through gait analysis [13]. Gaitvelocity [14], [15] and variability [16] are among the mostsignificantly affected gait parameters in frail patients. Theuse of wearable inertial sensors [17]–[20] to assess the gaitnot only simplifies and speeds up the assessment procedurebut also gives a more objective evaluation of frailty status.
In this paper we propose a frailty assessment methodwhich uses deep learning CNN models with image repre-sentation of gait data collected through Inertial MeasurementUnit (IMU) sensors. We propose two CNN models basedon single and multi-stride data. We also compare differentimaging techniques to evaluate their suitability for gait data.
II. METHODOLOGY
The frailty assessment methodology proposed in this paperstarts with the acquisition of gait data using IMU sensors asshown in Fig. 1. Then gait cycle segmentation is performedto extract individual gait strides. These segmented signalsare then encoded into images using different image encoding
arX
iv:2
110.
0782
1v1
[cs
.CV
] 1
5 O
ct 2
021
techniques. Finally, the encoded images are fed into CNN-based models for classifying the gait type. The followingsubsections describe the proposed methodology steps.
A. Participants and Data collection
The data for this study was collected from 71 elderlysubjects. Inclusion criteria were being older, community-dwelling adults with age ≥ 65 years, and having the abilityto walk independently without a walking aid. Subjects withany musculoskeletal abnormalities or severe gait and balancedisorders that may limit their ability to walk at least 20mwere excluded. The demographic characteristics of the cohortare presented in Table I. A brief introduction about thestudy was provided to the participants. A written and signedinformed consent was taken from all participants before theexperiment. This study was approved by the InstitutionalReview Board of Kyung Hee University Medical Center.
TABLE IDEMOGRAPHIC INFORMATION OF THE PATIENTS
Variable Mean ± SD (Range)
Age (years) 77.56 ± 3.92 (71-86)Height (cm) 155.90 ± 18.35 (141.2-175)Weight (kg) 60.08 ± 9.12 (41.4-93)
Gender- Male (%) 38.02- Female (%) 61.98
The frailty assessment of the subjects was made usingthe FRAIL scale [12] which assigns scores from 0 to 5 inan increasing order of frailty severity. A score of 0 impliesrobust, 1-2 implies pre-frail, and 3–5 implies frail status.However, the last two can be combined to be referred asa non-robust state. Therefore, for this work, subjects weredivided into two groups, robust (with a score of zero) andnon-robust (with a score exceeding zero), in terms of theirfrailty status. Out of 71 subjects, 26 were termed as robustand the rest of the 45 as non-robust.
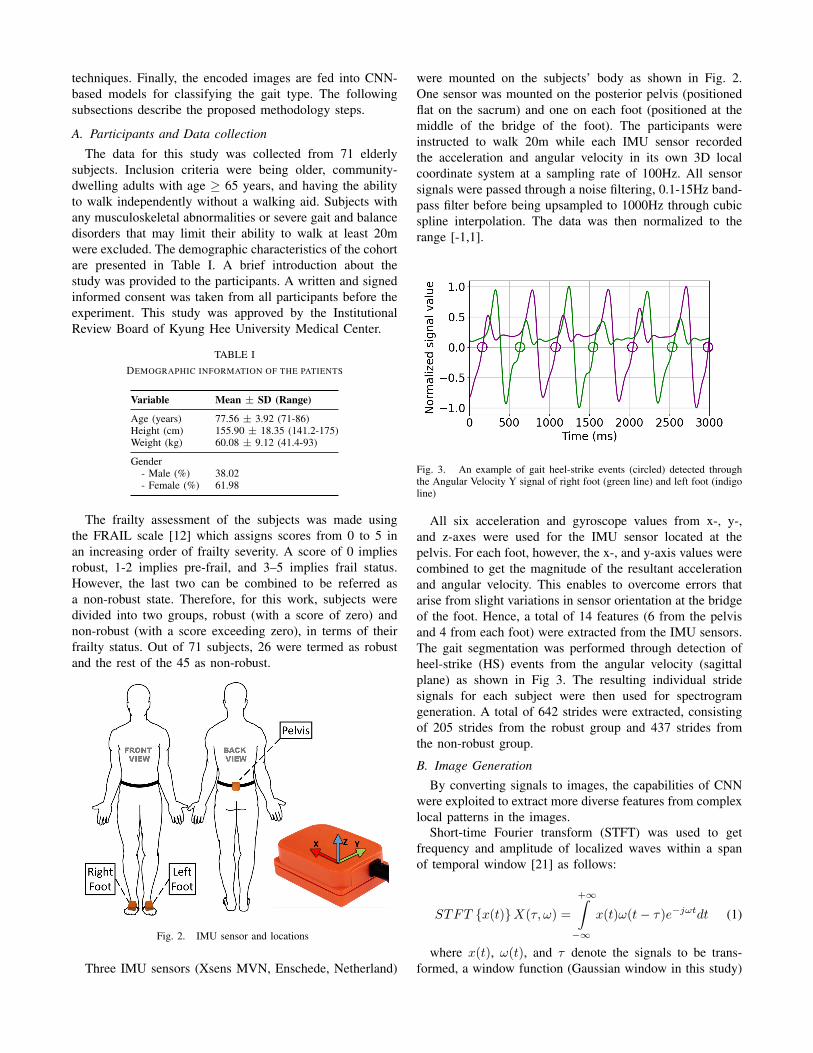
Fig. 2. IMU sensor and locations
Three IMU sensors (Xsens MVN, Enschede, Netherland)
were mounted on the subjects’ body as shown in Fig. 2.One sensor was mounted on the posterior pelvis (positionedflat on the sacrum) and one on each foot (positioned at themiddle of the bridge of the foot). The participants wereinstructed to walk 20m while each IMU sensor recordedthe acceleration and angular velocity in its own 3D localcoordinate system at a sampling rate of 100Hz. All sensorsignals were passed through a noise filtering, 0.1-15Hz band-pass filter before being upsampled to 1000Hz through cubicspline interpolation. The data was then normalized to therange [-1,1].
Fig. 3. An example of gait heel-strike events (circled) detected throughthe Angular Velocity Y signal of right foot (green line) and left foot (indigoline)
All six acceleration and gyroscope values from x-, y-,and z-axes were used for the IMU sensor located at thepelvis. For each foot, however, the x-, and y-axis values werecombined to get the magnitude of the resultant accelerationand angular velocity. This enables to overcome errors thatarise from slight variations in sensor orientation at the bridgeof the foot. Hence, a total of 14 features (6 from the pelvisand 4 from each foot) were extracted from the IMU sensors.The gait segmentation was performed through detection ofheel-strike (HS) events from the angular velocity (sagittalplane) as shown in Fig 3. The resulting individual stridesignals for each subject were then used for spectrogramgeneration. A total of 642 strides were extracted, consistingof 205 strides from the robust group and 437 strides fromthe non-robust group.
B. Image GenerationBy converting signals to images, the capabilities of CNN
were exploited to extract more diverse features from complexlocal patterns in the images.
Short-time Fourier transform (STFT) was used to getfrequency and amplitude of localized waves within a spanof temporal window [21] as follows:
STFT {x(t)}X(τ, ω) =
+∞∫−∞
x(t)ω(t− τ)e−jωtdt (1)
where x(t), ω(t), and τ denote the signals to be trans-formed, a window function (Gaussian window in this study)

centered around zero, and a time shift, respectively. Thespectrogram is generated by squaring the STFT magnitudeas follows:
spectrogram{x(t)} = ‖X(τ, ω)‖2 (2)
The frequency range was restricted to 6Hz and the timeresolution was fixed at 0.1s. Figure 4 (a) shows the STFTspectrogram for the x-axis pelvis acceleration signal. Thebrighter colors correspond to a higher energy frequencycomponent.
Compared to Fourier transform where signals are decom-posed into sinusoids of different frequencies, in the Continu-ous Wavelet Transform (CWT), the signals are decomposedinto shifted or scaled shapes from the mother wavelet. CWTis defined [22] as:
C(a, b) =1√∣∣a∣∣
+∞∫−∞
s(t)Ψ∗(t−ba
)dt
a ∈ R+ − {0}, b ∈ R,
(3)
where f(t) is the input signal and Ψa,b(t) is the motherwavelet with ’a’ as the scale factor and ’b’ as the shiftfactor. The CWT for this study used the Morse waveletwith 20 voices per octave and a frequency range restrictedto 15Hz. The visual representation of the CWT of a signalis referred to as a scalogram. The scalogram for the x-axispelvis acceleration signal is presented in Fig. 4 (b).
Fig. 4. Example images generated for accelerometer x-signal on pelvissensor (a) using STFT (b), CWT (c), and GAF (d)
Granular Angular Field (GAF) is a method which usespolar coordinates based matrix to encode a time seriesinto an image while still preserving the absolute temporalrelationships in the series [23]. In this study we use GramianAngular Summation Field (GASF) which uses the cosine ofthe summation of angles from the polar coordinates and isgiven as:
GASF =
cos(φ1 + φ1) . . . cos(φ1 + φn)cos(φ2 + φ1) . . . cos(φ2 + φn)
.... . .
...cos(φn + φ1) . . . cos(φn + φn)
(4)
Figure 4 (c) shows the GASF for an example signal. Allimages from STFT, CWT, and GAF were produced with thedimensions 224x224 pixels. A total of 17,976 images wereproduced from the three sensors from the 71 participants.
Fig. 5. CNN model architecture (a) Single-stride-CNN (b) Multi-stride-CNN
C. Convolution Neural Network Modeling
To prepare the images for input to the CNN model,all images, sized 224 x 224 x 3 (3-channel RGB image)each, from each of the 14 parameters were stacked in theorder of pelvis, right foot, and left foot. This way, for eachstride, the input image set of size 224 x 224 x 42 wasobtained. Two types of CNN models were proposed in thisstudy: the Single-stride-CNN (SS-CNN) and Multi-stride-CNN (MS-CNN). SS-CNN uses a single stride image set(Si) as input to train and classify between the two outputclasses robust and non-robust for training and testing. asshown in 5 (a). However, MS-CNN uses three consecutivestrides (Si, Si+1, Si+2)) of the subject for the task as in Fig. 5(b). Leaping one step ahead of just learning on features fromeach stride, the MS-CNN further enables identification andlearning of features related to stride-to-stride variability inthe gait. For n consecutive strides, n−2 three-stride sets wereextracted. For instance, for a subject having 10 consecutivestrides in the data, 8 three-stride sets were obtained as [1, 2,3], [2, 3, 4], [3, 4, 5] ... [8, 9, 10]. This resulted in a totalof 360 stride sets, 103 from the robust group and 257 fromthe non-robust group.
The proposed architecture of SS-CNN consists of six con-volutional blocks, followed by three fully connected layersand a sigmoid layer at the output as shown in Fig. 5 (a).Each convolutional block contains a convolutional layer, aRectified Linear Unit (ReLU) layer, a batch normalization(BN) layer, and a Maxpooling layer. The six convolutionallayers have filter sizes 64, 128, 128, 128, 256, and 512. Thekernel size is set to 20x20 for all. The three fully connectedlayers have lengths 64, 32, and 1 as the output. Dropoutlayers are applied to the fully connected layers. The detailed

Fig. 6. The detailed architecture of CNN and Dense block in the CNN model
architecture of CNN and fully connected layers is given inFig. 6.
In MS-CNN, instead of a single stride image set, the inputconsisting of three consecutive stride image sets goes intoseparate convolutional blocks which are concatenated beforethe fully connected layers as shown in Fig. 5 (b). Here, thedesign parameters for the convolutional blocks and the fullyconnected layers have been kept the same as in SS-CNN.
D. Training and Testing
For both types of models, 90% of images were selectedfor training and 10% for testing, in a stratified manner asto keep the same class distribution as in the original data.A stratified shuffle split cross-validation with five folds wasused to evaluate performance. The networks were trainedusing Adaptive learning rate (ADADELTA) to make the bestof both, learning rate annealing and momentum training toconverge faster. Initial values of the weights and bias wereinitialized with Glorot uniform initializer. An early stoppingcriterion was employed to stop training when the validationaccuracy did not improve for 5 epochs.
TABLE IIMODEL RESULTS
Model Image Accuracy Precision Recall F-Measure
SS-
CNN
STFT 0.66 0.722 0.843 0.778
CWT 0.713 0.808 0.813 0.811
GAF 0.773 0.810 0.878 0.843
MS-
CNN
STFT 0.72 0.808 0.889 0.847
CWT 0.823 0.875 0.904 0.889
GAF 0.851 0.912 0.896 0.904
III. RESULTS AND DISCUSSION
Table II shows the classification results for the twoproposed models. As SS-CNN uses single stride images,hence the number of training samples was equal to the totalnumber of strides available in the data. On the other hand,the MS-CNN requires a set of three consecutive strides,which reduces the number of training samples by abouthalf. Nonetheless, the MS-CNN attains better performancecompared to the SS-CNN for all three types of images. Thatis because the output of MS-CNN architecture relies not only
on the features of each stride but more importantly on thegait dynamics and stride-to-stride variation within the threestrides. This gives MS-CNN a considerable advantage overthe SS-CNN, and hence it attains an average 8.2% higheraccuracy.
Models trained on GAF images achieved the best accuracyamong the three, while CWT and STFT come next insequence. Unlike CWT and STFT which are classical time-frequency methods, GAF is used to encode time series asimages, while preserving the temporal correlations existingin the signal. The deep learning model uses this temporaldependence within the gait time series for a better prediction.For the SS-CNN model, GAF achieved an accuracy of77.3% while CWT achieved 71.3% and STFT achieved 66%.The sequence is followed in terms of precision, recall, andF-Measure for the SS-CNN. Moreover, for the MS-CNNmodel, GAF achieves an accuracy of 85.1%, the best overallin this study, while CWT achieves 82.3% and STFT achieves72%. Although MS-CNN also has GAF as the best modelin terms of accuracy and precision, however, CWT has aslightly higher recall in this case.
Figure 7 shows the confusion matrices for the two bestMS-CNN models and the best SS-CNN model. Comparingthe two confusion matrices of the MS-CNN model withGAF input (Fig. 7(a)) and MS-CNN model with CWT input(Fig. 7(b)) that GAF generated 12 false positives, muchless than 18 in CWT’s case, indicating the better precisionachieved through GAF. However, CWT generated one lessfalse negative and one more true positive compared to GAF,showing its slightly better recall performance.
In Fig. 7 (c), the confusion matrix for SS-CNN with GAFas input is given. The numbers are not directly comparablewith those in MS-CNN because of the different number ofsamples, but we see from the normalized values that SS-CNNusing GAF input gives 19% more false positives and over 1%more false negatives compared to MS-CNN using GAF. Thisshows that its precision performance is much worse than itsrecall performance.
While a better recall is more desirable than precisionin disease classification, however in this case the recallperformance improvement of MS-CNN using CWT overGAF is not significant (<1%), however, it gives muchlower precision performance compared to GAF (differenceof 3.7%). Therefore, we could say that overall, MS-CNN

Fig. 7. Confusion matrices for (a) MS-CNN using GAF (b) MS-CNNusing CWT, and (c) SS-CNN using GAF
using GAF input provides a better assessment of frailty withits higher accuracy and F-measure.
Regarding the poorer performance of STFT compared tothe CWT, STFT uses a fixed window length resulting ina fixed frequency resolution. Shorter window lengths givehigher time resolution but deteriorate frequency resolution.Contrarily, longer window lengths give higher frequencyresolution but reduce time resolution [24]. This limits STFT’sability to perceive all time-frequency variations in the signal.This missing information fails to appear on the producedSTFT spectrogram images, essentially causing a drop in itsperformance. CWT, on the other hand, works with variablewindow lengths, using shorter window lengths for higherfrequencies and longer window lengths for lower frequencies[25]. Hence, it gives a superior frequency-time resolution.
IV. CONCLUSIONS
Gait IMU data was collected for frail and non-frail elderly.It was shown that by encoding gait signals as images, deeplearning-based models can be utilized for the classificationof gait type. The proposed multi-stride-based CNN deeplearning model using GAF as input achieved an accuracy of85% and precision of 0.912. This work shows that frailty can
be assessed with high accuracy using gait IMU data encodedas images. Deep learning models can learn the featurescapturing the changes in temporal signal patterns and stride-to-stride variations. As future work, it will be interestingto explore the recurrent neural network-based deep learningmodels that are better suited for the identification of patternsin time-series data.
REFERENCES
[1] D. of Economic and S. Affairs, “World population ageing 2020:Highlights,” United Nations, Tech. Rep., 2020.
[2] N. Frieswijk, B. P. Buunk, N. Steverink, and J. P. Slaets, “The effectof social comparison information on the life satisfaction of frail olderpersons.” Psychology and aging, vol. 19, no. 1, p. 183, 2004.
[3] A. J. Campbell and D. M. Buchner, “Unstable disability and thefluctuations of frailty,” Age and ageing, vol. 26, no. 4, pp. 315–318,1997.
[4] G. A. Van Kan, Y. Rolland, H. Bergman, J. Morley, S. Kritchevsky, andB. Vellas, “The iana task force on frailty assessment of older people inclinical practice,” The Journal of Nutrition Health and Aging, vol. 12,no. 1, pp. 29–37, 2008.
[5] K. Rockwood and A. Mitnitski, “Frailty in relation to the accumulationof deficits,” The Journals of Gerontology Series A: Biological Sciencesand Medical Sciences, vol. 62, no. 7, pp. 722–727, 2007.
[6] K. Rockwood, R. A. Fox, P. Stolee, D. Robertson, and B. L. Beattie,“Frailty in elderly people: an evolving concept.” CMAJ: CanadianMedical Association Journal, vol. 150, no. 4, p. 489, 1994.
[7] A. Clegg, J. Young, S. Iliffe, M. O. Rikkert, and K. Rockwood, “Frailtyin elderly people,” The lancet, vol. 381, no. 9868, pp. 752–762, 2013.
[8] J. E. Morley, “Diabetes, sarcopenia, and frailty,” Clinics in geriatricmedicine, vol. 24, no. 3, pp. 455–469, 2008.
[9] D. T. Villareal, G. I. Smith, D. R. Sinacore, K. Shah, and B. Mitten-dorfer, “Regular multicomponent exercise increases physical fitnessand muscle protein anabolism in frail, obese, older adults,” Obesity,vol. 19, no. 2, pp. 312–318, 2011.
[10] L. P. Fried, C. M. Tangen, J. Walston, A. B. Newman, C. Hirsch,J. Gottdiener, T. Seeman, R. Tracy, W. J. Kop, G. Burke, et al.,“Frailty in older adults: evidence for a phenotype,” The Journalsof Gerontology Series A: Biological Sciences and Medical Sciences,vol. 56, no. 3, pp. M146–M157, 2001.
[11] K. E. Ensrud, S. K. Ewing, B. C. Taylor, H. A. Fink, P. M. Cawthon,K. L. Stone, T. A. Hillier, J. A. Cauley, M. C. Hochberg, N. Rodondi,et al., “Comparison of 2 frailty indexes for prediction of falls,disability, fractures, and death in older women,” Archives of internalmedicine, vol. 168, no. 4, pp. 382–389, 2008.
[12] G. A. van Kan, Y. M. Rolland, J. E. Morley, and B. Vellas, “Frailty: to-ward a clinical definition,” Journal of the American Medical DirectorsAssociation, vol. 9, no. 2, pp. 71–72, 2008.
[13] M. Schwenk, C. Howe, A. Saleh, J. Mohler, G. Grewal, D. Armstrong,and B. Najafi, “Frailty and technology: a systematic review of gaitanalysis in those with frailty,” Gerontology, vol. 60, no. 1, pp. 79–89,2014.
[14] T. M. Gill, J. M. McGloin, E. A. Gahbauer, D. M. Shepard, and L. M.Bianco, “Two recruitment strategies for a clinical trial of physicallyfrail community-living older persons,” Journal of the American Geri-atrics Society, vol. 49, no. 8, pp. 1039–1045, 2001.
[15] M. D. Rothman, L. Leo-Summers, and T. M. Gill, “Prognostic signifi-cance of potential frailty criteria,” Journal of the American GeriatricsSociety, vol. 56, no. 12, pp. 2211–2216, 2008.
[16] M. Montero-Odasso, S. W. Muir, M. Hall, T. J. Doherty, M. Kloseck,O. Beauchet, and M. Speechley, “Gait variability is associated withfrailty in community-dwelling older adults,” Journals of GerontologySeries A: Biomedical Sciences and Medical Sciences, vol. 66, no. 5,pp. 568–576, 2011.
[17] M. Schwenk, J. Mohler, C. Wendel, M. Fain, R. Taylor-Piliae,B. Najafi, et al., “Wearable sensor-based in-home assessment of gait,balance, and physical activity for discrimination of frailty status:baseline results of the arizona frailty cohort study,” Gerontology,vol. 61, no. 3, pp. 258–267, 2015.
[18] B. R. Greene, E. P. Doheny, A. O’Halloran, and R. Anne Kenny,“Frailty status can be accurately assessed using inertial sensors andthe tug test,” Age and ageing, vol. 43, no. 3, pp. 406–411, 2014.

[19] A. Godfrey, “Wearables for independent living in older adults: Gaitand falls,” Maturitas, vol. 100, pp. 16–26, 2017.
[20] J. Razjouyan, A. D. Naik, M. J. Horstman, M. E. Kunik, M. Amir-mazaheri, H. Zhou, A. Sharafkhaneh, and B. Najafi, “Wearable sensorsand the assessment of frailty among vulnerable older adults: anobservational cohort study,” Sensors, vol. 18, no. 5, p. 1336, 2018.
[21] K. Grochenig, Foundations of time-frequency analysis. SpringerScience & Business Media, 2001.
[22] S. Mallat, A wavelet tour of signal processing. Elsevier, 1999.[23] Z. Wang and T. Oates, “Imaging time-series to improve classification
and imputation,” arXiv preprint arXiv:1506.00327, 2015.[24] D. Gabor, “Theory of communication. part 1: The analysis of informa-
tion,” Journal of the Institution of Electrical Engineers-Part III: Radioand Communication Engineering, vol. 93, no. 26, pp. 429–441, 1946.
[25] O. Rioul and M. Vetterli, “Wavelets and signal processing,” IEEEsignal processing magazine, vol. 8, no. 4, pp. 14–38, 1991.


![Frailty pathway [970kb]](https://img.pdfslide.us/doc/110x75/588da5761a28ab737b8b4e2c/frailty-pathway-970kb.jpg)