Embed Size (px)
Citation preview

Tsai et al. Epigenetics & Chromatin (2016) 9:32 DOI 10.1186/s13072-016-0082-4
RESEARCH
GAGA factor, a positive regulator of global gene expression, modulates transcriptional pausing and organization of upstream nucleosomesShih‑Ying Tsai1,2, Yuh‑Long Chang1, Krishna B. S. Swamy1, Ruei‑Lin Chiang1 and Der‑Hwa Huang1*
Abstract
Background: Genome‑wide studies in higher eukaryotes have revealed the presence of paused RNA polymerase II (RNA‑Pol) at about 30–50 bp downstream of the transcription start site of genes involved in developmental control, cell proliferation and intercellular signaling. Promoter‑proximal pausing is believed to represent a critical step in tran‑scriptional regulation. GAGA sequence motifs have frequently been found in the upstream region of paused genes in Drosophila, implicating a prevalent binding factor, GAF, in transcriptional pausing.
Results: Using newly isolated mutants that retain only ~3 % normal GAF level, we analyzed its impacts on transcrip‑tional regulation in whole animals. We first examined the abundance of three major isoforms of RNA‑Pol on Hsp70 during heat shock. By cytogenetic analyses on polytene chromosomes and chromatin immunoprecipitation (ChIP), we show that paused RNA‑Pol of Hsp70 is substantially reduced in mutants. Conversely, a global increase in paused RNA‑Pol is observed when GAF is over‑expressed. Coupled analyses of transcriptome and GAF genomic distribution show that 269 genes enriched for upstream GAF binding are down‑regulated in mutants. Interestingly, ~15 % of them encode transcriptional factors, which might control ~2000 additional genes down‑regulated in mutants. Further examination of RNA‑Pol distribution in GAF targets reveals that a positive correlation exists between promoter‑proxi‑mal RNA‑Pol density and GAF occupancy in WT, but not in mutants. Comparison of nucleosome profiles indicates that nucleosome occupancy is preferentially attenuated by GAF in the upstream region that strongly favors nucleosome assembly. Using a dominant eye phenotype caused by GAF over‑expression, we detect significant genetic interac‑tions between GAF and the nucleosome remodeler NURF, the pausing factor NELF, and BAB1 whose binding sites are enriched specifically in genes displaying GAF‑dependent pausing.
Conclusion: Our results provide direct evidence to support a critical role of GAF in global gene expression, transcrip‑tional pausing and upstream nucleosome organization of a group of genes. By cooperating with factors acting at different levels, GAF orchestrates a series of events from local nucleosome displacement to paused transcription. The use of whole animals containing broad tissue types attests the physiological relevance of this regulatory network.
Keywords: GAGA factor, RNA polymerase II, Transcription pausing, Nucleosome
© 2016 The Author(s). This article is distributed under the terms of the Creative Commons Attribution 4.0 International License (http://creativecommons.org/licenses/by/4.0/), which permits unrestricted use, distribution, and reproduction in any medium, provided you give appropriate credit to the original author(s) and the source, provide a link to the Creative Commons license, and indicate if changes were made. The Creative Commons Public Domain Dedication waiver (http://creativecommons.org/publicdomain/zero/1.0/) applies to the data made available in this article, unless otherwise stated.
Open Access
Epigenetics & Chromatin
*Correspondence: [email protected] 1 Institute of Molecular Biology, Academia Sinica, Nankang, Taipei, Taiwan, ROCFull list of author information is available at the end of the article

Page 2 of 20Tsai et al. Epigenetics & Chromatin (2016) 9:32
BackgroundEukaryotic transcription requires coordinated activities from distinct ensembles acting directly on transcriptional processes or chromatin architecture. Previous studies have shown that the transcriptional machinery undergoes stepwise catalytic transitions from initial assembly to ter-mination upon the integration of regulatory information from general and gene-specific factors, while the overall organization and constituents of chromatin are dynami-cally modified to facilitate loading and progression of the transcriptional machinery [1]. Despite a wealth of knowl-edge on the interplay of these activities, new features continue to emerge and await further studies.
Analyses in cell-free systems have established that the supramolecular assembly of transcriptional complexes over the transcription start site (TSS) represents a criti-cal rate-limiting step [2]. However, in vivo studies of Drosophila Heat shock 70 (Hsp70) and human c-Myc and c-Fos genes have revealed that RNA polymerase II (RNA-Pol) may stall for lengthy periods at about 30–50 bp downstream of the TSS, implicating a novel rate-limit-ing step prior to productive transcription [3–6]. Subse-quently, this promoter-proximal pausing has widely been found in genes involved in developmental regulation, cell proliferation and intercellular signaling from fly to human [7–11]. It has been proposed that pausing is responsible for rapid and synchronous transcriptional induction [12, 13]. One distinguishing feature of the paused RNA-Pol is the presence of hyper-phosphorylated serine 5 residues (Ser-5p) in heptad repeats of Rpb1’s C-terminal domain (CTD). In contrast, RNA-Pol engaged in pre-initiation is hypo-phosphorylated (Hypo-p), while the productively elongating form gains additional phosphorylation on serine 2 residues (Ser-2p) [14, 15]. Both biochemical and genomic studies have further shown that paused RNA-Pol is stabilized by its association with NELF (negative elongation factor) and DSIF (DRB sensitivity-inducing factor) and that phosphorylation of these factors by a cyclin-dependent kinase, P-TEFb (positive transcription elongation factor b), triggers the transition of RNA-Pol from paused to elongation states [16–21].
Several features have also been noted for paused genes. For example, the TSS of these genes is clustered in nar-row regions [7], which are frequently associated with a particular set of core promoter elements [22–24]. Cer-tain nucleotide compositions are enriched in sequences immediately upstream or downstream of TSS [7, 23]. Furthermore, consistent with the view that nucleosomes act as a transcription barrier, paused RNA-Pols have been shown to contact the first nucleosome of the highly ordered downstream nucleosomal array [25]. Paradoxi-cally, a closer examination of genes with different degrees of pausing has revealed that highly paused genes tend
to possess lower levels and less organized downstream nucleosomes than those with weaker or no pausing [23]. Recent studies have shown that these differences may reflect the occupancy of specific upstream binding fac-tors, suggesting the involvement of distinct mechanisms for transcriptional pausing [26].
A large fraction of paused genes, including Hsp70, contain GAGA sequence motifs in the upstream region in Drosophila. Two sequence-specific DNA binding pro-teins, GAF and Psq factor, are known to bind this motif [27, 28]. Genome-wide studies have revealed a correla-tion between GAF occupancy and paused genes [22, 29, 30]. GAF consists of two structurally and functionally similar isoforms containing an N-terminal POZ/BTB protein interaction domain, a single zinc finger capable of sequence-specific binding and a glutamine-rich C-ter-minal domain [31–33]. Several, sometimes incompatible, in vitro and in vivo functions have been assigned to GAF, including anti-silencing, transcriptional activation, het-erochromatin-mediated silencing and Hox gene activa-tion or repression [28, 34–37]. Moreover, its association with NURF (nucleosome remodeling factor) and dFACT (facilitates chromatin transcription) suggests a functional link to chromatin organization [38, 39]. Recently, it has been shown that GAF knockdown in a cultured cell line results in reduced pausing and increased nucleosomes in both upstream and downstream regions [40]. Whether these effects are exerted in other cells and, more impor-tantly, relevant in the living organism remain unclear.
Here we used newly isolated Gaf mutants to exam-ine their effects on gene regulation in whole animals. We started with transcriptional analyses of Hsp70 and extended to genome-wide studies. We found that GAF, as an activator required for global gene expression, modu-lates the level of paused RNA-Pol and the nucleosome pattern specifically in the region immediately upstream of the TSS by cooperating with various sequence-inde-pendent and sequence-specific factors.
ResultsSelective reduction of RNA‑Pol Ser‑5p on Hsp70 in Gaf mutantsTo investigate the role of GAF in transcriptional regula-tion, we first examined the phosphorylation status of two key serine residues (i.e., Ser-2 and Ser-5) in CTD of RNA-Pol in wild type (WT) and Gaf mutant larvae. The GAF-coding gene was previously designated as trithorax-like (Trl) residing in the left arm of the third chromosome, based on the observation that some mutant alleles could cause homeotic transformations like trithorax [36]. How-ever, this assignment was not supported by subsequent reports [41, 42]. In fact, we found that the homeotic effect is lost when the right arm of the third chromosome of

Page 3 of 20Tsai et al. Epigenetics & Chromatin (2016) 9:32
original alleles is replaced by the genetically marked WT chromosome (unpublished data). To avoid potential con-fusion, we generated a new set of deletion mutants from a homozygous viable P insertion line, EP3184 (Fig. 1a), and referred them as Gaf alleles. In addition, we removed the putative second-site mutation from Trl13C by recom-bination and designated it as Gaf13C#3. Homozygous Gaf deletion mutations are lethal during early larval develop-ment, while Trl13C and Gaf13C#3 can develop into sterile adults. However, the combination of GafDH34—an allele in which sequences from the EP3184 insertion site to the 3′ non-coding region of Gaf have been deleted (Fig. 1a)—and Gaf13C#3 allows animals to survive until early pupal stage. Using a purified antibody raised against the com-mon region of GAF isoforms (Fig. 1a, pink region), we detected ~3 % WT level of proteins in GafDH34/Gaf13C#3 trans-heterozygotes during the late third instar (Fig. 1b). To facilitate our analyses, we used these trans-heterozy-gotes for subsequent studies unless otherwise specified.
Previous studies have shown that RNA-Pol under-goes both qualitative and quantitative changes during heat induction of Hsp70 genes [43]. RNA-Pol is initially paused at the region ~50 bp downstream of the TSS (+50) primarily with Ser-5p, but is rapidly converted into the isoform actively engaged in transcriptional elon-gation with additional phosphorylation on Ser-2. To understand how this process is regulated by the binding of GAF to the upstream GAGA repeats, we analyzed the relationship between GAF and the phosphorylation state of RNA-Pol following heat induction of Hsp70. Drosoph-ila contains six Hsp70 genes located in two cytogeneti-cally discernible clusters at map positions 87A and 87C on polytene chromosomes. We used simultaneous stain-ing of GAF and BEAF-32—a boundary element-binding protein [44, 45]—as controls for staining quality. In addi-tion, the major bands of BEAF-32 staining were used to mark this region with five sections (1–5, Fig. 1d–f) for further comparison. The 87A region contains two Hsp70 genes located between sections 2 and 3, and the 87C region contains four Hsp70 genes between sections 4 and 5 (marked by stars). Before induction, the signals of RNA-Pol isoforms including Hypo-p, Ser-5p and Ser-2p were either very weak or undetectable on these locations of both WT and mutant chromosomes (Fig. 1d–f, upper panel). Following 30-min heat induction, strong signals of all three isoforms appeared at both the 87A and 87C clusters. No significant difference was observed for the Hypo-p signal between WT and mutant chromosomes (Fig. 1d, lower panel), but a substantial reduction in the Ser-5p signal was evident on mutant chromosomes (Fig. 1e, lower panel). In addition, the Ser-2p signal appeared to increase significantly on mutant chromo-somes (Fig. 1f, lower panel).
To confirm these cytogenetic results, we used chroma-tin immunoprecipitation (ChIP) to quantitatively analyze the phosphorylation profile of RNA-Pol on Hsp70. Cross-linked chromatin samples prepared from third-instar larvae containing imaginal disks, nerve cords and sali-vary glands were subjected to ChIP and quantitative PCR (qPCR) to measure the relative abundance of these iso-forms in three intragenic regions centered at +58, +379 and +1702 as well as an upstream region centered at −182 for comparison (Fig. 1c). Prior to heat shock, both Hypo-p and Ser-5p signals were somewhat higher around +58 in WT samples, in agreement with the observation of paused RNA-Pol at the promoter-proximal region [46]. In mutant samples, although the level of Hypo-p did not show significant change in this region, relatively lower level of Ser-5p was seen (Fig. 1e’), suggesting the reduc-tion of paused RNA-Pol in the absence of GAF. Interest-ingly, the Ser-2p signal showed substantial increases in the distal part of Hsp70, indicating that productive tran-scription occurs concomitantly in mutants (Fig. 1f ’). We noted that there were also moderate increases in Hypo-p in downstream regions (Fig. 1d’), which presumably reflect incomplete phosphorylation of RNA-Pol during elongation [47].
Upon a brief heat shock (i.e., 5 min), WT samples showed substantial increases in signal intensity for all three RNA-Pol isoforms at the +58 region and further downstream, as expected for fully active transcription. The increase in the Ser-5p signal was most pronounced at the promoter-proximal region, indicating the accu-mulation of considerable amounts of paused RNA-Pol. Clearly, the transition of RNA-Pol from paused to elon-gation states remains rate limiting during transcrip-tional activation. Similar to the uninduced condition, the Ser-5p signal showed a drastic reduction from WT to mutant samples. Again, the Ser-2p signal in mutant samples showed concomitant increases in the coding region, particularly at the 3′ end. Despite these changes, no significant differences were found between WT and mutant samples for total RNA-Pol, as measured on poly-tene chromosomes using an antibody recognizing the Rpb3 subunit of RNA-Pol (Additional file 1: Fig. S1A, B). These results confirm our cytogenetic observations and together indicate that paused RNA-Pol becomes more frequently released to engage in elongation in the absence of GAF. Thus, the transition between promoter-proximal pausing and productive elongation of RNA-Pol appears to be modulated by GAF.
Global regulation of RNA‑Pol phosphorylationWe next asked whether the global level of various forms of phosphorylated RNA-Pol could be affected by either Gaf mutation or GAF over-expression. Again, we used

Page 4 of 20Tsai et al. Epigenetics & Chromatin (2016) 9:32
GAF and BEAF-32 staining as internal controls for pol-ytene chromosome staining. Compared to WT chro-mosomes, the overall intensity of Hypo-p and Ser-2p staining did not show any significant change on mutant chromosomes (Additional file 1: Fig. S2A, B). In contrast,
the overall intensity of Ser-5p was reduced in mutant chromosomes (Fig. 2a). In the complementary study, we drove over-expression of a GAF isoform, GAF-519, in sal-ivary glands by introducing dpp-Gal4 to a transgenic line containing UAS-GAF on third chromosome (henceforth

Page 5 of 20Tsai et al. Epigenetics & Chromatin (2016) 9:32
called dpp > GAF(3)). The resultant chromosomes were intensely labeled with GAF signals and were thinner and more difficult to spread than WT ones. In proportion to the reduced chromosomal size, the overall BEAF-32 sig-nals also appeared to be relatively weaker. Importantly, there was a substantial increase in Ser-5p signal (Fig. 2b). However, no obvious changes were observed for Hypo-p, Ser-2p and total RNA-Pol signals (Additional file 1: Figs. S1C and S2C, D).
The relative amounts of different RNA-Pol isoforms were further measured by immunoblotting, using extracts prepared from salivary glands of these larvae. While there was a modest reduction of Ser5-p signal in mutant extracts, a substantial increase in Ser-5p (~three-fold) signal was observed for dpp > GAF(3) extracts. In contrast, both Hypo-p and Ser2-p did not show signifi-cant differences in dpp > GAF(3) extracts (Fig. 2c). To further determine whether the changes of Ser5-p might reflect the amount of total RNA-Pol under different genetic backgrounds, we also examined these extracts with ARNA-3 antibody that recognizes an epitope dis-tant from the CTD [48]. In contrast to Ser5-p, total RNA-Pol was slightly increased in mutant extracts, but slightly reduced in dpp > GAF(3) extracts (Fig. 2c, and Additional file 1: Fig. S1D), further revealing the selective effects on Ser-5p. These results strongly support a global role of GAF on regulation of Ser-5p.
GAF controls global gene expressionTo further elucidate the role of GAF in global transcrip-tional regulation, we next examined the genome-wide distribution of GAF in larval tissues. Chromatin prepared from WT imaginal tissues of third-instar larvae was sub-jected to ChIP with an affinity-purified GAF antibody, followed by deep sequencing (ChIP-seq) to get more than thirty million reads (~32 × 106 for GAF, ~34 × 106 for input), which were used for further analyses. Using the
PICS program (Probabilistic inference for ChIP-Seq) [49], we identified 3716 GAF binding peaks (FDR < 0.05). Subsequent analysis by the MEME (Multiple EM for Motif Elicitation) program revealed a reiterated GA motif with the highest score (p = 1.6 × 10−788) [50]. Although this motif is similar to the known consensus Trl bind-ing sequences (E = 2.92 × 10⁻⁴ by TOMTOM analysis) (Fig. 3a), it appears to conform much better to the (GA)n signature. However, it is worth noting that about 80 % of such sequences in the genome lack significant amounts of GAF binding (data not shown), indicating that not all sequences are equally accessible.
These GAF binding peaks could be assigned to 1891 annotated genes, which are referred to as putative GAF-target genes. Among them, 1442 genes (~76 %) contain GAF peaks with values at least twofold higher than the corresponding regions in the input control (Fig. 3b). Importantly, they all contain GAF peaks within 500 bp upstream of the TSS. About half of them have additional peaks located within the gene body including exons and introns. For genes with less GAF occupancy (<twofold enrichment), their peaks are located in the gene body (~14 %) or in regions within (~7 %) or beyond (~3 %) 500 bp upstream of the TSS. Given that the baseline of the input is significantly higher than that of GAF ChIP (GAF panel in Fig. 4a), the twofold enrichment appears to be a stringent criterion for selecting relevant genes for further analyses. The abundance and the position of GAF peaks strongly support these genes as bona fide physiological targets. Based on the number of putative GAF targets, our dataset is about 20–50 % larger than several earlier studies and similar to a recent study [30, 40, 51–53]. Notably, significant portions of the GAF targets were not identified in these studies (Additional file 1: Fig. S3). Using gene ontology (GO) analysis and Functional Annotation Clustering from DAVID, we found that our collection is enriched for genes involved
(See figure on previous page.) Fig. 1 GAF modulates different phosphoisoforms of RNA‑Pol at the Hsp70 locus. a Molecular map of the Gaf locus. Two isoforms of GAF, GAF‑519 and GAF‑581, share the same BTB/POZ (yellow box) and Zn‑finger domains (green box), but differ in the Gln‑rich domain (blue box). The GAF antibody is raised against the shared region (pink box). The P‑element insertion lines, Gaf13C and EP(3)3184, are indicated by triangles. The deletion in GafDH34, shown by the dotted box, extends to 218 bp upstream of 3′end of the gene. b Quantification of GAF. Extracts from salivary glands of third‑instar larvae were immunoblotted with GAF and α‑tubulin antibodies. The relative abundance of GAF from duplicate experiments is shown. c Gene map of Hsp70. A simplified map is shown with approximate locations of the GAF and HSF binding sites, TATA box, and four sets of primers used for qPCR. The relative position to the TSS for the midpoint of each PCR fragment is indicated. d–f. Cytogenetic studies of RNA‑Pol at Hsp70 loci. Polytene chromosomes from WT and mutants before (d–f, upper panels) or after a 30‑min heat shock (d–f, lower panels) were simultaneously stained with antibodies against RNA‑Pol (Hypo‑p, Ser‑5p or Ser‑2p in red), GAF (in blue) and BEAF‑32 (in green). The color is removed for panels showing individual staining for clarity. The region from 87A to 87C is marked by five sections (1–5) based on BEAF‑32 staining. Two Hsp70 clusters are located in sec‑tions 2–3 and 4–5 and are indicated by *. d’–f’. Quantitative measurement of RNA‑Pol on Hsp70. Chromatin samples prepared from imaginal tissues of WT or Gaf mutant larvae before (non‑HS) or after treatment at 37 °C for 5 min (HS) were subjected to immunoprecipitation with RNA‑Pol antibod‑ies against Hypo‑p (d’), Ser‑5p (e’), or Ser‑2p (f’), followed by qPCR using four primer sets shown in c. The amounts of qPCR products from each set of measurements are expressed as a percentage of input. The average of three ChIP experiments is shown. Statistically significant differences are indicated (t test, *p < 0.05; **p < 0.01; ***p < 0.001)

Page 6 of 20Tsai et al. Epigenetics & Chromatin (2016) 9:32
Fig. 2 Global effects of GAF on the level of RNA‑Pol Ser‑5p. a Reduction of RNA‑Pol Ser‑5p in Gaf mutants. Polytene chromosomes from WT and Gaf mutants were co‑stained and processed as described in Fig. 1. b Increase in RNA‑Pol Ser‑5p by GAF over‑expression. Polytene chromosome from dpp > WT or dpp > GAF(3) samples were co‑stained as described in Fig. 1. c Detection of differential effects of GAF on RNA‑Pol phosphoisoforms. Salivary gland extracts from WT, Gaf mutants and dpp > GAF(3) lines were immunoblotted with antibodies against three RNA‑Pol phosphoisoforms, total RNA‑Pol (ARNA3) and α‑tubulin. The abundance of each RNA‑Pol isoform was adjusted with that of α‑tubulin. The relative abundance of each RNA‑Pol isoform from triplicate experiments is shown
Page 7 of 20Tsai et al. Epigenetics & Chromatin (2016) 9:32
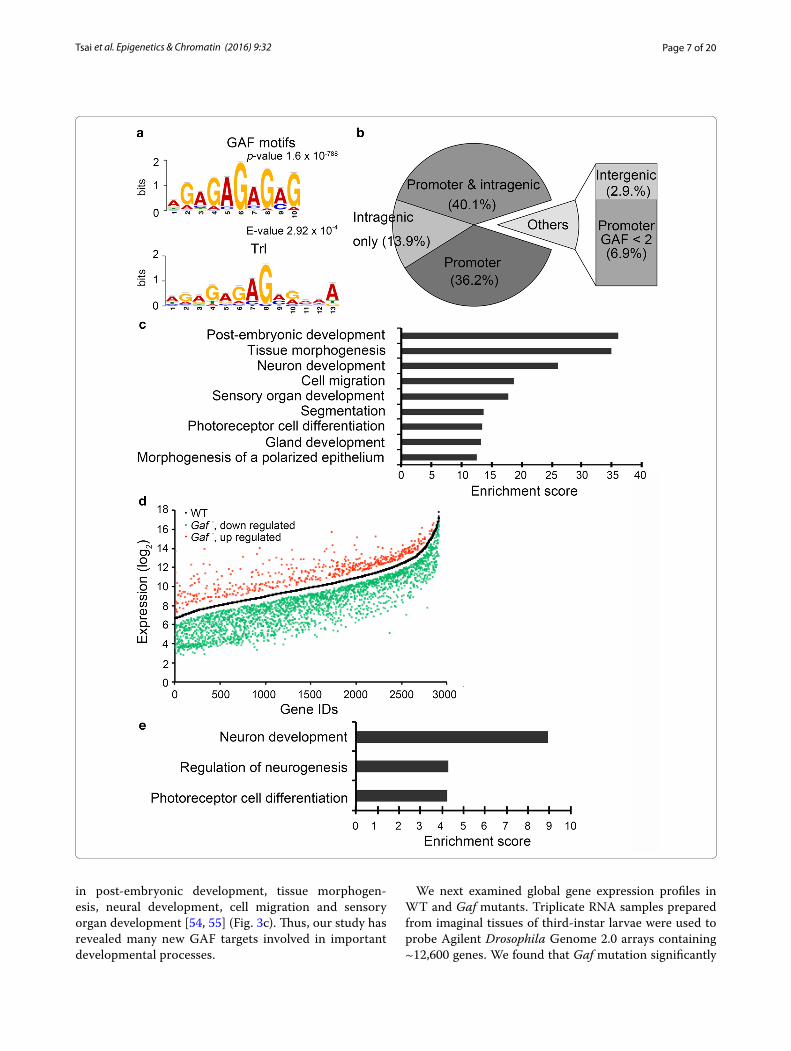
in post-embryonic development, tissue morphogen-esis, neural development, cell migration and sensory organ development [54, 55] (Fig. 3c). Thus, our study has revealed many new GAF targets involved in important developmental processes.
We next examined global gene expression profiles in WT and Gaf mutants. Triplicate RNA samples prepared from imaginal tissues of third-instar larvae were used to probe Agilent Drosophila Genome 2.0 arrays containing ~12,600 genes. We found that Gaf mutation significantly

Page 8 of 20Tsai et al. Epigenetics & Chromatin (2016) 9:32
affected expression of 2912 genes (p < 0.05, >1.5-fold change). Among them, 15 genes were randomly chosen for verification by RT-qPCR. Nearly 70 % of selected genes showed similar changes (Additional file 1: Fig. S4A), confirming the validity of gene expression pro-files. The vast majority (82 %) of affected genes showed reduced expression in Gaf mutants, supporting a positive role of GAF in global gene regulation (Fig. 3d). Unlike the strong enrichment of GAF peaks in many developmental processes, no specific process could be assigned to these affected genes (unpublished data). Further comparison with ChIP-seq data revealed that 269 genes contain GAF peaks with >twofold enrichment in the promoter region, indicating that they are directly regulated by GAF. As noted earlier, this number may be an underestimate, due to the large difference inherent in the calculation of ChIP and input samples. Importantly, about 80 % (218 genes) of them was down-regulated in Gaf mutants. In addition, they tend to cluster into functions related to neuronal development or morphogenesis (Fig. 3e). A recent study reported that 64 genes show altered expression in wing disks after GAF knockdown [56]. Using similar criteria for >twofold change, our study identified more than 2000
genes (Additional file 1: Fig. S4B), further validating our approach.
GAF regulates promoter‑proximal RNA‑PolTo determine the global effect of GAF on transcriptional processes, we examined genome-wide RNA-Pol distri-bution in both WT and mutant tissues by ChIP-seq. We used anti-Rpb3 antibody for an unbiased assessment of RNA-Pol distribution regardless of phosphorylation status [57]. By mapping about thirty million valid reads from WT or mutant samples, we identified about 2700 genes that satisfied the following criteria: false discovery rate (FDR) < 0.05 and p < 0.01 by Fisher’s exact test. The distribution of RNA-Pol and GAF in the 83B-C region is shown in Fig. 4a. RNA-Pol appears to be enriched in the promoter-proximal region of many genes within this sec-tion. In parallel, high levels of GAF are frequently found. Importantly, the abundance of promoter-proximal RNA-Pol of several GAF-target genes is reduced in mutants (average 40 % reduction in 52 % GAF-target genes).
To assess the global impact of GAF on RNA-Pol, we focused on GAF-target genes with more than two-fold GAF enrichment in the promoter region. To avoid
(See figure on next page.) Fig. 4 Reduction of paused RNA‑Pol in Gaf mutants. a Distribution of RNA‑Pol and GAF in the 83B‑C region. RNA‑Pol and GAF reads at each nucleo‑tide were normalized with the total reads of each sample. The cumulative reads of RNA‑Pol and GAF in the section from 1,525,747 to 1,660,521 of the third chromosome are shown with the gene map below. Genes with significant reduction of promoter‑proximal RNA‑Pol in mutants are indi‑cated by arrows. Note that input reads are significantly higher than background reads in ChIP samples, potentially reducing the number of enriched peaks. The average read for the input sample is 70. Red dash lines marking this value in GAF ChIP and input are shown in GAF panel. b–g Correlation between RNA‑Pol and GAF. RNA‑Pol density in the promoter‑proximal region (b, e; from −100 to +150) and gene body (c, f; from +500 to the end) in WT (b, c) or mutants (e, f) is separately plotted against the WT level of GAF occupancy according to the enrichment score of each promoter. PIs calculated from the ratio of RNA‑Pol densities in the promoter‑proximal region over the gene body are similarly plotted for WT (d) and mutants (g). Three hundred and sixty‑five genes were included in this analysis. Statistical values for Spearman’s rank correlation coefficient (ρ) and p value (p) are shown. h GAF distribution in different ranks of targets. Three hundred and sixty‑five GAF targets are divided into four ranks based on the overall GAF enrichment score from −500 to TSS. Ranks I to IV range from lowest to highest GAF scores. GAF distribution from −500 to +500 is shown for each rank. The normalized reads of both GAF peaks and input are shown in y‑axis. i Dosage‑dependent relationship between RNA‑Pol pausing and GAF occupancy. The PIs of each rank of genes in WT and mutants are represented by box plots. The whiskers represent 5 and 95 % of each rank. The statis‑tical significance of differences calculated by Mann–Whitney U test is indicated for ranks III (p = 0.03, *) and IV (p = 6.04 × 10⁻⁵, ***)
(See figure on previous page.) Fig. 3 Genomic analyses of GAF target genes and Gaf mutation on gene expression. a GAF binding motif. The sequences of GAF peaks were analyzed by MEME. The most significant motif is shown with the statistical value (p value = 1.6 × 10−788). The statistical comparison with previously identified Trl motif is also shown (E value = 2.92 × 10⁻⁴). b Summary of GAF distribution. GAF binding sites identified by ChIP‑sequencing and evaluated by statistical analyses are summarized in a pie chart. GAF peaks with more than twofold enrichment over the input are grouped into four categories: promoter only (from −500 to TSS), both promoter and intragenic region (UTR, intron and exon), intragenic region only, and intergenic region (beyond −500 or 3’ end). A small percentage of GAF peaks with less than twofold enrichment in the promoter region are also indicated. c Biological functions enriched in GAF targets. Putative GAF‑target genes were subjected to DAVID for functional annotation clustering analysis. The GO term and the enrichment score of clusters above 10 (FDR < 0.0001) are shown. d The global effect of Gaf mutation on gene expression. Triplicate RNA samples from WT and Gaf mutants were subjected to microarray analysis. A scatter plot summarizes statistically significant changes in gene expression (p < 0.05 and >1.5‑fold change). Each gene is assigned an ID number according to the ascending order of its expression level as shown in the log2 scale in the y‑axis. The central curve represents the WT expression level of genes that show significant changes in mutants. Approximately 80 or 20 % of genes show reduced (green) or increased expression (red) in mutants, respectively. e GO analysis of GAF targets with affected expression in mutants. GAF targets with significant changes in expression were subjected to analysis for functional clustering. The GO term and the enrichment score of clusters above 2 (FDR < 0.05) are shown

Page 9 of 20Tsai et al. Epigenetics & Chromatin (2016) 9:32

Page 10 of 20Tsai et al. Epigenetics & Chromatin (2016) 9:32

Page 11 of 20Tsai et al. Epigenetics & Chromatin (2016) 9:32
ambiguity, we selected genes based on criteria modified from a published article [7]: (1) single TSS; (2) no internal genes; and (3) at least 2 kb away from adjacent genes. A total of 365 genes were chosen for further analyses (Fish-er’s exact test, p < 0.01) (Additional file 1: Fig. S5). For direct comparison, we first calculated RNA-Pol density by normalizing RNA-Pol reads at each nucleotide posi-tion with the total valid reads from WT or mutant sam-ples, followed by summation of normalized values at each position. Subsequently, we summed up the value for the promoter-proximal region (region A, −100 to +150) and the gene body region (region B, +500 to the end of the gene) separately. Lastly, the relationship between RNA-Pol density and GAF occupancy was examined by plot-ting RNA-Pol density against the WT enrichment score of GAF for each gene.
As shown in Fig. 4b, e, GAF occupancy is significantly and positively correlated with the density of promoter-proximal RNA-Pol (Spearman’s rank correlation coef-ficient, ρ = 0.42, p < 1 × 10⁻¹¹) in WT, whereas this correlation is almost completely lost in Gaf mutants (ρ = 0.01, p = 0.91). For the gene body, a modest nega-tive correlation is observed between GAF occupancy and RNA-Pol density (ρ = −0.16, p = 0.002, Fig. 4c) in WT and is slightly affected in the Gaf mutants (ρ = −0.21, p = 3.7 × 10⁻⁵, Fig. 4f ). We also adopted the pausing index (PI) to evaluate the genome-wide impact of Gaf mutation on transcriptional status [58]. To derive PI, the RNA-Pol values for regions A and B were used as numerators and denominators, respectively [9]. When PI was plotted against the enrichment score of GAF, a posi-tive correlation between PI and GAF occupancy was also observed for the WT sample (ρ = 0.35, p = 1.1 × 10⁻¹¹, Fig. 4d). Similarly, the correlation was reduced, albeit less evidently, in mutants (ρ = 0.15, p = 0.01, Fig. 4g). We attribute this mild effect to the larger reduction of denominators in mutants.
Among these targets, the extent of GAF occupancy appears to differ widely. Based on the normalized read at each nucleotide position, they range from a minimum of twofold over the input control to several
hundred folds. To explore whether any group of genes might be more susceptible to GAF-mediated regula-tion, we divided these targets into four ranks based on the cumulative enrichment scores in the region from −500 to the TSS. Specifically, the normalized GAF reads in this region were added up for each gene and then used to calculate the enrichment over the input. The enrichment scores of these gene range from 2 to 5.9 (I, 92 genes), 6.1 to 10.0 (II, 91 genes), 10.0 to 17.2 (III, 91 genes), 17.5 to 301 (IV, 91 genes including 6 Hsp70 genes). As expected from higher GAF occupancy, more extended GA repeats were found in ranks III and IV (Additional file 1: Fig. S6). Close inspection of GAF occupancy in these genes revealed that they differ from each other not only in their scores, but also in their overall distribution (Fig. 4h). For example, rank IV lacks a downstream GAF peak around +300 commonly found in other ranks, despite its prominent overall scores. Although GAF peaks are present in the upstream region of all targets, their positions appear to shift gradually from the TSS (~−10 in rank I) toward more upstream sites (~−100 in rank IV). Moreover, rank IV has rela-tively high levels of GAF occupancy up to the region around −500 (Fig. 4h).
Using box plots to represent the PI range for each rank, we found that higher ranks tended to show higher PIs, further reinforcing the relationship between GAF and paused RNA-Pol. Again, a more severe reduction of PIs was observed for higher ranks in mutants (Fig. 4i). We also examined the effect of Gaf mutation on RNA-Pol accumulation in the promoter-proximal region and gene body separately. Similarly, rank IV exhibited the most pronounced effect of RNA-Pol accumulation in the promoter-proximal region (Additional file 1: Fig. S7). These results strongly support a dose-dependent rela-tionship between GAF occupancy and paused RNA-Pol. It is worth noting that only a small proportion of paused genes (~16.5 % of 1602 genes with PI > 4) identified at embryonic stages overlaps with our collection [9], reflect-ing highly dynamic regulation of pausing during develop-ment [59] (Additional file 1: Fig. S8).
(See Figure on previous page.) Fig. 5 Selective effects of GAF on upstream nucleosomes. a Global nucleosome profiles. The overall nucleosome distribution of GAF targets (n = 1891) or non‑targets (n = 13,774) in the WT genome is shown for the 1 kb region around TSS. To calculate the average nucleosome counts, the midpoint of MNase‑resistant fragments was used to represent the position of each nucleosome. The average read at each nucleotide coordinate was summed after normalization. The frequency of SS‑dinucleotides that favor nucleosome formation is shown by heat maps (below). b–e Alteration of nucleosome patterns in Gaf mutants. Nucleosome distribution within 1 kb of the promoter‑proximal region in WT (red) and Gaf mutants (blue) is shown for different ranks of targets. The statistical differences between these two patterns were calculated by Kolmogorov–Smirnov tests after divid‑ing the 1 kb region into either four sections (above graphs) or two sections (below graphs). The value and statistical significance of each section (*) are shown. The approximate location and height of GAF peaks are indicated in each graph (gray bars). The SS‑dinucleotide distribution is also shown as a heat map for each rank

Page 12 of 20Tsai et al. Epigenetics & Chromatin (2016) 9:32
GAF affects the organization of upstream nucleosomesRecent studies have demonstrated a strong link between transcriptional pausing and the presence of nucleosomes around the TSS [23, 25]. To determine whether the nucleosome organization is involved in GAF-mediated transcription pausing, we examined genome-wide nucle-osome profiles on WT and mutant chromatin by paired-end deep sequencing of chromatin fragments after micrococcal nuclease digestion (MNase-seq). Approxi-mately 40 million reads for 120–180 bp fragments were selected, and the midpoint of each read was taken to represent a nucleosome count. The cumulative value of nucleosome counts at each nucleotide coordinate in the region from −500 to +500 of the TSS was then used to construct the nucleosome profile for the metagene. For the vast majority of genes without GAF occupancy in the promoter region (13,774 genes), a high level of ordered nucleosome array was observed in the downstream region, starting from the +1 nucleosome positioned around +130 (dash line in Fig. 5a). In contrast, less nucle-osome counts were detected in the upstream region up to about −300, resembling the nucleosome-free region (NFR) found in many organisms [60, 61]. For 1891 GAF-target genes, a different profile was seen. In gen-eral, downstream nucleosome peaks were shallower and less distinct. Instead of the NFR, significant amounts of nucleosome counts were detected in the upstream region ranging from the TSS to −150 (solid line in Fig. 5a). To exclude the possibility that this difference might result from the much larger pool size of non-target genes used for the plotting, we constructed a nucleosome profile from 1900 non-targets randomly chosen from five chro-mosomal arms. No matter the difference in pool size, the patterns are almost indistinguishable for non-targets (Additional file 1: Fig. S9A).
Interestingly, these profiles appeared to correlate with the predicted nucleosome propensity based on the
occurrence of SS-dinucleotides comprising GG, GC, CC and CG [62]. For example, the high level of downstream nucleosome arrays found in non-target genes coincided with high SS-dinucleotide contents. In contrast, the NFR was relatively devoid of such sequences. For GAF targets, however, the highest level of SS-dinucleotide content was found in sequences flanking the TSS. Thus, the WT nucleosome profile appears to partially reflect the intrin-sic property of DNA sequences.
To determine the role of GAF in modulating nucleo-some organization, we next examined how nucleosome profiles are altered in different ranks of GAF targets (Fig. 5b–e). Superimposition of WT nucleosome pro-files with GAF peaks revealed a sharp +1 nucleosome peak flanked by GAF peaks in the three lower ranks of genes. In rank IV, no distinct nucleosome peak was found in this region. Despite these differences, none of these downstream nucleosome profiles were signifi-cantly affected by Gaf mutations. In the upstream region spanning the TSS, disordered nucleosome profiles were observed in all ranks. Notably, their nucleosome profiles seemed to extend more toward the upstream region for ranks I through IV, paralleling the presence of higher SS-dinucleotide content. The upstream nucleosome pro-file began to show significant increases from rank II in Gaf mutants. By dividing the upstream region into dis-tal and proximal halves, we found that the increase in nucleosome counts was mainly located in the distal half of rank II (Kolmogorov–Smirnov test, p = 1.23 × 10⁻⁴). The increase expanded to the proximal half in rank III (p = 8 × 10⁻³) and became most pronounced in rank IV (p = 3 × 10⁻³). Thus, nucleosome organization is affected in a dose-dependent manner. It is also important to note that the upstream nucleosome profile of rank IV became more consistent with the high SS-dinucleotide content in Gaf mutants, suggesting that GAF’s main function is to alleviate the constraint imposed by nucleosomes and
Table 1 Frequency of various core promoter elements in non-target genes, GAF target genes and each GAF rank
Each element was screened by MEME with p value <0.005
Motif Non‑GAF targets GAF targets GAF‑I GAF‑II GAF‑III GAF‑IV
DRE 9.05 % 9.89 % 20.65 % 12.09 % 18.68 % 3.30 %
Motif 1 13.32 % 15.18 % 23.91 % 19.78 % 9.89 % 9.89 %
Motif 5 5.67 % 6.24 % 8.70 % 6.59 % 4.40 % 6.59 %
Motif 6 15.72 % 14.17 % 17.39 % 16.48 % 12.09 % 7.69 %
Motif 7 11.70 % 13.38 % 21.74 % 20.88 % 9.89 % 6.59 %
DPE 2.12 % 3.60 % 1.09 % 1.10 % 5.49 % 7.69 %
INR 3.33 % 5.98 % 5.43 % 10.99 % 7.69 % 7.69 %
MTE 2.02 % 4.92 % 4.35 % 3.30 % 5.49 % 8.79 %
TATA box 6.29 % 3.75 % 6.52 % 4.40 % 2.20 % 1.10 %
Gene number 13,774 1891 92 91 91 91

Page 13 of 20Tsai et al. Epigenetics & Chromatin (2016) 9:32
Fig. 6 GAF‑interacting factors involved in RNA‑Pol pausing. a Genetic test for GAF‑interacting factors. The small‑eye phenotype induced by ey > GAF(2) was used to identify factors involved in GAF‑mediated pausing. Each photograph represents the typical eye observed in WT and mutant backgrounds. b Detailed analysis of GAF‑induced small‑eye phenotype. The scanning electron microscopic graphs of typical eyes from ey > WT and ey > GAF(2) adults are shown. The total numbers of ommatidia in each eye field and the average area of each ommatidium were measured from these graphs (ey > WT, n = 12; ey > GAF(2), n = 22) and summarized below. c The effect of GAF over‑expression in eye‑antenna disks. Disks were stained by Hoechst 33258. The area posterior to the morphogenetic furrow (arrow) is severely reduced in ey > GAF(2) disks. d Quantitative measurement for adult eyes. The scanning electron microscopic graphs described in b were used to measure the eye field and ommatidia number separately. The average area per ommatidium was calculated from these values. e Quantitative measurement for larval imaginal disks. The nuclei density of antenna and eye disks from ey > WT and ey > GAF(2) animals was separately measured. The ratio of nuclei density between antenna and eye disks was given as A/E index. The details of the measurement are described in Additional file 1: Fig. S10A. f Effects of different mutations on small‑eye phenotype. Measurement was based on the pixel number within eye perimeter in photographs taken under a dissection microscope. The average eye size was calculated from measurement of 50 eyes for each genotype. Statistical significance is indicated (t test, *p < 0.05; **p < 0.01; ***p < 0.001)
Page 14 of 20Tsai et al. Epigenetics & Chromatin (2016) 9:32
underlying sequences, particularly in the proximal half of the upstream region.
The correlation between increased nucleosome occu-pancy and reduced RNA-Pol strongly suggests that these events are related [23]. To determine whether reduced RNA-Pol is sufficient to cause the increase in nucleosome occupancy, we examined the nucleosome profile of non-target genes with significant reduction (>20 % reduction from WT, n = 210) of promoter-proximal RNA-Pol in Gaf mutant. Compared to the WT profile, no significant change was found in mutants (Additional file 1: Fig. S9B). We also examined the nucleosome profile around inter-genic GAF peaks (n = 516). Interestingly, these regions showed substantial increases in nucleosome occupancy in mutants (Additional file 1: Fig. S9C). These observa-tions strongly suggest that elevated nucleosome occu-pancy in Gaf mutants is not directly affected by adjacent RNA-Pol.
GAF cooperates with other regulatory factorsSeveral motifs are frequently found in Drosophila core promoters [63]. Some appear to correlate with the occur-rence of paused RNA-Pol or specific nucleosomal profiles [24, 64, 65]. We used MEME to survey the whole genome to determine their prevalence in GAF targets. Compared to non-targets, GAF targets showed significant enrich-ment for DPE (2.12 vs 3.60 %), INR (3.33 vs 5.98 %) and
MTE (2.02 vs 4.92 %), but reduction for TATA boxes (6.29 vs 3.75 %). Interestingly, the enrichment for DPE, INR and MTE, as well as the reduction for TATA boxes, was further enhanced in rank IV (Table 1). In addition, the occurrence of Motif 1, 6, 7 and DRE was also signifi-cantly reduced in rank IV. These patterns are similar to those found in developmentally regulated genes [64].
We next asked whether any other factors might cooper-ate with GAF in regulating transcriptional pausing. Since GAF over-expression could result in striking increases in GAF occupancy and paused RNA-Pol globally (Fig. 2b) and since there are multiple GAF motifs in eye develop-ment genes including eyegone, twin of eyg, lozenge, seven-up and Bar (data not shown), we reasoned that GAF over-expression in eye disks might lead to its increased occupancy on these promoters and subsequent pausing, providing a convenient genetic assay. Using eyeless-Gal4 to drive a UAS-GAF-519 transgene located on second chromosome (i.e., ey > GAF(2)) in eye imaginal tissues, we found that the size of the adult eyes was reduced by ~50 % in ey > GAF(2) flies (Fig. 6a, b). Detailed examina-tion revealed that both eye field and ommatidia number were severely reduced (Fig. 6b, d). However, the average space of each ommatidium remained similar for both ey > WT and ey > GAF(2) adults. We further examined the structure of larval eye disks. As expected, the size of eye disks of third-instar larvae was substantially reduced (Fig. 6c). Specifically, the region corresponding to undif-ferentiated cells located posterior to the morphogenetic furrow showed impaired development. We also com-pared the nuclei density of antenna disks with that of posterior eye disks (A/E index, Fig. 6e and Additional file 1: Fig. S10A). Again, similar values were found for ey > WT and ey > GAF(2) disks. Thus, GAF over-expres-sion appears to mainly affect the number of eye cells.
Previous studies have shown that NURF—an ATP-dependent nucleosome remodeling factor—may interact directly with GAF to re-organize nucleosomal spacing [38]. In a Nurf mutant background, eye size was substan-tially restored (Fig. 6a, f and Additional file 1: Fig. S10B), indicating that Nurf is indeed involved in GAF-mediated regulation. We further tested the involvement of other factors known to facilitate RNA-Pol pausing directly [21]. Specifically, two components of NELF complex were examined. Interestingly, the small-eye phenotype was relieved moderately by a Nelf-A mutation and sub-stantially by a Nelf-E mutation. However, the mutation of Su(var)3-7—a suppressor of heterochromatin-mediated silencing [66]—did not produce significant effects.
Furthermore, we used the MEME program to search potential binding motifs in the region from −1000 to +500 of GAF-target genes. These motifs were then analyzed by the TOMTOM program to identify
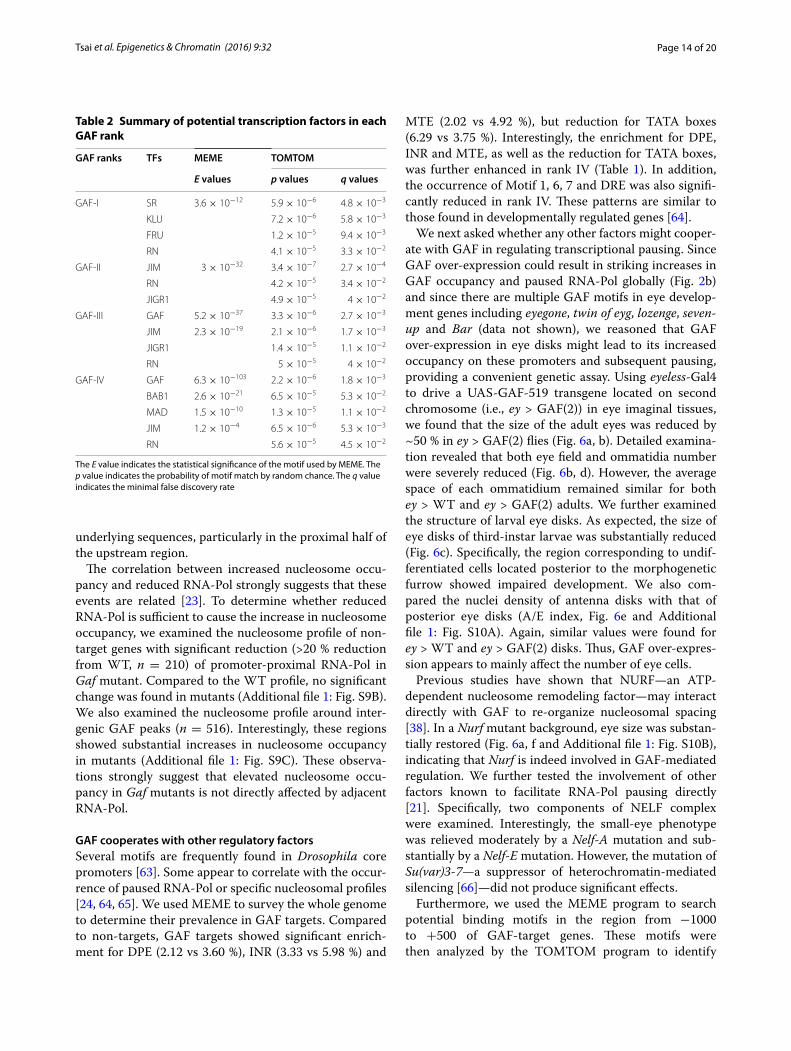
Table 2 Summary of potential transcription factors in each GAF rank
The E value indicates the statistical significance of the motif used by MEME. The p value indicates the probability of motif match by random chance. The q value indicates the minimal false discovery rate
GAF ranks TFs MEME TOMTOM
E values p values q values
GAF‑I SR 3.6 × 10⁻¹² 5.9 × 10⁻⁶ 4.8 × 10⁻³
KLU 7.2 × 10⁻⁶ 5.8 × 10⁻³
FRU 1.2 × 10⁻⁵ 9.4 × 10⁻³
RN 4.1 × 10⁻⁵ 3.3 × 10⁻²
GAF‑II JIM 3 × 10⁻³² 3.4 × 10⁻⁷ 2.7 × 10⁻⁴
RN 4.2 × 10⁻⁵ 3.4 × 10⁻²
JIGR1 4.9 × 10⁻⁵ 4 × 10⁻²
GAF‑III GAF 5.2 × 10−37 3.3 × 10⁻⁶ 2.7 × 10⁻³
JIM 2.3 × 10⁻¹⁹ 2.1 × 10⁻⁶ 1.7 × 10⁻³
JIGR1 1.4 × 10⁻⁵ 1.1 × 10⁻²
RN 5 × 10⁻⁵ 4 × 10⁻²
GAF‑IV GAF 6.3 × 10−103 2.2 × 10⁻⁶ 1.8 × 10⁻³
BAB1 2.6 × 10⁻²¹ 6.5 × 10⁻⁵ 5.3 × 10⁻²
MAD 1.5 × 10⁻¹⁰ 1.3 × 10⁻⁵ 1.1 × 10⁻²
JIM 1.2 × 10⁻⁴ 6.5 × 10⁻⁶ 5.3 × 10⁻³
RN 5.6 × 10⁻⁵ 4.5 × 10⁻²
Page 15 of 20Tsai et al. Epigenetics & Chromatin (2016) 9:32
corresponding transcription factors [50], followed by ver-ification with the FlyTF database containing 753 validated site-specific transcription factors [67]. Relevant factors and their binding motifs are summarized in Table 2. Con-sistent with our ranking, most significant GAF motifs were found in ranks III and IV (E values <5.2 × 10−37 or 6.3 × 10−103). Interestingly, motifs for BAB1 (E value <2.6 × 10⁻²¹) and MAD (E value <1.5 × 10⁻¹⁰) were identified in rank IV only. Again, we tested their physi-ological relevance using the GAF-induced eye pheno-type assay. The eye defects were substantially relieved in bab1 (Fig. 6a, f ), suggesting the functional involvement of BAB1 in GAF-mediated pausing. In contrast, no obvious effect was observed in Mad mutant. However, due to the weaker eye phenotype induced by UAS-GAF located on third chromosome (i.e., UAS-GAF(3)), the role of MAD is less certain (Fig. 6f and Additional file 1: Fig. S10B).
DiscussionIn this report, we used several approaches to address the role of GAF in transcriptional regulation in broad tissue contexts. Our results support that GAF acts as a global activator and is required to maintain proper level of paused RNA-Pol and organization of upstream nucleosomes.
As expected from prevalent GAF occupancy in the genome, expression of ~20 % of coding genes (2912 genes) is affected by Gaf mutation. Based on its occu-pancy near the TSS, we estimate that at least 9 % of them are directly regulated by GAF. Interestingly, about 15 % of these direct targets (40 genes) are listed in FlyTF as putative transcriptional factors (Additional file 2: Table S1), of which nearly half have previously been validated experimentally and are known to carry out important developmental functions such as embryonic segment for-mation and cell fate determination. Conceivably, these transcriptional factors could further control the expres-sion of a much larger spectrum of downstream genes that lack direct GAF binding. Either directly or indirectly, the vast majority (~80 %) of these genes are down-regulated in Gaf mutants. These results demonstrate that GAF functions primarily as a global transcriptional activa-tor. It is worth noting that many of these developmen-tal regulators were not identified in previous studies [26, 51]. Therefore, our results significantly expand the global function of GAF, particularly in the developmental processes.
For the inducible Hsp70 gene, we demonstrate that GAF affects transcription primarily at post-initiation steps. Both cytogenetic and molecular analyses of the Hsp70 gene showed that the levels of Ser-5p and Ser-2p, but not Hypo-p, are substantially affected in Gaf mutants following heat induction. Since phosphorylation
of RNA-Pol occurs after transcriptional initiation, these results clearly indicate that GAF exerts its effects at post-initiation steps. Our studies also revealed reciprocal changes for Ser-5p and Ser-2p in Gaf mutants; accom-panying the large decrease in promoter-proximal Ser-5p signal, Ser-2p showed a substantial increase toward the distal end of Hsp70. Given the obligatory order for the appearance of Ser-5p and Ser-2p during transcription, these observations strongly suggest that the reduction of Ser-5p signal represents the primary effect of Gaf muta-tion. The increase in Ser2-p seems to be at odds with the observation that the majority of genes are down-regu-lated in Gaf mutants. Since GAF can physically interact with NELF and since active transcription of Hsp70 occurs when NELF is dissociated from RNA-Pol [21, 68], it is plausible that less NELF is recruited to Hsp70 promoter in Gaf mutant, resulting in less efficient withholding of paused RNA-Pol. In addition, we note that Hsp70 expres-sion can still be induced by the potent activator HSF dur-ing heat shock from a transgene lacking GAF binding sites [69]. Thus, Hsp70 may represent an unusual case in which multiple factors are critically involved in its activa-tion. GAF knockdown in cultured cells has recently been reported to affect the accumulation of total RNA-Pol only in promoter-proximal region [40]. Since the individ-ual contribution of Ser-5p and Ser-2p could not be dis-tinguished in that assay and since we show that there is a reciprocal relationship between these two isoforms par-ticularly in distal regions, it is very likely that the effects of GAF depletion were not fully evaluated.
Our results further show that the effect of GAF on Ser-5p is not unique to Hsp70. We found that Gaf mutation results in reduced Ser-5p, but not Hypo-p or Ser-2p, on polytene chromosomes, suggesting that GAF can modu-late the level of Ser-5p globally. This is substantiated by our analyses of the genome-wide distribution of RNA-Pol. In WT samples, GAF occupancy in the upstream region is positively correlated only with the RNA-Pol density in the promoter-proximal region or with PI. These results clearly reveal a dose-dependent relation-ship between paused RNA-Pol and GAF. Importantly, this positive correlation was lost in Gaf mutants, indicat-ing a direct role of GAF in RNA-Pol pausing. Contrary to the reduction of paused RNA-Pol in Gaf mutants, GAF over-expression results in an overall increase in Ser-5p, but not other isoforms. These complementary results further strengthen the conclusion that GAF is critical for transcription pausing.
Consistent with earlier studies [26, 68], our analyses of genome-wide nucleosome profiling revealed remarkable differences between GAF-target and non-target genes. Much lower levels of the nucleosome array were found in the transcribed region of GAF-target genes, indicating

Page 16 of 20Tsai et al. Epigenetics & Chromatin (2016) 9:32
that paused genes contain less downstream nucleosomes. Although somewhat anti-intuitive, these patterns are consistent with recent studies showing a negative correla-tion between PI and downstream nucleosome occupancy [23]. Apparently, these observations do not support a general notion that downstream nucleosomes act directly as a barrier for RNA-Pol, triggering its pausing. Interest-ingly, these profiles appear to coincide closely with the SS-dinucleotide content predicted to favor nucleosome occupancy, suggesting a close relationship between them.
In contrast to the downstream region, GAF-target genes contain more nucleosomes around the TSS and immediately upstream region than non-target genes. Overall, these patterns are consistent with the SS-dinucleotide content of the upstream region. However, considering the strong enrichment of SS-dinucleotide content in GAF targets, the increased nucleosome lev-els seem to be somewhat modest. It is also puzzling that nucleosomal profiles of different ranks of target genes appear to be largely indistinguishable, despite there being more extended SS-dinucleotide sequences in higher ranks. Nevertheless, the levels of nucleosomes were selectively increased in upstream regions from the TSS up to −500 for rank III and more so for rank IV in Gaf mutants, resulting in closer matches to predicted nucleosome profiles. Thus, the upstream sequences of these genes may intrinsically favor higher levels of nucle-osomes, potentially producing stronger physical con-straints for the loading and assembly of transcriptional machinery. Apparently, the presence of high levels of GAF relieves such constraints by reducing the amount of nucleosomes and consequently makes promoters more accessible. Like RNA-Pol pausing, the modulation of
nucleosome profiles by GAF is highly dependent upon the degree of occupancy. This dosage-dependent effect strongly supports a direct role of GAF. Thus, caution should be taken when making inferences about GAF’s role in regulation based on the GAF motif alone.
Since GAF can recruit NURF to remodel nucleosome organization in vitro [38] and since our genetic stud-ies showed that NURF is involved in GAF-mediated regulation, we suggest that GAF may act through NURF to remodel upstream nucleosomes and subsequently facilitate the loading and assembly of factors involved in regulation and general transcription. Based on the obser-vation that a reduction of paused RNA-Pol is correlated with elevated upstream nucleosomes [23, 59], an alterna-tive might suggest a different sequence of events. How-ever, this possibility is not supported by our observations that nucleosome occupancy is not affected in non-target genes with significantly reduced RNA-Pol and the nucle-osome occupancy is elevated in intergenic regions in Gaf mutants.
The role of GAF in RNA-Pol pausing and nucleosome remodeling has recently been reported, based on similar studies of a cultured cell line [40]. While our results on RNA-Pol pausing are quite similar, the effects on nucleo-somal remodeling are somewhat different. In our study, nucleosome perturbation is found only in the upstream region where maximal GAF occupancy is located, while the earlier study has shown that the effect is exerted on more extended region including TSS and further down-stream. Since our collections of GAF targets differ by ~50 %, this difference may reflect the selection of dif-ferent gene pools. It is also worth noting that multiple tissues are used in our study. Thus, the effect we have
Fig. 7 Proposed model for GAF‑mediated transcriptional pausing. Genes with high SS‑dinucleotide contents around and upstream of the TSS are occupied by much higher levels of upstream nucleosomes (dark circle) than others. This organization prevents the loading and assembly of the transcriptional complex. The occupancy of GAF results in the recruitment and cooperative interactions with NURF, NELF and BAB1 to facilitate local nucleosome remodeling and provide accessible space for the assembly of the transcriptional complex and subsequently triggers its transition to the paused state
Page 17 of 20Tsai et al. Epigenetics & Chromatin (2016) 9:32
observed may represent a more general scheme in living organisms.
In addition to NURF, our study shows that NELF and BAB1 are physiologically relevant to GAF’s function. Since NELF can physically interact with GAF and RNA-Pol, GAF may also regulate pausing through recruitment of NELF. However, comparison of the available data sug-gests that GAF targets overlap only partially with those of NELF or NURF [30, 70] (Additional file 1: Fig. S11). Therefore, GAF may act cooperatively with individual or multiple factors, depending upon specific targets. Fur-thermore, earlier studies suggest that BAB1 and GAF share a common interacting protein, TAF3, a component of TFIID essential for the assembly of the pre-initiation complex [71, 72]. Our findings that BAB1 binding sites are enriched specifically in rank IV genes and that there is a strong genetic interaction between bab1 and Gaf mutants support cooperation between GAF and BAB1 in controlling transcriptional pausing. These results clearly show that the upstream region of GAF targets is intrinsically prone to nucleosome assembly, resulting in promoter occlusion. By its ability to trigger nucleosome re-organization, GAF may facilitate the promoter acces-sibility, assembly of the basal transcriptional machinery and its transition into initiation (Fig. 7). Subsequently, the activity of pausing factors recruited by GAF may arrest RNA-Pol at the pausing state, awaiting developmental or environmental cues. Thus, GAF appears to act as a cen-tral player of this regulatory circuitry.
ConclusionWe present cytogenetic, transcriptomic, chromatin land-scaping and nucleosome profiling studies on transcrip-tional pausing of Hsp70 and whole genome to understand the role of a Drosophila upstream binding factor, GAF. Our studies show that depletion of GAF results in global reduction of gene expression, reduced transcrip-tional pausing of genes that normally have high levels of GAF occupancy. These genes appear to be enriched for sequences that favor nucleosome occupancy in the upstream region. The binding of GAF in these genes and its cooperative interactions with factors involved in nucleosome remodeling and RNA-Pol pausing relieve constraints imposed by nucleosome occupancy, enabling these promoters more permissive for the progression of early transcriptional processes and poised for subsequent induction. Our results support a pivotal role of GAF in a regulatory circuitry. It provides the first mechanistic illustration for regulation of transcriptional pausing by an upstream factor in an animal model.
MethodsFly preparationAll flies were raised in standard media at 25 °C. Gaf13C#3 carrying st cu sr e ca markers was derived from recombi-nation between Trl13C [36] and a standard ru cu ca strain. GafDH34 was generated from EP3184 (Szeged Stock Centre) by immobilization of the P-element. Nelf-AKG09483, Nelf-EEY07065, Df(3L)babAr07, Mad12 and ru cu ca were obtained from Bloomington Stock Centre. w; P{GawB}Cdk9NP0727/CyO was from Drosophila Genetic Resource Center. E(bx)Nurf301−9 and Su(var)3-714 were obtained from P. Badenhorst and P. Spierer, respectively.
Antibody and immunoblottingGST-GAF-N was constructed by inserting a GAF N-terminal fragment (1–1089 nucleotides of ORF) into pGST5X-1 (Novagen). Bacterial fusion protein induced in strain BL21 (DE3) was gel-purified and used for immu-nization in rabbits by standard protocols [73]. After pre-absorption with GST extracts, the antibody was affinity-purified, using GST-GAF-M fusion protein con-taining the middle part of GAF (253–1352 nucleotides of ORF). For immunoblotting, imaginal tissues from WT and Gaf mutant larvae were lysed in SDS–urea buffer [73]. Extracts were separated on 10 % SDS-PAGE, blot-ted onto nitrocellulose filters and detected by antibodies against GAF, α-tubulin (Sigma, T9026), RNA-Pol includ-ing ARNA3 (Merck Millipore, CBL221), CTD Hypo-p (8wg16) (Covance, MMS-126R), Ser-5p (H14) (Covance, MMS-134R), Ser-2p (H5) (Covance, MMS-129R).
Polytene chromosome stainingThree pairs of salivary glands were isolated from third-instar larvae raised at 25 °C or treated for 30 min at 37 °C before dissection. Polytene chromosomes prepared from squashed glands were stained according to previously described procedures [74, 75]. Primary antibodies were used at the following dilutions: GAF, 1:500; BEAF-32, 1:50 (Developmental Studies Hybridoma Bank); RNA-Pol 8wg16, H14, H5, all 1:20; Rpb3, 1:100 (a gift from Dr. J. T. Lis). Secondary antibodies were used at 1:100 dilution for Cy5-conjugated goat anti-rabbit IgG (Jackson Immu-noResearch, 111-175-144), rhodamine-conjugated goat anti-mouse IgM (Jackson ImmunoResearch, 715-595-140), Alexa 488 goat anti-mouse IgG1 (Molecular Probes, A21202), Alexa 633 goat anti-mouse IgG2a antibodies (Molecular Probes, A21105). DNA was stained with Hoe-chst 33258 (0.25 mg/ml) (Polysciences, 09460). The fluo-rescent staining was detected by Zeiss LSM 510 confocal microscope.

Page 18 of 20Tsai et al. Epigenetics & Chromatin (2016) 9:32
ChIP analysis for Hsp70Thirty WT or mutant third-instar larvae were dissected in Drosophila M3 medium (Sigma); anterior-most parts containing imaginal disks, nerve cords and salivary glands (referred to as imaginal tissues throughout) were collected. For heat-shock samples, tissue samples were processed according to published procedures [76] and then incubated at 37 °C for 5 min. Tissues were fixed for 20 min in 1 % paraformaldehyde and quenched by 0.125 M glycine. After three washes in TBS (10 mM Tris–HCl, pH 8.0 and 150 mM NaCl), fixed tissues were suspended in 0.5 ml of lysis buffer (Upstate) and then sheared by Bioruptor (Diagenode). A 0.1-ml aliquot was used for each immunoprecipitation assay with different antibodies or pre-immune serum according to the ven-dor’s protocol (Upstate). The amount of antibodies used in these assays was as follows: Ser-5p, 15 μL; Ser-2p, 25 μL; Hypo-p, 5 μL; GAF, 2.5 μL. Two percent of immuno-precipitated DNA or input DNA was subjected to qPCRs for 35 cycles. PCR primers are listed in Additional file 2: Tables S2, 3.
Microarray analysesTotal RNA was extracted from imaginal tissues of WT or mutant third-instar larvae by TRIzol (Invitrogen), treated with RNase-free DNase I (Worthington) and purified by RNeasy kit (Qiagen) according to the ven-dors’ protocols. Microarray analysis was conducted by our in-house Microarray Core Facility (http://www.imb.sinica.edu.tw/mdarray/index.html). Briefly, cDNA was synthesized from 15 μg RNA and labeled with Alexa Fluor 555 (WT) or Alexa Fluor 647 (mutant) using a SuperScript Indirect cDNA Labeling System (Invitrogen). Labeled probes prepared from three samples were inde-pendently hybridized to a Drosophila Gene Expression Microarray (Agilent 4 × 44 K) containing 37,536 oligo-nucleotide probes, according to the manufacturer’s pro-tocol. Microarrays were scanned on an Agilent G2565CA scanner and quantified using Feature Extraction software (FE version 10.5.1.1.1) for background subtraction and LOWESS normalization. GeneSpring GX11.5 analysis software (Agilent) was used for further analysis. Average values from triplicate sets were filtered on a Volcano plot, and an entity list was collected from probes with signifi-cant expression in WT samples (signal intensity > 100, p < 0.05).
ChIP‑sequencingChromatin samples from WT and mutant larvae were prepared as described above. Immunoprecipitation was performed with affinity-purified antibodies against GAF or Rpb3. ChIP and input DNA samples were pro-cessed using an Illumina ChIP-Seq DNA Sample Prep
kit (Illumina). After ligation to adaptors, DNA samples were amplified by PCR without size selections. Sequenc-ing was performed on an Illumina Genome Analyzer IIx for 40 bp read length by the Biofuel High Through-put Sequencing Core Facility (Institute of Biodiversity Research Center, Academia Sinica, Taiwan).
MNase sequencingMNase-digested chromatin was prepared as described previously with some modifications [23, 77, 78]. After fixation, imaginal tissues were resuspended in 1 ml buffer A (300 mM sucrose, 2 mM Mg acetate, 3 mM CaCl2, 10 mM Tris pH 8, 0.1 % Triton X-100 and 0.5 mM DTT), for 60 larvae and homogenized in a Dounce homogenizer (tight pestle, Wheaton). Nuclei were collected by centrif-ugation at 4 °C, 720 g for 5 min, washed by buffer A and washed in buffer D (50 mM Tris–HCl pH 8, 25 % glyc-erol, 5 mM Mg acetate, 0.1 mM EDTA and 5 mM DTT). Nuclei were resuspended in buffer MN (15 mM Tris–HCl pH 8.5, 60 mM KCl, 15 mM NaCl, 0.5 mM DTT, 0.25 M sucrose and 3 mM CaCl2). Two hundred microliter of chromatin was digested with 20U of MNase (Worthing-ton) for 3 h at 25 °C. Gel-purified DNA fragments rang-ing from 100 to 200 bp were then subjected to pair-end sequencing by an Illumina Genome Analyzer IIx.
Details of bioinformatic analyses are presented in Addi-tional file 3.
AbbreviationsGAF: GAGA factor; RNA‑Pol: RNA polymerase II; Hsp70: heat shock 70; MNase: micrococcal nuclease; NURF: nucleosome remodeling factor; NELF: negative elongation factor; bab1: bric a brac 1; Hypo‑p: hypo‑phosphorylated serine residues on C‑terminal heptad repeats of Rpb1; Ser‑5p: hyper‑phosphorylated serine 5 residues on C‑terminal heptad repeats of Rpb1; Ser‑2p: hyper‑phosphorylated serine 2 residues on C‑terminal heptad repeats of Rpb1; DSIF: DRB sensitivity‑inducing factor; FACT: facilitates chromatin transcription; Trl: trithorax‑like; BEAF‑32: boundary element‑associated factor of 32kD; dpp: decapentaplegic; PICS program: Probabilistic inference for ChIP‑Seq; MEME: Multiple EM for Motif Elicitation; DAVID: Database for Annotation, Visualization
Additional files
Additional file 1. Figure S1. Analyses of RNA‑Pol in Gaf mutants. Figure S2. RNA‑Pol Hypo‑p and Ser‑2p are not affected by GAF on polytene chromosomes. Figure S3. Comparison of GAF target genes identified in different reports. Figure S4. Verification of gene expression by microarray studies. Figure S5. Procedures of statistical analyses of GAF and RNA‑Pol ChIP‑seq data. Figure S6. The abundance of different GAF binding motifs among targets. Figure S7. Reduction promoterproximal RNA‑Pol in the Gaf mutant. Figure S8. Comparison of paused genes iden‑tified in different reports. Figure S9. Comparion of nucleosome profiles. Figure S10. Analyses of GAF’s effects on eye development. Figure S11. Comparison of target genes for GAF, NELF and NURF.
Additional file 2. Table S1. Putative transcription factors identified in GAF target genes. Table S2. PCR primers used for ChIP analysis of Hsp70. Table S3. Primers used for RT‑qPCR.
Additional file 3. Supplementary Methods.

Page 19 of 20Tsai et al. Epigenetics & Chromatin (2016) 9:32
and Integrated Discovery; P‑TEFb: positive transcription elongation factor b; Mad: mothers against dpp; Su(var)3‑7: suppressor of variegation 3–7.
Authors’ contributionsSYT and DHH designed the study. SYT performed all experiments except mutagenesis (by DHH) and GAF ChIP‑seq, SEM (by YLC). RLJ and KBSS devel‑oped the algorithm and performed statistical analyses. SYT and DHH wrote the manuscript. All the authors participated in discussion and manuscript revision. All authors read and approved the final manuscript.
Author details1 Institute of Molecular Biology, Academia Sinica, Nankang, Taipei, Taiwan, ROC. 2 Molecular Cell Biology, Taiwan International Graduate Program, Institute of Molecular Biology, Academia Sinica, Graduate Institute of Life Sciences, National Defense Medical Center, Taipei, Taiwan, ROC.
AcknowledgementsWe thank the Bloomington Stock Center, Drosophila Genetic Resource Center, Szeged Stock Centre, P. Spierer and P. Badenhorst for fly stocks. We also thank Developmental Studies Hybridoma Bank at the University of Iowa for the BEAF‑32 antibody. We are grateful to J. T. Lis for Rpb3 antibody. BRC NGS Core, IMB Genomic Core and IMB Bioinformatics Core in Academia Sinica performed deep sequencing, microarray and high throughput data analysis. We thank J. O’Brien for editing the manuscript.
Competing interestsThe authors declare that they have no competing interests.
Availability of supporting dataThe microarray and ChIP‑seq (genomic) data in this study have been depos‑ited in the NCBI Gene Expression Omnibus (GEO; http://www.ncbi.nlm.nih.gov/geo/) under the SuperSeries with the accession number: GSE70634.
FundingThis project was supported by grants from Academia Sinica.
Received: 10 May 2016 Accepted: 20 July 2016
References 1. Fuda NJ, Ardehali MB, Lis JT. Defining mechanisms that regulate RNA
polymerase II transcription in vivo. Nature. 2009;461:186–92. 2. Thomas MC, Chiang C‑M. The general transcription machinery and
general cofactors. Crit Rev Biochem Mol Biol. 2006;41:105–78. 3. Rougvie AE, Lis JT. Postinitiation transcriptional control in Drosophila
melanogaster. Mol Cell Biol. 1990;10:6041–5. 4. Krumm A, Meulia T, Brunvand M, Groudine M. The block to transcriptional
elongation within the human c‑myc gene is determined in the promoter‑proximal region. Genes Dev. 1992;6:2201–13.
5. Plet A, Eick D, Blanchard JM. Elongation and premature termination of transcripts initiated from c‑fos and c‑myc promoters show dissimilar pat‑terns. Oncogene. 1995;10:319–28.
6. Strobl LJ, Eick D. Hold back of RNA polymerase II at the transcrip‑tion start site mediates down‑regulation of c‑myc in vivo. EMBO J. 1992;11:3307–14.
7. Nechaev S, Fargo DC, dos Santos G, Liu L, Gao Y, Adelman K. Global analysis of short RNAs reveals widespread promoter‑proximal stalling and arrest of Pol II in Drosophila. Science. 2010;327:335–8.
8. Guenther MG, Levine SS, Boyer LA, Jaenisch R, Young RA. A chromatin landmark and transcription initiation at most promoters in human cells. Cell. 2007;130:77–88.
9. Zeitlinger J, Stark A, Kellis M, Hong J‑W, Nechaev S, Adelman K, Levine M, Young RA. RNA polymerase stalling at developmental control genes in the Drosophila melanogaster embryo. Nat Genet. 2007;39:1512–6.
10. Min IM, Waterfall JJ, Core LJ, Munroe RJ, Schimenti J, Lis JT. Regulating RNA polymerase pausing and transcription elongation in embryonic stem cells. Genes Dev. 2011;25:742–54.
11. Kim TH, Barrera LO, Zheng M, Qu C, Singer MA, Richmond TA, Wu Y, Green RD, Ren B. A high‑resolution map of active promoters in the human genome. Nature. 2005;436:876–80.
12. Levine M. Paused RNA polymerase II as a developmental checkpoint. Cell. 2011;145:502–11.
13. Adelman K, Lis JT. Promoter‑proximal pausing of RNA polymerase II: emerging roles in metazoans. Nat Rev Genet. 2012;13:720–31.
14. Zhou Q, Li T, Price DH. RNA polymerase II elongation control. Annu Rev Biochem. 2012;81:119–43.
15. Phatnani HP, Greenleaf AL. Phosphorylation and functions of the RNA polymerase II CTD. Genes Dev. 2006;20:2922–36.
16. Yamaguchi Y, Takagi T, Wada T, Yano K, Furuya A, Sugimoto S, Hasegawa J, Handa H. NELF, a multisubunit complex containing RD, cooperates with DSIF to repress RNA polymerase II elongation. Cell. 1999;97:41–51.
17. Wada T, Takagi T, Yamaguchi Y, Ferdous A, Imai T, Hirose S, Sugimoto S, Yano K, Hartzog GA, Winston F, et al. DSIF, a novel transcription elonga‑tion factor that regulates RNA polymerase II processivity, is composed of human Spt4 and Spt5 homologs. Genes Dev. 1998;12:343–56.
18. Cheng B, Price DH. Properties of RNA polymerase II elongation complexes before and after the P‑TEFb‑mediated transition into productive elonga‑tion. J Biol Chem. 2007;282:21901–12.
19. Price DH. P‑TEFb, a cyclin‑dependent kinase controlling elongation by RNA polymerase II. Mol Cell Biol. 2000;20:2629–34.
20. Kwak H, Lis JT. Control of transcriptional elongation. Annu Rev Genet. 2013;47:483–508.
21. Wu CH, Yamaguchi Y, Benjamin LR, Horvat‑Gordon M, Washinsky J, Enerly E, Larsson J, Lambertsson A, Handa H, Gilmour D. NELF and DSIF cause promoter proximal pausing on the hsp70 promoter in Drosophila. Genes Dev. 2003;17:1402–14.
22. Hendrix DA, Hong J‑W, Zeitlinger J, Rokhsar DS, Levine MS. Promoter ele‑ments associated with RNA Pol II stalling in the Drosophila embryo. Proc Natl Acad Sci. 2008;105:7762–7.
23. Gilchrist DA, Dos Santos G, Fargo DC, Xie B, Gao Y, Li L, Adelman K. Paus‑ing of RNA polymerase II disrupts DNA‑specified nucleosome organiza‑tion to enable precise gene regulation. Cell. 2010;143:540–51.
24. Rach EA, Winter DR, Benjamin AM, Corcoran DL, Ni T, Zhu J, Ohler U. Transcription initiation patterns indicate divergent strategies for gene regulation at the chromatin level. PLoS Genet. 2011;7:e1001274.
25. Mavrich TN, Jiang C, Ioshikhes IP, Li X, Venters BJ, Zanton SJ, Tomsho LP, Qi J, Glaser RL, Schuster SC, et al. Nucleosome organization in the Dros‑ophila genome. Nature. 2008;453:358–62.
26. Li J, Gilmour DS. Distinct mechanisms of transcriptional pausing orches‑trated by GAGA factor and M1BP, a novel transcription factor. EMBO J. 2013;32:1829–41.
27. Lehmann M, Siegmund T, Lintermann KG, Korge G. The pipsqueak protein of Drosophila melanogaster binds to GAGA sequences through a novel DNA‑binding domain. J Biol Chem. 1998;273:28504–9.
28. Soeller WC, Oh CE, Kornberg TB. Isolation of cDNAs encoding the Dros‑ophila GAGA transcription factor. Mol Cell Biol. 1993;13:7961–70.
29. Gilchrist DA, Nechaev S, Lee C, Ghosh SKB, Collins JB, Li L, Gilmour DS, Adelman K. NELF‑mediated stalling of Pol II can enhance gene expres‑sion by blocking promoter‑proximal nucleosome assembly. Genes Dev. 2008;22:1921–33.
30. Lee C, Li X, Hechmer A, Eisen M, Biggin MD, Venters BJ, Jiang C, Li J, Pugh BF, Gilmour DS. NELF and GAGA factor are linked to promoter‑proximal pausing at many genes in Drosophila. Mol Cell Biol. 2008;28:3290–300.
31. Benyajati C, Mueller L, Xu N, Pappano M, Gao J, Mosammaparast M, Conklin D, Granok H, Craig C, Elgin S. Multiple isoforms of GAGA fac‑tor, a critical component of chromatin structure. Nucleic Acids Res. 1997;25:3345–53.
32. Wilkins RC, Lis JT. Dynamics of potentiation and activation: GAGA factor and its role in heat shock gene regulation. Nucl Acids Res. 1997;25:3963–8.
33. Greenberg AJ, Schedl P. GAGA factor isoforms have distinct but overlap‑ping functions in vivo. Mol Cell Biol. 2001;21:8565–74.
34. Kerrigan LA, Croston GE, Lira LM, Kadonaga JT. Sequence‑specific tran‑scriptional antirepression of the Drosophila Kruppel gene by the GAGA factor. J Biol Chem. 1991;266:574–82.
35. Biggin MD, Tjian R. Transcription factors that activate the Ultrabithorax promoter in developmentally staged extracts. Cell. 1988;53:699–711.

Page 20 of 20Tsai et al. Epigenetics & Chromatin (2016) 9:32
36. Farkas G, Gausz J, Galloni M, Reuter G, Gyurkovics H, Karch F. The Trithorax‑like gene encodes the Drosophila GAGA factor. Nature. 1994;371:806–8.
37. Adkins NL, Hagerman TA, Georgel P. GAGA protein: a multi‑faceted tran‑scription factor. Biochem Cell Biol. 2006;84:559–67.
38. Tsukiyama T, Wu C. Purification and properties of an ATP‑dependent nucleosome remodeling factor. Cell. 1995;83:1011–20.
39. Shimojima T, Okada M, Nakayama T, Ueda H, Okawa K, Iwamatsu A, Handa H, Hirose S. Drosophila FACT contributes to Hox gene expression through physical and functional interactions with GAGA factor. Genes Dev. 2003;17:1605–16.
40. Fuda NJ, Guertin MJ, Sharma S, Danko CG, Martins AL, Siepel A, Lis JT. GAGA factor maintains nucleosome‑free regions and has a role in RNA polymerase II recruitment to promoters. PLoS Genet. 2015;11:e1005108.
41. Vazquez M, Moore L, Kennison JA. The trithorax group gene osa encodes an ARID‑domain protein that genetically interacts with the brahma chromatin‑remodeling factor to regulate transcription. Development. 1999;126:733–42.
42. Brown JL, Fritsch C, Mueller J, Kassis JA. The Drosophila pho‑like gene encodes a YY1‑related DNA binding protein that is redundant with pleio‑homeotic in homeotic gene silencing. Development. 2003;130:285–94.
43. Lis J. Promoter‑associated pausing in promoter architecture and post‑initiation transcriptional regulation. Cold Spring Harb Symp Quant Biol. 1998;63:347–56.
44. Zhao K, Hart CM, Laemmli UK. Visualization of chromosomal domains with boundary element‑associated factor BEAF‑32. Cell. 1995;81:879–89.
45. Gerasimova TI, Corces VG. Boundary and insulator elements in chromo‑somes. Curr Opin Genet Dev. 1996;6:185–92.
46. Gilmour DS, Lis JT. RNA polymerase II interacts with the promoter region of the noninduced hsp70 gene in Drosophila melanogaster cells. Mol Cell Biol. 1986;6:3984–9.
47. Brookes E, Pombo A. Modifications of RNA polymerase II are pivotal in regulating gene expression states. EMBO Rep. 2009;10:1213–9.
48. Krämer A, Haars R, Kabisch R, Will H, Bautz FA, Bautz EKF. Monoclonal antibody directed against RNA polymerase II of Drosophila melanogaster. Mol Gen Genet. 1980;180:193–9.
49. Zhang X, Robertson G, Krzywinski M, Ning K, Droit A, Jones S, Gottardo R. PICS: probabilistic inference for ChIP‑seq. Biometrics. 2011;67:151–63.
50. Machanick P, Bailey TL. MEME‑ChIP: motif analysis of large DNA datasets. Bioinformatics. 2011;27:1696–7.
51. van Steensel B, Delrow J, Bussemaker HJ. Genomewide analysis of Drosophila GAGA factor target genes reveals context‑dependent DNA binding. Proc Natl Acad Sci USA. 2003;100:2580–5.
52. Negre N, Brown CD, Ma L, Bristow CA, Miller SW, Wagner U, Kheradpour P, Eaton ML, Loriaux P, Sealfon R, et al. A cis‑regulatory map of the Dros‑ophila genome. Nature. 2011;471:527–31.
53. Oh H, Slattery M, Ma L, Crofts A, White KP, Mann RS, Irvine KD. Genome‑wide association of yorkie with chromatin and chromatin‑remodeling complexes. Cell Rep. 2013;3:309–18.
54. Huang DW, Sherman BT, Lempicki RA. Systematic and integrative analysis of large gene lists using DAVID bioinformatics resources. Nat Protocols. 2008;4:44–57.
55. Huang DW, Sherman BT, Lempicki RA. Bioinformatics enrichment tools: paths toward the comprehensive functional analysis of large gene lists. Nucleic Acids Res. 2009;37:1–13.
56. Blanch M, Piñeyro D, Bernués J. New insights for Drosophila GAGA factor in larvae. R Soc Open Sci. 2015;2:150011–25.
57. Adelman K, Marr MT, Werner J, Saunders A, Ni Z, Andrulis ED, Lis JT. Efficient release from promoter‑proximal stall sites requires transcript cleavage factor TFIIS. Mol Cell. 2005;17:103–12.
58. Muse GW, Gilchrist DA, Nechaev S, Shah R, Parker JS, Grissom SF, Zeitlinger J, Adelman K. RNA polymerase is poised for activation across the genome. Nat Genet. 2007;39:1507–11.
59. Gaertner B, Johnston J, Chen K, Wallaschek N, Paulson A, Garruss AS, Gaudenz K, De Kumar B, Krumlauf R, Zeitlinger J. Poised RNA polymer‑ase II changes over developmental time and prepares genes for future expression. Cell Reports. 2012;2:1670–83.
60. Mavrich TN, Ioshikhes IP, Venters BJ, Jiang C, Tomsho LP, Qi J, Schuster SC, Albert I, Pugh BF. A barrier nucleosome model for statistical position‑ing of nucleosomes throughout the yeast genome. Genome Res. 2008;18:1073–83.
61. Jiang C, Pugh BF. A compiled and systematic reference map of nucleo‑some positions across the Saccharomyces cerevisiae genome. Genome Biol. 2009;10:R109.
62. Kaplan N, Moore IK, Fondufe‑Mittendorf Y, Gossett AJ, Tillo D, Field Y, LeP‑roust EM, Hughes TR, Lieb JD, Widom J, Segal E. The DNA‑encoded nucle‑osome organization of a eukaryotic genome. Nature. 2009;458:362–6.
63. Ohler U, Liao G‑C, Niemann H, Rubin G. Computational analysis of core promoters in the Drosophila genome. Genome Biol. 2002;3:1–12.
64. Zabidi MA, Arnold CD, Schernhuber K, Pagani M, Rath M, Frank O, Stark A. Enhancer‑core‑promoter specificity separates developmental and housekeeping gene regulation. Nature. 2015;518:556–9.
65. Engström PG, Ho Sui SJ, Drivenes Ø, Becker TS, Lenhard B. Genomic regu‑latory blocks underlie extensive microsynteny conservation in insects. Genome Res. 2007;17:1898–908.
66. Spierer A, Begeot F, Spierer P, Delattre M. SU(VAR)3‑7 links hetero‑chromatin and dosage compensation in Drosophila. PLoS Genet. 2008;4:e1000066.
67. Adryan B, Teichmann SA. FlyTF: a systematic review of site‑specific tran‑scription factors in the fruit fly Drosophila melanogaster. Bioinformatics. 2006;22:1532–3.
68. Li J, Liu Y, Rhee HS, Ghosh SK, Bai L, Pugh BF, Gilmour DS. Kinetic competi‑tion between elongation rate and binding of NELF controls promoter‑proximal pausing. Mol Cell. 2013;50:711–22.
69. Lee H, Kraus KW, Wolfner MF, Lis JT. DNA sequence requirements for generating paused polymerase at the start of hsp70. Genes Dev. 1992;6:284–95.
70. Kwon SY, Xiao H, Glover BP, Tjian R, Wu C, Badenhorst P. The nucleosome remodeling factor (NURF) regulates genes involved in Drosophila innate immunity. Dev Biol. 2008;316:538–47.
71. Pointud J‑C, Larsson J, Dastugue B, Couderc J‑L. The BTB/POZ domain of the regulatory proteins Bric à brac 1 (BAB1) and Bric à brac 2 (BAB2) Interacts with the Novel Drosophila TAFII factor BIP2/dTAFII155. Dev Biol. 2001;237:368–80.
72. Chopra VS, Srinivasan A, Kumar RP, Mishra K, Basquin D, Docquier M, Seum C, Pauli D, Mishra RK. Transcriptional activation by GAGA factor is through its direct interaction with dmTAF3. Dev Biol. 2008;317:660–70.
73. Chang Y‑L, King B, Lin S‑C, Kennison JA, Huang D‑H. A double‑bromodo‑main protein, FSH‑S, activates the homeotic gene ultrabithorax through a critical promoter‑proximal region. Mol Cell Biol. 2007;27:5486–98.
74. Johansen KM, Cai W, Deng H, Bao X, Zhang W, Girton J, Johansen J. Polytene chromosome squash methods for studying transcription and epigenetic chromatin modification in Drosophila using antibodies. Meth‑ods. 2009;48:387–97.
75. Huang D‑H, Chang Y‑L, Yang C‑C, Pan IC, King B. pipsqueak encodes a fac‑tor essential for sequence‑specific targeting of a polycomb group protein complex. Mol Cell Biol. 2002;22:6261–71.
76. Fuda NJ, Buckley MS, Wei W, Core LJ, Waters CT, Reinberg D, Lis JT. Fcp1 dephosphorylation of the RNA polymerase II C‑terminal domain is required for efficient transcription of heat shock genes. Mol Cell Biol. 2012;32:3428–37.
77. Gilchrist DA, Fargo DC, Adelman K. Using ChIP‑chip and ChIP‑seq to study the regulation of gene expression: genome‑wide localization studies reveal widespread regulation of transcription elongation. Methods. 2009;48:398–408.
78. Petesch SJ, Lis JT. Rapid, transcription‑independent loss of nucleosomes over a large chromatin domain at Hsp70 Loci. Cell. 2008;134:74–84.