Embed Size (px)
Citation preview
Gabriel India Ltd.Result Update Presentation – FY16

2
This presentation and the accompanying slides (the “Presentation”), has been prepared by Gabriel India Limited (the “Company”), solely for information purposes and do not constitute any offer, recommendation or invitation to purchase or subscribe for any
securities, and shall not form the basis or be relied on in connection with any contract or binding commitment whatsoever. No offering of securities of the
Company will be made except by means of a statutory offering document containing detailed information about the Company.
This Presentation has been prepared by the Company based on information and data which the Company considers reliable, but the Company makes no
representation or warranty, express or implied, whatsoever, and no reliance shall be placed on, the truth, accuracy, completeness, fairness and
reasonableness of the contents of this Presentation. This Presentation may not be all inclusive and may not contain all of the information that you may
consider material. Any liability in respect of the contents of, or any omission from, this Presentation is expressly excluded.
Certain matters discussed in this Presentation may contain statements regarding the Company’s market opportunity and business prospects that are
individually and collectively forward-looking statements. Such forward-looking statements are not guarantees of future performance and are subject to
known and unknown risks, uncertainties and assumptions that are difficult to predict. These risks and uncertainties include, but are not limited to, the
performance of the Indian economy and of the economies of various international markets, the performance of the auto ancilliary industry in India and
world-wide, competition, the company’s ability to successfully implement its strategy, the Company’s future levels of growth and expansion, technological
implementation, changes and advancements, changes in revenue, income or cash flows, the Company’s market preferences and its exposure to market risks,
as well as other risks. The Company’s actual results, levels of activity, performance or achievements could differ materially and adversely from results
expressed in or implied by this Presentation. The Company assumes no obligation to update any forward-looking information contained in this
Presentation. Any forward-looking statements and projections made by third parties included in this Presentation are not adopted by the Company and
the Company is not responsible for such third party statements and projections.

3
Revenue
Rs. 14,382 Mn
-0.4%
EBITDA
Rs. 1,296 Mn
+11%
EBITDA Margin*%
9%
81 bps
PAT
Rs. 752 Mn
+25%
ROIC %
27.8%
110 bps
PBT
Rs. 961 Mn
+14%
Consistent Performance Continues in FY16
*Adjusted for one time items of royalty reversal Rs 21 millions and bonus provision of Rs. 41.12 million (including Rs. 21.71 million for the period 1st April 2014 to 31st March 2015) for the year ended 31st March 2016 arising due to retrospective amendment of Payment of Bonus Act,1965
Note: All comparison are Year on Year

4
Revenue
Rs. 3,662 Mn
5%
EBITDA
Rs. 331 Mn
+16%
EBITDA Margin*%
9%
78 bps
PAT
Rs. 209 Mn
+62%
Cash PAT
Rs. 290 Mn
+41%
PBT
Rs. 255 Mn
+26%
Strong Performance Continues in Q4 FY16
* Adjusted for one time bonus provision of Rs 4.86 million in quarter ended March 2016 arising due to retrospective amendment of Payment of Bonus Act,1965.
Note: All comparison are Year on Year

5
Margin Expansion Continues
PBT Before Exceptional Item Margin %EBITDA Margin %
FY16*
8.1%
FY14
7.1%
FY13 FY15
9.0%
+81 bps
6.7%
+ 85 bps
FY14
3.4%
5.8%
6.7%
FY15 FY16
4.3%
FY13
* EBITDA adjusted for one time items of royalty reversal Rs 21 million and provision towards bonus of Rs. 41.12 million (including Rs. 21.71 million for theperiod 1st April 2014 to 31st March 2015) arising due to retrospective amendment of Payment of Bonus Act, 1965.
6
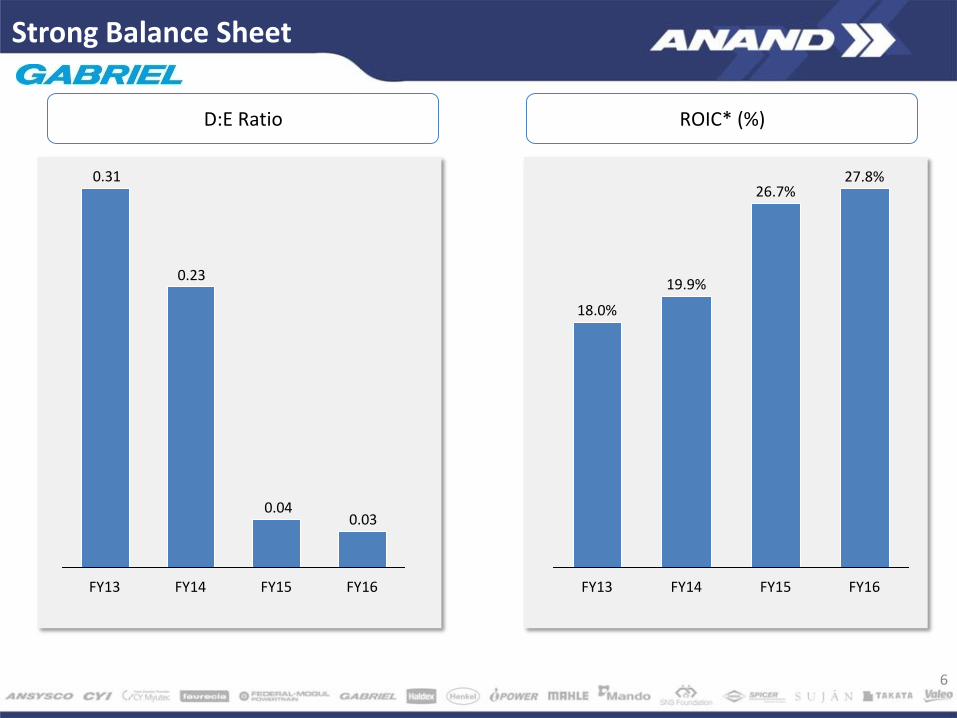
Strong Balance Sheet
ROIC* (%)D:E Ratio
0.030.04
0.23
0.31
FY15FY14FY13 FY16
26.7%
FY13
18.0%
FY14
19.9%
FY15 FY16
27.8%
7
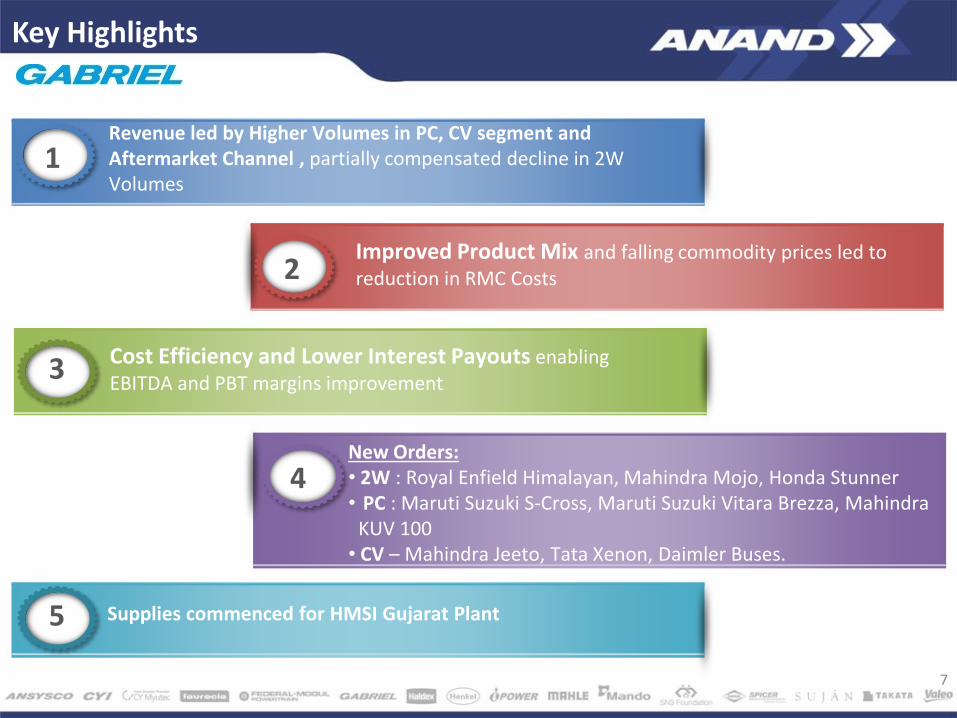
Cost Efficiency and Lower Interest Payouts enabling EBITDA and PBT margins improvement
Supplies commenced for HMSI Gujarat Plant
New Orders: • 2W : Royal Enfield Himalayan, Mahindra Mojo, Honda Stunner• PC : Maruti Suzuki S-Cross, Maruti Suzuki Vitara Brezza, Mahindra
KUV 100• CV – Mahindra Jeeto, Tata Xenon, Daimler Buses.
1Revenue led by Higher Volumes in PC, CV segment and Aftermarket Channel , partially compensated decline in 2W Volumes
Improved Product Mix and falling commodity prices led to reduction in RMC Costs2
3
4
5
Key Highlights
8
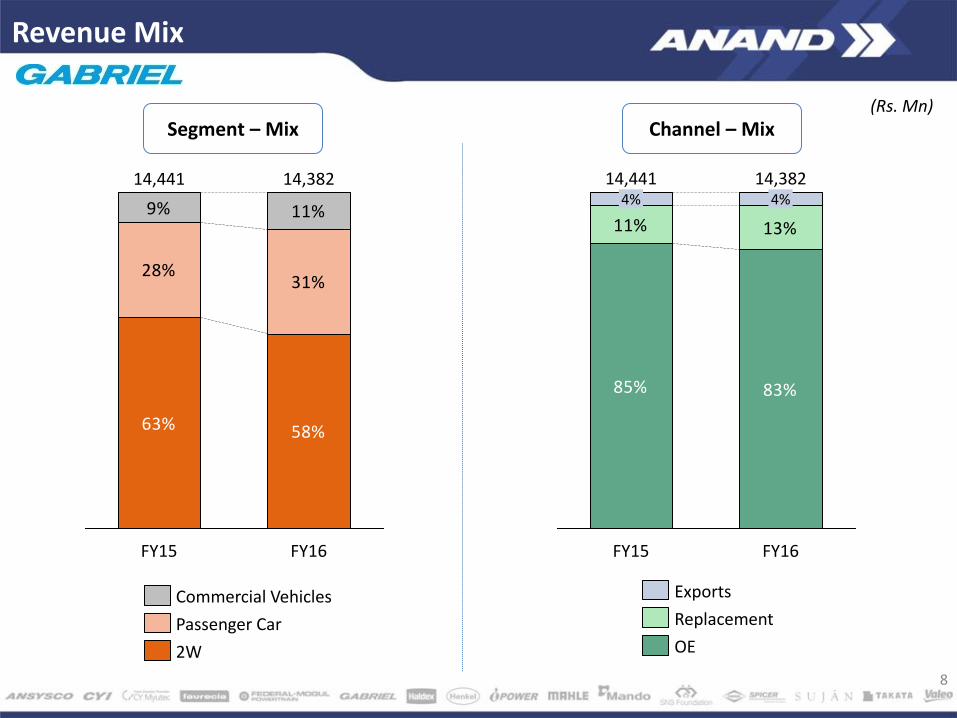
Channel – Mix Segment – Mix
Revenue Mix
63% 58%
28%31%
9% 11%
14,38214,441
FY16FY15
2W
Commercial Vehicles
Passenger Car
85% 83%
11% 13%
14,38214,441
FY15
4% 4%
FY16
Exports
Replacement
OE
(Rs. Mn)

0.5 0.5
0.75
0.85
1.05
1.2
FY11 FY12 FY13 FY14 FY15 FY16
33%32%21%15% 31%
• Continuous Dividend
since 1998
• Stable Payout Ratio
• Declared Final Dividend
of Rs. 0.75 per share,
amounting to 75% of
Face Value.
• Total Dividend of Rs.1.20
per share of Re.1 each
Dividend Per Share (Rs.)
Pay out Ratio
Improving Dividend Profile
9
23%

10
Rs. Mn FY16 % of Sales FY15 % of Sales YoY% Q4 FY16 % of Sales Q4 FY15 % of Sales YoY%
Revenue 14,382 100.0% 14,441 100.0% (0.4%) 3,662 100.0% 3,484 100.0% 5%
Raw Material 10,282 71.5% 10,434 72.3% 2,628 71.8% 2,494 71.6%
Employee Expenses* 1,150 8.0% 1,077 7.5% 279 7.6% 277 7.9%
Other Expenses 1,674 11.6% 1,762 12.2% 428 11.7% 428 12.3%
EBITDA 1,276 8.9% 1,168 8.1% 9% 326 8.9% 285 8.2% 15%
Adjusted EBITDA** 1,296 9.0% 1,168 8.1% 11% 331 9.0% 285 8.2% 16%
Other Income 42 0.3% 40 0.3% 15 0.4% 7 0.2%
Interest 25 0.2% 55 0.4% 6 0.2% 14 0.4%
Depreciation 332 2.3% 311 2.2% 81 2.2% 76 2.2%
PBT before Exceptional Item
961 6.7% 841 5.8% 14% 255 7.0% 202 5.8% 26%
Exceptional Item 6 0.0% 6 0.0% 2 0.0% 2 0.0%
PBT 955 6.6% 835 5.8% 253 6.9% 200 5.8%
Tax 203 1.4% 235 1.6% 44 1.2% 71 2.0%
PAT 752 5.2% 600 4.2% 25% 209 5.7% 130 3.7% 62%
Cash PAT 1,084 7.5% 912 6,3% 19% 290 7.9% 206 5.9% 41%
Profit & Loss Highlights
* Employee benefit expense for the year ended 31st March 2016 includes provision towards bonus of Rs. 41.12 million (including Rs. 21.71 million for theperiod 1st April 2014 to 31st March 2015) arising due to retrospective amendment of Payment of Bonus Act, 1965.
** EBITDA adjusted for one time items of royalty reversal Rs 21 million and provision towards bonus as mentioned above.
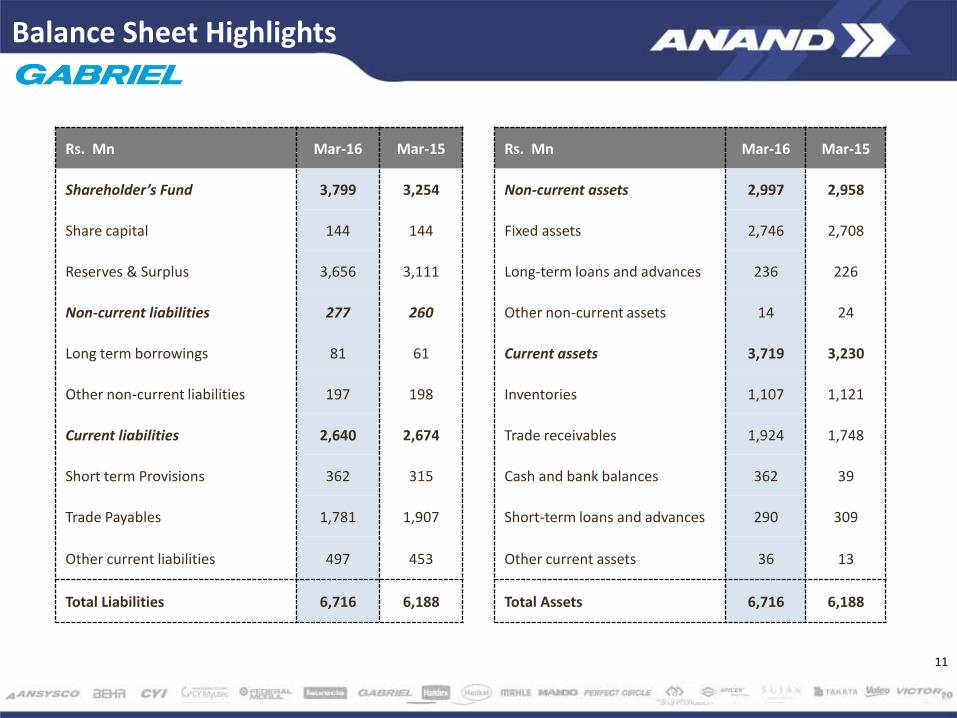
Rs. Mn Mar-16 Mar-15
Shareholder’s Fund 3,799 3,254
Share capital 144 144
Reserves & Surplus 3,656 3,111
Non-current liabilities 277 260
Long term borrowings 81 61
Other non-current liabilities 197 198
Current liabilities 2,640 2,674
Short term Provisions 362 315
Trade Payables 1,781 1,907
Other current liabilities 497 453
Total Liabilities 6,716 6,188
Rs. Mn Mar-16 Mar-15
Non-current assets 2,997 2,958
Fixed assets 2,746 2,708
Long-term loans and advances 236 226
Other non-current assets 14 24
Current assets 3,719 3,230
Inventories 1,107 1,121
Trade receivables 1,924 1,748
Cash and bank balances 362 39
Short-term loans and advances 290 309
Other current assets 36 13
Total Assets 6,716 6,188
11
Balance Sheet Highlights

12
3,6623,548
3,752
3,4193,484
Q1 FY16*
Q4 FY16**
Q3 FY16**
Q2 FY16
Q4 FY15
331350
329
283284
Q3 FY16**
Q4 FY16**
Q2 FY16
Q1 FY16*
Q4 FY15
Q1 FY16*
Q4 FY15
Q4 FY16**
8.2%
Q3 FY16**
Q2 FY16
8.8% 9.0%
9.9%
8.3%
202228
252226
255
7.0%6.4%6.7%6.7%
5.8%
50
100
150
200
250
300
0%
1%
2%
3%
4%
5%
6%
7%
Q2FY16 Q3FY16Q4FY15 Q4FY16Q1FY16
Revenue EBITDA EBITDA Margin%
PBT Before Exceptional Item & Margin (%)
Quarterly Performance Trend
(Rs. Mn)
* Adjusted for onetime write back of provision amounting to Rs.21 Million** Adjusted for the one time provision for employee benefits bonus expense of Rs 4.86 million in quarter ended March 2016 and Rs36.26 million in quarter ended December 2015 arising due to retrospective amendment of Payment of Bonus Act,1965.

13
276171 195
101 59
671
551 468
288
83
1,251
813
670
139 112
0
100
200
300
400
500
600
700
800
900
1000
1100
1200
1300
1400
Mar '12 Mar '13 Mar '14 Mar '15 Mar '16
Public Deposits Working capital Term loan Finance lease Others Total
• Company stopped accepting Public Deposits w.e.f November,2015 • Outstanding balance reduced from Rs. 101 millions to Rs. 59 millions.
Reduction in borrowings

14
Working Capital Improvement
34 33
2826
24
FY12* FY13* FY14* FY15* FY16*
Net Working Capital Days
*Debtors including Bills discounted with banks.
Company accumulated Cash Surplus of Rs 362 Millions as on 31st March 2016as a consequence of better working capital management and improved margins

15
692
396
348
388
0
100
200
300
400
500
600
700
800
FY 13 FY 14 FY 15 FY 16
Capital Expenditure Trends
Capital Expenditure (Rs. Mn)
16Head Office, Pune, India
Business Overview
17
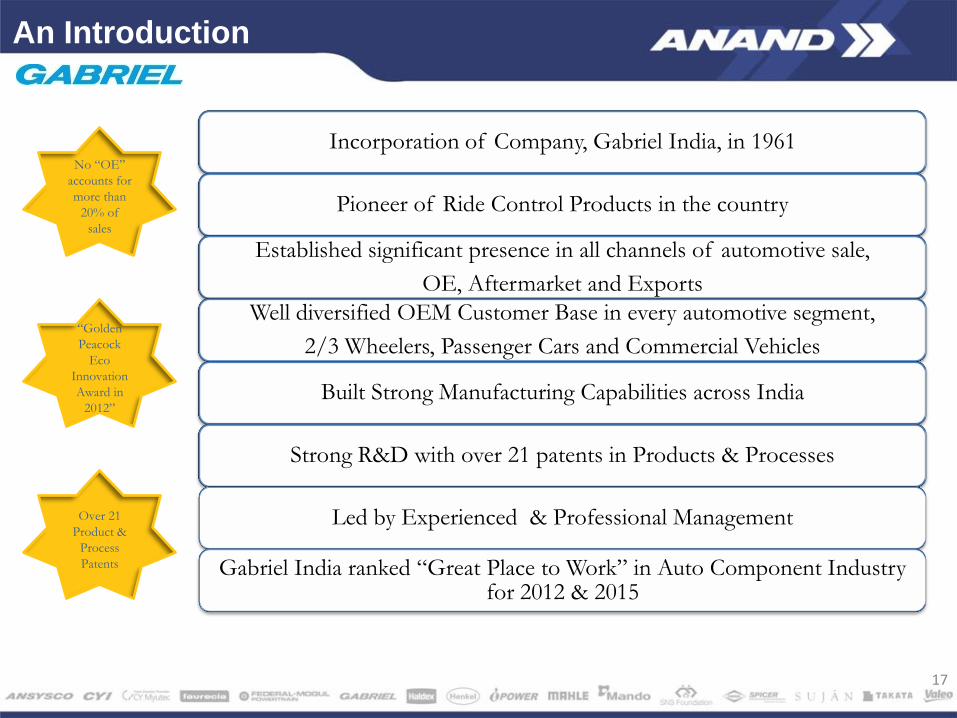
Incorporation of Company, Gabriel India, in 1961
Pioneer of Ride Control Products in the country
Established significant presence in all channels of automotive sale,
OE, Aftermarket and Exports
Well diversified OEM Customer Base in every automotive segment,
2/3 Wheelers, Passenger Cars and Commercial Vehicles
Built Strong Manufacturing Capabilities across India
Strong R&D with over 21 patents in Products & Processes
Led by Experienced & Professional Management
Gabriel India ranked “Great Place to Work” in Auto Component Industry for 2012 & 2015
No “OE”
accounts for
more than
20% of
sales
“Golden
Peacock
Eco
Innovation
Award in
2012”
Over 21
Product &
Process
Patents
An Introduction

18
Pioneer of Ride Control Products…
2/3 Wheeler
Passenger Car
Commercial Vehicle & Railways
Front Forks McPherson Struts Shock Absorbers
Hydraulic Shock Absorbers
Gas Shock Absorbers
Cartridges
Cabin Dampers
Seat DampersGas Shock Absorbers
AFTER MARKET ACROSS ALL SEGMENTS

19
Segment - Wise – FY16
Channel - Wise - FY16
Sales (Rs. Mn)
... With Diversified Revenue-Mix
6,883
9,617
11,153
11,960
12,745
14,441 14,382
FY10 FY11 FY12 FY13 FY14 FY15 FY16
2/3 Wheelers
58%
Passenger cars31%
Commercial Vehicles
11%
OE83%
Aftermarket13%
Exports4%
CAGR +13%

20
Strategic Manufacturing Footprint
Ashok LeylandHonda CarsHonda MotorcyclesICMLMaruti SuzukiSuzuki Motorcycles
SML IsuzuTata MotorsTVS MotorsYamaha India
Hindustan Motors
Ashok LeylandBharat BenzHindustan MotorsHyundai
Royal EnfieldTata MotorsToyota KirloskarTVS Motors
PiaggioSkodaVWVolvo Eicher
Bajaj AutoFIATForce MotorsGMMahindraMahindra Trucks & BusesMAN Trucks
AMWGMTata MotorsHonda Motorcycles
GIL Presence
GIL PlantsParwanoo
Khandsa
DewasSanand
Nashik
Pune
Hosur
Malur
Aurangabad
GIL Satellite Locations
* Map not to the scale
21
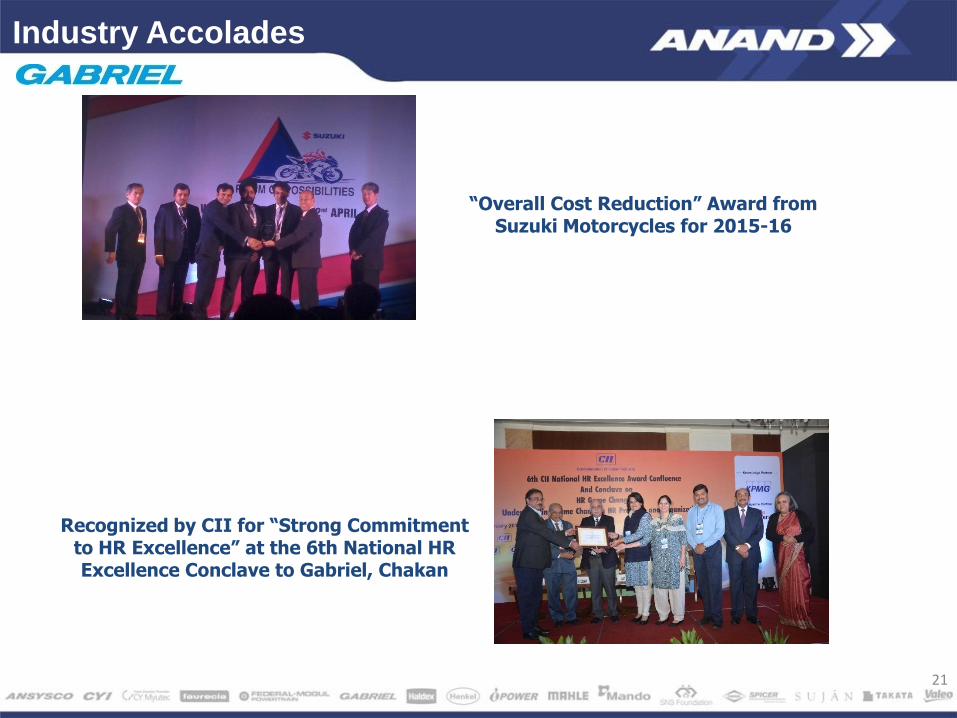
Industry Accolades
“Overall Cost Reduction” Award from Suzuki Motorcycles for 2015-16
Recognized by CII for “Strong Commitment to HR Excellence” at the 6th National HR Excellence Conclave to Gabriel, Chakan
22Head Office, Pune, India
Going Ahead
23
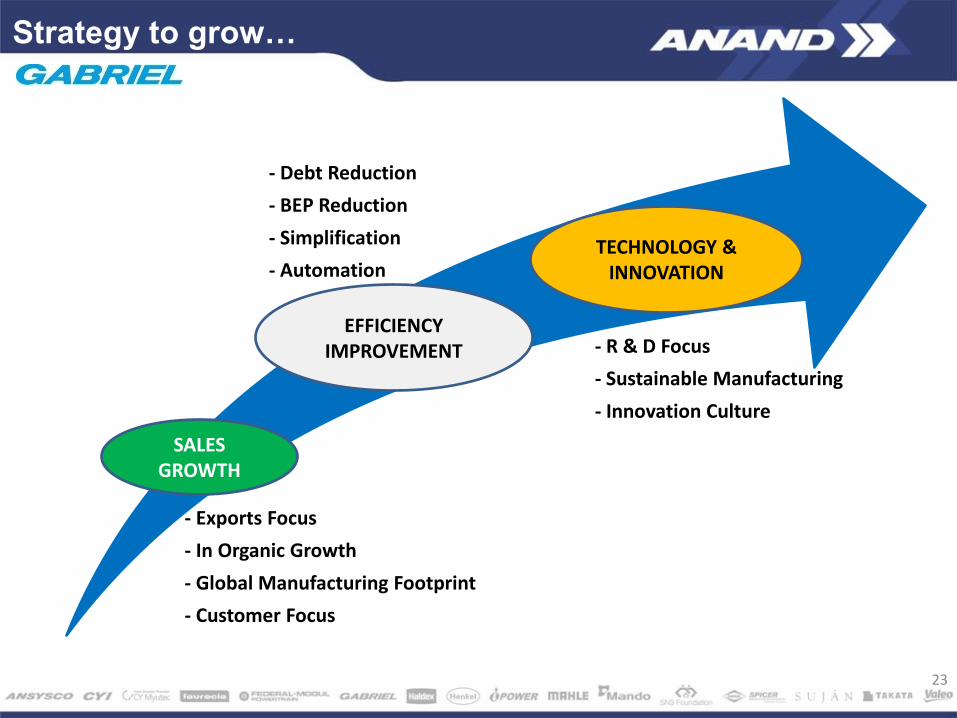
Strategy to grow…
- Exports Focus
- In Organic Growth
- Global Manufacturing Footprint
- Customer Focus
- Debt Reduction
- BEP Reduction
- Simplification
- Automation
- R & D Focus
- Sustainable Manufacturing
- Innovation Culture
SALES GROWTH
EFFICIENCY IMPROVEMENT
TECHNOLOGY & INNOVATION

24
2/3 Wheelers Passenger Cars Commercial Vehicles
SBU Structure for focused approach
• Created Strategic Business Units for each automotive segment : 2Wheelers/ 3Wheelers, Passenger
Cars & Commercial Vehicles / Railways and After-Market Channel
• To derive benefits in
• Customer & Product Focus
• Export Push
• After market expansion
Focus Area : SBU-wise
• Quality & Process
Technology
• Capacity Enhancement
• Product Innovation
• Improving Market Share
• Product Technology
• New Product
Devolvement
After-Market Presence across all business segments
…With SBU Approach
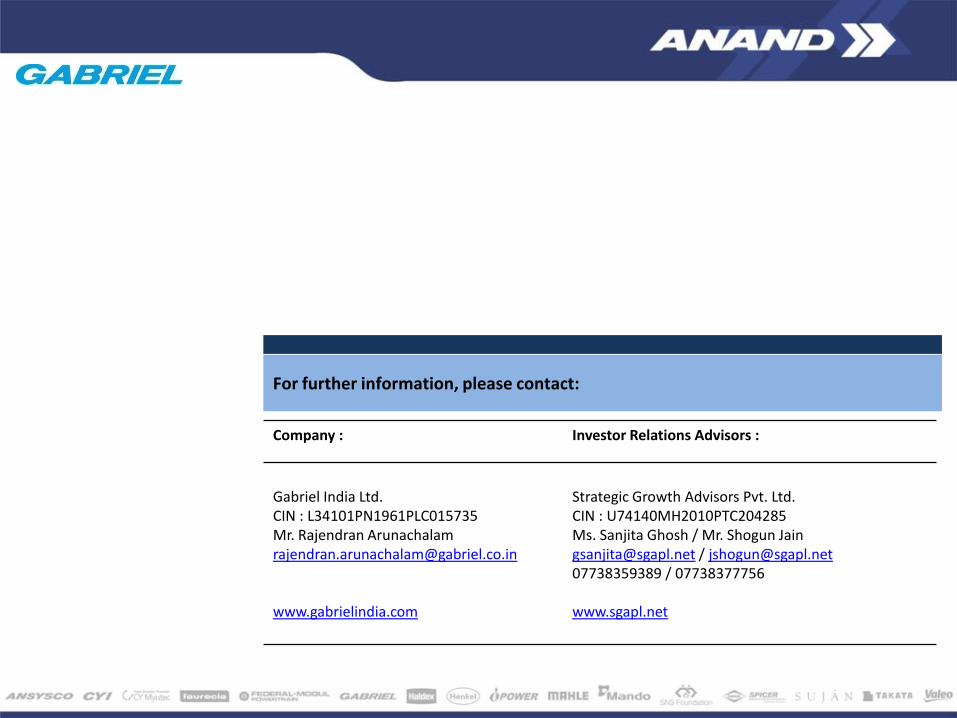
For further information, please contact:
Company : Investor Relations Advisors :
Gabriel India Ltd.CIN : L34101PN1961PLC015735Mr. Rajendran [email protected]
www.gabrielindia.com
Strategic Growth Advisors Pvt. Ltd.CIN : U74140MH2010PTC204285Ms. Sanjita Ghosh / Mr. Shogun [email protected] / [email protected] / 07738377756
www.sgapl.net


![Information security[277]](https://img.pdfslide.us/doc/110x75/58ce85891a28ab210a8b686d/information-security277.jpg)