Embed Size (px)
Citation preview
Volume 3 • Issue 5 • 1000141Hydrol Current ResISSN: 2157-7587 HYCR, an open access journal
Open AccessResearch Article
Olawoyin et al., 2012, 3:5DOI: 10.4172/2157-7587.1000141
Optimal Well Design for Enhanced Stimulation Fluids Recovery and Flow-back Treatment in the Marcellus Shale Gas Development using Integrated TechnologiesRichard Olawoyin*, Christian Madu and Khaled Enab
Petroleum and Natural Gas Engineering, The Pennsylvania State University, USA
*Corresponding author: Richard Olawoyin, Petroleum and Natural Gas Engineering, The Pennsylvania State University, University Park, PA 16802, USA, Tel: +1-213-290-8355; Fax: +1-814-863-3081; E-mail: [email protected]
Received July 20, 2012; Accepted October 29, 2012; Published October 31, 2012
Citation: Olawoyin R, Madu C, Enab K (2012) Optimal Well Design for Enhanced Stimulation Fluids Recovery and Flow-back Treatment in the Marcellus Shale Gas Development using Integrated Technologies. Hydrol Current Res 3:141. doi:10.4172/2157-7587.1000141
Copyright: © 2012 Olawoyin R et al. This is an open-access article distributed under the terms of the Creative Commons Attribution License, which permits unrestricted use, distribution, and reproduction in any medium, provided the original author and source are credited.
AbstractA typical well was designed with formation properties in Springfield Township, Bradford County, Pennsylvania
using computer modeling group (CMG) software to analyze the production potential in the area over 40 years. Multilateral wells gave the highest initial gas production rate and cumulative production of 1.18E+07 ft3/day and 2.6E+10 ft3 respectively. FracPro® software was used for the fracture design. The simulation demonstrates that hydraulic fracturing can appreciably increase cumulative production and production rate in the well, with an estimated 3.6 Million gallons (of water) per well required to fracture open the formation for the free flow of gas. Due to the efficient well design and stimulation design, a load recovery of approximately 86% of the injected fluid is achievable which amount to 73,714 bbls of waste water to be treated per stimulation job. The system capacity of the forward osmosis integrated process, operating on hydraulic fracturing flow-back water will treat 604,800 gallons per day (gal/d). The novel design takes into consideration the flow-back recovery per hour in the system, which is 600 bbl/hr for the centralized system, but 150 bbl/hr for a single well pad. The tank size required would be a 25,000 gallon tank, covering approximately 1,202 square feet and cost $52,255. The forward osmosis (FO) system uses a thin-film composite (TFC) membrane system based on efficiency and power generation capabilities. The capital cost of each system is about $100,000. The annual operating cost of the FO system would be about $ 0.60/kgal of produced water. A cost estimate savings of over one million dollars ($1,000,000) is expected if the integrated forward osmosis system is implemented. Aside cost savings, the emission generated from the system is minimal, which makes it considerably environmentally friendly compared to other types of treatments.
IntroductionThe advent of intensified exploration and production in the
Marcellus Shale has brought benefits and challenges to the area. An enormous investment is being made in developing extraction technologies to effectively recover natural gas from tight formations that is very low permeability [1]. Directional drilling technologies alongside hydraulic fracturing have made formations once considered uneconomical, an investor’s hub. The combination of directional drilling and hydraulic fracturingis quintessential in accessing the pay zone efficiently and also creating a network of fractures in the formation, which enables an optimal recovery of the reservoir fluid [2,3]. Wells are enhanced considerably using the hydraulic fracturing method, especially in the Marcellus Shale with an estimated 516 trillion cubic feet (TCF) of gas in place [4]. This capacity makes the Marcellus Shale economically important to the world’s strategic energy prospects. Several analyst have made different estimates of the gas reserves in the Marcellus Shale, with new studies, more accurate estimates are possible in the near future. At present the formation is estimated to contain approximately 1,307 TCF [5] Activities in the region have increased exponentially, triggering a queue of investors eager to take part in the booming energy venture. Towards this end, there has been a huge capital intensive investment in the Marcellus Shale by some international energy firms in developing productive fields, providing advanced technology and in the exploration of the natural resource of interest (gas). Details on the activities involving shale gas developments have been resented in other literatures [6-14]. The waste generated due to increasing exploration remains a problem [15-17], there are constraints in form of regulations that demand that the waste water be treated before re injected into the natural flow. This paper presents a reservoir simulation identifying the most prolific drilling design and also provides cost effective solution to tackling the problem of water usage for hydraulic fracturing purposes, load recovery (flow-back), waste water treatment and energy consumption.
Background Analysis: Reservoir SimulationWith the goal of reducing the impact of drilling in the Marcellus
shale area, several directional wells were designed using CMG to identify the most suitable well design (within a 640 acres area) with the least environmental impact and highest recovery. The reservoir properties used was from one of the most prolific areas in the Marcellus Shale, in the Bradford County (Table 1).
Single horizontal well
One horizontal well (1440ft) was designed with 8710 ft total depth (TD) (Figure1) from the surface and deviated depth (DD) of 90ft vertically into the reservoir. For a 40 year CMG pressure profile, the pressure distribution as represented in figure 1b shows that the steady production or gas recovery begins at (3.5E+06) ft3/day as shown in figure 2a, with cumulative gas production of 6.2E+09 ft3 (Figure 2b). This model suggests that though substantial amount of gas can be produced but a single well is insufficient for optimal production and footprint reduction.
HydrologyCurrent Research
Hyd
rolog
y: Current Research
ISSN: 2157-7587

Citation: Olawoyin R, Madu C, Enab K (2012) Optimal Well Design for Enhanced Stimulation Fluids Recovery and Flow-back Treatment in the Marcellus Shale Gas Development using Integrated Technologies. Hydrol Current Res 3:141. doi:10.4172/2157-7587.1000141
Page 2 of 10
Volume 3 • Issue 5 • 1000141Hydrol Current ResISSN: 2157-7587 HYCR, an open access journal
Well-1
Well-1
0.00 810.00 25
Figure 1: a) Horizontal well designed in the Marcellus Shale. b) Pressure distribution for 1 horizontal well: 40 years profile.
Well-1 horizontal.irf Well-1 horizontal.irf
Gas
Rat
e SC
(ft3
/day
)
Wel
l Blo
ck P
ress
ure
(psl
)
Cum
ulat
ive
Gas
SC
(ft3
)
Time (Date)
Gas Rate SCWell Block Pressure
4.00e+6
300e+6
2.00e+6
1.00e+6
0.00e+0
8.00e+9
600e+9
4.00e+9
2.00e+9
0.00e+02020 2030 2040 2050 2060 2020 2030 2040 2050 2060
5,000
4,000
3,000
2,000
1,000
0
Figure 2: a) Gas production rate vs. Time for a single horizontal well. b) Cumulative gas production vs. time for a single horizontal well.
Well-1 dual.irf Well-1 dual.irf
Gas
Rat
e SC
(ft3
/day
)
Wel
l Blo
ck P
ress
ure
(psl
)
Cum
ulat
ive
Gas
SC
(ft3
)
6.00e+6
5.00e+6
4.00e+6
3.00e+6
2.00e+6
1.00e+6
0.00e+0
5,000
4,000
3,000
2,000
1,000
0
Time (Date)Time (Date)
Gas Rate SCWell Block Pressure
2020 2030 2040 2050 20602020 2030 2040 2050 2060
1.00e+10
8.00e+9
6.00e+9
4.00e+9
2.00e+9
0.00e+0
6.00e+6
5.00e+6
4.00e+6
3.00e+6
2.00e+6
1.00e+6
0.00e+0
Figure 3: a) Gas production rate vs. time for dual horizontal well. b) Cumulative gas production vs. time for dual horizontal well.

Citation: Olawoyin R, Madu C, Enab K (2012) Optimal Well Design for Enhanced Stimulation Fluids Recovery and Flow-back Treatment in the Marcellus Shale Gas Development using Integrated Technologies. Hydrol Current Res 3:141. doi:10.4172/2157-7587.1000141
Page 3 of 10
Volume 3 • Issue 5 • 1000141Hydrol Current ResISSN: 2157-7587 HYCR, an open access journal
Multilateral horizontal wells
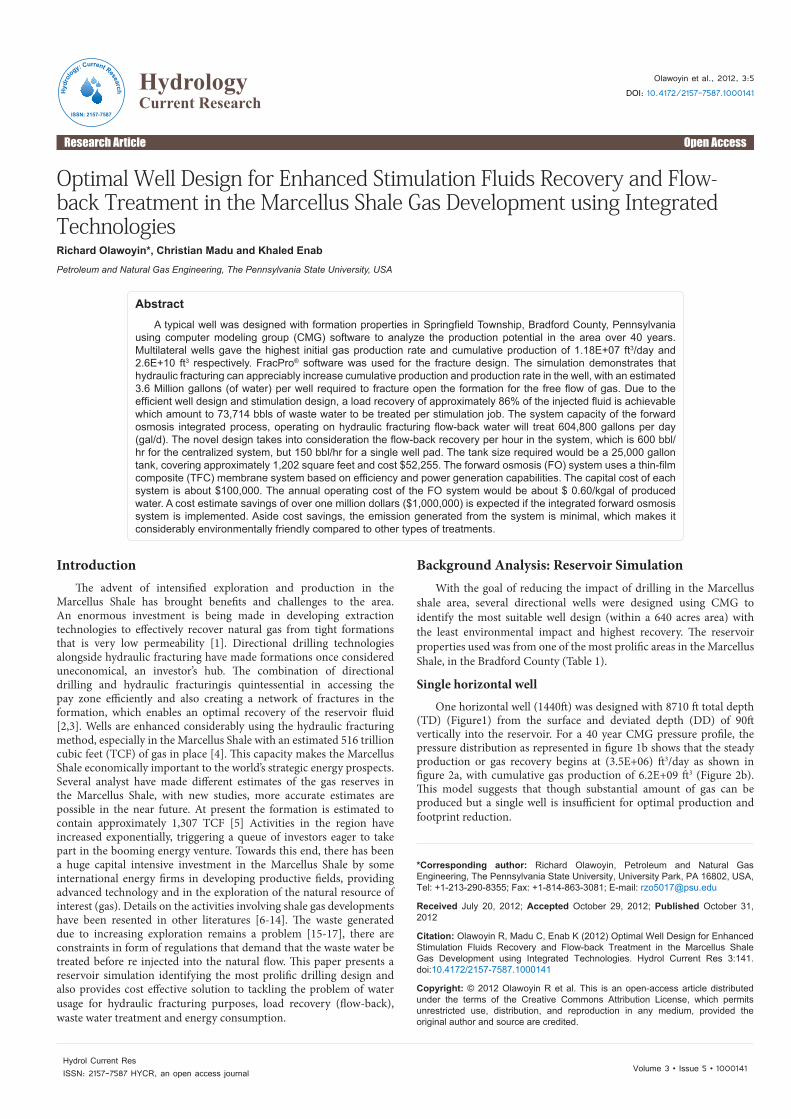
Simulating a dual horizontal well with the same TD and DD as the single horizontal well, the gas rate will be 5.1E+06 ft3/day and the cumulative gas production of 9.7E+09 ft3 as seen in figures 3a and 3b respectively. Illustrated in figures 4a and 4b are the reservoir pressure profile, or the extent of pressure disturbance, around the well bore after a period of 40 years and the well designs respectively. The profile shows steady production indicating that a dual horizontal well gives better results in both design and production profile than the single horizontal well. Other designs considered in this studyinclude;the dual horizontal wells with distance, as shown in figures 5a and 5b,which shows the gas production rate and cumulative gas production over a period of 40 years. The two horizontal wells were designed at opposing angles and at variable depths (30 ft apart) both wells are within the pay zone. The production profile is enhanced with more gas produced than the single and conventional dual horizontal wells.
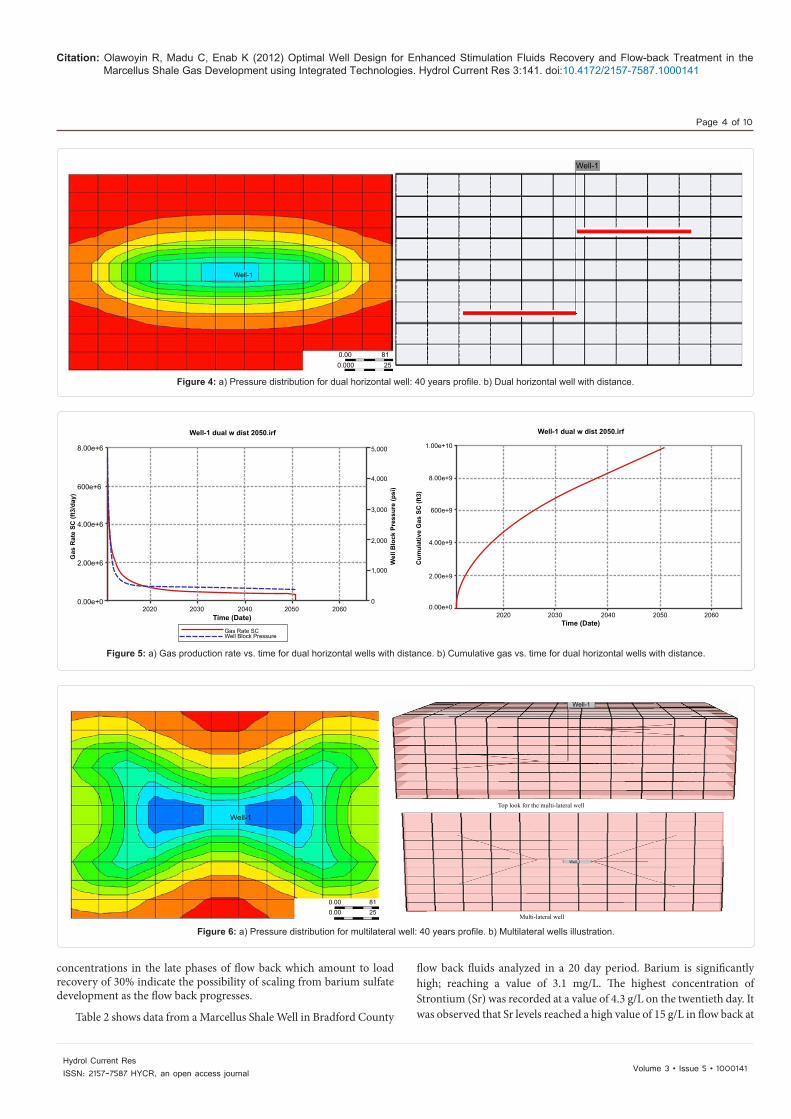
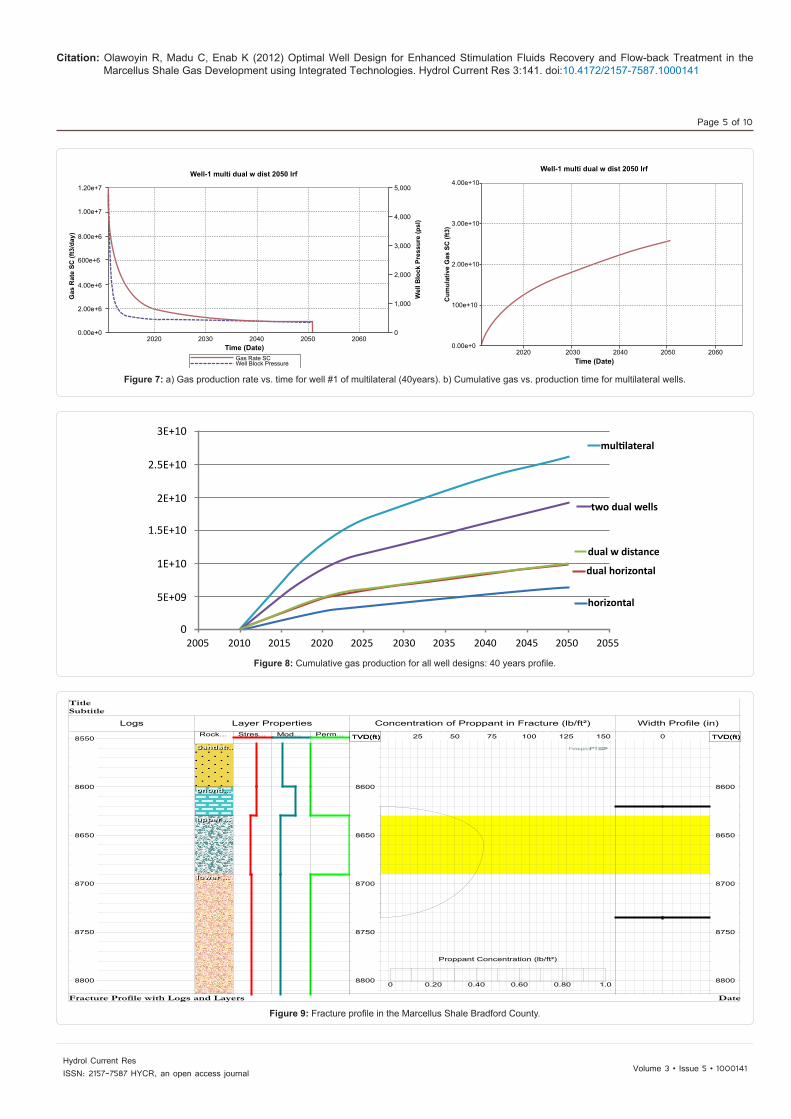
Multilateral wells pressure distribution profile and design as shown in figures 6a and 6b respectively illustrate a wider coverage of the reservoir. The gas production rate begins at 1.18 E+07 ft3/day as shown in figure 7a, while the cumulative gas production was estimated as 2.6 E+10 ft3as shown in figure 7b. There is a significant improvement in the flow rate and cumulative recovery rate from the multilateral well simulation design with higher productivity. The main objective is to identify the best well design that will require the least number of surface wells and also have the capability to drain the same area effectively as shown in the comparative cumulative gas production profile for all the well designs (Figure 8). Selecting the multilateral well design will reduce surface disturbance, while the entire reservoir is effectively drained over time. In this study, we have presented the optimal well design for the purpose of understanding the fluid requirements for the well drilling and completion.
Environmental Management of Process FluidsThe use of silicate drilling fluid gives good results as water based
drilling mud (WBM) due to the high penetration rate, most favorable inhibition characteristics, and high solids discharge performance, less trouble time, least environmental impact and better wellbore integrity. Bentonite cement gives good results in the Marcellus shale since it reduces slurry cost and facilitates in the decrease in the cement thickening time [18].
Stimulation techniques and fluid recovery
Well stimulation methods have progressed with the development of unconventional reservoirs due to the profitable possibility of unconventional field exploration. Success depends mostly on efficient stimulation of rocks with permeability ranging from 10 to 100 nanodarcies [19]. The potential for Shale gas has become very important in the energy market. The stimulation process has continued to improve in time through advanced innovation [3]. Conversely, the most feasible technique employed in stimulating the well (hydraulic fracturing method) has aroused a lot of attention since its use became predominant in the region. As part of the process, the technique generates huge amount of chemically contaminated water from the sub surface. Hence, it has become imperative to look for ways in curtailing the utilization of water resource and also develop better methods of flow back recovery.
The Hydraulic fracturing process
Hydraulic fracturing entails the perforation of the shale rock at depth with a perforating gun and subsequently injecting high pressured water inside the well bore, this then generate setof fractures in the rock shale and widens fractures present prior to the stimulation. The prime function of well stimulation in shale reservoirs is to expand the radiusof the drainage by generating lengthy fractures that intersect natural fractures thus setting up a flow channel network for the gas towards the wellbore, by which the stimulated reservoir volume (SRV) is maximized [20]. Figure 9 shows a typical fracture design profile for the Marcellus Shale a Bradford County, Pennsylvania.
This increases the permeability and enhances production from the formation. This process is a function of pressure and permeability, as fluid is pumped into the formation at high pressure, the blocks nearest to the well bore experiences breakage and fractures are created, which improves the permeability. Slick water (approximately 98% water) is the preferred fluid for stimulation in low-permeability reservoirs, and it is also the principal tool in breaching tight formations in unconventional plays provided there is viable water accessibility [21]. Precipitation in the area (Appalachian) is approximately 43 inches per year, compared to the other parts of the continental United States that receive about 10 inches [22]. Additionally, there are other several available water sources which may include, municipal water, rivers, ponds, lakes cited close to the Marcellus shale area, therefore the use of slick water for the hydraulic fracture process has proven to be the most cost effective and convenient At the end of the hydraulic fracturing well stimulation treatment, some of the injected fluids in the formation will flow into the well and to the well head, since the pumping pressure has been eliminated [23]. It is important for this flow back water to be recovered because the continuous presence of the fluid would block the free passage of the natural gas through the propped fractures. The composition of the fracturing fluid changes once it has had contact with the reservoir rocks, due to contamination and dissolution of several other minerals in the formation. It has been estimated that in the Marcellus Shale area, 35% of the fracturing fluid is recovered as flow back fluids. This is not economically beneficial to operators since more volume of fresh water would be required for successive stimulation stages [24]. In other Shale plays however, the recovery rate has been estimated to be between 30%-70% [23]. Consequently, increasing the recovery rate of flow back fluids would minimize the need for more fresh water and also reduce the general impact of shale gas drilling in the area. A load recovery of about 86 % of the pump in fluid is attainable with the fracture design which amount to 73,714 bbl.
Nature of flow back water
Several reviews have attempted to capture the mineralogy, composition, environmental impact and existing practices related to the use and the management of flow back fluids in unconventional and conventional gas fields [25].
Total dissolved solids (TDS) which is the amount of soluble salts flow back fluid varies from about 20 mg/l to about 200,000 mg/l, representing a salt content of above 20% in the Marcellus Shale. The salt content at locations is dependent on several factors ranging from the composition of the formation to variations to natural conditions in the formation and also the tendency for the fracturing fluid to flow through the formation.
The level of dissolved components rises while the pH and alkalinity decreases as flow back advanced. Sodium and calcium exhibit analogous patterns in the developed wells. This is prone to sulfate scaling as the amount of calcium rises while sulfate drops. A sharp increase in barium
Citation: Olawoyin R, Madu C, Enab K (2012) Optimal Well Design for Enhanced Stimulation Fluids Recovery and Flow-back Treatment in the Marcellus Shale Gas Development using Integrated Technologies. Hydrol Current Res 3:141. doi:10.4172/2157-7587.1000141
Page 4 of 10
Volume 3 • Issue 5 • 1000141Hydrol Current ResISSN: 2157-7587 HYCR, an open access journal
concentrations in the late phases of flow back which amount to load recovery of 30% indicate the possibility of scaling from barium sulfate development as the flow back progresses.
Table 2 shows data from a Marcellus Shale Well in Bradford County
flow back fluids analyzed in a 20 day period. Barium is significantly high; reaching a value of 3.1 mg/L. The highest concentration of Strontium (Sr) was recorded at a value of 4.3 g/L on the twentieth day. It was observed that Sr levels reached a high value of 15 g/L in flow back at
0.00 810.000 25
Well-1
Well-1
Figure 4: a) Pressure distribution for dual horizontal well: 40 years profile. b) Dual horizontal well with distance.
Well-1 dual w dist 2050.irf Well-1 dual w dist 2050.irf
Gas
Rat
e SC
(ft3
/day
)
Wel
l Blo
ck P
ress
ure
(psi
)
Cum
ulat
ive
Gas
SC
(ft3
)
Time (Date)Time (Date)
Gas Rate SCWell Block Pressure
8.00e+6
600e+6
4.00e+6
2.00e+6
0.00e+0
1.00e+10
8.00e+9
600e+9
4.00e+9
2.00e+9
0.00e+02020 2030 2040 2050 20602020 2030 2040 2050 2060
5,000
4,000
3,000
2,000
1,000
0
Figure 5: a) Gas production rate vs. time for dual horizontal wells with distance. b) Cumulative gas vs. time for dual horizontal wells with distance.
Well-1
Well-1
Top look for the multi-lateral well
Multi-lateral well
Well-1
0.00 810.00 25
Figure 6: a) Pressure distribution for multilateral well: 40 years profile. b) Multilateral wells illustration.
Citation: Olawoyin R, Madu C, Enab K (2012) Optimal Well Design for Enhanced Stimulation Fluids Recovery and Flow-back Treatment in the Marcellus Shale Gas Development using Integrated Technologies. Hydrol Current Res 3:141. doi:10.4172/2157-7587.1000141
Page 5 of 10
Volume 3 • Issue 5 • 1000141Hydrol Current ResISSN: 2157-7587 HYCR, an open access journal
Well-1 multi dual w dist 2050 lrf Well-1 multi dual w dist 2050 lrf
Time (Date)
Time (Date)
Gas
Rat
e SC
(ft3
/day
)
Wel
l Blo
ck P
ress
ure
(psl
)
Cum
ulat
ive
Gas
SC
(ft3
)
Gas Rate SCWell Block Pressure
1.20e+7
1.00e+7
8.00e+6
600e+6
4.00e+6
2.00e+6
0.00e+02020 2030 2040 2050 2060
2020 2030 2040 2050 2060
5,000
4,000
3,000
2,000
1,000
0
4.00e+10
3.00e+10
2.00e+10
100e+10
0.00e+0
Figure 7: a) Gas production rate vs. time for well #1 of multilateral (40years). b) Cumulative gas vs. production time for multilateral wells.
2005 2010 2015 2020 2025 2030 2035 2040 2045 2050 2055
3E+10
2.5E+10
2E+10
1.5E+10
1E+10
5E+09
0
multilateral
two dual wells
dual w distance
dual horizontal
horizontal
Figure 8: Cumulative gas production for all well designs: 40 years profile.
SubtitleTitle
Fracture Profile with Logs and Layers Date
8550
8600
8650
8700
8750
8800
LogsRock... Stres... Mod... Perm...
Layer Properties
Sandst...Sandst...
onond...onond...
upper ...upper ...
lower ...lower ...
8600
8650
8700
8750
8800
25 50 75 100 125 150
Concentration of Proppant in Fracture (lb/ft²)
TVD(ft)TVD(ft)
0 0.20 0.40 0.60 0.80 1.0
Proppant Concentration (lb/ft²)
8600
8650
8700
8750
8800
0
Width Profile (in)
TVD(ft)TVD(ft)
Figure 9: Fracture profile in the Marcellus Shale Bradford County.

Citation: Olawoyin R, Madu C, Enab K (2012) Optimal Well Design for Enhanced Stimulation Fluids Recovery and Flow-back Treatment in the Marcellus Shale Gas Development using Integrated Technologies. Hydrol Current Res 3:141. doi:10.4172/2157-7587.1000141
Page 6 of 10
Volume 3 • Issue 5 • 1000141Hydrol Current ResISSN: 2157-7587 HYCR, an open access journal
other locations in the Marcellus Shale wells. Potassium concentrations area about 5 g/L at 20 days.
Asthe chemical composition of Marcellus flow back water varies dependent upon the well location and elapsed time since the fracture was completed, the results in table 1 are typical of flow back recoveries in the Marcellus Shale. The concentration of brine in the flow back increases with time and reaches the optimum, at this point; the flow back will have a steady decline in the concentration of brine as the well production continues.
Method and Design: Forward OsmosisForward Osmosis (FO) is a distinctive and developing technology
which treats waste water and necessitates no energy to pressure the flow through the membrane system, thereby eliminating the need for huge energy requirement. A draw solution is employed across the alternate side of the membrane to drive a high osmotic pressure generating the pressure gradient than the other side of the membrane which contains the waste stream [26].
It is essential that the solute such as sodium chloride (NaCl), used as the draw solution is usable with the waste water, in other to generate pure brine. Ammonium (NH3)-carbon dioxide (CO2) gas mixture can also be used. It can be removed from the solution comparatively easily [27]. The FO system functions effectively without the need of an applied hydraulic pressure. Other advantages include the low tendency for membrane fouling compared to the Reverse Osmosis (RO) systems, and a high rate of contaminants rejection [28,29]. It has been proven that it removes 97-99 percent of salts and heavy metals from waste water and it is also effective in rejecting viruses, bacteria and other colloidal solids with a 100 percent success rate [30].
The rate of energy that facilitates water flow, P is shown in equation 1. = ∆ΠP q (1)
Water flux through a membrane is represented as q, while the pressure difference on the membrane is represented as ∆π [29]. The pressure difference can be further defined as the difference in the draw solution’s osmotic energy and that of the feed. This is illustrated in equation 2 [29].
∆Π = Π −ΠDS feed (2)
∏DS is the draw solution osmotic pressure, measured in Pascal (Pa) while ∏feed is feed’s osmotic pressure (of water) in Pa. Equation 3 explains the water passage in the osmotic process.
σ= ∆Π −∆( )WJ A P (3)
JW is the flux of water, while A stands for the membrane water permeability, σ represents reflection coefficient, the applied pressure is represented as ∆P [31].
Draw solution
The Forward Osmosis process does not require to be pressured in order for the flow to be activated. Instead on the permeate section of the membrane, concentrated draw solution drive the flow due to concentration difference [32]. The application of this design process has been extensively studied and reported in related reports [27]; components of an efficient draw solution have also been elaborated [26].
Ideal draw solutions such as ammonia and carbon dioxide were identified as very effective, since they have high solubility as gases and are cost effectively separated from water by modest heating distillation [26].
BRINE
Initial flowbackwater tank
4 in
ches
Wastewaterfrom well
20 feet
8 fe
et
PowerStorage
Fresh Water
Wastewater Thermolyticmixture
3 inches3 inches 2 inches
2 inches2 inches
2 in
ches
2 in
ches
Ther
mol
ytic
mix
ture
turb
ine
Heat
Draw solution (NH3CO3)
Figure 10: Components and flow process outline of the centralized water treatment facility.
Citation: Olawoyin R, Madu C, Enab K (2012) Optimal Well Design for Enhanced Stimulation Fluids Recovery and Flow-back Treatment in the Marcellus Shale Gas Development using Integrated Technologies. Hydrol Current Res 3:141. doi:10.4172/2157-7587.1000141
Page 7 of 10
Volume 3 • Issue 5 • 1000141Hydrol Current ResISSN: 2157-7587 HYCR, an open access journal
FO membrane selections
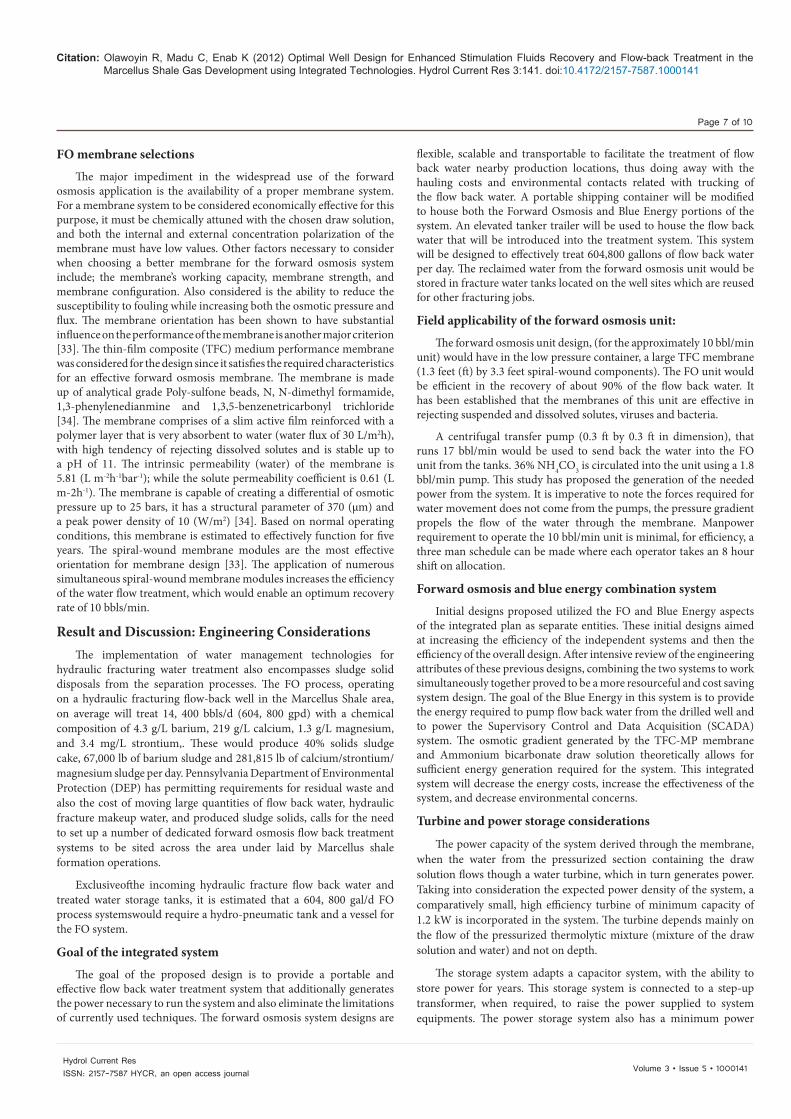
The major impediment in the widespread use of the forward osmosis application is the availability of a proper membrane system. For a membrane system to be considered economically effective for this purpose, it must be chemically attuned with the chosen draw solution, and both the internal and external concentration polarization of the membrane must have low values. Other factors necessary to consider when choosing a better membrane for the forward osmosis system include; the membrane’s working capacity, membrane strength, and membrane configuration. Also considered is the ability to reduce the susceptibility to fouling while increasing both the osmotic pressure and flux. The membrane orientation has been shown to have substantial influence on the performance of the membrane is another major criterion [33]. The thin-film composite (TFC) medium performance membrane was considered for the design since it satisfies the required characteristics for an effective forward osmosis membrane. The membrane is made up of analytical grade Poly-sulfone beads, N, N-dimethyl formamide, 1,3-phenylenedianmine and 1,3,5-benzenetricarbonyl trichloride [34]. The membrane comprises of a slim active film reinforced with a polymer layer that is very absorbent to water (water flux of 30 L/m2h), with high tendency of rejecting dissolved solutes and is stable up to a pH of 11. The intrinsic permeability (water) of the membrane is 5.81 (L m-2h-1bar-1); while the solute permeability coefficient is 0.61 (L m-2h-1). The membrane is capable of creating a differential of osmotic pressure up to 25 bars, it has a structural parameter of 370 (μm) and a peak power density of 10 (W/m2) [34]. Based on normal operating conditions, this membrane is estimated to effectively function for five years. The spiral-wound membrane modules are the most effective orientation for membrane design [33]. The application of numerous simultaneous spiral-wound membrane modules increases the efficiency of the water flow treatment, which would enable an optimum recovery rate of 10 bbls/min.
Result and Discussion: Engineering ConsiderationsThe implementation of water management technologies for
hydraulic fracturing water treatment also encompasses sludge solid disposals from the separation processes. The FO process, operating on a hydraulic fracturing flow-back well in the Marcellus Shale area, on average will treat 14, 400 bbls/d (604, 800 gpd) with a chemical composition of 4.3 g/L barium, 219 g/L calcium, 1.3 g/L magnesium, and 3.4 mg/L strontium,. These would produce 40% solids sludge cake, 67,000 lb of barium sludge and 281,815 lb of calcium/strontium/magnesium sludge per day. Pennsylvania Department of Environmental Protection (DEP) has permitting requirements for residual waste and also the cost of moving large quantities of flow back water, hydraulic fracture makeup water, and produced sludge solids, calls for the need to set up a number of dedicated forward osmosis flow back treatment systems to be sited across the area under laid by Marcellus shale formation operations.
Exclusiveofthe incoming hydraulic fracture flow back water and treated water storage tanks, it is estimated that a 604, 800 gal/d FO process systemswould require a hydro-pneumatic tank and a vessel for the FO system.
Goal of the integrated system
The goal of the proposed design is to provide a portable and effective flow back water treatment system that additionally generates the power necessary to run the system and also eliminate the limitations of currently used techniques. The forward osmosis system designs are
flexible, scalable and transportable to facilitate the treatment of flow back water nearby production locations, thus doing away with the hauling costs and environmental contacts related with trucking of the flow back water. A portable shipping container will be modified to house both the Forward Osmosis and Blue Energy portions of the system. An elevated tanker trailer will be used to house the flow back water that will be introduced into the treatment system. This system will be designed to effectively treat 604,800 gallons of flow back water per day. The reclaimed water from the forward osmosis unit would be stored in fracture water tanks located on the well sites which are reused for other fracturing jobs.
Field applicability of the forward osmosis unit:
The forward osmosis unit design, (for the approximately 10 bbl/min unit) would have in the low pressure container, a large TFC membrane (1.3 feet (ft) by 3.3 feet spiral-wound components). The FO unit would be efficient in the recovery of about 90% of the flow back water. It has been established that the membranes of this unit are effective in rejecting suspended and dissolved solutes, viruses and bacteria.
A centrifugal transfer pump (0.3 ft by 0.3 ft in dimension), that runs 17 bbl/min would be used to send back the water into the FO unit from the tanks. 36% NH4CO3 is circulated into the unit using a 1.8 bbl/min pump. This study has proposed the generation of the needed power from the system. It is imperative to note the forces required for water movement does not come from the pumps, the pressure gradient propels the flow of the water through the membrane. Manpower requirement to operate the 10 bbl/min unit is minimal, for efficiency, a three man schedule can be made where each operator takes an 8 hour shift on allocation.
Forward osmosis and blue energy combination system
Initial designs proposed utilized the FO and Blue Energy aspects of the integrated plan as separate entities. These initial designs aimed at increasing the efficiency of the independent systems and then the efficiency of the overall design. After intensive review of the engineering attributes of these previous designs, combining the two systems to work simultaneously together proved to be a more resourceful and cost saving system design. The goal of the Blue Energy in this system is to provide the energy required to pump flow back water from the drilled well and to power the Supervisory Control and Data Acquisition (SCADA) system. The osmotic gradient generated by the TFC-MP membrane and Ammonium bicarbonate draw solution theoretically allows for sufficient energy generation required for the system. This integrated system will decrease the energy costs, increase the effectiveness of the system, and decrease environmental concerns.
Turbine and power storage considerations
The power capacity of the system derived through the membrane, when the water from the pressurized section containing the draw solution flows though a water turbine, which in turn generates power. Taking into consideration the expected power density of the system, a comparatively small, high efficiency turbine of minimum capacity of 1.2 kW is incorporated in the system. The turbine depends mainly on the flow of the pressurized thermolytic mixture (mixture of the draw solution and water) and not on depth.
The storage system adapts a capacitor system, with the ability to store power for years. This storage system is connected to a step-up transformer, when required, to raise the power supplied to system equipments. The power storage system also has a minimum power

Citation: Olawoyin R, Madu C, Enab K (2012) Optimal Well Design for Enhanced Stimulation Fluids Recovery and Flow-back Treatment in the Marcellus Shale Gas Development using Integrated Technologies. Hydrol Current Res 3:141. doi:10.4172/2157-7587.1000141
Page 8 of 10
Volume 3 • Issue 5 • 1000141Hydrol Current ResISSN: 2157-7587 HYCR, an open access journal
25,000 Gal Flow BackWater Storage
Brine
Pump
PowerStorage
Turbine
Scada Sensor
Valve: Scada SensorControlled
ReclaimWater
30-36 Feet
3 In
Pip
e
2 In Pipe
3 In Pipe
4 In Pipe
2 In Pipe 2 In Pipe
% In Pipe2 In Pipe
1 In Pipe
2 In PipeFlow
Bac
k W
ater
Pum
ped
from
Wel
ls
Low Pressure Recirculation Vessel
Reboiler
7 Fe
et
4 Feet
Pump
Concentrated DrawSolution (NH4HCO3)
H20 NH4CO3
Forward Osmosis Unit
Return tubefor NH4 andCO2 Gases
VaccumDistulationColumn
SCADAMonitoring
System
Flow
Bac
k W
ater
TFC
Mem
bran
e
Figure 11: Schematic engineering representation of the centralized forward osmosis water treatment facility.
Flow Back Water Storage Tank
Forward Osmosis Centralized Water Treatment Unit
Brine Storage
Flow Back WaterPumped From Wells
Reclaim Water Storage
Figure 12: Generalized footprint-novel centralized forward osmosis water treatment facility.
Citation: Olawoyin R, Madu C, Enab K (2012) Optimal Well Design for Enhanced Stimulation Fluids Recovery and Flow-back Treatment in the Marcellus Shale Gas Development using Integrated Technologies. Hydrol Current Res 3:141. doi:10.4172/2157-7587.1000141
Page 9 of 10
Volume 3 • Issue 5 • 1000141Hydrol Current ResISSN: 2157-7587 HYCR, an open access journal
capacity of 1.2 kW.
System Overview
The proposed design is a novel centralized flow back water treatment facility. This system will be semi-portable to reduce the costs and environment impacts associated with current methods of flow back water treatment of wells in the Marcellus Shale region and other Shale plays. The system will be scaled to treat 604,800 gpd (gallons per day) A Supervisory Control and Data Acquisition (SCADA) system will be utilized to maintain the optimal flow rate of 10 bbl/min of treated water.
The solids separated from the reclaimed water will be contained in a separate tank that can be transported from storage to the market. The treated water will be housed in a separate area. This treated water can be reused in future well fracture operations, sold or can be returned to the environment since it will meet/exceed standards enacted by the Environmental Protection Agency (EPA). Figure 10 shows comprehensively the components of the system and the interconnections that explains the workability of the entire system. The engineering design schematic is presented in figure 11 which illustrates an overview of the most important features of the integrated system design, from the flow back well to the reclaimed water. Forward Osmosis is the most effective flow back water treatment method because it does not require pretreatment of the flow back water and also there is no substantial power requirement in the system, this makes the entire system, environmentally friendly. Forward osmosis has the least carbon signature compared to other flow back water treatment methods that were considered for the flow back water treatment facility which is overly represented in figure 12.
System housing selection
A steel portable shipping container will be used to house the entire system consisting of the Forward Osmosis Unit, Blue Energy generation components and SCADA systems. This proposed design will utilize a 40 foot Dual Insulated Dry Goods Shipping Cargo Container with the dimensions 40 ftL×8 ftH×8 ftW. A Dual Insulated Dry Goods Shipping Cargo Container was the ideal housing unit since modified containers are readily available. The estimated price for the 40 ft shipping container and chassis is 7,000 USD including modifications. The Forward Osmosis and Blue Energy systems would be housed within 30-36 ft of the available 40 ft of the Dual Insulated Dry Goods Shipping Cargo Container. The reaming 4-10 ft of available length will be used to house the main components of the SCADA system and other miscellaneous components. The container will need separate insulation considerations for the Forward Osmosis process and for SCADA system. The Forward Osmosis system section of the container must be insulated to prevent the liquids in the system from freezing and to reduce the costs associated with heating required for the separation of the draw solute from the treated water. The SCADA section of the container must be insulated and vented to prevent the computer components from overheating in the warmer periods of operation. During the cooler periods, the
computer components will generate enough heat to prevent failure. Anti-Slip mats will be installed within the Dual Insulated dry Goods Shipping Cargo Container to reduce the likelihood that any human operator would slip due to liquids on the floor. Shatterproof fluorescent lights will be installed in both the Forward Osmosis section and SCADA section of the container. The lights will be installed mainly for maintenance operations. This container will be housed upon a trailer designed to house and haul shipping containers by semi trucks. This elevation also allows for housing a container to collect and house the dissolved solutes separated out of the flow back water by the forward osmosis membrane. This collection method will be directly connected to the system to prevent spillage of the dissolved components into the environment. A plastic intermediate bulk container could be used since it is light weight, durable and resists corrosion better than a steel intermediate bulk container.
Impact of FO Integrated TechnologyThe extensive use of the FO technology to recover drilling and
fracturing wastewater would have some environmental impact as well. This could be a limiting factor, but this is minimal and less impacting than other known methods, considering the fact that the energy necessary to run the system is produced by the system. Another important limiting factor to consider in this design is the chemical composition of the formation, the membrane fouling and dysfunctional part replacement. These problems can be solved during the site specific design of this integrated system to accommodate for these barriers. Ultimately this system is more cost effective than any other conventional methods used presently. If the reserve waste water tank contains 74,000 bbls, and the forward osmosis unit recovers 90% of the flow backwater, then 66,600 bbls off low back water will be recovered/treated and 8,000 bbls would go for recirculation. To reclaim the 66,600 bbls of waste water, the forward osmosis system would require the use of approximately 6000 bbls of 36% NH4CO3, leading to a total produced volume of about 72,600 bbls.
Extensive use of the FO process to reclaim drilling and fracturing flow back water in the Marcellus Shale would save approximately 750 million gallons of fresh watery early. Aside this benefit, the FO model also eliminates 66,600 bbls of waste water per horizontal well of hauling related road damages. Approximately 175 truckloads of waste water can be effectively eliminated per reserve pit from conventional practice. Based on the suppositions above, emissions can be drastically reduced with an extensive use of FO/Blue Energy model to regain drilling and fracturing waste fluids, which could save an average of 143,000 bbls/year of diesel. The United States consists of about 25 shale basins where the forward osmosis technology alongside the power generation can be employed. Conversely, the FO system model is not restricted to shale development but also relevant in conventional petroleum exploration areas.
ConclusionThe advent of shale gas development in the quest of meeting the
world’s energy demands, did not come only with benefits but also some challenges. The natural low permeability shale must be fractured to guarantee higher productivity and the fracturing process involves the use of millions of gallons of water that must be recovered as flow back or produced waste water. Due to pressure from the public and other regulatory agencies, operators in the petroleum industry are expected to comply in the improvement of their water management practices. From analytical results and testing, the FO system is comparatively the easiest, portable and scalable unit with resourcefully and efficiently reclamation
Depth 8620 FtThickness 180 Ft
i 5280 Ftj 5280 Ft
Permeability (horizontal) 0.01 mdPermeability (vertical) 0.001
Porosity 5%Temperature 210 F
Initial Pressure 4000 psiRock compressibility 0.000001
Table 1: Typical reservoir properties for the designed well.

Citation: Olawoyin R, Madu C, Enab K (2012) Optimal Well Design for Enhanced Stimulation Fluids Recovery and Flow-back Treatment in the Marcellus Shale Gas Development using Integrated Technologies. Hydrol Current Res 3:141. doi:10.4172/2157-7587.1000141
Page 10 of 10
Volume 3 • Issue 5 • 1000141Hydrol Current ResISSN: 2157-7587 HYCR, an open access journal
capabilities of water waste for valuable reuse. Aside the reduction in the quantity of fresh waterused, the results confirms that forward osmosis can substantially lessen the carbon foot print of exploration and production in the petroleum industry. The combination of FO system and power generation will not only save fresh water resources, but it will provide more water resources that are reusable for other purposes. This integrated system is cost effective and it will improve the public’s perception of operator’s responsibilities to the environment.
References
1. King GE (2010) Thirty Years of Gas Shale Fracturing: What Have We Learned? SPE.
2. Hubbert MK, Willis DGW (1957) Mechanics of hydraulic fracturing. Transaction of the American Institute of Mining, Metallurgical, and Petroleum Engineers Incorporated 210: 153-168.
3. Olawoyin R, Wang JY, Oyewole SA (2012) Environmental Safety Assessment of Drilling Operations in the Marcellus Shale Gas Development, SPE Drilling & Completion, SPE.
4. Engelder T, Lash GG (2008) Marcellus Shale Play’s Vast Resource Potential Creating Stir in Appalachia. The American Oil and Gas Reporter.
5. Engelder T (2009) Marcellus 2008: Report card on the breakout year for gas production in the Appalachian Basin. Fort Worth Basin Oil and Gas, August 2009 edition, Abilene, TX, 18-22.
6. Bell CE, Brannon HD, Hughes B (2011) Redesigning Fracturing Fluids for Improving Reliability and Well Performance in Horizontal Tight Gas Shale Applications. SPE.
7. Hurst A, Scott A, Vigorito M (2011) Physical characteristics of sand injectites. Earth-Science Reviews 106: 215-246.
8. Olawoyin RO (2011) Natural Gas Development in the Marcellus Shale. MS thesis, Pennsylvania State University, University Park, Pennsylvania.
9. Davies RJ, Clarke AL (2010) Storage rather than venting after gas hydrate dissociation. Geology 38: 963-966.
10. Zuhlsdorff L, Spieß V (2004) Three-dimensional seismic characterization of a venting site reveals compelling indications of natural hydraulic fracturing. Geology 32: 101-104.
11. Arthur JD, Uretsky M, Wilson P (2010) Water Resources and Use for Hydrualic Fracturing in the Marcellus Shale Region. ALL Consulting, Tulsa, OK.
12. Cartwright J, Huuse M, Aplin A (2007) Seal bypass systems. American Association of Petroleum Geologists 91: 1141-1166.
13. Christopherson S (2011) The Economic Consequences of Marcellus Shale Gas Extraction: Key Issues. CaRDI Reports Issue No 14, Community and Regional Development Institute, Cornell University, Ithaca, NY.
14. Kargbo DM, Wilhelm RG, Campbell DJ (2010) Natural gas plays in the Marcellus Shale: challenges and potential opportunities. Environ Sci Technol 44: 5679–5684.
15. Soeder DJ, Kappel WM (2009) Water Resources and Natural Gas Production from the Marcellus Shale. US Geological Survey Fact Sheet 2009–3032, Reston, VA.
16. (2011) US Environmental Protection Agency (USEPA), Plan to Study the Potential Impacts of Hydraulic Fracturing on Drinking Water Resources. Office of Research and Development, Washington DC.
17. Veil J (2010) Water Management Technologies Used by Marcellus Shale Gas Producers. Argonne National Laboratory, Argonne, IL Prepared for the U.S. Department of Energy, National Energy Technology Laboratory.
18. Bourgoyne AT Jr, Millheim KK, Chenevert ME, Young FS Jr (1986) Applied Drilling Engineering (SPE Textbook Series) Society of Petroleum Engineers 2: 85-112.
19. Cipolla CL, Ceramics C (2009) Modeling Production and Evaluating Fracture Performance in Unconventional Gas Reservoirs. Journal of Petroleum Technology, SPE, 84-90.
20. Paktinat J, Pinkgouse JA, Fontaine J (2007) Investigation of Methods to Improve Utica Shale Hydraulic Fracturing in the Appalachian Basin. Society of Petroleum Engineers, SPE.
21. Palisch TT, Vincent M, Handren P (2008) Slickwater Fracturing: Food for Thought. Society of Petroleum Engineers, SPE.
22. (2005) National Oceanic and Atmospheric Administration (NOAA), Annual Summary.
23. Daniel J, Bohm B, Cornue D (2009) Environmental Considerations of Modern Shale Gas Development. Society of Petroleum Engineers, SPE 122931.
24. Gaudlip AW, Paugh LO, Hayes TD (2008) Marcellus Water Management Challenges in Pennsylvania. Paper SPE 119898, presented at the SPE Shale Gas Production Conference, Ft Worth, TX, USA, 16-18 November.
25. Veil JA, Puder MG, Elcock D, Redweik RJ (2004) A White Paper Describing Produced Water from Production of Crude Oil, Natural Gas, and Coal Bed Methane. ANL Report under DOE (NETL) Contract W-31-109-Eng-38.
26. Mc Ginnis R, Mc Cutcheon JR, Elimelech M (2007) A novel ammonia-carbon dioxide osmotic heat engine for power generation. J Membr Sci 305: 13-19.
27. Mc Cutcheon JR, Mc Ginnis RL, Elimelech M (2006) Desalination by ammonia–carbon dioxide forward osmosis: Influence of draw and feed solution concentrations on process performance. J Membr Sci 278: 114–123.
28. Cath TY, Childress AE, Elimelech M (2006) Forward osmosis: Principles, applications, and recent developments. J Membr Sci 281: 70-87.
29. Bamaga OA, Yokochi A, Zabara B, Babaqi AS (2011) Hybrid FO/RO desalination system: Preliminary assessment of osmotic energy recovery and designs of new FO membrane module configurations. Desalination 268: 163-169.
30. Mi B, Elimelech M (2010) Organic Fouling of Forward Osmosis Membranes: Fouling Reversibility and Cleaning without Chemical Reagents. J Membr Sci 348: 337-345.
31. Lee K, Baker R, Lonsdale H (1981) Membrane for power generation by pressure retarded osmosis. J Membr Sci 8: 141-171.
32. Achilli A, Cath TY, Childress AE (2010) Selection of Inorganic-Based Draw Solutions for Forward Osmosis Applications. J Membr Sci 364: 233-241.
33. Wang R, Shi L, Tang CY, Chou S, et al. (2010) Characterization of Novel Forward Osmosis Hollow Fiber Membranes. J Membr Sci 355: 158-167.
34. Yip NY, Tiraferri A, Phillip WA, Schiffman JD, Hoover LA, et al. (2011) Thin-Film Composite Pressure Retarded Osmosis Membranes for Sustainable Power Generation from Salinity Gradients. Environ Sci Technol 45: 4360-4369.
Samp Date
TDS Ca(mg/L)
Mg(mg/L)
CaCO3 Na(mg/L)
K(mg/L)
Fe(mg/L)
Ba(mg/L)
Sr(mg/L)
Mn(mg/L)
SO4(mg/L)
Cl(mg/L)
4/14 22438 15.00 2.73 49.44 18.00 1.65 0.25 0.23 0.46 0.60 3.00 183.004/26 84839 7100 603 23286 22800 326 3.93 2000 1400 6.69 0.00 506004/27 89861 7640 651 24952 24300 346 7.80 1990 1510 7.07 8.87 534004/27 105161 8490 714 27432 25100 352 9.70 1870 1670 7.44 156 668004/28 116266 10500 893 33879 29400 410 35.30 1980 2200 9.10 139 707004/29 123902 11700 996 38419 31100 437 16.20 2480 2860 9.50 2.94 743004/30 164081 16700 1400 52071 41700 579 23.50 2230 2570 13.00 165 987005/1 140169 14000 1150 44358 34300 477 28.70 2290 2590 11.00 22.70 853005/2 146539 16700 1380 53473 39400 535 30.20 3000 3380 13.10 0.19 821005/3 161636 17100 1410 54446 40400 543 35.20 2950 3280 13.30 4.97 959005/4 164902 16700 13000 103026 37000 496 32.90 3850 4310 12.30 1.15 89500
Table 2: Marcellus Shale Well Flowback Analysis Data for 20 days.


![EGURIDAD Sy Medio Ambiente€¦ · [2] Seguridad Industrial en Atmósferas explosivas, Dr. Javier García To-rrent. [3] The RASE Project , Dr. Richard L. Rogers. [4] Dust Explosion](https://img.pdfslide.us/doc/110x75/5f53285fdb0863322472225d/eguridad-sy-medio-ambiente-2-seguridad-industrial-en-atmsferas-explosivas-dr.jpg)