Embed Size (px)
Citation preview
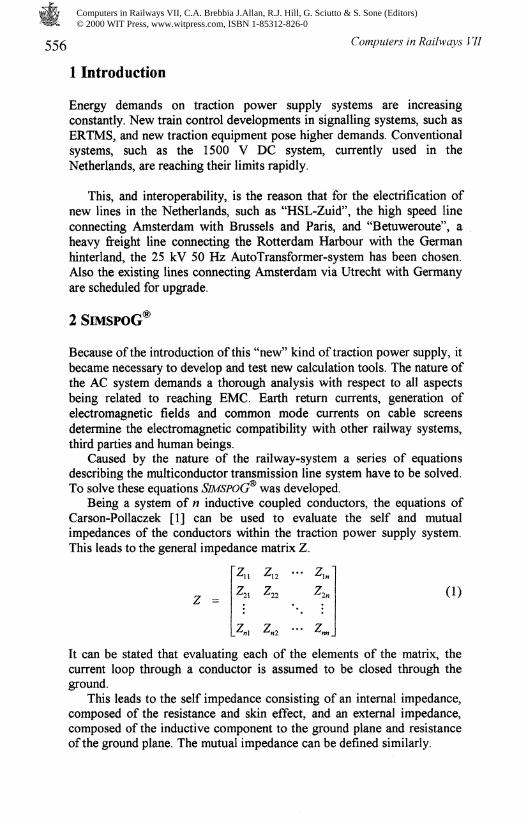
Analysis of AC traction power supplies
using the SlMSPOG simulation tool
G. van Alphen, V.W.M. van Rens, H.W.M. SmuldersHolland Railconsult, Utrecht, The Netherlands
Abstract
Introducing the technology of AC traction power supply in theNetherlands, modelling of the railway infrastructure has become a vitalpart in the EMC studies which have to be carried out. Therefore HollandRailconsult has developed the mathematical model SiMSPO(f, of therailway system as a transmission line, using the mathematical packageMathcad for the calculations.
Being a part of a range of related simulation tools, SlMSPOG® is anengineering tool suited to calculate current distributions within 1x25 kVas well as 2x25 kV AC traction power supply systems, based on themulti-pole technique. Being verified by purposeful measurements on theLuxembourg railway-network, SlMSPOfj is being utilised for calculatingcurrents on cable screens (using the transfer-impedance concept todetermine disturbing voltages), touch- and stepvoltages within the supplysystem, current distributions within system separation sections as well asshort circuit calculations.
The calculations mentioned are being done to design the 2x25 kVsystem for the "first" Dutch AC railway-line "Betuweroute" and the firstpart "Havenspoorlijn" in the Rotterdam Harbour in particular. This firstpart will go into service in the first half of the year 2000, using theopportunity to carry out a large number of measurements on the pilotrailway-line to validate the system design and the tools used.
Future applications of SlMSPOGf® will be post-processing for voltage-distributions in the traction power supply system, using the resultingenergy-consumption data of the train-simulation tool SimRail as input, aswell as in the area of harmonic studies.
Computers in Railways VII, C.A. Brebbia J.Allan, R.J. Hill, G. Sciutto & S. Sone (Editors) © 2000 WIT Press, www.witpress.com, ISBN 1-85312-826-0
Computers in Railways 111
1 Introduction
Energy demands on traction power supply systems are increasingconstantly. New train control developments in signalling systems, such asERTMS, and new traction equipment pose higher demands. Conventionalsystems, such as the 1500 V DC system, currently used in theNetherlands, are reaching their limits rapidly.
This, and interoperability, is the reason that for the electrification ofnew lines in the Netherlands, such as "HSL-Zuid", the high speed lineconnecting Amsterdam with Brussels and Paris, and "Betuweroute", aheavy freight line connecting the Rotterdam Harbour with the Germanhinterland, the 25 kV 50 Hz AutoTransformer-system has been chosen.Also the existing lines connecting Amsterdam via Utrecht with Germanyare scheduled for upgrade.
2 SiMSPOG®
Because of the introduction of this "new" kind of traction power supply, itbecame necessary to develop and test new calculation tools. The nature ofthe AC system demands a thorough analysis with respect to all aspectsbeing related to reaching EMC. Earth return currents, generation ofelectromagnetic fields and common mode currents on cable screensdetermine the electromagnetic compatibility with other railway systems,third parties and human beings.
Caused by the nature of the railway-system a series of equationsdescribing the multiconductor transmission line system have to be solved.To solve these equations SlMSPOG® was developed.
Being a system of n inductive coupled conductors, the equations ofCarson-Pollaczek [1] can be used to evaluate the self and mutualimpedances of the conductors within the traction power supply system.This leads to the general impedance matrix Z
z =
Z\n
(1)
3*
It can be stated that evaluating each of the elements of the matrix, thecurrent loop through a conductor is assumed to be closed through theground.
This leads to the self impedance consisting of an internal impedance,composed of the resistance and skin effect, and an external impedance,composed of the inductive component to the ground plane and resistanceof the ground plane. The mutual impedance can be defined similarly.
Computers in Railways VII, C.A. Brebbia J.Allan, R.J. Hill, G. Sciutto & S. Sone (Editors) © 2000 WIT Press, www.witpress.com, ISBN 1-85312-826-0
Computers in Railways VII 557
Figure 1: Definition of the impedance current loops.
Zg - Dearth J Dearth
(2)
(3)
(5)
Of course these impedance components only give the possibility toevaluate the typical impedance of a given conductor configuration.Therefore, while analysing the system, it is useful to calculate the currentdistribution within the power supply system as function of, for example,• Load position;• Supply system type;• Rail to earth conductance;• Local conductor geometry.
Choosing Mathcad as the mathematical toolbox, it was a useful choice toimplement the multi-pole method to evaluate the current distributionwithin the power supply system.
As can be found in literature (Petrov [2]), the general equationdescribing the supply system can written as:
Ml = A*(U"
LM(6)
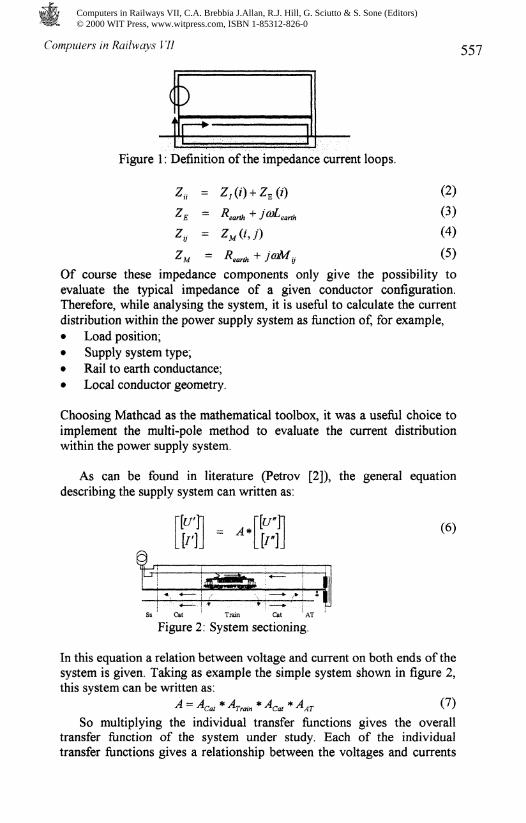
Ss Cat ' Train Cat ATFigure 2: System sectioning.
In this equation a relation between voltage and current on both ends of thesystem is given. Taking as example the simple system shown in figure 2,this system can be written as:
So multiplying the individual transfer functions gives the overalltransfer function of the system under study. Each of the individualtransfer functions gives a relationship between the voltages and currents
Computers in Railways VII, C.A. Brebbia J.Allan, R.J. Hill, G. Sciutto & S. Sone (Editors) © 2000 WIT Press, www.witpress.com, ISBN 1-85312-826-0
Computers in Railways Vll
on both sides of the section concerned. For example the impedance matrixZ (eqn 1) of a catenary section can be written as:
(8)
In a similar way the transfer function of the autotransformer can bedescribed (Kontcha [3]) ~
After solving eqn 6 using the applicable boundary conditions, thevalues of U\ /', £/" and /" are found and the voltages and currents on eachborder section can be calculated by multiplying, for example
'AT
[I AT] I/I(10)
So consequently carrying out this exercise finally U' and /' must befound.
For simplicity in the equations listed above, the rail to earthconductivity is neglected. Of course in reality this conductivity plays animportant role in the electromagnetic behaviour of a traction powersupply system. Therefore in the "complete" SlMSPOG® version this effectis taken into account. While modelling the different situations to beconsidered, reduction of the number of conductors is sometimes beingpractised for ease of simulation. This is allowed for those conductorswhich are paralled electrically, like contact wire and messenger wire.Measurements have been carried out on the "Ligne du Nord" of theLuxembourg Railways (CFL) to verify SiMSPOG®.
3 Application
Up till now the SiMSPOG® simulation tool has been used for several typesof engineering studies:• Selecting of power supply system with respect to, for example,
common mode currents on cable screens;• Determining the lay-out of an earthing system with respect to touch-
and step-voltages;• Applicability and effectivity of resonance bonds in a system
separation section;In the next paragraphs some examples of these calculations will be
treated.
3.1 Simulation of common mode currents on cable screens
With the aid of a current distribution simulation, using SlMSPOCr®, it canbe generally shown that the AT-system is the most appropriate system for
Computers in Railways VII, C.A. Brebbia J.Allan, R.J. Hill, G. Sciutto & S. Sone (Editors) © 2000 WIT Press, www.witpress.com, ISBN 1-85312-826-0
Computers in Railways VII 559
reducing the common mode currents on cable screens of signalling- andtelecommunication systems.
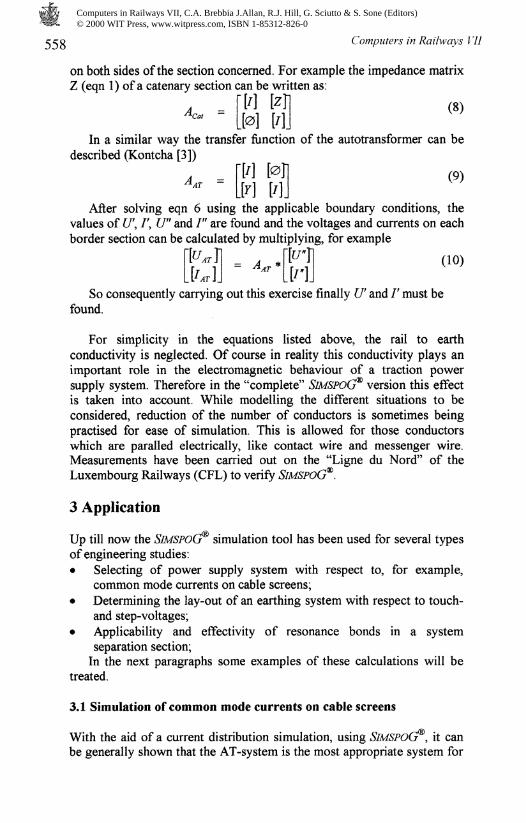
Figure 3: Simulation model for common mode currents.
A double track model, resembling the "Havenspoorlijn" was used. Seefigure 3. Three types of traction power supply systems were compared,the so called ST-, RT- and AT-system, on the basis of calculated screencurrents of four different cable bundles (01 through 04) assuming a 500 Aload on both tracks at the load position. The position of the load withrespect to the substation (OS) and the autotransformer stations (ATI andAT2) was varied; "sitA" and "sitB". The cable bundles were varied inlength and in position according to figure 3. The screens of the cablebundles are connected to the return/earthing circuit at both ends of thecable bundle (multiple grounding). The cable (multiple) screens weresimulated by using an equivalent 50 mnf copper conductor. Cable screencurrents were calculated for the three 25 kV systems mentioned. Theresults of the calculations are listed in table 1.
Table 1. Calculated screen currents [A] as a function of the three25 kV systems.
Cablebundle01020304
ATsitA16152536
sitB8121229
RTsitA2041821
sitB59808079
STsitA32641302
sitB93125125124
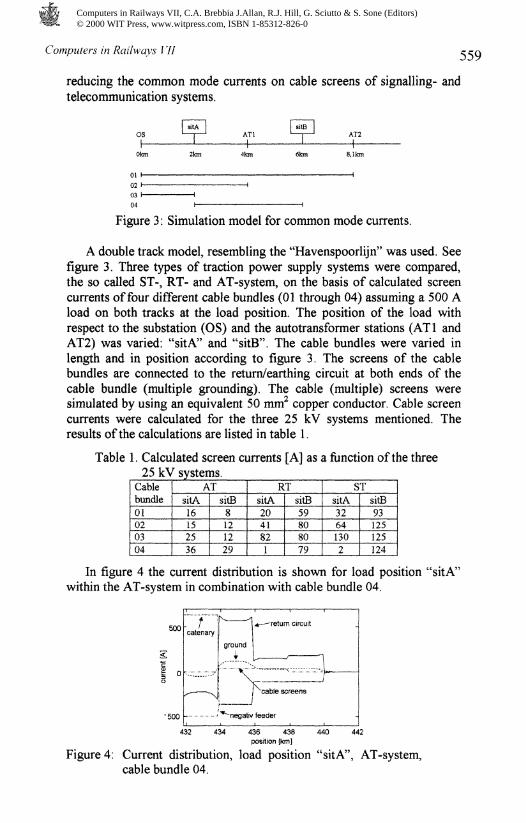
In figure 4 the current distribution is shown for load position "sitA"within the AT-system in combination with cable bundle 04.
-500432 434 436 438 440 442
position [km]Figure 4. Current distribution, load position "sitA", AT-system,
cable bundle 04.
Computers in Railways VII, C.A. Brebbia J.Allan, R.J. Hill, G. Sciutto & S. Sone (Editors) © 2000 WIT Press, www.witpress.com, ISBN 1-85312-826-0
Computers in Railways VII
Comparing the simulation results it can be stated that indeed theAT-system is the most appropriate traction power supply system when thescreen currents are taken into consideration. From the results in table 1 itcan be deduced that the cable-screen currents are, as a rule of thumb, 3 to4 times less with an AT-system then with a ST- or RT-system. Thismeans that, using the transfer-impedance approach (Van der Laan [4]),differential mode disturbing voltages will be 3 to 4 times less with anAT-system than with a ST- or RT-system.
3.2 Touch- and step-voltages
The European Standard EN50122-1 [5] describes the limits of the valuesof the voltage, which are allowed to be accessible to human beings.Within the AC traction supply system these voltages occur between• Rail and surrounding soil;* Rail and catenary poles;+ Cables and surrounding soil (also during maintenance).
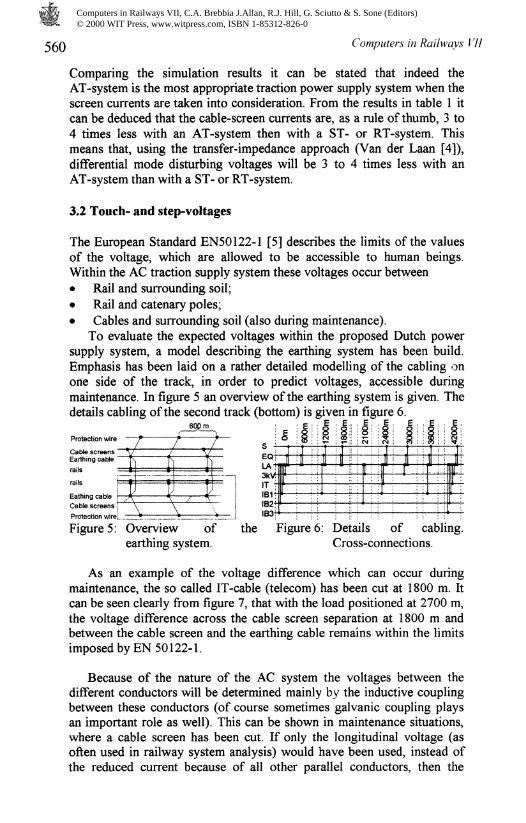
To evaluate the expected voltages within the proposed Dutch powersupply system, a model describing the earthing system has been build.Emphasis has been laid on a rather detailed modelling of the cabling onone side of the track, in order to predict voltages, accessible duringmaintenance. In figure 5 an overview of the earthing system is given. Thedetails cabling of the second track (bottom) is given in figure 6.
Protection wireCable screens "" y / y ^_Earthing cable T\ f\ fs *=U,
" " "= £flITIBlfflIB2f
railsEathing cableCable screens f V \~~Protection wirei • VFigure 5: Overview of the Figure 6: Details of cabling.
earthing system. Cross-connections.
As an example of the voltage difference which can occur duringmaintenance, the so called IT-cable (telecom) has been cut at 1800 m. Itcan be seen clearly from figure 7, that with the load positioned at 2700 m,the voltage difference across the cable screen separation at 1800 m andbetween the cable screen and the earthing cable remains within the limitsimposed by EN 50122-1.
Because of the nature of the AC system the voltages between thedifferent conductors will be determined mainly by the inductive couplingbetween these conductors (of course sometimes galvanic coupling playsan important role as well). This can be shown in maintenance situations,where a cable screen has been cut. If only the longitudinal voltage (asoften used in railway system analysis) would have been used, instead ofthe reduced current because of all other parallel conductors, then the
Computers in Railways VII, C.A. Brebbia J.Allan, R.J. Hill, G. Sciutto & S. Sone (Editors) © 2000 WIT Press, www.witpress.com, ISBN 1-85312-826-0
Computers in Railways VII 561
average touch voltage would have been approximately 35 % - 70 %higher.
52r
39
26
13
EC - IT cable screen EC = Earthing CableEC - IB2 cable screen
EC - return wireEC-3kV cable screen
EC -181 cablereen
0 0.5 1 1.5 2 2.5 3 3.5 4position [km]
Figure 7: Voltage distributions with IT-cable cut.
3.3 System Separation Section
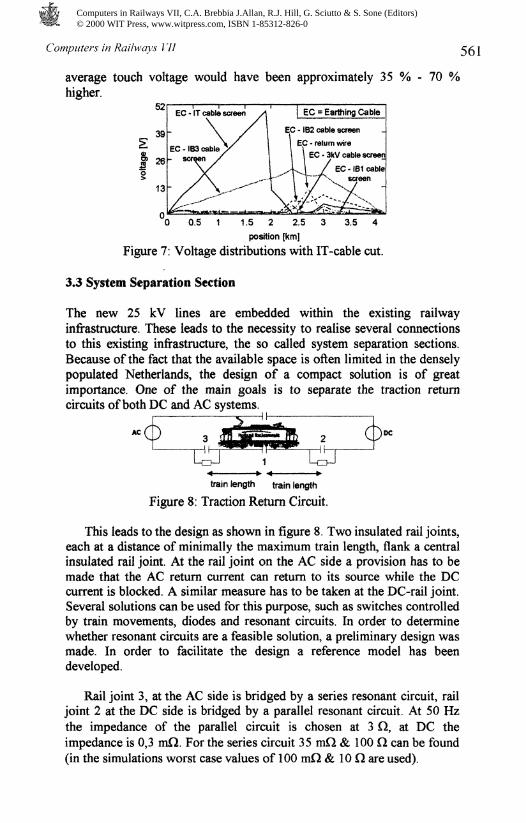
The new 25 kV lines are embedded within the existing railwayinfrastructure. These leads to the necessity to realise several connectionsto this existing infrastructure, the so called system separation sections.Because of the fact that the available space is often limited in the denselypopulated Netherlands, the design of a compact solution is of greatimportance. One of the main goals is to separate the traction returncircuits of both DC and AC systems.
-/ 3, (I. fl
% "
*
s L
iJi 2 c>
train length train length
Figure 8: Traction Return Circuit.
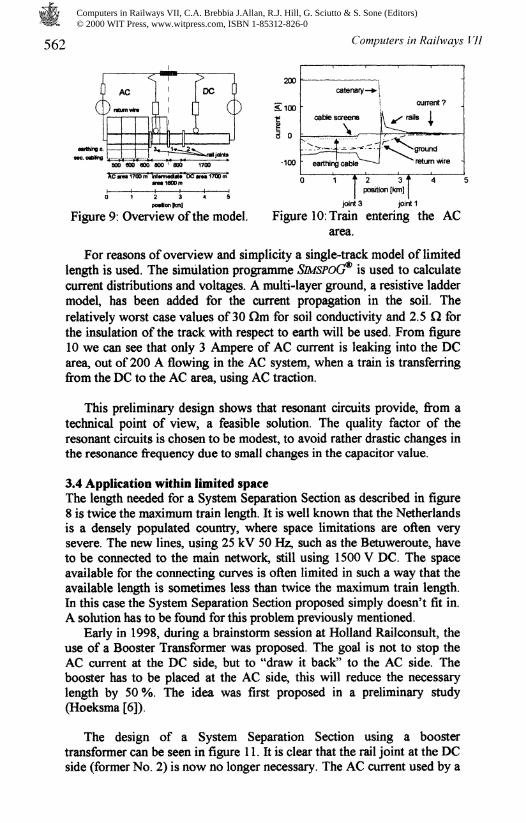
This leads to the design as shown in figure 8. Two insulated rail joints,each at a distance of minimally the maximum train length, flank a centralinsulated rail joint. At the rail joint on the AC side a provision has to bemade that the AC return current can return to its source while the DCcurrent is blocked. A similar measure has to be taken at the DC-rail joint.Several solutions can be used for this purpose, such as switches controlledby train movements, diodes and resonant circuits. In order to determinewhether resonant circuits are a feasible solution, a preliminary design wasmade. In order to facilitate the design a reference model has beendeveloped.
Rail joint 3, at the AC side is bridged by a series resonant circuit, railjoint 2 at the DC side is bridged by a parallel resonant circuit. At 50 Hzthe impedance of the parallel circuit is chosen at 3 Q, at DC theimpedance is 0,3 mfl. For the series circuit 35 mQ & 100 Q can be found(in the simulations worst case values of 100 mH & 10 Q are used).
Computers in Railways VII, C.A. Brebbia J.Allan, R.J. Hill, G. Sciutto & S. Sone (Editors) © 2000 WIT Press, www.witpress.com, ISBN 1-85312-826-0
562 Computers in Railways 111
portion [km]Figure 9: Overview of the model.
100~ 2 3 | 4 !position [km]
joint 3 joint 1Figure 10: Train entering the AC
area.
For reasons of overview and simplicity a single-track model of limitedlength is used. The simulation programme SMSPOCf® is used to calculatecurrent distributions and voltages. A multi-layer ground, a resistive laddermodel, has been added for the current propagation in the soil. Therelatively worst case values of 30 Qm for soil conductivity and 2.5 fl forthe insulation of the track with respect to earth will be used. From figure10 we can see that only 3 Ampere of AC current is leaking into the DCarea, out of 200 A flowing in the AC system, when a train is transferringfrom the DC to the AC area, using AC traction.
This preliminary design shows that resonant circuits provide, from atechnical point of view, a feasible solution. The quality factor of theresonant circuits is chosen to be modest, to avoid rather drastic changes inthe resonance frequency due to small changes in the capacitor value.
3.4 Application within limited spaceThe length needed for a System Separation Section as described in figure8 is twice the maximum train length. It is well known that the Netherlandsis a densely populated country, where space limitations are often verysevere. The new lines, using 25 kV 50 Hz, such as the Betuweroute, haveto be connected to the main network, still using 1500 V DC. The spaceavailable for the connecting curves is often limited in such a way that theavailable length is sometimes less than twice the maximum train length.In this case the System Separation Section proposed simply doesn't fit in.A solution has to be found for this problem previously mentioned.
Early in 1998, during a brainstorm session at Holland Railconsult, theuse of a Booster Transformer was proposed. The goal is not to stop theAC current at the DC side, but to "draw it back" to the AC side. Thebooster has to be placed at the AC side, this will reduce the necessarylength by 50%. The idea was first proposed in a preliminary study(Hoeksma [6]).
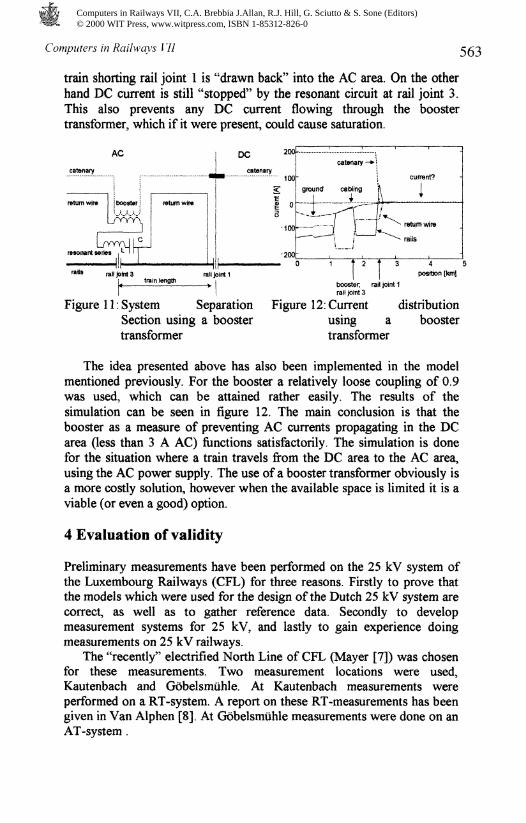
The design of a System Separation Section using a boostertransformer can be seen in figure 11. It is clear that the rail joint at the DCside (former No. 2) is now no longer necessary. The AC current used by a
Computers in Railways VII, C.A. Brebbia J.Allan, R.J. Hill, G. Sciutto & S. Sone (Editors) © 2000 WIT Press, www.witpress.com, ISBN 1-85312-826-0
Computers in Railways VII
train shorting rail joint 1 is "drawn back" into the AC area. On the otherhand DC current is still "stopped" by the resonant circuit at rail joint 3.This also prevents any DC current flowing through the boostertransformer, which if it were present, could cause saturation.
catenary
booster; rail joint 1rail joint 3
Figure 11: System Separation Figure 12: Current distributionSection using a booster using a boostertransformer transformer
The idea presented above has also been implemented in the modelmentioned previously. For the booster a relatively loose coupling of 0.9was used, which can be attained rather easily. The results of thesimulation can be seen in figure 12. The main conclusion is that thebooster as a measure of preventing AC currents propagating in the DCarea (less than 3 A AC) functions satisfactorily. The simulation is donefor the situation where a train travels from the DC area to the AC area,using the AC power supply. The use of a booster transformer obviously isa more costly solution, however when the available space is limited it is aviable (or even a good) option.
4 Evaluation of validity
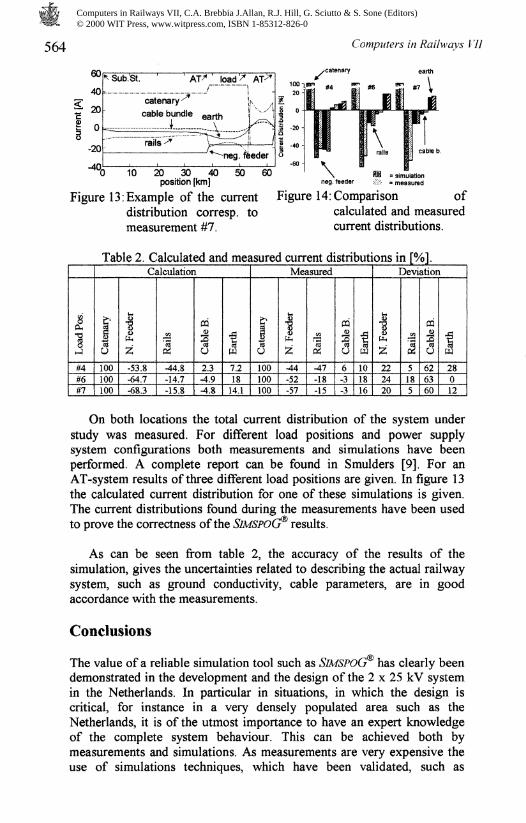
Preliminary measurements have been performed on the 25 kV system ofthe Luxembourg Railways (CFL) for three reasons. Firstly to prove thatthe models which were used for the design of the Dutch 25 kV system arecorrect, as well as to gather reference data. Secondly to developmeasurement systems for 25 kV, and lastly to gain experience doingmeasurements on 25 kV railways.
The "recently" electrified North Line of CFL (Mayer [7]) was chosenfor these measurements. Two measurement locations were used,Kautenbach and Gftbelsmuhle. At Kautenbach measurements wereperformed on a RT-system. A report on these RT-measurements has beengiven in Van Alphen [8]. At Gobelsmiihle measurements were done on anAT-system .
Computers in Railways VII, C.A. Brebbia J.Allan, R.J. Hill, G. Sciutto & S. Sone (Editors) © 2000 WIT Press, www.witpress.com, ISBN 1-85312-826-0
564 Computers in Railways VII
ou
40
20
0
-20An
* Sub.'St. '
catenarycable bun
rails
' AT/'/ '
die earN
* — - ~V-%
load '/ AP*
: MW1 /neg. feeder
yc:atenary
I
0 10 20 30 40 50 60position [km]
Figure 13: Example of the currentdistribution corresp. tomeasurement #7.
\ = simulation= measuredneg. feeder
Figure 14: Comparison ofcalculated and measuredcurrent distributions.
Table 2. Calculated and measured current distributions in [%].
Load Pos.
#4#6#7
Calculation
I*
$100100100
£z-53.8-64.7-68.3
OT
1-44.8-14.7-15.8
Cable B.
2.3-4.9-4.8
17.21814.1
Measured
IT
u100100100
£55•44-52-57
OT
1-47-18-15
Cable B.
6-3-3
03W101816
Deviation
c255222420
«a'0045185
Cable B.
626360
I28012
On both locations the total current distribution of the system understudy was measured. For different load positions and power supplysystem configurations both measurements and simulations have beenperformed. A complete report can be found in Smulders [9]. For anAT-system results of three different load positions are given. In figure 13the calculated current distribution for one of these simulations is given.The current distributions found during the measurements have been usedto prove the correctness of the SlMSPOGr® results.
As can be seen from table 2, the accuracy of the results of thesimulation, gives the uncertainties related to describing the actual railwaysystem, such as ground conductivity, cable parameters, are in goodaccordance with the measurements.
Conclusions
The value of a reliable simulation tool such as SlMSPOG® has clearly beendemonstrated in the development and the design of the 2 x 25 kV systemin the Netherlands. In particular in situations, in which the design iscritical, for instance in a very densely populated area such as theNetherlands, it is of the utmost importance to have an expert knowledgeof the complete system behaviour. This can be achieved both bymeasurements and simulations. As measurements are very expensive theuse of simulations techniques, which have been validated, such as
Computers in Railways VII, C.A. Brebbia J.Allan, R.J. Hill, G. Sciutto & S. Sone (Editors) © 2000 WIT Press, www.witpress.com, ISBN 1-85312-826-0
Computers in Railways VII r^r
described in this paper, are becoming very important in the design ofrailway infrastructure. The application of Systems Engineering and thecombination with simulation tools such as SlMSPOCf® provide the designerof a railway system with powerful tools, which will make an efficient,economical railway system design possible.
Acknowledgements
The results presented in this paper are of course the outcome of the workof many. Therefore the authors would like to thank everybody who hasmade a contribution in the development of SlMSPOGf® and themeasurements in Luxembourg.
References
[1] Pollaczek, F., "Uber das Feld einer unendlichen langen wechselstromdurchflossene Einfachleitung", Mitt. Am dem telegraphisenReichsamt, 1926 (in German).
[2] Petrov, O, O Grimalski, "Berechnung der elektrischen GroBen inOberleitungen und Schienen von Wechselstrombahnen", ElektrischeBahnen 88 (1990) 11, pp. 398 - 402 (in German).
[3] Kontcha, A.; "Mehrpolverfahren fur Berechnungen inMehrleitersystemen bei Einphasenwechselstrombahnen", ElektrischeBahnen 94 (1996) 4, pp. 97-109 (in German).
[4] Laan, P.C.T. van der, A.PJ. van Deursen, "Linear EMC-Solutionsfor Power Systems", 10th International Symposium on High-VoltageEngineering, Montreal, Canada, august 25-29, 1997.
[5] EN 50122-1,"Railway applications, Fixed installations, Part 1:Protective provisions relating to electrical safety and earthing",Cenelec, June 1997.
[6] Hoeksma, H., "Inpassing spanningssluizen Elst, Geldermalsen,Sophia-tunnel", Holland Railconsult, 6 October 1998 (in Dutch).
[7] Mayer, Ch.-L., "Modernisierung der Nordstrecke und elektrischerBetrieb bei der Societe Nationale des Chemins de FerLuxembourgeois", Elektrische Bahnen 92 (1994) 5, pp. 144 - 152(in German).
[8] Alphen, G. van, A.P.J van Deursen, H.W.M. Smulders, "Einsatz vonEMV-Mei3verfahren bei 25 kV-Bahnstromanlagen ohneEinschrankung der normale Verkehrsbetrieb", 2. InternationaleKonferenz Elektrische Bahnsysteme, 23-24 March 1999, Berlin,pp. 195-199 (in German).
[9] Smulders, H., G. van Alphen, A. van Deursen, R. de Graaff,"Comparison between Measurements and Simulations on 25 kVTraction Power Supply Systems", World Congress on RailwayResearch, 19-23 October 1999.
Computers in Railways VII, C.A. Brebbia J.Allan, R.J. Hill, G. Sciutto & S. Sone (Editors) © 2000 WIT Press, www.witpress.com, ISBN 1-85312-826-0


![Ouders in de sport - WOC Alphen aan den Rijn · • Atletiek & Volleybal • Jongens & meisjes ... Microsoft PowerPoint - 2009 WOC Alphen ad Rijn 24 juni ouders.ppt [Compatibiliteitsmodus]](https://img.pdfslide.us/doc/110x75/5c75357109d3f2ba1a8c6952/ouders-in-de-sport-woc-alphen-aan-den-atletiek-volleybal-jongens.jpg)