Embed Size (px)
Citation preview

Articleshttps://doi.org/10.1038/s41558-018-0162-5
1Department of Oceanography and Coastal Sciences, College of the Coast and Environment, Louisiana State University, Baton Rouge, LA, USA. 2Departamento de Ecologia e Zoologia, Universidade Federal de Santa Catarina, Florianópolis, Brazil. 3Departamento de Engenharia e Meio Ambiente, Universidade Federal da Paraíba, Rio Tinto, Brazil. 4Centro Agronómico Tropical de Investigación de Enseñanza, Turrialba, Costa Rica. 5Departamento de Botânica, Universidade Federal de Santa Catarina, Florianópolis, Brazil. 6Núcleo de Estudos do Mar, Universidade Federal de Santa Catarina, Florianópolis, Brazil. 7Departamento de Geociências, Universidade Federal de Santa Catarina, Florianópolis, Brazil. Present address: 8Southeast Environmental Research Center, Florida International University, Miami, FL, USA. *e-mail: [email protected]
Compared with terrestrial woodlands, mangrove forests thrive on dynamic coastlines controlled by physical forc-ings (for example, rivers, tides and waves) and geomor-
phic evolutionary processes (for example, the rate and source of sediment input, and rate of relative sea-level change)1. Combined, these processes create a range of clastic coastal environments spanning from prograding to transgressive embayed shorelines1,2. Wave power, tidal and fluvial processes, along with regional cli-mate, represent the main subsidiary energies of coastal zones, and the relative contribution of these environmental drivers pro-duces conspicuous coastal environmental settings (CES), includ-ing deltas, estuaries, lagoons, composite deltas and lagoons, bedrock, and carbonate settings3,4 (see Methods for a summary of these CES). Built on this ecogeomorphology framework5, the CES approach recognizes hydrology, geomorphology and cli-mate as the main components of macroscale variation in coastal wetland ecological processes3,4. Hence, each coastal setting has a conspicuous environmental signature that controls both the type and rate of sediment supply to the coastline, nutrient load and limitation (for example, the nitrogen-to-phosphorus stoichio-metric ratio), organic matter diagenesis, and, ultimately, carbon storage in vegetation (above- and below-ground biomass) and soil pools1,3,4,6,7 (Supplementary Fig. 1). C:N:P stoichiometric interac-tions may enhance or weaken the carbon-climate feedback con-sidering that the nitrogen and phosphorus density in soils may represent limiting conditions for carbon accumulation in soils8,9. Thus, reconciling site-specific mechanisms regulating C:N:P stoi-chiometry with macroscale processes in mangrove ecosystems is key in advancing conceptual models into empirical frameworks, improving our capacity to predict carbon stocks in these and other coastal wetlands.
Our approach was to develop a natural trajectory experiment10 of mangrove soil nutrient and carbon dynamics to scale up the large variation in these ecosystem properties across dynamic CES, to test whether the relative contribution of environmental driv-ers (for example, tides, river discharge, temperature, rainfall and evapotranspiration) that form distinct CES defines soil organic car-bon (SOC) storage. We assessed the role of these key geophysical and climatic environmental drivers in forming conspicuous CES and tested the influence of these settings in determining mangrove soil C:N:P stoichiometry and resulting SOC storage. Climate-based11 models, or simply the use of global mean reference values12, have been proposed as alternatives to explain global-scale varia-tion in mangrove SOC stocks. Here, we used soil C:N:P ecological stoichiometry to answer the question of whether or not CES drive macroscale variation in mangrove soil nutrient density and result-ing SOC stocks. Based on this validated framework, we combined mangrove SOC data gathered by past global estimates11,12 with additional literature and unpublished data, and used this global dataset (Supplementary Table 1) to developed models to account for the global controls and variation in mangrove SOC stocks (see Methods for details).
Patterns of mangrove SOC stocks across CESMangrove SOC, total nitrogen and total phosphorus varied sig-nificantly across distinct CES throughout the neotropics (Fig. 1 and Supplementary Table 2), accounting for over 60, 62 and 42% of the variability in soil carbon, nitrogen and phosphorus density and 44, 49 and 52% of the variation in C:N, N:P and C:P ratios, respectively (Supplementary Fig. 2). C:N:P stoichiometric ratios also revealed a separation of CES into two major groups: sedi-ment-rich settings with a substantial inorganic sediment load from
Global controls on carbon storage in mangrove soilsAndré S. Rovai 1,2*, Robert R. Twilley1, Edward Castañeda-Moya1,8, Pablo Riul 3, Miguel Cifuentes-Jara4, Marilyn Manrow-Villalobos4, Paulo A. Horta2,5, José C. Simonassi6, Alessandra L. Fonseca7 and Paulo R. Pagliosa2,7
Global-scale variation in mangrove ecosystem properties has been explained using a conceptual framework linking geomorpho-logical processes to distinct coastal environmental settings (CES) for nearly 50 years. However, these assumptions have not been empirically tested at the global scale. Here, we show that CES account for global variability in mangrove soil C:N:P stoi-chiometry and soil organic carbon (SOC) stocks. Using this ecogeomorphology framework, we developed a global model that captures variation in mangrove SOC stocks compatible with distinct CES. We show that mangrove SOC stocks have been under-estimated by up to 50% (a difference of roughly 200 Mg ha−1) in carbonate settings and overestimated by up to 86% (around 400 Mg ha−1) in deltaic coastlines. Moreover, we provide information for 57 nations that currently lack SOC data, enabling these and other countries to develop or evaluate their blue carbon inventories.
© 2018 Macmillan Publishers Limited, part of Springer Nature. All rights reserved.
NATuRE CLiMATE CHANGE | www.nature.com/natureclimatechange

Articles Nature Climate ChaNge
riverine input with low, narrow-ranging ratios (282:9:1 to 662:20:1) and peat-dominated settings resulting from negligent or no river discharge with high, wide-ranging ratios (760:39:1 to 2,923:117:1) (Supplementary Table 3).
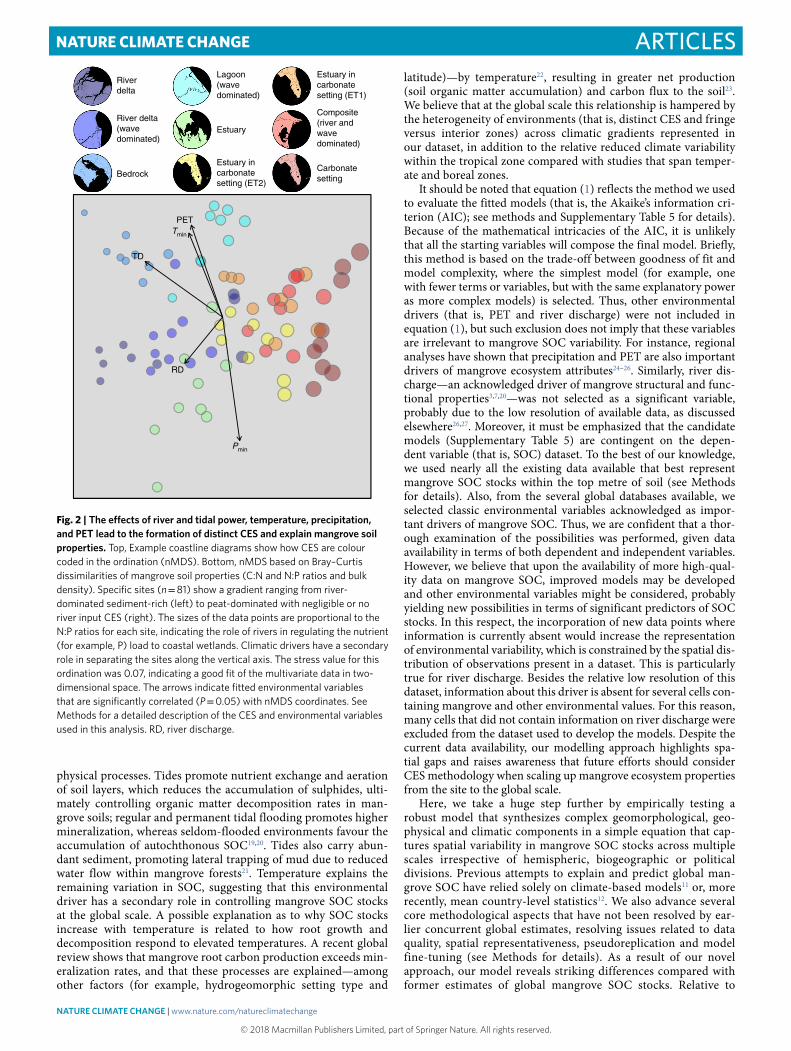
Non-metric multidimensional scaling (nMDS) coupled with permutational multivariate analyses of variance (PERMANOVA) further evidenced the separation of groups into distinct CES, except for tide- and wave-dominated deltaic systems (Fig. 2 and Supplementary Table 4). These differences were clearly depicted along the gradient observed in the ordination, spanning from inor-ganic sediment-rich settings with low N:P ratios (deltaic settings) to peat-dominated phosphorus-limited settings (carbonate and composite settings). This trend was explained by significant geo-physical (tidal range and river discharge) and climatic (tempera-ture, precipitation and annual potential evapotranspiration (PET)) drivers (Fig. 2).
Our study uses ecogeomorphology models to empirically test the CES framework. These assumptions that coastal geomorphology drives global variation in mangrove ecosystem properties have not been empirically tested under a macroecological perspective, nor have they been validated to predict mangrove SOC stocks beyond local or, at best, regional scales. Our analyses offer an alternative standpoint to the latitude-based framework proposed to account for the spatial variation in carbon and nutrient density and stoichi-ometry in mangrove soils13. Particularly, soil phosphorus limitation (high N:P ratios) was evident in peat-dominated coastal settings (carbonate sites in the Florida Coastal Everglades and compos-ite sites on the Costa Rica Caribbean coast), which receive, if any, negligible river input (Fig. 2 and Supplementary Table 3). Sites with low soil N:P ratios, such as the Amazon and Caravelas river del-tas located in the low tropics, confirm the significance of riverine inorganic phosphorus input to such patterns along coastal zones14,15. However, mangrove soils with low N:P ratios associated with deltaic coastal settings have also been reported in temperate inor-ganic sediment-rich coastal landforms16 as a response to the high yield of rich phosphorus-adsorbed sediment particles in coastal waters14. Moreover, the stoichiometric signature found across dis-tinct coastal landforms further supports the role of CES in deter-mining mangrove soil carbon, nitrogen and phosphorus densities. The C:N:P stoichiometric ratio for mangrove soils (global average
902:38:1) is consistent with ratios described for other natural wet-lands (1,347:72:1)17. Our results also show that carbonate settings and alluvial coastal landforms further differentiate into two distinct CES groups, one characterized by low and narrow C:N:P stoichio-metric ratios due to the marked contribution of river discharge, and another characterized by high and wide-ranging ratios due to the absence of freshwater inputs and correspondingly lower inorganic sediment and nutrient loads (for example, phosphorus adsorbed to sediment particles) (Supplementary Table 3).
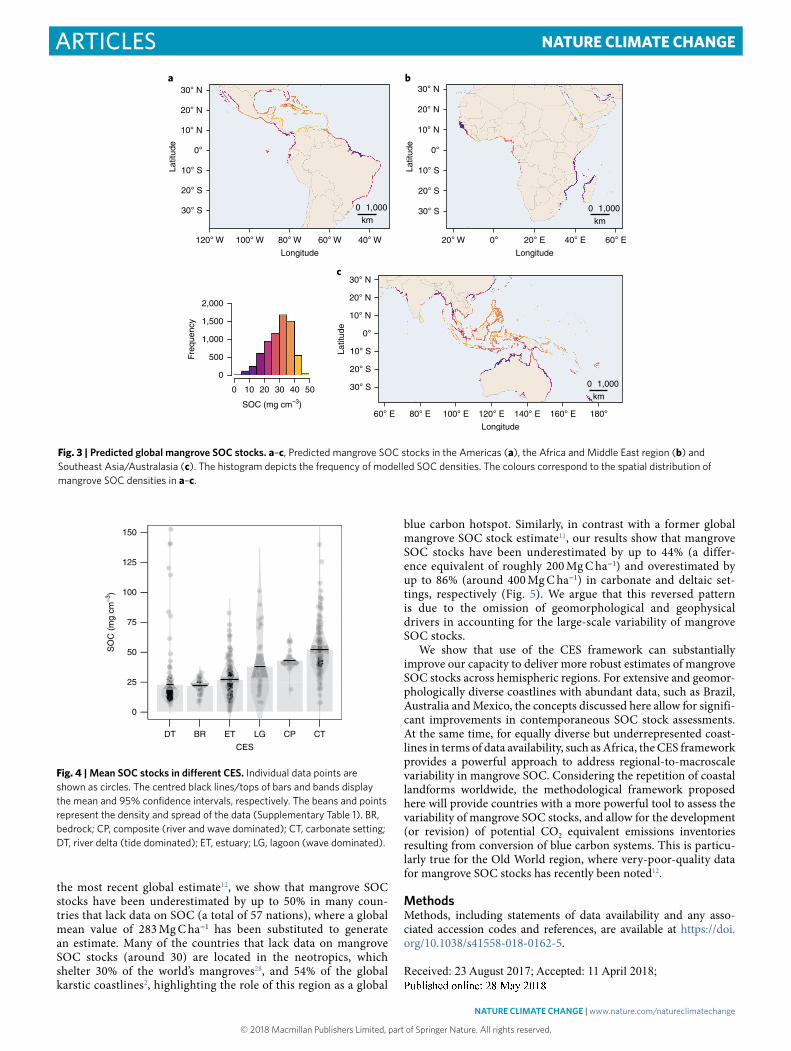
Global variation in mangrove SOC stocksUsing this validated CES framework, we fit climate-geophysical models to estimate SOC density in mangrove soils across the globe. We assessed the roles of tides, river discharge, temperature, pre-cipitation and PET on mangrove SOC stocks (see Methods and Supplementary Table 5 for details). We found that tidal amplitude (TD) and minimum temperature (Tmin) are the major drivers of SOC, accounting for 20% of the total variability in global mangrove SOC stocks (degrees of freedom = 139, P < 0.0001), which ranged from 3.38 to 46.41 mg C cm−3 (median: 31.12 mg C cm−3) (Fig. 3a–c). The relative contributions of these variables to the global variability explained by the model18 were 83 and 17% for TD and Tmin, respec-tively. The following equation was used to predict global mangrove SOC stocks.
= . + − . + . Tlog SOC 3 207 ( 0 002TD) (0 029 ) (1)min
We predicted a total global budget of 2.26 Pg carbon in mangrove soils. Our model predicted higher SOC density values for carbon-ate settings and lower values for deltaic and estuarine coastal set-tings (Fig. 3a–c), which is consistent with both our field dataset and values reported in the literature (Supplementary Fig. 3). Mangrove SOC stocks (in the top metre of soil) are 25 to 50% higher in carbon-ate, peat-dominated settings compared with sediment-rich settings (Fig. 4).
Our results show that SOC in mangroves is mostly constrained by geomorphology and geophysical processes acting at the coastal setting landscape level rather than climatic gradients. TD explains most of the variability in mangrove SOC density. The mechanisms associated with tidal hydrodynamics include biogeochemical and
C (
mg
cm–3
)
N (
mg
cm–3
)
P (
mg
cm–3
)
7.2
39.4
71.6
ET1ET2
CT CP BR DT LG DT1ET
a
0.6
2.2
3.8
ET2ET1
CT CP DT ETDT1
BR LG
b
0.1
0.3
BR DTET2
ET1DT1
ET CP LG CT
c
C:N
rat
io
8.8
24.3
39.8
LG BRET1
CT CPDT1
ET2DT ET
d
N:P
rat
io
5.0
90.8
176.7
CT CPET1
ET2ET LG DT1
DT BR
e
C:P
rat
io
113.4
2,901.2
5,689.0
CT CPET1
ET2 LG ETDT1
DT BR
f
CES
Fig. 1 | Mangrove SOC, total nitrogen and total phosphorus, and C:N, N:P and C:P ratios in distinct CES in the neotropics. a–c, Density of mangrove SOC (a), nitrogen (b) and phosphorus (c). d–f, Stoichiometry for C:N (d), N:P (e) and C:P (f). A Scott–Knott post-hoc multiple comparisons test was used. Points and vertical lines represent the mean, minimum and maximum values for each group. Groups means are differentiated by colours that denote statistical difference (P = 0.05). BR, bedrock; CP, composite (river and wave dominated); CT, carbonate setting; DT, river delta (tide dominated); DT1, river delta (wave dominated); ET, estuary; ET1/ET2, estuaries in carbonate settings; LG, lagoon (wave dominated).
© 2018 Macmillan Publishers Limited, part of Springer Nature. All rights reserved.
NATuRE CLiMATE CHANGE | www.nature.com/natureclimatechange
ArticlesNature Climate ChaNge
physical processes. Tides promote nutrient exchange and aeration of soil layers, which reduces the accumulation of sulphides, ulti-mately controlling organic matter decomposition rates in man-grove soils; regular and permanent tidal flooding promotes higher mineralization, whereas seldom-flooded environments favour the accumulation of autochthonous SOC19,20. Tides also carry abun-dant sediment, promoting lateral trapping of mud due to reduced water flow within mangrove forests21. Temperature explains the remaining variation in SOC, suggesting that this environmental driver has a secondary role in controlling mangrove SOC stocks at the global scale. A possible explanation as to why SOC stocks increase with temperature is related to how root growth and decomposition respond to elevated temperatures. A recent global review shows that mangrove root carbon production exceeds min-eralization rates, and that these processes are explained—among other factors (for example, hydrogeomorphic setting type and
latitude)—by temperature22, resulting in greater net production (soil organic matter accumulation) and carbon flux to the soil23. We believe that at the global scale this relationship is hampered by the heterogeneity of environments (that is, distinct CES and fringe versus interior zones) across climatic gradients represented in our dataset, in addition to the relative reduced climate variability within the tropical zone compared with studies that span temper-ate and boreal zones.
It should be noted that equation (1) reflects the method we used to evaluate the fitted models (that is, the Akaike’s information cri-terion (AIC); see methods and Supplementary Table 5 for details). Because of the mathematical intricacies of the AIC, it is unlikely that all the starting variables will compose the final model. Briefly, this method is based on the trade-off between goodness of fit and model complexity, where the simplest model (for example, one with fewer terms or variables, but with the same explanatory power as more complex models) is selected. Thus, other environmental drivers (that is, PET and river discharge) were not included in equation (1), but such exclusion does not imply that these variables are irrelevant to mangrove SOC variability. For instance, regional analyses have shown that precipitation and PET are also important drivers of mangrove ecosystem attributes24–26. Similarly, river dis-charge—an acknowledged driver of mangrove structural and func-tional properties3,7,20—was not selected as a significant variable, probably due to the low resolution of available data, as discussed elsewhere26,27. Moreover, it must be emphasized that the candidate models (Supplementary Table 5) are contingent on the depen-dent variable (that is, SOC) dataset. To the best of our knowledge, we used nearly all the existing data available that best represent mangrove SOC stocks within the top metre of soil (see Methods for details). Also, from the several global databases available, we selected classic environmental variables acknowledged as impor-tant drivers of mangrove SOC. Thus, we are confident that a thor-ough examination of the possibilities was performed, given data availability in terms of both dependent and independent variables. However, we believe that upon the availability of more high-qual-ity data on mangrove SOC, improved models may be developed and other environmental variables might be considered, probably yielding new possibilities in terms of significant predictors of SOC stocks. In this respect, the incorporation of new data points where information is currently absent would increase the representation of environmental variability, which is constrained by the spatial dis-tribution of observations present in a dataset. This is particularly true for river discharge. Besides the relative low resolution of this dataset, information about this driver is absent for several cells con-taining mangrove and other environmental values. For this reason, many cells that did not contain information on river discharge were excluded from the dataset used to develop the models. Despite the current data availability, our modelling approach highlights spa-tial gaps and raises awareness that future efforts should consider CES methodology when scaling up mangrove ecosystem properties from the site to the global scale.
Here, we take a huge step further by empirically testing a robust model that synthesizes complex geomorphological, geo-physical and climatic components in a simple equation that cap-tures spatial variability in mangrove SOC stocks across multiple scales irrespective of hemispheric, biogeographic or political divisions. Previous attempts to explain and predict global man-grove SOC have relied solely on climate-based models11 or, more recently, mean country-level statistics12. We also advance several core methodological aspects that have not been resolved by ear-lier concurrent global estimates, resolving issues related to data quality, spatial representativeness, pseudoreplication and model fine-tuning (see Methods for details). As a result of our novel approach, our model reveals striking differences compared with former estimates of global mangrove SOC stocks. Relative to
Riverdelta
River delta(wavedominated)
Bedrock
Lagoon(wavedominated)
Estuary
Estuary incarbonatesetting (ET2)
Estuary incarbonatesetting (ET1)
Composite(river andwavedominated)
Carbonatesetting
Pmin
PETTmin
TD
RD
Fig. 2 | The effects of river and tidal power, temperature, precipitation, and PET lead to the formation of distinct CES and explain mangrove soil properties. Top, Example coastline diagrams show how CES are colour coded in the ordination (nMDS). Bottom, nMDS based on Bray–Curtis dissimilarities of mangrove soil properties (C:N and N:P ratios and bulk density). Specific sites (n = 81) show a gradient ranging from river-dominated sediment-rich (left) to peat-dominated with negligible or no river input CES (right). The sizes of the data points are proportional to the N:P ratios for each site, indicating the role of rivers in regulating the nutrient (for example, P) load to coastal wetlands. Climatic drivers have a secondary role in separating the sites along the vertical axis. The stress value for this ordination was 0.07, indicating a good fit of the multivariate data in two-dimensional space. The arrows indicate fitted environmental variables that are significantly correlated (P = 0.05) with nMDS coordinates. See Methods for a detailed description of the CES and environmental variables used in this analysis. RD, river discharge.
© 2018 Macmillan Publishers Limited, part of Springer Nature. All rights reserved.
NATuRE CLiMATE CHANGE | www.nature.com/natureclimatechange
Articles Nature Climate ChaNge
the most recent global estimate12, we show that mangrove SOC stocks have been underestimated by up to 50% in many coun-tries that lack data on SOC (a total of 57 nations), where a global mean value of 283 Mg C ha−1 has been substituted to generate an estimate. Many of the countries that lack data on mangrove SOC stocks (around 30) are located in the neotropics, which shelter 30% of the world’s mangroves28, and 54% of the global karstic coastlines2, highlighting the role of this region as a global
blue carbon hotspot. Similarly, in contrast with a former global mangrove SOC stock estimate11, our results show that mangrove SOC stocks have been underestimated by up to 44% (a differ-ence equivalent of roughly 200 Mg C ha−1) and overestimated by up to 86% (around 400 Mg C ha−1) in carbonate and deltaic set-tings, respectively (Fig. 5). We argue that this reversed pattern is due to the omission of geomorphological and geophysical drivers in accounting for the large-scale variability of mangrove SOC stocks.
We show that use of the CES framework can substantially improve our capacity to deliver more robust estimates of mangrove SOC stocks across hemispheric regions. For extensive and geomor-phologically diverse coastlines with abundant data, such as Brazil, Australia and Mexico, the concepts discussed here allow for signifi-cant improvements in contemporaneous SOC stock assessments. At the same time, for equally diverse but underrepresented coast-lines in terms of data availability, such as Africa, the CES framework provides a powerful approach to address regional-to-macroscale variability in mangrove SOC. Considering the repetition of coastal landforms worldwide, the methodological framework proposed here will provide countries with a more powerful tool to assess the variability of mangrove SOC stocks, and allow for the development (or revision) of potential CO2 equivalent emissions inventories resulting from conversion of blue carbon systems. This is particu-larly true for the Old World region, where very-poor-quality data for mangrove SOC stocks has recently been noted12.
MethodsMethods, including statements of data availability and any asso-ciated accession codes and references, are available at https://doi.org/10.1038/s41558-018-0162-5.
Received: 23 August 2017; Accepted: 11 April 2018; Published: xx xx xxxx
a30° N
20° N
10° N
Latit
ude
10° S
20° S
30° S
120° W
2,000
1,500
Freq
uenc
y
1,000
500
0
0 10 20 30 40
SOC (mg cm–3)
50
100° W 80° W
Longitude Longitude
60° W 40° W 20° W 0° 20° E 40° E 60° E
km
0 01,000
km
1,000
0°
b30° N
20° N
10° N
Latit
ude
10° S
20° S
30° S
0°
Longitude
60° E 80° E 100° E 120° E 140° E 160° E 180°
0
km
1,000
c30° N
20° N
10° N
Latit
ude
10° S
20° S
30° S
0°
Fig. 3 | Predicted global mangrove SOC stocks. a–c, Predicted mangrove SOC stocks in the Americas (a), the Africa and Middle East region (b) and Southeast Asia/Australasia (c). The histogram depicts the frequency of modelled SOC densities. The colours correspond to the spatial distribution of mangrove SOC densities in a–c.
0
25
50
75
100
125
150
DT BR ET LG CP CT
CES
SO
C (
mg
cm–3
)
Fig. 4 | Mean SOC stocks in different CES. Individual data points are shown as circles. The centred black lines/tops of bars and bands display the mean and 95% confidence intervals, respectively. The beans and points represent the density and spread of the data (Supplementary Table 1). BR, bedrock; CP, composite (river and wave dominated); CT, carbonate setting; DT, river delta (tide dominated); ET, estuary; LG, lagoon (wave dominated).
© 2018 Macmillan Publishers Limited, part of Springer Nature. All rights reserved.
NATuRE CLiMATE CHANGE | www.nature.com/natureclimatechange

ArticlesNature Climate ChaNge
References 1. Boyd, R., Dalrymple, R. & Zaitlin, B. A. Classification of clastic coastal
depositional environments. Sediment. Geol. 80, 139–150 (1992). 2. Dürr, H. H. et al. Worldwide typology of nearshore coastal systems:
defining the estuarine filter of river inputs to the oceans. Estuaries Coasts 34, 441–458 (2011).
3. Thom, B. G. in Mangrove Ecosystems in Australia: Structure, Function and Management (ed. Clough, B. F.) 3–17 (Australian National Univ. Press, Canberra, 1982).
4. Woodroffe, C. in Coastal and Estuarine Studies—Tropical Mangrove Ecosystems Vol 41 (eds Robertson, A. I. & Alongi, D. M.) 7–41 (American Geophysical Union, Washington DC, 1992).
5. Wheaton, J. M., Gibbins, C., Wainwright, J., Larsen, L. & McElroy, B. Multiscale feedbacks in ecogeomorphology. Geomorphology 126, 265–268 (2011).
6. Twilley, R. R., Chen, R. & Hargis, T. Carbon sinks in mangroves and their implications to carbon budget of tropical coastal ecosystems. Water Air Soil Pollut. 64, 265–288 (1992).
7. Twilley, R. R. in Maximum Power: the Ideas and Applications of H. T. Odum (ed. Hall, C. A. S.) 43–62 (Univ. Press Colorado, Niwot, 1995).
8. Allison, S. D., Wallenstein, M. D. & Bradford, M. A. Soil-carbon response to warming dependent on microbial physiology. Nat. Geosci. 3, 336–340 (2010).
9. Janssens, I. A. et al. Reduction of forest soil respiration in response to nitrogen deposition. Nat. Geosci. 3, 315–322 (2010).
10. Diamond, J. M. & Case, T. J. Community Ecology (Harper & Row, New York, 1986).
11. Jardine, S. L. & Siikamäki, J. V. A global predictive model of carbon in mangrove soils. Environ. Res. Lett. 9, 104013 (2014).
12. Atwood, T. B. et al. Global patterns in mangrove soil carbon stocks and losses. Nat. Clim. Change 7, 523–528 (2017).
13. Lovelock, C. E., Feller, I. C., Ball, M. C., Ellis, J. & Sorrell, B. Testing the growth rate vs. geochemical hypothesis for latitudinal variation in plant nutrients. Ecol. Lett. 10, 1154–1163 (2007).
14. Harrison, J. A. et al. Dissolved inorganic phosphorus export to the coastal zone: results from a spatially explicit, global model. Glob. Biogeochem. Cycles 19, GB4S03 (2005).
15. Syvitski, J. P. M., Vörösmarty, C. J., Kettner, A. J. & Green, P. Impact of humans on the flux of terrestrial sediment to the global coastal ocean. Science 308, 376–380 (2005).
16. Henry, K. M. & Twilley, R. R. Soil development in a coastal Louisiana wetland during a climate-induced vegetation shift from salt marsh to mangrove. J. Coast. Res. 29, 1273–1283 (2013).
17. Xu, X., Thornton, P. E. & Post, W. M. A global analysis of soil microbial biomass carbon, nitrogen and phosphorus in terrestrial ecosystems. Glob. Ecol. Biogeogr. 22, 737–749 (2013).
18. Grömping, U. R package relaimpo: relative importance for linear regression. J. Stat. Softw. 17, 139–147 (2006).
19. Castañeda-Moya, E., Twilley, R. R. & Rivera-Monroy, V. H. Allocation of biomass and net primary productivity of mangrove forests along environmental gradients in the Florida Coastal Everglades, USA. Forest Ecol. Manag. 307, 226–241 (2013).
20. Lovelock, C. E. et al. The vulnerability of Indo-Pacific mangrove forests to sea-level rise. Nature 526, 559–563 (2015).
21. Woodroffe, C. D. et al. Mangrove sedimentation and response to relative sea-level rise. Ann. Rev. Mar. Sci. 8, 243–266 (2016).
22. Ouyang, X., Lee, S. Y. & Connolly, R. M. The role of root decomposition in global mangrove and saltmarsh carbon budgets. Earth Sci. Rev. 166, 53–63 (2017).
23. Pregitzer, K. S., King, J. S., Burton, A. J. & Brown, S. E. Responses of tree fine roots to temperature. New Phytol. 147, 105–115 (2000).
24. Feher, L. C. et al. Linear and nonlinear effects of temperature and precipitation on ecosystem properties in tidal saline wetlands. Ecosphere 8, e01956 (2017).
25. Gabler, C. A. et al. Macroclimatic change expected to transform coastal wetland ecosystems this century. Nat. Clim. Change 7, 142–147 (2017).
26. Rovai, A. S. et al. Scaling mangrove aboveground biomass from site-level to continental-scale. Glob. Ecol. Biogeogr. 25, 286–298 (2016).
27. Hutchison, J. et al. Building an expert-judgment-based model of mangrove fisheries. Am. Fish. Soc. Symp. 83, 17–42 (2015).
28. Giri, C. et al. Status and distribution of mangrove forests of the world using earth observation satellite data. Glob. Ecol. Biogeogr. 20, 154–159 (2011).
AcknowledgementsThe Brazilian foundations CAPES and CNPq, Louisiana Sea Grant College and NSF Coastal SEES programme (EAR-1427389) funded this work. The CAPES/CNPq Science without Borders and Post-doctoral Senior programmes provided international fellowships for A.S.R. (BEX1930/13-3), P.R.P. (18379/12-5) and A.L.F (209666/13-7). We are thankful to the Florida Coastal Everglades Long-Term Ecological Research programme (permit EVER-2013-SCI-0058), Rookery Bay National Estuarine Research Reserve (especially K. Cunniff) and J.N. “Ding” Darling National Wildlife Refuge (permit FWS 14042) for facilitating the collection of samples. We also thank S. L. Jardine for kindly providing a high-resolution mangrove soil carbon density grid to serve as a reference in our modelling analyses. We are extremely indebted to T. Blanchard (Department of Oceanography and Coastal Sciences, LSU) and P. Leandro (CATIE) for support with laboratory analyses, as well as to W. Weis and R. Menghini for assistance during fieldwork and A. Christensen and A. McCall for assistance with manipulation of the raster files.
Author contributionsA.S.R. conceived the study, performed the statistical analyses and wrote the manuscript draft. P.R. and A.S.R. performed the modelling analyses. R.R.T., P.R.P., E.C.-M. and P.R. contributed to development of the work in general and helped to write the final version of the paper. M.C.-J. collected and analysed soil samples from El Salvador, Panama and some sites in Costa Rica. P.R.P., E.C.-M., M.M.-V., P.A.H., J.C.S. and A.L.F. contributed to field sampling and laboratory analyses.
Competing financial interestsThe authors declare no competing interests.
Additional informationSupplementary information is available for this paper at https://doi.org/10.1038/s41558-018-0162-5.
Reprints and permissions information is available at www.nature.com/reprints.
Correspondence and requests for materials should be addressed to A.S.R.
Publisher’s note: Springer Nature remains neutral with regard to jurisdictional claims in published maps and institutional affiliations.
150° W 100° W 50° W 0° 50° E 100° E 150° E
40° S
20° S
0°
20° N
40° N
Latit
ude
Longitude
0 1,000
kmF
requ
ency
−20 −10 0 10 20 30 40
0
500
1,000
1,500
Absolute difference in SOC(mg cm−3)
Fig. 5 | inter-study comparison of global mangrove SOC density estimates. Differences in global mangrove SOC density estimates between ref. 11 and the present study (see Fig. 3a–c). The histogram depicts the frequency of SOC density differences. The colours correspond to the spatial distribution of SOC density differences on the map.
© 2018 Macmillan Publishers Limited, part of Springer Nature. All rights reserved.
NATuRE CLiMATE CHANGE | www.nature.com/natureclimatechange

Articles Nature Climate ChaNge
MethodsCES hypothesis. In this study, we used an acknowledged and independent classification of CES, including deltas (river dominated), estuaries (tide dominated), lagoons (wave dominated), composite (river and wave dominated), bedrock (drowned bedrock valley) and carbonate settings3,4. Here, we provide an overview of the dominant types of CES included in our analyses, and suggest consultation of the original sources for additional information3,4. One of the major factors defining the different coastal settings in this study is the source of sediment (that is, river-borne), which represents a combination of geophysical processes and local geology that influence mangrove ecology3,4,29. Clastic sediments, delivered from upland catchments and deposited along the coastal zone, form subaerial intertidal platforms that mangrove wetlands colonize, resulting in unique forested habitats. Such terrigenous sediment systems can be classified into two broad subgroups based on the relative effects of river, tides and waves controlling sediment transport. Muddy coasts represent continental margins influenced by substantial river inputs characteristic of prograding deltaic coasts. Such settings are the active zone of deposition from major river basins, or may be downstream, where massive fluid muds are transported by nearshore currents and accumulate far away from deltaic environmental settings to form muddy shorelines29. This group of river-dominated deltaic coasts contains landforms shaped by the combination of tidal and wave processes forming a continuum of geomorphological settings1. Mangroves are often restricted to abandoned deltaic floodplains (that is, former distributaries) where salt-tolerant plants thrive. The second group of clastic systems is represented by transgressional continental margins forming embayments, which are bounded zones where river and sea water mix, creating major estuaries around the world. These estuarine coasts have a wide range of freshwater- and marine-sourced sediment inputs, from rias to lagoons (tide and wave dominated). These coastal systems do not have the extensive muddy shorelines of deltaic systems, but mangroves in such settings can be a significant component of the total area of the estuary (wetland plus bay area), as clastic sediments are deposited and build an intertidal platform for the colonization of vegetation. These coastal settings may also interact with river-dominated processes, being shaped over time by the abandonment of the river to leave estuaries, lagoons, bedrock and composite coastal landscapes. Estuaries, or tide-dominated systems, are also allochthonous environments, but the tidal range is higher and associated with bidirectional tidal currents. In these settings, wave power is typically low and tidal currents are responsible for reworking river-borne sediments within the system. Lagoons are wave-dominated coastlines, but with relatively low river discharge. Wave energy re-works river-borne sediments, forming longshore barrier islands, which enclose drowned river valleys. Mangroves develop on fluvial deposits along the protected margins of these broad elongated lagoons. Composite river- and wave-dominated settings occur where rivers deliver large sediment loads into wave-dominated coastlines, forming complex settings sharing deltaic and lagoon characteristics. Mangroves usually occupy and respond to diverse types of landforms formed within composite settings (that is, abandoned distributaries, river mouths and lagoons). Bedrocks are coastal embayments formed by the rising postglacial sea level. Mangroves occur on relatively poorly developed muddy substrates along the valley edges as a result of limited sediment supply from both river and marine sources. In contrast with these coastal systems dominated by clastic sediments, the third group of CES results from in situ processes of sediment deposition, such as carbonate formation along reef coasts, known as biogenic formation. Mangroves in these types of continental or island landforms are dominated by peaty and calcareous soils that are a combination of carbonate formation and mangrove productivity, both of which originate largely through carbon fixation. The classification of carbonate settings used here comprises carbonate platforms (or karstic environments) and Holocene reef tops, including mangroves bordering oceanic islands. In these settings, plant–soil feedback is partly driven by the calcium carbonate soil matrix, where the phosphorus supply is often limited due to carbonate chemisorption reactions and the sequestering of phosphorus into recalcitrant organic pools, which reduces the availability of exchangeable phosphorus to plants30. Phosphorus limitation stimulates below-ground biomass accumulation, resulting in elevated SOC density31.
To test the hypothesis that these different CES drive macroscale variation in mangrove soil nutrient density and the resulting carbon storage, we used soil C:N:P ecological stoichiometry data obtained from 36 sites across the neotropics (27 sites for carbon, nitrogen and phosphorus, and 9 for SOC). These sites were classified into distinct CES following the categorization system provided above3,4. We constrained our hypothesis testing to the neotropics due to the lack of precise SOC, nitrogen and phosphorus data representative of the top-metre soil layer in the Old World mangroves12. Despite not having included mangrove sites from the Old World, our experimental design comprised the global diversity of CES that mangroves can possibly thrive in2,3, incorporating most of the environmental heterogeneity these ecosystems are subjected to (for example, micro- to macrotidal regimes, low to largest river discharges and range centres to range limits both north and south of the equator) (Supplementary Table 1). Our sampling strategy and factorial design considered CES and sites (nested within CES) as factors. CES were replicated by sampling mangrove sites situated either in independent watersheds or within the same watershed, maintaining a minimum distance of 50 km between sampling sites whenever possible. At each site, triplicate soil cores
were randomly collected within ~50 m from the shoreline using an AMS Gouge Auger (6.35 cm diameter; 1 m length). Following standardized protocols32, cores were gently extruded, divided into four depth intervals (0–15, 15–30, 30–50 and 50–100 cm) and subsampled at 5–10, 20–25, 37.5–42.5 and 67.5–72.5 cm depths. Samples were stored in plastic bags and kept on ice for further analyses. Soil samples were oven-dried at 60 °C to a constant weight, and weighed to estimate the soil bulk density (g dry mass cm–3 of wet soil). Organic carbon and total nitrogen densities were determined on two analytical replicates of each sample via dry combustion using an ECS 4010 elemental analyser (Costech Analytical Technologies) after acid fumigation to remove carbonates33. Total phosphorus was extracted with 1 N HCl after combustion in a furnace at 550 °C34 and determined by colorimetric analysis using a Flow Solution IV autoanalyser (OI Analytical). The carbon and nutrient densities (mg cm−3) for each depth interval were obtained from the product of the element content (dry mass, mg g−1), bulk density (g cm−3) and depth interval (cm). Depth-integrated values (that is, for the top metre) were obtained by averaging the SOC density values across all sampling depth intervals in a core. The stoichiometry of carbon, nitrogen and phosphorus in mangrove soils was calculated on a molar basis.
To test the influence of climatic and geophysical drivers on mangrove nutrient density and SOC stocks, we used global compilations widely used in macroecological studies. Climate variables were retrieved from the WorldClim database for the period 1950–2000 (ref. 35). These variables included the minimum temperature of the coldest month (Tmin, °C) and minimum precipitation of the driest month (Pmin, mm yr−1). The selection of variables was based on the assumption that plants are adapted to cope with climate variability by shifting biomass allocation patterns that are triggered by ecophysiological thresholds36,37. Tmin and Pmin represent extreme or limiting environmental factors38,39. Particularly, we used Pmin because, contrary to mean annual precipitation, it better portrays environmental thresholds that constrain ecosystem functionality37, thus regulating production (and decomposition) rates, and resulting SOC stocks. Recent analysis suggests that marked changes in ecosystem structural and functional properties occur closer to the lower hinge (for example, minimum values) of climate threshold zone boundaries (that is, the area of the maximum rate of change)24. Moreover, mean values are often not an interesting choice for ecological modelling because they seldom reasonably represent the existing variation in environmental conditions. Finally, from a merely statistical point of view, the mean annual precipitation and Pmin are positively correlated when fitted to our data grid (coefficient of determination, r2 = 0.77, P < 0.001). PET (mm yr−1) was calculated for the period 2000 to 2012 using data from the Moderate Resolution Imaging Spectroradiometer that globally cover vegetated land surface area at an eight day interval40. A global tidal range was calculated using the tidal atlas of finite element solutions41 by subtracting mean low water springs from mean high water springs. The highest value of the sum of the two major tidal constituents, either the semidiurnal amplitude (M2 + S2) or diurnal amplitude (K1 + O1), was then multiplied by two to obtain the tidal range (cm). Global river discharge data (m3 s−1) were extracted from the Global Runoff Data Centre archive42.
We used a hierarchical sampling design with sampling sites (random effect) nested within CES (fixed effect), and soil cores treated as experimental units. Normality and homoscedasticity were checked using Shapiro’s and Cochran’s tests, respectively, and when necessary data were log transformed (ln(x) + 1) to eliminate any major departures from these assumptions. Variation in the mean SOC, nitrogen and phosphorus densities and C:N:P ratios across CES was assessed using one-way analysis of variance (ANOVA) and associated variance components. The estimation of variance components is an important step in ANOVA because it is not constrained by sample size (as are probability-based metrics); rather, it provides an estimate of the magnitude of effects in ANOVA allowing for the determination of the contribution of a given factor to variability in a response variable43. Significant differences (α < 0.05) highlighted by the ANOVA were scrutinized using the Scott–Knott test—a clustering algorithm for multiple comparisons that avoids overlapping, a problem commonly observed in other post-hoc tests (that is, Tukey and Student–Newman–Keuls) where one or more treatment level is classified in more than one group44. We also performed multivariate ordination analyses to investigate clustering patterns resulting from similarities between the CES studied. Variables to be included in the multivariate ordination analyses were tested for autocorrelation (Spearman’s rank) and multicollinearity (variance inflation factor) (see Supplementary Fig. 4). Homoscedasticity of the multivariate data was assessed through a multivariate analogue of Levene’s test for homogeneity of variances, based on the average distance of group members to the group centroid (dispersions) in multivariate space45 (see Supplementary Fig. 5). Multivariate analyses were run on log-transformed data (ln(x) + 1). Group differences were evaluated using nMDS coupled with PERMANOVA46, on the basis of the Bray–Curtis dissimilarity index, using 999 permutations. The nMDS final solution was evaluated using dimensionality, stress, stability and Monte Carlo analyses (Supplementary Fig. 6). Differences identified in the PERMANOVA were investigated using posteriori pairwise permutational multivariate t-tests. We tested the influence of ecologically relevant geophysical (TD and river discharge) and climatic (Tmin, Pmin and PET) variables on mangrove soil stoichiometry7 using correlation analyses. All statistical analyses were performed using R (see Supplementary Information for details).
© 2018 Macmillan Publishers Limited, part of Springer Nature. All rights reserved.
NATuRE CLiMATE CHANGE | www.nature.com/natureclimatechange
ArticlesNature Climate ChaNge
Global-scale mangrove SOC modelling. Based on the empirically validated CES framework, we combined mangrove SOC data gathered by past global estimates11,12 with additional literature and unpublished data, and used this global dataset (Fig. 3a–c and Supplementary Table 1) to develop models to account for the global controls and variation in mangrove SOC stocks. It should be noted that the field-based dataset reported in this study (36 sites, as described above) accounts for 27% of the data available for the neotropics and includes new information on mangrove SOC (as well as nitrogen and phosphorus) for over 14 sites selected across the study area (Supplementary Table 1). Additional references were retrieved online on Scopus and the Institute for Scientific Information’s Web of Knowledge using ‘mangrove’ and ‘soil carbon’ as keywords. When needed, depth-integrated (top metre) mangrove SOC density values were converted from SOC stocks (Mg ha−1) by dividing SOC stocks by the total sampled depth. In contrast with past global mangrove SOC stock estimates, we only included in our analyses data representative of at least the first 0.3 m to a depth of 1 m (considering that most of the SOC results from root decay47, and roots are mostly distributed within the first top metre19), as well as the seasonal variability in near-surface SOC density48. We did not use mangrove SOC density values converted from loss on ignition, considering this relationship only explains around 60% of the variability in organic carbon density in mangrove soils32. In addition, in contrast with previous global mangrove SOC density mapping11, rather than considering each sampling depth interval in a core as an independent sample, we used depth-integrated SOC density from the top metre (that is, the mean value obtained from all depth intervals in a core). Besides capturing more appropriately the variability in SOC across depth, this procedure was necessary to ensure independency among samples, as well as to reduce the possibility of overfitting when developing regression. Finally, we excluded from our analyses newly colonized mangrove areas (pioneer and young mangroves), as well as sites subjected to anthropogenic disturbances. After applying these data quality criteria, we were left with 107 studies totalling 552 sites from 43 countries (Fig. 3a–c and Supplementary Table 1). We then categorized these sites into CES based on the definitions provided by ref. 3, later reviewed by ref. 4, as detailed above. The conceptual model in ref. 3 considers the prevailing coastal geomorphological features, such as the presence or absence of rivers, embayments, lagoons, barrier islands, chenier plains and carbonate substrates. Sites often fit clearly into a given category, but to ensure uniformity we used an expert-based evaluation process in which at least five of this paper’s authors were responsible for assigning categories to sites. Primarily, we assigned categories based on the information provided in the studies, and used Google Earth to confirm the classification (or to assign one when not given).
To develop the models, we determined the median values for mangrove SOC density within each cell that contained the observed values. This yielded 142 cells—the sample size used in our modelling analyses. For each of these cells, we retrieved values for the same environmental drivers used in our ordination analysis (nMDS; for example, Tmin, Pmin, PET, river discharge and TD). Mangrove SOC density values were regressed against these predictors using multiple regression (ordinary least squares) analyses. We used the natural logarithm of SOC when developing the model because it linearizes the residues and improves the model’s fit. Model selection was based on the AIC, as well as the significance of the model’s terms indicated by ordinary least squares summary, ANOVA and stepwise regression. The relative importance of each environmental driver of SOC density was determined by coefficient of determination R2 partitioning. Normality assumptions of model residues were checked using Shapiro’s test. Lack of fit was assessed using pure error analysis (see Supplementary Information for details of the statistical analyses). Model validation was performed based on k-fold cross-validation by splitting our dataset (Supplementary Table 1) into 80% for training and 20% for testing (Supplementary Fig. 3). To predict mangrove SOC stocks worldwide, we used a global mangrove area coverage mask49 to select cells where mangroves occur in a 0.25º resolution (approximately 25 km at the equator).
Data availability. The datasets generated during the current study are available from the corresponding author upon reasonable request.
References 29. Woodroffe, C. D. Coasts: Form, Process and Evolution (Cambridge Univ. Press,
Cambridge, 2002). 30. Koch, M. S., Benz, R. E. & Rudnick, D. T. Solid-phase phosphorus pools in
highly organic carbonate sediments of northeastern Florida Bay. Estuar. Coast. Shelf Sci. 52, 279–291 (2001).
31. Twilley, R. R., Castañeda-Moya, E., Rivera-Monroy, V. H. & Rovai, A. S. in Mangrove Ecosystems: A Global Biogeographic Perspective (eds. Rivera-Monroy, V. H., Lee, S. Y., Kristensen, E. & Twilley, R. R.) Ch. 5 (Springer International Publishing, Zurich, 2017).
32. Howard, J., Hoyt, S., Isensee, K., Pidgeon, E. & Telszewski, M. Coastal Blue Carbon: Methods for Assessing Carbon Stocks and Emissions Factors in Mangroves, Tidal Salt Marshes, and Seagrass Meadows (Conservation International, Intergovernmental Oceanographic Commission of UNESCO & International Union for Conservation of Nature, 2014).
33. Harris, D., Horwáth, W. R. & van Kessel, C. Acid fumigation of soils to remove carbonates prior to total organic carbon or carbon-13 isotopic analysis. Soil Sci. Soc. Am. J. 65, 1853–1856 (2001).
34. Aspila, K. I., Agemian, H. & Chau, A. S. Y. A semi-automated method for the determination of inorganic, organic and total phosphate in sediments. Analyst 101, 187–197 (1976).
35. Hijmans, R. J., Cameron, S. E., Parra, J. L., Jones, P. G. & Jarvis, A. Very high resolution interpolated climate surfaces for global land areas. Int. J. Climatol. 25, 1965–1978 (2005).
36. Osland, M. J. et al. Beyond just sea-level rise: considering macroclimatic drivers within coastal wetland vulnerability assessments to climate change. Glob. Change Biol. 22, 1–11 (2016).
37. Easterling, D. R. et al. Climate extremes: observations, modeling, and impacts. Science 289, 2068–2074 (2000).
38. Osland, M. J. et al. Mangrove expansion and contraction at a poleward range limit: climate extremes and land–ocean temperature gradients. Ecology 98, 125–137 (2017).
39. Osland, M. J. et al. Climatic controls on the global distribution, abundance, and species richness of mangrove forests. Ecol. Monogr. 87, 341–359 (2017).
40. Mu, Q., Zhao, M. & Running, S. W. Improvements to a MODIS global terrestrial evapotranspiration algorithm. Remote Sens. Environ. 115, 1781–1800 (2011).
41. Carrère, L., Lyard, F., Cancet, M., Guillot, A. & Roblou, L. FES 2012: a new global tidal model taking advantage of nearly 20 years of altimetry measurements. In Proc. 20 Years of Progress in Radar Altimetry Symp. (Avisno & cnes, 2012).
42. Fekete, B. M., Vörösmarty, C. J. & Grabs, W. High-resolution fields of global runoff combining observed river discharge and simulated water balances. Glob. Biogeochem. Cycles 16, 15-1–15-10 (2002).
43. Graham, M. H. & Edwards, M. S. Statistical significance versus fit: estimating the importance of individual factors in ecological analysis of variance. Oikos 93, 505–513 (2001).
44. Scott, A. J. & Knott, M. A cluster analysis method for grouping means in the analysis of variance. Biometrics 30, 507–512 (1974).
45. Anderson, M. J., Ellingsen, K. E. & McArdle, B. H. Multivariate dispersion as a measure of beta diversity. Ecol. Lett. 9, 683–693 (2006).
46. Anderson, M. J. A new method for non-parametric multivariate analysis of variance. Austral Ecol. 26, 32–46 (2001).
47. Saintilan, N., Rogers, K., Mazumber, D. & Woodroffe, C. Allochthonous and autochthonous contributions to carbon accumulation and carbon store in southeastern Australian coastal wetlands. Estuar. Coast. Shelf Sci. 128, 84–92 (2013).
48. Suárez-Abelenda, M. et al. The effect of nutrient-rich effluents from shrimp farming on mangrove soil carbon storage and geochemistry under semi-arid climate conditions in northern Brazil. Geoderma 213, 551–559 (2014).
49. Hamilton, S. E. & Casey, D. Creation of a high spatio-temporal resolution global database of continuous mangrove forest cover for the 21st century (CGMFC-21). Glob. Ecol. Biogeogr. 25, 729–738 (2016).
© 2018 Macmillan Publishers Limited, part of Springer Nature. All rights reserved.
NATuRE CLiMATE CHANGE | www.nature.com/natureclimatechange