Embed Size (px)
Citation preview

University of Bologna
G. Marcolini1, F. Giovanardi1, M. Rudan1, F. Buscemi1,
E. Piccinini1, R. Brunetti2, A. Cappelli2
1Advanced Research Center on Electronic Systems
(ARCES), University of Bologna, Bologna, Italy.
2Physics Department and S3, University of Modena
and Reggio Emilia, Modena, Italy.
This work has been carried out under the contract no. 3477131/2011 of the Intel Corporation, whose support is
gratefully acknowledged.
University of Bologna

University of Bologna M. Rudan 2
� Motivations and introduction.
� Heating induced by the dynamic measurement.
� Qualitative explanation – Quantitative approach.
� Model – Part a), b), c), d).
� Results.
� Conclusions.
University of Bologna M. Rudan 3
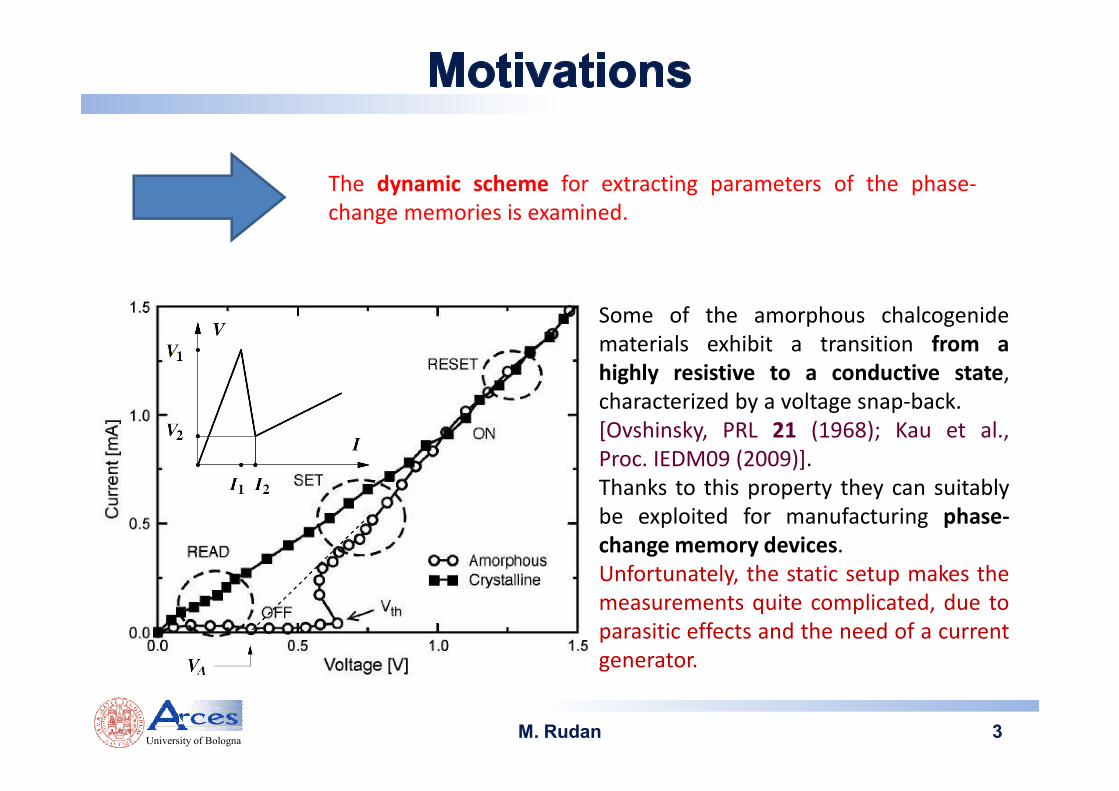
The dynamic scheme for extracting parameters of the phase-
change memories is examined.
Some of the amorphous chalcogenide
materials exhibit a transition from a
highly resistive to a conductive state,
characterized by a voltage snap-back.
[Ovshinsky, PRL 21 (1968); Kau et al.,
Proc. IEDM09 (2009)].
Thanks to this property they can suitably
be exploited for manufacturing phase-
change memory devices.
Unfortunately, the static setup makes the
measurements quite complicated, due to
parasitic effects and the need of a current
generator.

University of Bologna M. Rudan 4
� A more effective approach to measuring the electrical characteristics is that of exploiting the
intrinsic instability due to the negative differential-resistance branch of the PCM curve.
� Basing on this observation one arranges a dynamic-measurement setup.
� In this setup the characteristic of the external load intersects that of the PCM in the negative
resistance branch, so that the circuit is forced to oscillate.
V2
II2I1
V1
V
The dynamic measurement brings about a problem, shown in the next slide.
Load characteristic
Slope: R1
Slope: R2
University of Bologna M. Rudan 5
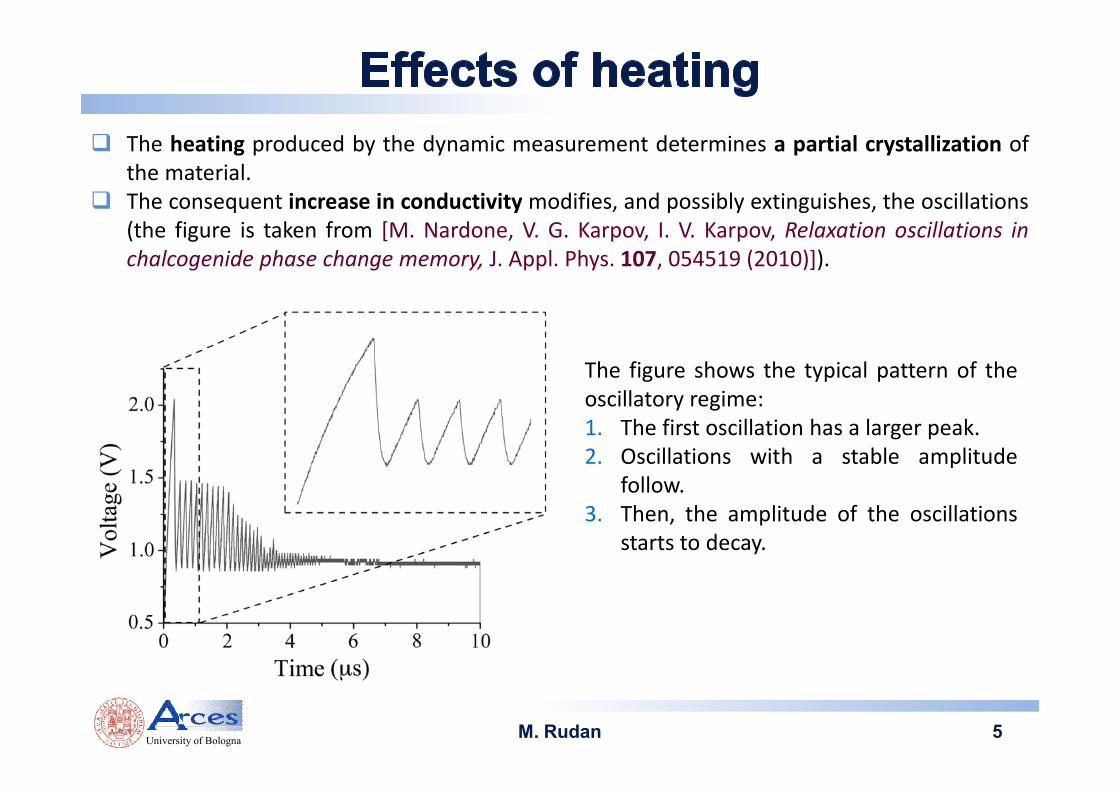
� The heating produced by the dynamic measurement determines a partial crystallization of
the material.
� The consequent increase in conductivity modifies, and possibly extinguishes, the oscillations
(the figure is taken from [M. Nardone, V. G. Karpov, I. V. Karpov, Relaxation oscillations in
chalcogenide phase change memory, J. Appl. Phys. 107, 054519 (2010)]).
The figure shows the typical pattern of the
oscillatory regime:
1. The first oscillation has a larger peak.
2. Oscillations with a stable amplitude
follow.
3. Then, the amplitude of the oscillations
starts to decay.

University of Bologna M. Rudan 6
� The strong decrease in amplitude from the first peak to the next ones is explained by the
sudden crystallization of a finite portion (the white half sphere right above the heater) due
to the concentration of the current flow-lines.
� The heater is much narrower than the amorphous region (black area), and the temperature
is the highest because the whole device is still amorphous.
The figure is adapted from [H.-S. P. Wong, S. Raoux, S.
Kim, J. Liang, J.P. Reifenberg, B. Rajendran, M. Asheghi,
K.E. Goodson, Phase Change Memory, Proc. of the IEEE
98, 12, pp. 2201–2227 (2010)].
� The conspicuous crystallization occurring in the first
oscillation leaves a smaller resistance for the next
cycles.
� The behavior from the second peak on is ascribed to
the decrease in the remaining volume of the
amorphous phase due to rapid heating and quenching,
that produces the formation of small crystalline nuclei
(nucleation).
University of Bologna M. Rudan 7
The description of the oscillations must include a time-dependent thermal analysis
along with the modeling of nucleation. Specifically, the following aspects must be
addressed simultaneously:
a) The behavior of a non-linear circuit embedding a negative differential-resistance
branch whose properties depend on time.
b) The thermal analysis of the circuit to find the time dependence of the PCM
temperature.
c) The time dependence of the crystallization of a part of the PCM volume.
d) The resistivity change of the PCM and its feedback on the shape of the N-shaped
characteristic.
A comprehensive modeling of the above events is carried out in the next pages.

University of Bologna M. Rudan 8
� The device under investigation is described as the series of an intrinsic part (the
PCM), bearing the N-shaped characteristic, and a constant resistance RS due to the
heater, crystalline cap, and upper contact.
� The bias parameters are the constant current I0 and a parallel resistance RL.
� The oscillatory regime is sustained by a parasitic capacitance C.
� The experimental datum is the voltage V(t) across the PCM-RS series.
� The functioning of the circuit is described by the two coupled equations:
� The branches of the oscillation’s limit cycle in the I,V plane are determined
essentially by the two points (I1,V1), (I2,V2) enclosing the negative-resistance
branch.
� Among the parameters, RS, C, I1, I2 are constant, while V1, V2 change with time
because of the progressive crystallization of the material.
University of Bologna M. Rudan 9
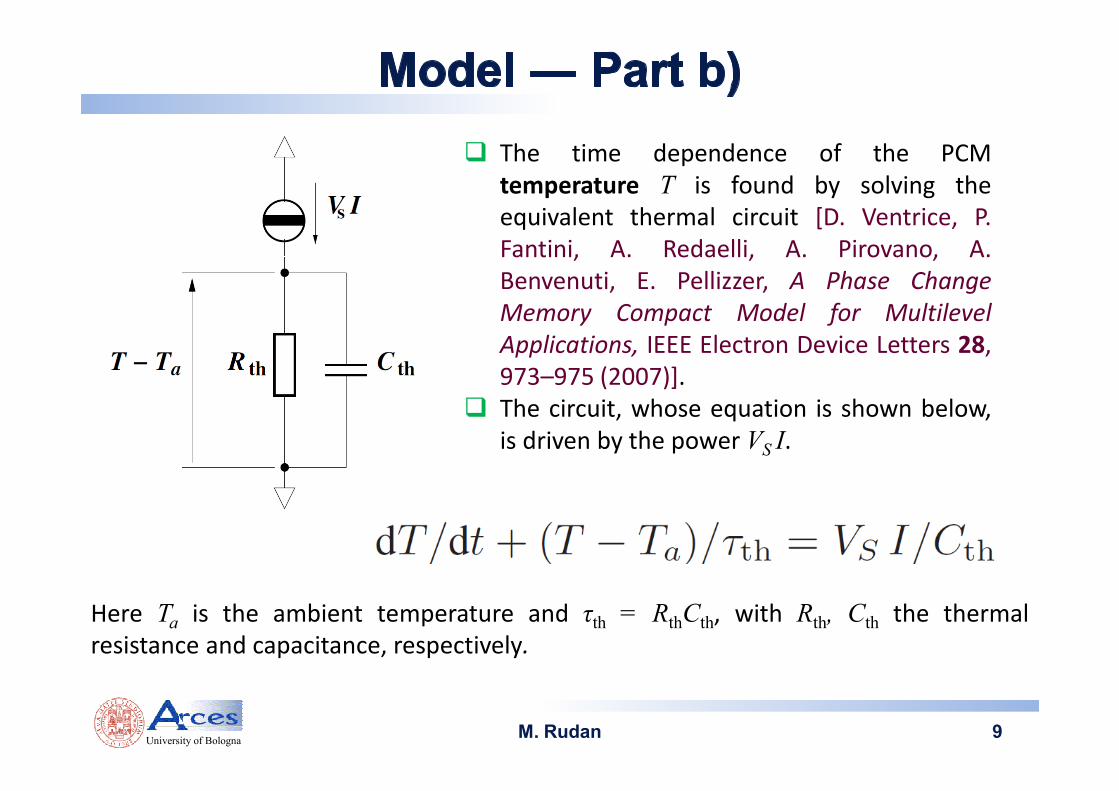
� The time dependence of the PCM
temperature T is found by solving the
equivalent thermal circuit [D. Ventrice, P.
Fantini, A. Redaelli, A. Pirovano, A.
Benvenuti, E. Pellizzer, A Phase Change
Memory Compact Model for Multilevel
Applications, IEEE Electron Device Letters 28,
973–975 (2007)].
� The circuit, whose equation is shown below,
is driven by the power VS I.
Here Ta is the ambient temperature and τth = RthCth, with Rth, Cth the thermal
resistance and capacitance, respectively.

University of Bologna M. Rudan 10
� Crystallization starts with the formation of small unstable clusters of the new phase
(nucleation process; a “nucleus” is the minimum-size volume that crystallizes).
� Eventually some clusters reach a critical radius beyond which they are stable, so that they
can grow rather than dissolve (growth process).
� Let g be the number of nuclei in a cluster, Ng(t) the concentration at time t of clusters made
of g nuclei, and Pg = Ng / Σg Ng the probability that a cluster is made of g nuclei.
The dynamic model for the crystallization phase transformation is taken from [E. M. Wright, P. K.
Khulbe, M. Mansuripur, Dynamic theory of crystallization in Ge2Sb2.3Te2 phase-change optical
recording media, Appl. Optics 39, 6695 (2000)] and reads (with )
g = 2, 3, . . ., with Cg the condensation rate (the number per unit time of g-sized clusters that
grow by one nucleus), Eg the evaporation rate (the number per unit time of g-sized clusters
from which one nucleus dissolves), and r the generation rate of the nuclei.
Part c) of the model has 3 fitting parameters.

University of Bologna M. Rudan 11
� During the oscillations the temperature increases beyond the glass temperature Tg. As a
portion of the volume crystallizes, the dissipated power decreases due to the decrease in
resistance.
� However, the input power is still sufficient to continue the crystallization process. In parallel,
the amplitude of the oscillations decays due to the decreasing resistance.
� When the whole device is in the amorphous phase the positive slopes are either R1 or R2
depending on the current.
� If the heating and quenching process ended up in the crystallization of the whole volume,
the two resistances R1, R2 would transform into the resistance Rc of a volume of crystalline
material equal to that of the original device.
When only part of the volume is crystallized, the expressions of the two positive-slope branches
become
where 0 ≤ λ(t) = (H − Ham) / H ≤ 1 is the fraction of the crystallized volume, with Ham(t) the
length of the PCM that has not crystallized yet and H the initial length. The value of λ(t) is
extracted from the nucleation equations.
University of Bologna M. Rudan 12
� The thermal resistance of the thermal circuit at t is calculated from
where A is the PCM cross-sectional area, ρth the thermal resistivity, and the suffix
“am” (“cr”) refers to the amorphous (crystalline) phase.
� The values used here are H = 100 nm, A = 180 × 180 nm2, ρamth = 500 KcmW−1, and
ρcrth = 200 KcmW−1 [A. Pirovano, A. L. Lacaita, A. Benvenuti, F. Pellizzer, S. Hudgens,
and R. Bez, Scaling Analysis of Phase-Change Memory Technology, in IEDM Tech.
Dig., 2009, pp. 699-702].
� The thermal capacitance does not depend on the material’s phase and reads Cth =
cpH A, cp = 1.25 Jcm−3K−1.
� The time dependence of V1, V2 changes the form of the N-shaped curve.
� The oscillation continues as long as the characteristic of the external load intersects
that of the PCM in the negative-resistance branch.

University of Bologna M. Rudan 13
To summarize, the model is made of the following equations, that form a set non-linear,
coupled, differential or algebraic equations, supplemented with the constitutive equations for
the coefficients r, Cg and Eg :
The differential part entails a non-trivial open integration, that is tackled by the integral-
equation method of [M. Rudan, A. Gnudi, E. Gnani, S. Reggiani, G. Baccarani, Improving the
Accuracy of the Schrödinger-Poisson Solution in CNWs and CNTs, Proc. SISPAD 2010, 307–310
(2010)].
University of Bologna M. Rudan 14
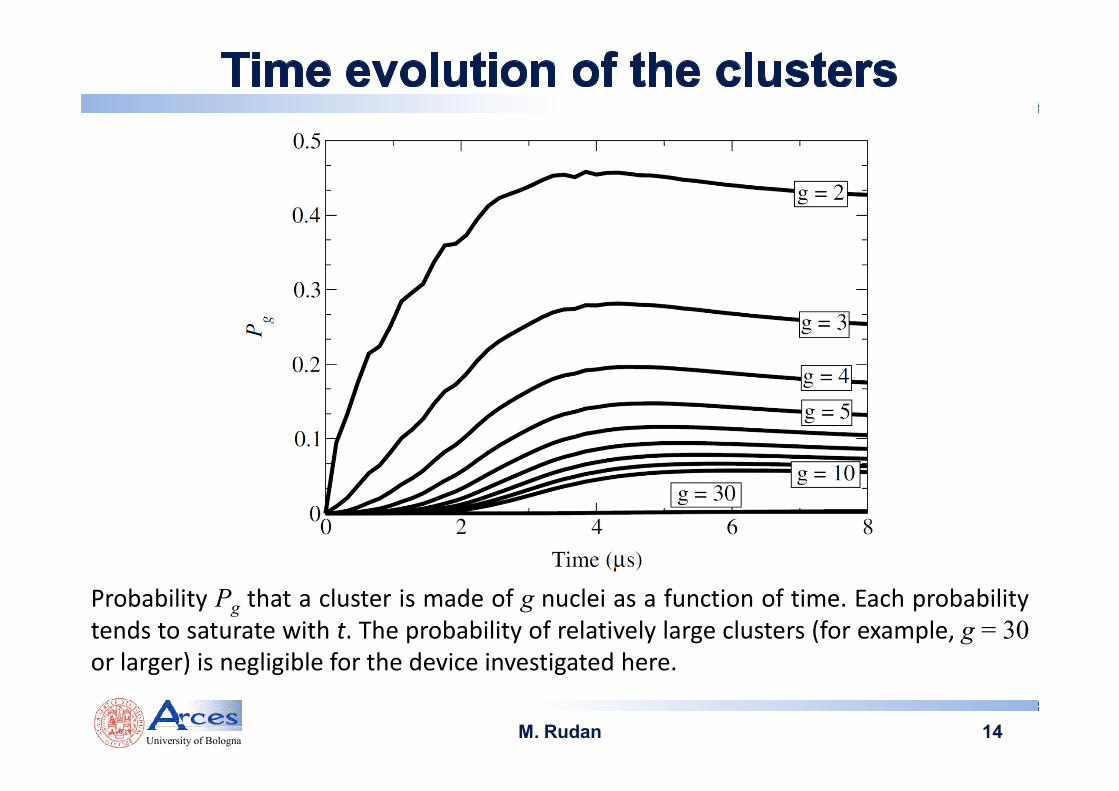
Probability Pg that a cluster is made of g nuclei as a function of time. Each probability
tends to saturate with t. The probability of relatively large clusters (for example, g = 30
or larger) is negligible for the device investigated here.

University of Bologna M. Rudan 15
� The figure shows the fraction λ of the crystallized volume as a function of time.
� The increase in λ corresponds to the decay of the peaks, and is relatively slower
than the oscillation period.
� A 1 ps discretization time
coupled with a 5th order
integral-equation method
gave the numerical
scheme the required
accuracy.
� The temperature of the
material never exceeded
the melting temperature
Tm.

University of Bologna M. Rudan 16
The outcome of the model has been compared with the experiments of [M.
Nardone, V. G. Karpov, I. V. Karpov, Relaxation oscillations in chalcogenide phase
change memory, J. Appl. Phys. 107, 054519 (2010)].� The experimental curve
has been converted into
a discrete set to make
the fitting of parameters
possible.
� The first, larger peak is
related to a three-
dimensional effect that
is not included in the
present model.
� The comparison has
been carried out
starting from the second
peak.
University of Bologna M. Rudan 17
� The model captures at the same time the period of the oscillations and the
decay of the voltage peaks due to the progressive crystallization of the
material.
� Due to the voltage decay the crystallization conditions become weaker and
weaker, and the fraction of crystallized material tends to saturate as shown
earlier in the figure.
� In the experiments considered here, when such a saturation occurs the
characteristic of the external load still intersects that of the PCM in the
negative differential-resistance branch (the oscillations stabilize).
� In other cases (not shown) the deformation of the PCM characteristic shifts
the bias point out of the characteristic of the external load, and theoscillations eventually come to an end.

University of Bologna M. Rudan 18
� A comprehensive model for the oscillation decay in PCM devices due to the
progressive crystallization of the material has been given.
� The equations proposed here are able to capture the experimentally-observed
macroscopic behavior of the device.
� With the aid of a thermal circuit monitoring the PCM temperature and the time
spent in the glass-melting temperature range, it is possible to evaluate the state of
the cell under different experimental conditions.
� A number of parameters appearing in the non-equilibrium nucleation theory have
been determined by a fitting procedure.
The method makes it possible to extract the parameters that describe the N-shaped
characteristic, including their heating-induced time variation, that are of a
paramount importance in the design of PCM.