Embed Size (px)
Citation preview

Hoek, E. 2009, Fundamentals of slope design. Keynote address at
Slope Stability 2009, Santiago, Chile, 9 - 11 November 2009.
Details from www.slopestability.cl
COPYRIGHT NOTICE
The following document is subject to copyright agreements
The attached copy is provided for your personal use on the understanding
that you will not distribute it and that you will not include it in other
published documents.
Fundamentals of slope design 2
Fundamentals of slope design
E. Hoek
203 – 2300 Capilano Crescent
North Vancouver, British Columbia
Canada, V7R 4H7
ABSTRACT
The management of the slopes in an open pit mine depends, amongst other things, upon
the assessment of the stability of these slopes. The recognition and analysis of the
different modes of failure are the main issues that will be addressed in this paper on the
fundamentals of slope design. A critical component of any stability analysis is estimation
of the strength of the rock mass and the discontinuities which control sliding and this
issue will be discussed in some detail. Other topics, such as the creation of reliable
geological and groundwater models and the assessment of risk and economic factors, will
be dealt with by other speakers at this Symposium and in the “Guidelines for Open Pit
Slope Design”.
Fundamentals of slope design 3
INTRODUCTION
The overall management of the slopes created during the development of an open
pit mine requires an ongoing assessment of the stability of these slopes. This assessment
depends on good geological, geotechnical and groundwater models as well as an
understanding of the risks and economic consequences of slope instability. A good open
slope design is one that integrates all of these factors to produce a balanced compromise
between safety, on the one hand, and operational and economic efficiency on the other.
The quality of the geological and groundwater models and of the geotechnical
information available cannot be over-emphasised. Without reliable background
information a slope stability analysis becomes a meaningless exercise. The methods for
collecting this information and setting up the appropriate models are discussed in detail
by other speakers at this Symposium and also in the “Guidelines for Open Pit Slope
Design” (1) which will be published at this Symposium. These topics will not be dealt
with in this paper which will concentrate on the recognition and analysis of the different
modes of slope failure and on the estimation of the rock mass and discontinuity
properties required for this analysis.
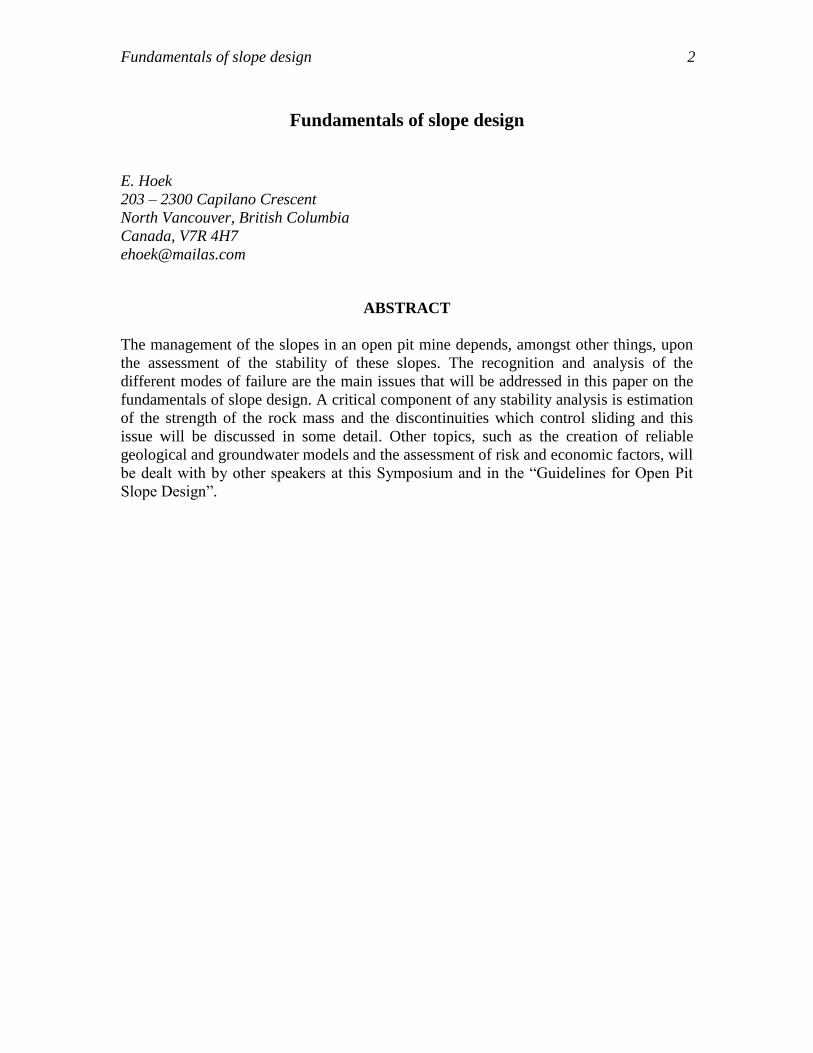
Figure 1 presents simplified illustrations of the four basic failure modes that have
been observed in open pit slopes. These failure processes may occur on either a bench
scale or as a failure of the overall pit slope and it is not unusual to encounter several of
these failure types or combinations of failure types in an open pit slope. All of these
failure modes, with the exception of toppling failure, involve simple gravitationally
driven sliding along planes or zones that are significantly weaker than the remaining rock
mass. In the case of toppling failure, in-dipping discontinuities create release surfaces
that allow columns of rock to topple away from the slope face.
Figure 1- Simplified illustrations of most common slope failure modes.
Fundamentals of slope design 4
METHODS OF SLOPE ANALYSIS
Limit equilibrium methods for the analysis of slope stability have been available
for decades and have now been developed to very effective design tools that permit
incorporation of the most complex geological and groundwater conditions. Automatic
searches for the most critical failure surface are included in many of these models and
probabilistic analyses are also available in some cases. A well designed limit equilibrium
program is probably the best tool for “what if” type analyses at a conceptual slope design
stage or to investigate failures and possible remedial actions. These models run very
efficiently on most personal computers and permit the designer rapidly to explore a wide
range of options.
The results produced by these models are only as good as the input data. A very
good geological model is essential and realistic estimates of rock mass and discontinuity
strengths are required. The advantages and limitations of limit equilibrium analyses are
best illustrated by means of a practical example.
Structurally controlled failure
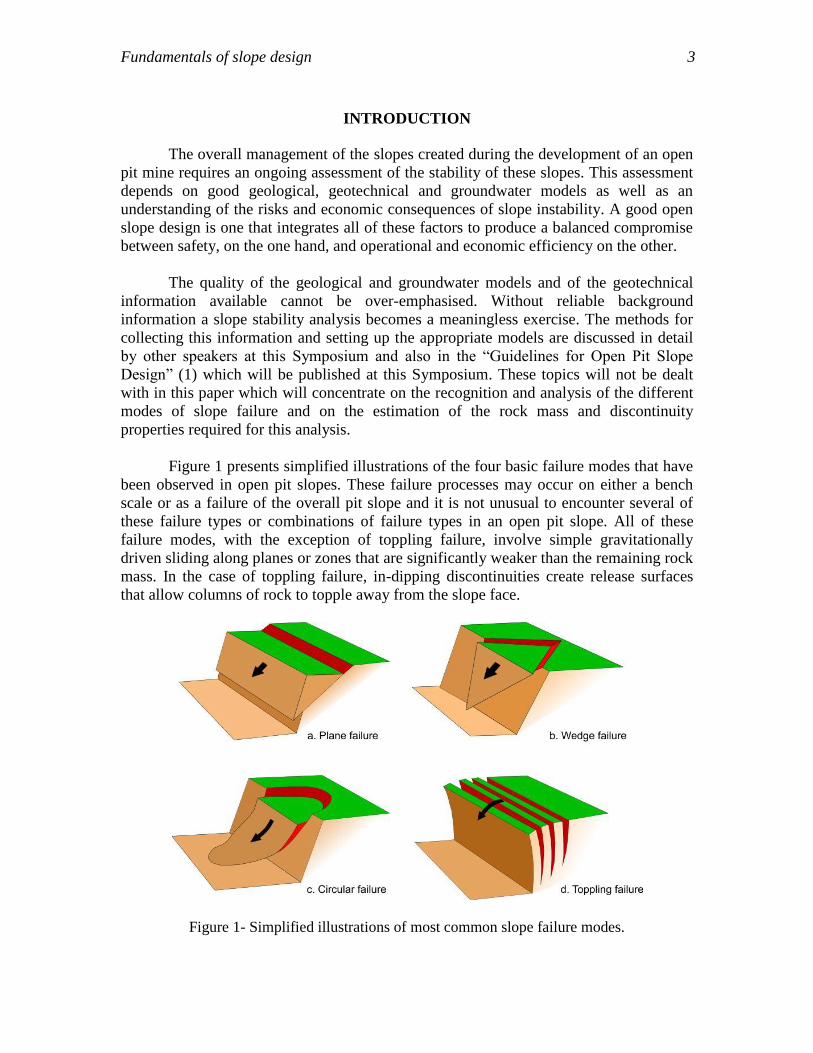
Consider the very simple case of a wedge failure in a 15 m high open pit mine
bench. As illustrated in Figure 2, the wedge slides along the line of intersection of two
planes and the back of the wedge is defined by a steeply dipping tension crack. It is
assumed that water pressures act on the sliding surfaces and in the tension crack and that
the wedge is subjected to a horizontal acceleration, due to an earthquake or production
blasting, of 0.08 g acting outwards in the direction of the line of intersection.
Figure 2 - Example of wedge failure in a bench, analysed using the program Swedge (2).
Fundamentals of slope design 5
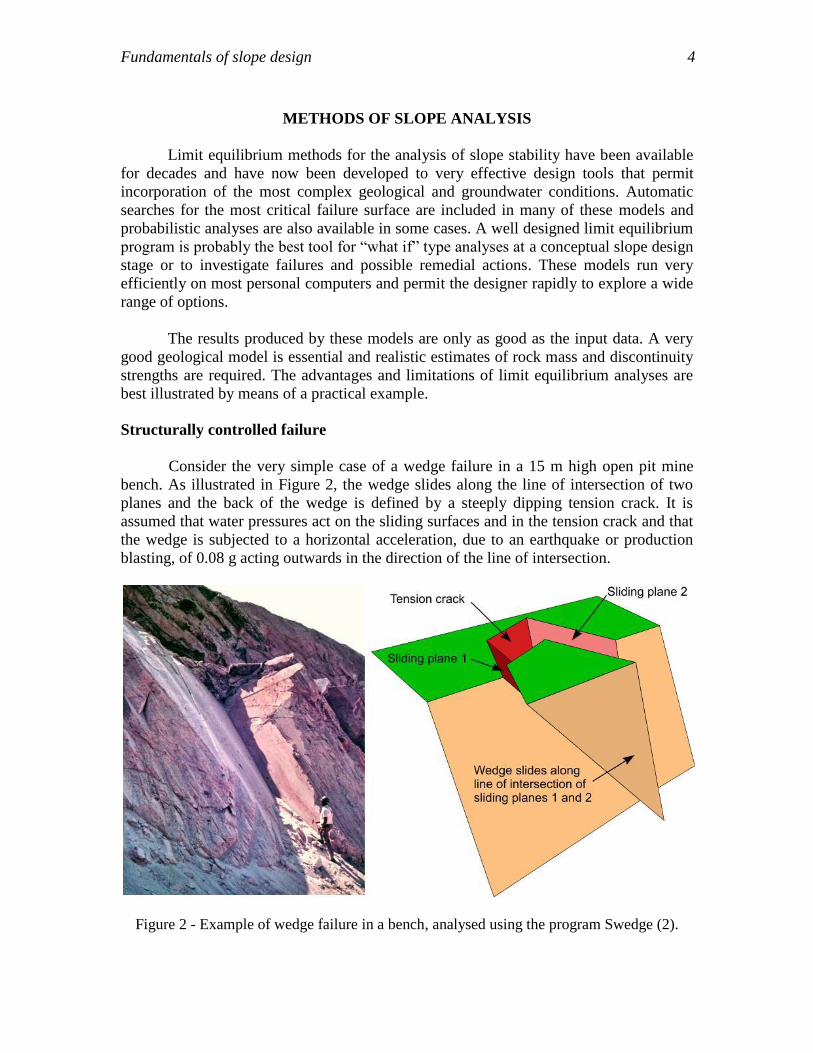
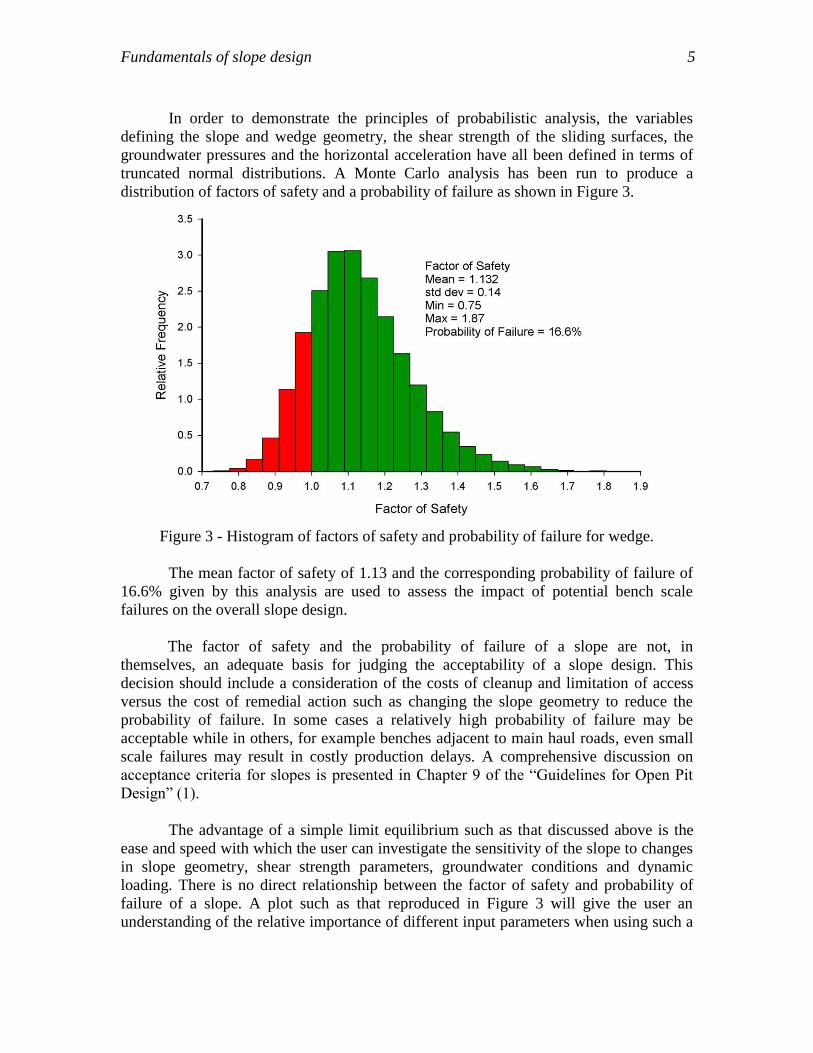
In order to demonstrate the principles of probabilistic analysis, the variables
defining the slope and wedge geometry, the shear strength of the sliding surfaces, the
groundwater pressures and the horizontal acceleration have all been defined in terms of
truncated normal distributions. A Monte Carlo analysis has been run to produce a
distribution of factors of safety and a probability of failure as shown in Figure 3.
Figure 3 - Histogram of factors of safety and probability of failure for wedge.
The mean factor of safety of 1.13 and the corresponding probability of failure of
16.6% given by this analysis are used to assess the impact of potential bench scale
failures on the overall slope design.
The factor of safety and the probability of failure of a slope are not, in
themselves, an adequate basis for judging the acceptability of a slope design. This
decision should include a consideration of the costs of cleanup and limitation of access
versus the cost of remedial action such as changing the slope geometry to reduce the
probability of failure. In some cases a relatively high probability of failure may be
acceptable while in others, for example benches adjacent to main haul roads, even small
scale failures may result in costly production delays. A comprehensive discussion on
acceptance criteria for slopes is presented in Chapter 9 of the “Guidelines for Open Pit
Design” (1).
The advantage of a simple limit equilibrium such as that discussed above is the
ease and speed with which the user can investigate the sensitivity of the slope to changes
in slope geometry, shear strength parameters, groundwater conditions and dynamic
loading. There is no direct relationship between the factor of safety and probability of
failure of a slope. A plot such as that reproduced in Figure 3 will give the user an
understanding of the relative importance of different input parameters when using such a
Fundamentals of slope design 6
tool for sensitivity studies. It is highly recommended that anyone embarking on slope
stability studies for the first time should carry out a range of such sensitivity studies in
order to gain an appreciation of how the software operates and how small changes in the
input parameters can result in dramatic changes in the calculated results.
One major disadvantage of limit equilibrium analyses in open pit mining is the
fact that the method does not include any analysis or prediction of displacements. Since
the monitoring of slope displacements is the most reliable tool for the prediction of
developing instability and for checking the effectiveness of remedial measures, this
limitation of the program restricts its uses to relatively simple tasks described above.
Shear Strength Reduction analysis
The shear strength reduction method was first used for slope stability analysis in
1975 by Zienkiewicz et al (3) and is discussed in detail in Chapter 10 of the "Guidelines
for Open Pit Design" (1). The method involves the construction of a numerical model of
the slope using programs such as FLAC (4), Phase2 (5), UDEC (6) and other continuum
or discontinuum codes. Once the model has been constructed the shear strengths of all
the component materials are iteratively increased or decreased by a Strength Reduction
Factor (SRF) until the slope fails. This is judged on the basis of monitoring a target point
on the slope and where a sudden change in displacement coincides with the onset of
instability. Dawson et al (7) show that the shear-strength reduction factors of safety are
generally within a few percent of limit analysis solutions when an associated flow rule, in
which the friction angle and dilation angle are equal, is used.
The shear strength reduction method is now widely used in open pit slope
stability studies because it includes all the benefits of limit equilibrium analyses and it
allows the user to study slope displacements that are critical in the evaluation of open pit
stability. An example involving the use of this method will be discussed later.
ESTIMATION OF ROCK MASS PROPERTIES
All early forms of limit equilibrium analyses, which had their origins in soil
mechanics, assume that the component materials in a slope are homogeneous and
isotropic. Even if the program allows the incorporation of specific structural features
such as faults, the other materials in the slope are generally assumed to be homogenous.
Recent developments in modelling discontinuous rock masses will be discussed later in
this paper.
In the case of rocks, most of the methods for estimating the shear strength of
component materials for incorporation into continuum models are based on some form of
rock mass classification. Classifications by Bieniawski (8), Barton (9), Laubscher (10)
and Hoek and Brown (11) are the best known in the mining industry and are the most
commonly used for rock mass property estimates.
Fundamentals of slope design 7
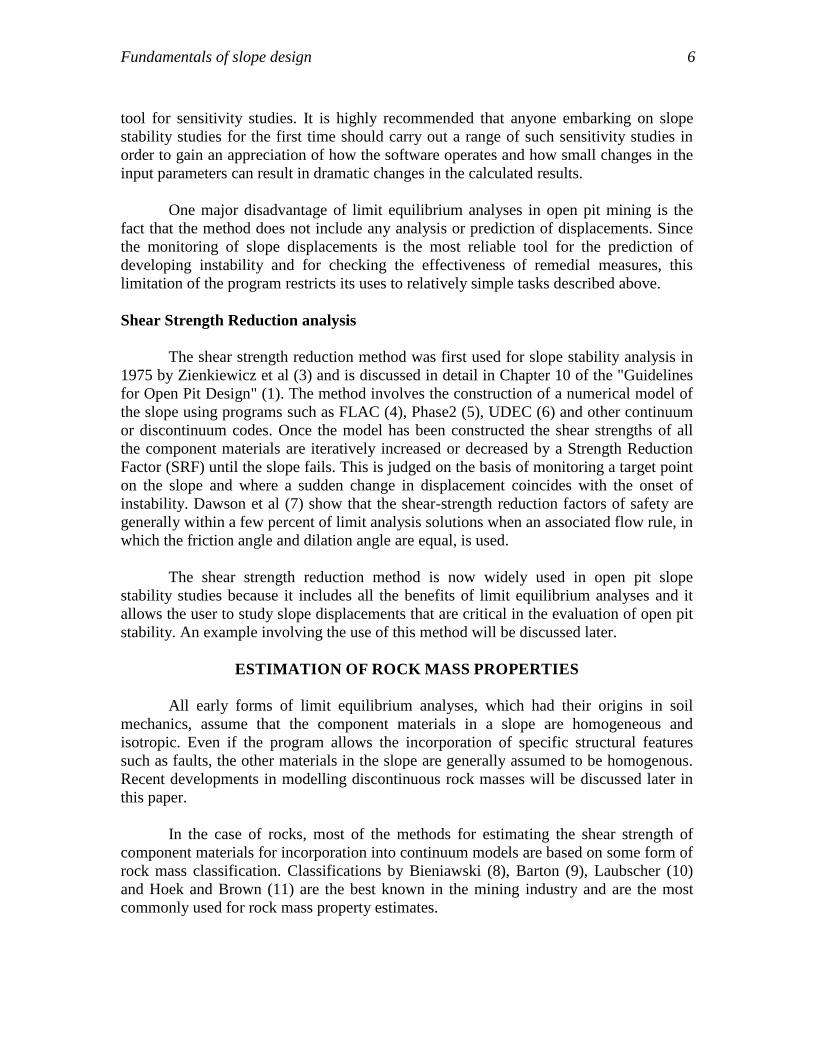
Figure 4 - Estimates of rock mass strength.
Figure 4 gives a selection of the empirical curves relating rock mass
strength/intact rock strength for some of these classifications. The two curves marked
Hoek (D = 0) and Hoek (D = 1) define the approximate range of typical rock mass
strengths cm determined according to the procedure described by Hoek et al in 2002
(12), implemented in the program RocLab (www.rocscience.com). The original Hoek-
Brown criterion, published in 1980, was found to give unrealistically low strength values
when applied to confined conditions such as those surrounding a tunnel. This resulted in
a gradual refinement of the criterion with the 2002 version giving higher strengths for
undisturbed confined rock masses (D = 0) and significantly lower strength values for
blast damaged rock masses such as would occur in a typical open pit mine slope (D = 1).
Note that the blast damage only extends a limited distance into the slope. This may range
from one or two metres for small civil engineering blasts to many tens of metres for open
pit mine production blasts. Downgrading the properties of the entire rock mass by the
factor D will lead to unrealistically large slope failure predictions.
Having estimated the rock mass strength cm as described above, the
corresponding Mohr Coulomb cohesive strength c and friction angle can be determined
from the program RocLab or, in a simplified form, from:
Fundamentals of slope design 8
sin1
cos2
ccm (1)
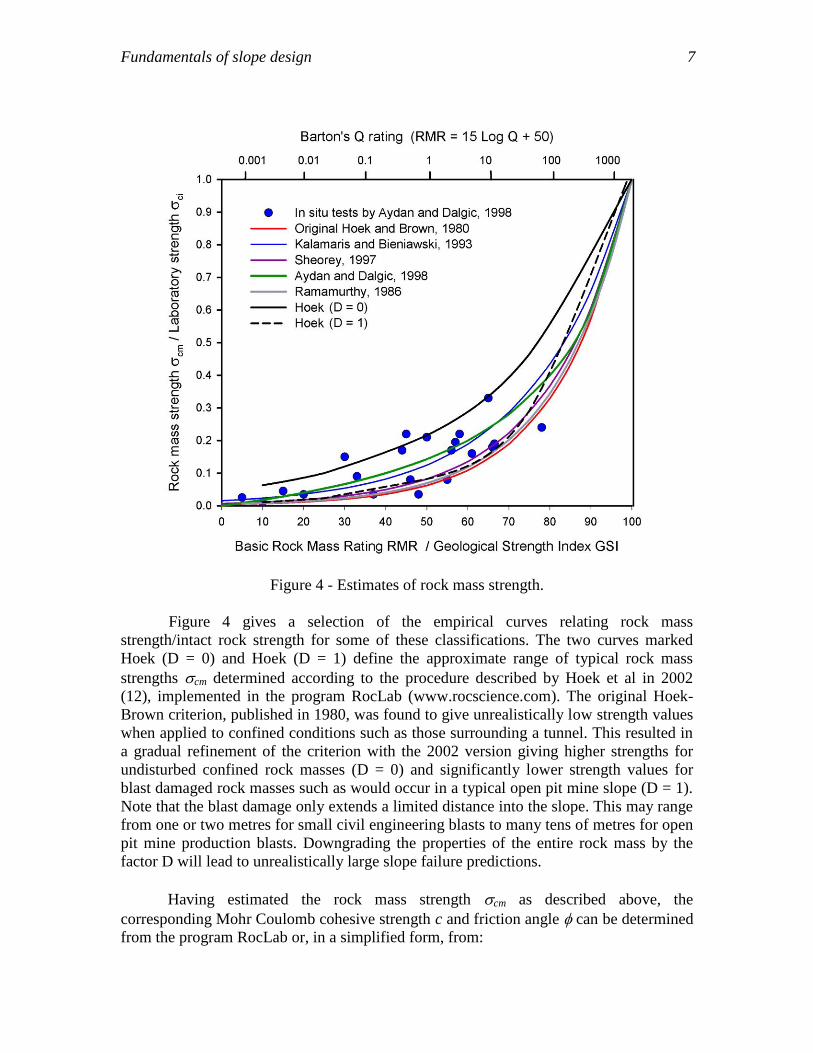
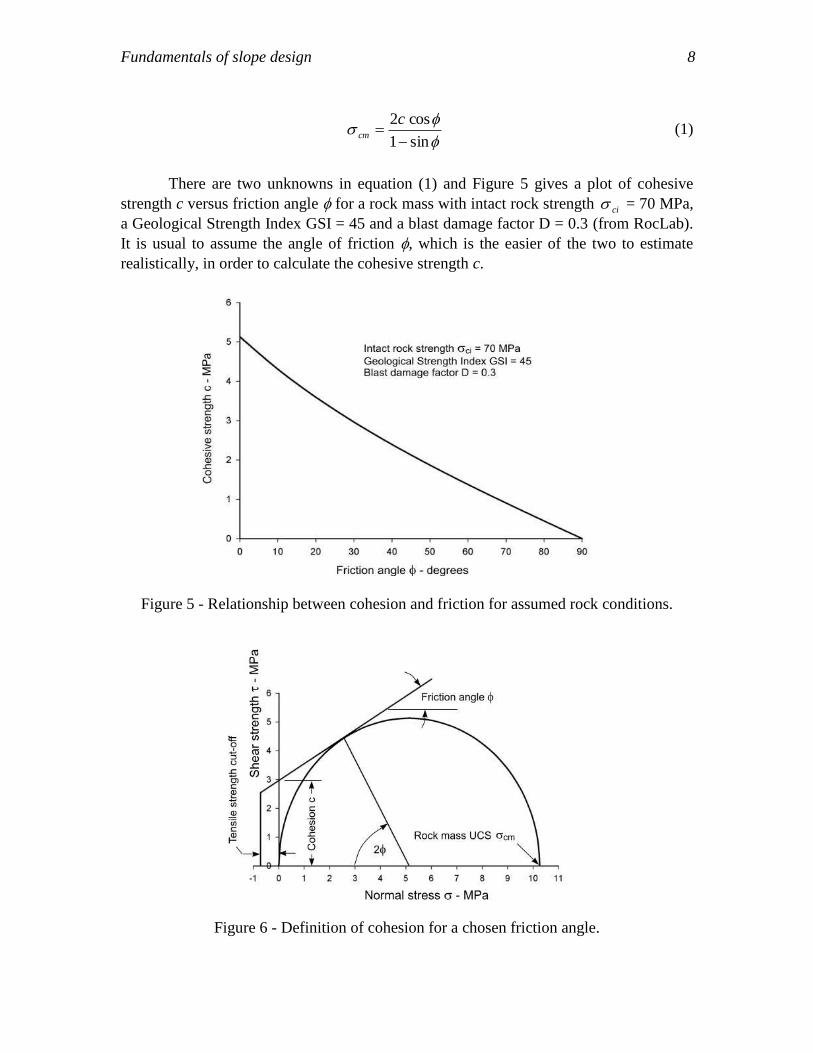
There are two unknowns in equation (1) and Figure 5 gives a plot of cohesive
strength c versus friction angle for a rock mass with intact rock strength ci = 70 MPa,
a Geological Strength Index GSI = 45 and a blast damage factor D = 0.3 (from RocLab).
It is usual to assume the angle of friction , which is the easier of the two to estimate
realistically, in order to calculate the cohesive strength c.
Figure 5 - Relationship between cohesion and friction for assumed rock conditions.
Figure 6 - Definition of cohesion for a chosen friction angle.
Fundamentals of slope design 9
Figure 6 illustrates the relationship between the friction angle , the cohesive
strength c and the uniaxial compressive strength cm of the rock mass. Also included in
this plot is the tensile strength cut-off which is required for some slope stability
calculations. The rock mass tensile strength can be estimated as about 8% of the uniaxial
compressive strength cm .
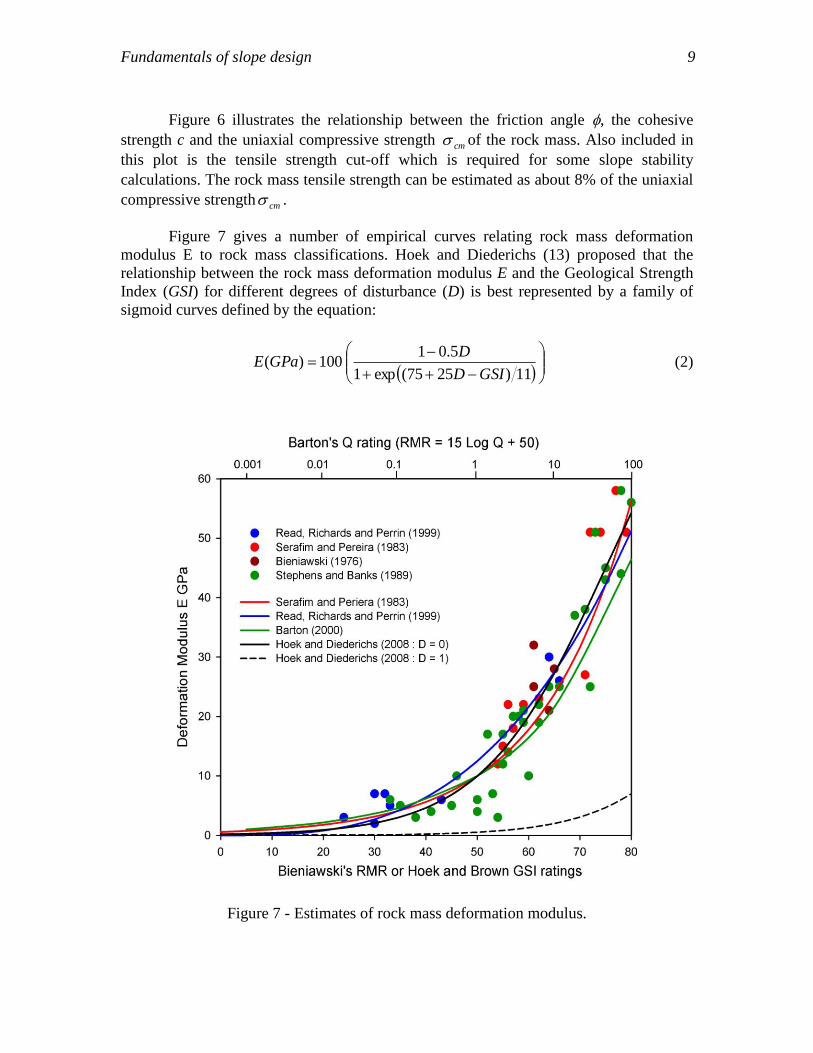
Figure 7 gives a number of empirical curves relating rock mass deformation
modulus E to rock mass classifications. Hoek and Diederichs (13) proposed that the
relationship between the rock mass deformation modulus E and the Geological Strength
Index (GSI) for different degrees of disturbance (D) is best represented by a family of
sigmoid curves defined by the equation:
11)2575(exp1
5.01100)(
GSID
DGPaE (2)
Figure 7 - Estimates of rock mass deformation modulus.
Fundamentals of slope design 10
Equation (1) gives a first very crude estimate of the cohesion and friction angle
required as input for a limit equilibrium analysis of a slope consisting of homogeneous
and isotropic rock or soil masses. If displacements are considered, as in the case of a
numerical analysis, then the deformation modulus of each rock mass component can be
estimated from equation (2). This approach and refinements of it lie at the heart of all
classification based methods for estimating rock mass properties.
Hoek and Marinos (14) have described the efforts that have been made, over a
period of about 30 years, to refine the Hoek-Brown criterion and the GSI classification
system to cover a wide range of rock masses and to improve its accuracy. Other authors
in this field have made similar efforts and the geotechnical literature abounds with papers
and discussions on this topic. The question is whether all of these efforts have resulted in
significant improvements on the reliability of the estimates of rock mass properties. In
retrospect, and bearing in mind that the rock masses considered are limited by the
assumptions of homogeneity and isotropy, it is apparent that these efforts have reached
the point of vanishing returns. This is not a critical comment since there were very few
options available when these methods were developed. However, it is now time to see
whether developments in computer technology and numerical methods can help us
calibrate or move on from the empirical methods, such as the Hoek-Brown criterion, that
have been used for so long.
MODELLING THE BEHAVIOUR OF DISCONTINUOUS ROCK MASSES
In 1971 Cundall (15) published one of the earliest papers on the modelling of
discontinuous rock masses and this led to the development of the Itasca programs UDEC
(6), 3DEC (16) and several other programs for modelling jointed rock masses and
granular materials. The most recent development in this group of programs is the
Synthetic Rock Mass, SRM (17) which holds out the promise of being able to
incorporate all significant discontinuity and intact rock properties into a discontinuous
rock mass model without having to resort to classification based estimates. Other
discontinuous models such as the combined finite-discrete element models described by
Munjiza (18), although not yet as well developed for rock mechanics applications as the
SRM, show a great deal of promise. The combined finite-discrete element program
ELFEN (19) was developed for the dynamic modelling of impact loading on brittle
materials such as ceramics, but has been increasingly used in rock mechanics.
It is clearly beyond the scope of this paper to discuss the relative merits of these
numerical models, their advantages and limitations and the developments that are still
required before they can be considered routine design tools. Participants in this
Symposium will find a discussion on these methods in Chapter 10 of the Guidelines for
Open Pit Design (1) and in some of the other presentations. The discussion that follows is
limited to the use of discontinuous models to estimate rock mass properties and to
analyse complex structurally controlled slopes.
Fundamentals of slope design 11
Analysis of rock mass behaviour
A rock mass comprises blocks of intact rock separated by discontinuities such as
faults, shear zones, bedding planes and joints. The failure of such a rock mass involves
sliding on multiple discontinuity sets as well as tensile and shear failure of rock bridges
and intact rock blocks. How do we develop a realistic representation of the behaviour of
such a rock mass?
Potyondy and Cundall (20), in discussing this challenge, point out that systems
composed of many simple objects commonly exhibit behaviour that is much more
complicated than that of the constituents. They list the following characteristics that need
to be considered in developing a rock mass model:
Continuously non-linear stress–strain response, with ultimate yield, followed by
softening or hardening.
Behaviour that changes in character, according to stress state; for example, crack
patterns quite different in tensile, unconfined- and confined-compressive regimes.
Memory of previous stress or strain excursions, in both magnitude and direction.
Dilatancy that depends on history, mean stress and initial state.
Hysteresis at all levels of cyclic loading/unloading.
Transition from brittle to ductile shear response as the mean stress is increased.
Dependence of incremental stiffness on mean stress and history.
Induced anisotropy of stiffness and strength with stress and strain path.
Non-linear envelope of strength.
Spontaneous appearance of microcracks and localized macrofractures.
Spontaneous emission of acoustic energy.
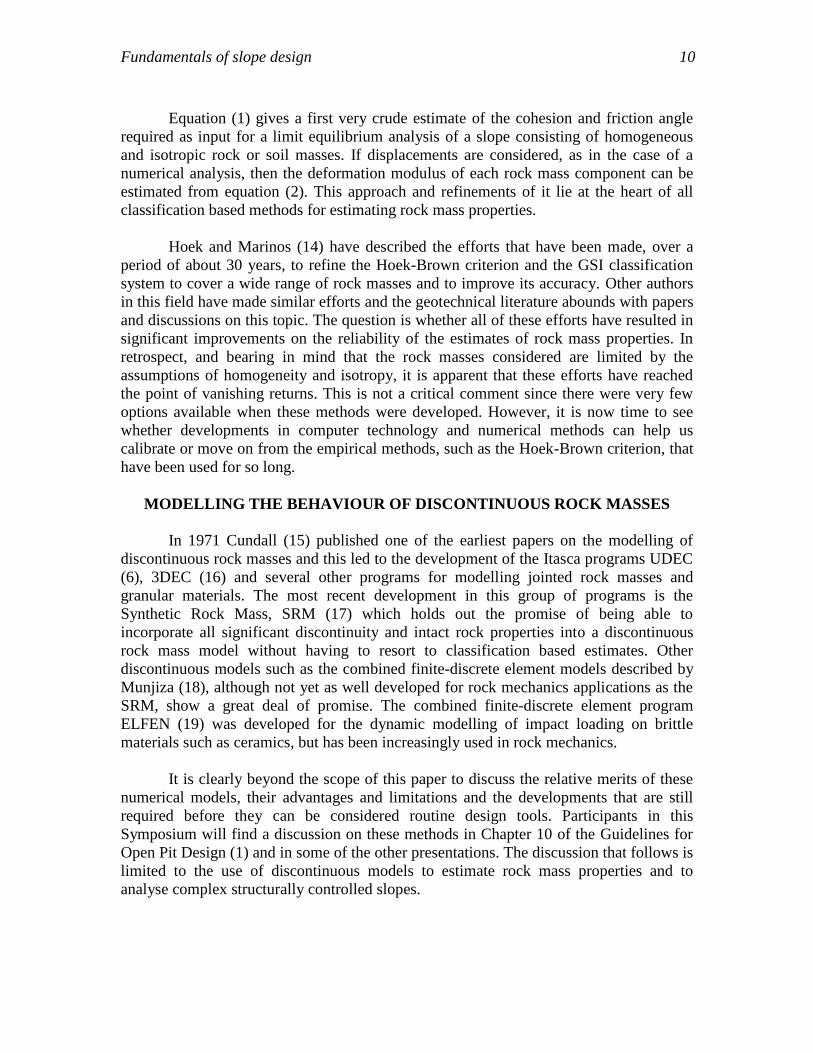
One the tools that has been applied to the problem of analysing the behaviour of
rock masses is the Synthetic Rock Mass (SRM) approach developed by Itasca. Cundall
(21) explains that the SRM represents a jointed rock mass by an assembly of joint set
elements embedded in a matrix that allows new fractures to initiate and grow
dynamically according to the imposed stress and strain level. This approach uses the
Bonded Particle Model, shown in Figure 8 and described by Potyondy and Cundall (20),
for the rock matrix and the Smooth Joint Model, described by Mas Ivars et al (22), for
pre-existing fractures.
The Bonded Particle Model is based on the Itasca discrete-element code PFC3D
(23) and it represents the rock as an assembly of spherical particles bonded together at
their contacts. These bonds can break, depending on the stress level, representing
fractures that originate and grow naturally within the assembly. The Smooth Joint Model,
which allows slip and opening of planar surfaces independently of the local particle
geometry, is used to represent pre-existing joints and fractures. Note that the particles
"pass through" each other in order to respect the given sliding direction. These joints and
fractures are defined by a Discrete Fracture Network (24) which is based on joint
spacing, trace-length and orientation derived from on site drilling and mapping.
Fundamentals of slope design 12
Figure 8 - Illustration of the Bonded Particle Model and the Smooth Joint Model.
Modified after Cundall et al (26).
It has been found that most of the characteristics described by Potyondy and
Cundall (20), listed above, can be reproduced in a SRM model. These characteristics will
vary, depending upon the properties and constitutive relationships assumed for the rock
and the discontinuities. Considerable work remains to be done to refine these
relationships and to understand all of the complex interactions that occur during the
progressive failure of rock masses. However, as illustrated in the paper by Lorig (25), the
SRM approach has already been demonstrated to overcome many of the limitations
inherent in empirical estimates of rock mass properties.
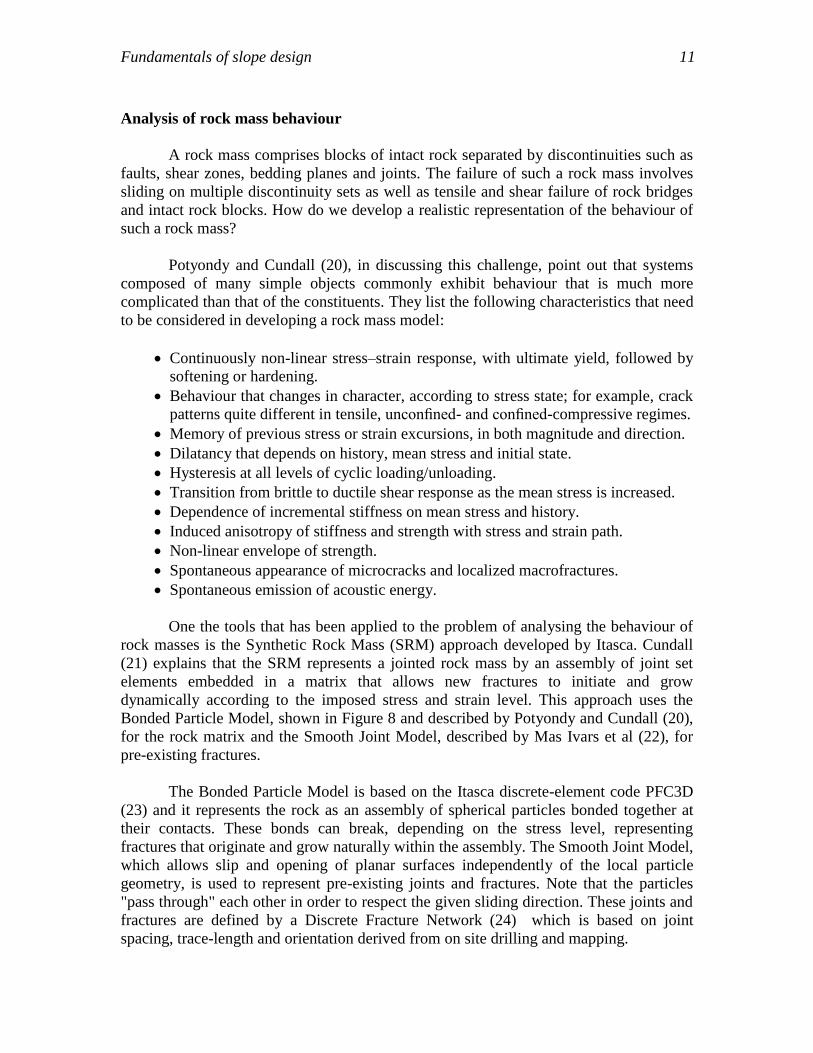
Figure 9 - Numerically obtained values UCS versus sample size for
three orientations of the applied axial stress for Carbonatite from the
Palabora Mine in South Africa. After Cundall et al (26).
Fundamentals of slope design 13
Cundall et al (26) have described the use of the SRM approach to investigate the
influence of sample scale on the strength of jointed rock masses. The results of one of
these studies, for a Carbonatite rock mass from the Palabora Mine in South Africa, are
plotted in Figure 9. This is a long standing problem in rock engineering since it is
impossible to conduct physical tests on samples of comparable size to the rock mass into
which the slopes of an open pit mine are excavated. While the concept of size effect has
been understood for a very long time it is only with the advent of tools such as the SRM
that it has been possible to quantify this effect with any degree of certainty.
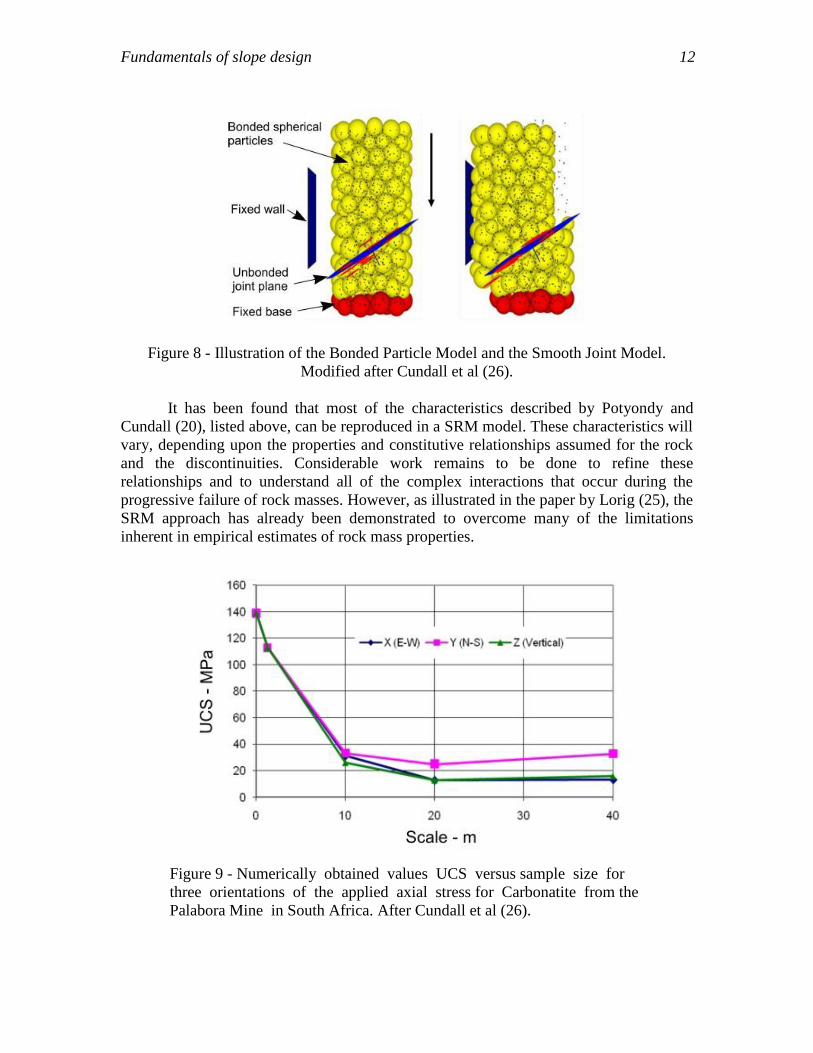
Cundall (27) suggests that, while the PCF3D approach described above shows
great potential, there is still a role for continuum codes which give more reasonable
computation times. He discusses the use of one such continuum code called the
Ubiquitous Joint Rock Mass model, developed by Sainsbury et al (28), for the study of
progressive deterioration of matrix (intact) cohesion and ubiquitous joint failure. The
results for one such study are reproduced in Figure 10.
Figure 10 - Stages of damage within a strain-softening ubiquitous joint model including
matrix cohesion degradation and ubiquitous joint failure. After Cundall (27).
Fundamentals of slope design 14
One of the other advanced numerical codes that has been applied to rock
engineering analysis is ELFEN, developed by RockField Software (19). This is a hybrid
2D/3D model that incorporates finite element and discrete element analysis. Failure
bands can develop within or between single elements and, when the load carrying
capacity across such failure bands decreases to zero, a fracture propagates within the
continuum finite element mesh. At this point the mesh is updated and this results in the
formation of a discrete element rock fragment. Crook et al (29) showed that, by using a
combination of the standard Mohr-Coulomb yield function with a tension cut-off, they
could model brittle, tensile axial-splitting fractures and more ductile shear features in
ELFEN. This allows the modelling of a continuum and a discontinuum and the
transformation of the rock mass from a continuum to a discontinuum. Pre-existing faults
and joints can also be inserted into these models.
ELFEN and similar combined finite-discrete element models (18) have not been
applied to practical open pit stability problems to anything like the same extent as the
Itasca Synthetic Rock Mass models. Hence, the behaviour of rock mass has not been
optimised to the same extent. While these models appear to hold out a great deal of
promise for applications such as slope stability analyses, it remains to be seen whether
future developments can meet the challenges that still have to be overcome.
Advanced slope stability analysis
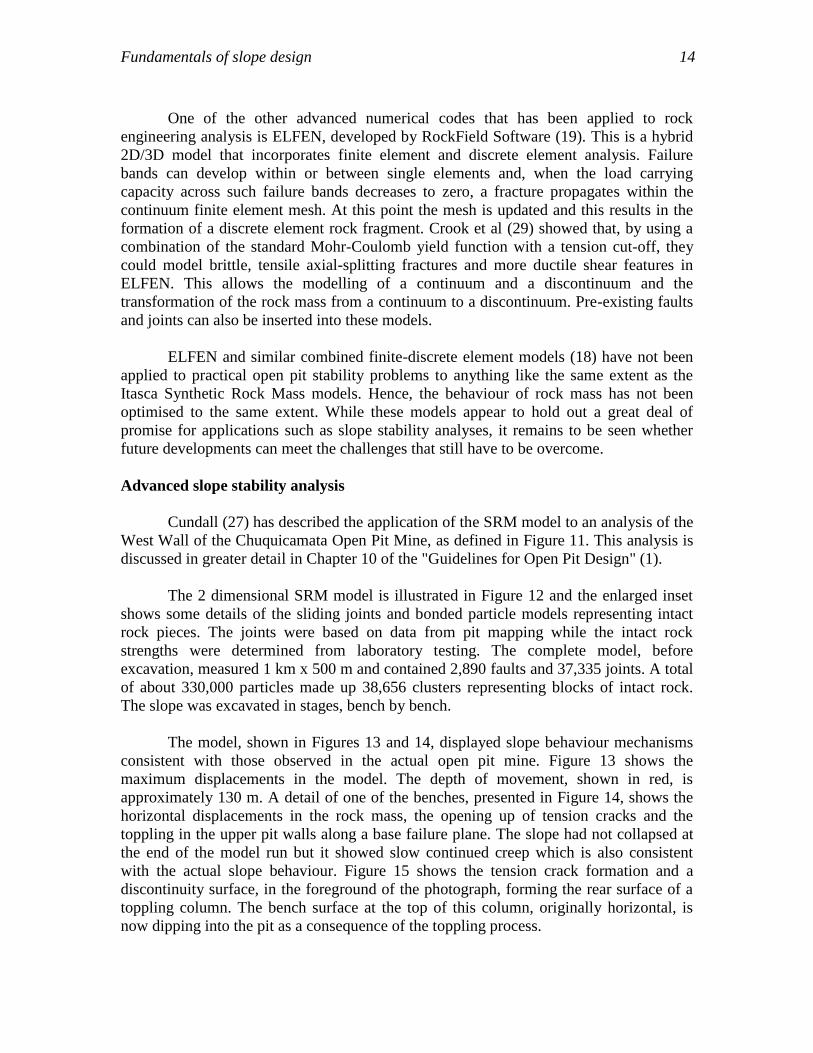
Cundall (27) has described the application of the SRM model to an analysis of the
West Wall of the Chuquicamata Open Pit Mine, as defined in Figure 11. This analysis is
discussed in greater detail in Chapter 10 of the "Guidelines for Open Pit Design" (1).
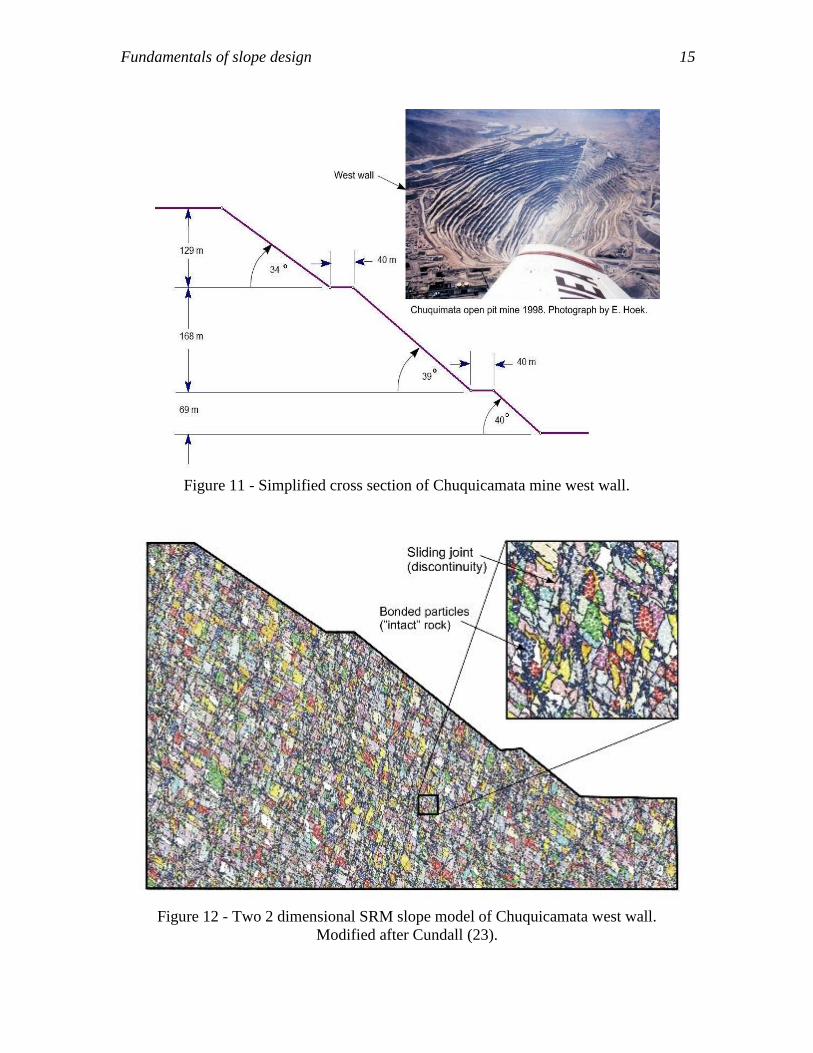
The 2 dimensional SRM model is illustrated in Figure 12 and the enlarged inset
shows some details of the sliding joints and bonded particle models representing intact
rock pieces. The joints were based on data from pit mapping while the intact rock
strengths were determined from laboratory testing. The complete model, before
excavation, measured 1 km x 500 m and contained 2,890 faults and 37,335 joints. A total
of about 330,000 particles made up 38,656 clusters representing blocks of intact rock.
The slope was excavated in stages, bench by bench.
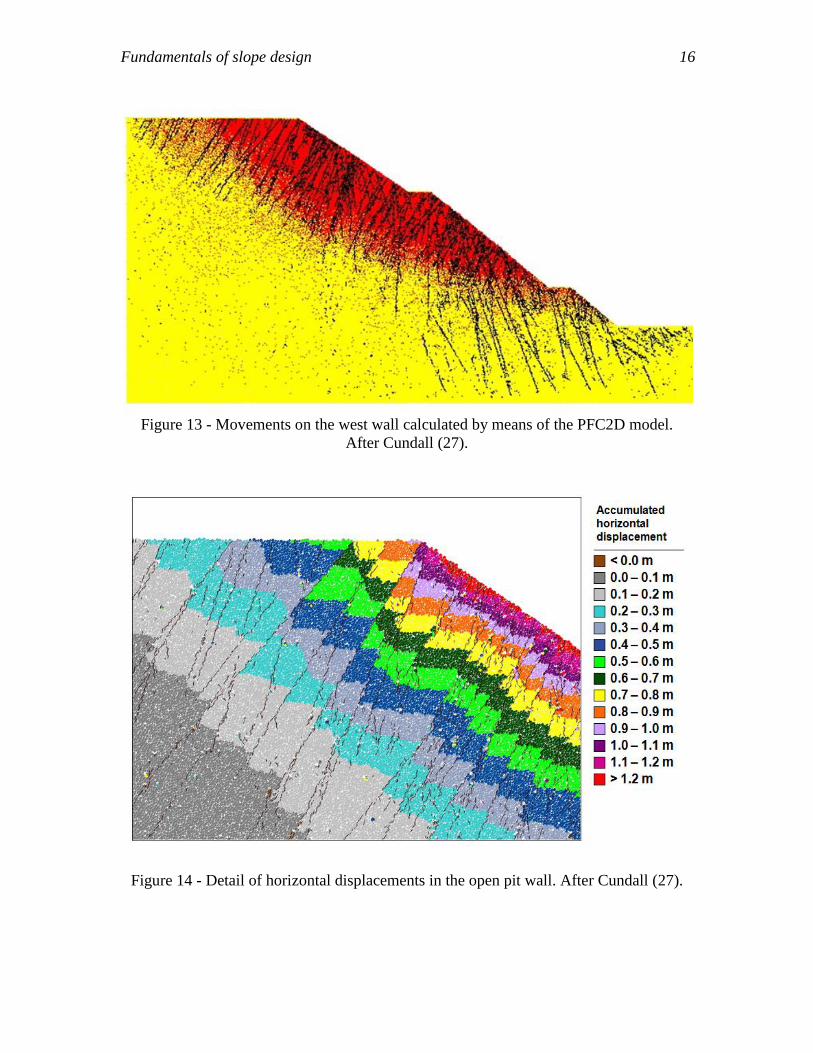
The model, shown in Figures 13 and 14, displayed slope behaviour mechanisms
consistent with those observed in the actual open pit mine. Figure 13 shows the
maximum displacements in the model. The depth of movement, shown in red, is
approximately 130 m. A detail of one of the benches, presented in Figure 14, shows the
horizontal displacements in the rock mass, the opening up of tension cracks and the
toppling in the upper pit walls along a base failure plane. The slope had not collapsed at
the end of the model run but it showed slow continued creep which is also consistent
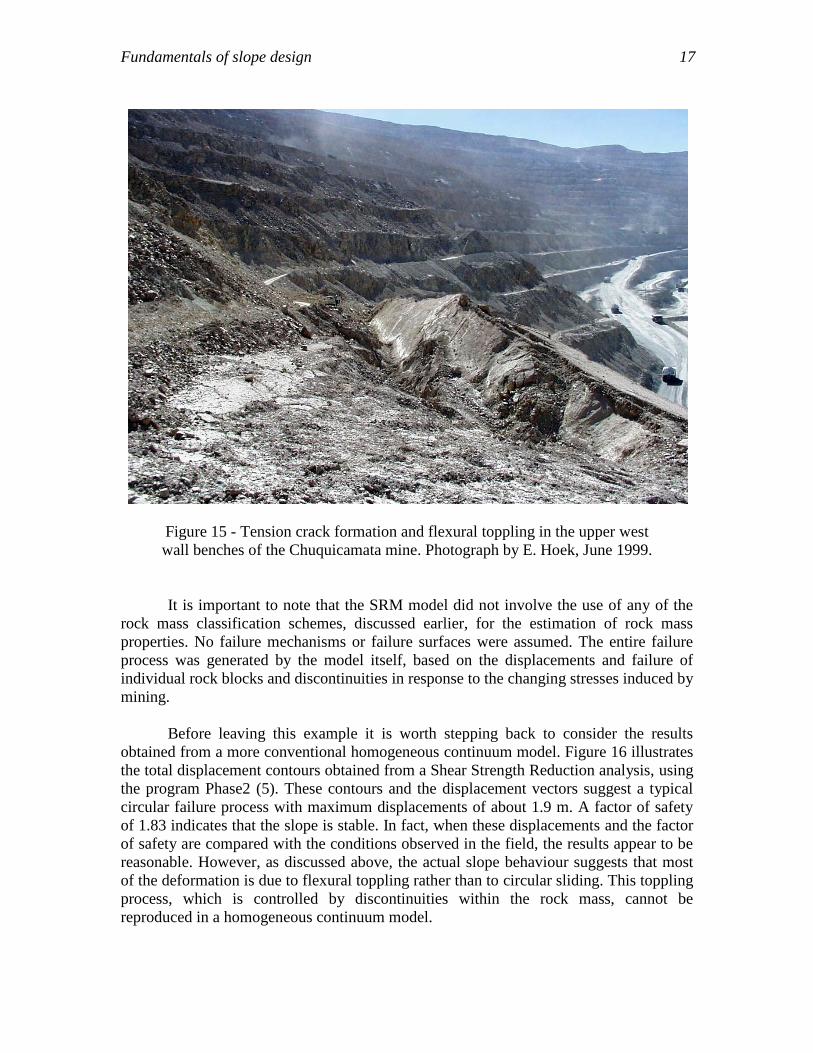
with the actual slope behaviour. Figure 15 shows the tension crack formation and a
discontinuity surface, in the foreground of the photograph, forming the rear surface of a
toppling column. The bench surface at the top of this column, originally horizontal, is
now dipping into the pit as a consequence of the toppling process.
Fundamentals of slope design 15
Figure 11 - Simplified cross section of Chuquicamata mine west wall.
Figure 12 - Two 2 dimensional SRM slope model of Chuquicamata west wall.
Modified after Cundall (23).
Fundamentals of slope design 16
Figure 13 - Movements on the west wall calculated by means of the PFC2D model.
After Cundall (27).
Figure 14 - Detail of horizontal displacements in the open pit wall. After Cundall (27).
Fundamentals of slope design 17
Figure 15 - Tension crack formation and flexural toppling in the upper west
wall benches of the Chuquicamata mine. Photograph by E. Hoek, June 1999.
It is important to note that the SRM model did not involve the use of any of the
rock mass classification schemes, discussed earlier, for the estimation of rock mass
properties. No failure mechanisms or failure surfaces were assumed. The entire failure
process was generated by the model itself, based on the displacements and failure of
individual rock blocks and discontinuities in response to the changing stresses induced by
mining.
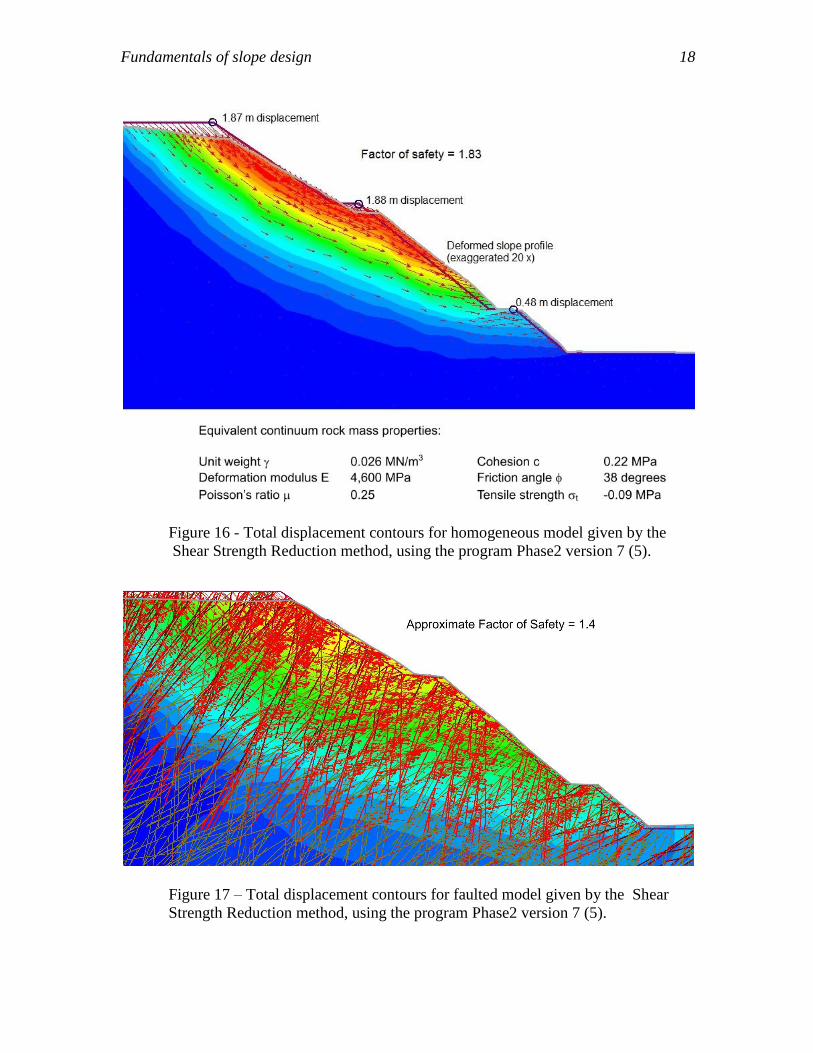
Before leaving this example it is worth stepping back to consider the results
obtained from a more conventional homogeneous continuum model. Figure 16 illustrates
the total displacement contours obtained from a Shear Strength Reduction analysis, using
the program Phase2 (5). These contours and the displacement vectors suggest a typical
circular failure process with maximum displacements of about 1.9 m. A factor of safety
of 1.83 indicates that the slope is stable. In fact, when these displacements and the factor
of safety are compared with the conditions observed in the field, the results appear to be
reasonable. However, as discussed above, the actual slope behaviour suggests that most
of the deformation is due to flexural toppling rather than to circular sliding. This toppling
process, which is controlled by discontinuities within the rock mass, cannot be
reproduced in a homogeneous continuum model.
Fundamentals of slope design 18
Figure 16 - Total displacement contours for homogeneous model given by the
Shear Strength Reduction method, using the program Phase2 version 7 (5).
Figure 17 – Total displacement contours for faulted model given by the Shear
Strength Reduction method, using the program Phase2 version 7 (5).
Fundamentals of slope design 19
The superposition of a pattern of faults in the homogeneous continuum model,
used to generate Figure 16, results in a significant change in the rock mass behaviour. As
illustrated in Figure 17, the displacement vectors indicate a predominantly toppling
failure process which is much more realistic than that for a homogeneous model.
However, this process is only qualitative since the detailed mechanical behaviour of both
the intact rock pieces and the discontinuities have not been included in the model as for
the Synthetic Rock Mass model illustrated in Figure 12
A comprehensive analysis of the failure in a jointed continuum model requires
that tensile and shear failure of the "intact" rock pieces have to be considered in addition
to the shear failure of discontinuities. It is only relatively recently that jointed continuum
models with this capability have been developed (28), as shown in Figure 10. Such
models are attractive because of the lower demands on computer capacity than for
equivalent SRM models and there appear to be significant advantages in further
developing these models.
It can be argued that most slope designers are interested in designing stable slopes and
that it is not necessary to model the large displacements and detatchment of rock blocks
as can be done in models such as the Synthetic Rock Mass. There is considerable merit in
this argument and it is important that development of jointed continuum models should
be continued in order that they can be used in cases that do not demand the capabilities of
the SRM models.
There are also cases, such as that discussed below, where it is necessary to study
the break-up of rock masses and the movement of blocks down the slope. While the SRM
model can be used for such analyses there are also simpler alternatives that can be
considered.
Rockfall analysis
Watson et al (30) and Lorig et al (31) have published the details of the analysis of
a potential slide of the Checkerboard Creek slope located 1.5 km upstream of the
Revelstoke Dam on the Columbia River in British Columbia, Canada. Measured
displacements and visible slope deformation features on the ground surface indicate that
the rock mass is moving at a rate of up to 13 mm/year downslope towards the Revelstoke
Reservoir. Between 1984 and 2005, British Columbia Hydro carried out an investigation
of the risks associated with a sudden rockfall depositing a significant volume of rock into
the reservior and creating waves with the potential for overtopping part of the dam.
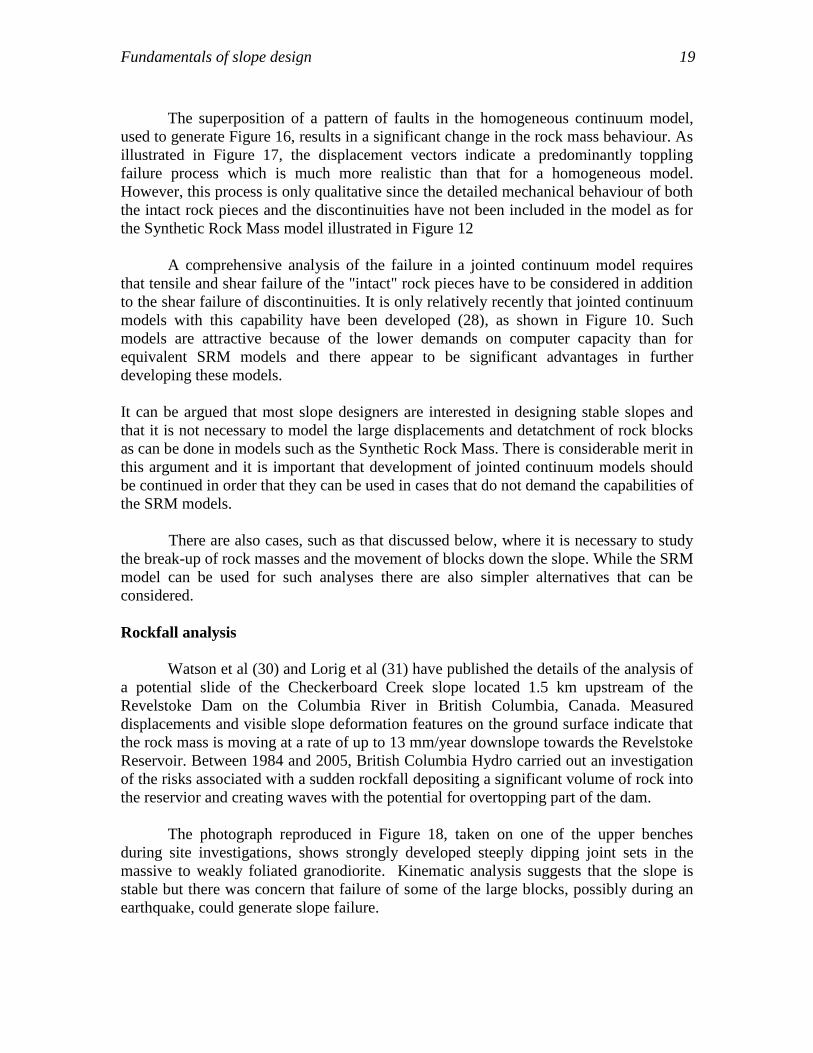
The photograph reproduced in Figure 18, taken on one of the upper benches
during site investigations, shows strongly developed steeply dipping joint sets in the
massive to weakly foliated granodiorite. Kinematic analysis suggests that the slope is
stable but there was concern that failure of some of the large blocks, possibly during an
earthquake, could generate slope failure.
Fundamentals of slope design 20
Figure 18 - Checkerboard Creek slope formed by a steep roadcut. The photograph,
showing the sub vertical joints, was taken on one of the upper benches during site
investigations. Photograph by E. Hoek, 2004.
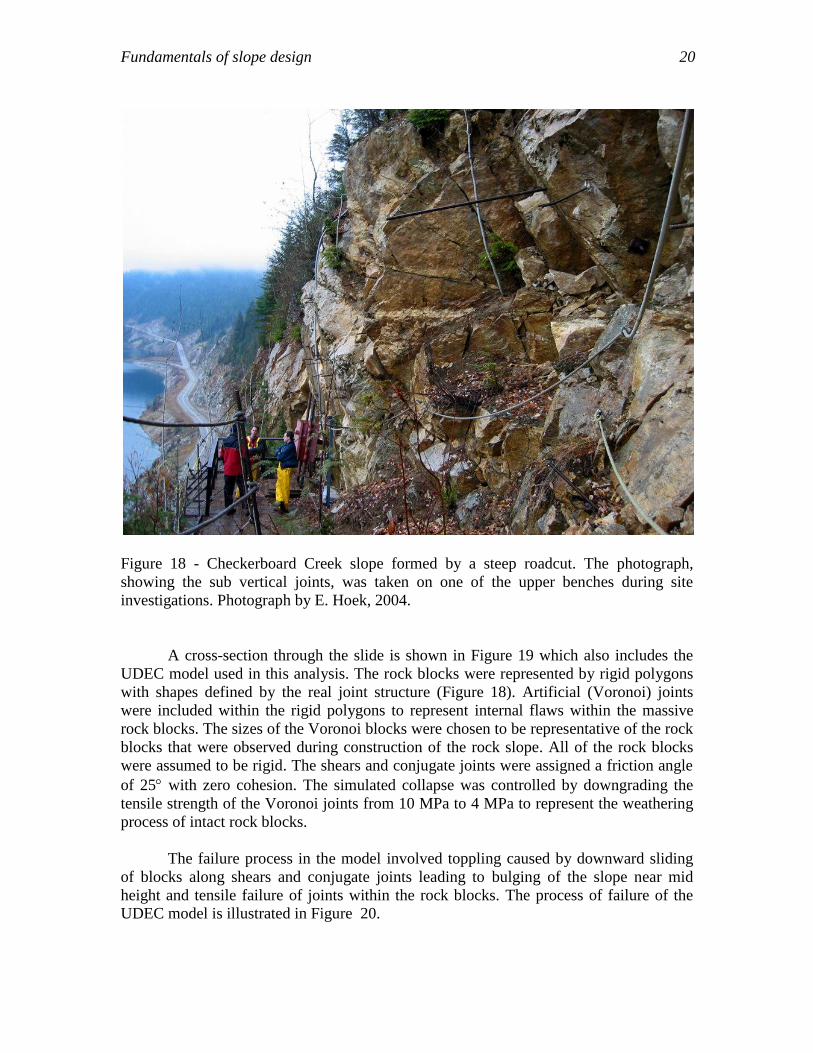
A cross-section through the slide is shown in Figure 19 which also includes the
UDEC model used in this analysis. The rock blocks were represented by rigid polygons
with shapes defined by the real joint structure (Figure 18). Artificial (Voronoi) joints
were included within the rigid polygons to represent internal flaws within the massive
rock blocks. The sizes of the Voronoi blocks were chosen to be representative of the rock
blocks that were observed during construction of the rock slope. All of the rock blocks
were assumed to be rigid. The shears and conjugate joints were assigned a friction angle
of 25 with zero cohesion. The simulated collapse was controlled by downgrading the
tensile strength of the Voronoi joints from 10 MPa to 4 MPa to represent the weathering
process of intact rock blocks.
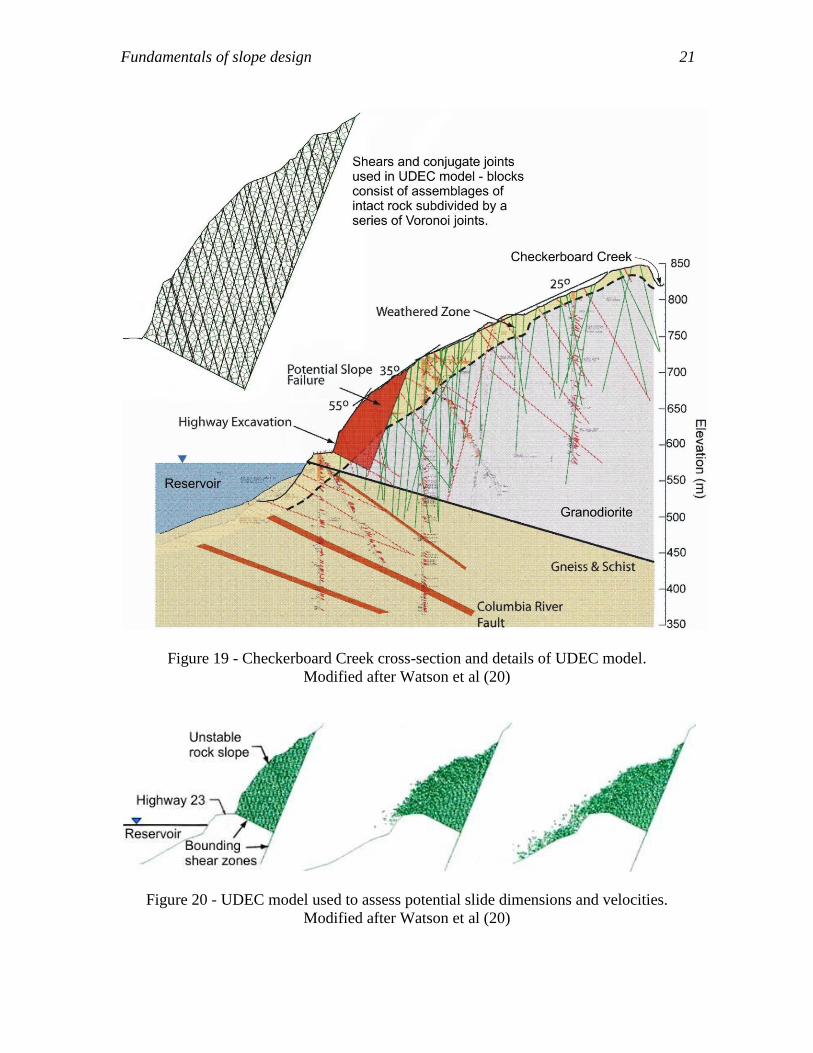
The failure process in the model involved toppling caused by downward sliding
of blocks along shears and conjugate joints leading to bulging of the slope near mid
height and tensile failure of joints within the rock blocks. The process of failure of the
UDEC model is illustrated in Figure 20.
Fundamentals of slope design 21
Figure 19 - Checkerboard Creek cross-section and details of UDEC model.
Modified after Watson et al (20)
Figure 20 - UDEC model used to assess potential slide dimensions and velocities.
Modified after Watson et al (20)
Fundamentals of slope design 22
In the UDEC model, used to simulate the failure of the potentially unstable part of
the Checkerboard Creek slope, no effort was made to model the precise failure
mechanism of the intact rock blocks defined by the intersecting shears and conjugate
joints. Failure of the Voronoi joints, when the tensile strength was exceeded, achieved
the goal of breaking-up the rock mass into blocks of representative size and freeing these
blocks to move down the slope. Einstein is credited with having said "Keep it simple; as
simple as possible, but no simpler" and this model is an excellent example of using the
capabilities of the model required to simulate the process being studied without over-
complicating the model.
The range of slide behaviour was investigated by varying the following five
factors: strength of joints and shears, type and amount of damping used to simulate the
coefficient of restitution and thus energy loss during runout, friction angle of' contacts
during movement, reservoir effects and rock fragment sizes. The UDEC model provided
a wide range of results and these were used as input for a scaled physical model used to
generate waves in the reservoir. The integration of site investigation, monitoring,
numerical modelling and the construction of the physical hydraulic model resulted in a
defensible approach to risk assessment at the Checkerboard Creek rock slope. Each stage
was essential in determining that there is a negligible risk of a single event rockslide
larger than 0.5 million m3 and that the wave from such a slide would not overtop the
Revelstoke Dam (30).
CONCLUSIONS
The economy of scale has made large scale open pit mines or underground large
caving operations attractive for the recovery of low grade mineral deposits. These
massive operations have placed new demands on rock engineers to design slopes and
underground mines on a scale not attempted before. In recognition of deficiencies in
available design methods the mining industry has funded a series of large research
projects including the International Caving Study (ICS), started in 1997, and its successor
the Mass Mining Technolgy (MMT) project and the parallel Large Open Pit (LOP)
project. The main outcome of the LOP project has been the "Guidelines for Open Pit
Design" which will be published at this symposium.
The development of numerical models to study the failure and deformation of
large rock masses has been an integral component of all three programs mentioned
above. Itasca has been one of the principal contractors in these programs and the
development of the Synthetic Rock Mass and its components has been one of the most
significant developments.
One of the major features of the SRM system is the fact that rock mass models
can be built up from basic properties of intact rock and of rock discontinuities without
having to rely on estimates based on rock mass classification systems such as GSI. The
joint spacing, trace lengths and orientations are derived from drilling and mapping on site
Fundamentals of slope design 23
and are incorporated into the SRM model by means of a statistically based Discrete
Fracture Network (24). The properties of the intact rock and of the discontinuities are
determined from laboratory tests and are used directly in the models.
At the very least these types of models provide a means of calibrating empirical
rock mass classification schemes. As described by Cundall (21), a testing environment
has been developed for SRM samples for a standard suite of direct tension and uniaxial
and triaxial compression tests. These tests allow the systematic characterisation of the
mechanical behaviour of jointed rock masses. The author is hopeful that, in time, a
sufficient number of numerical "tests" will have been conducted that the classification
schemes can be reorganised and calibrated to provide much more rational and reliable
classifications than those which exist today.
At the other end of the spectrum these systems can be used to construct two and
three dimensional models of complete rock masses, such as that illustrated in Figure 12,
into which slopes can be excavated sequentially to simulate the mining process. Failure
processes in such rock masses are generated from the changing induced stresses as the
open pit is mined and, provided that the properties of all of the components have been
correctly represented, the overall model rock mass behaviour will replicate that of its in
situ counterpart.
The Synthetic Rock Mass is currently the most advanced system of its kind for
modelling rock mass behaviour. Other models such as the combined finite-discrete
element method (18, 19) and the ubiquitous joint rock mass model (28) are alternatives
that appear to have great potential and that may offer significant advantages in certain
applications. It will probably require many years of development before robust and
reliable models emerge as leaders from the large number of competing codes currently
under development.
Numerical models, in themselves, do not provide a complete solution to open pit
slope design. As demonstrated by the large number of topics covered in the " Guidelines
for Open Pit Design", a complete slope design requires consideration of a large number
of geological, geotechnical, groundwater and operational factors. The results of a slope
stability analysis, by whatever means this is carried out, should always be considered in
association with these other factors and should be checked wherever possible by back
analysis of monitored displacements and slope failures. A slope stability calculation
should never be treated as an end in itself but rather as a contribution to the overall
design process.
ACKNOWLEDGEMENTS
The major contributions to the fundamental understanding of rock engineering
problems and to the development of robust and reliable software by Peter Cundall are
hereby acknowledged on behalf of the rock engineering community. Discussions over the
Fundamentals of slope design 24
years with Peter Cundall, Loren Lorig, John Read, Peter Stacey, Derek Martin, Mark
Diederichs, Jean Hutchinson, Peter Kaiser, José Carvalho, Trevor Carter, John Curran,
Brent Corkum, Reginald Hammah, Doug Stead, Eric Eberhardt, Richard Bieniawski and
others have all contributed to the ideas presented in this paper.
The permission of Codelco Norte to publish the details of the Chuquicamata open
pit mine analysis is gratefully acknowledged.
REFERENCES
1. J. Read and P.F. Stacey, Guidelines for Open Pit Design, CSIRO Publishing,
Melbourne, 2009.
2. Rocscience, Swedge – Program for evaluating the geometry and stability of surface
wedges in rock slopes, Rocscience Inc., Toronto, 2006
3. O.C. Zienkiewicz, C. Humpherson and R.W. Lewis, Associated and non-associated
viscoplasticity and plasticity in soil mechanics, Géotechnique, Vol. 25, No. 4, 1975, 671-689.
4. Itasca Consulting Group, FLAC, Fast Lagrangian Analysis of Continua, User’s Guide,
Itasca Consulting Group, Minneapolis, 1995. 5. Rocscience, Phase2 - Finite element analysis of excavations and slopes, Rocscience
Inc., Toronto, 2009. 6. Itasca Consulting Group, UDEC, Universal Distinct Element Code, User’s Guide.
Itasca Consulting Group, Minneapolis, 2004.
7. E.M. Dawson, W.H. Roth and A. Drescher A, Slope stability analysis by strength
reduction, Géotechnique , Vol. 49, No. 6, 1999, 835–840.
8. Z.T. Bieniawski, Engineering Rock Mass Classifications, John Wiley & Sons, New
York, 1989.
9. N.R. Barton, Some new Q-value correlations to assist in site characterization and
tunnel design. International Journal of Rock Mechanics and Mining Science and
Geomechanics Abstracts, Vol. 39, No. 2, 2002, 185–216.
10. D.H. Laubscher and J. Jakubec, The MRMR rock mass classification for jointed
rock masses, Underground Mining Methods: Engineering Fundamentals and
International Case Studies, W.A. Hustrulid and R.L. Bullock, Eds., Society of Mining
Engineers, New York, 2001, 474–481.
11. E. Hoek and E.T. Brown, Practical estimates of rock mass strength, International
Journal of Rock Mechanics and Mining Science, Vol. 34, No. 8, 1997, 1165-1186.
Fundamentals of slope design 25
12. E. Hoek, C. Carranza-Torres and B. Corkum, Hoek-Brown failure criterion, 2002
edition, Proceedings of 5th North American Rock Mechanics Symposium and 17th
Tunnelling Association of Canada Conference, R. Hammah, W. Bawden, J. Curran
and M. Telesnicki, Eds., University of Toronto Press, Toronto, Vol. 1, 2002,267–273.
13. E. Hoek and M.S. Diederichs, Empirical estimation of rock mass modulus,
International Journal of Rock Mechanics and Mining Science, Vol. 43, No. 2, 2006,
203–215.
14. E. Hoek and P.G. Marinos, A brief history of the development of the Hoek-Brown
failure criterion, Soils and Rocks, No. 2, 2007.
15. P.A. Cundall, A computer model for simulating large scale movements in block rock
systems. Proceedings of the International Society for Rock Mechanics Conference,
Nancy, France, Vol. 1, 1971, 129-136.
16. Itasca Consulting Group, 3DEC, Three-Dimensional Distinct Element Code, Version
3.0, Itasca Consulting Group, Minneapolis, 2003.
17. M. Pierce, P.A. Cundall, and D. Potyondy, A synthetic rock mass model for jointed
rock, Proc. 1st Canada-U.S. Rock Mechanics Symposium, Vancouver, B.C., May,
2007, 341-349.
18. A. Munjiza, The Combined Finite-Discrete Element Method, Wiley & Sons,
Chichester, 2004. 19. Rockfield, ELFEN, Rockfield Software, UK, http://www.rockfield.co.uk/elfen.htm.,
2001. 20. D.O. Potyondy and P.A. Cundall, A bonded-particle model for rock, International
Journal of Rock Mechanics and Mining Science, Vol 41, 2004, 1329–1364. 21. P.A. Cundall, Recent advances numerical modelling for large scale mining projects,
Australian Centre for Geomechanics Newsletter, Vol. 30, 2008,1-7. 22. D. Mas Ivars, D. O. Potyondy, M. Pierce and P. A. Cundall, The smooth-joint contact
model, Proceedings 8th World Congress on Computational Mechanics and 5th. European Congress on Computational Methods in Applied Sciences and Engineering, Venice, Italy, July 2008.
23. Itasca Consulting Group, PFC3D, Particle Flow Code in 3 Dimensions, Version 3.1,
Itasca Consulting Group, Minneapolis, 2005. 24. D.B. Billaux, D. Luvison and B.P. Darcel, 3FLO, calculs d’écoulements
tridimensionnels, Bases théoretiques. User’s Manual, 3FLO Version 2.31. Itasca, Ecully, October, 2006.

Fundamentals of slope design 26
25. L.J. Lorig, Using numbers from geology, Proceedings 11th Congress of the International Society for Rock Mechanics, Taylor and Francis, London, 2007, 1369-1377.
26. P.A. Cundall, M.E. Pierce and D. Mas Ivars, Quantifying the size effect of rock mass
strength, Proceedings, 1st Southern Hemisphere International Rock Mechanics Symposium, Perth, Y. Potvin et al., Eds., Australian Centre for Geomechanics, Nedlands, Western Australia, Vol. 2, 2008,3-15.
27. P.A. Cundall, An approach to rock mass modelling, From Rock Mass to Rock Model
- CD Workshop presentations, 1st Southern Hemisphere International Rock Mechanics Symposium, Perth, Y. Potvin et al., Eds., Australian Centre for Geomechanics, Nedlands, Western Australia, 2008.
28. B. Sainsbury, M. Pierce and D. Mas Ivars, Simulation of rock-mass strength
anisotropy and scale effects using a Ubiquitous Joint Rock Mass (UJRM) model, Proceedings First International FLAC/DEM Symposium on Numerical Modelling, Hart et al, Eds., Itasca, Minneapolis, 2008
29. A. Crook, S. Wilson, J.G. Yu and R. Owen, Computational modelling of the
localized deformation associated with borehole breakout in quasi-brittle materials. Journal Petroleum Science and Engineering, Vol. 38, 2003, 177– 186.
30.A.D. Watson, C.D. Martin, D.P. Moore, T.W.G. Stewart and L.J. Lorig,
Integration of geology, monitoring and modelling to assess rockslide risk, Felsbau, Vol. 24, 2006,50-58.
31. L.J. Lorig, A.D. Watson, C.D. Martin and D.P. Moore, Rockslide run-out prediction
from distinct element analysis, Geomechanics and Geoengineering, Vol. 4, 2009, 17-25.