Embed Size (px)
Citation preview
January 13, 2021
© Ichigo Inc. All rights reserved. www.ichigo.gr.jp/en
FY22/2 H1 Corporate Presentation
Ichigo (2337)October 14, 2021
© Ichigo Inc. All rights reserved. 2
We would like to express our deepest condolences to all those affected by the Covid pandemic globally, and our wishes for the earliest and fullest possible recovery.
Take care, be safe.
© Ichigo Inc. All rights reserved.
Make The WorldMore Sustainable
© Ichigo Inc. All rights reserved.
© Ichigo Inc. All rights reserved.
© Ichigo Inc. All rights reserved. 6
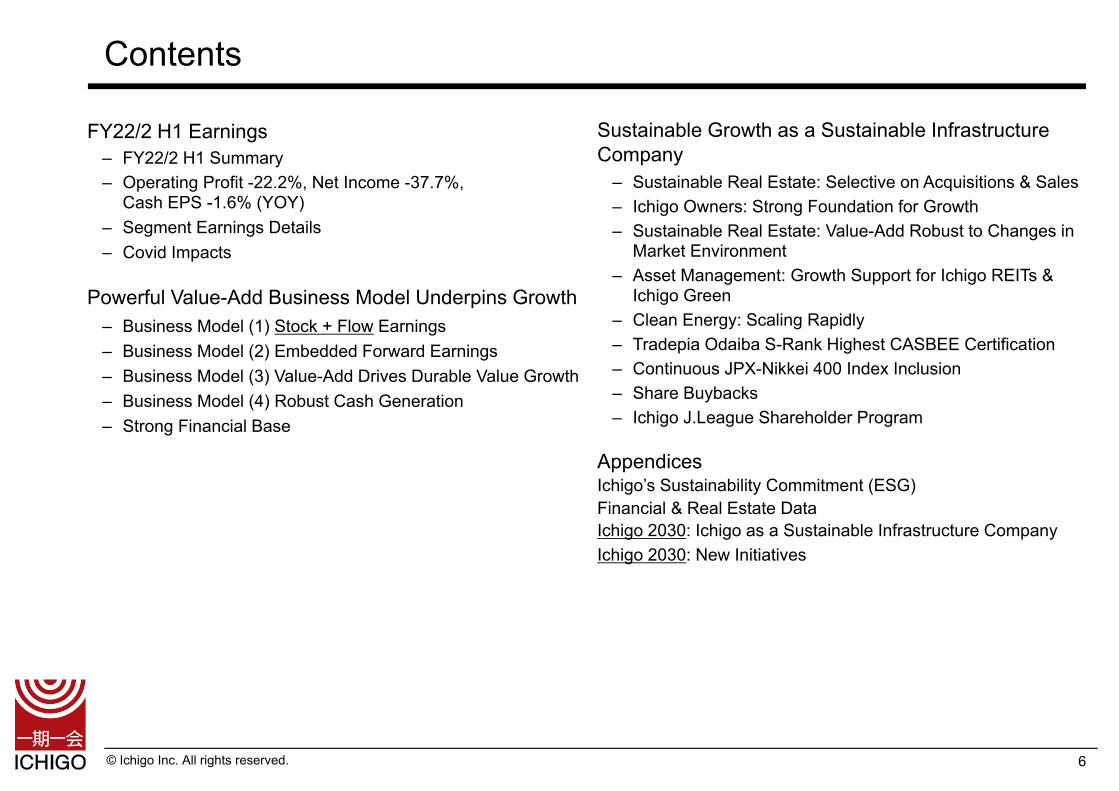
Contents
FY22/2 H1 Earnings‒ FY22/2 H1 Summary‒ Operating Profit -22.2%, Net Income -37.7%,
Cash EPS -1.6% (YOY)‒ Segment Earnings Details‒ Covid Impacts
Powerful Value-Add Business Model Underpins Growth‒ Business Model (1) Stock + Flow Earnings‒ Business Model (2) Embedded Forward Earnings‒ Business Model (3) Value-Add Drives Durable Value Growth‒ Business Model (4) Robust Cash Generation‒ Strong Financial Base
Sustainable Growth as a Sustainable Infrastructure Company‒ Sustainable Real Estate: Selective on Acquisitions & Sales‒ Ichigo Owners: Strong Foundation for Growth‒ Sustainable Real Estate: Value-Add Robust to Changes in
Market Environment‒ Asset Management: Growth Support for Ichigo REITs &
Ichigo Green‒ Clean Energy: Scaling Rapidly ‒ Tradepia Odaiba S-Rank Highest CASBEE Certification‒ Continuous JPX-Nikkei 400 Index Inclusion‒ Share Buybacks‒ Ichigo J.League Shareholder Program
AppendicesIchigo’s Sustainability Commitment (ESG)Financial & Real Estate DataIchigo 2030: Ichigo as a Sustainable Infrastructure CompanyIchigo 2030: New Initiatives
© Ichigo Inc. All rights reserved.
FY22/2 H1 Earnings
7
© Ichigo Inc. All rights reserved. 8
– Slow Hotel Earnings Recovery due to Prolonged Covid Effects
– Minimal Covid Impact on Mid-Size Offices
– Clean Energy Growth – Stock Earnings +14% YOY
– JPX-Nikkei 400 Index Inclusion for 6th Year in a Row
– Qualified for TSE Prime Market (Listing Date: April 4, 2022)
FY22/2 H1 Summary
© Ichigo Inc. All rights reserved.
FY22/2 H1 Summary
9
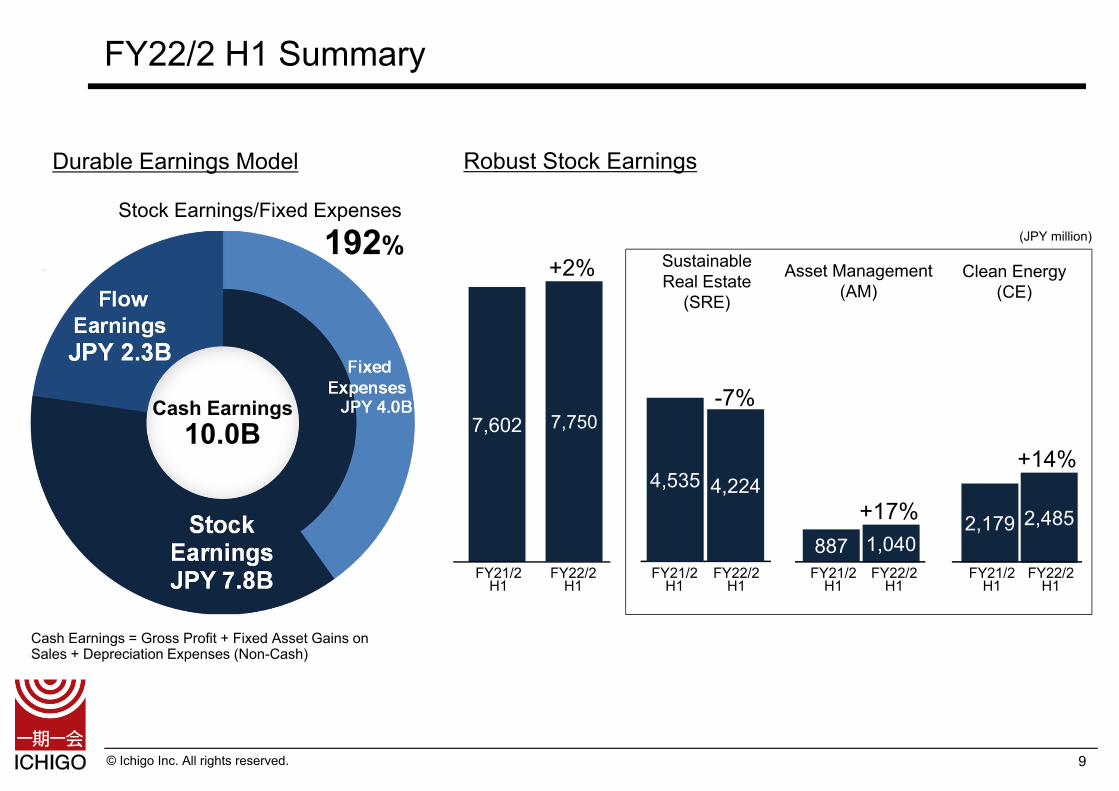
Cash Earnings10.0B
Durable Earnings Model Robust Stock Earnings
7,7507,602
+2%
4,2244,535
1,0408872,4852,179
-7%
+17%
+14%
Sustainable Real Estate
(SRE)
Asset Management(AM)
Clean Energy(CE)
192%Stock Earnings/Fixed Expenses
Cash Earnings = Gross Profit + Fixed Asset Gains on Sales + Depreciation Expenses (Non-Cash)
(JPY million)
FY22/2 H1
FY22/2 H1
FY22/2 H1
FY22/2 H1
FY21/2 H1
FY21/2 H1
FY21/2 H1
FY21/2 H1
© Ichigo Inc. All rights reserved.
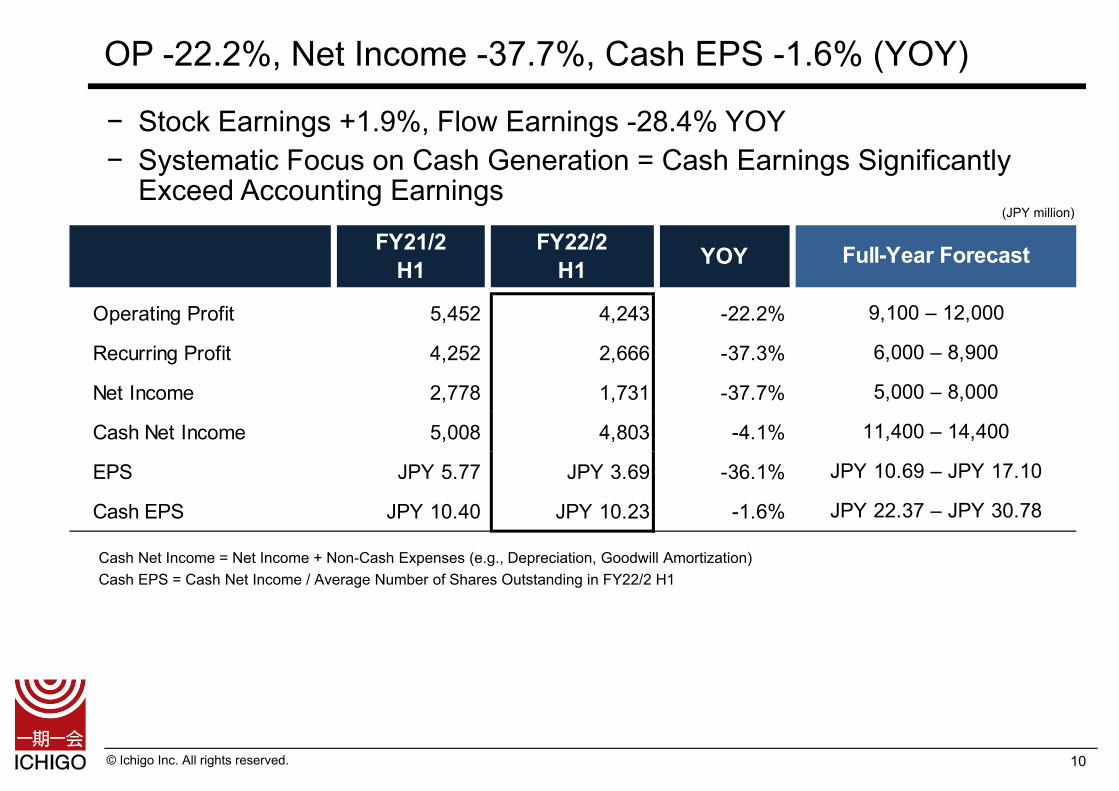
− Stock Earnings +1.9%, Flow Earnings -28.4% YOY− Systematic Focus on Cash Generation = Cash Earnings Significantly
Exceed Accounting Earnings
OP -22.2%, Net Income -37.7%, Cash EPS -1.6% (YOY)
10
(JPY million)
Cash Net Income = Net Income + Non-Cash Expenses (e.g., Depreciation, Goodwill Amortization)Cash EPS = Cash Net Income / Average Number of Shares Outstanding in FY22/2 H1
FY21/2H1
FY22/2H1 YOY
Operating Profit 5,452 4,243 -22.2%
Recurring Profit 4,252 2,666 -37.3%
Net Income 2,778 1,731 -37.7%
Cash Net Income 5,008 4,803 -4.1%
EPS JPY 5.77 JPY 3.69 -36.1%
Cash EPS JPY 10.40 JPY 10.23 -1.6%
5,000 – 8,000
11,400 – 14,400
JPY 10.69 – JPY 17.10
JPY 22.37 – JPY 30.78
Full-Year Forecast
9,100 – 12,000
6,000 – 8,900
© Ichigo Inc. All rights reserved.
FY21/2 H1 FY22/2 H1 Full-Year Forecast FY21/2 H1 FY22/2 H1 YOY
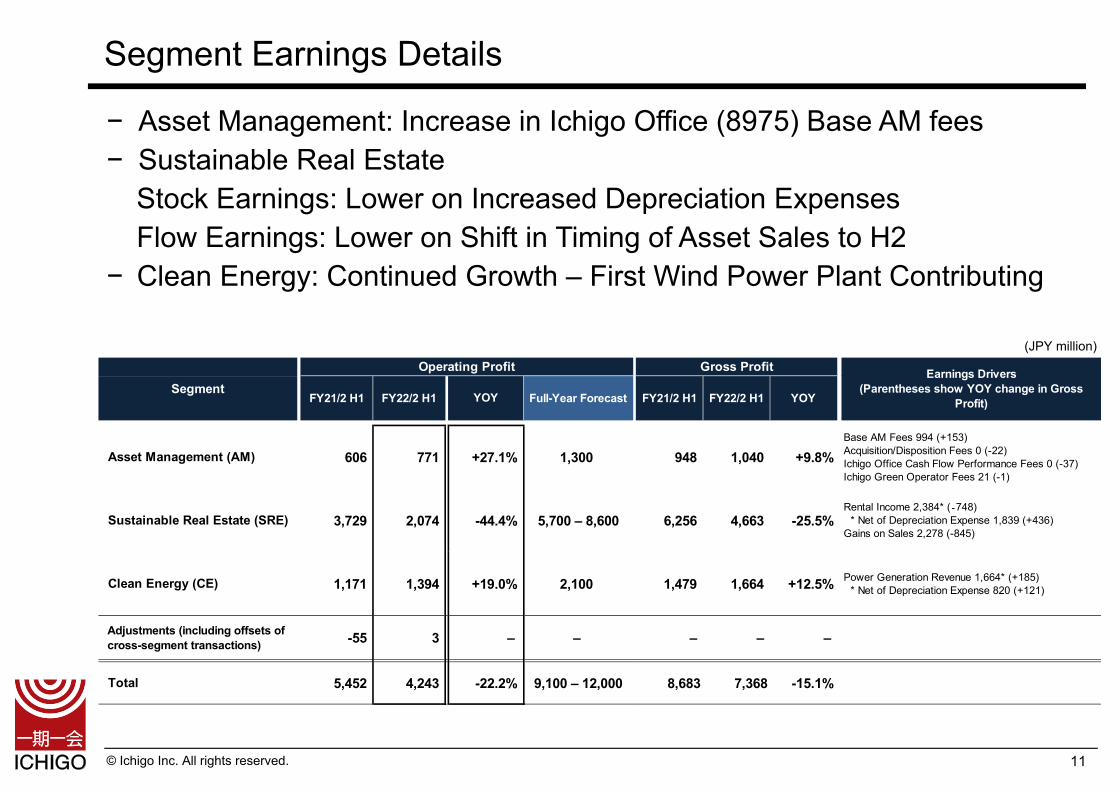
Asset Management (AM) 606 771 +27.1% 1,300 948 1,040 +9.8%Base AM Fees 994 (+153)Acquisition/Disposition Fees 0 (-22)Ichigo Office Cash Flow Performance Fees 0 (-37)Ichigo Green Operator Fees 21 (-1)
Sustainable Real Estate (SRE) 3,729 2,074 -44.4% 5,700 – 8,600 6,256 4,663 -25.5%Rental Income 2,384* (‐748) * Net of Depreciation Expense 1,839 (+436)Gains on Sales 2,278 (-845)
Clean Energy (CE) 1,171 1,394 +19.0% 2,100 1,479 1,664 +12.5% Power Generation Revenue 1,664* (+185) * Net of Depreciation Expense 820 (+121)
Adjustments (including offsets ofcross-segment transactions) -55 3 – – – – –
Total 5,452 4,243 -22.2% 9,100 – 12,000 8,683 7,368 -15.1%
SegmentOperating Profit Gross Profit Earnings Drivers
(Parentheses show YOY change in GrossProfit)YOY
Segment Earnings Details
− Asset Management: Increase in Ichigo Office (8975) Base AM fees− Sustainable Real Estate
Stock Earnings: Lower on Increased Depreciation ExpensesFlow Earnings: Lower on Shift in Timing of Asset Sales to H2
− Clean Energy: Continued Growth – First Wind Power Plant Contributing
11
(JPY million)
© Ichigo Inc. All rights reserved.
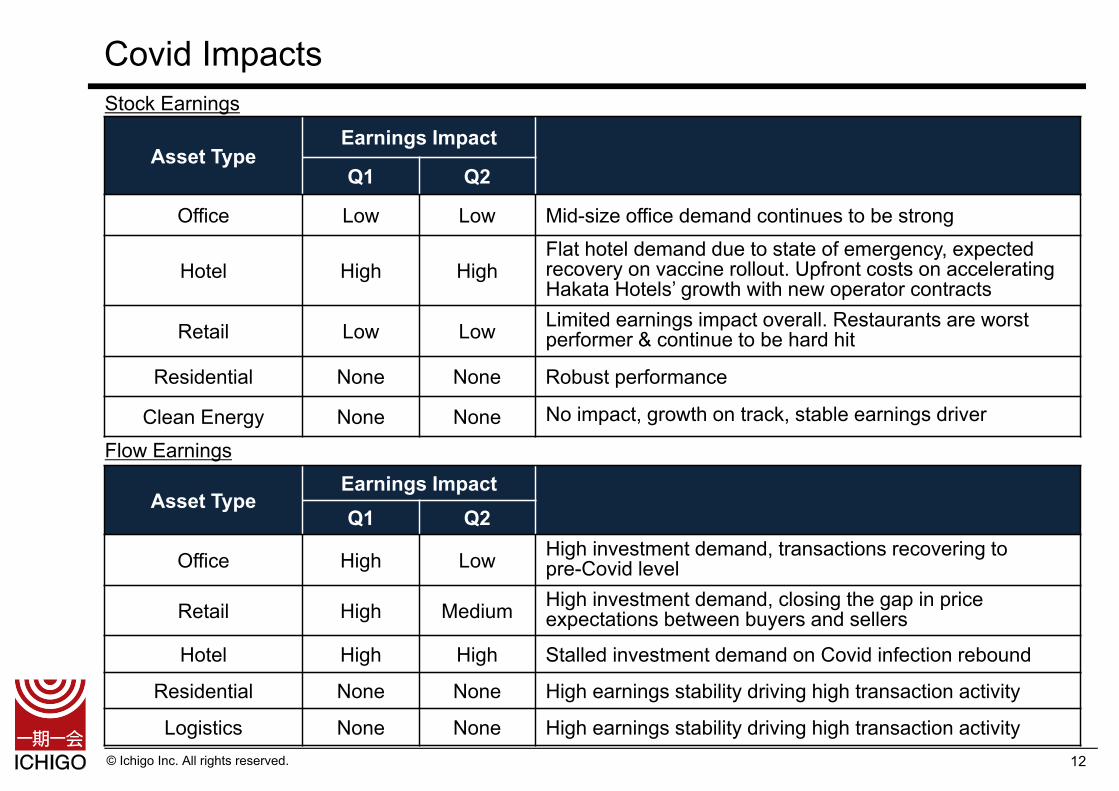
Covid Impacts
12
Stock Earnings
Flow Earnings
Asset TypeEarnings Impact
Q1 Q2
Office Low Low Mid-size office demand continues to be strong
Hotel High HighFlat hotel demand due to state of emergency, expected recovery on vaccine rollout. Upfront costs on accelerating Hakata Hotels’ growth with new operator contracts
Retail Low Low Limited earnings impact overall. Restaurants are worst performer & continue to be hard hit
Residential None None Robust performance
Clean Energy None None No impact, growth on track, stable earnings driver
Asset TypeEarnings ImpactQ1 Q2
Office High Low High investment demand, transactions recovering to pre-Covid level
Retail High Medium High investment demand, closing the gap in price expectations between buyers and sellers
Hotel High High Stalled investment demand on Covid infection rebound
Residential None None High earnings stability driving high transaction activity
Logistics None None High earnings stability driving high transaction activity

© Ichigo Inc. All rights reserved.
Powerful Value-Add Business Model Underpins Growth
13
© Ichigo Inc. All rights reserved. 14
(JPY million)
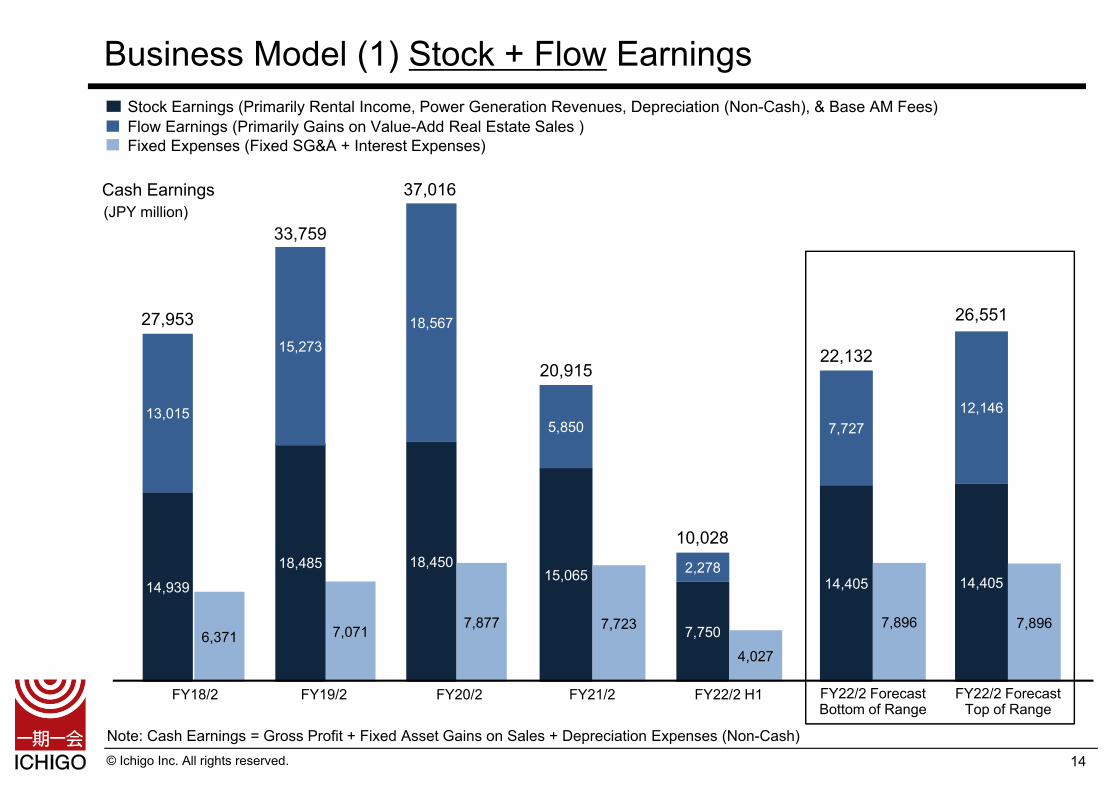
Stock Earnings (Primarily Rental Income, Power Generation Revenues, Depreciation (Non-Cash), & Base AM Fees) Flow Earnings (Primarily Gains on Value-Add Real Estate Sales )Fixed Expenses (Fixed SG&A + Interest Expenses)
FY18/2 FY19/2 FY20/2 FY21/2 FY22/2 ForecastBottom of Range
Cash Earnings
14,939
6,371 7,071
18,45018,485
13,015
15,27318,567
37,016
33,759
27,953
7,877
Note: Cash Earnings = Gross Profit + Fixed Asset Gains on Sales + Depreciation Expenses (Non-Cash)
15,065
7,723
5,850
20,915
FY22/2 H1 FY22/2 ForecastTop of Range
14,405
7,896
12,146
14,405
7,896
7,727
22,132
26,551
7,7504,027
2,278
10,028
Business Model (1) Stock + Flow Earnings
© Ichigo Inc. All rights reserved.
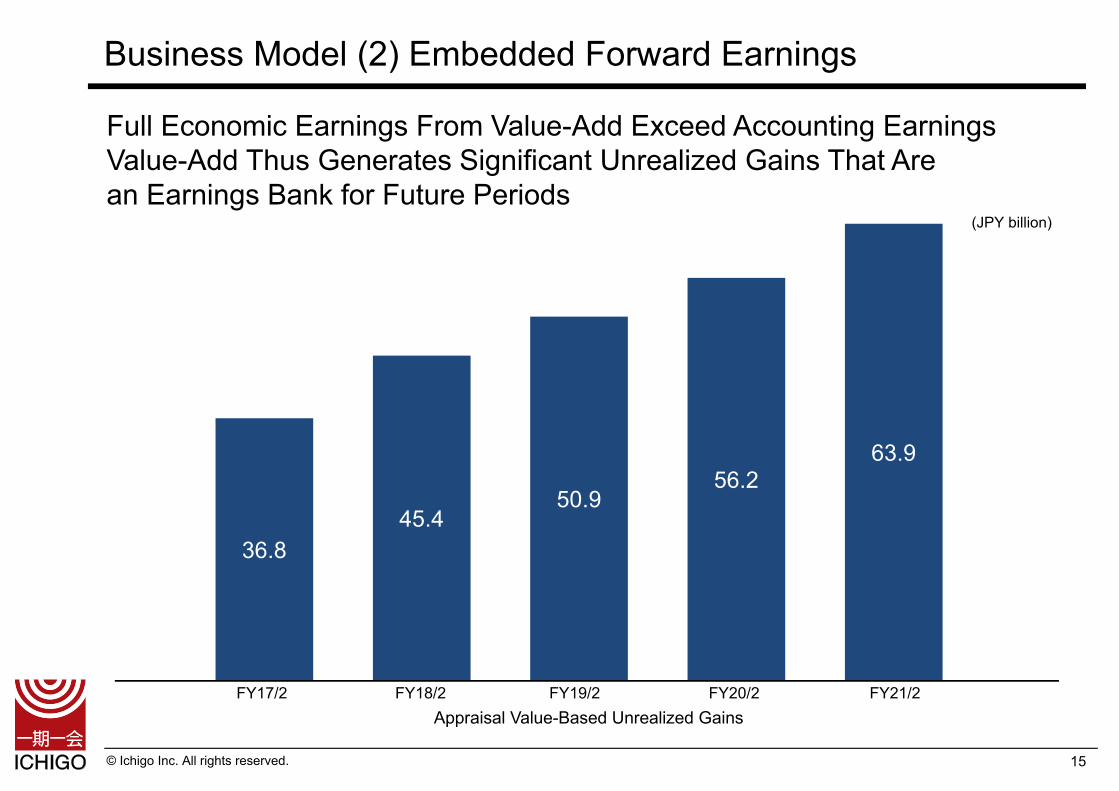
Full Economic Earnings From Value-Add Exceed Accounting Earnings Value-Add Thus Generates Significant Unrealized Gains That Are an Earnings Bank for Future Periods
15
36.845.4
(JPY billion)
FY17/2 FY18/2 FY19/2
Business Model (2) Embedded Forward Earnings
Appraisal Value-Based Unrealized Gains
50.9
FY20/2
56.2
FY21/2
63.9
© Ichigo Inc. All rights reserved. 16
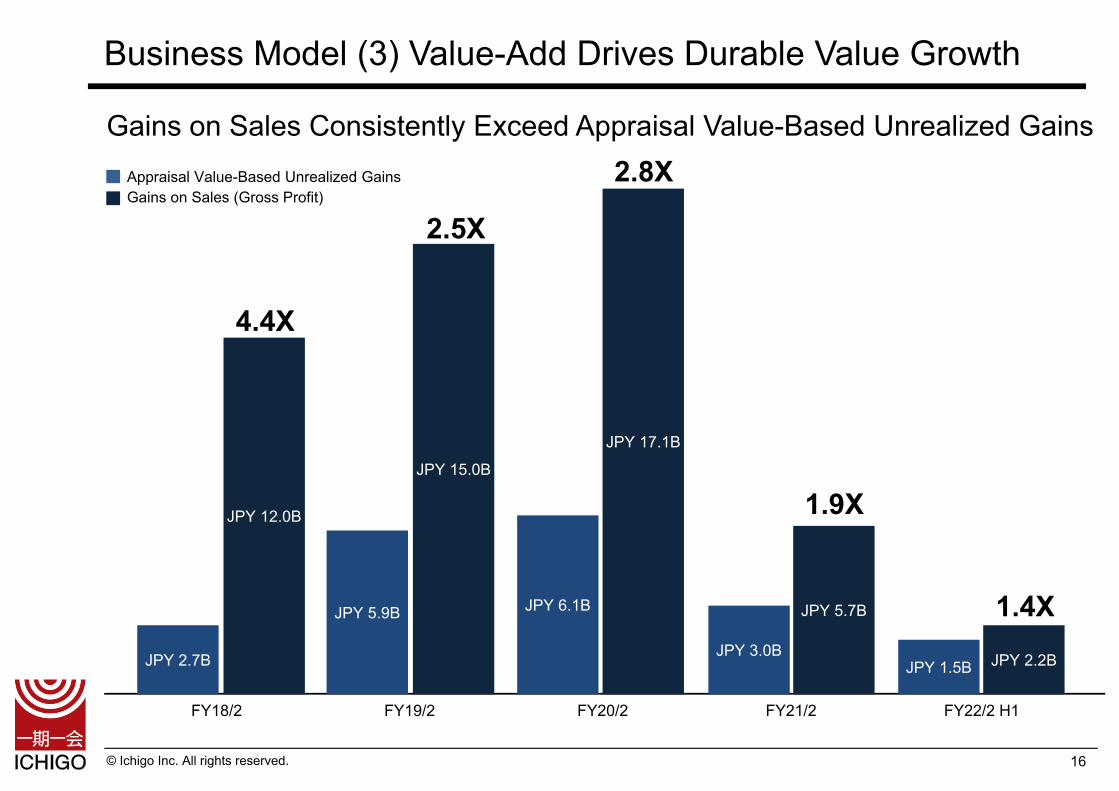
Business Model (3) Value-Add Drives Durable Value Growth
Gains on Sales Consistently Exceed Appraisal Value-Based Unrealized GainsAppraisal Value-Based Unrealized GainsGains on Sales (Gross Profit)
FY19/2 FY20/2 FY21/2 FY22/2 H1
4.4X
2.5X
2.8X
1.9X
JPY 2.7B
JPY 12.0B
JPY 5.9B
JPY 15.0B
JPY 6.1B
JPY 17.1B
JPY 3.0B
JPY 5.7B
JPY 1.5B JPY 2.2B
1.4X
FY18/2
© Ichigo Inc. All rights reserved.
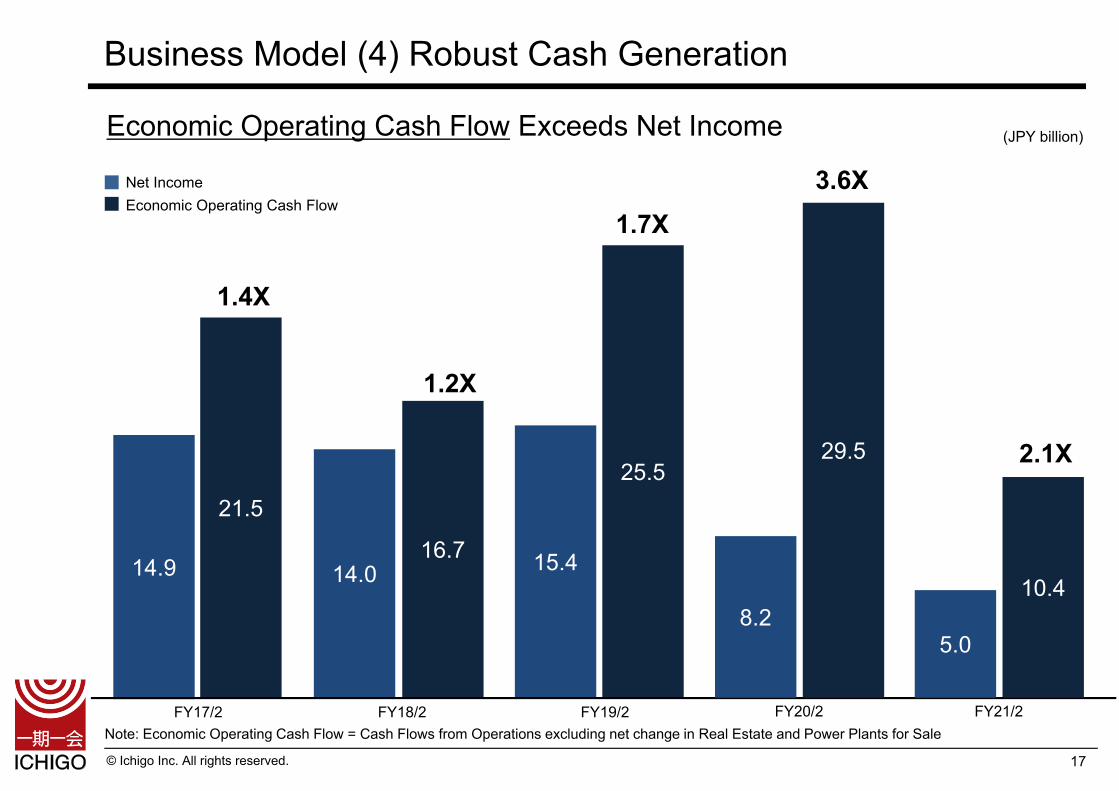
Economic Operating Cash Flow Exceeds Net Income
17
Business Model (4) Robust Cash Generation
Net IncomeEconomic Operating Cash Flow
Note: Economic Operating Cash Flow = Cash Flows from Operations excluding net change in Real Estate and Power Plants for Sale
(JPY billion)
14.9
21.5
14.016.7 15.4
25.5
FY17/2 FY18/2 FY19/2
1.7X
1.4X
1.2X
5.0
10.4
FY21/2
2.1X
8.2
29.5
FY20/2
3.6X
© Ichigo Inc. All rights reserved.
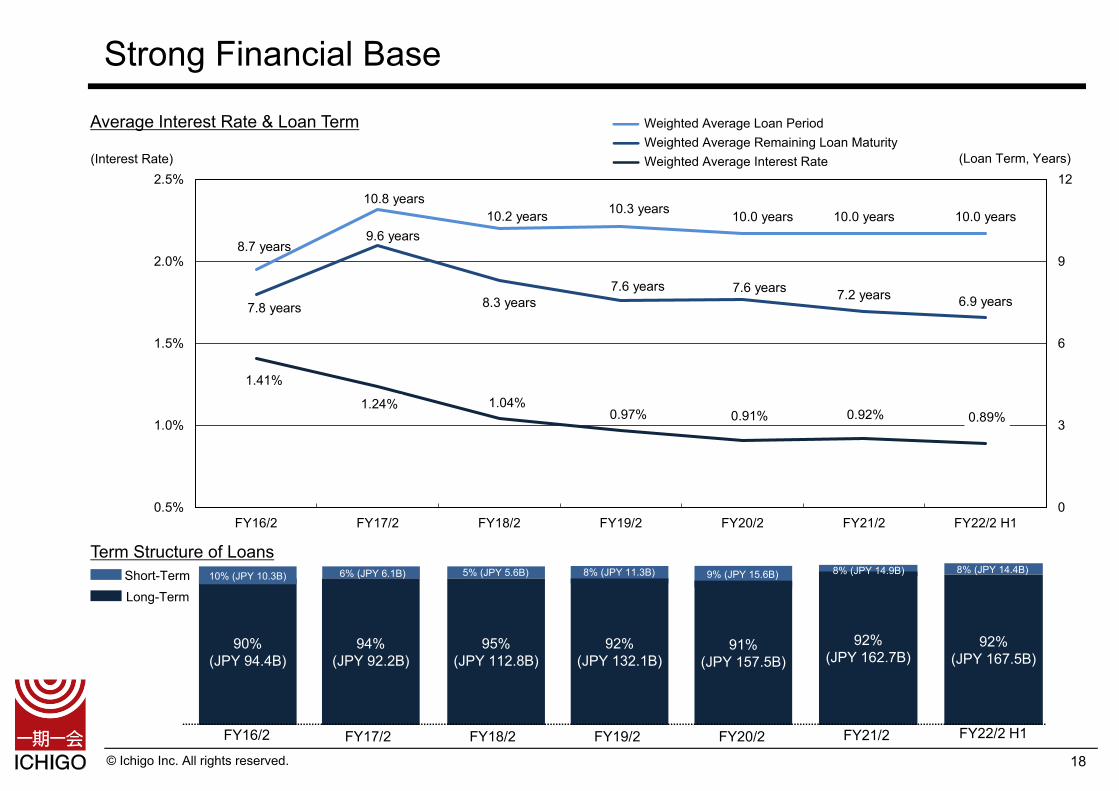
1.41%
1.24% 1.04%0.97% 0.91% 0.92% 0.89%
8.7 years
10.8 years 10.2 years 10.3 years 10.0 years 10.0 years 10.0 years
7.8 years
9.6 years
8.3 years 7.6 years 7.6 years 7.2 years 6.9 years
0
3
6
9
12
0.5%
1.0%
1.5%
2.0%
2.5%
FY16/2 FY17/2 FY18/2 FY19/2 FY20/2 FY21/2 FY22/2 H1
Strong Financial Base
Short-Term
90%(JPY 94.4B)
10% (JPY 10.3B)
Average Interest Rate & Loan Term
Term Structure of Loans
Long-Term
95%(JPY 112.8B)
5% (JPY 5.6B)
94%(JPY 92.2B)
6% (JPY 6.1B)
(Interest Rate) (Loan Term, Years)
92%(JPY 132.1B)
8% (JPY 11.3B)
Weighted Average Remaining Loan MaturityWeighted Average Interest Rate
Weighted Average Loan Period
FY16/2 FY17/2 FY18/2 FY19/2
91%(JPY 157.5B)
9% (JPY 15.6B)
FY20/2 FY21/2
18
92%(JPY 162.7B)
8% (JPY 14.9B)
FY22/2 H1
92%(JPY 167.5B)
8% (JPY 14.4B)
© Ichigo Inc. All rights reserved.
Sustainable Growth as a Sustainable Infrastructure Company
19
© Ichigo Inc. All rights reserved.
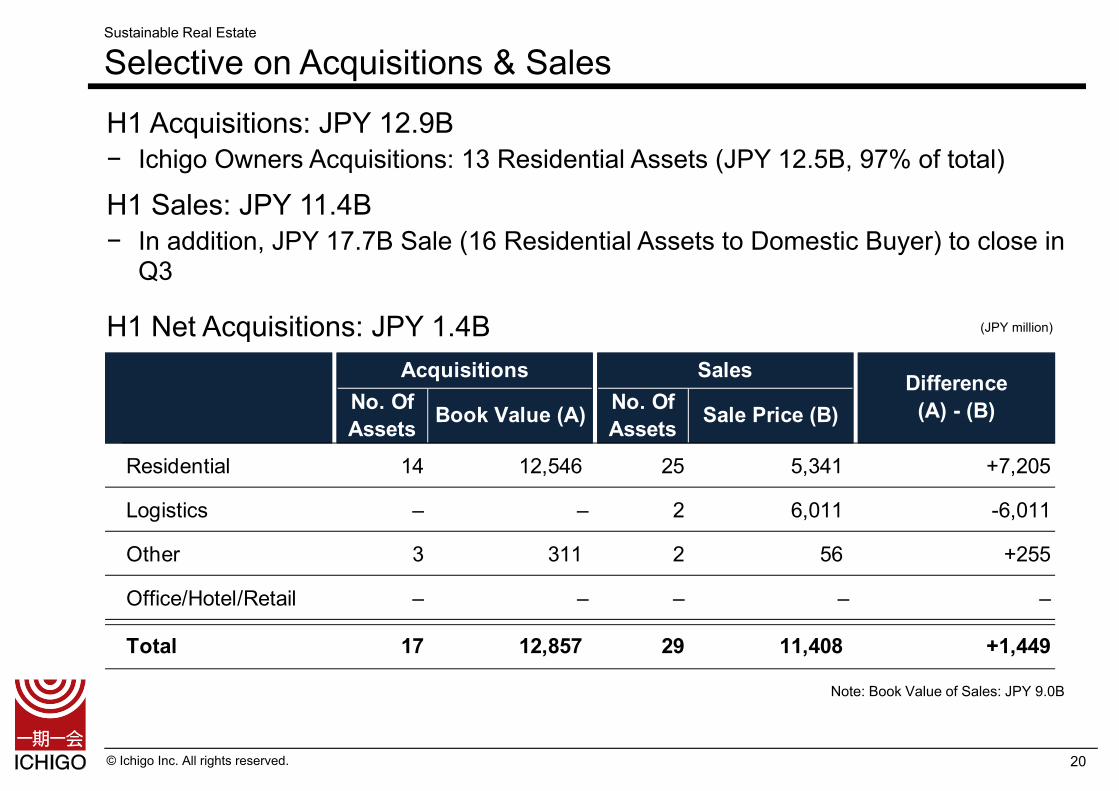
No. OfAssets Book Value (A) No. Of
Assets Sale Price (B)
Residential 14 12,546 25 5,341 +7,205
Logistics – – 2 6,011 -6,011
Other 3 311 2 56 +255
Office/Hotel/Retail – – – – –
Total 17 12,857 29 11,408 +1,449
Acquisitions Sales Difference(A) - (B)
20
Sustainable Real Estate
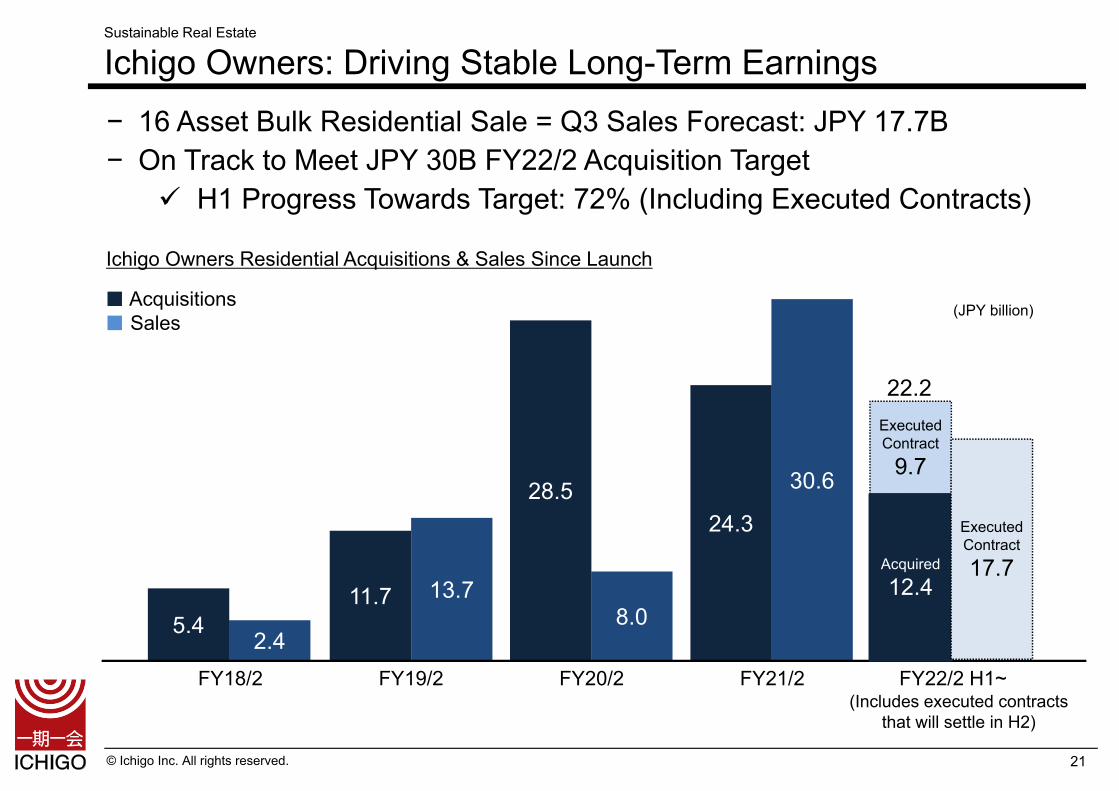
Selective on Acquisitions & SalesH1 Acquisitions: JPY 12.9B− Ichigo Owners Acquisitions: 13 Residential Assets (JPY 12.5B, 97% of total)
H1 Sales: JPY 11.4B− In addition, JPY 17.7B Sale (16 Residential Assets to Domestic Buyer) to close in
Q3
H1 Net Acquisitions: JPY 1.4B (JPY million)
Note: Book Value of Sales: JPY 9.0B
© Ichigo Inc. All rights reserved.
Ichigo Owners Residential Acquisitions & Sales Since Launch
(JPY billion)
FY18/2
■ Acquisitions ■ Sales
FY19/2 FY20/2 FY21/2
21
Sustainable Real Estate
Ichigo Owners: Driving Stable Long-Term Earnings
24.3
30.628.5
8.011.7 13.7
5.42.4
(Includes executed contracts that will settle in H2)
FY22/2 H1~
Executed Contract
9.7
Acquired12.4
ExecutedContract
17.7
22.2
− 16 Asset Bulk Residential Sale = Q3 Sales Forecast: JPY 17.7B− On Track to Meet JPY 30B FY22/2 Acquisition Target
H1 Progress Towards Target: 72% (Including Executed Contracts)
© Ichigo Inc. All rights reserved.
Multi-Asset
GPM
22
Sustainable Real Estate
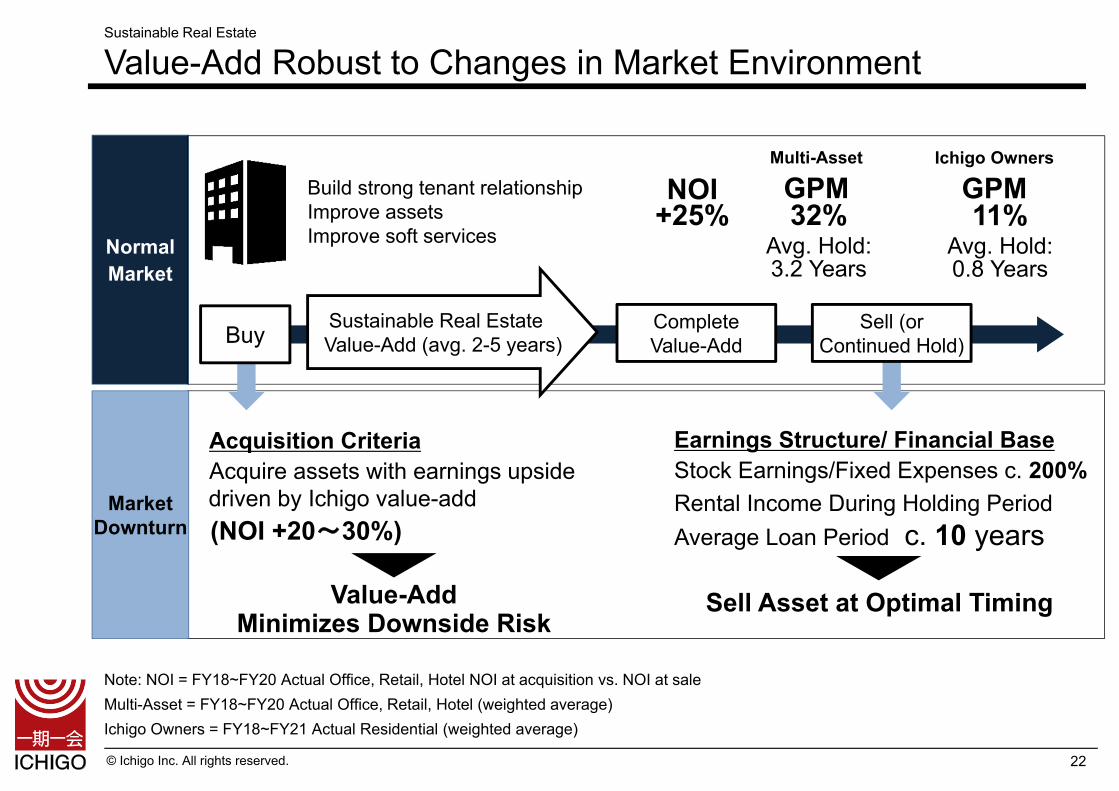
Value-Add Robust to Changes in Market Environment
Note: NOI = FY18~FY20 Actual Office, Retail, Hotel NOI at acquisition vs. NOI at saleMulti-Asset = FY18~FY20 Actual Office, Retail, Hotel (weighted average)Ichigo Owners = FY18~FY21 Actual Residential (weighted average)
NormalMarket
Acquisition CriteriaAcquire assets with earnings upside driven by Ichigo value-add (NOI +20~30%)
Earnings Structure/ Financial BaseStock Earnings/Fixed Expenses c. 200%Rental Income During Holding PeriodAverage Loan Period c. 10 years
Value-AddMinimizes Downside Risk
Sell Asset at Optimal Timing
Market Downturn
NOI
Complete Value-Add
Sustainable Real Estate Value-Add (avg. 2-5 years)
+25% 11%Avg. Hold: 0.8 Years
Ichigo Owners
GPM
Sell (or Continued Hold)Buy
Build strong tenant relationshipImprove assetsImprove soft services
32%Avg. Hold: 3.2 Years
© Ichigo Inc. All rights reserved. 23
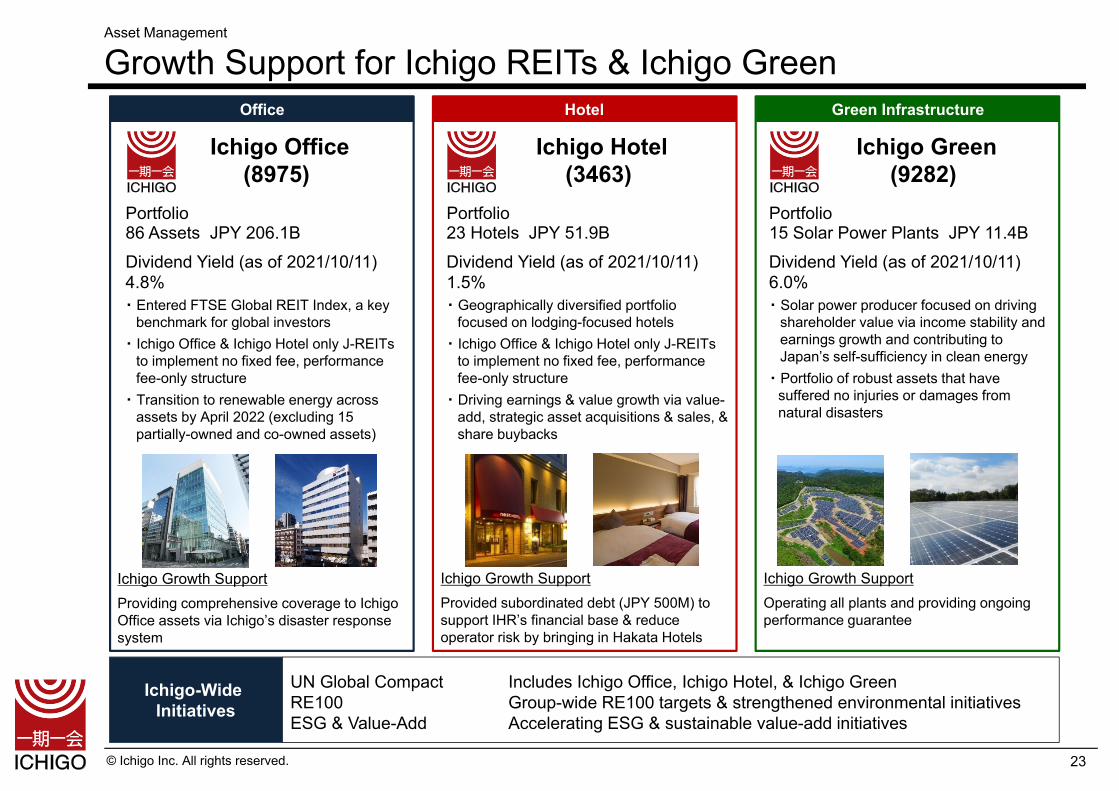
Ichigo Office (8975)
Ichigo Hotel (3463)
Ichigo Green (9282)
Portfolio86 Assets JPY 206.1B 23 Hotels JPY 51.9B 15 Solar Power Plants JPY 11.4B
・ Entered FTSE Global REIT Index, a key benchmark for global investors
・ Ichigo Office & Ichigo Hotel only J-REITs to implement no fixed fee, performance fee-only structure
・ Transition to renewable energy across assets by April 2022 (excluding 15 partially-owned and co-owned assets)
・ Geographically diversified portfolio focused on lodging-focused hotels
・ Ichigo Office & Ichigo Hotel only J-REITs to implement no fixed fee, performance fee-only structure
・ Driving earnings & value growth via value-add, strategic asset acquisitions & sales, & share buybacks
・ Solar power producer focused on driving shareholder value via income stability and earnings growth and contributing to Japan’s self-sufficiency in clean energy
・ Portfolio of robust assets that have suffered no injuries or damages from natural disasters
Dividend Yield (as of 2021/10/11) Dividend Yield (as of 2021/10/11) Dividend Yield (as of 2021/10/11)4.8% 1.5% 6.0%
Portfolio Portfolio
Ichigo Growth SupportProviding comprehensive coverage to Ichigo Office assets via Ichigo’s disaster response system
Ichigo Growth SupportProvided subordinated debt (JPY 500M) to support IHR’s financial base & reduce operator risk by bringing in Hakata Hotels
Ichigo Growth SupportOperating all plants and providing ongoing performance guarantee
Green InfrastructureOffice Hotel
Asset Management
Growth Support for Ichigo REITs & Ichigo Green
Ichigo-Wide Initiatives
UN Global CompactRE100 ESG & Value-Add
Includes Ichigo Office, Ichigo Hotel, & Ichigo GreenGroup-wide RE100 targets & strengthened environmental initiatives Accelerating ESG & sustainable value-add initiatives
© Ichigo Inc. All rights reserved.
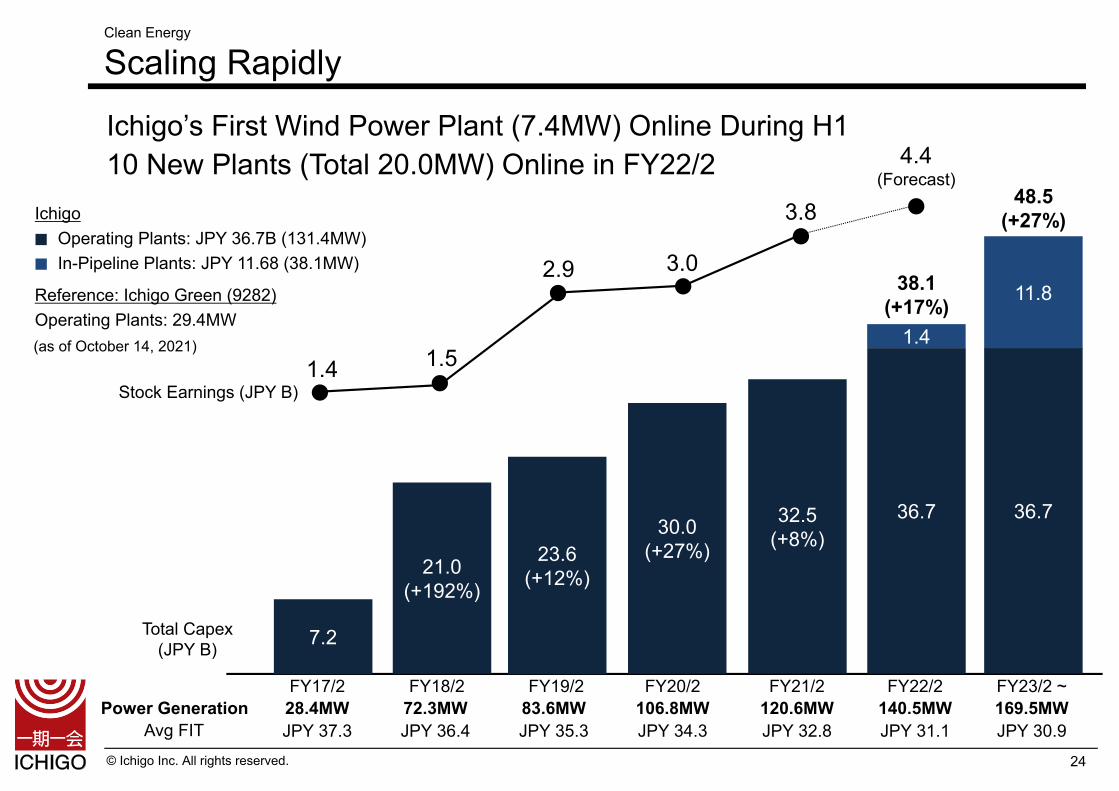
IchigoOperating Plants: JPY 36.7B (131.4MW)In-Pipeline Plants: JPY 11.68 (38.1MW)
Reference: Ichigo Green (9282)Operating Plants: 29.4MW
Ichigo’s First Wind Power Plant (7.4MW) Online During H110 New Plants (Total 20.0MW) Online in FY22/2
Clean Energy
Scaling Rapidly
FY17/228.4MW
FY18/272.3MW
FY19/283.6MW
FY20/2106.8MW
FY22/2140.5MW
FY23/2 ~169.5MWPower Generation
FY21/2120.6MW
Avg FIT
24
Total Capex(JPY B)
JPY 37.3 JPY 36.4 JPY 35.3 JPY 34.3 JPY 31.1 JPY 30.9JPY 32.8
2.9 3.0
3.8
4.4(Forecast)
1.51.4
32.5(+8%)
7.2
21.0(+192%)
23.6(+12%)
30.0(+27%)
48.5(+27%)
38.1(+17%) 11.8
1.4
36.7 36.7
Stock Earnings (JPY B)
(as of October 14, 2021)
© Ichigo Inc. All rights reserved.
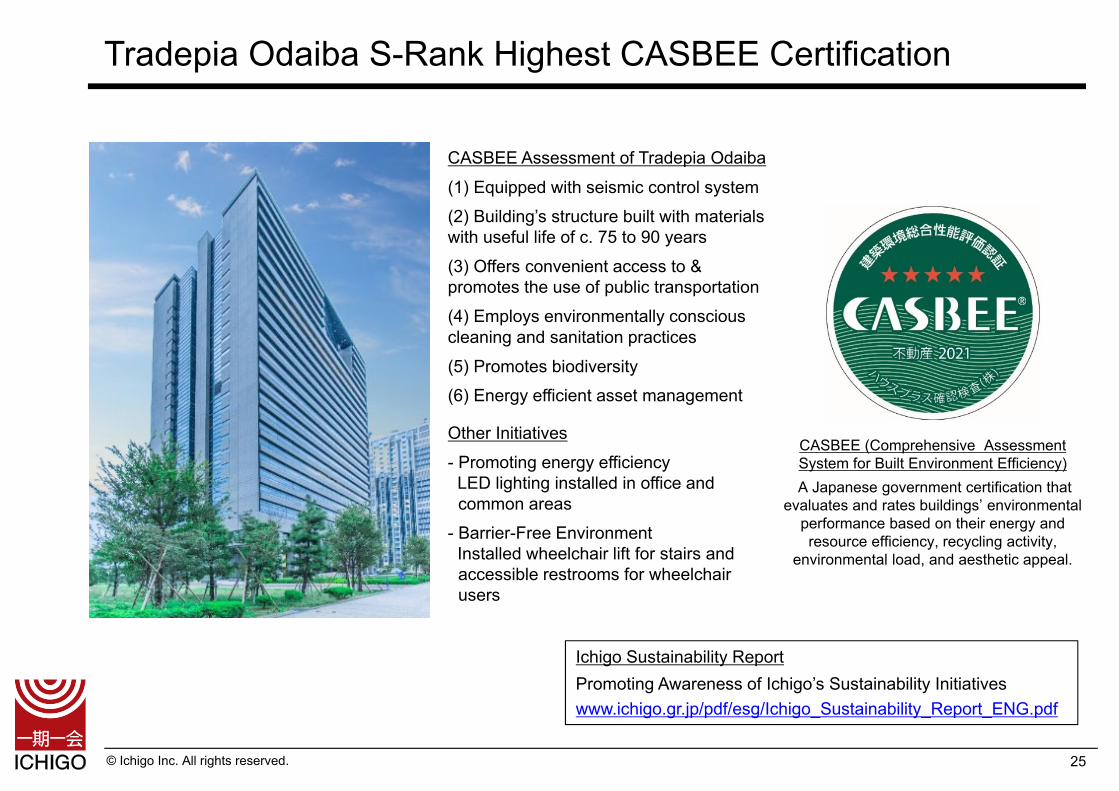
CASBEE (Comprehensive Assessment System for Built Environment Efficiency)A Japanese government certification that
evaluates and rates buildings’ environmental performance based on their energy and resource efficiency, recycling activity,
environmental load, and aesthetic appeal.
25
Tradepia Odaiba S-Rank Highest CASBEE Certification
CASBEE Assessment of Tradepia Odaiba
(1) Equipped with seismic control system(2) Building’s structure built with materials with useful life of c. 75 to 90 years(3) Offers convenient access to & promotes the use of public transportation(4) Employs environmentally conscious cleaning and sanitation practices(5) Promotes biodiversity (6) Energy efficient asset management
Ichigo Sustainability ReportPromoting Awareness of Ichigo’s Sustainability Initiativeswww.ichigo.gr.jp/pdf/esg/Ichigo_Sustainability_Report_ENG.pdf
Other Initiatives- Promoting energy efficiency
LED lighting installed in office and common areas
- Barrier-Free EnvironmentInstalled wheelchair lift for stairs and accessible restrooms for wheelchair users
© Ichigo Inc. All rights reserved.
Ranking Calculation
While the JPX-Nikkei 400 does not provide an official ranking of its 400 constituents,the ranking can be calculated based upon the JPX-Nikkei 400’s publicly-availableformula, which rank orders the 1,000 highest market capitalization companies out of the1,200 highest value-traded Japanese companies by:
(a) three-year average ROE (40% weighting)(b) three-year cumulative operating profit (40% weighting)(c) market capitalization (20% weighting)
Continuous JPX-Nikkei 400 Index Inclusion
26
Selected for Inclusion for the 6th Year in a Row− Targeting continuous inclusion in the JPX-Nikkei 400 over the full 11-year
span of Ichigo 2030 vision (FY20/2~FY30/2)
© Ichigo Inc. All rights reserved. 27
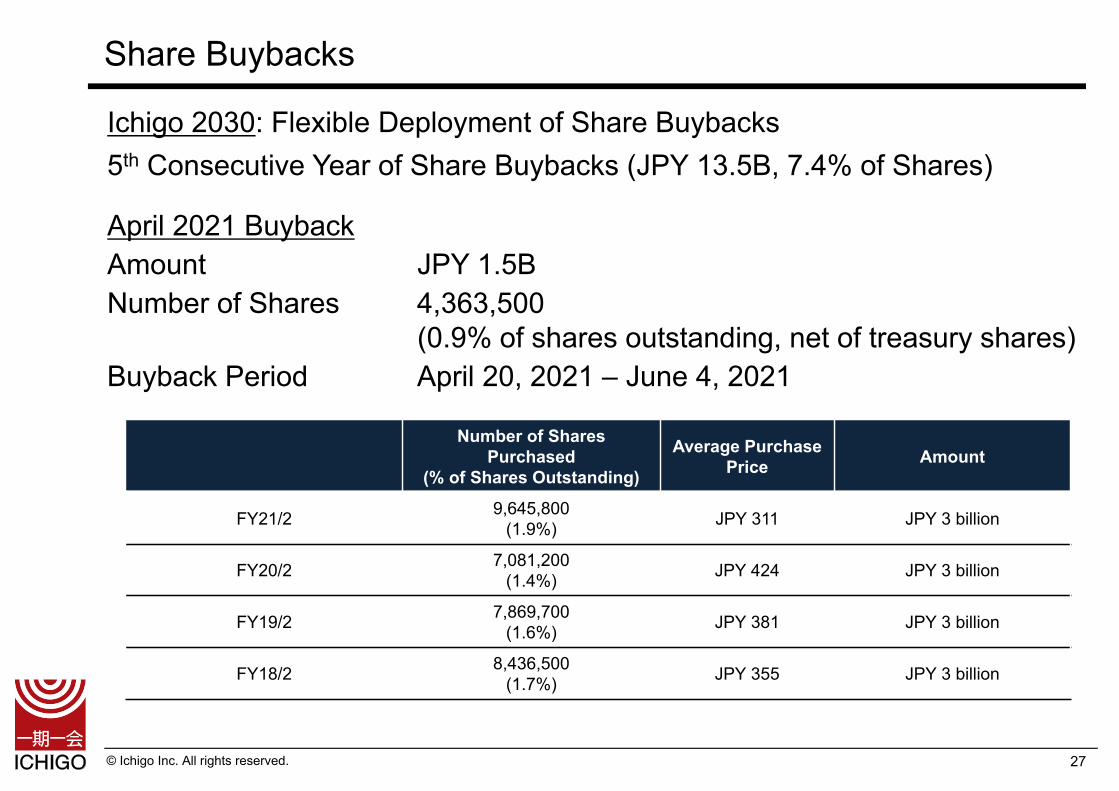
Share Buybacks
Ichigo 2030: Flexible Deployment of Share Buybacks5th Consecutive Year of Share Buybacks (JPY 13.5B, 7.4% of Shares)
April 2021 BuybackAmount JPY 1.5BNumber of Shares 4,363,500
(0.9% of shares outstanding, net of treasury shares)Buyback Period April 20, 2021 – June 4, 2021
Number of Shares Purchased
(% of Shares Outstanding)
Average PurchasePrice Amount
FY21/2 9,645,800(1.9%) JPY 311 JPY 3 billion
FY20/2 7,081,200(1.4%) JPY 424 JPY 3 billion
FY19/2 7,869,700(1.6%) JPY 381 JPY 3 billion
FY18/2 8,436,500(1.7%) JPY 355 JPY 3 billion
© Ichigo Inc. All rights reserved.
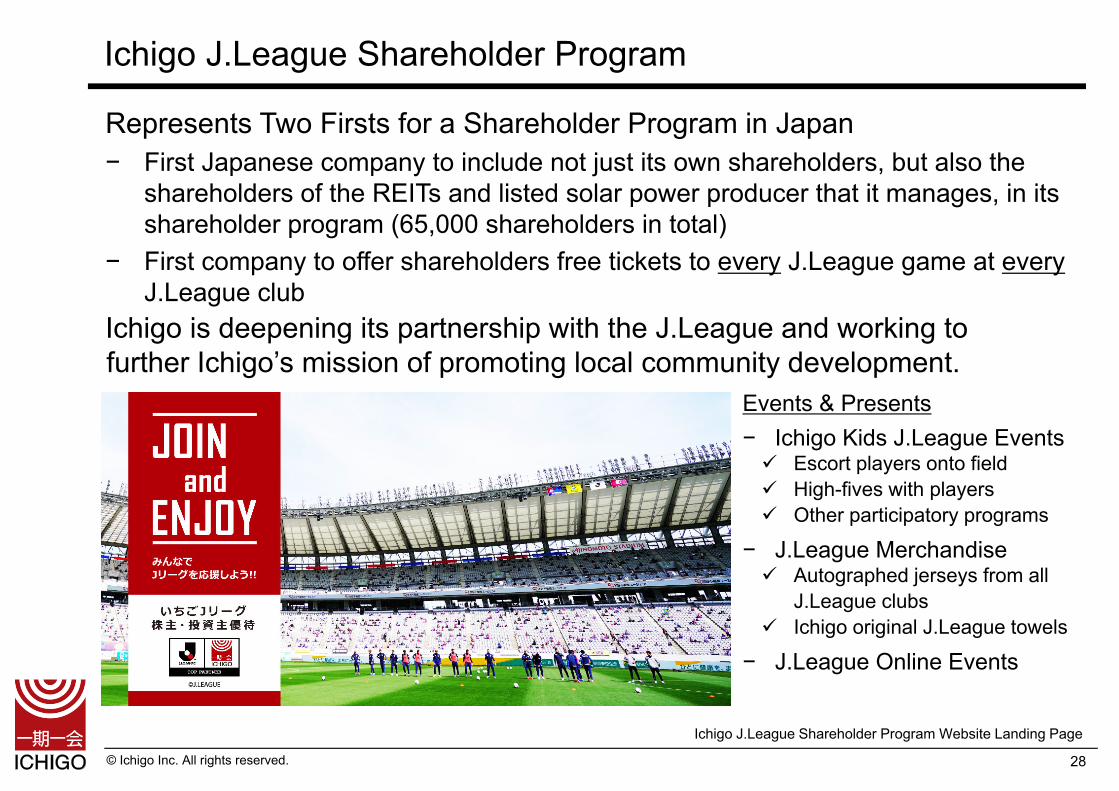
Ichigo J.League Shareholder Program
Represents Two Firsts for a Shareholder Program in Japan− First Japanese company to include not just its own shareholders, but also the
shareholders of the REITs and listed solar power producer that it manages, in its shareholder program (65,000 shareholders in total)
− First company to offer shareholders free tickets to every J.League game at everyJ.League club
Ichigo is deepening its partnership with the J.League and working to further Ichigo’s mission of promoting local community development.
Ichigo J.League Shareholder Program Website Landing Page
Events & Presents− Ichigo Kids J.League Events Escort players onto field High-fives with players Other participatory programs
− J.League Merchandise Autographed jerseys from all
J.League clubs Ichigo original J.League towels
− J.League Online Events
28
© Ichigo Inc. All rights reserved.
Appendix: Ichigo’s Sustainability Commitment (ESG)
29
© Ichigo Inc. All rights reserved. 30
Ichigo Sustainability Policy
Harmony with the EnvironmentIchigo actively monitors and minimizes the environmental impact of its business operations.Energy Conservation, CO2 Reduction, and RecyclingIchigo seeks to contribute to a low-carbon, low-waste society by reducing energy consumption, extending the useful life of assets, actively recycling, reducing waste production and water consumption, and implementing green procurement measures.Regulatory and Environmental ComplianceIchigo complies with all environmental laws and regulations and Ichigo’s own independently established environmental rules. Ichigo also carefully monitors and complies with all applicable changes in laws and regulations.Training and AwarenessIchigo promotes understanding of its Sustainability Policy and works to increase sustainability awareness among all Ichigo employees.Sustainability Performance Communication and DisclosureIchigo communicates its Sustainability Policy and Ichigo’s sustainability initiatives to society at large. Ichigo also obtains certifications for its sustainability activities on an ongoing basis.
© Ichigo Inc. All rights reserved.
Sustainability Initiatives
31
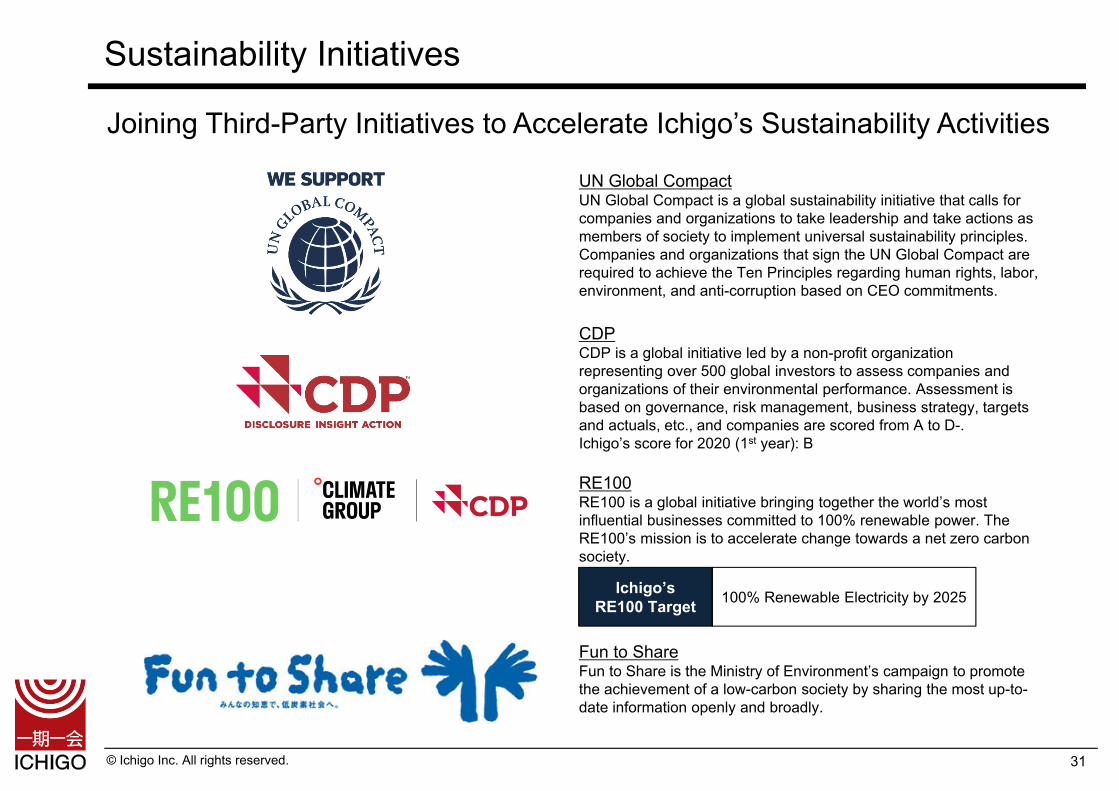
Joining Third-Party Initiatives to Accelerate Ichigo’s Sustainability Activities
RE100RE100 is a global initiative bringing together the world’s most influential businesses committed to 100% renewable power. The RE100’s mission is to accelerate change towards a net zero carbon society.
Fun to ShareFun to Share is the Ministry of Environment’s campaign to promote the achievement of a low-carbon society by sharing the most up-to-date information openly and broadly.
UN Global CompactUN Global Compact is a global sustainability initiative that calls for companies and organizations to take leadership and take actions as members of society to implement universal sustainability principles. Companies and organizations that sign the UN Global Compact are required to achieve the Ten Principles regarding human rights, labor, environment, and anti-corruption based on CEO commitments.
CDPCDP is a global initiative led by a non-profit organization representing over 500 global investors to assess companies and organizations of their environmental performance. Assessment is based on governance, risk management, business strategy, targets and actuals, etc., and companies are scored from A to D-.Ichigo’s score for 2020 (1st year): B
Ichigo’s RE100 Target 100% Renewable Electricity by 2025
© Ichigo Inc. All rights reserved. 32
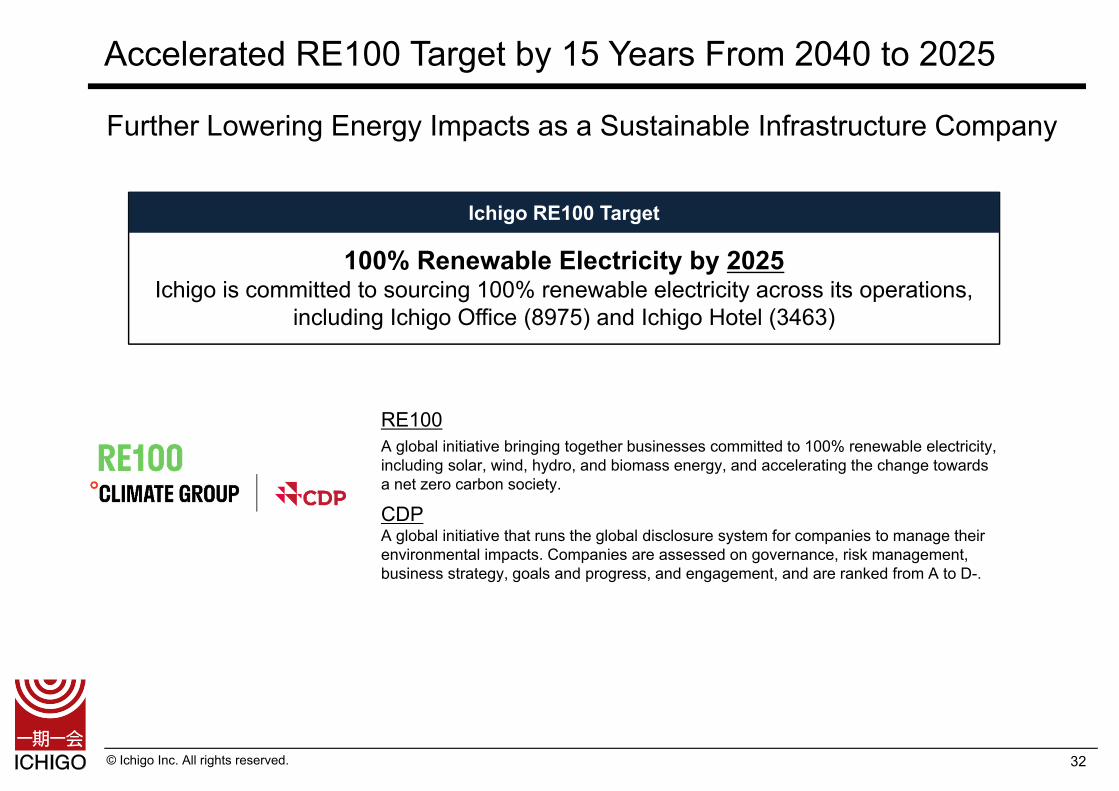
100% Renewable Electricity by 2025Ichigo is committed to sourcing 100% renewable electricity across its operations,
including Ichigo Office (8975) and Ichigo Hotel (3463)
Ichigo RE100 Target
Further Lowering Energy Impacts as a Sustainable Infrastructure Company
RE100A global initiative bringing together businesses committed to 100% renewable electricity, including solar, wind, hydro, and biomass energy, and accelerating the change towards a net zero carbon society.
CDPA global initiative that runs the global disclosure system for companies to manage their environmental impacts. Companies are assessed on governance, risk management, business strategy, goals and progress, and engagement, and are ranked from A to D-.
Accelerated RE100 Target by 15 Years From 2040 to 2025
© Ichigo Inc. All rights reserved. 33
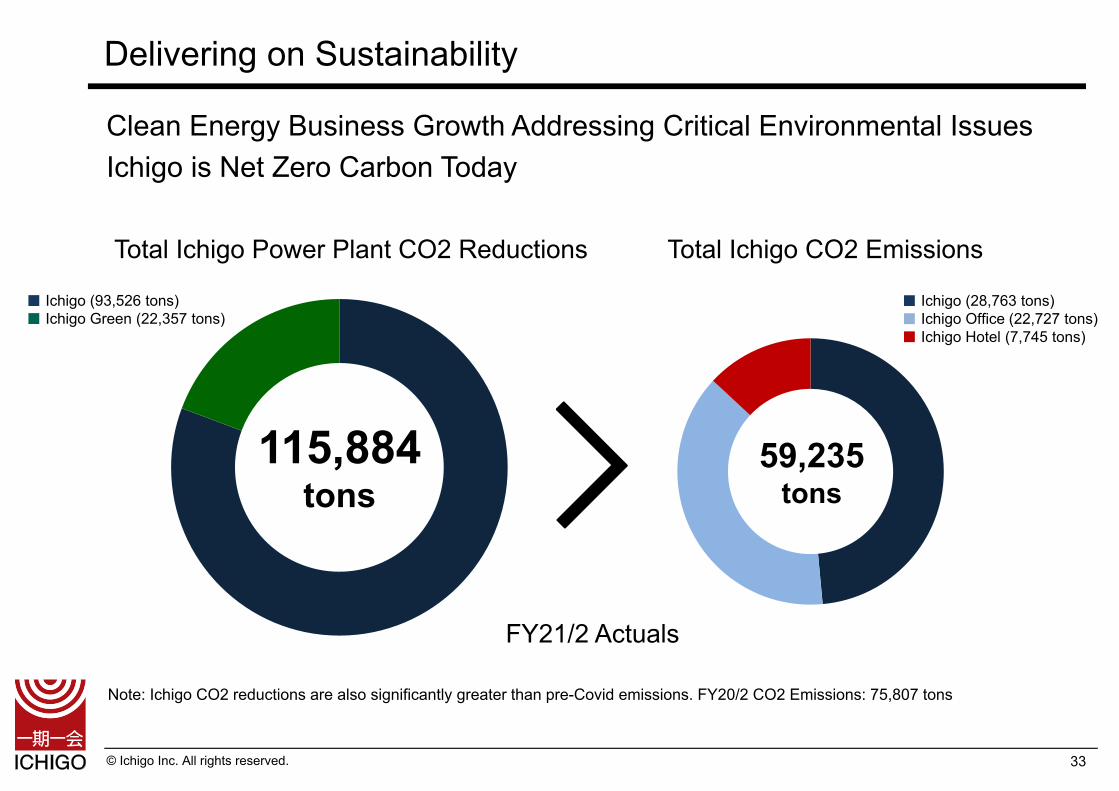
Total Ichigo CO2 Emissions
■ Ichigo (28,763 tons)■ Ichigo Office (22,727 tons)■ Ichigo Hotel (7,745 tons)
Note: Ichigo CO2 reductions are also significantly greater than pre-Covid emissions. FY20/2 CO2 Emissions: 75,807 tons
■ Ichigo (93,526 tons)■ Ichigo Green (22,357 tons)
Total Ichigo Power Plant CO2 Reductions
Delivering on Sustainability
Clean Energy Business Growth Addressing Critical Environmental IssuesIchigo is Net Zero Carbon Today
115,884tons
59,235tons
FY21/2 Actuals
© Ichigo Inc. All rights reserved.
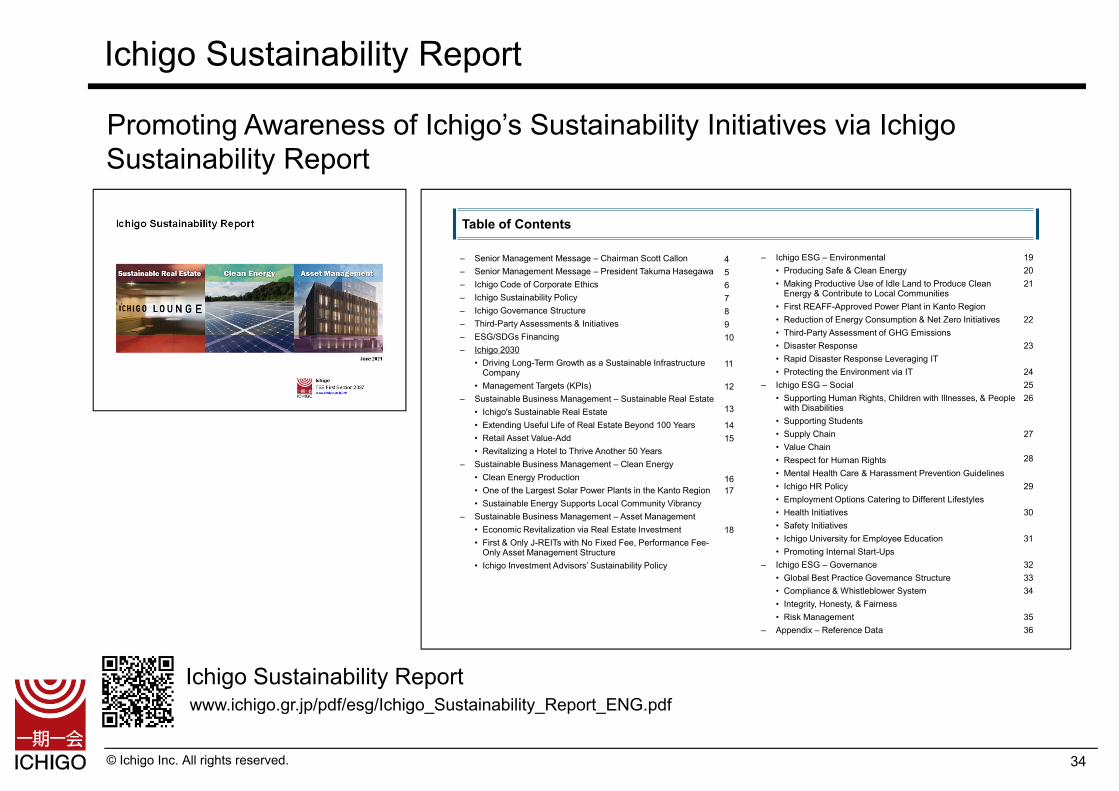
Ichigo Sustainability Report
34
Promoting Awareness of Ichigo’s Sustainability Initiatives via Ichigo Sustainability Report
Ichigo Sustainability Reportwww.ichigo.gr.jp/pdf/esg/Ichigo_Sustainability_Report_ENG.pdf
– Senior Management Message – Chairman Scott Callon– Senior Management Message – President Takuma Hasegawa – Ichigo Code of Corporate Ethics– Ichigo Sustainability Policy– Ichigo Governance Structure– Third-Party Assessments & Initiatives– ESG/SDGs Financing– Ichigo 2030
• Driving Long-Term Growth as a Sustainable Infrastructure Company
• Management Targets (KPIs)– Sustainable Business Management – Sustainable Real Estate
• Ichigo's Sustainable Real Estate• Extending Useful Life of Real Estate Beyond 100 Years• Retail Asset Value-Add• Revitalizing a Hotel to Thrive Another 50 Years
– Sustainable Business Management – Clean Energy• Clean Energy Production• One of the Largest Solar Power Plants in the Kanto Region• Sustainable Energy Supports Local Community Vibrancy
– Sustainable Business Management – Asset Management• Economic Revitalization via Real Estate Investment• First & Only J-REITs with No Fixed Fee, Performance Fee-
Only Asset Management Structure• Ichigo Investment Advisors’ Sustainability Policy
– Ichigo ESG – Environmental• Producing Safe & Clean Energy• Making Productive Use of Idle Land to Produce Clean
Energy & Contribute to Local Communities• First REAFF-Approved Power Plant in Kanto Region• Reduction of Energy Consumption & Net Zero Initiatives• Third-Party Assessment of GHG Emissions• Disaster Response• Rapid Disaster Response Leveraging IT• Protecting the Environment via IT
– Ichigo ESG – Social• Supporting Human Rights, Children with Illnesses, & People
with Disabilities• Supporting Students• Supply Chain• Value Chain• Respect for Human Rights• Mental Health Care & Harassment Prevention Guidelines• Ichigo HR Policy• Employment Options Catering to Different Lifestyles• Health Initiatives• Safety Initiatives• Ichigo University for Employee Education• Promoting Internal Start-Ups
– Ichigo ESG – Governance• Global Best Practice Governance Structure• Compliance & Whistleblower System• Integrity, Honesty, & Fairness• Risk Management
– Appendix – Reference Data
45678910
11
12
13
1415
1617
18
192021
22
23
242526
27
28
29
30
31
323334
3536
Table of Contents
© Ichigo Inc. All rights reserved.
Increase energy efficiency
Improve aesthetics and comfortSeismic reinforcementsRegulatory compliance
35
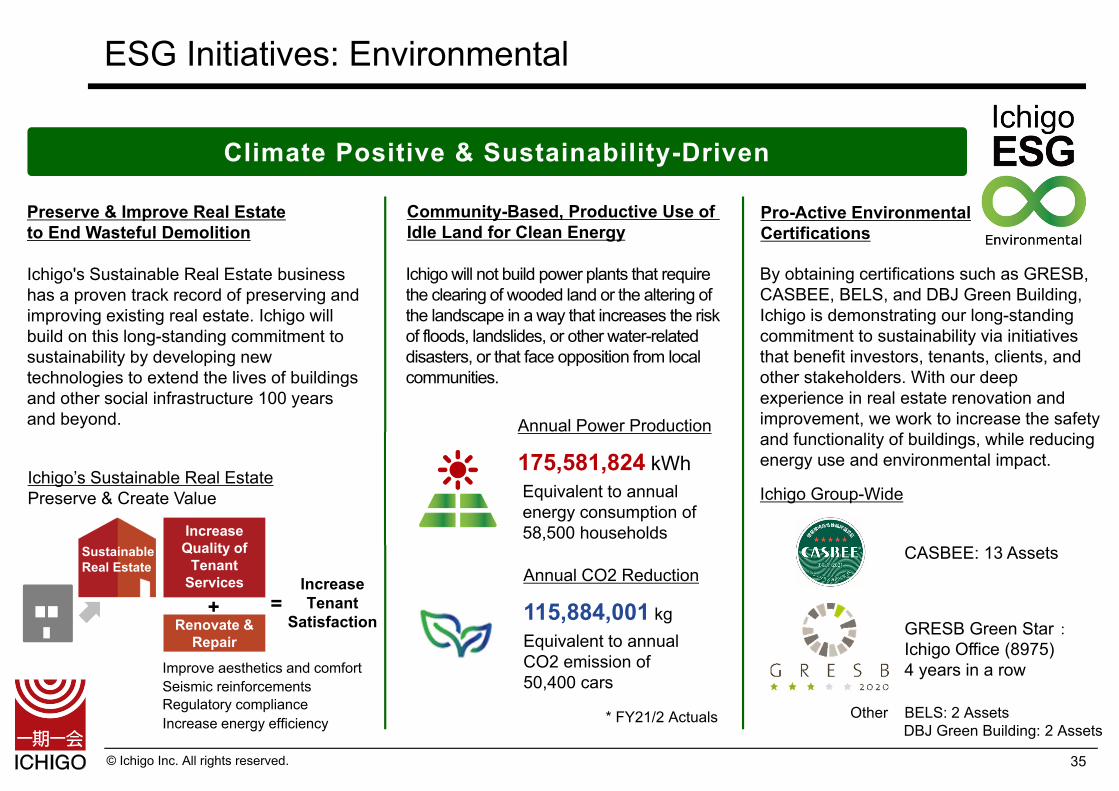
Climate Positive & Sustainability-Driven
Preserve & Improve Real Estateto End Wasteful Demolition
Community-Based, Productive Use of Idle Land for Clean Energy
Ichigo will not build power plants that require the clearing of wooded land or the altering of the landscape in a way that increases the risk of floods, landslides, or other water-related disasters, or that face opposition from local communities.
Pro-Active EnvironmentalCertifications
Annual Power Production
175,581,824 kWhEquivalent to annual energy consumption of 58,500 households
Annual CO2 Reduction
115,884,001 kgEquivalent to annualCO2 emission of 50,400 cars
Ichigo’s Sustainable Real EstatePreserve & Create Value
* FY21/2 Actuals
CASBEE: 13 Assets
By obtaining certifications such as GRESB, CASBEE, BELS, and DBJ Green Building, Ichigo is demonstrating our long-standing commitment to sustainability via initiatives that benefit investors, tenants, clients, and other stakeholders. With our deep experience in real estate renovation and improvement, we work to increase the safety and functionality of buildings, while reducing energy use and environmental impact.
Ichigo's Sustainable Real Estate business has a proven track record of preserving and improving existing real estate. Ichigo will build on this long-standing commitment to sustainability by developing new technologies to extend the lives of buildings and other social infrastructure 100 years and beyond.
IncreaseTenant
SatisfactionRenovate &Repair
Increase Quality of
Tenant Services
+ =GRESB Green Star :Ichigo Office (8975)4 years in a row
Ichigo Group-Wide
Other BELS: 2 AssetsDBJ Green Building: 2 Assets
SustainableReal Estate
ESG Initiatives: Environmental
© Ichigo Inc. All rights reserved. 36
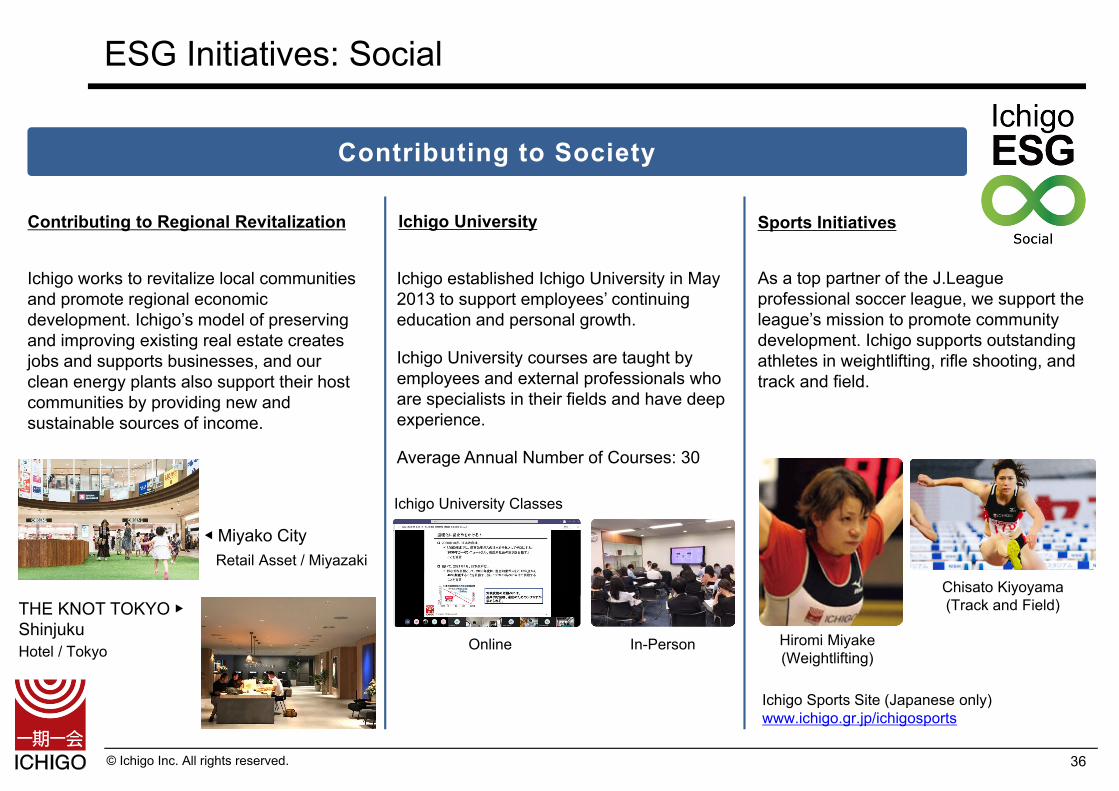
Contributing to Society
Contributing to Regional Revitalization Ichigo University Sports Initiatives
As a top partner of the J.League professional soccer league, we support the league’s mission to promote community development. Ichigo supports outstanding athletes in weightlifting, rifle shooting, and track and field.
Online In-Person
Ichigo University Classes
Hiromi Miyake(Weightlifting)
Chisato Kiyoyama(Track and Field)
Ichigo Sports Site (Japanese only)www.ichigo.gr.jp/ichigosports
Ichigo works to revitalize local communities and promote regional economic development. Ichigo’s model of preserving and improving existing real estate creates jobs and supports businesses, and our clean energy plants also support their host communities by providing new and sustainable sources of income.
◀ Miyako CityRetail Asset / Miyazaki
THE KNOT TOKYO ▶ShinjukuHotel / Tokyo
Ichigo established Ichigo University in May 2013 to support employees’ continuing education and personal growth.
Ichigo University courses are taught by employees and external professionals who are specialists in their fields and have deep experience.
Average Annual Number of Courses: 30
ESG Initiatives: Social
© Ichigo Inc. All rights reserved. 37
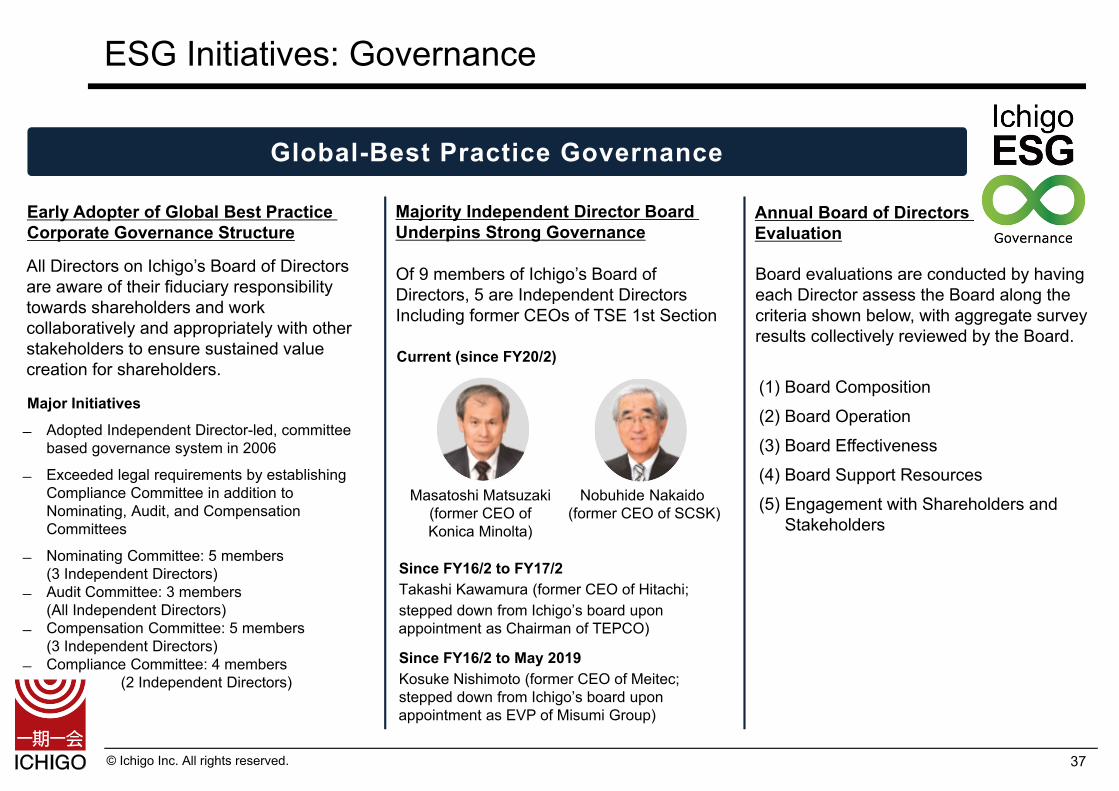
Global-Best Practice Governance
Early Adopter of Global Best Practice Corporate Governance Structure
Majority Independent Director Board Underpins Strong Governance
Of 9 members of Ichigo’s Board of Directors, 5 are Independent DirectorsIncluding former CEOs of TSE 1st Section
Annual Board of Directors Evaluation
Board evaluations are conducted by having each Director assess the Board along the criteria shown below, with aggregate survey results collectively reviewed by the Board.
All Directors on Ichigo’s Board of Directors are aware of their fiduciary responsibility towards shareholders and work collaboratively and appropriately with other stakeholders to ensure sustained value creation for shareholders.
Current (since FY20/2)
Nobuhide Nakaido(former CEO of SCSK)
Masatoshi Matsuzaki (former CEO of Konica Minolta)
Since FY16/2 to FY17/2Takashi Kawamura (former CEO of Hitachi;stepped down from Ichigo’s board upon appointment as Chairman of TEPCO)
Since FY16/2 to May 2019Kosuke Nishimoto (former CEO of Meitec;stepped down from Ichigo’s board upon appointment as EVP of Misumi Group)
Major Initiatives Adopted Independent Director-led, committee
based governance system in 2006
Exceeded legal requirements by establishing Compliance Committee in addition to Nominating, Audit, and Compensation Committees
Nominating Committee: 5 members (3 Independent Directors)
Audit Committee: 3 members (All Independent Directors)
Compensation Committee: 5 members (3 Independent Directors)
Compliance Committee: 4 members(2 Independent Directors)
(1) Board Composition (2) Board Operation (3) Board Effectiveness (4) Board Support Resources (5) Engagement with Shareholders and
Stakeholders
ESG Initiatives: Governance
© Ichigo Inc. All rights reserved.
Appendix: Financial & Real Estate Data
38
© Ichigo Inc. All rights reserved.
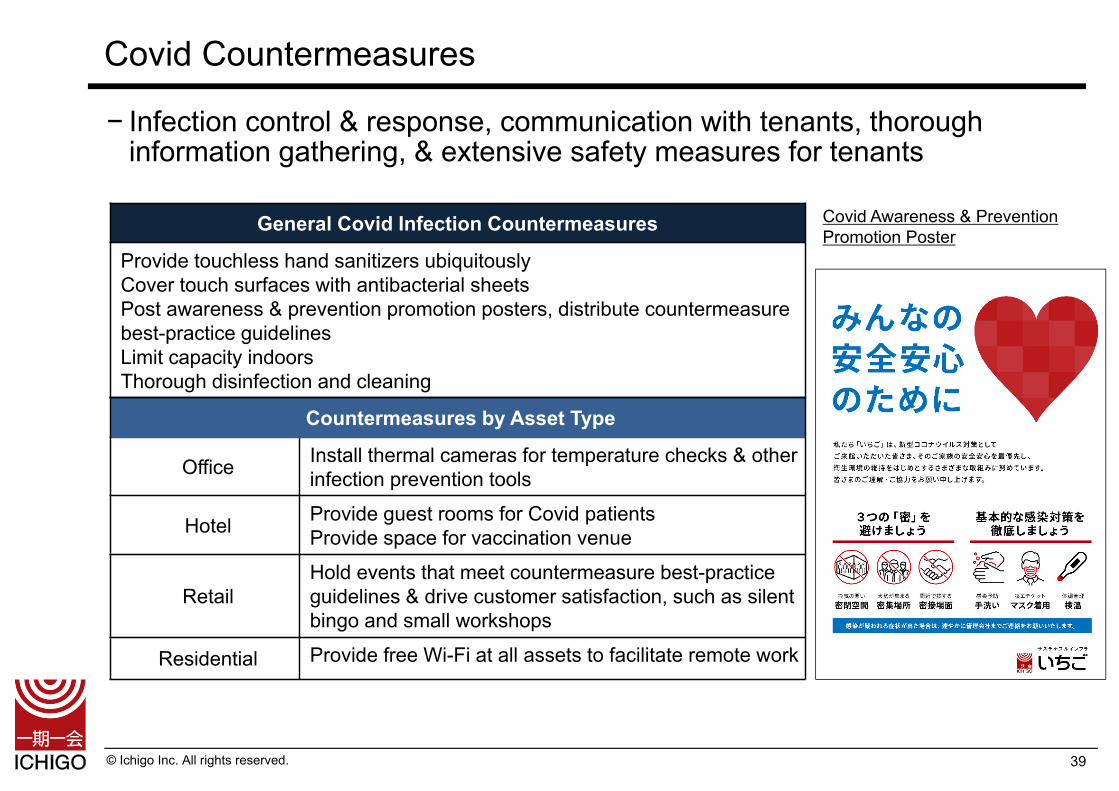
Covid Countermeasures
39
Covid Awareness & Prevention Promotion Poster
− Infection control & response, communication with tenants, thorough information gathering, & extensive safety measures for tenants
Countermeasures by Asset Type
Office Install thermal cameras for temperature checks & other infection prevention tools
Hotel Provide guest rooms for Covid patientsProvide space for vaccination venue
RetailHold events that meet countermeasure best-practice guidelines & drive customer satisfaction, such as silent bingo and small workshops
Residential Provide free Wi-Fi at all assets to facilitate remote work
General Covid Infection Countermeasures
Provide touchless hand sanitizers ubiquitouslyCover touch surfaces with antibacterial sheetsPost awareness & prevention promotion posters, distribute countermeasure best-practice guidelinesLimit capacity indoorsThorough disinfection and cleaning
© Ichigo Inc. All rights reserved.
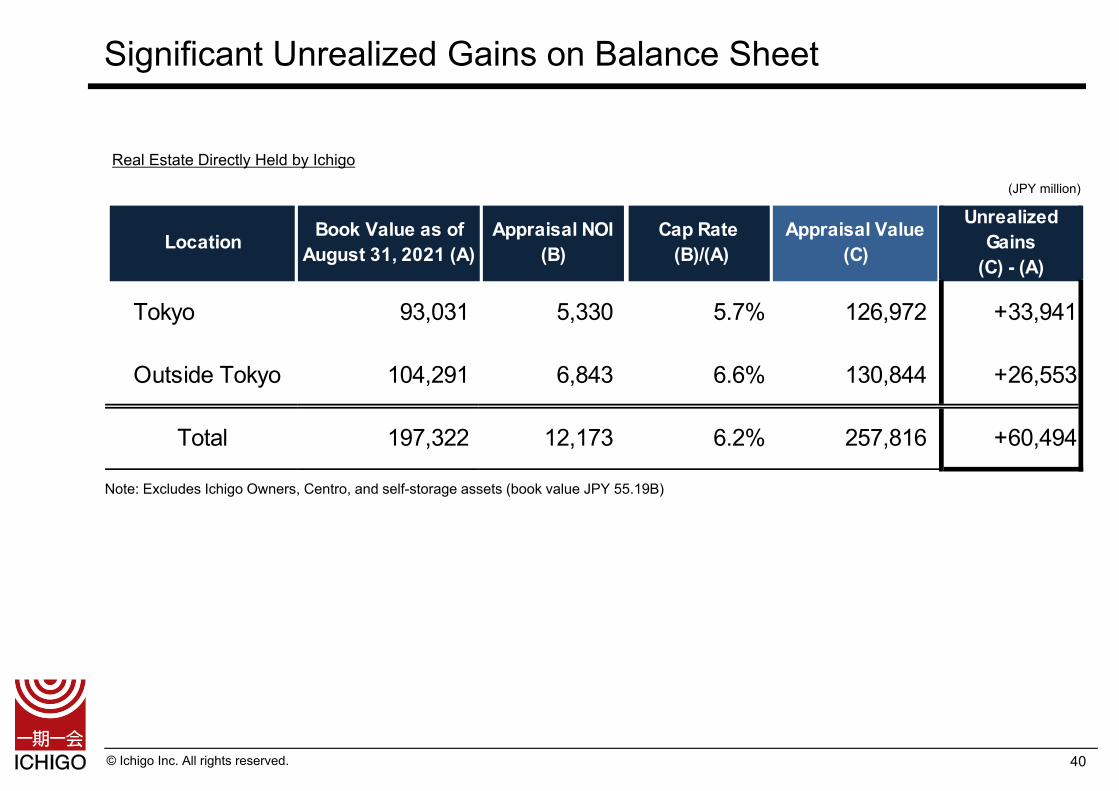
Significant Unrealized Gains on Balance Sheet
Real Estate Directly Held by Ichigo
(JPY million)
Note: Excludes Ichigo Owners, Centro, and self-storage assets (book value JPY 55.19B)
40
Tokyo 93,031 5,330 5.7% 126,972 +33,941
Outside Tokyo 104,291 6,843 6.6% 130,844 +26,553
Total 197,322 12,173 6.2% 257,816 +60,494
Location Book Value as ofAugust 31, 2021 (A)
Appraisal NOI(B)
Appraisal Value(C)
UnrealizedGains
(C) - (A)
Cap Rate (B)/(A)
© Ichigo Inc. All rights reserved.
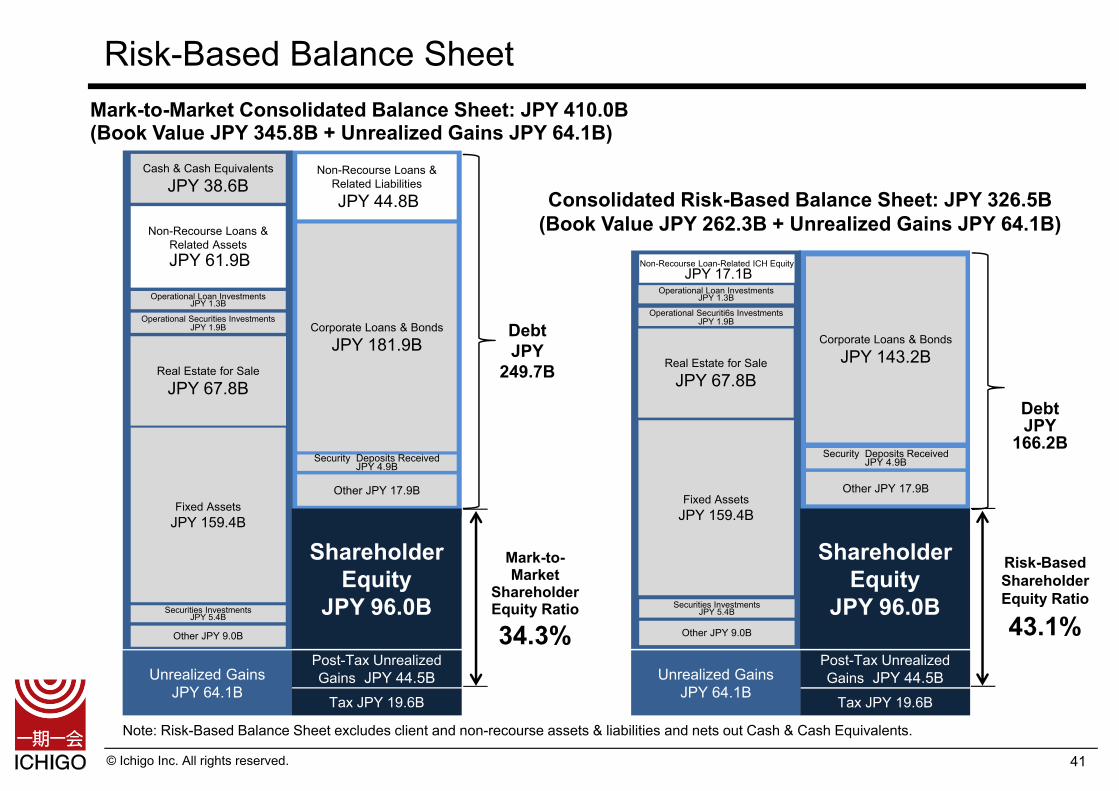
Unrealized GainsJPY 64.1B
41
Note: Risk-Based Balance Sheet excludes client and non-recourse assets & liabilities and nets out Cash & Cash Equivalents.
Debt JPY
166.2B
DebtJPY
249.7B
Risk-BasedShareholder Equity Ratio
43.1%
Consolidated Risk-Based Balance Sheet: JPY 326.5B(Book Value JPY 262.3B + Unrealized Gains JPY 64.1B)
Mark-to-Market
ShareholderEquity Ratio
34.3%
Non-Recourse Loan-Related ICH EquityJPY 17.1B
Mark-to-Market Consolidated Balance Sheet: JPY 410.0B(Book Value JPY 345.8B + Unrealized Gains JPY 64.1B)
ShareholderEquity
JPY 96.0B
Post-Tax Unrealized Gains JPY 44.5B
Non-Recourse Loans & Related AssetsJPY 61.9B
Operational Securities Investments JPY 1.9B
Fixed AssetsJPY 159.4B
Securities InvestmentsJPY 5.4B
Other JPY 9.0B
Non-Recourse Loans & Related LiabilitiesJPY 44.8B
Cash & Cash EquivalentsJPY 38.6B
Corporate Loans & BondsJPY 181.9B
Security Deposits Received JPY 4.9B
Other JPY 17.9B
ShareholderEquity
JPY 96.0B
Corporate Loans & BondsJPY 143.2B
Risk-Based Balance Sheet
Operational Loan Investments JPY 1.3B
Tax JPY 19.6B
Unrealized GainsJPY 64.1B
Post-Tax Unrealized Gains JPY 44.5B
Tax JPY 19.6B
Security Deposits Received JPY 4.9B
Other JPY 17.9B
Securities InvestmentsJPY 5.4B
Other JPY 9.0B
Real Estate for SaleJPY 67.8B
Operational Securiti6s Investments JPY 1.9B
Fixed AssetsJPY 159.4B
Operational Loan Investments JPY 1.3B
Real Estate for SaleJPY 67.8B
© Ichigo Inc. All rights reserved. 42
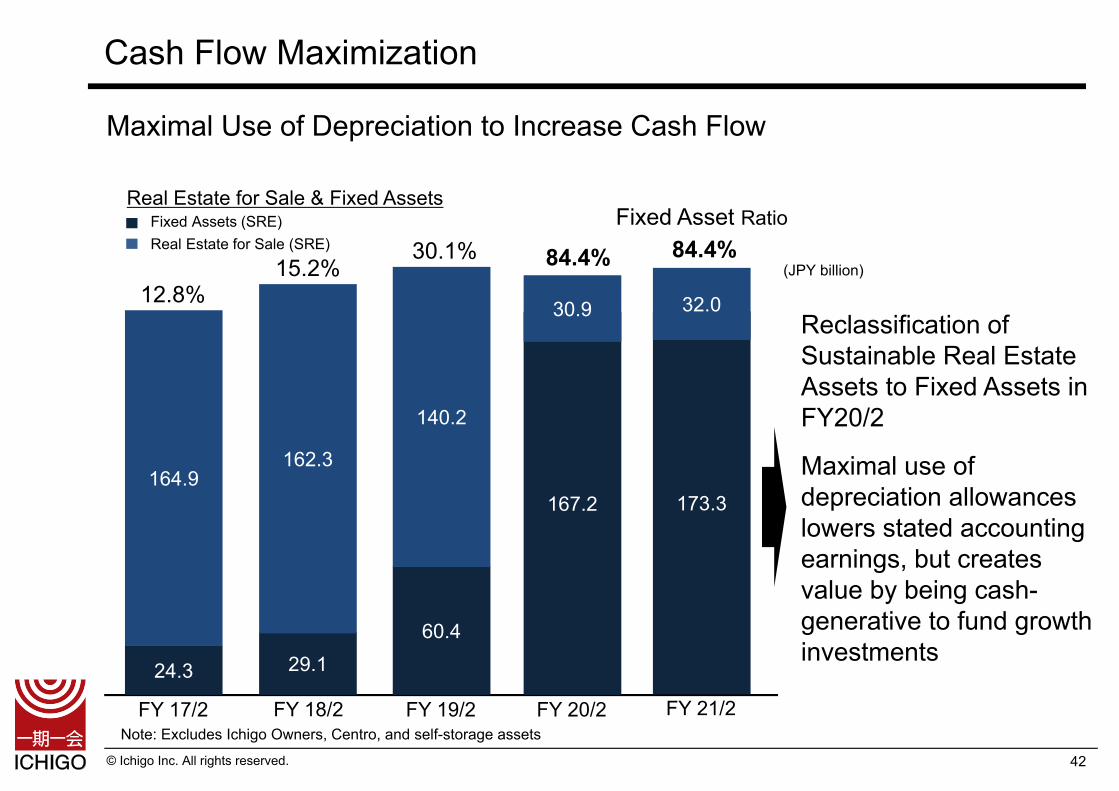
Cash Flow Maximization
Maximal Use of Depreciation to Increase Cash Flow
Real Estate for Sale & Fixed Assets
29.1
162.3
60.4
140.2
FY 18/2 FY 19/2
164.9
24.3
Fixed Assets (SRE)Real Estate for Sale (SRE)
FY 17/2
12.8%15.2%
30.1%(JPY billion)
167.2
30.9
FY 20/2
84.4%Fixed Asset Ratio
Reclassification of Sustainable Real Estate Assets to Fixed Assets in FY20/2
Maximal use of depreciation allowances lowers stated accounting earnings, but creates value by being cash-generative to fund growth investments
Note: Excludes Ichigo Owners, Centro, and self-storage assets
173.3
32.0
FY 21/2
84.4%
© Ichigo Inc. All rights reserved. 43
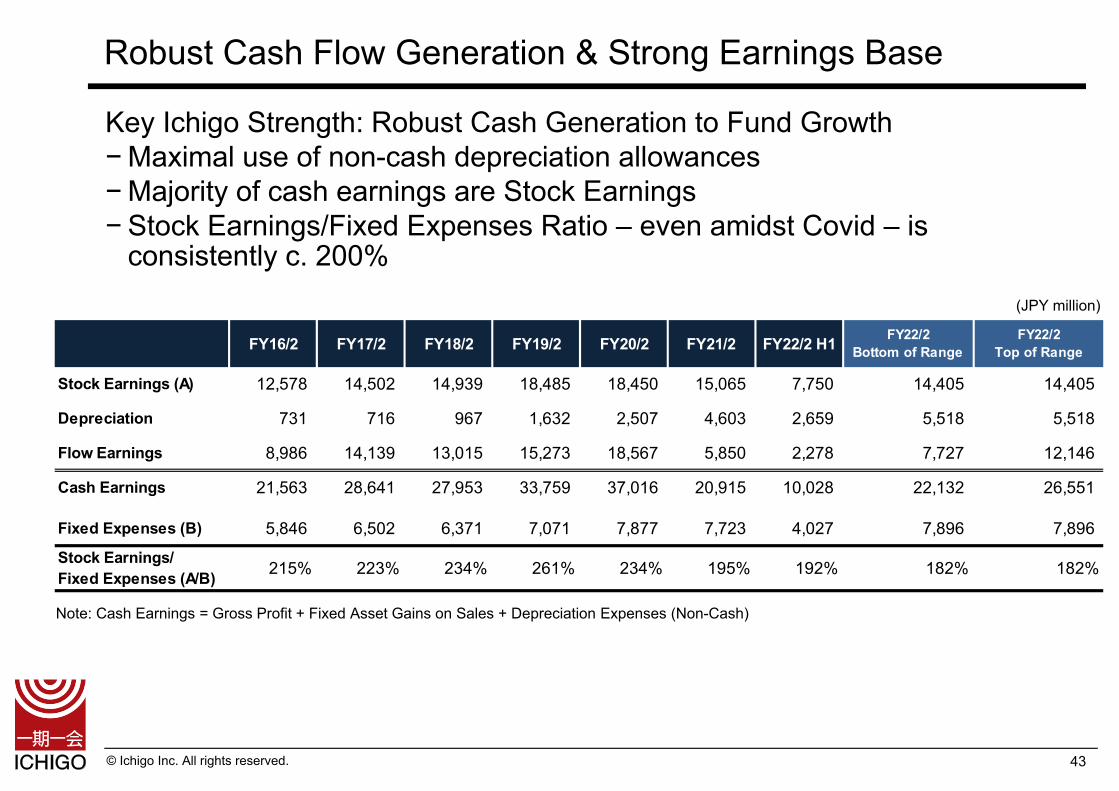
Robust Cash Flow Generation & Strong Earnings Base
Note: Cash Earnings = Gross Profit + Fixed Asset Gains on Sales + Depreciation Expenses (Non-Cash)
Key Ichigo Strength: Robust Cash Generation to Fund Growth−Maximal use of non-cash depreciation allowances−Majority of cash earnings are Stock Earnings−Stock Earnings/Fixed Expenses Ratio – even amidst Covid – is
consistently c. 200% (JPY million)
FY16/2 FY17/2 FY18/2 FY19/2 FY20/2 FY21/2 FY22/2 H1 FY22/2Bottom of Range
FY22/2Top of Range
Stock Earnings (A) 12,578 14,502 14,939 18,485 18,450 15,065 7,750 14,405 14,405
Depreciation 731 716 967 1,632 2,507 4,603 2,659 5,518 5,518
Flow Earnings 8,986 14,139 13,015 15,273 18,567 5,850 2,278 7,727 12,146
Cash Earnings 21,563 28,641 27,953 33,759 37,016 20,915 10,028 22,132 26,551
Fixed Expenses (B) 5,846 6,502 6,371 7,071 7,877 7,723 4,027 7,896 7,896
Stock Earnings/Fixed Expenses (A/B) 215% 223% 234% 261% 234% 195% 192% 182% 182%
© Ichigo Inc. All rights reserved.
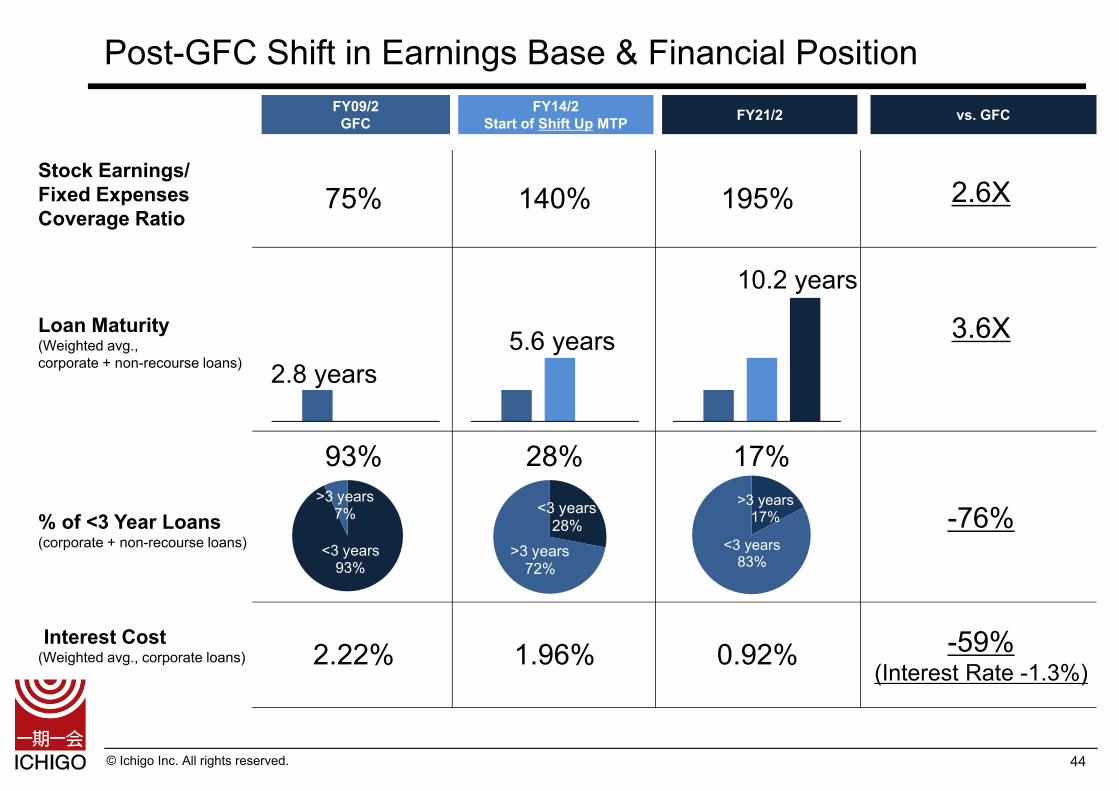
Post-GFC Shift in Earnings Base & Financial PositionFY09/2GFC
FY14/2Start of Shift Up MTP FY21/2 vs. GFC
44
2.8 years5.6 years
10.2 years
75%
-59%(Interest Rate -1.3%)
140% 195%
93% 28% 17%
2.22% 1.96% 0.92%
Stock Earnings/Fixed ExpensesCoverage Ratio
Loan Maturity(Weighted avg., corporate + non-recourse loans)
% of <3 Year Loans(corporate + non-recourse loans)
Interest Cost(Weighted avg., corporate loans)
3.6X
-76%
2.6X
<3 years28%
>3 years72%
<3 years93%
>3 years7%
>3 years17%
<3 years83%
© Ichigo Inc. All rights reserved.
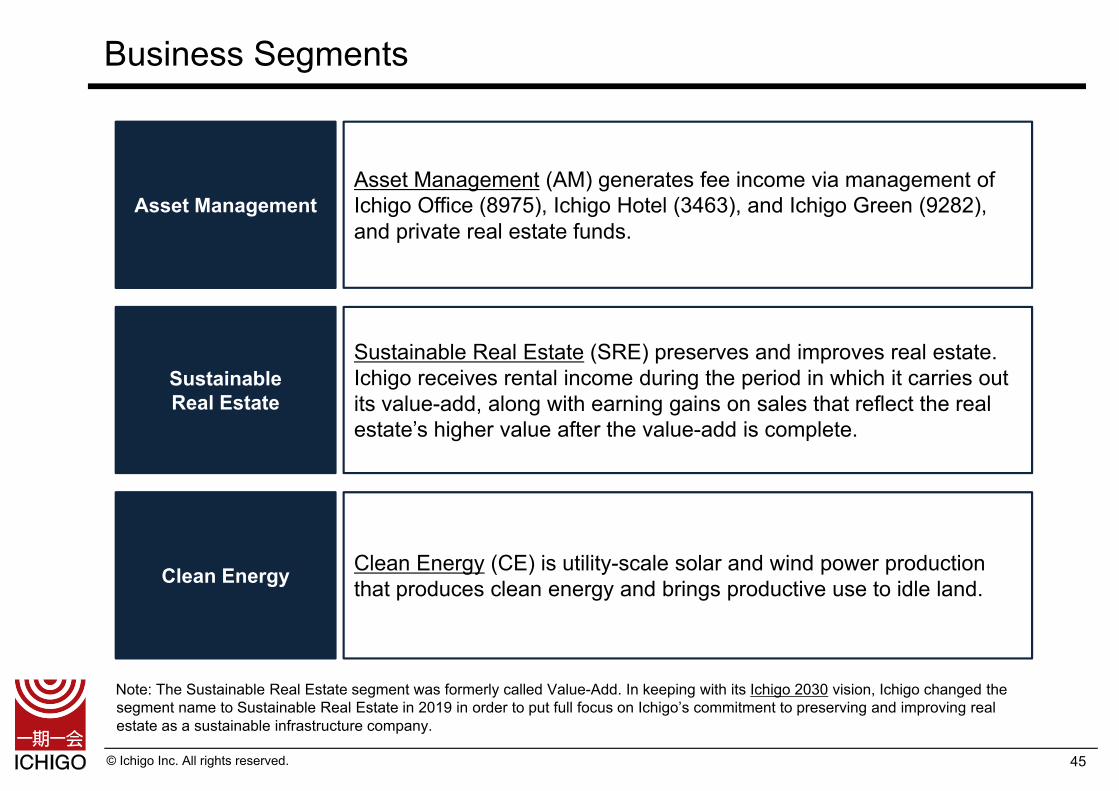
Business Segments
Asset ManagementAsset Management (AM) generates fee income via management of Ichigo Office (8975), Ichigo Hotel (3463), and Ichigo Green (9282),and private real estate funds.
Sustainable Real Estate
Sustainable Real Estate (SRE) preserves and improves real estate. Ichigo receives rental income during the period in which it carries out its value-add, along with earning gains on sales that reflect the real estate’s higher value after the value-add is complete.
Clean Energy Clean Energy (CE) is utility-scale solar and wind power production that produces clean energy and brings productive use to idle land.
Note: The Sustainable Real Estate segment was formerly called Value-Add. In keeping with its Ichigo 2030 vision, Ichigo changed the segment name to Sustainable Real Estate in 2019 in order to put full focus on Ichigo’s commitment to preserving and improving real estate as a sustainable infrastructure company.
45
© Ichigo Inc. All rights reserved.
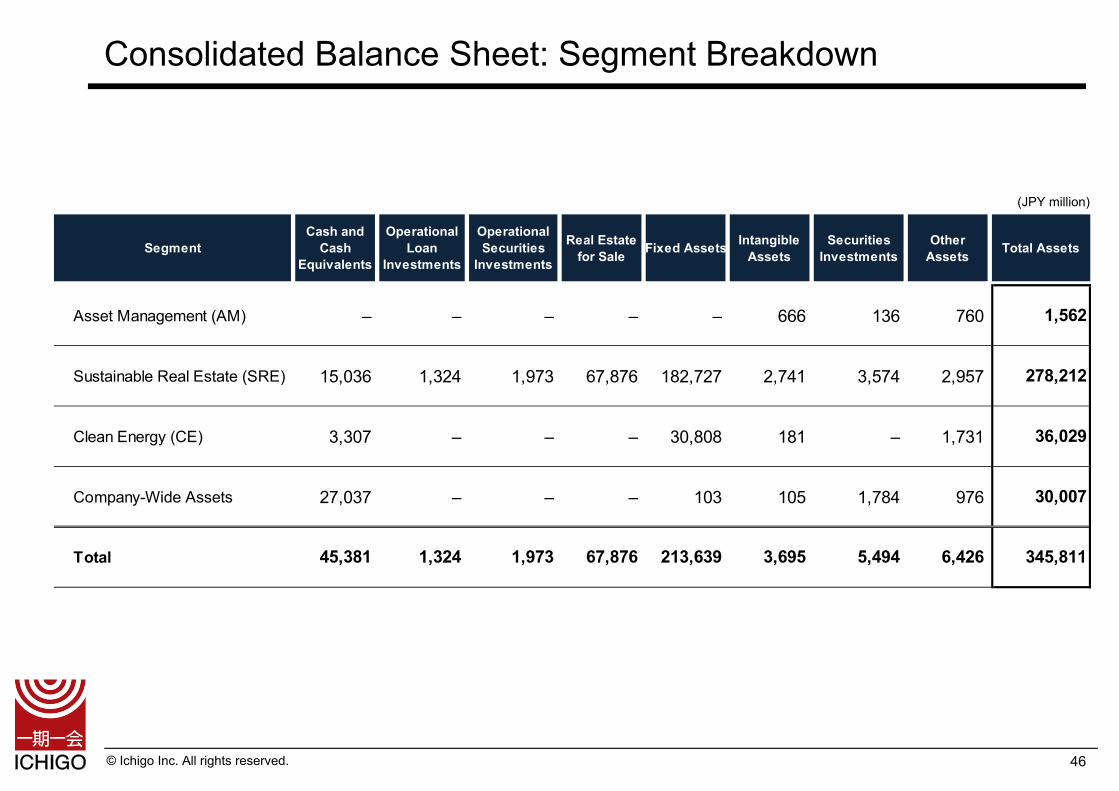
Cash andCash
Equivalents
OperationalLoan
Investments
OperationalSecurities
Investments
Real Estatefor Sale Fixed Assets Intangible
AssetsSecurities
InvestmentsOther
Assets Total Assets
Asset Management (AM) – – – – – 666 136 760 1,562
Sustainable Real Estate (SRE) 15,036 1,324 1,973 67,876 182,727 2,741 3,574 2,957 278,212
Clean Energy (CE) 3,307 – – – 30,808 181 – 1,731 36,029
Company-Wide Assets 27,037 – – – 103 105 1,784 976 30,007
Total 45,381 1,324 1,973 67,876 213,639 3,695 5,494 6,426 345,811
Segment
46
Consolidated Balance Sheet: Segment Breakdown
(JPY million)
© Ichigo Inc. All rights reserved.
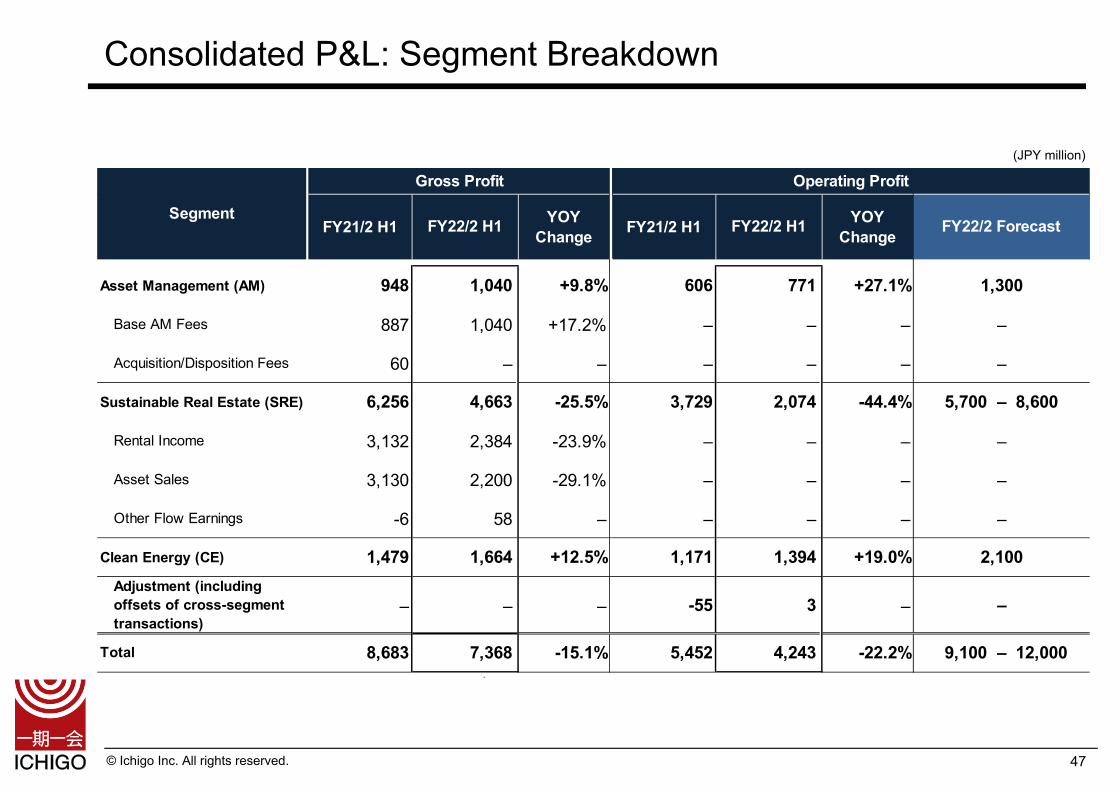
FY21/2 H1 YOYChange FY21/2 H1 YOY
Change
Asset Management (AM) 948 1,040 +9.8% 606 771 +27.1%
Base AM Fees 887 1,040 +17.2% – – – –
Acquisition/Disposition Fees 60 – – – – – –
Sustainable Real Estate (SRE) 6,256 4,663 -25.5% 3,729 2,074 -44.4% 5,700 – 8,600
Rental Income 3,132 2,384 -23.9% – – – –
Asset Sales 3,130 2,200 -29.1% – – – –
Other Flow Earnings -6 58 – – – – –
Clean Energy (CE) 1,479 1,664 +12.5% 1,171 1,394 +19.0%Adjustment (includingoffsets of cross-segmenttransactions)
– – – -55 3 – –
8,683 7,368 -15.1% 5,452 4,243 -22.2% 9,100 – 12,000Total
Segment
Gross Profit
FY22/2 H1 FY22/2 H1
Operating Profit
FY22/2 Forecast
2,100
1,300
47
Consolidated P&L: Segment Breakdown
(JPY million)
© Ichigo Inc. All rights reserved. 48
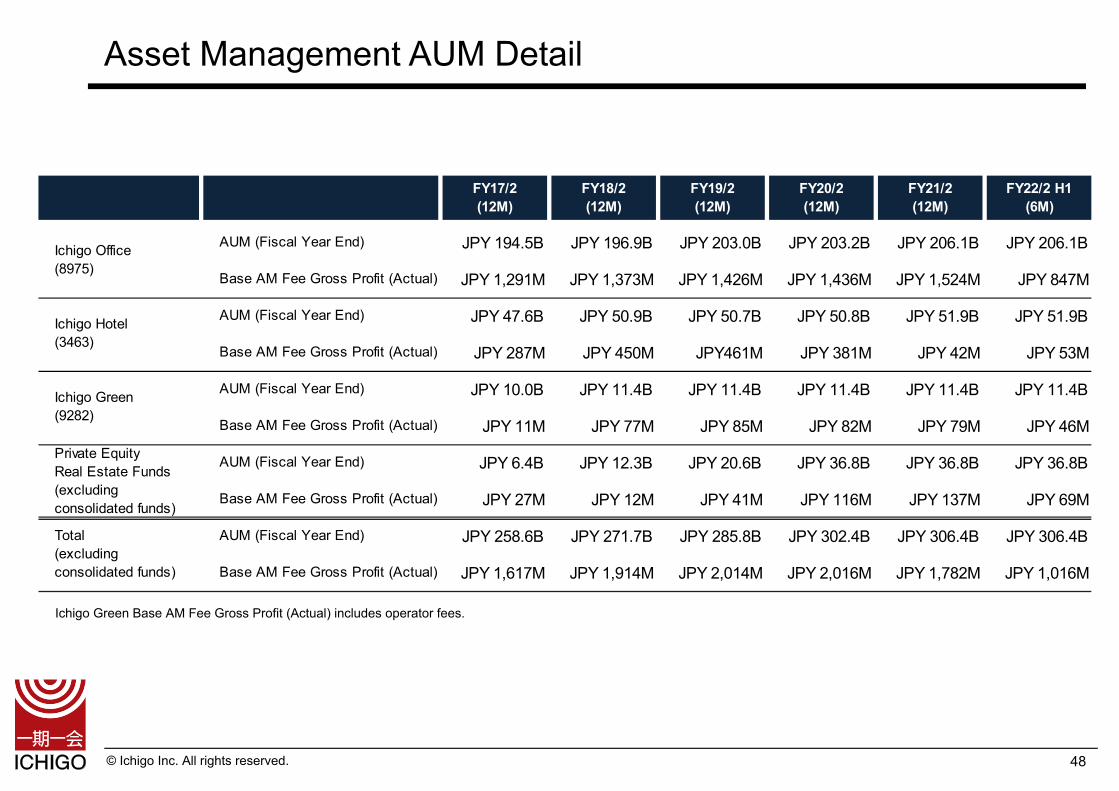
Asset Management AUM Detail
Ichigo Green Base AM Fee Gross Profit (Actual) includes operator fees.
FY17/2(12M)
FY18/2(12M)
FY19/2(12M)
FY20/2(12M)
FY21/2(12M)
FY22/2 H1(6M)
AUM (Fiscal Year End) JPY 194.5B JPY 196.9B JPY 203.0B JPY 203.2B JPY 206.1B JPY 206.1B
Base AM Fee Gross Profit (Actual) JPY 1,291M JPY 1,373M JPY 1,426M JPY 1,436M JPY 1,524M JPY 847M
AUM (Fiscal Year End) JPY 47.6B JPY 50.9B JPY 50.7B JPY 50.8B JPY 51.9B JPY 51.9B
Base AM Fee Gross Profit (Actual) JPY 287M JPY 450M JPY461M JPY 381M JPY 42M JPY 53M
AUM (Fiscal Year End) JPY 10.0B JPY 11.4B JPY 11.4B JPY 11.4B JPY 11.4B JPY 11.4B
Base AM Fee Gross Profit (Actual) JPY 11M JPY 77M JPY 85M JPY 82M JPY 79M JPY 46MPrivate EquityReal Estate Funds
AUM (Fiscal Year End) JPY 6.4B JPY 12.3B JPY 20.6B JPY 36.8B JPY 36.8B JPY 36.8B(excludingconsolidated funds)
Base AM Fee Gross Profit (Actual) JPY 27M JPY 12M JPY 41M JPY 116M JPY 137M JPY 69M
AUM (Fiscal Year End) JPY 258.6B JPY 271.7B JPY 285.8B JPY 302.4B JPY 306.4B JPY 306.4B
Base AM Fee Gross Profit (Actual) JPY 1,617M JPY 1,914M JPY 2,014M JPY 2,016M JPY 1,782M JPY 1,016M
Ichigo Office(8975)
Total(excludingconsolidated funds)
Ichigo Green(9282)
Ichigo Hotel(3463)
© Ichigo Inc. All rights reserved.
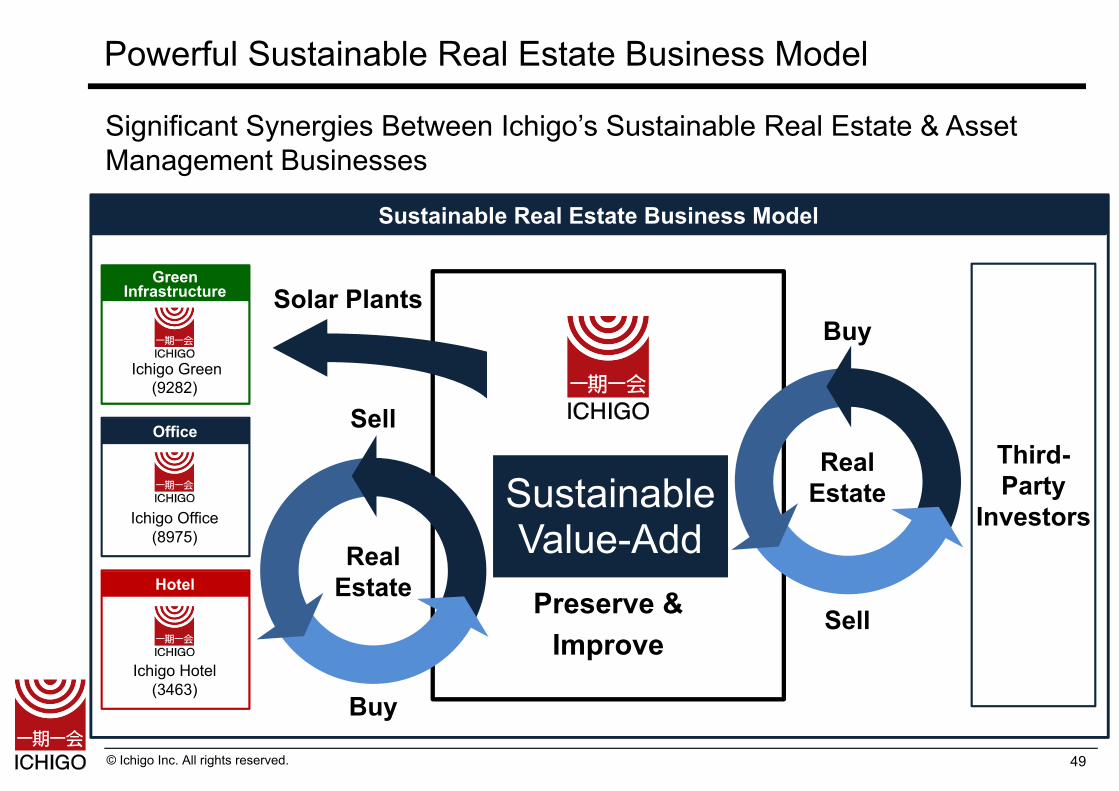
Significant Synergies Between Ichigo’s Sustainable Real Estate & Asset Management Businesses
Powerful Sustainable Real Estate Business Model
Third-Party
Investors
Sustainable Real Estate Business Model
Green Infrastructure
Ichigo Green(9282)
Solar Plants
Buy
SellOffice
Ichigo Office (8975)
Hotel
Ichigo Hotel (3463)
SustainableValue-Add
不動産
Sell
Buy
Real Estate
Real Estate
Preserve &Improve
49
© Ichigo Inc. All rights reserved.
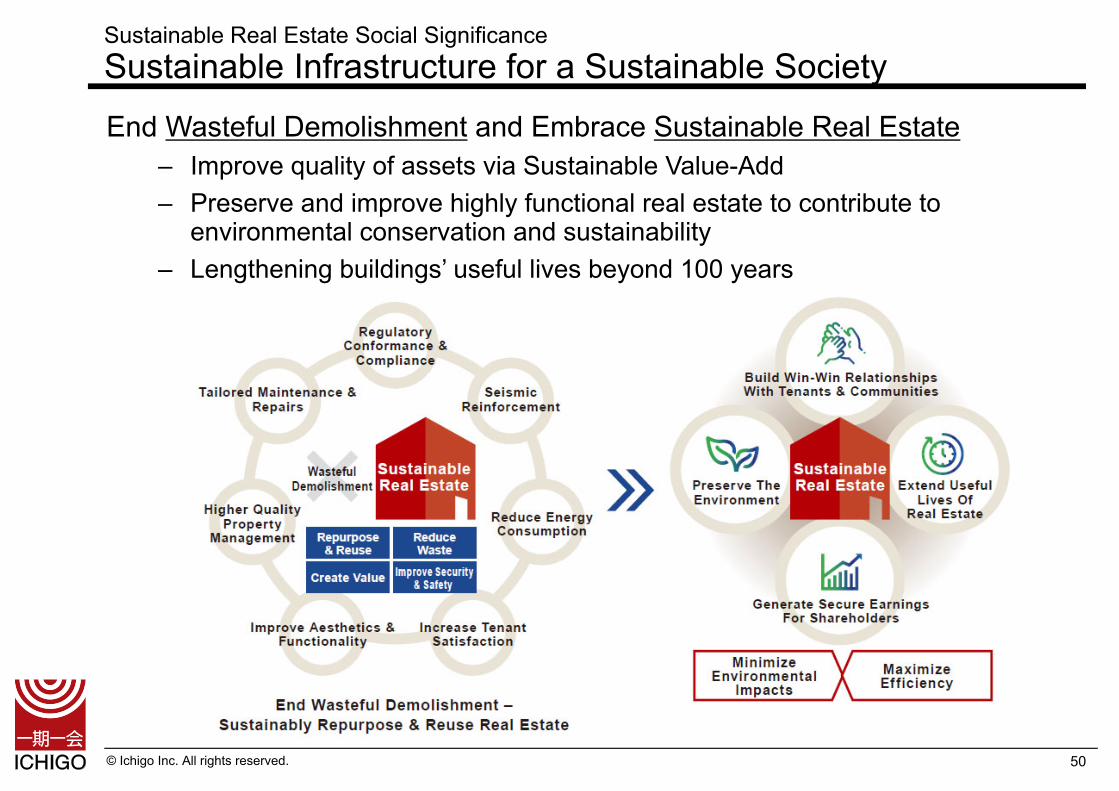
End Wasteful Demolishment and Embrace Sustainable Real Estate‒ Improve quality of assets via Sustainable Value-Add‒ Preserve and improve highly functional real estate to contribute to
environmental conservation and sustainability‒ Lengthening buildings’ useful lives beyond 100 years
Sustainable Real Estate Social SignificanceSustainable Infrastructure for a Sustainable Society
50
© Ichigo Inc. All rights reserved.
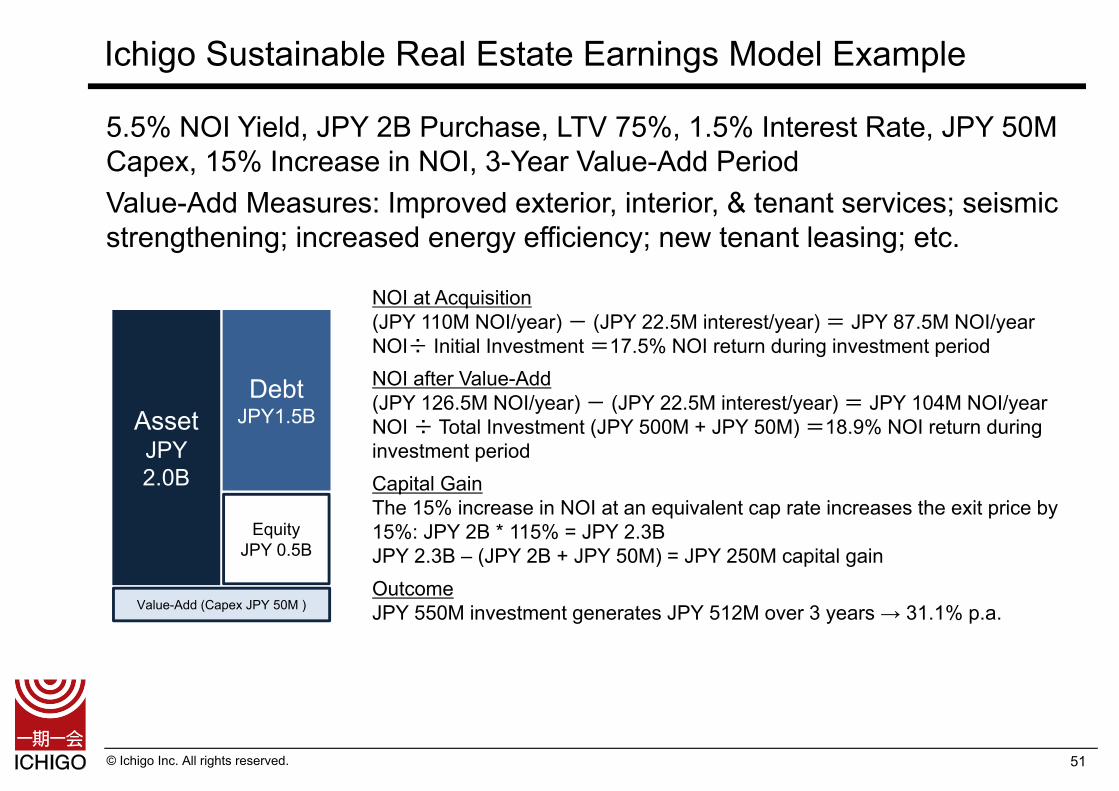
5.5% NOI Yield, JPY 2B Purchase, LTV 75%, 1.5% Interest Rate, JPY 50M Capex, 15% Increase in NOI, 3-Year Value-Add PeriodValue-Add Measures: Improved exterior, interior, & tenant services; seismic strengthening; increased energy efficiency; new tenant leasing; etc.
Ichigo Sustainable Real Estate Earnings Model Example
AssetJPY 2.0B
DebtJPY1.5B
Equity JPY 0.5B
NOI at Acquisition(JPY 110M NOI/year) - (JPY 22.5M interest/year) = JPY 87.5M NOI/yearNOI÷ Initial Investment =17.5% NOI return during investment period.
NOI after Value-Add(JPY 126.5M NOI/year) - (JPY 22.5M interest/year) = JPY 104M NOI/yearNOI ÷ Total Investment (JPY 500M + JPY 50M) =18.9% NOI return during investment period.
Capital GainThe 15% increase in NOI at an equivalent cap rate increases the exit price by 15%: JPY 2B * 115% = JPY 2.3BJPY 2.3B – (JPY 2B + JPY 50M) = JPY 250M capital gain.
OutcomeJPY 550M investment generates JPY 512M over 3 years → 31.1% p.a.Value-Add (Capex JPY 50M )
51
© Ichigo Inc. All rights reserved.
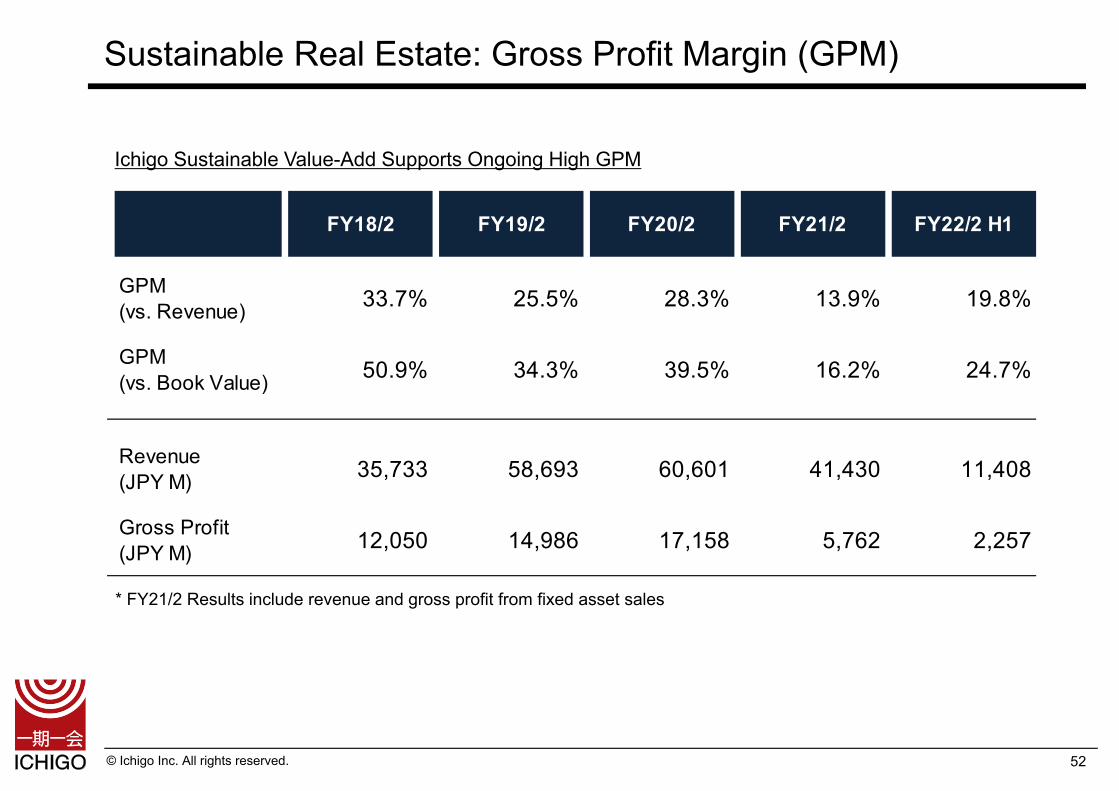
Sustainable Real Estate: Gross Profit Margin (GPM)
Ichigo Sustainable Value-Add Supports Ongoing High GPM
* FY21/2 Results include revenue and gross profit from fixed asset sales
52
FY18/2 FY19/2 FY20/2 FY21/2 FY22/2 H1
GPM(vs. Revenue) 33.7% 25.5% 28.3% 13.9% 19.8%
GPM(vs. Book Value) 50.9% 34.3% 39.5% 16.2% 24.7%
Revenue(JPY M) 35,733 58,693 60,601 41,430 11,408
Gross Profit(JPY M) 12,050 14,986 17,158 5,762 2,257
© Ichigo Inc. All rights reserved.
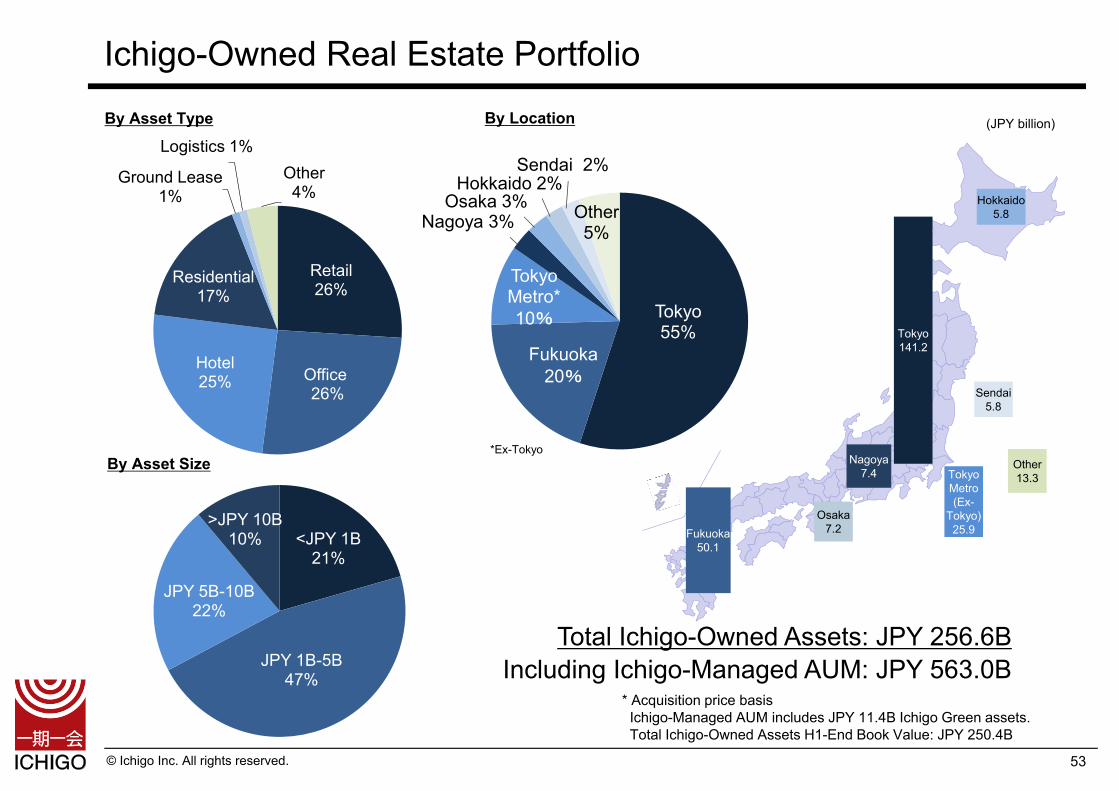
Tokyo55%
TokyoMetro* 10%
Fukuoka20%
Nagoya 3%Osaka 3%
Hokkaido 2%Sendai 2%
Other 5%
Ichigo-Owned Real Estate Portfolio
(JPY billion)
Total Ichigo-Owned Assets: JPY 256.6B Including Ichigo-Managed AUM: JPY 563.0B
By Asset Type By Location
* Acquisition price basisIchigo-Managed AUM includes JPY 11.4B Ichigo Green assets. Total Ichigo-Owned Assets H1-End Book Value: JPY 250.4B
Tokyo141.2
Osaka7.2
Sendai5.8
TokyoMetro(Ex-
Tokyo)25.9Fukuoka
50.1
Other13.3
Nagoya7.4
Hokkaido5.8
*Ex-TokyoBy Asset Size
53
Retail26%
Office26%
Hotel25%
Residential17%
Ground Lease1%
Logistics 1%Other4%
<JPY 1B21%
JPY 1B-5B47%
JPY 5B-10B22%
>JPY 10B10%
© Ichigo Inc. All rights reserved.
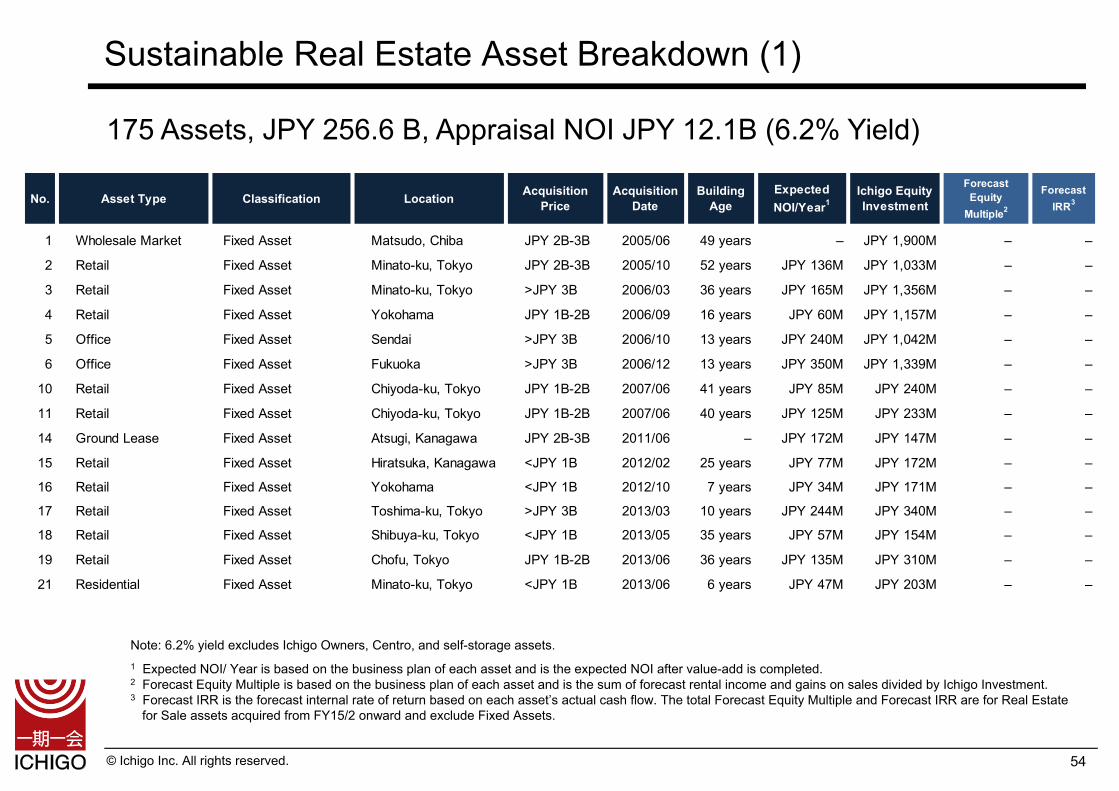
No. Asset Type Classification Location AcquisitionPrice
AcquisitionDate
BuildingAge
ExpectedNOI/Year1
Ichigo EquityInvestment
ForecastEquity
Multiple2
ForecastIRR3
1 Wholesale Market Fixed Asset Matsudo, Chiba JPY 2B-3B 2005/06 49 years – JPY 1,900M – –
2 Retail Fixed Asset Minato-ku, Tokyo JPY 2B-3B 2005/10 52 years JPY 136M JPY 1,033M – –
3 Retail Fixed Asset Minato-ku, Tokyo >JPY 3B 2006/03 36 years JPY 165M JPY 1,356M – –
4 Retail Fixed Asset Yokohama JPY 1B-2B 2006/09 16 years JPY 60M JPY 1,157M – –
5 Office Fixed Asset Sendai >JPY 3B 2006/10 13 years JPY 240M JPY 1,042M – –
6 Office Fixed Asset Fukuoka >JPY 3B 2006/12 13 years JPY 350M JPY 1,339M – –
10 Retail Fixed Asset Chiyoda-ku, Tokyo JPY 1B-2B 2007/06 41 years JPY 85M JPY 240M – –
11 Retail Fixed Asset Chiyoda-ku, Tokyo JPY 1B-2B 2007/06 40 years JPY 125M JPY 233M – –
14 Ground Lease Fixed Asset Atsugi, Kanagawa JPY 2B-3B 2011/06 – JPY 172M JPY 147M – –
15 Retail Fixed Asset Hiratsuka, Kanagawa <JPY 1B 2012/02 25 years JPY 77M JPY 172M – –
16 Retail Fixed Asset Yokohama <JPY 1B 2012/10 7 years JPY 34M JPY 171M – –
17 Retail Fixed Asset Toshima-ku, Tokyo >JPY 3B 2013/03 10 years JPY 244M JPY 340M – –
18 Retail Fixed Asset Shibuya-ku, Tokyo <JPY 1B 2013/05 35 years JPY 57M JPY 154M – –
19 Retail Fixed Asset Chofu, Tokyo JPY 1B-2B 2013/06 36 years JPY 135M JPY 310M – –
21 Residential Fixed Asset Minato-ku, Tokyo <JPY 1B 2013/06 6 years JPY 47M JPY 203M – –
Sustainable Real Estate Asset Breakdown (1)
1 Expected NOI/ Year is based on the business plan of each asset and is the expected NOI after value-add is completed.2 Forecast Equity Multiple is based on the business plan of each asset and is the sum of forecast rental income and gains on sales divided by Ichigo Investment. 3 Forecast IRR is the forecast internal rate of return based on each asset’s actual cash flow. The total Forecast Equity Multiple and Forecast IRR are for Real Estate
for Sale assets acquired from FY15/2 onward and exclude Fixed Assets.
175 Assets, JPY 256.6 B, Appraisal NOI JPY 12.1B (6.2% Yield)
Note: 6.2% yield excludes Ichigo Owners, Centro, and self-storage assets.
54
© Ichigo Inc. All rights reserved.
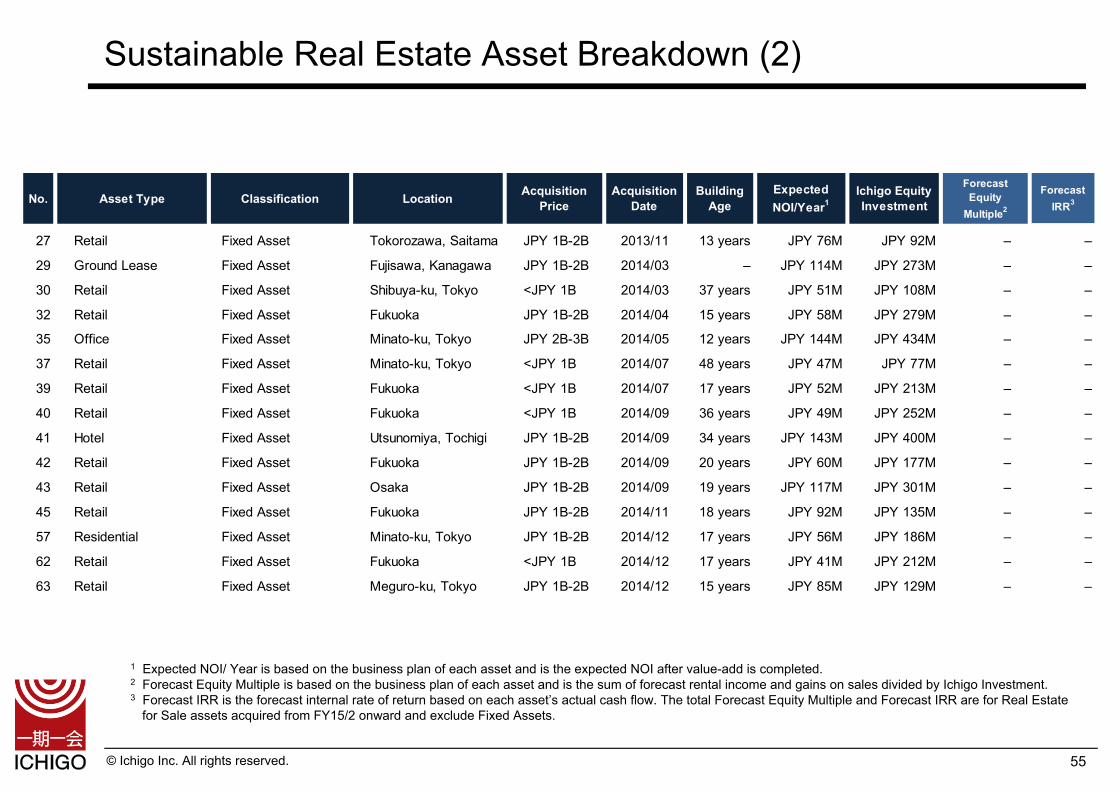
Sustainable Real Estate Asset Breakdown (2)
1 Expected NOI/ Year is based on the business plan of each asset and is the expected NOI after value-add is completed.2 Forecast Equity Multiple is based on the business plan of each asset and is the sum of forecast rental income and gains on sales divided by Ichigo Investment. 3 Forecast IRR is the forecast internal rate of return based on each asset’s actual cash flow. The total Forecast Equity Multiple and Forecast IRR are for Real Estate
for Sale assets acquired from FY15/2 onward and exclude Fixed Assets.
55
No. Asset Type Classification Location AcquisitionPrice
AcquisitionDate
BuildingAge
ExpectedNOI/Year1
Ichigo EquityInvestment
ForecastEquity
Multiple2
ForecastIRR3
27 Retail Fixed Asset Tokorozawa, Saitama JPY 1B-2B 2013/11 13 years JPY 76M JPY 92M – –
29 Ground Lease Fixed Asset Fujisawa, Kanagawa JPY 1B-2B 2014/03 – JPY 114M JPY 273M – –
30 Retail Fixed Asset Shibuya-ku, Tokyo <JPY 1B 2014/03 37 years JPY 51M JPY 108M – –
32 Retail Fixed Asset Fukuoka JPY 1B-2B 2014/04 15 years JPY 58M JPY 279M – –
35 Office Fixed Asset Minato-ku, Tokyo JPY 2B-3B 2014/05 12 years JPY 144M JPY 434M – –
37 Retail Fixed Asset Minato-ku, Tokyo <JPY 1B 2014/07 48 years JPY 47M JPY 77M – –
39 Retail Fixed Asset Fukuoka <JPY 1B 2014/07 17 years JPY 52M JPY 213M – –
40 Retail Fixed Asset Fukuoka <JPY 1B 2014/09 36 years JPY 49M JPY 252M – –
41 Hotel Fixed Asset Utsunomiya, Tochigi JPY 1B-2B 2014/09 34 years JPY 143M JPY 400M – –
42 Retail Fixed Asset Fukuoka JPY 1B-2B 2014/09 20 years JPY 60M JPY 177M – –
43 Retail Fixed Asset Osaka JPY 1B-2B 2014/09 19 years JPY 117M JPY 301M – –
45 Retail Fixed Asset Fukuoka JPY 1B-2B 2014/11 18 years JPY 92M JPY 135M – –
57 Residential Fixed Asset Minato-ku, Tokyo JPY 1B-2B 2014/12 17 years JPY 56M JPY 186M – –
62 Retail Fixed Asset Fukuoka <JPY 1B 2014/12 17 years JPY 41M JPY 212M – –
63 Retail Fixed Asset Meguro-ku, Tokyo JPY 1B-2B 2014/12 15 years JPY 85M JPY 129M – –
© Ichigo Inc. All rights reserved.
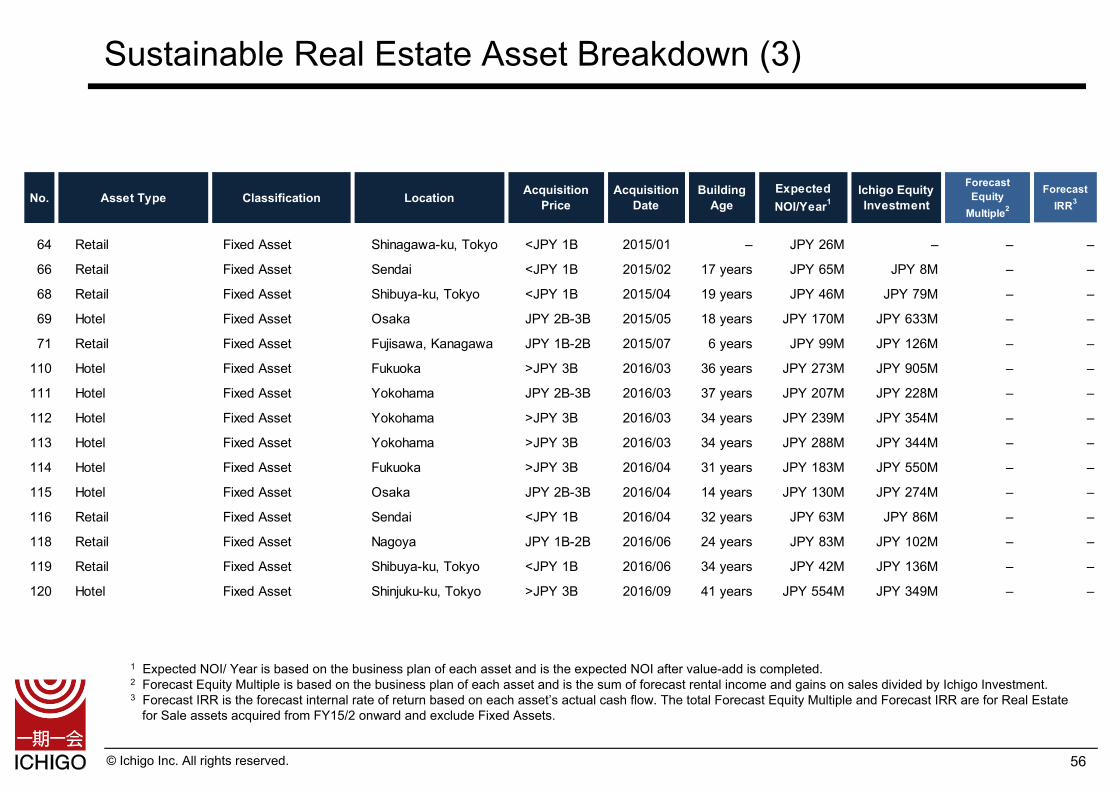
Sustainable Real Estate Asset Breakdown (3)
1 Expected NOI/ Year is based on the business plan of each asset and is the expected NOI after value-add is completed.2 Forecast Equity Multiple is based on the business plan of each asset and is the sum of forecast rental income and gains on sales divided by Ichigo Investment. 3 Forecast IRR is the forecast internal rate of return based on each asset’s actual cash flow. The total Forecast Equity Multiple and Forecast IRR are for Real Estate
for Sale assets acquired from FY15/2 onward and exclude Fixed Assets.
56
No. Asset Type Classification Location AcquisitionPrice
AcquisitionDate
BuildingAge
ExpectedNOI/Year1
Ichigo EquityInvestment
ForecastEquity
Multiple2
ForecastIRR3
64 Retail Fixed Asset Shinagawa-ku, Tokyo <JPY 1B 2015/01 – JPY 26M – – –
66 Retail Fixed Asset Sendai <JPY 1B 2015/02 17 years JPY 65M JPY 8M – –
68 Retail Fixed Asset Shibuya-ku, Tokyo <JPY 1B 2015/04 19 years JPY 46M JPY 79M – –
69 Hotel Fixed Asset Osaka JPY 2B-3B 2015/05 18 years JPY 170M JPY 633M – –
71 Retail Fixed Asset Fujisawa, Kanagawa JPY 1B-2B 2015/07 6 years JPY 99M JPY 126M – –
110 Hotel Fixed Asset Fukuoka >JPY 3B 2016/03 36 years JPY 273M JPY 905M – –
111 Hotel Fixed Asset Yokohama JPY 2B-3B 2016/03 37 years JPY 207M JPY 228M – –
112 Hotel Fixed Asset Yokohama >JPY 3B 2016/03 34 years JPY 239M JPY 354M – –
113 Hotel Fixed Asset Yokohama >JPY 3B 2016/03 34 years JPY 288M JPY 344M – –
114 Hotel Fixed Asset Fukuoka >JPY 3B 2016/04 31 years JPY 183M JPY 550M – –
115 Hotel Fixed Asset Osaka JPY 2B-3B 2016/04 14 years JPY 130M JPY 274M – –
116 Retail Fixed Asset Sendai <JPY 1B 2016/04 32 years JPY 63M JPY 86M – –
118 Retail Fixed Asset Nagoya JPY 1B-2B 2016/06 24 years JPY 83M JPY 102M – –
119 Retail Fixed Asset Shibuya-ku, Tokyo <JPY 1B 2016/06 34 years JPY 42M JPY 136M – –
120 Hotel Fixed Asset Shinjuku-ku, Tokyo >JPY 3B 2016/09 41 years JPY 554M JPY 349M – –
© Ichigo Inc. All rights reserved.
No. Asset Type Classification Location AcquisitionPrice
AcquisitionDate
BuildingAge
ExpectedNOI/Year1
Ichigo EquityInvestment
ForecastEquity
Multiple2
ForecastIRR3
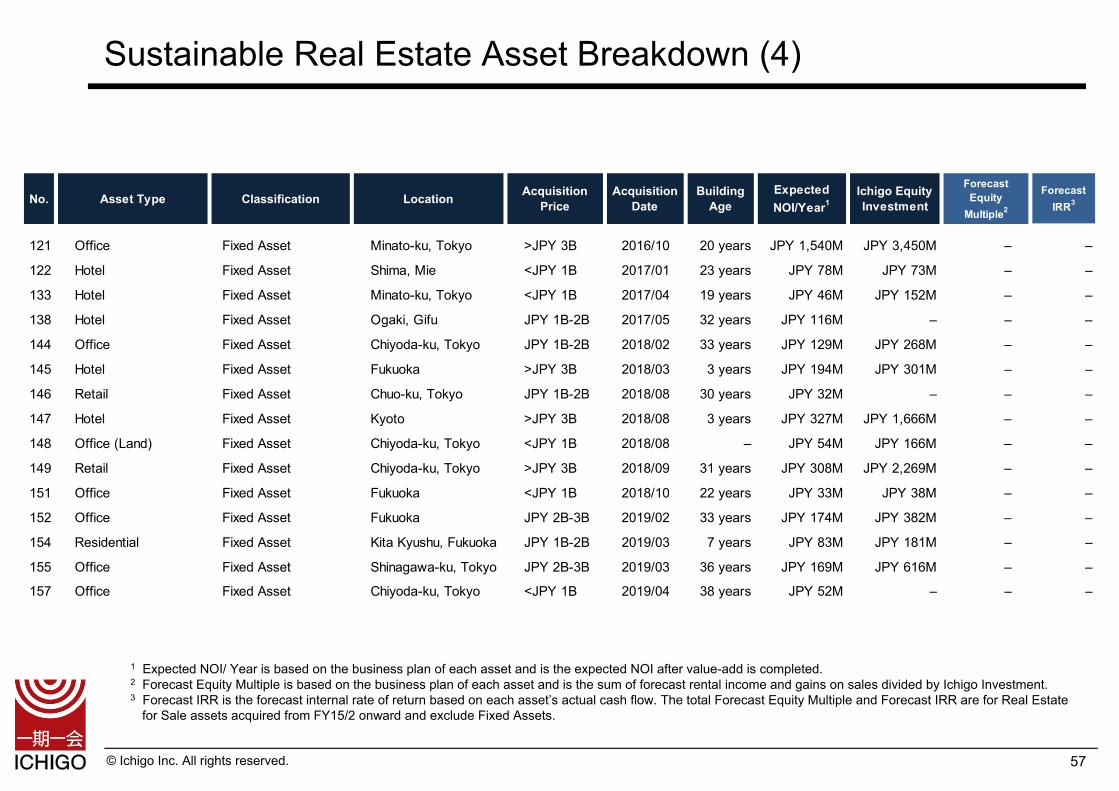
121 Office Fixed Asset Minato-ku, Tokyo >JPY 3B 2016/10 20 years JPY 1,540M JPY 3,450M – –
122 Hotel Fixed Asset Shima, Mie <JPY 1B 2017/01 23 years JPY 78M JPY 73M – –
133 Hotel Fixed Asset Minato-ku, Tokyo <JPY 1B 2017/04 19 years JPY 46M JPY 152M – –
138 Hotel Fixed Asset Ogaki, Gifu JPY 1B-2B 2017/05 32 years JPY 116M – – –
144 Office Fixed Asset Chiyoda-ku, Tokyo JPY 1B-2B 2018/02 33 years JPY 129M JPY 268M – –
145 Hotel Fixed Asset Fukuoka >JPY 3B 2018/03 3 years JPY 194M JPY 301M – –
146 Retail Fixed Asset Chuo-ku, Tokyo JPY 1B-2B 2018/08 30 years JPY 32M – – –
147 Hotel Fixed Asset Kyoto >JPY 3B 2018/08 3 years JPY 327M JPY 1,666M – –
148 Office (Land) Fixed Asset Chiyoda-ku, Tokyo <JPY 1B 2018/08 – JPY 54M JPY 166M – –
149 Retail Fixed Asset Chiyoda-ku, Tokyo >JPY 3B 2018/09 31 years JPY 308M JPY 2,269M – –
151 Office Fixed Asset Fukuoka <JPY 1B 2018/10 22 years JPY 33M JPY 38M – –
152 Office Fixed Asset Fukuoka JPY 2B-3B 2019/02 33 years JPY 174M JPY 382M – –
154 Residential Fixed Asset Kita Kyushu, Fukuoka JPY 1B-2B 2019/03 7 years JPY 83M JPY 181M – –
155 Office Fixed Asset Shinagawa-ku, Tokyo JPY 2B-3B 2019/03 36 years JPY 169M JPY 616M – –
157 Office Fixed Asset Chiyoda-ku, Tokyo <JPY 1B 2019/04 38 years JPY 52M – – –
Sustainable Real Estate Asset Breakdown (4)
1 Expected NOI/ Year is based on the business plan of each asset and is the expected NOI after value-add is completed.2 Forecast Equity Multiple is based on the business plan of each asset and is the sum of forecast rental income and gains on sales divided by Ichigo Investment. 3 Forecast IRR is the forecast internal rate of return based on each asset’s actual cash flow. The total Forecast Equity Multiple and Forecast IRR are for Real Estate
for Sale assets acquired from FY15/2 onward and exclude Fixed Assets.
57
© Ichigo Inc. All rights reserved.
No. Asset Type Classification Location AcquisitionPrice
AcquisitionDate
BuildingAge
ExpectedNOI/Year1
Ichigo EquityInvestment
ForecastEquity
Multiple2
ForecastIRR3
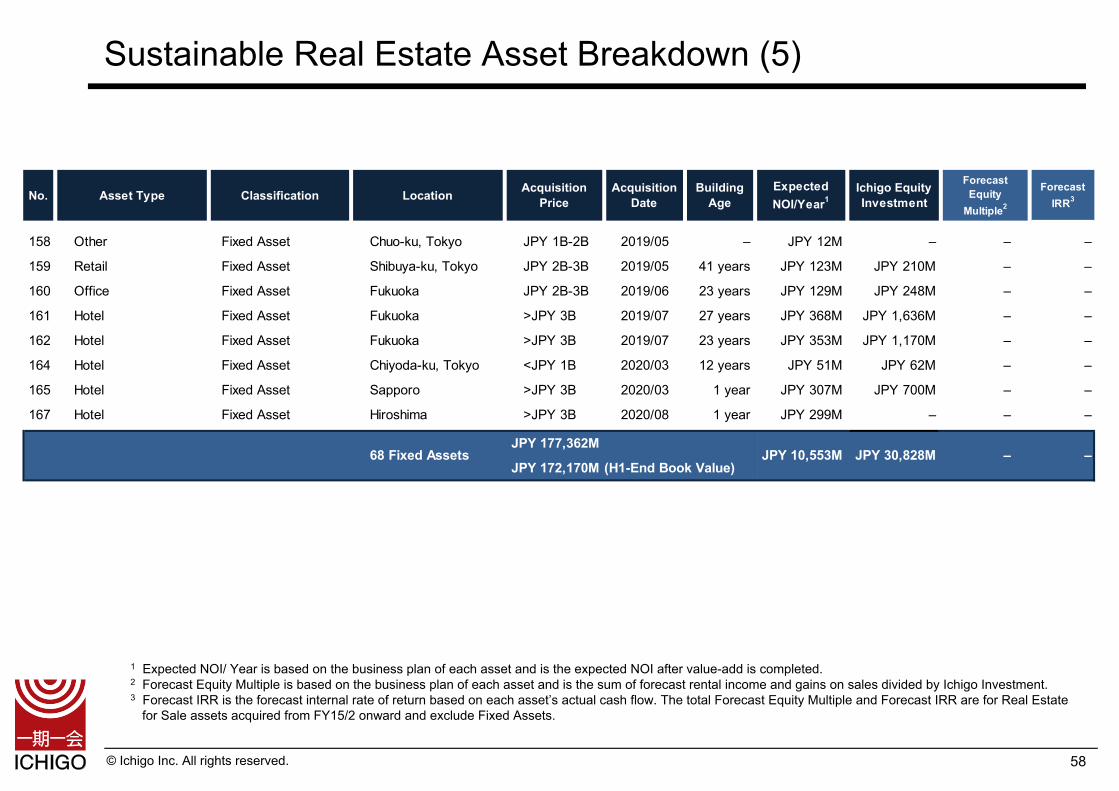
158 Other Fixed Asset Chuo-ku, Tokyo JPY 1B-2B 2019/05 – JPY 12M – – –
159 Retail Fixed Asset Shibuya-ku, Tokyo JPY 2B-3B 2019/05 41 years JPY 123M JPY 210M – –
160 Office Fixed Asset Fukuoka JPY 2B-3B 2019/06 23 years JPY 129M JPY 248M – –
161 Hotel Fixed Asset Fukuoka >JPY 3B 2019/07 27 years JPY 368M JPY 1,636M – –
162 Hotel Fixed Asset Fukuoka >JPY 3B 2019/07 23 years JPY 353M JPY 1,170M – –
164 Hotel Fixed Asset Chiyoda-ku, Tokyo <JPY 1B 2020/03 12 years JPY 51M JPY 62M – –
165 Hotel Fixed Asset Sapporo >JPY 3B 2020/03 1 year JPY 307M JPY 700M – –
167 Hotel Fixed Asset Hiroshima >JPY 3B 2020/08 1 year JPY 299M – – –
JPY 177,362M
JPY 172,170M (H1-End Book Value) 68 Fixed Assets JPY 10,553M JPY 30,828M – –
Sustainable Real Estate Asset Breakdown (5)
1 Expected NOI/ Year is based on the business plan of each asset and is the expected NOI after value-add is completed.2 Forecast Equity Multiple is based on the business plan of each asset and is the sum of forecast rental income and gains on sales divided by Ichigo Investment. 3 Forecast IRR is the forecast internal rate of return based on each asset’s actual cash flow. The total Forecast Equity Multiple and Forecast IRR are for Real Estate
for Sale assets acquired from FY15/2 onward and exclude Fixed Assets.
58
© Ichigo Inc. All rights reserved.
No. Asset Type Classification Location AcquisitionPrice
AcquisitionDate
BuildingAge
ExpectedNOI/Year1
Ichigo EquityInvestment
ForecastEquity
Multiple2
ForecastIRR3
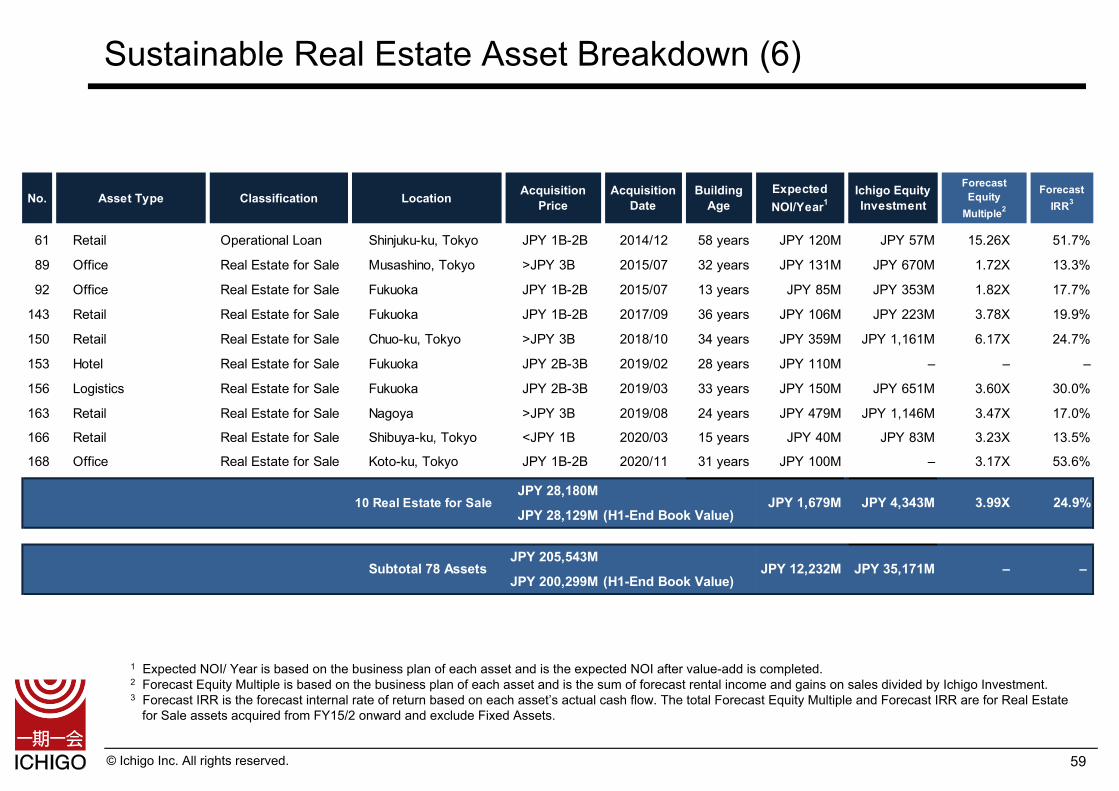
61 Retail Operational Loan Shinjuku-ku, Tokyo JPY 1B-2B 2014/12 58 years JPY 120M JPY 57M 15.26X 51.7%
89 Office Real Estate for Sale Musashino, Tokyo >JPY 3B 2015/07 32 years JPY 131M JPY 670M 1.72X 13.3%
92 Office Real Estate for Sale Fukuoka JPY 1B-2B 2015/07 13 years JPY 85M JPY 353M 1.82X 17.7%
143 Retail Real Estate for Sale Fukuoka JPY 1B-2B 2017/09 36 years JPY 106M JPY 223M 3.78X 19.9%
150 Retail Real Estate for Sale Chuo-ku, Tokyo >JPY 3B 2018/10 34 years JPY 359M JPY 1,161M 6.17X 24.7%
153 Hotel Real Estate for Sale Fukuoka JPY 2B-3B 2019/02 28 years JPY 110M – – –
156 Logistics Real Estate for Sale Fukuoka JPY 2B-3B 2019/03 33 years JPY 150M JPY 651M 3.60X 30.0%
163 Retail Real Estate for Sale Nagoya >JPY 3B 2019/08 24 years JPY 479M JPY 1,146M 3.47X 17.0%
166 Retail Real Estate for Sale Shibuya-ku, Tokyo <JPY 1B 2020/03 15 years JPY 40M JPY 83M 3.23X 13.5%
168 Office Real Estate for Sale Koto-ku, Tokyo JPY 1B-2B 2020/11 31 years JPY 100M – 3.17X 53.6%
JPY 28,180M
JPY 28,129M (H1-End Book Value)
JPY 205,543M
JPY 200,299M (H1-End Book Value)
10 Real Estate for Sale JPY 1,679M JPY 4,343M 3.99X 24.9%
Subtotal 78 Assets – JPY 12,232M JPY 35,171M –
Sustainable Real Estate Asset Breakdown (6)
1 Expected NOI/ Year is based on the business plan of each asset and is the expected NOI after value-add is completed.2 Forecast Equity Multiple is based on the business plan of each asset and is the sum of forecast rental income and gains on sales divided by Ichigo Investment. 3 Forecast IRR is the forecast internal rate of return based on each asset’s actual cash flow. The total Forecast Equity Multiple and Forecast IRR are for Real Estate
for Sale assets acquired from FY15/2 onward and exclude Fixed Assets.
59
© Ichigo Inc. All rights reserved.
No. AcquisitionPrice
ExpectedNOI/Year1
Ichigo EquityInvestment
ForecastEquity
Multiple
ForecastIRR
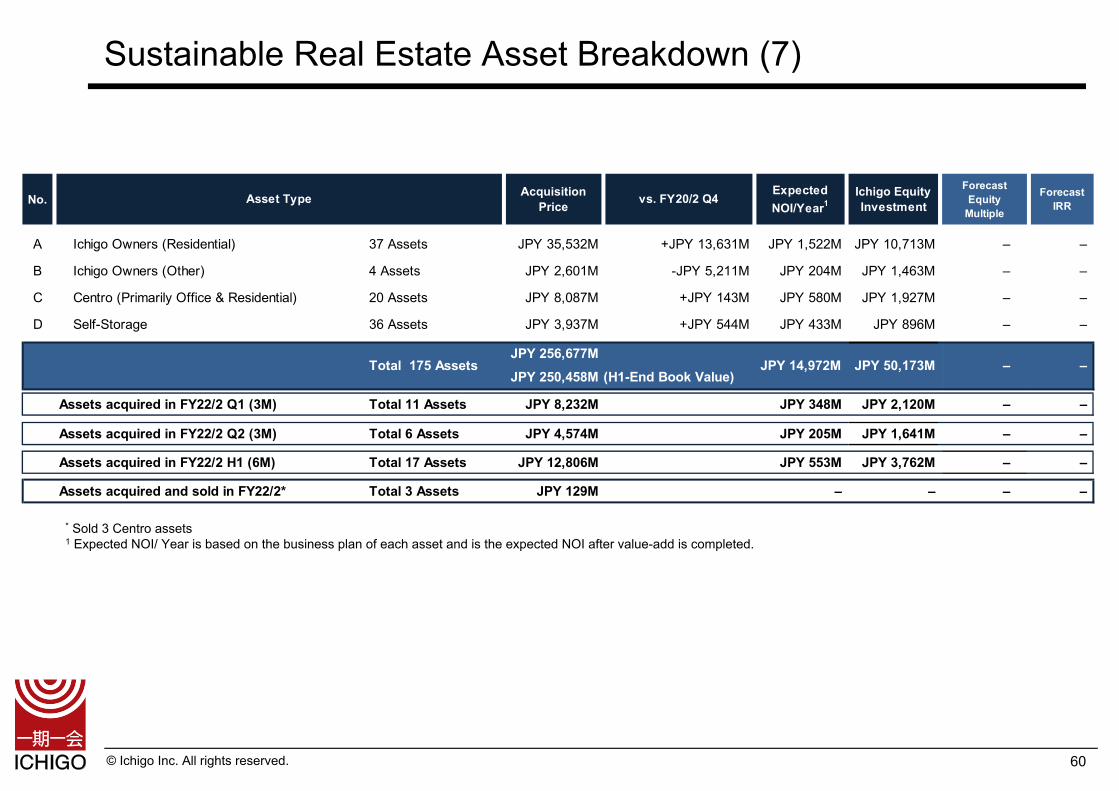
A Ichigo Owners (Residential) 37 Assets JPY 35,532M JPY 1,522M JPY 10,713M – –
B Ichigo Owners (Other) 4 Assets JPY 2,601M JPY 204M JPY 1,463M – –
C Centro (Primarily Office & Residential) 20 Assets JPY 8,087M JPY 580M JPY 1,927M – –
D Self-Storage 36 Assets JPY 3,937M JPY 433M JPY 896M – –
JPY 256,677MJPY 250,458M (H1-End Book Value)
Assets acquired in FY22/2 Q1 (3M) Total 11 Assets JPY 8,232M JPY 348M JPY 2,120M – –
Assets acquired in FY22/2 Q2 (3M) Total 6 Assets JPY 4,574M JPY 205M JPY 1,641M – –
Assets acquired in FY22/2 H1 (6M) Total 17 Assets JPY 12,806M JPY 553M JPY 3,762M – –
Assets acquired and sold in FY22/2* Total 3 Assets JPY 129M – – – –
JPY 50,173M – – JPY 14,972M
+JPY 13,631M
-JPY 5,211M
+JPY 544M
Total 175 Assets
Asset Type vs. FY20/2 Q4
+JPY 143M
Sustainable Real Estate Asset Breakdown (7)
* Sold 3 Centro assets1 Expected NOI/ Year is based on the business plan of each asset and is the expected NOI after value-add is completed.
60
© Ichigo Inc. All rights reserved.
Wind Power Plant AreaPanel
Output(MW)
FIT(Pre-tax)
OperationStart Date
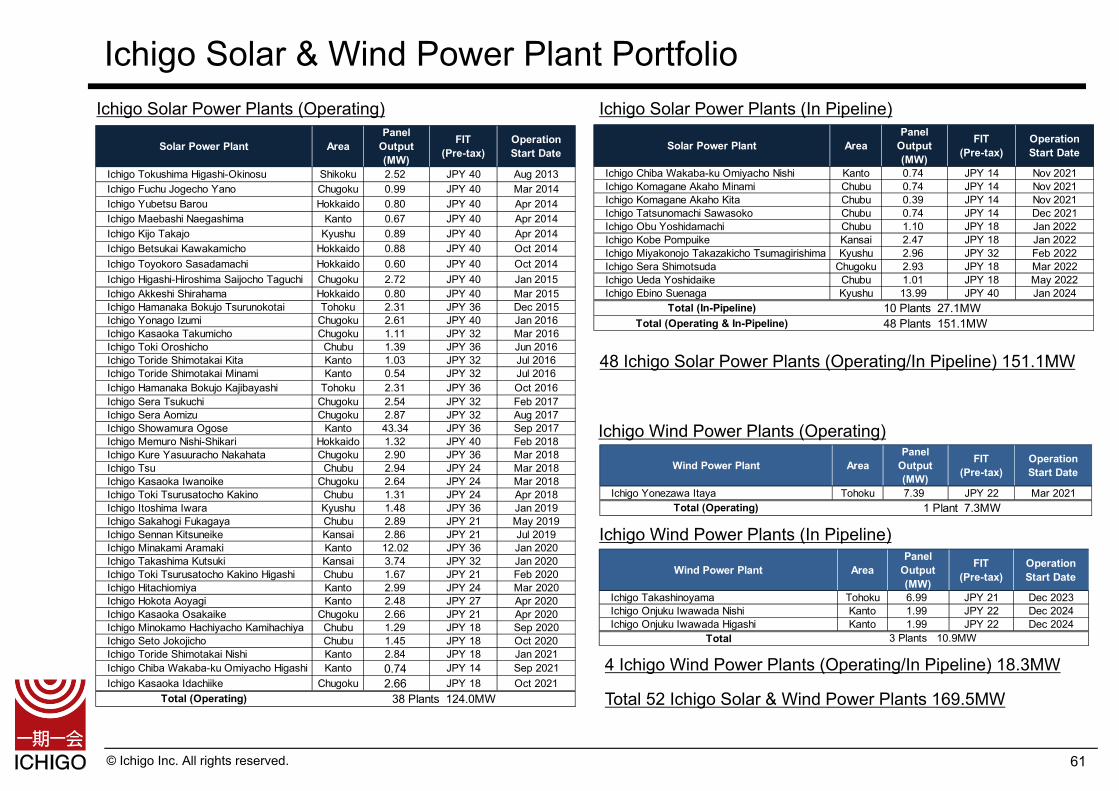
Ichigo Yonezawa Itaya Tohoku 7.39 JPY 22 Mar 2021Total (Operating) 1 Plant 7.3MW
Solar Power Plant AreaPanel
Output(MW)
FIT(Pre-tax)
OperationStart Date
Ichigo Chiba Wakaba-ku Omiyacho Nishi Kanto 0.74 JPY 14 Nov 2021Ichigo Komagane Akaho Minami Chubu 0.74 JPY 14 Nov 2021Ichigo Komagane Akaho Kita Chubu 0.39 JPY 14 Nov 2021Ichigo Tatsunomachi Sawasoko Chubu 0.74 JPY 14 Dec 2021Ichigo Obu Yoshidamachi Chubu 1.10 JPY 18 Jan 2022Ichigo Kobe Pompuike Kansai 2.47 JPY 18 Jan 2022Ichigo Miyakonojo Takazakicho Tsumagirishima Kyushu 2.96 JPY 32 Feb 2022Ichigo Sera Shimotsuda Chugoku 2.93 JPY 18 Mar 2022Ichigo Ueda Yoshidaike Chubu 1.01 JPY 18 May 2022Ichigo Ebino Suenaga Kyushu 13.99 JPY 40 Jan 2024
Total (In-Pipeline)Total (Operating & In-Pipeline) 48 Plants 151.1MW
10 Plants 27.1MW
Solar Power Plant AreaPanel
Output(MW)
FIT(Pre-tax)
OperationStart Date
Ichigo Tokushima Higashi-Okinosu Shikoku 2.52 JPY 40 Aug 2013Ichigo Fuchu Jogecho Yano Chugoku 0.99 JPY 40 Mar 2014Ichigo Yubetsu Barou Hokkaido 0.80 JPY 40 Apr 2014Ichigo Maebashi Naegashima Kanto 0.67 JPY 40 Apr 2014Ichigo Kijo Takajo Kyushu 0.89 JPY 40 Apr 2014Ichigo Betsukai Kawakamicho Hokkaido 0.88 JPY 40 Oct 2014Ichigo Toyokoro Sasadamachi Hokkaido 0.60 JPY 40 Oct 2014Ichigo Higashi-Hiroshima Saijocho Taguchi Chugoku 2.72 JPY 40 Jan 2015Ichigo Akkeshi Shirahama Hokkaido 0.80 JPY 40 Mar 2015Ichigo Hamanaka Bokujo Tsurunokotai Tohoku 2.31 JPY 36 Dec 2015Ichigo Yonago Izumi Chugoku 2.61 JPY 40 Jan 2016Ichigo Kasaoka Takumicho Chugoku 1.11 JPY 32 Mar 2016Ichigo Toki Oroshicho Chubu 1.39 JPY 36 Jun 2016Ichigo Toride Shimotakai Kita Kanto 1.03 JPY 32 Jul 2016Ichigo Toride Shimotakai Minami Kanto 0.54 JPY 32 Jul 2016Ichigo Hamanaka Bokujo Kajibayashi Tohoku 2.31 JPY 36 Oct 2016Ichigo Sera Tsukuchi Chugoku 2.54 JPY 32 Feb 2017Ichigo Sera Aomizu Chugoku 2.87 JPY 32 Aug 2017Ichigo Showamura Ogose Kanto 43.34 JPY 36 Sep 2017Ichigo Memuro Nishi-Shikari Hokkaido 1.32 JPY 40 Feb 2018Ichigo Kure Yasuuracho Nakahata Chugoku 2.90 JPY 36 Mar 2018Ichigo Tsu Chubu 2.94 JPY 24 Mar 2018Ichigo Kasaoka Iwanoike Chugoku 2.64 JPY 24 Mar 2018Ichigo Toki Tsurusatocho Kakino Chubu 1.31 JPY 24 Apr 2018Ichigo Itoshima Iwara Kyushu 1.48 JPY 36 Jan 2019Ichigo Sakahogi Fukagaya Chubu 2.89 JPY 21 May 2019Ichigo Sennan Kitsuneike Kansai 2.86 JPY 21 Jul 2019Ichigo Minakami Aramaki Kanto 12.02 JPY 36 Jan 2020Ichigo Takashima Kutsuki Kansai 3.74 JPY 32 Jan 2020Ichigo Toki Tsurusatocho Kakino Higashi Chubu 1.67 JPY 21 Feb 2020Ichigo Hitachiomiya Kanto 2.99 JPY 24 Mar 2020Ichigo Hokota Aoyagi Kanto 2.48 JPY 27 Apr 2020Ichigo Kasaoka Osakaike Chugoku 2.66 JPY 21 Apr 2020Ichigo Minokamo Hachiyacho Kamihachiya Chubu 1.29 JPY 18 Sep 2020Ichigo Seto Jokojicho Chubu 1.45 JPY 18 Oct 2020Ichigo Toride Shimotakai Nishi Kanto 2.84 JPY 18 Jan 2021Ichigo Chiba Wakaba-ku Omiyacho Higashi Kanto 0.74 JPY 14 Sep 2021Ichigo Kasaoka Idachiike Chugoku 2.66 JPY 18 Oct 2021
Total (Operating) 38 Plants 124.0MW
Ichigo Solar & Wind Power Plant Portfolio
Wind Power Plant AreaPanel
Output(MW)
FIT(Pre-tax)
OperationStart Date
Ichigo Takashinoyama Tohoku 6.99 JPY 21 Dec 2023Ichigo Onjuku Iwawada Nishi Kanto 1.99 JPY 22 Dec 2024Ichigo Onjuku Iwawada Higashi Kanto 1.99 JPY 22 Dec 2024
Total 3 Plants 10.9MW
Ichigo Solar Power Plants (Operating) Ichigo Solar Power Plants (In Pipeline)
61
Ichigo Wind Power Plants (In Pipeline)
Ichigo Wind Power Plants (Operating)
48 Ichigo Solar Power Plants (Operating/In Pipeline) 151.1MW
4 Ichigo Wind Power Plants (Operating/In Pipeline) 18.3MW
Total 52 Ichigo Solar & Wind Power Plants 169.5MW
© Ichigo Inc. All rights reserved.
Solar Power Plant AreaPanel
Output(MW)
FIT(Pre-tax)
OperationStart Date
Ichigo Kiryu Okuzawa Kanto 1.33 JPY 40 Sep 2013 Ichigo Motomombetsu Hokkaido 1.40 JPY 40 Feb 2014 Ichigo Muroran Hatchodaira Hokkaido 1.24 JPY 40 Mar 2014 Ichigo Engaru Kiyokawa Hokkaido 1.12 JPY 40 Mar 2014 Ichigo Iyo Nakayamacho Izubuchi Shikoku 1.23 JPY 40 Apr 2014 Ichigo Nakashibetsu Midorigaoka Hokkaido 1.93 JPY 40 Nov 2014 Ichigo Abira Toasa Hokkaido 1.16 JPY 40 Dec 2014 Ichigo Toyokoro Hokkaido 1.02 JPY 40 Dec 2014 Ichigo Nago Futami Okinawa 8.44 JPY 40 Feb 2015 Ichigo Engaru Higashimachi Hokkaido 1.24 JPY 40 Feb 2015 Ichigo Takamatsu Kokubunjicho Nii Shikoku 2.43 JPY 36 Jun 2015 Ichigo Miyakonojo Yasuhisacho Kyushu 1.44 JPY 36 Jul 2015 Ichigo Toyokawa Mitocho Sawakihama Chubu 1.80 JPY 32 Sep 2015 Ichigo Yamaguchi Aionishi Chugoku 1.24 JPY 40 Dec 2015 Ichigo Yamaguchi Sayama Chugoku 2.35 JPY 36 Apr 2016
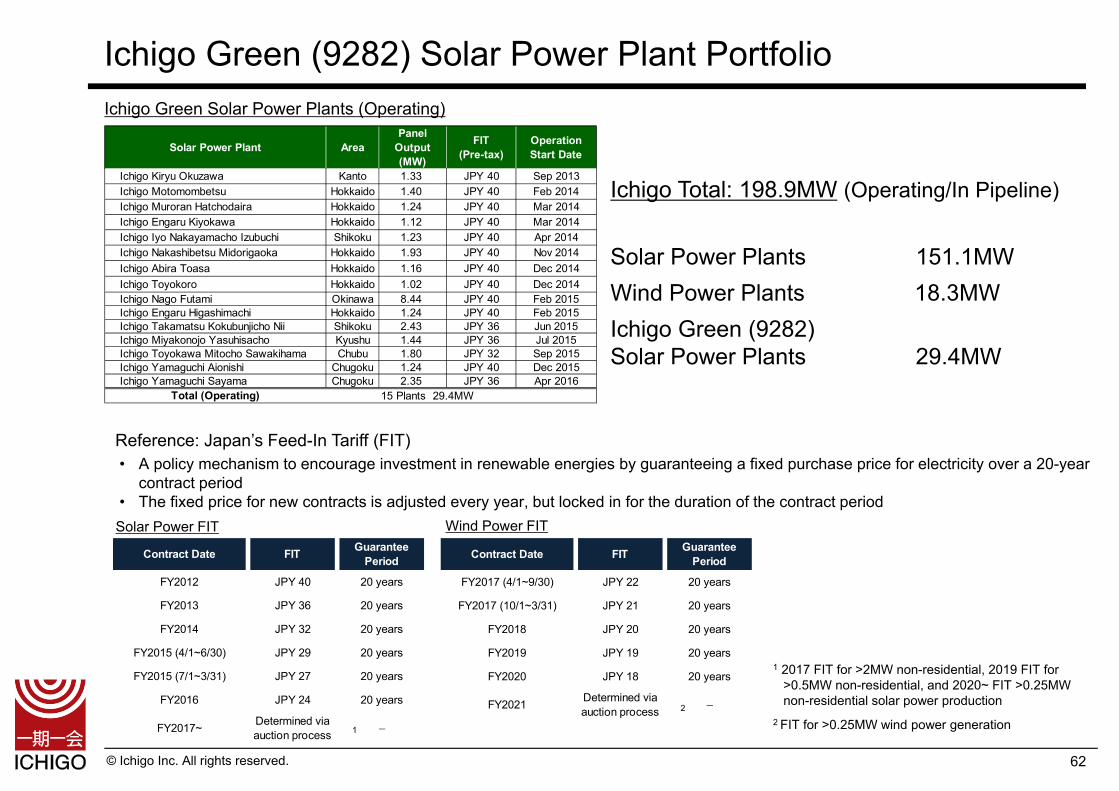
Total (Operating) 15 Plants 29.4MW
Ichigo Green (9282) Solar Power Plant Portfolio
62
Ichigo Green Solar Power Plants (Operating)
Reference: Japan’s Feed-In Tariff (FIT)• A policy mechanism to encourage investment in renewable energies by guaranteeing a fixed purchase price for electricity over a 20-year
contract period• The fixed price for new contracts is adjusted every year, but locked in for the duration of the contract period
Ichigo Total: 198.9MW (Operating/In Pipeline)
Solar Power Plants 151.1MWWind Power Plants 18.3MWIchigo Green (9282)Solar Power Plants 29.4MW
Contract Date FIT GuaranteePeriod
FY2012 JPY 40 20 years
FY2013 JPY 36 20 years
FY2014 JPY 32 20 years
FY2015 (4/1~6/30) JPY 29 20 years
FY2015 (7/1~3/31) JPY 27 20 years
FY2016 JPY 24 20 years
FY2017~ Determined viaauction process –
Contract Date FIT GuaranteePeriod
FY2017 (4/1~9/30) JPY 22 20 years
FY2017 (10/1~3/31) JPY 21 20 years
FY2018 JPY 20 20 years
FY2019 JPY 19 20 years
FY2020 JPY 18 20 years
FY2021 Determined viaauction process –
Solar Power FIT Wind Power FIT
1 2017 FIT for >2MW non-residential, 2019 FIT for >0.5MW non-residential, and 2020~ FIT >0.25MW non-residential solar power production
2 FIT for >0.25MW wind power generation 1
2
© Ichigo Inc. All rights reserved.
<2MW13%
2-10MW33%
>10MW37%
<2MW(In Pipeline)
3%
2-10MW(In Pipeline)
5%10MW
(In Pipeline)
9%
PanelOutput(MW)
FIT(Pre-tax)
(JPY)
PanelOutput(MW)
FIT(Pre-tax)
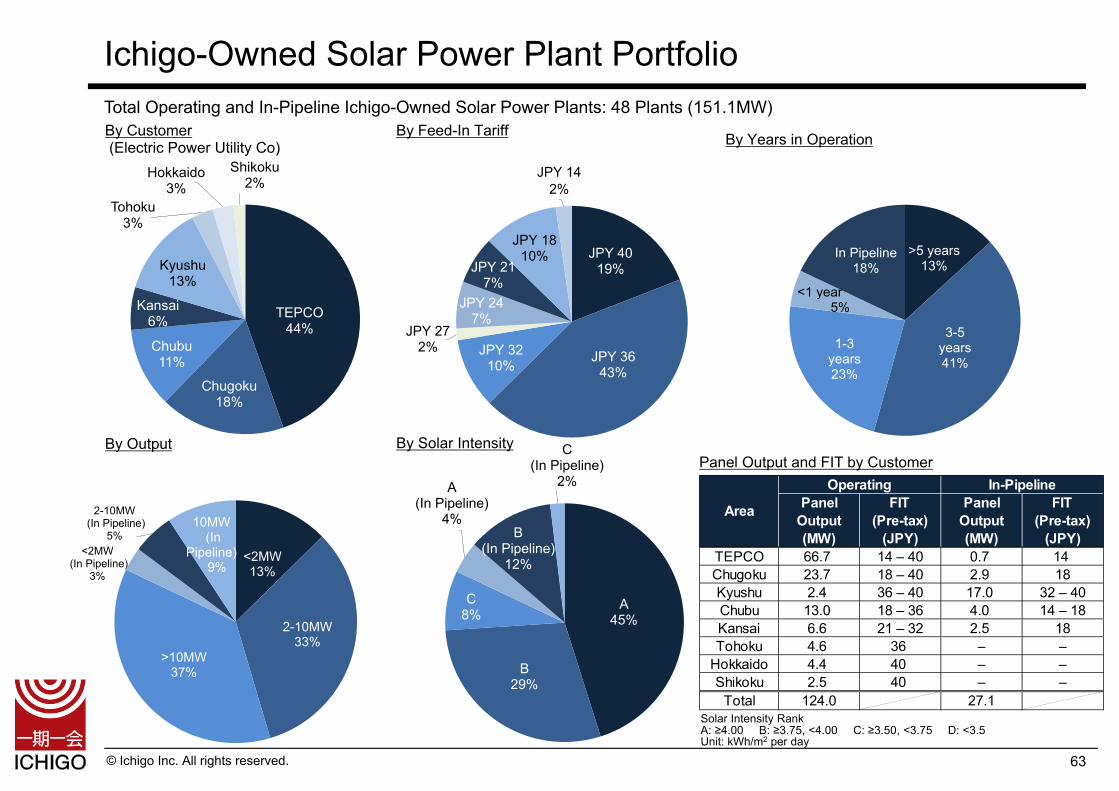
(JPY)TEPCO 66.7 14 – 40 0.7 14Chugoku 23.7 18 – 40 2.9 18Kyushu 2.4 36 – 40 17.0 32 – 40Chubu 13.0 18 – 36 4.0 14 – 18Kansai 6.6 21 – 32 2.5 18Tohoku 4.6 36 – –
Hokkaido 4.4 40 – –Shikoku 2.5 40 – –
Total 124.0 27.1
Area
Operating In-Pipeline
Ichigo-Owned Solar Power Plant PortfolioTotal Operating and In-Pipeline Ichigo-Owned Solar Power Plants: 48 Plants (151.1MW)
63
By Customer(Electric Power Utility Co)
By Feed-In Tariff By Years in Operation
By Output By Solar Intensity
Solar Intensity RankA: ≥4.00 B: ≥3.75, <4.00 C: ≥3.50, <3.75 D: <3.5Unit: kWh/m2 per day
Panel Output and FIT by Customer
TEPCO44%
Chugoku18%
Chubu11%
Kansai6%
Kyushu13%
Tohoku3%
Hokkaido3%
Shikoku2%
JPY 4019%
JPY 3643%
JPY 3210%
JPY 272%
JPY 247%
JPY 217%
JPY 1810%
JPY 142%
>5 years13%
3-5 years41%
1-3 years23%
<1 year5%
In Pipeline18%
A45%
B29%
C8%
A(In Pipeline)
4%B
(In Pipeline)12%
C(In Pipeline)
2%
© Ichigo Inc. All rights reserved. 64
Solar Power
Wind Power
Biomass
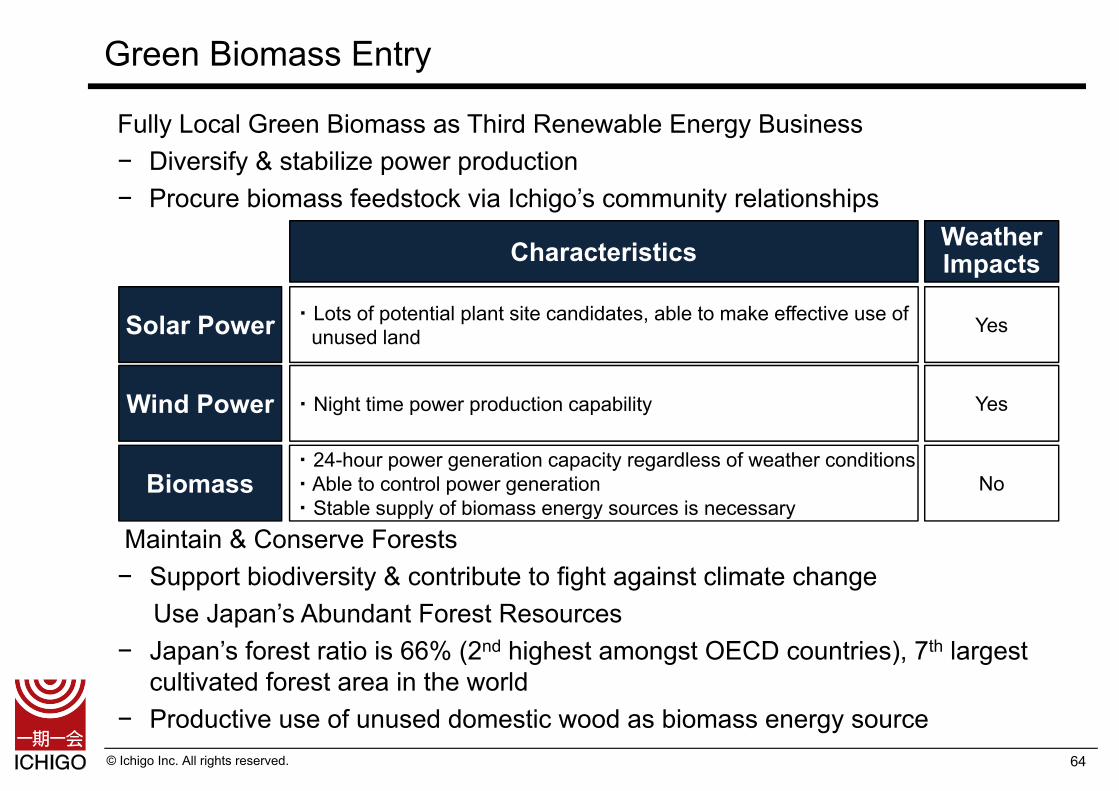
・ Lots of potential plant site candidates, able to make effective use of unused land
・ Night time power production capability
・ 24-hour power generation capacity regardless of weather conditions・ Able to control power generation ・ Stable supply of biomass energy sources is necessary
Characteristics WeatherImpacts
Yes
Yes
No
Fully Local Green Biomass as Third Renewable Energy Business− Diversify & stabilize power production− Procure biomass feedstock via Ichigo’s community relationships
Maintain & Conserve Forests− Support biodiversity & contribute to fight against climate change
Use Japan’s Abundant Forest Resources− Japan’s forest ratio is 66% (2nd highest amongst OECD countries), 7th largest
cultivated forest area in the world − Productive use of unused domestic wood as biomass energy source
Green Biomass Entry
© Ichigo Inc. All rights reserved.
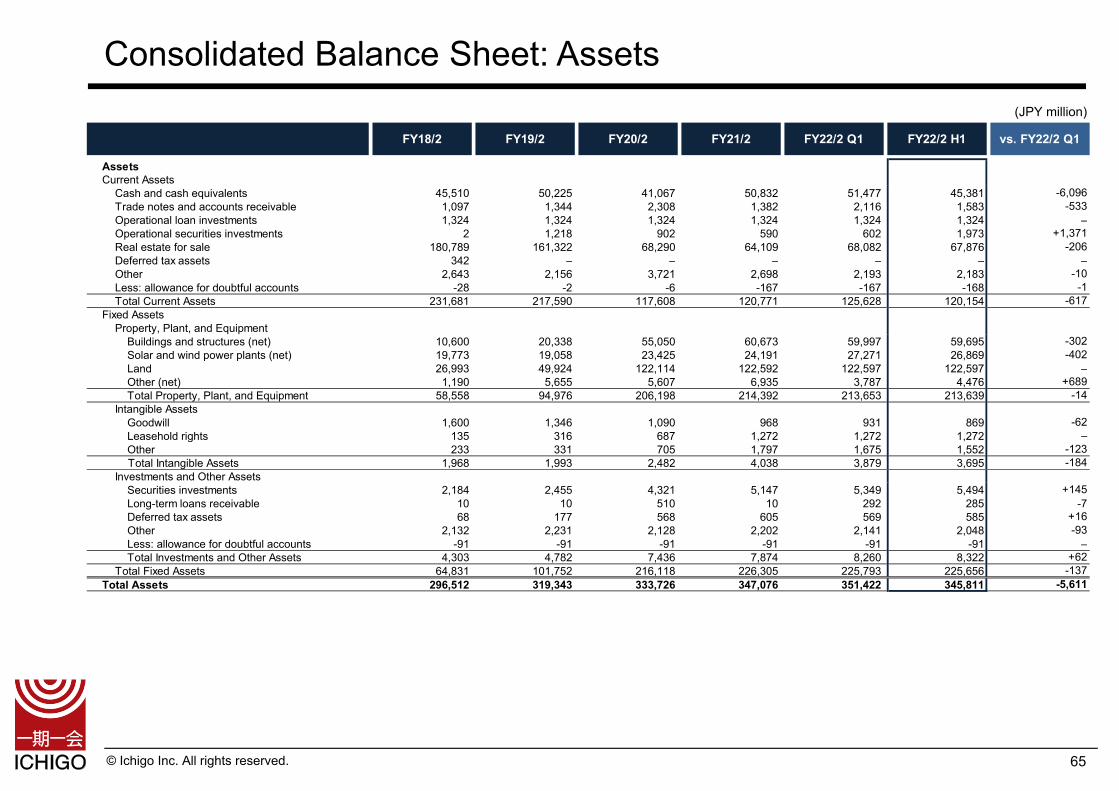
Consolidated Balance Sheet: Assets
65
(JPY million)
FY18/2 FY19/2 FY20/2 FY21/2 FY22/2 Q1 FY22/2 H1 vs. FY22/2 Q1
AssetsCurrent Assets
Cash and cash equivalents 45,510 50,225 41,067 50,832 51,477 45,381 -6,096Trade notes and accounts receivable 1,097 1,344 2,308 1,382 2,116 1,583 -533Operational loan investments 1,324 1,324 1,324 1,324 1,324 1,324 –Operational securities investments 2 1,218 902 590 602 1,973 +1,371Real estate for sale 180,789 161,322 68,290 64,109 68,082 67,876 -206Deferred tax assets 342 – – – – – –Other 2,643 2,156 3,721 2,698 2,193 2,183 -10Less: allowance for doubtful accounts -28 -2 -6 -167 -167 -168 -1Total Current Assets 231,681 217,590 117,608 120,771 125,628 120,154 -617
Fixed AssetsProperty, Plant, and Equipment Buildings and structures (net) 10,600 20,338 55,050 60,673 59,997 59,695 -302 Solar and wind power plants (net) 19,773 19,058 23,425 24,191 27,271 26,869 -402 Land 26,993 49,924 122,114 122,592 122,597 122,597 – Other (net) 1,190 5,655 5,607 6,935 3,787 4,476 +689 Total Property, Plant, and Equipment 58,558 94,976 206,198 214,392 213,653 213,639 -14Intangible Assets Goodwill 1,600 1,346 1,090 968 931 869 -62 Leasehold rights 135 316 687 1,272 1,272 1,272 – Other 233 331 705 1,797 1,675 1,552 -123
Total Intangible Assets 1,968 1,993 2,482 4,038 3,879 3,695 -184Investments and Other Assets Securities investments 2,184 2,455 4,321 5,147 5,349 5,494 +145 Long-term loans receivable 10 10 510 10 292 285 -7 Deferred tax assets 68 177 568 605 569 585 +16 Other 2,132 2,231 2,128 2,202 2,141 2,048 -93 Less: allowance for doubtful accounts -91 -91 -91 -91 -91 -91 – Total Investments and Other Assets 4,303 4,782 7,436 7,874 8,260 8,322 +62Total Fixed Assets 64,831 101,752 216,118 226,305 225,793 225,656 -137
Total Assets 296,512 319,343 333,726 347,076 351,422 345,811 -5,611
© Ichigo Inc. All rights reserved.
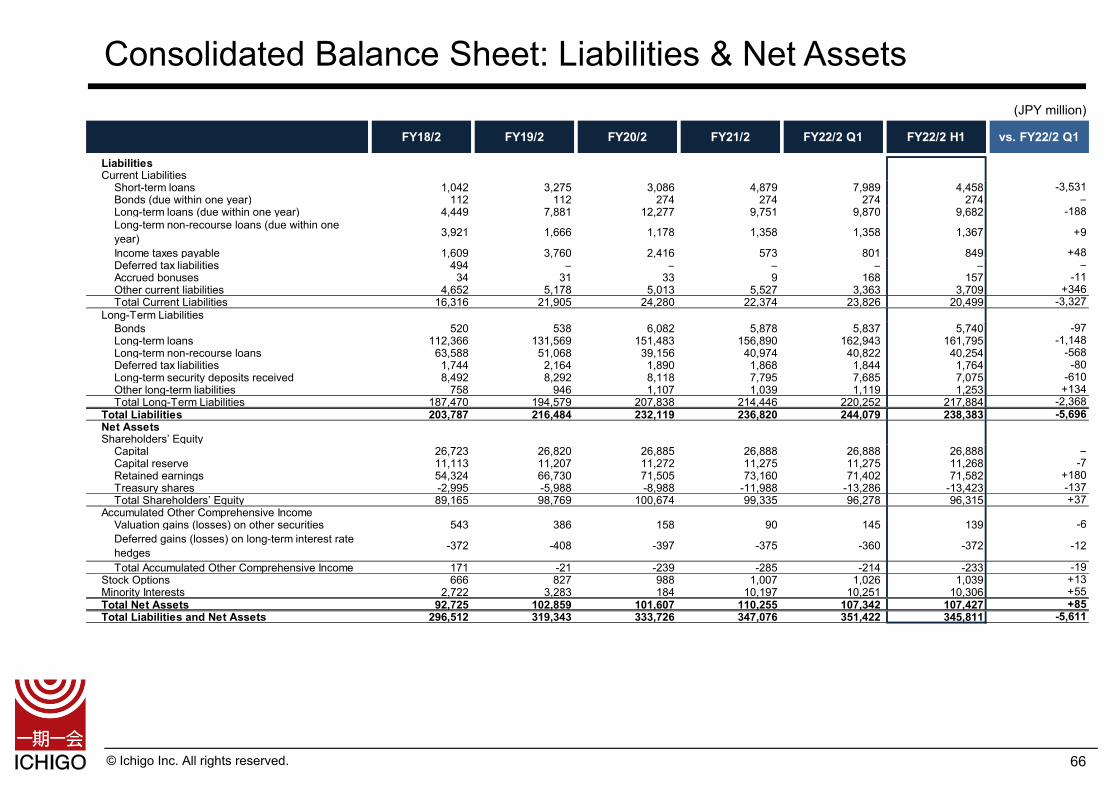
Consolidated Balance Sheet: Liabilities & Net Assets
66
(JPY million)
FY18/2 FY19/2 FY20/2 FY21/2 FY22/2 Q1 FY22/2 H1 vs. FY22/2 Q1
LiabilitiesCurrent Liabilities
Short-term loans 1,042 3,275 3,086 4,879 7,989 4,458 -3,531Bonds (due within one year) 112 112 274 274 274 274 –Long-term loans (due within one year) 4,449 7,881 12,277 9,751 9,870 9,682 -188Long-term non-recourse loans (due within oneyear) 3,921 1,666 1,178 1,358 1,358 1,367 +9
Income taxes payable 1,609 3,760 2,416 573 801 849 +48Deferred tax liabilities 494 – – – – – –Accrued bonuses 34 31 33 9 168 157 -11Other current liabilities 4,652 5,178 5,013 5,527 3,363 3,709 +346Total Current Liabilities 16,316 21,905 24,280 22,374 23,826 20,499 -3,327
Long-Term LiabilitiesBonds 520 538 6,082 5,878 5,837 5,740 -97Long-term loans 112,366 131,569 151,483 156,890 162,943 161,795 -1,148Long-term non-recourse loans 63,588 51,068 39,156 40,974 40,822 40,254 -568Deferred tax liabilities 1,744 2,164 1,890 1,868 1,844 1,764 -80Long-term security deposits received 8,492 8,292 8,118 7,795 7,685 7,075 -610Other long-term liabilities 758 946 1,107 1,039 1,119 1,253 +134Total Long-Term Liabilities 187,470 194,579 207,838 214,446 220,252 217,884 -2,368
Total Liabilities 203,787 216,484 232,119 236,820 244,079 238,383 -5,696Net AssetsShareholders’ Equity
Capital 26,723 26,820 26,885 26,888 26,888 26,888 –Capital reserve 11,113 11,207 11,272 11,275 11,275 11,268 -7Retained earnings 54,324 66,730 71,505 73,160 71,402 71,582 +180Treasury shares -2,995 -5,988 -8,988 -11,988 -13,286 -13,423 -137Total Shareholders’ Equity 89,165 98,769 100,674 99,335 96,278 96,315 +37
Accumulated Other Comprehensive IncomeValuation gains (losses) on other securities 543 386 158 90 145 139 -6Deferred gains (losses) on long-term interest ratehedges -372 -408 -397 -375 -360 -372 -12
Total Accumulated Other Comprehensive Income 171 -21 -239 -285 -214 -233 -19Stock Options 666 827 988 1,007 1,026 1,039 +13Minority Interests 2,722 3,283 184 10,197 10,251 10,306 +55Total Net Assets 92,725 102,859 101,607 110,255 107,342 107,427 +85Total Liabilities and Net Assets 296,512 319,343 333,726 347,076 351,422 345,811 -5,611
© Ichigo Inc. All rights reserved.
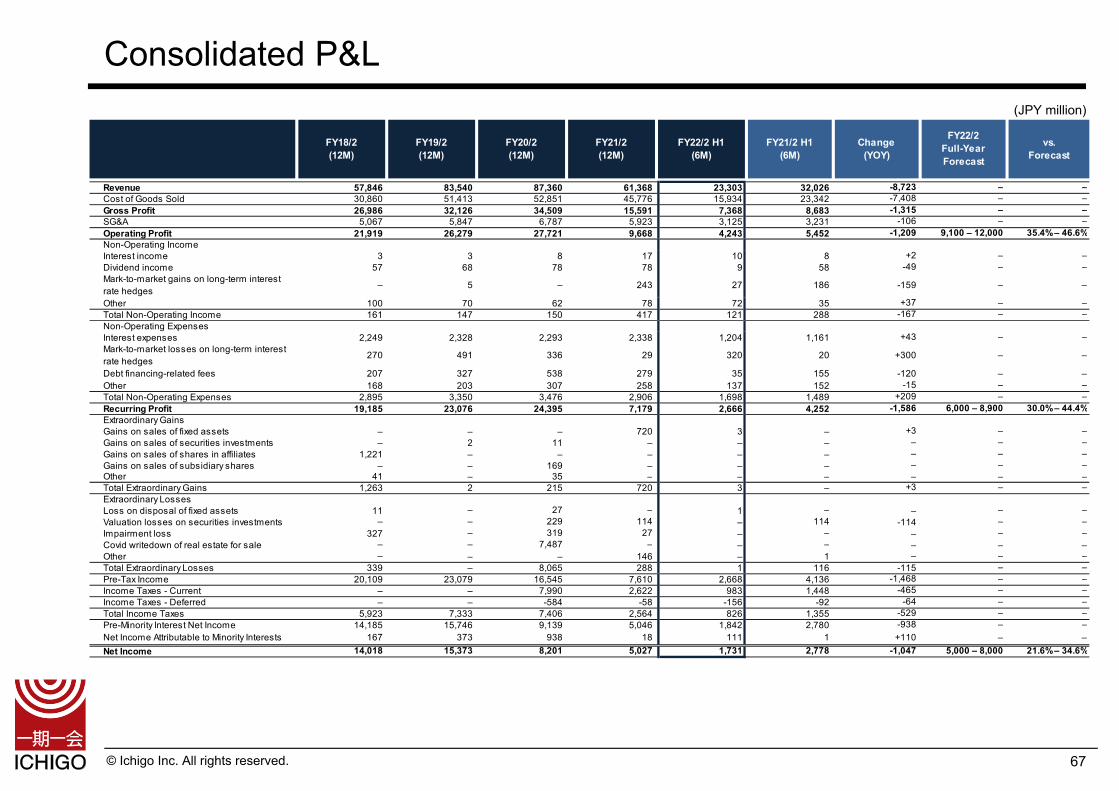
Consolidated P&L
67
(JPY million)
FY18/2(12M)
FY19/2(12M)
FY20/2(12M)
FY21/2(12M)
FY22/2 H1(6M)
FY21/2 H1(6M)
Change(YOY)
FY22/2Full-YearForecast
vs.Forecast
Revenue 57,846 83,540 87,360 61,368 23,303 32,026 -8,723 – –Cost of Goods Sold 30,860 51,413 52,851 45,776 15,934 23,342 -7,408 – –Gross Profit 26,986 32,126 34,509 15,591 7,368 8,683 -1,315 – –SG&A 5,067 5,847 6,787 5,923 3,125 3,231 -106 – –Operating Profit 21,919 26,279 27,721 9,668 4,243 5,452 -1,209 9,100 – 12,000 35.4% – 46.6%Non-Operating IncomeInterest income 3 3 8 17 10 8 +2 – –Dividend income 57 68 78 78 9 58 -49 – –Mark-to-market gains on long-term interestrate hedges – 5 – 243 27 186 -159 – –
Other 100 70 62 78 72 35 +37 – –Total Non-Operating Income 161 147 150 417 121 288 -167 – –Non-Operating ExpensesInterest expenses 2,249 2,328 2,293 2,338 1,204 1,161 +43 – –Mark-to-market losses on long-term interestrate hedges 270 491 336 29 320 20 +300 – –
Debt financing-related fees 207 327 538 279 35 155 -120 – –Other 168 203 307 258 137 152 -15 – –Total Non-Operating Expenses 2,895 3,350 3,476 2,906 1,698 1,489 +209 – –Recurring Profit 19,185 23,076 24,395 7,179 2,666 4,252 -1,586 6,000 – 8,900 30.0% – 44.4%Extraordinary GainsGains on sales of fixed assets – – – 720 3 – +3 – –Gains on sales of securities investments – 2 11 – – – – – –Gains on sales of shares in affiliates 1,221 – – – – – – – –Gains on sales of subsidiary shares – – 169 – – – – – –Other 41 – 35 – – – – – –Total Extraordinary Gains 1,263 2 215 720 3 – +3 – –Extraordinary LossesLoss on disposal of fixed assets 11 – 27 – 1 – – – –Valuation losses on securities investments – – 229 114 – 114 -114 – –Impairment loss 327 – 319 27 – – – – –Covid writedown of real estate for sale – – 7,487 – – – – – –Other – – – 146 – 1 – – –Total Extraordinary Losses 339 – 8,065 288 1 116 -115 – –Pre-Tax Income 20,109 23,079 16,545 7,610 2,668 4,136 -1,468 – –Income Taxes - Current – – 7,990 2,622 983 1,448 -465 – –Income Taxes - Deferred – – -584 -58 -156 -92 -64 – –Total Income Taxes 5,923 7,333 7,406 2,564 826 1,355 -529 – –Pre-Minority Interest Net Income 14,185 15,746 9,139 5,046 1,842 2,780 -938 – –Net Income Attributable to Minority Interests 167 373 938 18 111 1 +110 – –Net Income 14,018 15,373 8,201 5,027 1,731 2,778 -1,047 5,000 – 8,000 21.6% – 34.6%
© Ichigo Inc. All rights reserved.
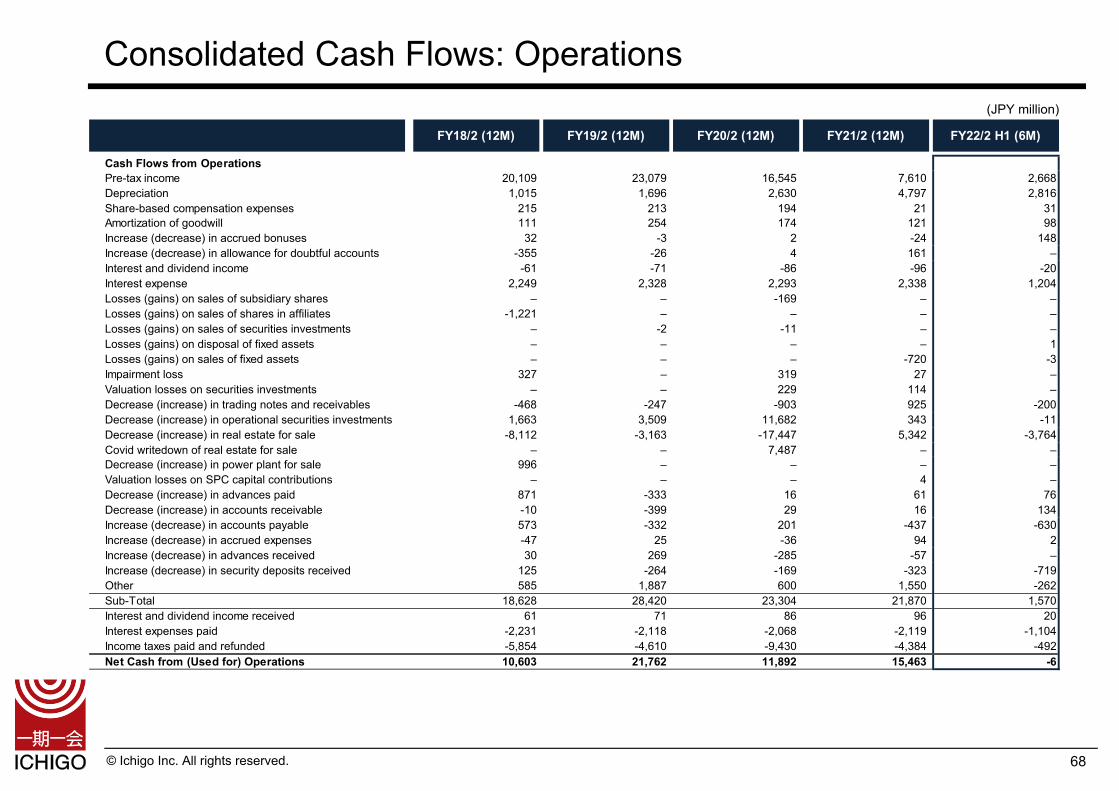
Consolidated Cash Flows: Operations
68
(JPY million)
FY18/2 (12M) FY19/2 (12M) FY20/2 (12M) FY21/2 (12M) FY22/2 H1 (6M)
Cash Flows from OperationsPre-tax income 20,109 23,079 16,545 7,610 2,668Depreciation 1,015 1,696 2,630 4,797 2,816Share-based compensation expenses 215 213 194 21 31Amortization of goodwill 111 254 174 121 98Increase (decrease) in accrued bonuses 32 -3 2 -24 148Increase (decrease) in allowance for doubtful accounts -355 -26 4 161 –Interest and dividend income -61 -71 -86 -96 -20Interest expense 2,249 2,328 2,293 2,338 1,204Losses (gains) on sales of subsidiary shares – – -169 – –Losses (gains) on sales of shares in affiliates -1,221 – – – –Losses (gains) on sales of securities investments – -2 -11 – –Losses (gains) on disposal of fixed assets – – – – 1Losses (gains) on sales of fixed assets – – – -720 -3Impairment loss 327 – 319 27 –Valuation losses on securities investments – – 229 114 –Decrease (increase) in trading notes and receivables -468 -247 -903 925 -200Decrease (increase) in operational securities investments 1,663 3,509 11,682 343 -11Decrease (increase) in real estate for sale -8,112 -3,163 -17,447 5,342 -3,764Covid writedown of real estate for sale – – 7,487 – –Decrease (increase) in power plant for sale 996 – – – –Valuation losses on SPC capital contributions – – – 4 –Decrease (increase) in advances paid 871 -333 16 61 76Decrease (increase) in accounts receivable -10 -399 29 16 134Increase (decrease) in accounts payable 573 -332 201 -437 -630Increase (decrease) in accrued expenses -47 25 -36 94 2Increase (decrease) in advances received 30 269 -285 -57 –Increase (decrease) in security deposits received 125 -264 -169 -323 -719Other 585 1,887 600 1,550 -262Sub-Total 18,628 28,420 23,304 21,870 1,570Interest and dividend income received 61 71 86 96 20Interest expenses paid -2,231 -2,118 -2,068 -2,119 -1,104Income taxes paid and refunded -5,854 -4,610 -9,430 -4,384 -492Net Cash from (Used for) Operations 10,603 21,762 11,892 15,463 -6
© Ichigo Inc. All rights reserved.
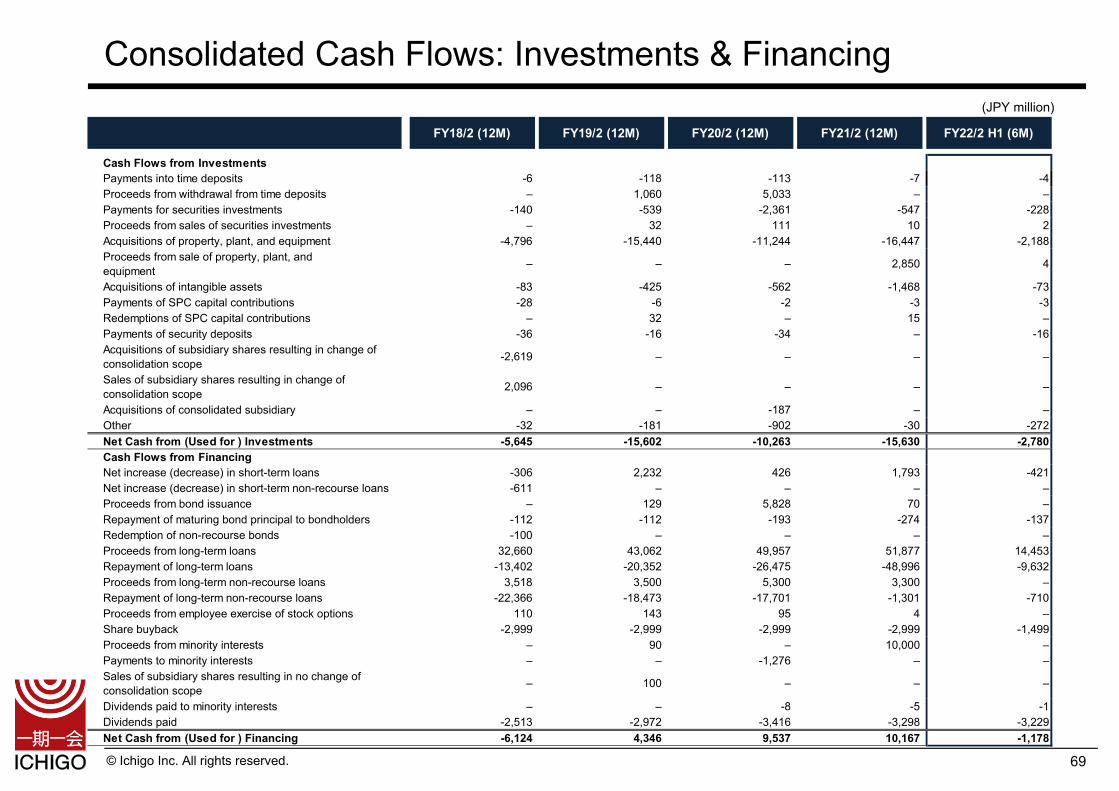
Consolidated Cash Flows: Investments & Financing
69
(JPY million)
FY18/2 (12M) FY19/2 (12M) FY20/2 (12M) FY21/2 (12M) FY22/2 H1 (6M)
Cash Flows from InvestmentsPayments into time deposits -6 -118 -113 -7 -4Proceeds from withdrawal from time deposits – 1,060 5,033 – –Payments for securities investments -140 -539 -2,361 -547 -228Proceeds from sales of securities investments – 32 111 10 2Acquisitions of property, plant, and equipment -4,796 -15,440 -11,244 -16,447 -2,188Proceeds from sale of property, plant, andequipment – – – 2,850 4
Acquisitions of intangible assets -83 -425 -562 -1,468 -73Payments of SPC capital contributions -28 -6 -2 -3 -3Redemptions of SPC capital contributions – 32 – 15 –Payments of security deposits -36 -16 -34 – -16Acquisitions of subsidiary shares resulting in change ofconsolidation scope -2,619 – – – –
Sales of subsidiary shares resulting in change ofconsolidation scope 2,096 – – – –
Acquisitions of consolidated subsidiary – – -187 – –Other -32 -181 -902 -30 -272Net Cash from (Used for ) Investments -5,645 -15,602 -10,263 -15,630 -2,780Cash Flows from FinancingNet increase (decrease) in short-term loans -306 2,232 426 1,793 -421Net increase (decrease) in short-term non-recourse loans -611 – – – –Proceeds from bond issuance – 129 5,828 70 –Repayment of maturing bond principal to bondholders -112 -112 -193 -274 -137Redemption of non-recourse bonds -100 – – – –Proceeds from long-term loans 32,660 43,062 49,957 51,877 14,453Repayment of long-term loans -13,402 -20,352 -26,475 -48,996 -9,632Proceeds from long-term non-recourse loans 3,518 3,500 5,300 3,300 –Repayment of long-term non-recourse loans -22,366 -18,473 -17,701 -1,301 -710Proceeds from employee exercise of stock options 110 143 95 4 –Share buyback -2,999 -2,999 -2,999 -2,999 -1,499Proceeds from minority interests – 90 – 10,000 –Payments to minority interests – – -1,276 – –Sales of subsidiary shares resulting in no change ofconsolidation scope – 100 – – –
Dividends paid to minority interests – – -8 -5 -1Dividends paid -2,513 -2,972 -3,416 -3,298 -3,229Net Cash from (Used for ) Financing -6,124 4,346 9,537 10,167 -1,178
© Ichigo Inc. All rights reserved.
Ichigo 2030: Ichigo as a Sustainable Infrastructure Company
70
© Ichigo Inc. All rights reserved. 71
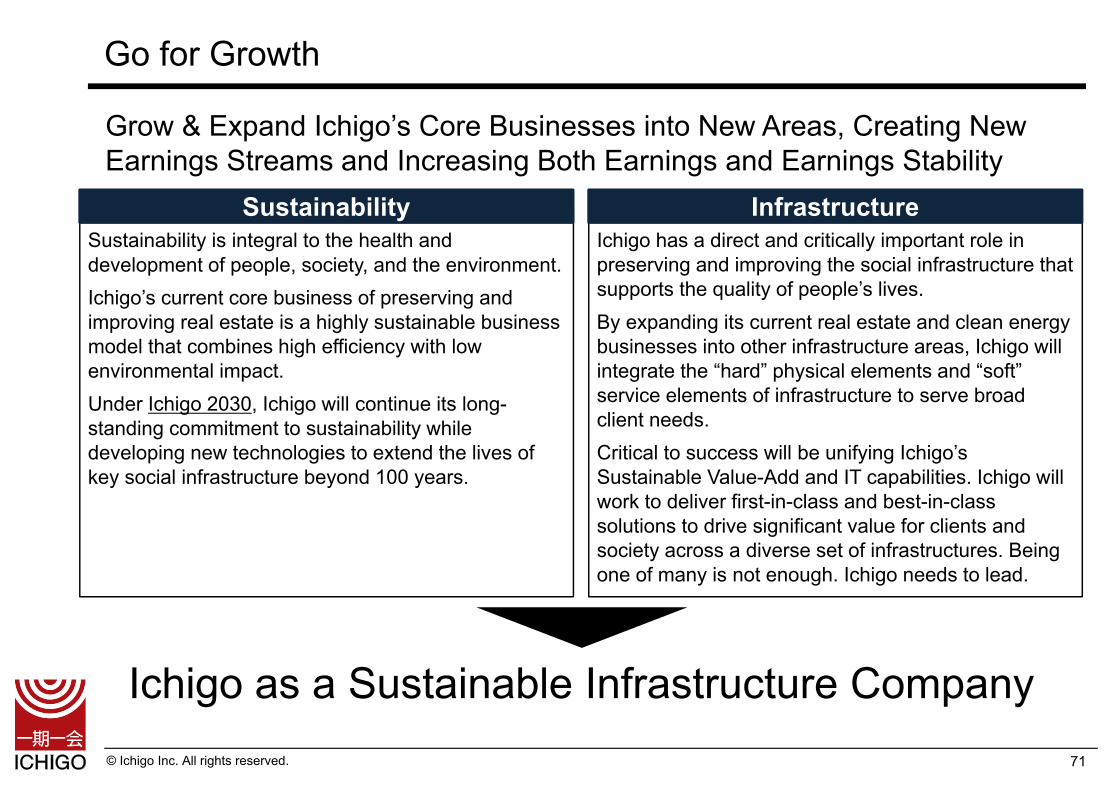
Go for Growth
Grow & Expand Ichigo’s Core Businesses into New Areas, Creating New Earnings Streams and Increasing Both Earnings and Earnings Stability
Sustainability is integral to the health and development of people, society, and the environment.Ichigo’s current core business of preserving and improving real estate is a highly sustainable business model that combines high efficiency with low environmental impact. Under Ichigo 2030, Ichigo will continue its long-standing commitment to sustainability while developing new technologies to extend the lives of key social infrastructure beyond 100 years.
Ichigo has a direct and critically important role in preserving and improving the social infrastructure that supports the quality of people’s lives. By expanding its current real estate and clean energy businesses into other infrastructure areas, Ichigo will integrate the “hard” physical elements and “soft” service elements of infrastructure to serve broad client needs.Critical to success will be unifying Ichigo’s Sustainable Value-Add and IT capabilities. Ichigo will work to deliver first-in-class and best-in-class solutions to drive significant value for clients and society across a diverse set of infrastructures. Being one of many is not enough. Ichigo needs to lead.
Ichigo as a Sustainable Infrastructure Company
Sustainability Infrastructure
© Ichigo Inc. All rights reserved. 72
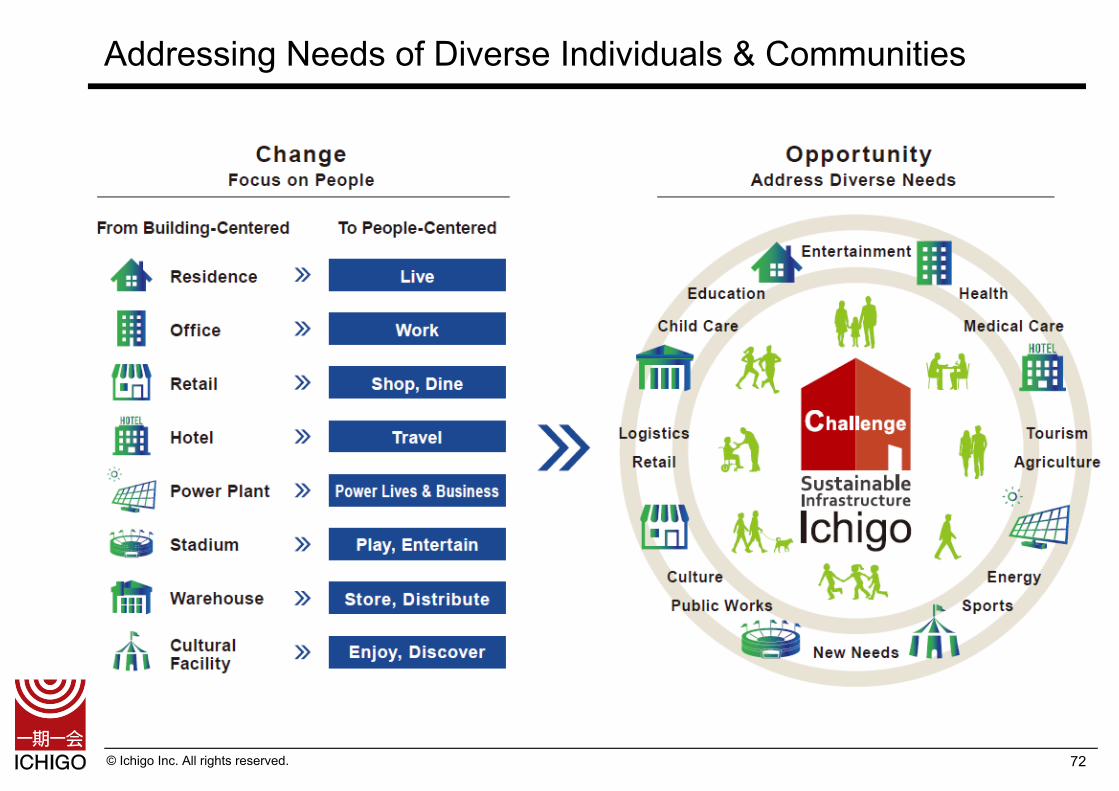
Addressing Needs of Diverse Individuals & Communities
© Ichigo Inc. All rights reserved. 73
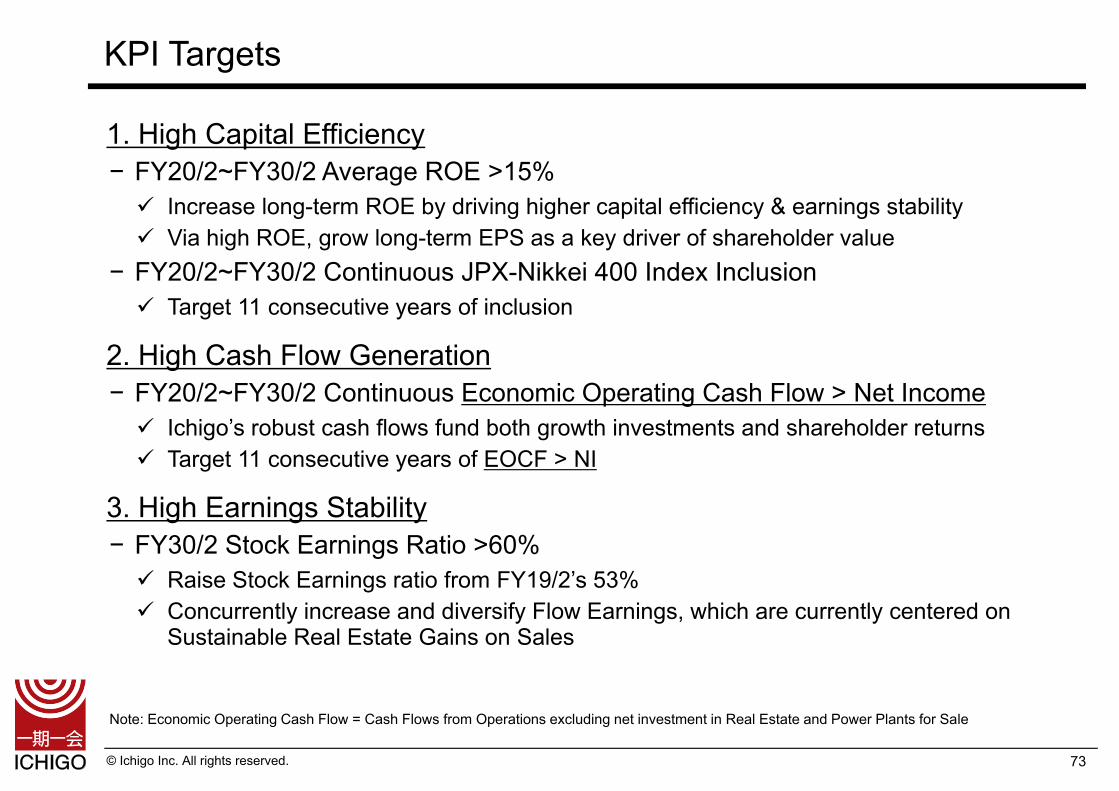
KPI Targets
1. High Capital Efficiency− FY20/2~FY30/2 Average ROE >15% Increase long-term ROE by driving higher capital efficiency & earnings stability Via high ROE, grow long-term EPS as a key driver of shareholder value
− FY20/2~FY30/2 Continuous JPX-Nikkei 400 Index Inclusion Target 11 consecutive years of inclusion
2. High Cash Flow Generation− FY20/2~FY30/2 Continuous Economic Operating Cash Flow > Net Income Ichigo’s robust cash flows fund both growth investments and shareholder returns Target 11 consecutive years of EOCF > NI
3. High Earnings Stability− FY30/2 Stock Earnings Ratio >60% Raise Stock Earnings ratio from FY19/2’s 53% Concurrently increase and diversify Flow Earnings, which are currently centered on
Sustainable Real Estate Gains on Sales
Note: Economic Operating Cash Flow = Cash Flows from Operations excluding net investment in Real Estate and Power Plants for Sale
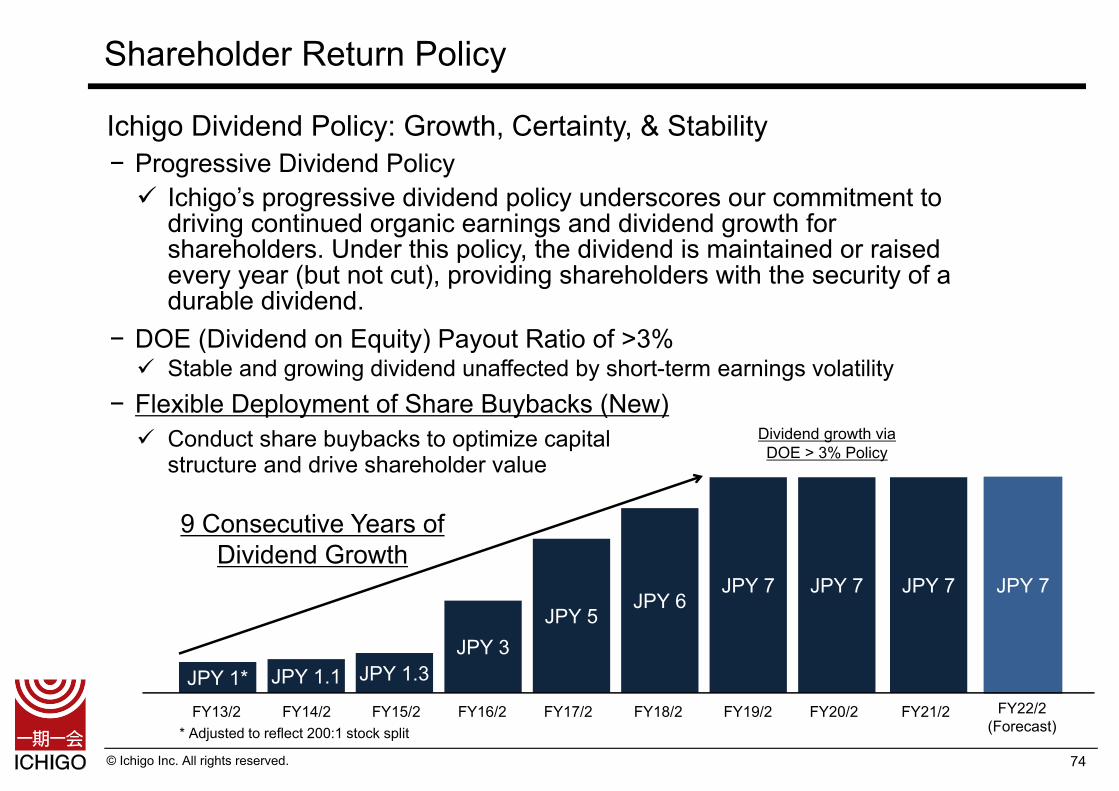
© Ichigo Inc. All rights reserved.
Shareholder Return Policy
Ichigo Dividend Policy: Growth, Certainty, & Stability− Progressive Dividend Policy Ichigo’s progressive dividend policy underscores our commitment to
driving continued organic earnings and dividend growth for shareholders. Under this policy, the dividend is maintained or raised every year (but not cut), providing shareholders with the security of a durable dividend.
− DOE (Dividend on Equity) Payout Ratio of >3% Stable and growing dividend unaffected by short-term earnings volatility
74
JPY 6
FY14/2 FY15/2 FY16/2
JPY 5JPY 3
JPY 1.3JPY 1.1JPY 1*
* Adjusted to reflect 200:1 stock split
JPY 7 JPY 7
9 Consecutive Years of Dividend Growth
Dividend growth via DOE > 3% Policy
− Flexible Deployment of Share Buybacks (New) Conduct share buybacks to optimize capital
structure and drive shareholder value
FY13/2 FY18/2 FY19/2 FY20/2FY17/2 FY22/2(Forecast)
JPY 7JPY 7
FY21/2
© Ichigo Inc. All rights reserved.
Ichigo 2030: New Initiatives
75
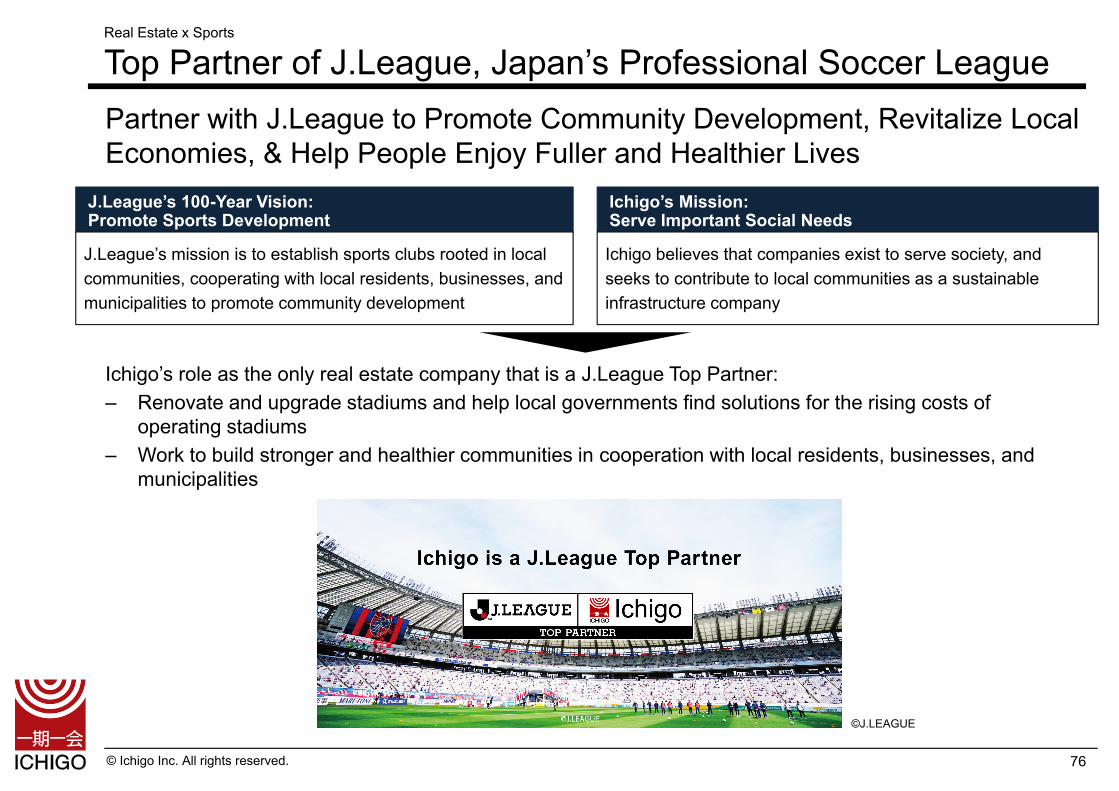
© Ichigo Inc. All rights reserved.
Partner with J.League to Promote Community Development, Revitalize Local Economies, & Help People Enjoy Fuller and Healthier Lives
76
Real Estate x Sports
Top Partner of J.League, Japan’s Professional Soccer League
J.League’s 100-Year Vision: Promote Sports Development
Ichigo’s Mission: Serve Important Social Needs
J.League’s mission is to establish sports clubs rooted in local communities, cooperating with local residents, businesses, and municipalities to promote community development
Ichigo believes that companies exist to serve society, and seeks to contribute to local communities as a sustainable infrastructure company
Ichigo’s role as the only real estate company that is a J.League Top Partner:– Renovate and upgrade stadiums and help local governments find solutions for the rising costs of
operating stadiums– Work to build stronger and healthier communities in cooperation with local residents, businesses, and
municipalities
©J.LEAGUE
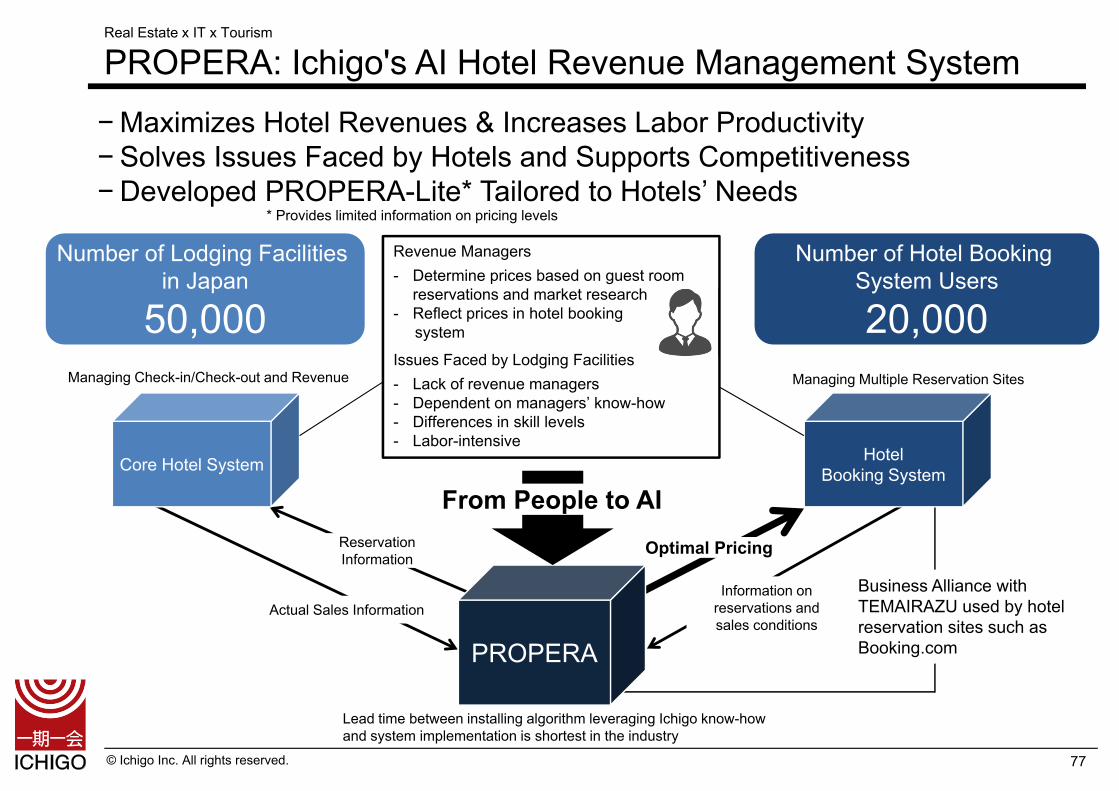
© Ichigo Inc. All rights reserved. 77
−Maximizes Hotel Revenues & Increases Labor Productivity−Solves Issues Faced by Hotels and Supports Competitiveness−Developed PROPERA-Lite* Tailored to Hotels’ Needs
Revenue Managers- Determine prices based on guest room
reservations and market research- Reflect prices in hotel booking
system
Issues Faced by Lodging Facilities- Lack of revenue managers- Dependent on managers’ know-how - Differences in skill levels- Labor-intensive
Managing Check-in/Check-out and Revenue Managing Multiple Reservation Sites
Lead time between installing algorithm leveraging Ichigo know-how and system implementation is shortest in the industry
Optimal Pricing
Core Hotel System
Information on reservations and sales conditions
Reservation Information
Actual Sales Information
Number of Lodging Facilities in Japan
50,000
Number of Hotel Booking System Users
20,000
Business Alliance with TEMAIRAZU used by hotel reservation sites such as Booking.com
HotelBooking System
PROPERA
From People to AI
* Provides limited information on pricing levels
Real Estate x IT x Tourism
PROPERA: Ichigo's AI Hotel Revenue Management System
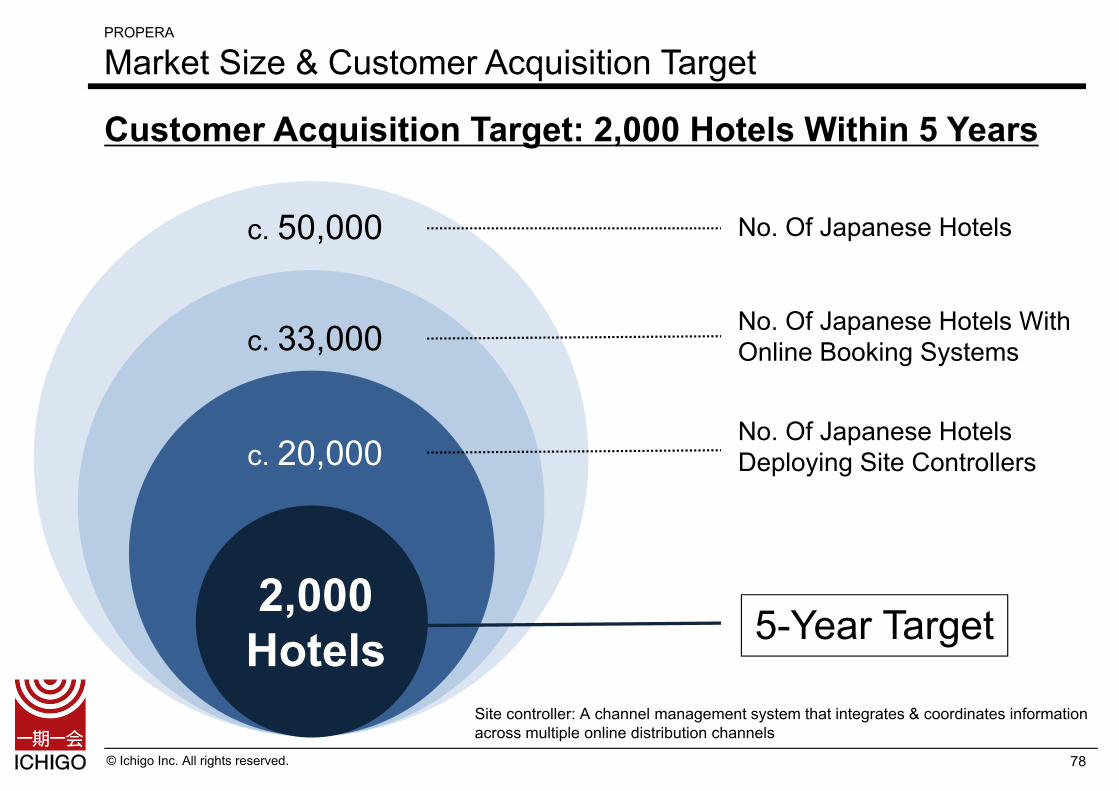
© Ichigo Inc. All rights reserved.
PROPERA
Market Size & Customer Acquisition Target
78
c. 33,000
c. 20,000
2,000Hotels
c. 50,000
Customer Acquisition Target: 2,000 Hotels Within 5 Years
No. Of Japanese Hotels With Online Booking Systems
No. Of Japanese Hotels Deploying Site Controllers
5-Year Target
Site controller: A channel management system that integrates & coordinates information across multiple online distribution channels
No. Of Japanese Hotels
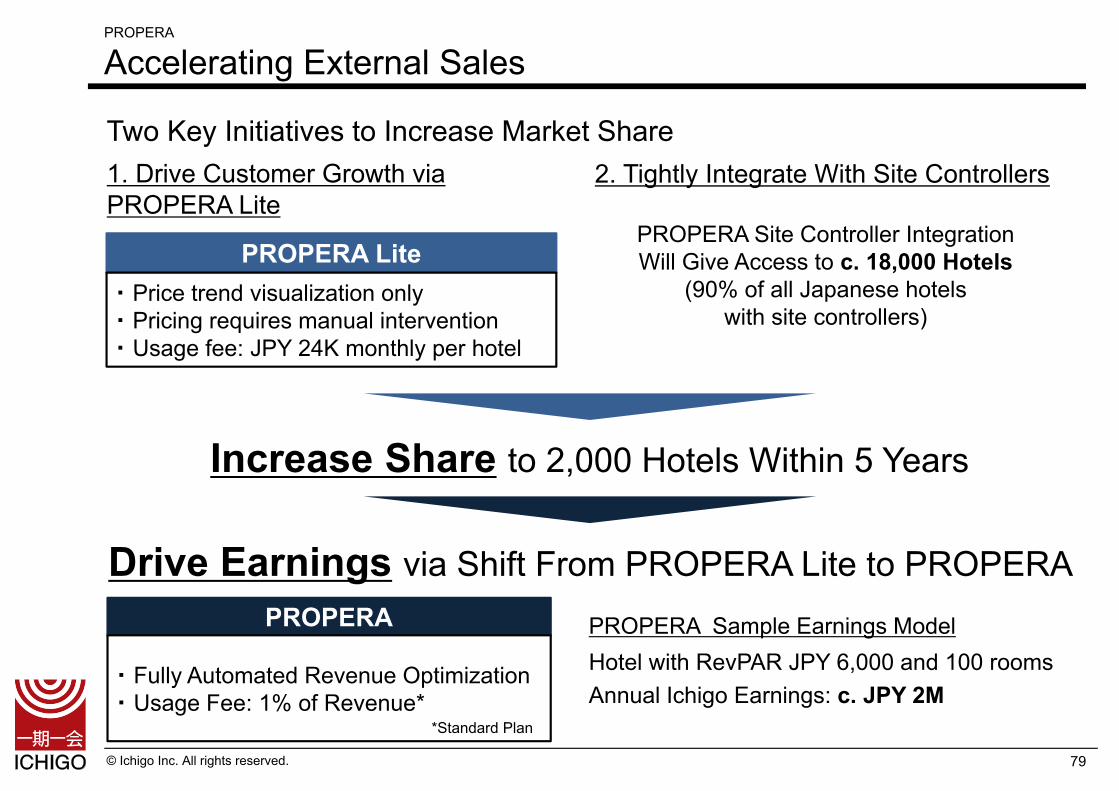
© Ichigo Inc. All rights reserved.
Two Key Initiatives to Increase Market Share1. Drive Customer Growth via PROPERA Lite
PROPERA Site Controller IntegrationWill Give Access to c. 18,000 Hotels
(90% of all Japanese hotels with site controllers)
Drive Earnings via Shift From PROPERA Lite to PROPERA PROPERA Sample Earnings ModelHotel with RevPAR JPY 6,000 and 100 roomsAnnual Ichigo Earnings: c. JPY 2M
PROPERA Lite・ Price trend visualization only・ Pricing requires manual intervention・ Usage fee: JPY 24K monthly per hotel
PROPERA
・ Fully Automated Revenue Optimization・ Usage Fee: 1% of Revenue*
*Standard Plan
Increase Share to 2,000 Hotels Within 5 Years
PROPERA
Accelerating External Sales
79
2. Tightly Integrate With Site Controllers
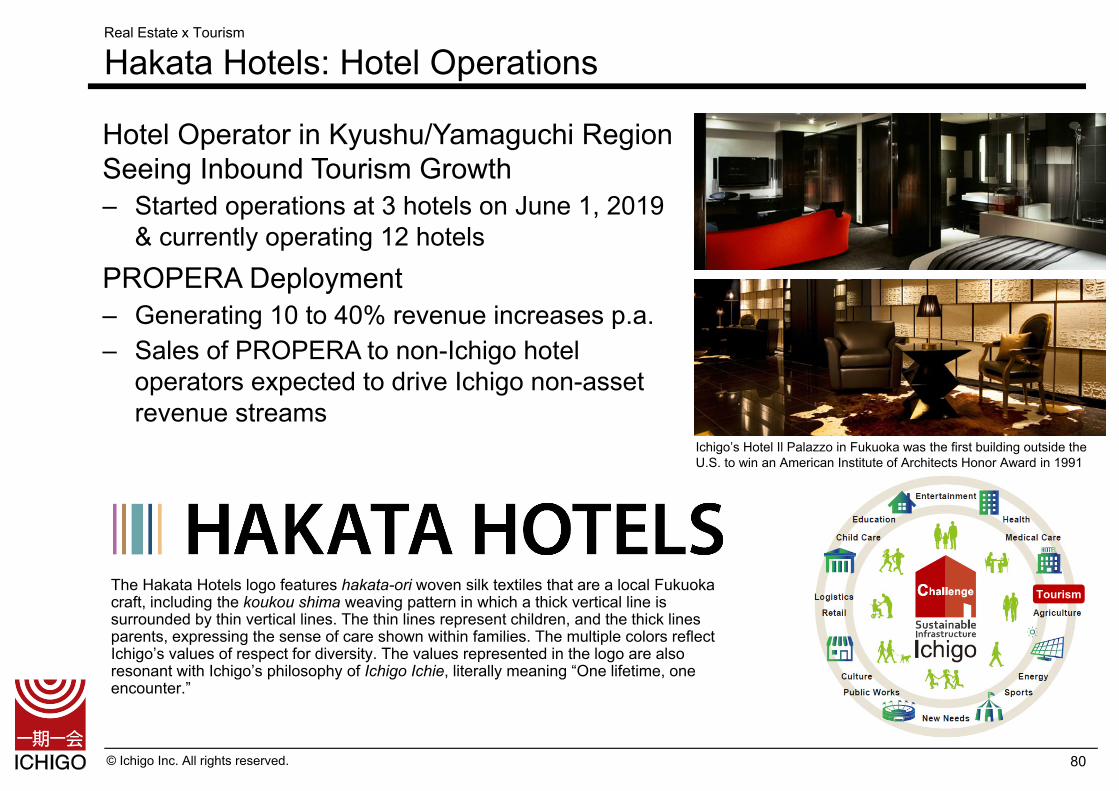
© Ichigo Inc. All rights reserved. 80
Real Estate x Tourism
Hakata Hotels: Hotel Operations
Hotel Operator in Kyushu/Yamaguchi Region Seeing Inbound Tourism Growth– Started operations at 3 hotels on June 1, 2019
& currently operating 12 hotelsPROPERA Deployment– Generating 10 to 40% revenue increases p.a.– Sales of PROPERA to non-Ichigo hotel
operators expected to drive Ichigo non-asset revenue streams
The Hakata Hotels logo features hakata-ori woven silk textiles that are a local Fukuoka craft, including the koukou shima weaving pattern in which a thick vertical line is surrounded by thin vertical lines. The thin lines represent children, and the thick lines parents, expressing the sense of care shown within families. The multiple colors reflect Ichigo’s values of respect for diversity. The values represented in the logo are also resonant with Ichigo’s philosophy of Ichigo Ichie, literally meaning “One lifetime, one encounter.”
Ichigo’s Hotel Il Palazzo in Fukuoka was the first building outside the U.S. to win an American Institute of Architects Honor Award in 1991
Tourism
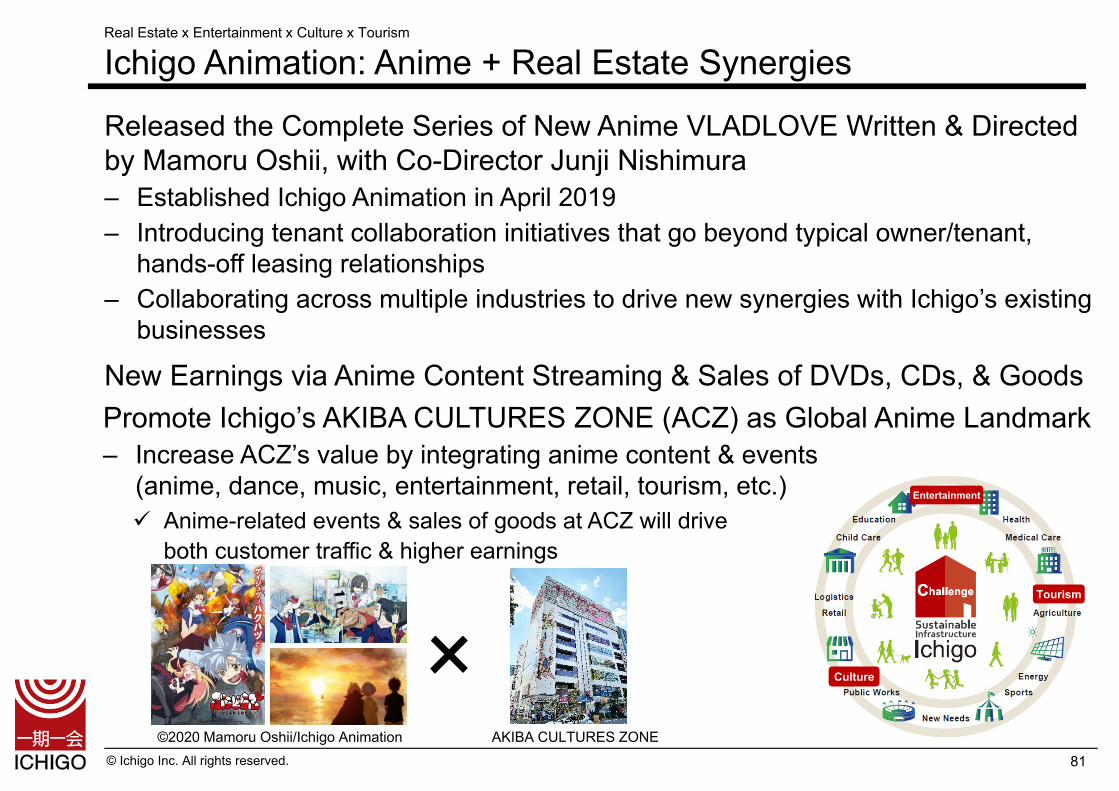
© Ichigo Inc. All rights reserved.
Released the Complete Series of New Anime VLADLOVE Written & Directed by Mamoru Oshii, with Co-Director Junji Nishimura– Established Ichigo Animation in April 2019– Introducing tenant collaboration initiatives that go beyond typical owner/tenant,
hands-off leasing relationships– Collaborating across multiple industries to drive new synergies with Ichigo’s existing
businesses
New Earnings via Anime Content Streaming & Sales of DVDs, CDs, & GoodsPromote Ichigo’s AKIBA CULTURES ZONE (ACZ) as Global Anime Landmark– Increase ACZ’s value by integrating anime content & events
(anime, dance, music, entertainment, retail, tourism, etc.) Anime-related events & sales of goods at ACZ will drive
both customer traffic & higher earnings
AKIBA CULTURES ZONE©2020 Mamoru Oshii/Ichigo Animation
×
Real Estate x Entertainment x Culture x Tourism
Ichigo Animation: Anime + Real Estate Synergies
Tourism
Culture
Entertainment
81
© Ichigo Inc. All rights reserved.
These materials were prepared to explain Ichigo’s businesses and are not for the purpose of soliciting investment in marketable securities issued by Ichigo. Ichigo does not guarantee the accuracy of the figures, information, estimates, or other statements included herein, and accepts no responsibility for damages or losses arising through the use of the figures, information, estimates, or other statements contained herein.
These materials are based upon information available as of the publication date, and may contain forward-looking statements pertaining to Ichigo’s expectations, targets, plans, and strategies. Such forward-looking statements are not facts, but are the result of management’s judgment based on information currently available. Actual operating results or developments concerning Ichigo may differ substantially from those indicated by forward-looking statements. The information enclosed is subject to revision without prior notice.
This document is a translation. If there is any discrepancy between the Japanese version and the English translation, the Japanese version shall prevail.
Contact:Ichigo (TSE First Section 2337)Investor Relations
TEL: +81-3-3502-4818E-mail: [email protected]/en
82
Ichigo is Japan’s first zero-carbon listed real estate company. We are taking responsibility for our environmental footprint by offsetting our carbon emissions and investing in low-carbon technologies such as solar energy.
Make The WorldMore Sustainable