Embed Size (px)
Citation preview
June 16-17, 2016
OPEN – FIN – 1-14
June 16-17, 2016
OPEN – FIN – 1-14
University of MissouriBoard of Curators
June 16, 2016Finance Committee
FY2017 Operating BudgetUM
June 16-17, 2016
OPEN – FIN – 1-15
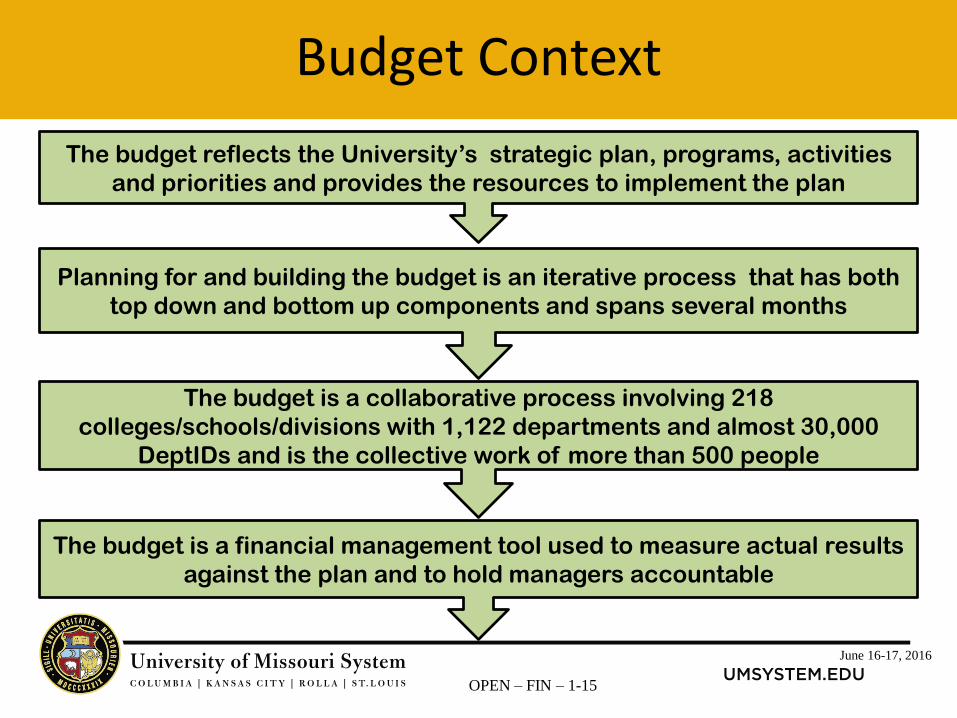
Planning for and building the budget is an iterative process that has both
top down and bottom up components and spans several months
The budget is a collaborative process involving 218
colleges/schools/divisions with 1,122 departments and almost 30,000
DeptIDs and is the collective work of more than 500 people
The budget is a financial management tool used to measure actual results
against the plan and to hold managers accountable
The budget reflects the University’s strategic plan, programs, activities
and priorities and provides the resources to implement the plan
Budget Context
June 16-17, 2016
OPEN – FIN – 1-16
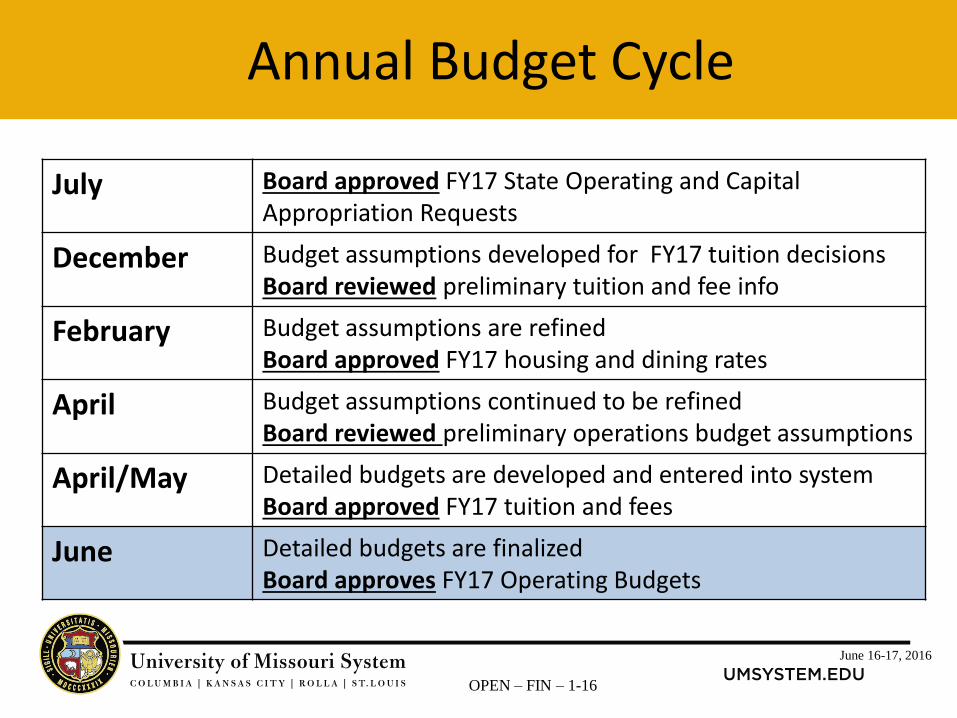
Annual Budget Cycle
July Board approved FY17 State Operating and Capital Appropriation Requests
December Budget assumptions developed for FY17 tuition decisionsBoard reviewed preliminary tuition and fee info
February Budget assumptions are refinedBoard approved FY17 housing and dining rates
April Budget assumptions continued to be refinedBoard reviewed preliminary operations budget assumptions
April/May Detailed budgets are developed and entered into systemBoard approved FY17 tuition and fees
June Detailed budgets are finalizedBoard approves FY17 Operating Budgets
June 16-17, 2016
OPEN – FIN – 1-17
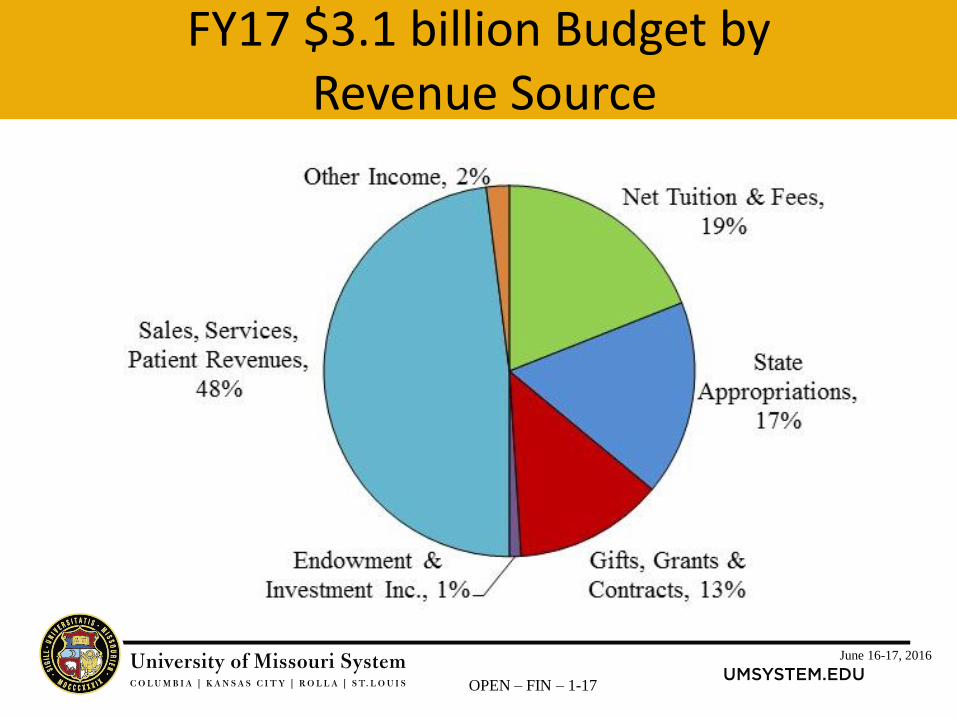
FY17 $3.1 billion Budget byRevenue Source
June 16-17, 2016
OPEN – FIN – 1-18
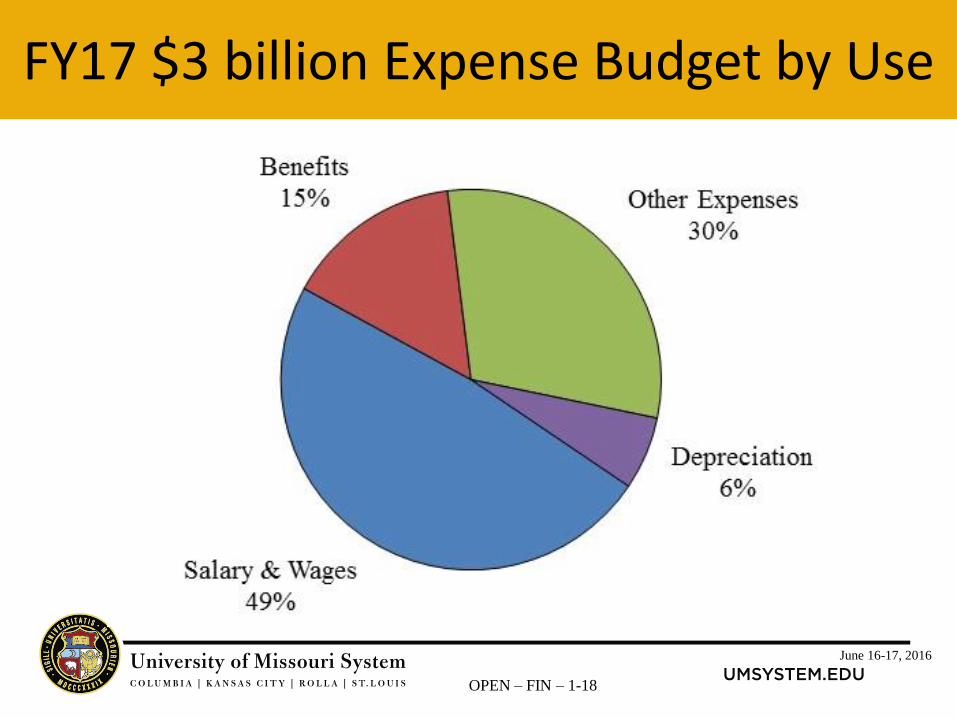
FY17 $3 billion Expense Budget by Use
June 16-17, 2016
OPEN – FIN – 1-19
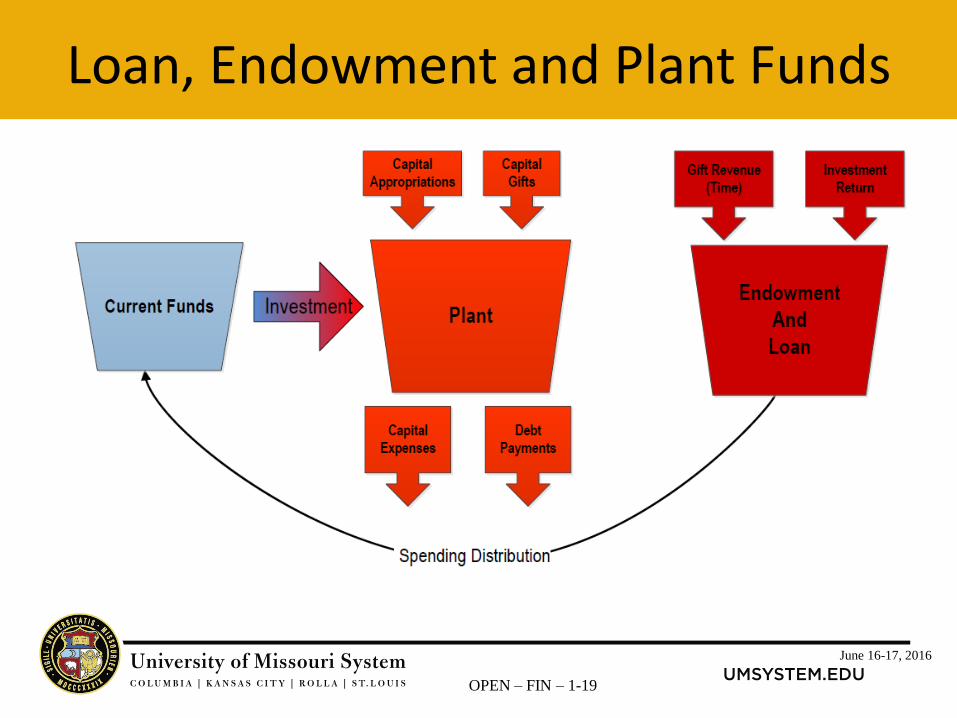
Loan, Endowment and Plant Funds
June 16-17, 2016
OPEN – FIN – 1-20
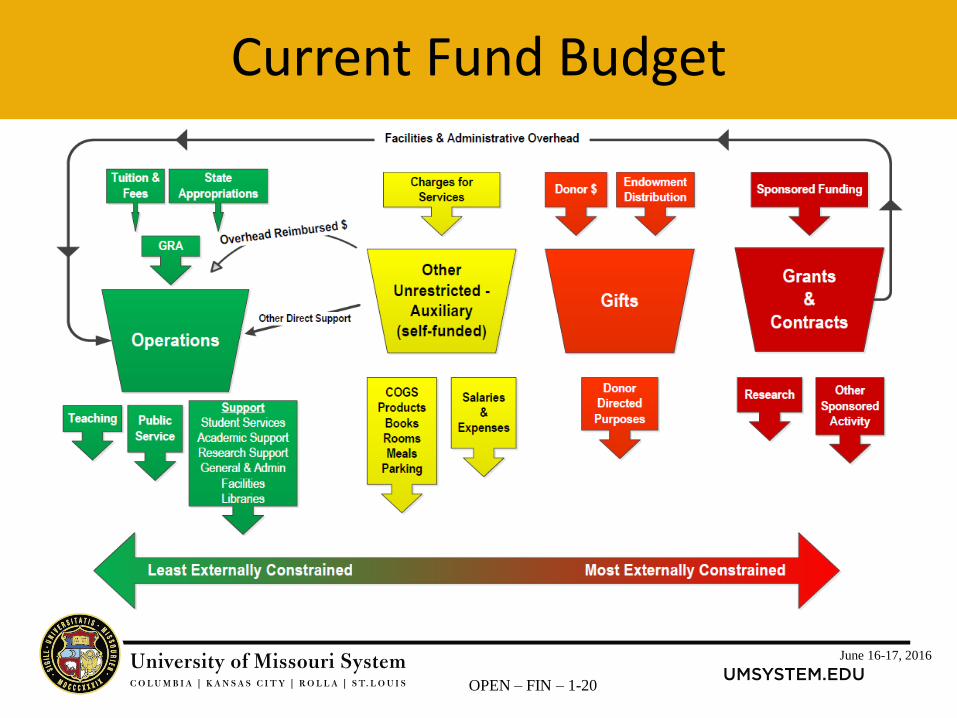
Current Fund Budget
June 16-17, 2016
OPEN – FIN – 1-21
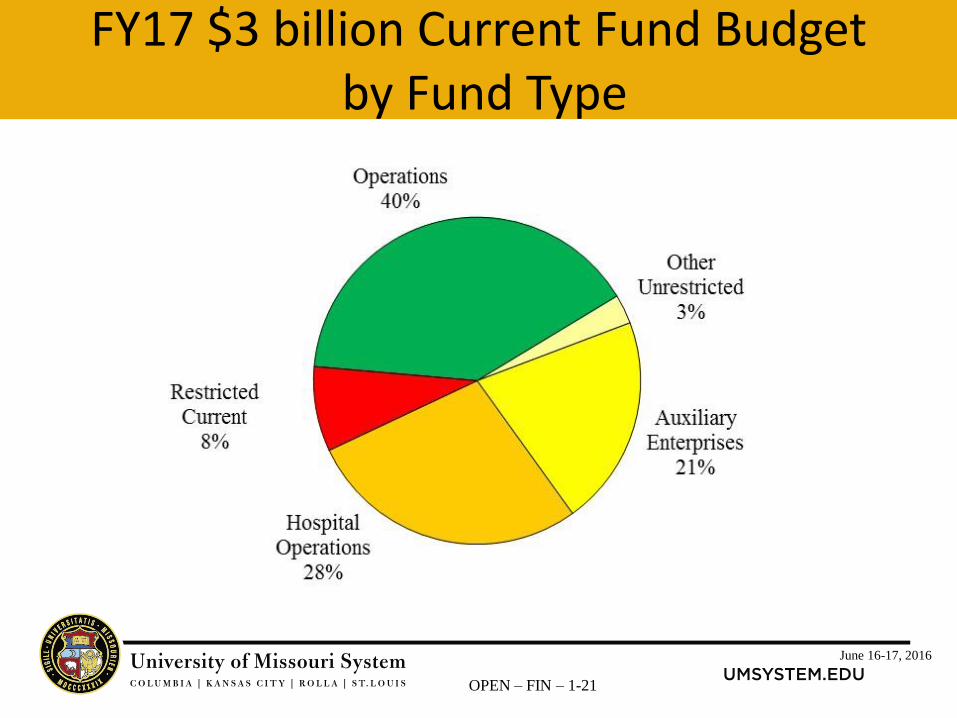
FY17 $3 billion Current Fund Budgetby Fund Type
June 16-17, 2016
OPEN – FIN – 1-22
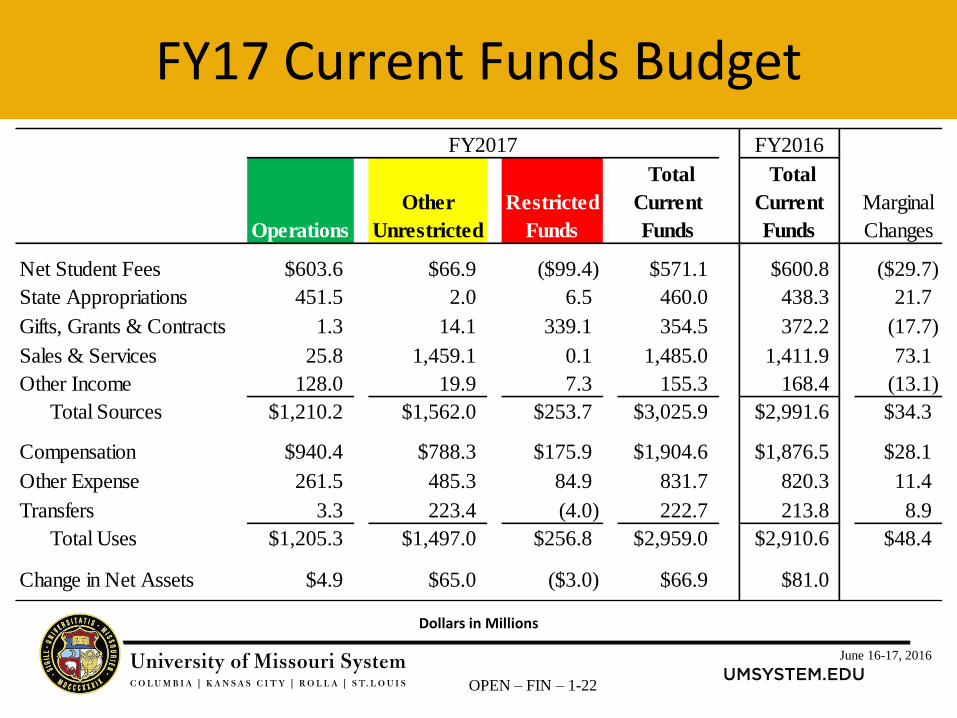
FY17 Current Funds Budget
Dollars in Millions
FY2016
Operations
Other
Unrestricted
Restricted
Funds
Total
Current
Funds
Total
Current
Funds
Marginal
Changes
Net Student Fees $603.6 $66.9 ($99.4) $571.1 $600.8 ($29.7)
State Appropriations 451.5 2.0 6.5 460.0 438.3 21.7
Gifts, Grants & Contracts 1.3 14.1 339.1 354.5 372.2 (17.7)
Sales & Services 25.8 1,459.1 0.1 1,485.0 1,411.9 73.1
Other Income 128.0 19.9 7.3 155.3 168.4 (13.1)
Total Sources $1,210.2 $1,562.0 $253.7 $3,025.9 $2,991.6 $34.3
Compensation $940.4 $788.3 $175.9 $1,904.6 $1,876.5 $28.1
Other Expense 261.5 485.3 84.9 831.7 820.3 11.4
Transfers 3.3 223.4 (4.0) 222.7 213.8 8.9
Total Uses $1,205.3 $1,497.0 $256.8 $2,959.0 $2,910.6 $48.4
Change in Net Assets $4.9 $65.0 ($3.0) $66.9 $81.0
FY2017
June 16-17, 2016
OPEN – FIN – 1-23
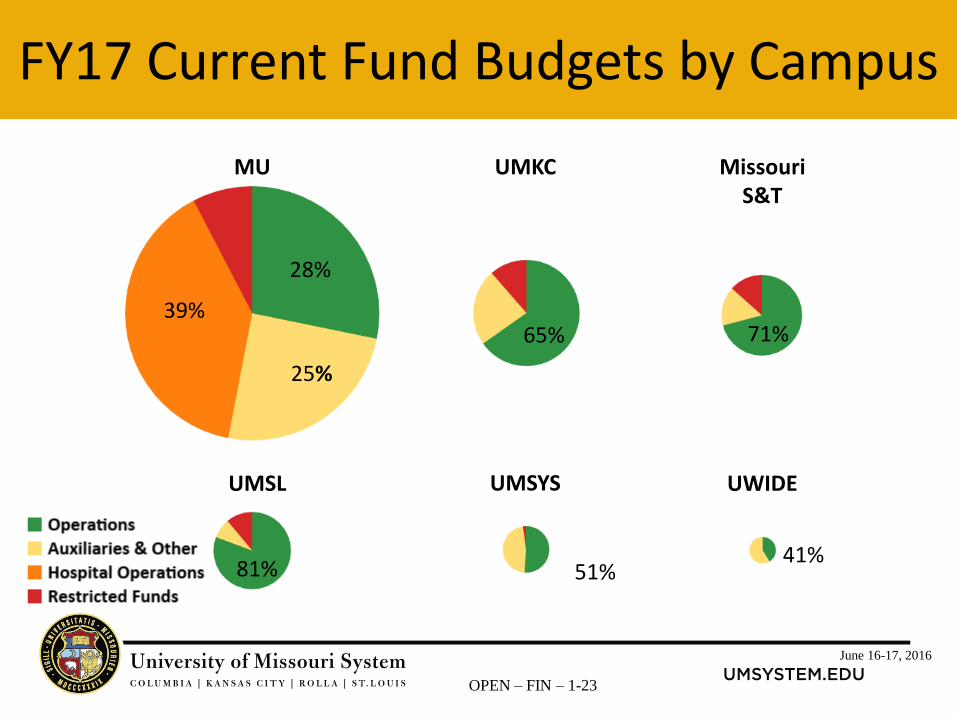
FY17 Current Fund Budgets by Campus
MU Missouri S&T
UMKC
UMSYSUMSL UWIDE
39%
28%
25%
65% 71%
81%41%
51%
June 16-17, 2016
OPEN – FIN – 1-24
Focus on the Operations Fund Budget
• Operations Fund is 39% of the total budget and 40% of the current budget.
• Operating state appropriations and tuition and fees are recorded in the operations fund.
• Instruction and public service as well as the supporting services for the total budget are primarily funded from operations.
• Operations has the most discretionary funds.
June 16-17, 2016
OPEN – FIN – 1-25
Focus on the Operations Fund Budget
• Auxiliary and other self-supporting units are required to expend within the revenues generated, including funding their capital reinvestment.
• Restricted expenditures are directed by donors or granting agencies, laws, and policies.
• Capital expenditures are approved by the Board through the capital plans and on a project by project basis for major projects.
• Endowment funds are invested and distributed according to Board policy.
June 16-17, 2016
OPEN – FIN – 1-26
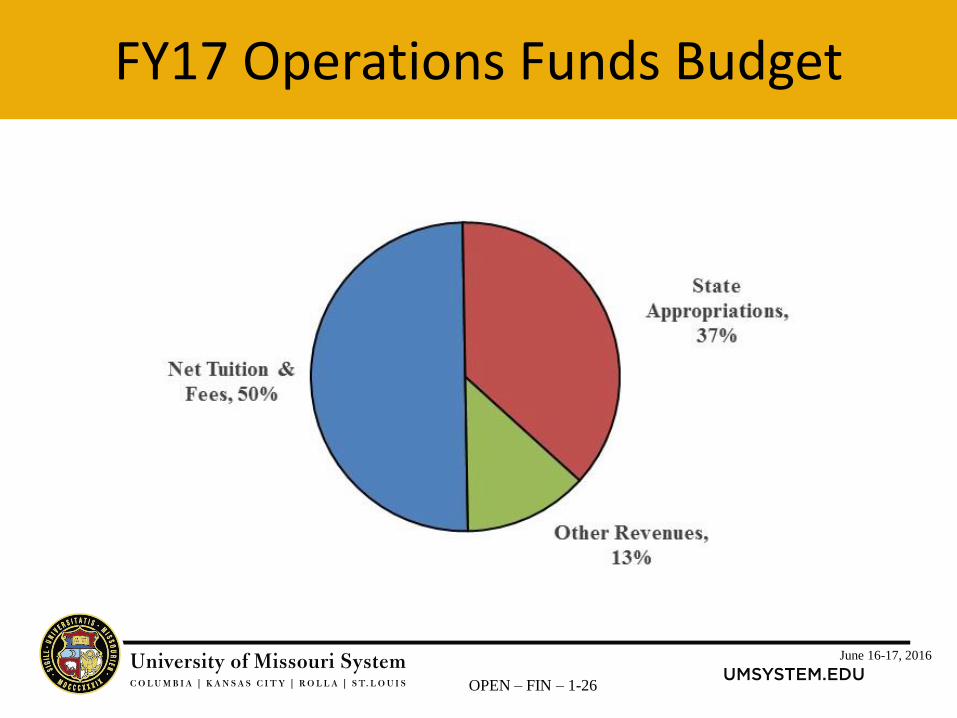
FY17 Operations Funds Budget
June 16-17, 2016
OPEN – FIN – 1-27
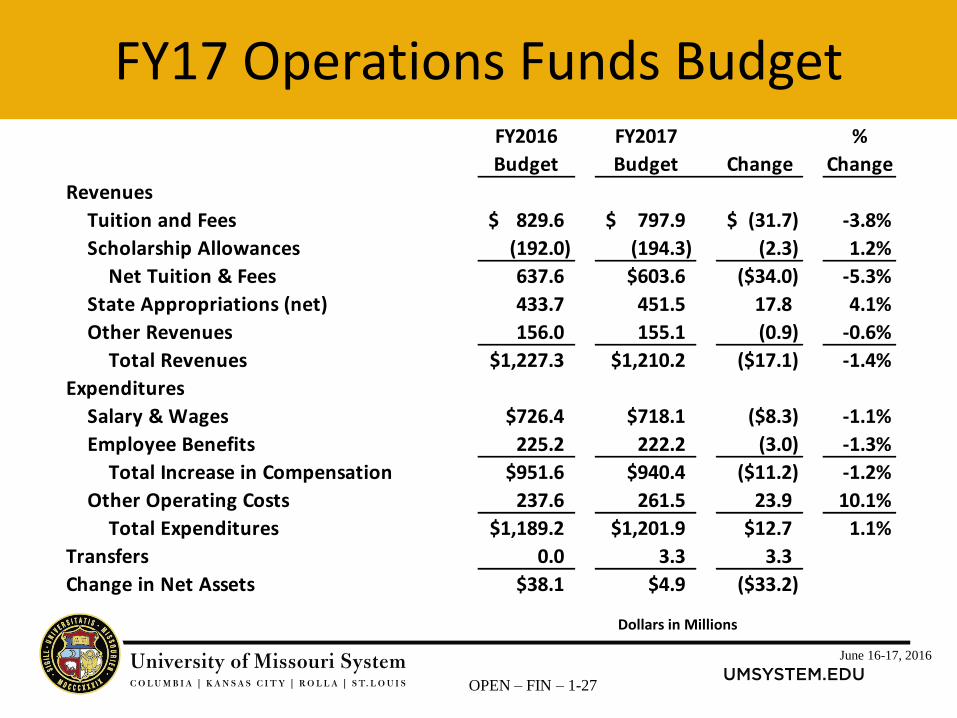
FY17 Operations Funds Budget
Dollars in Millions
FY2016 FY2017 %
Budget Budget Change Change
Revenues
Tuition and Fees 829.6$ 797.9$ (31.7)$ -3.8%
Scholarship Allowances (192.0) (194.3) (2.3) 1.2%
Net Tuition & Fees 637.6 $603.6 ($34.0) -5.3%
State Appropriations (net) 433.7 451.5 17.8 4.1%
Other Revenues 156.0 155.1 (0.9) -0.6%
Total Revenues $1,227.3 $1,210.2 ($17.1) -1.4%
Expenditures
Salary & Wages $726.4 $718.1 ($8.3) -1.1%
Employee Benefits 225.2 222.2 (3.0) -1.3%
Total Increase in Compensation $951.6 $940.4 ($11.2) -1.2%
Other Operating Costs 237.6 261.5 23.9 10.1%
Total Expenditures $1,189.2 $1,201.9 $12.7 1.1%
Transfers 0.0 3.3 3.3
Change in Net Assets $38.1 $4.9 ($33.2)
June 16-17, 2016
OPEN – FIN – 1-28
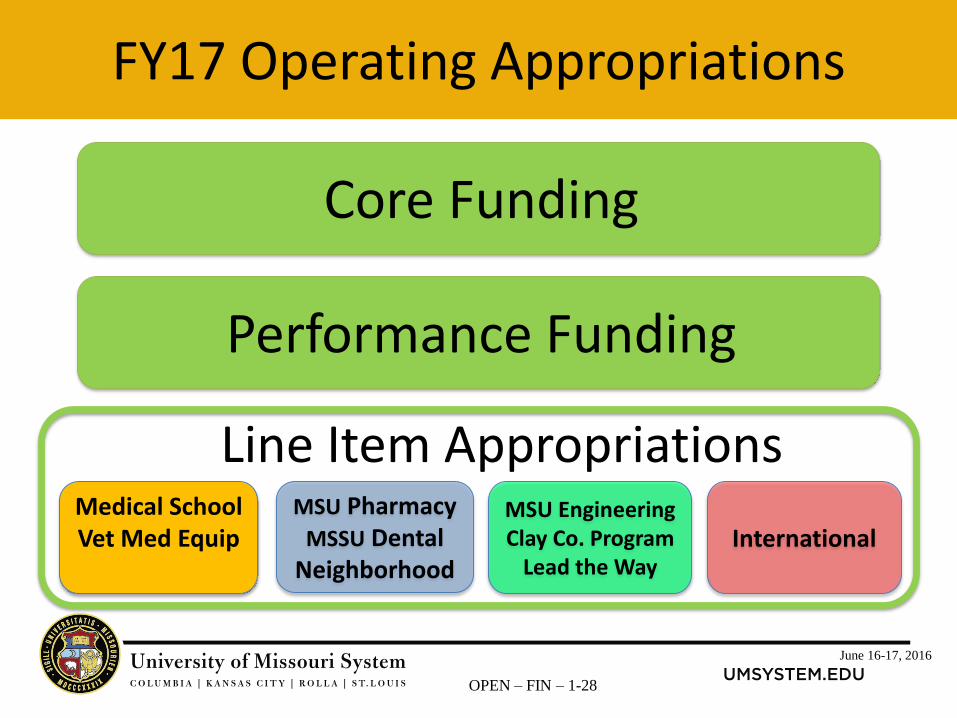
FY17 Operating Appropriations
Core Funding
Performance Funding
Medical SchoolVet Med Equip
MSU PharmacyMSSU Dental
Neighborhood
MSU EngineeringClay Co. Program
Lead the WayInternational
Line Item Appropriations
June 16-17, 2016
OPEN – FIN – 1-29
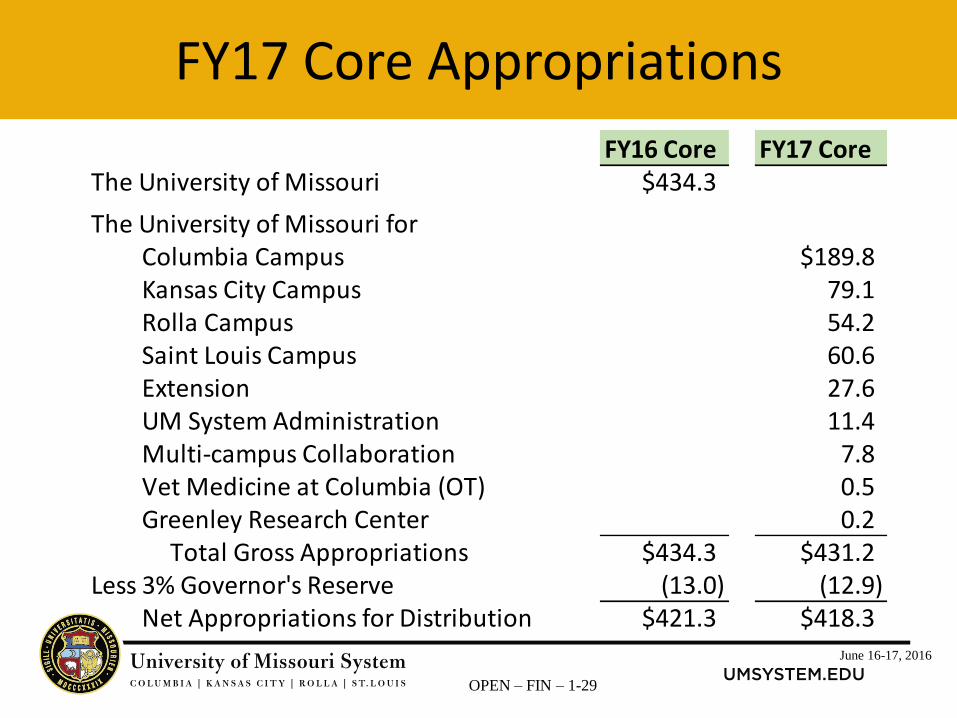
FY17 Core Appropriations
FY16 Core FY17 CoreThe University of Missouri $434.3
The University of Missouri for Columbia Campus $189.8 Kansas City Campus 79.1 Rolla Campus 54.2 Saint Louis Campus 60.6 Extension 27.6 UM System Administration 11.4 Multi-campus Collaboration 7.8 Vet Medicine at Columbia (OT) 0.5 Greenley Research Center 0.2 Total Gross Appropriations $434.3 $431.2Less 3% Governor's Reserve (13.0) (12.9) Net Appropriations for Distribution $421.3 $418.3
June 16-17, 2016
OPEN – FIN – 1-30
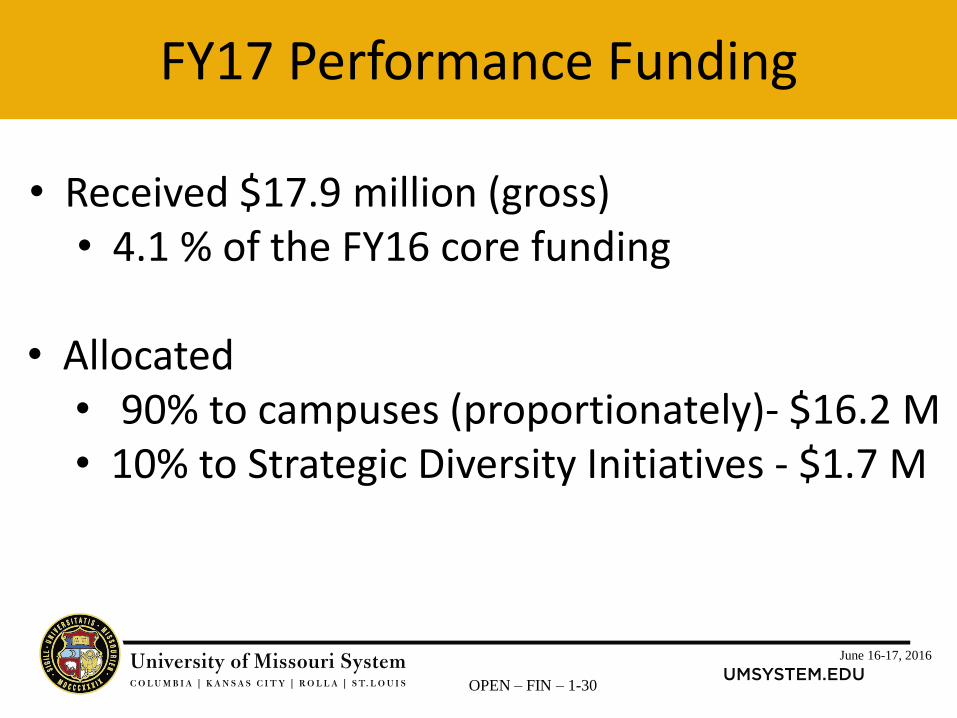
FY17 Performance Funding
• Received $17.9 million (gross)• 4.1 % of the FY16 core funding
• Allocated• 90% to campuses (proportionately)- $16.2 M • 10% to Strategic Diversity Initiatives - $1.7 M
June 16-17, 2016
OPEN – FIN – 1-31
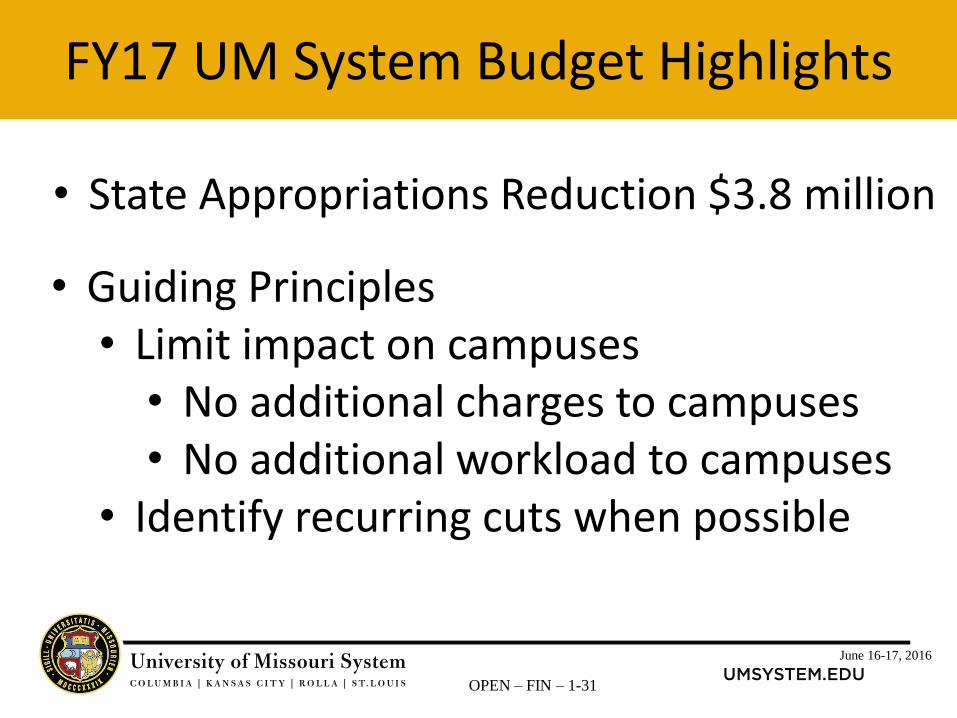
FY17 UM System Budget Highlights
• State Appropriations Reduction $3.8 million
• Guiding Principles• Limit impact on campuses
• No additional charges to campuses• No additional workload to campuses
• Identify recurring cuts when possible
June 16-17, 2016
OPEN – FIN – 1-32
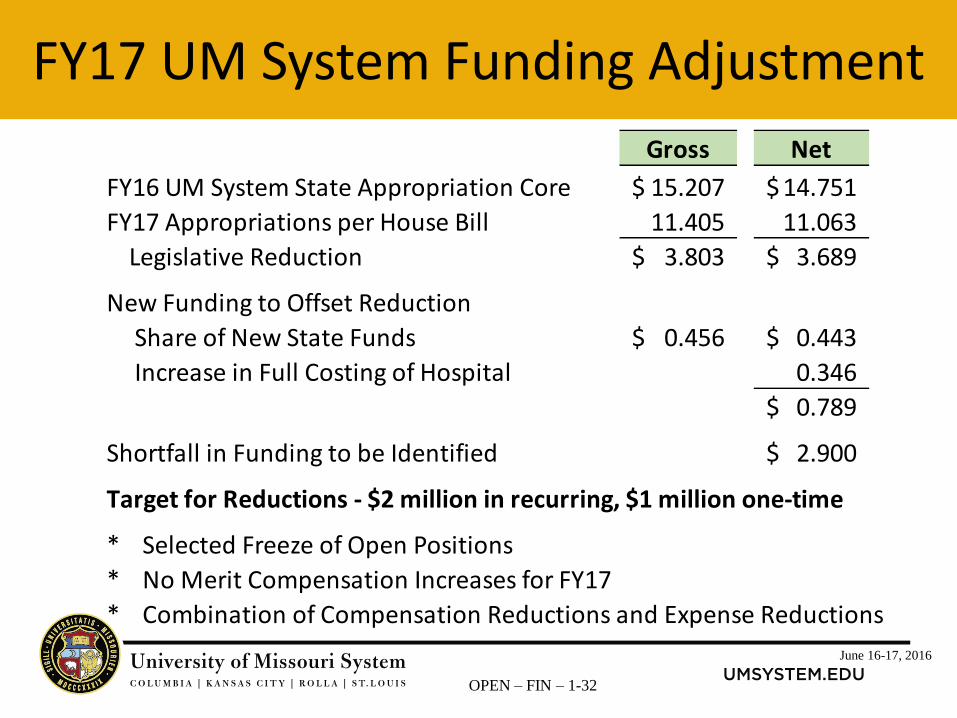
FY17 UM System Funding Adjustment
Gross Net
FY16 UM System State Appropriation Core 15.207$ 14.751$
FY17 Appropriations per House Bill 11.405 11.063
Legislative Reduction 3.803$ 3.689$
New Funding to Offset Reduction
Share of New State Funds 0.456$ 0.443$
Increase in Full Costing of Hospital 0.346
0.789$
Shortfall in Funding to be Identified 2.900$
Target for Reductions - $2 million in recurring, $1 million one-time
* Selected Freeze of Open Positions
* No Merit Compensation Increases for FY17
* Combination of Compensation Reductions and Expense Reductions
June 16-17, 2016
OPEN – FIN – 1-33
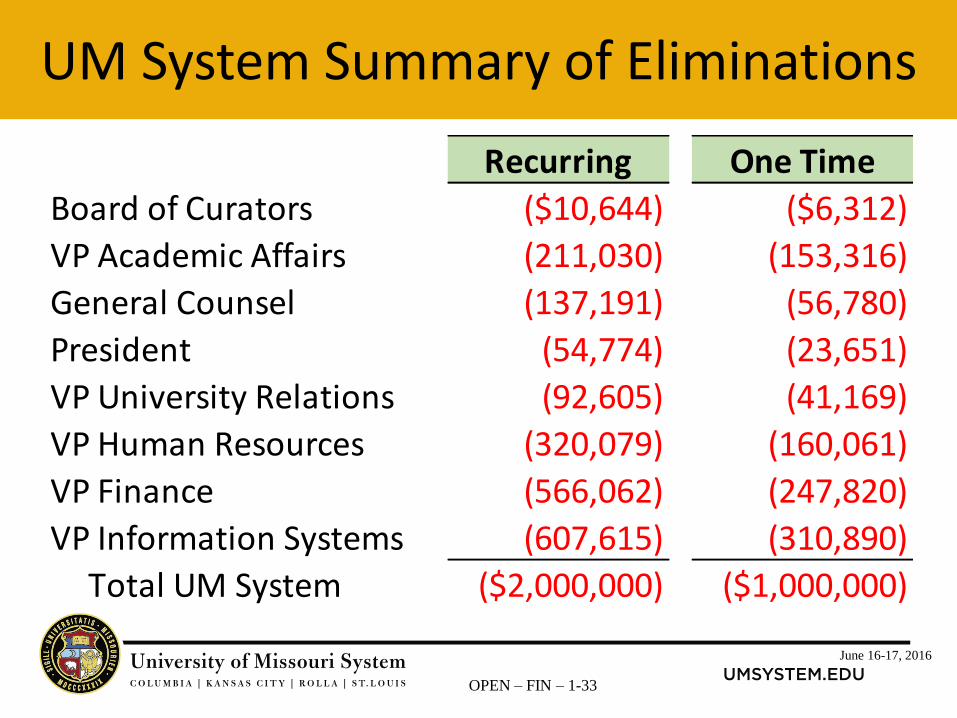
UM System Summary of Eliminations
One Time
Board of Curators ($10,644) ($6,312)
VP Academic Affairs (211,030) (153,316)
General Counsel (137,191) (56,780)
President (54,774) (23,651)
VP University Relations (92,605) (41,169)
VP Human Resources (320,079) (160,061)
VP Finance (566,062) (247,820)
VP Information Systems (607,615) (310,890)
Total UM System ($2,000,000) ($1,000,000)
Recurring
June 16-17, 2016
OPEN – FIN – 1-34
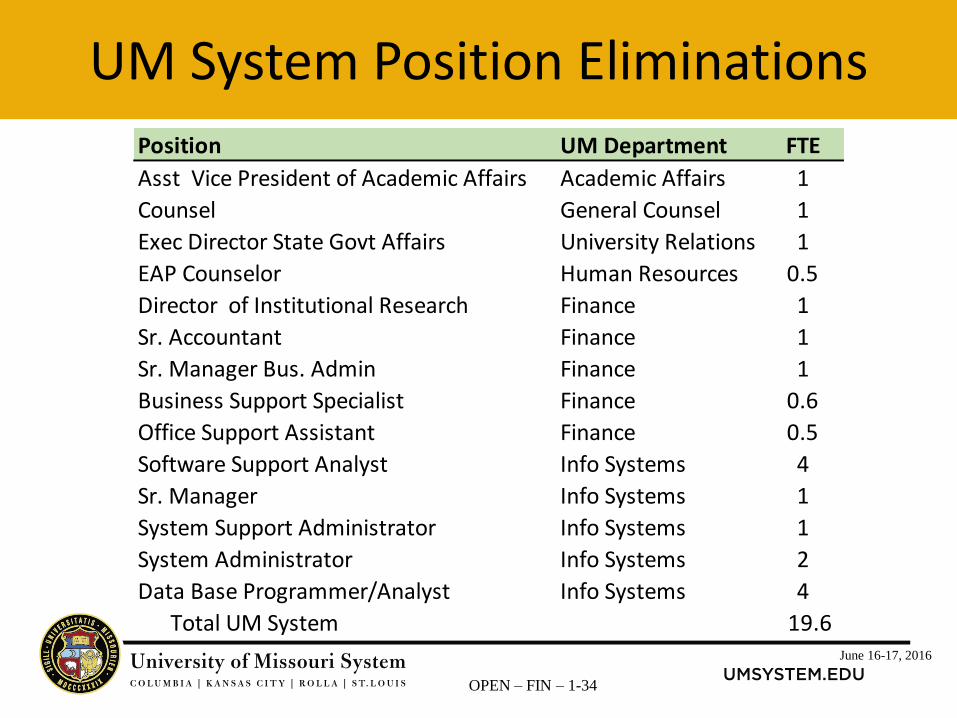
UM System Position Eliminations
Position UM Department FTE
Asst Vice President of Academic Affairs Academic Affairs 1
Counsel General Counsel 1
Exec Director State Govt Affairs University Relations 1
EAP Counselor Human Resources 0.5
Director of Institutional Research Finance 1
Sr. Accountant Finance 1
Sr. Manager Bus. Admin Finance 1
Business Support Specialist Finance 0.6
Office Support Assistant Finance 0.5
Software Support Analyst Info Systems 4
Sr. Manager Info Systems 1
System Support Administrator Info Systems 1
System Administrator Info Systems 2
Data Base Programmer/Analyst Info Systems 4
Total UM System 19.6
June 16-17, 2016
OPEN – FIN – 1-35
June 16-17, 2016
OPEN – FIN – 1-36
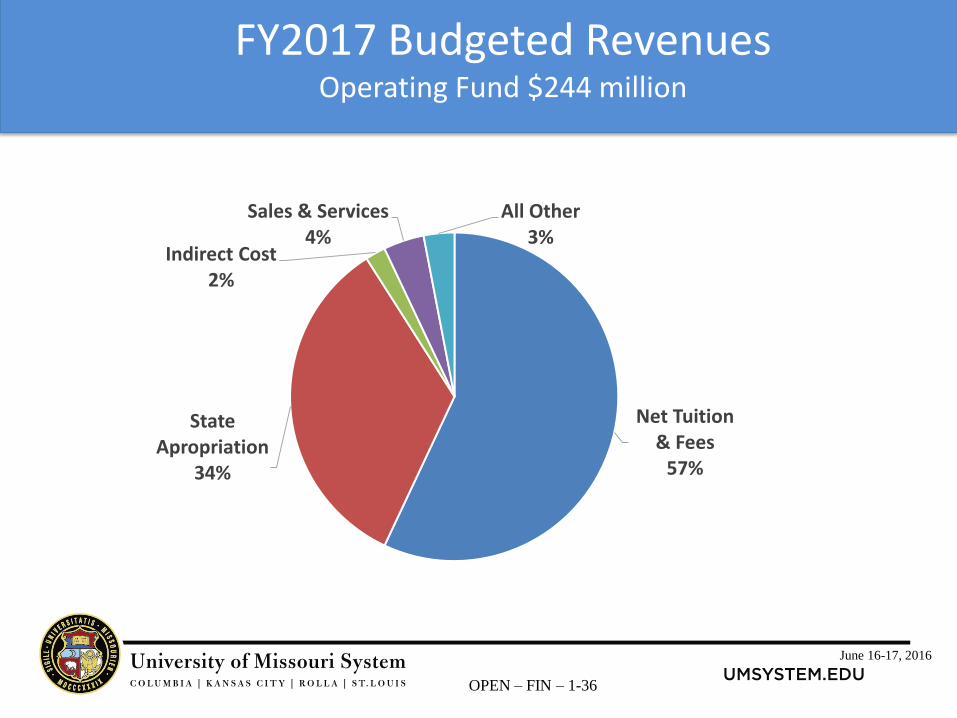
FY2017 Budgeted Revenues Operating Fund $244 million
Net Tuition & Fees
57%
State Apropriation
34%
Indirect Cost2%
Sales & Services4%
All Other3%
June 16-17, 2016
OPEN – FIN – 1-37
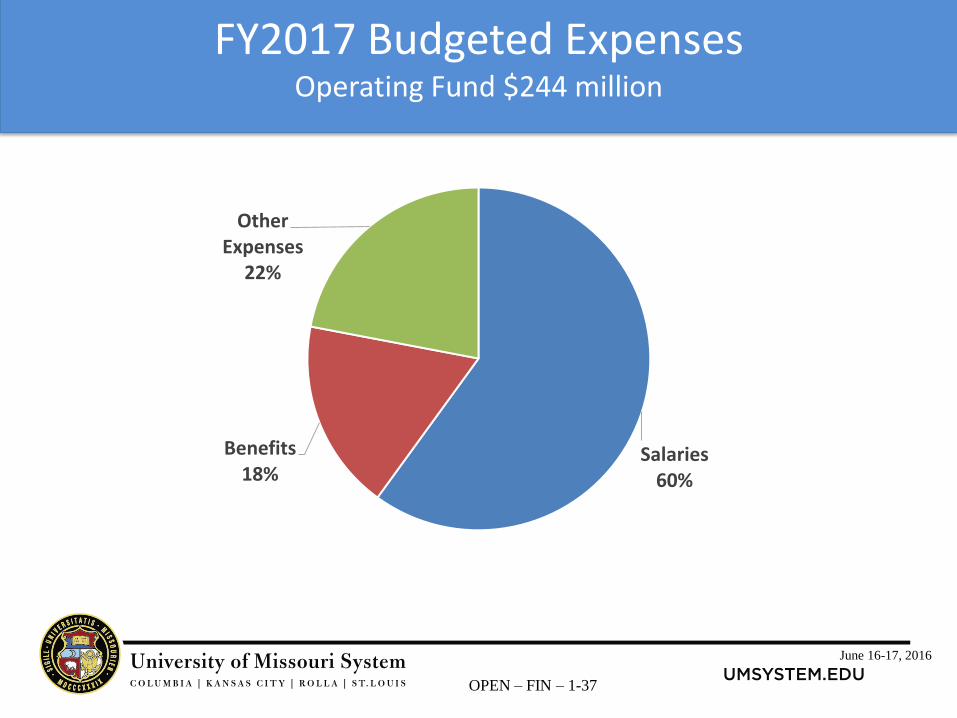
FY2017 Budgeted Expenses Operating Fund $244 million
Salaries60%
Benefits18%
Other Expenses
22%
June 16-17, 2016
OPEN – FIN – 1-38
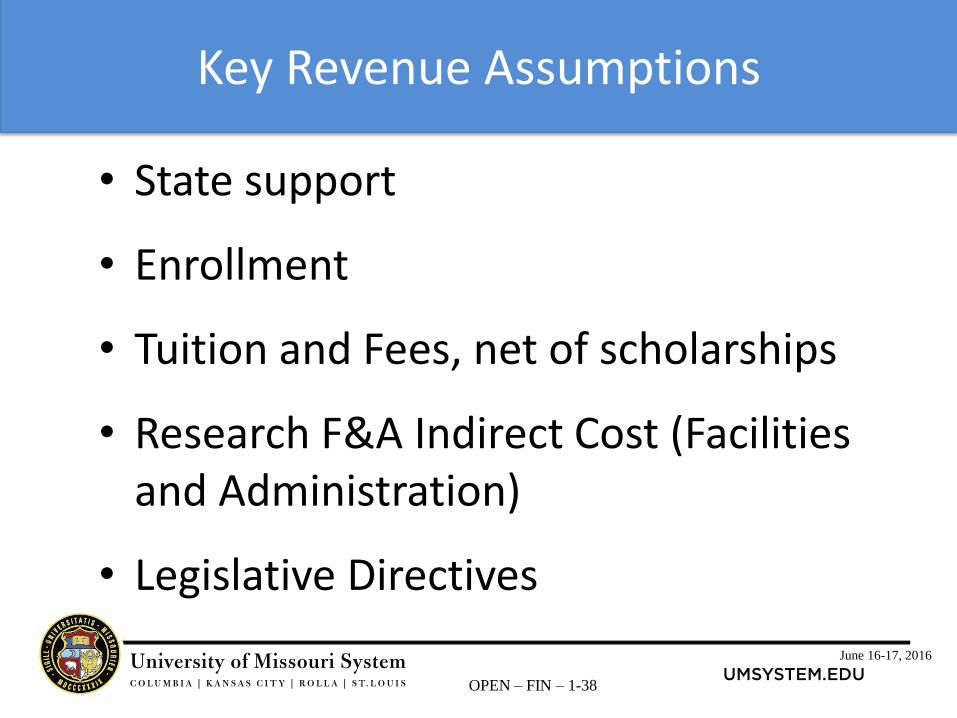
Key Revenue Assumptions
• State support
• Enrollment
• Tuition and Fees, net of scholarships
• Research F&A Indirect Cost (Facilities and Administration)
• Legislative Directives
June 16-17, 2016
OPEN – FIN – 1-39
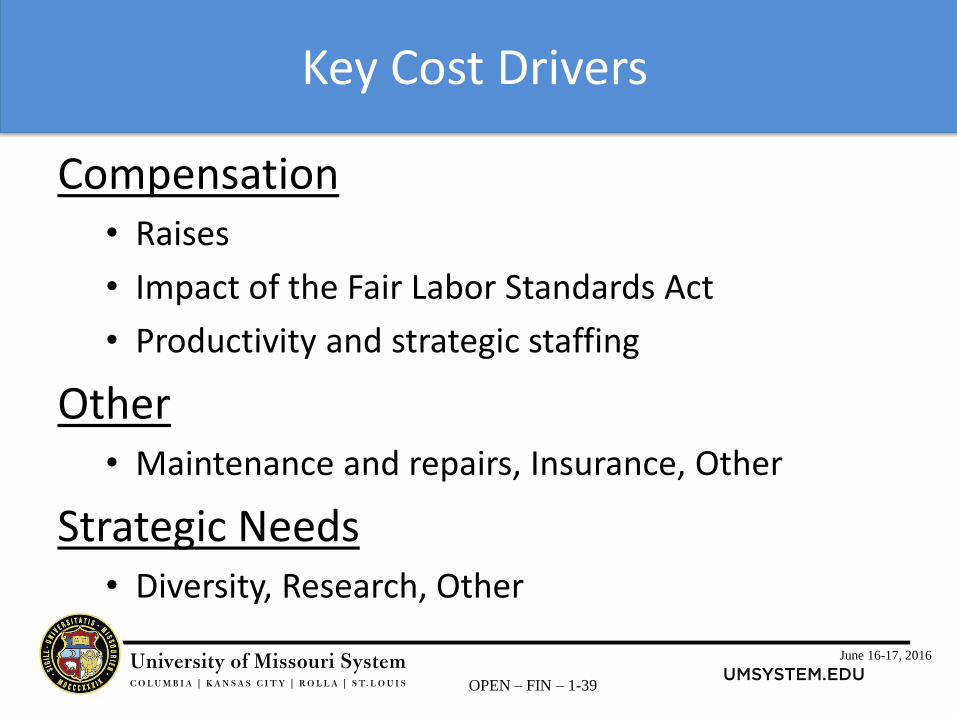
Key Cost Drivers
Compensation• Raises
• Impact of the Fair Labor Standards Act
• Productivity and strategic staffing
Other• Maintenance and repairs, Insurance, Other
Strategic Needs• Diversity, Research, Other
June 16-17, 2016
OPEN – FIN – 1-40
June 16-17, 2016
OPEN – FIN – 1-41
June 16-17, 2016
OPEN – FIN – 1-42
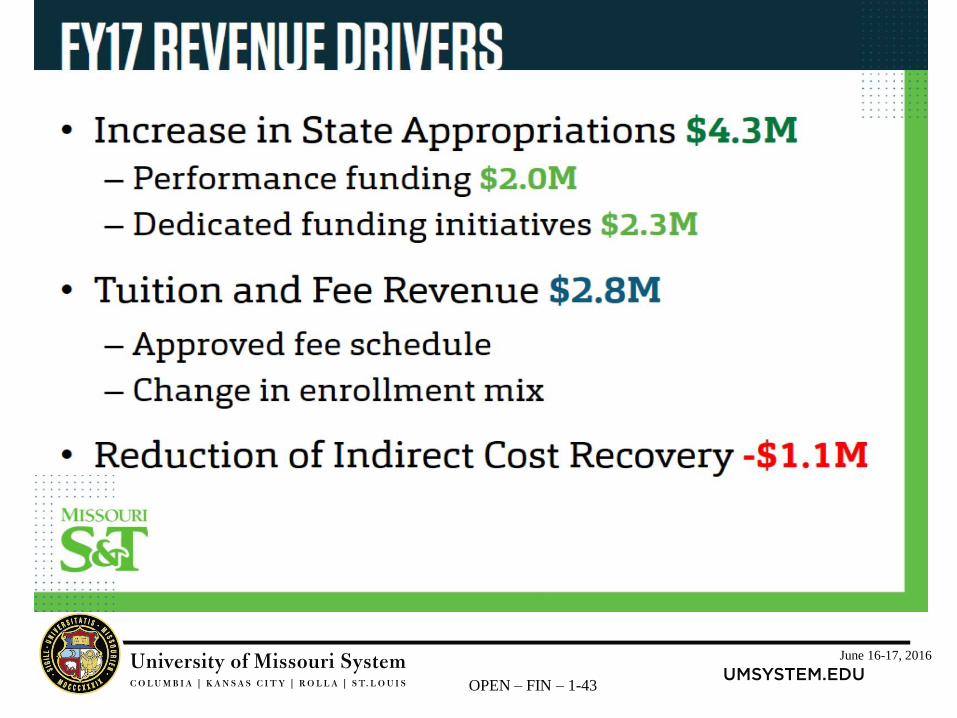
June 16-17, 2016
OPEN – FIN – 1-43
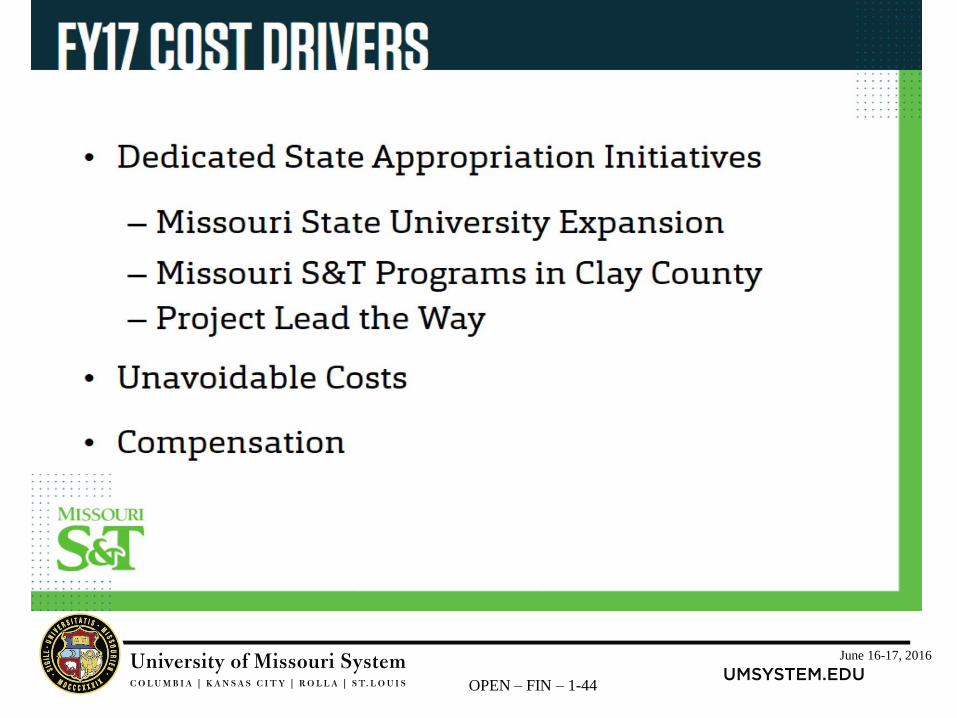
June 16-17, 2016
OPEN – FIN – 1-44
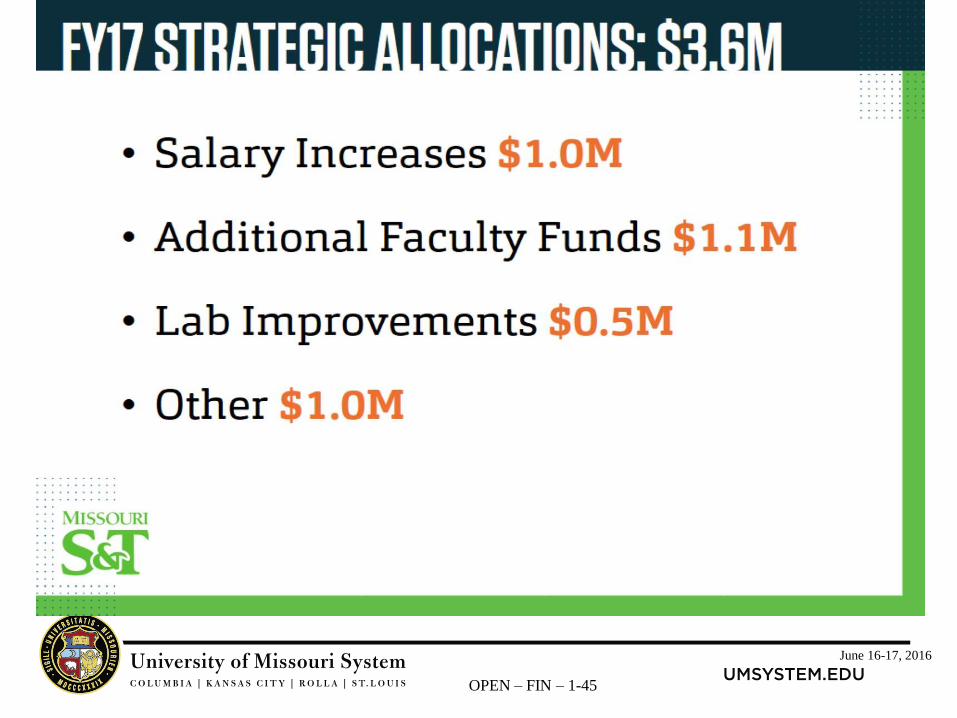
June 16-17, 2016
OPEN – FIN – 1-45
June 16-17, 2016
OPEN – FIN – 1-46
Fiscal Year 2017 BudgetFiscal Year 2017 Budget
June 16-17, 2016
OPEN – FIN – 1-47
FY17 Approach to Fiscal Management
UMSL cannot succeed in its University Mission while
operating with a budget deficit
Widespread acceptance and desire to reverse financial trends
Discussing needs/actions to Optimize UMSL vs. Optimize
College/Division
June 16-17, 2016
OPEN – FIN – 1-48
FY17 Approach to Fiscal Management
Strong fiscal management will be built on the foundation of
three ideas…
Execution of Sustainable Budget Realignment Proposal
Change Board Process to measure, monitor, and manage all changes with
respect to baseline
Appropriate use of all ‘above plan’ achievements
Hold reserves for protection against unexpected risks and issues
Data-driven business case to approve selected investments to enable
near-term deficit reduction
June 16-17, 2016
OPEN – FIN – 1-49
Sustainable Budget Realignment
Proposal
Kicked-off FY17 budget realignment after realization of
upcoming issues
Comprehensive plan to minimize projected budget
deficit in FY17 and to balance budget in FY18
Addressed student enrollment projections, labor, non-
labor and infrastructure costs
June 16-17, 2016
OPEN – FIN – 1-50
Sustainable Budget Realignment
Process
This is the most involved budget planning exercise in the
history of campus
Campus-wide communications and website dedicated to realignment
Meetings with students, faculty, staff and academic officers
Hundreds of individual suggestions to enhance UMSL operations
Dozens of realignment proposals submitted by units
June 16-17, 2016
OPEN – FIN – 1-51
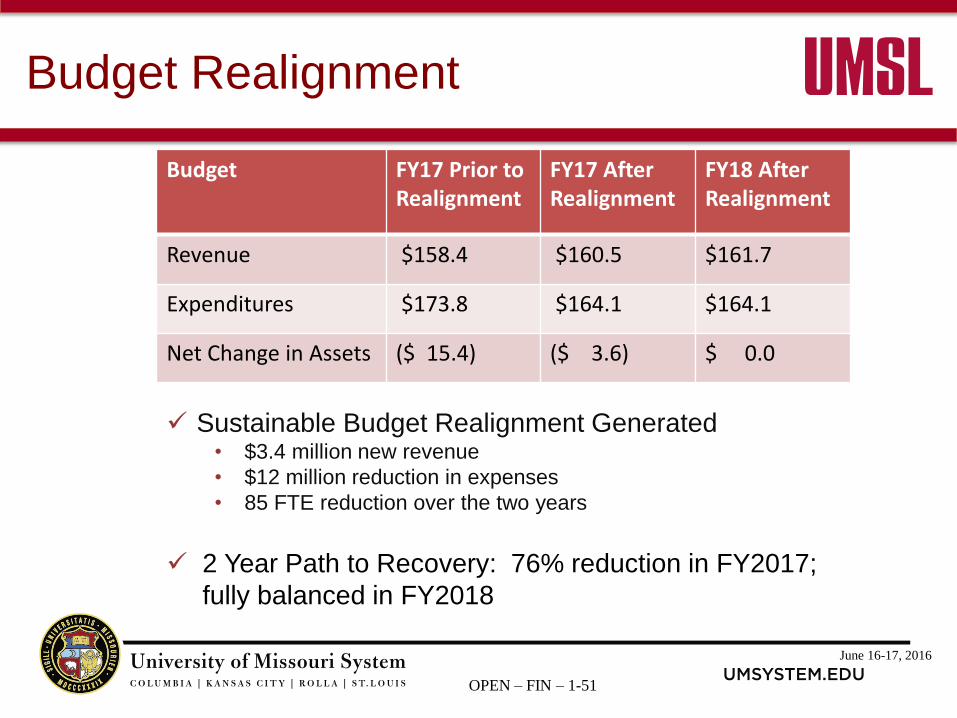
Budget Realignment
Budget FY17 Prior to Realignment
FY17 AfterRealignment
FY18 After Realignment
Revenue $158.4 $160.5 $161.7
Expenditures $173.8 $164.1 $164.1
Net Change in Assets ($ 15.4) ($ 3.6) $ 0.0
Sustainable Budget Realignment Generated• $3.4 million new revenue
• $12 million reduction in expenses
• 85 FTE reduction over the two years
2 Year Path to Recovery: 76% reduction in FY2017;
fully balanced in FY2018
June 16-17, 2016
OPEN – FIN – 1-52
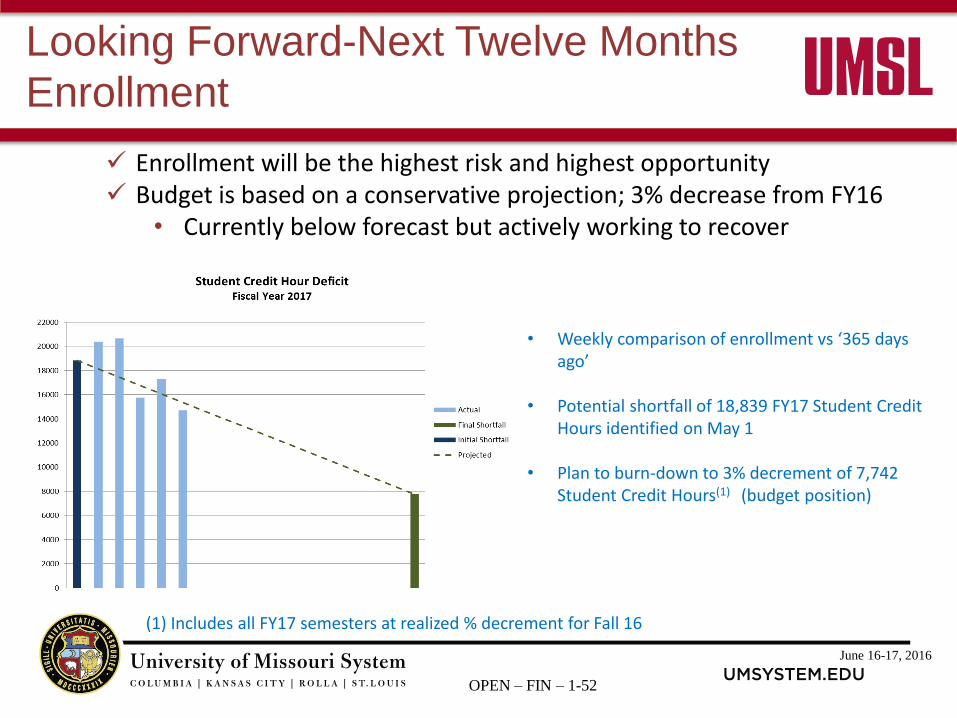
Looking Forward-Next Twelve Months
Enrollment
Enrollment will be the highest risk and highest opportunity Budget is based on a conservative projection; 3% decrease from FY16
• Currently below forecast but actively working to recover
• Weekly comparison of enrollment vs ‘365 days ago’
• Potential shortfall of 18,839 FY17 Student Credit Hours identified on May 1
• Plan to burn-down to 3% decrement of 7,742 Student Credit Hours(1) (budget position)
(1) Includes all FY17 semesters at realized % decrement for Fall 16
June 16-17, 2016
OPEN – FIN – 1-53
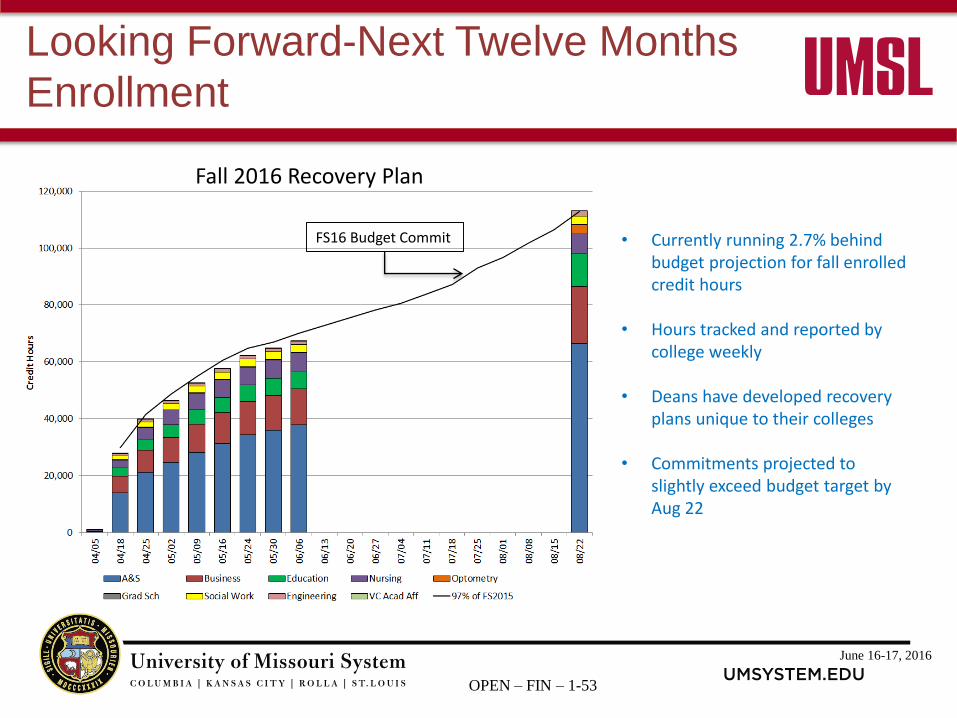
Looking Forward-Next Twelve Months
Enrollment
• Currently running 2.7% behind budget projection for fall enrolled credit hours
• Hours tracked and reported by college weekly
• Deans have developed recovery plans unique to their colleges
• Commitments projected to slightly exceed budget target by Aug 22
FS16 Budget Commit
Fall 2016 Recovery Plan
June 16-17, 2016
OPEN – FIN – 1-54
Looking Forward- Recovery Plan
• Faculty/Advisor contact with admitted students to get enrolled• Addressed impact of financial holds on student ability to enroll• Reach-back to Fall 2015 students who did not enroll in Spring 2016• Recruit students that haven’t enrolled between 2008 and 2015• Enrollment problem tracking – contact with student until resolved• Waitlist tracking and opening of new sections with appropriate demand• Addressing short-term marketing, social media, recruiting opportunities• Detailed correspondence plan to remain in contact with students
Weekly leadership meetings with all Deans to track enrollment data, develop and share recovery plans, joint agreement of mission and goals
Shared Initiatives:
June 16-17, 2016
OPEN – FIN – 1-55
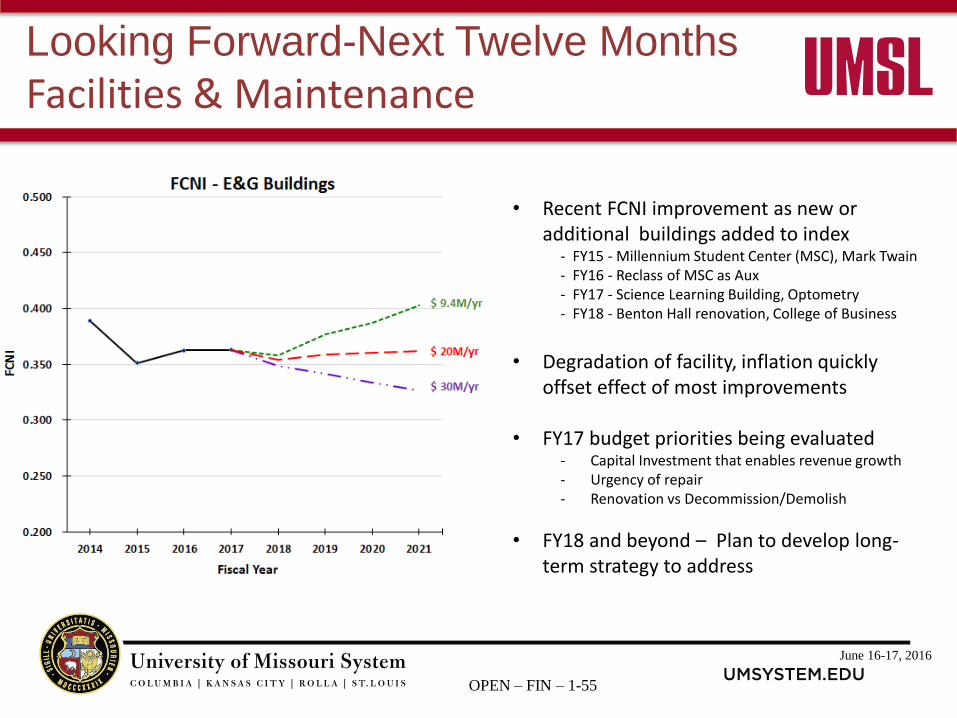
Looking Forward-Next Twelve Months
Facilities & Maintenance
• Recent FCNI improvement as new or additional buildings added to index
- FY15 - Millennium Student Center (MSC), Mark Twain- FY16 - Reclass of MSC as Aux- FY17 - Science Learning Building, Optometry- FY18 - Benton Hall renovation, College of Business
• Degradation of facility, inflation quickly offset effect of most improvements
• FY17 budget priorities being evaluated- Capital Investment that enables revenue growth- Urgency of repair- Renovation vs Decommission/Demolish
• FY18 and beyond – Plan to develop long-term strategy to address
June 16-17, 2016
OPEN – FIN – 1-56
Looking Forward-Next Twelve Months
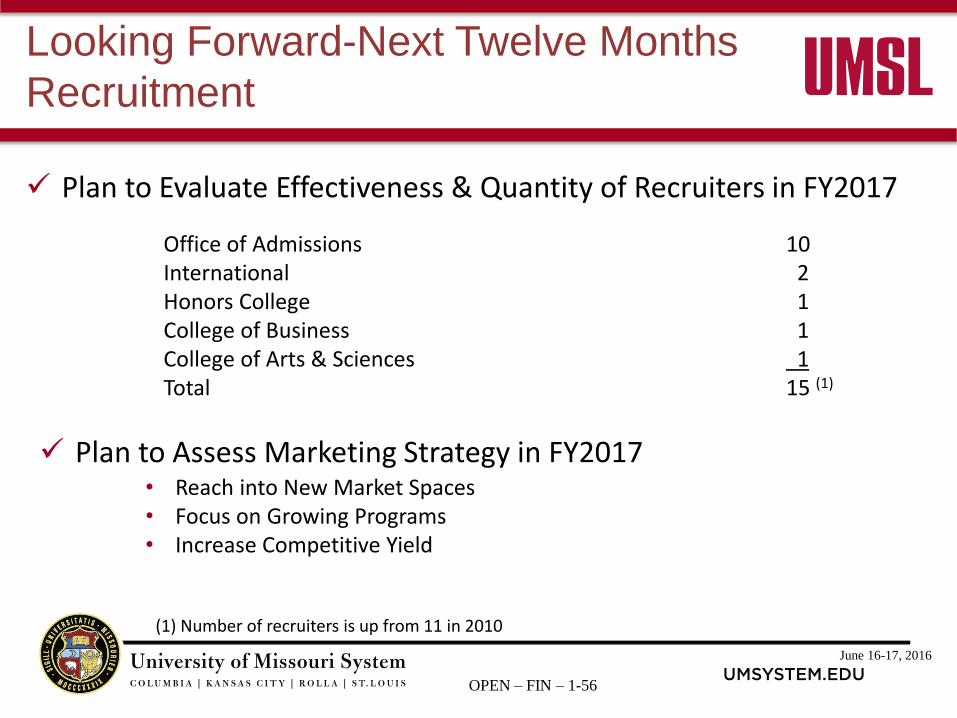
Recruitment
Office of Admissions 10International 2Honors College 1College of Business 1College of Arts & Sciences 1Total 15 (1)
Plan to Evaluate Effectiveness & Quantity of Recruiters in FY2017
Plan to Assess Marketing Strategy in FY2017• Reach into New Market Spaces• Focus on Growing Programs• Increase Competitive Yield
(1) Number of recruiters is up from 11 in 2010
June 16-17, 2016
OPEN – FIN – 1-57
Conclusion
UMSL recognizes challenges and opportunities for growth
Non-performance to budget is not an option
Proactive management of risks (to mitigate) and
opportunities (to sustain) financial targets
Invest in growth opportunities when affordable and
agreement on upside potential
June 16-17, 2016
OPEN – FIN – 1-58 58
http://mubudget.missouri.edu/
Mizzou Financial Overview
May 2016

June 16-17, 2016
OPEN – FIN – 1-59
Current Fund Budget
June 16-17, 2016
OPEN – FIN – 1-60
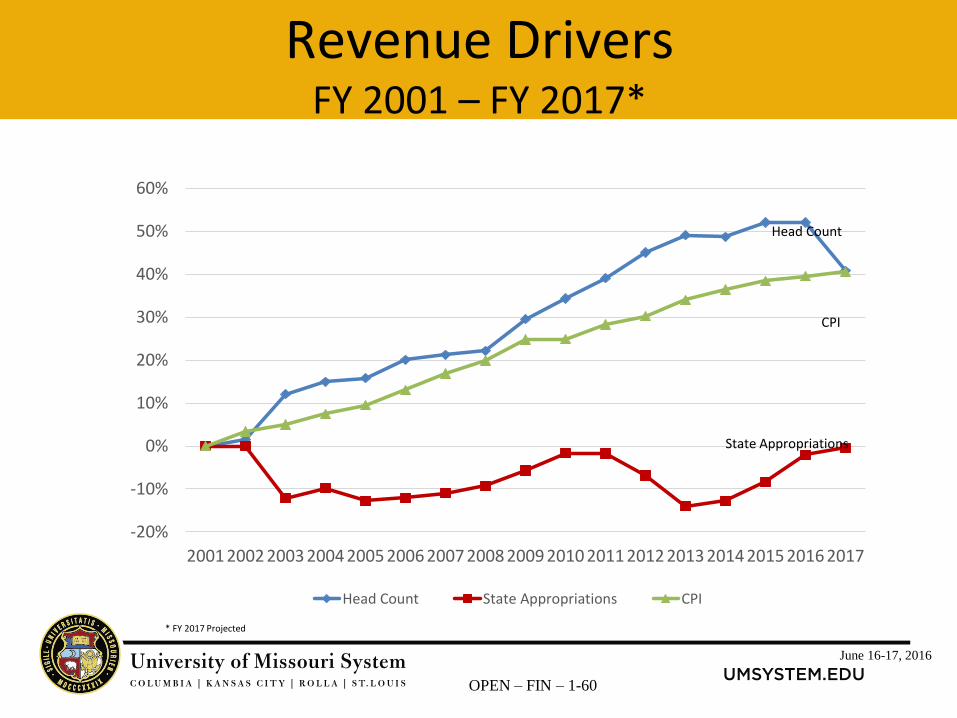
-20%
-10%
0%
10%
20%
30%
40%
50%
60%
2001 2002 2003 2004 2005 2006 2007 2008 2009 2010 2011 2012 2013 2014 2015 2016 2017
Head Count State Appropriations CPI
Head Count
CPI
State Appropriations
* FY 2017 Projected
Revenue DriversFY 2001 – FY 2017*
June 16-17, 2016
OPEN – FIN – 1-61
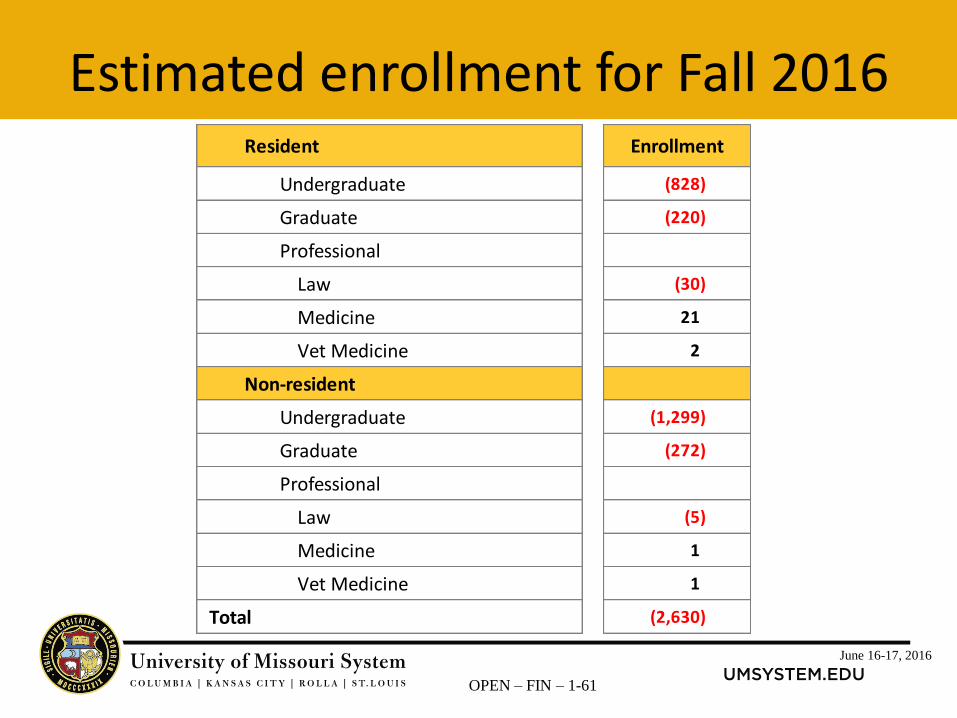
Estimated enrollment for Fall 2016
Undergraduate (828)
Graduate (220)
Professional
Law (30)
Medicine 21
Vet Medicine 2
Non-resident
Undergraduate (1,299)
Graduate (272)
Professional
Law (5)
Medicine 1
Vet Medicine 1
Total (2,630)
Resident Enrollment
June 16-17, 2016
OPEN – FIN – 1-62
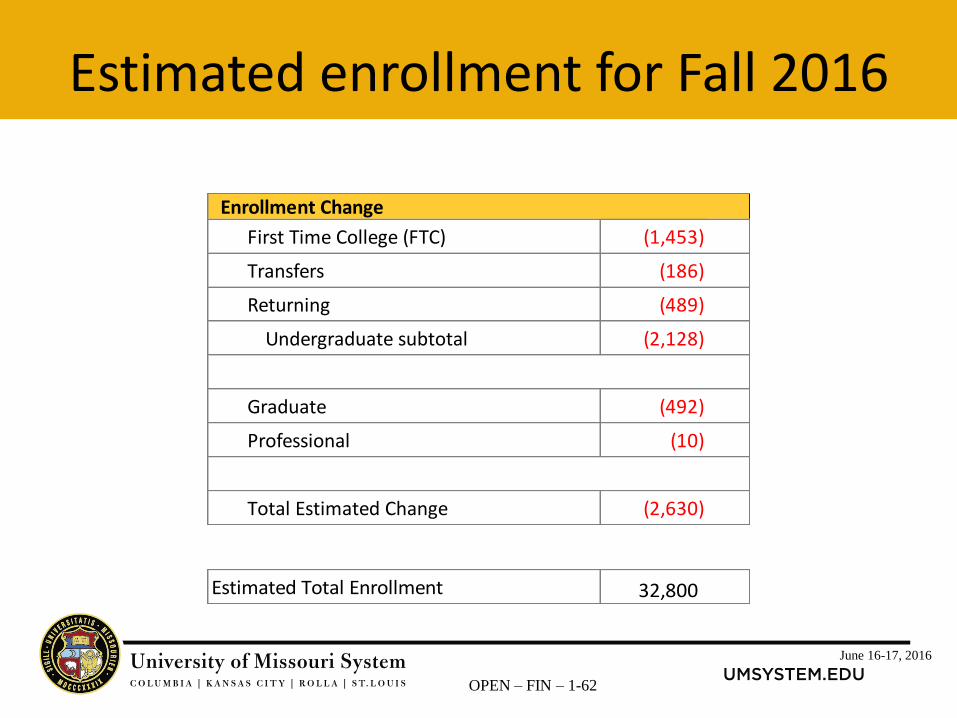
Estimated enrollment for Fall 2016
Enrollment Change
First Time College (FTC) (1,453)
Transfers (186)
Returning (489)
Undergraduate subtotal (2,128)
Graduate (492)
Professional (10)
Total Estimated Change (2,630)
Estimated Total Enrollment 32,800
June 16-17, 2016
OPEN – FIN – 1-63
Notable points regarding enrollment
• Losses are both resident and non-resident students
• MO State’s enrollment will be up compared to last year
• Illinois is a factor, but we will be down in non-resident enrollment from most other states as well
• Class mix is shifting significantly. FTC was 60.5% resident 39.5% non-resident Fall 15 we are expecting a move to 67% and 33% respectively for Fall 16
• Scholarship competitiveness will continue to be a factor
June 16-17, 2016
OPEN – FIN – 1-64
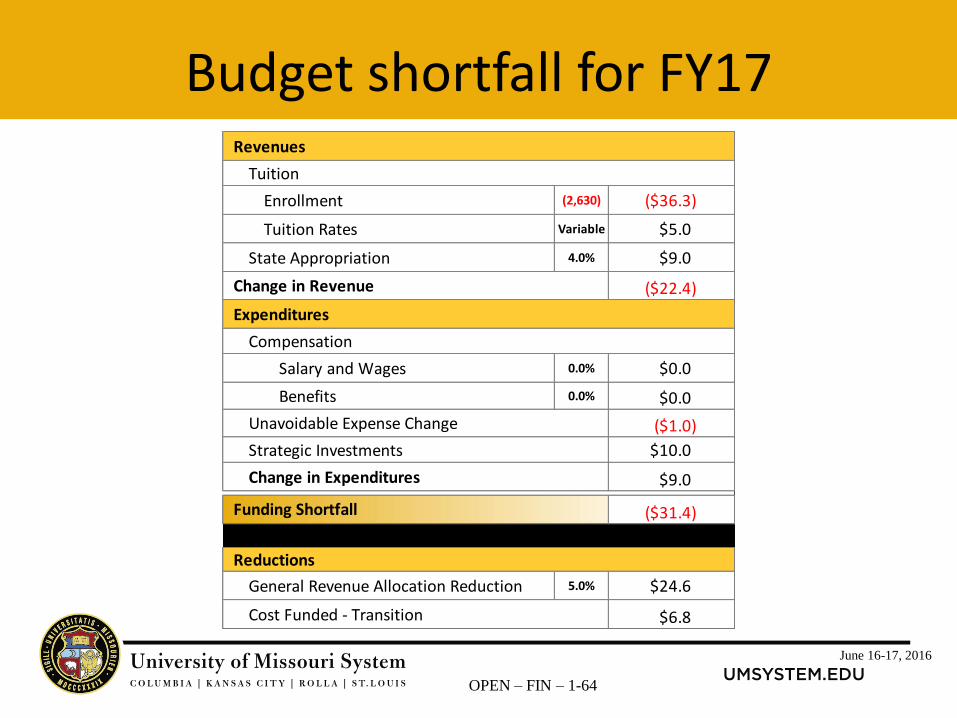
Budget shortfall for FY17Revenues
Tuition
Enrollment (2,630) ($36.3)
Tuition Rates Variable $5.0
State Appropriation 4.0% $9.0
Change in Revenue ($22.4)
Expenditures
Compensation
Salary and Wages 0.0% $0.0
Benefits 0.0% $0.0
Unavoidable Expense Change ($1.0)
Strategic Investments $10.0
Change in Expenditures $9.0
($31.4)
Reductions
General Revenue Allocation Reduction 5.0% $24.6
Cost Funded - Transition $6.8
Funding Shortfall
June 16-17, 2016
OPEN – FIN – 1-65
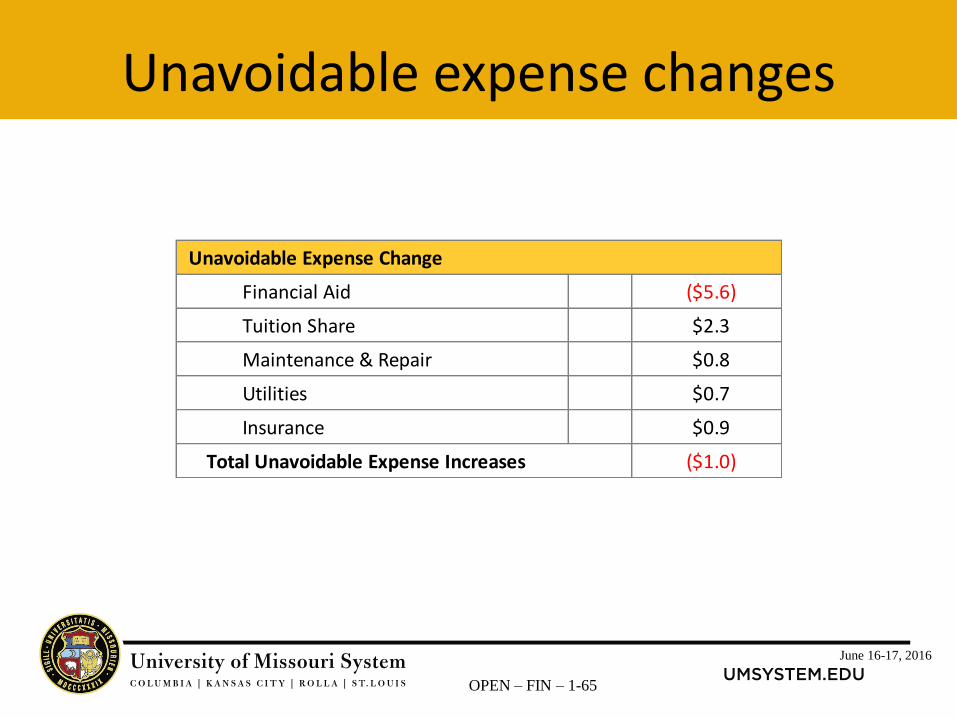
Unavoidable expense changes
Unavoidable Expense Change
Financial Aid ($5.6)
Tuition Share $2.3
Maintenance & Repair $0.8
Utilities $0.7
Insurance $0.9
Total Unavoidable Expense Increases ($1.0)
June 16-17, 2016
OPEN – FIN – 1-66
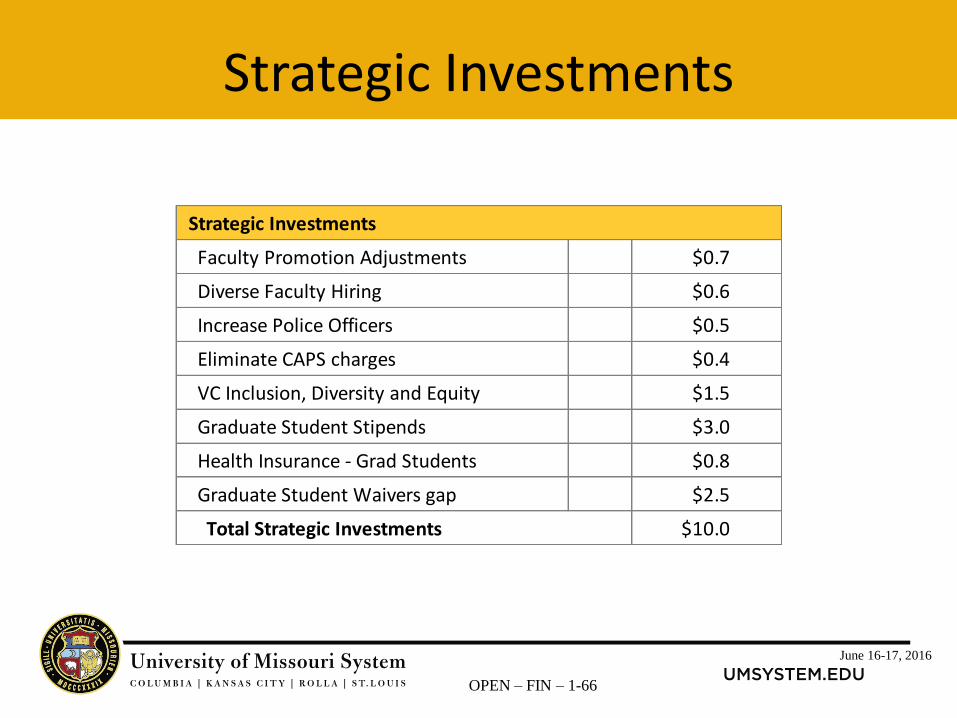
Strategic Investments
Strategic Investments
Faculty Promotion Adjustments $0.7
Diverse Faculty Hiring $0.6
Increase Police Officers $0.5
Eliminate CAPS charges $0.4
VC Inclusion, Diversity and Equity $1.5
Graduate Student Stipends $3.0
Health Insurance - Grad Students $0.8
Graduate Student Waivers gap $2.5
Total Strategic Investments $10.0
June 16-17, 2016
OPEN – FIN – 1-67
Notable points regarding financial adjustments
• We are not likely to recover enough by Fall 17 to cover the planned spend down of one time sources ($6.8M) and if we hold our own we could still be an additional 2,000 students down
• As we recover the next couple of years we are likely to be graduating larger classes than are entering creating potential budget gaps each of the next few years
• % Reductions across everything is not a feasible pattern for many more years
June 16-17, 2016
OPEN – FIN – 1-68
FY17 Operating Budget
Questions?