Embed Size (px)
Citation preview

FY2017 Financial Results Presentation
21 August 2017
Paul O’Malley, Managing Director and Chief Executive OfficerCharlie Elias, Chief Financial Officer
BlueScope Steel Limited. ASX Code: BSL
2
Important NoticeTHIS PRESENTATION IS NOT AND DOES NOT FORM PART OF ANY OFFER, INVITATION ORRECOMMENDATION IN RESPECT OF SECURITIES. ANY DECISION TO BUY OR SELL BLUESCOPESTEEL LIMITED SECURITIES OR OTHER PRODUCTS SHOULD BE MADE ONLY AFTER SEEKINGAPPROPRIATE FINANCIAL ADVICE. RELIANCE SHOULD NOT BE PLACED ON INFORMATION OROPINIONS CONTAINED IN THIS PRESENTATION AND, SUBJECT ONLY TO ANY LEGAL OBLIGATION TODO SO, BLUESCOPE STEEL DOES NOT ACCEPT ANY OBLIGATION TO CORRECT OR UPDATE THEM.THIS PRESENTATION DOES NOT TAKE INTO CONSIDERATION THE INVESTMENT OBJECTIVES,FINANCIAL SITUATION OR PARTICULAR NEEDS OF ANY PARTICULAR INVESTOR.
THIS PRESENTATION CONTAINS CERTAIN FORWARD-LOOKING STATEMENTS, WHICH CAN BEIDENTIFIED BY THE USE OF FORWARD-LOOKING TERMINOLOGY SUCH AS “MAY”, “WILL”, “SHOULD”,“EXPECT”, “INTEND”, “ANTICIPATE”, “ESTIMATE”, “CONTINUE”, “ASSUME” OR “FORECAST” OR THENEGATIVE THEREOF OR COMPARABLE TERMINOLOGY. THESE FORWARD-LOOKING STATEMENTSINVOLVE KNOWN AND UNKNOWN RISKS, UNCERTAINTIES AND OTHER FACTORS WHICH MAYCAUSE OUR ACTUAL RESULTS, PERFORMANCE AND ACHIEVEMENTS, OR INDUSTRY RESULTS, TOBE MATERIALLY DIFFERENT FROM ANY FUTURE RESULTS, PERFORMANCES OR ACHIEVEMENTS,OR INDUSTRY RESULTS, EXPRESSED OR IMPLIED BY SUCH FORWARD-LOOKING STATEMENTS.
TO THE FULLEST EXTENT PERMITTED BY LAW, BLUESCOPE STEEL AND ITS AFFILIATES AND THEIRRESPECTIVE OFFICERS, DIRECTORS, EMPLOYEES AND AGENTS, ACCEPT NO RESPONSIBILITY FORANY INFORMATION PROVIDED IN THIS PRESENTATION, INCLUDING ANY FORWARD LOOKINGINFORMATION, AND DISCLAIM ANY LIABILITY WHATSOEVER (INCLUDING FOR NEGLIGENCE) FORANY LOSS HOWSOEVER ARISING FROM ANY USE OF THIS PRESENTATION OR RELIANCE ONANYTHING CONTAINED IN OR OMITTED FROM IT OR OTHERWISE ARISING IN CONNECTION WITHTHIS.

FY2017 HEADLINES
4
Lost
time i
njurie
s per
milli
on m
an-h
ours
worke
d
Lost time injury frequency rate
Medic
ally t
reate
d inju
ries p
er m
illion
man
-hou
rs wo
rked
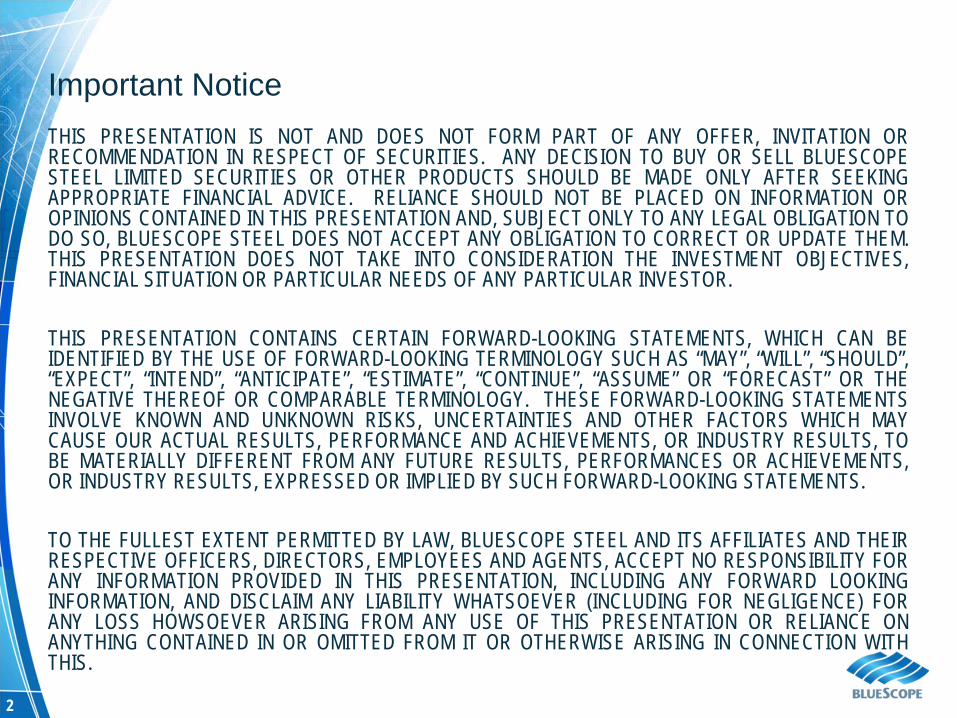
Charts include contractors from 1996, Butler from May 2004, 2007/08 acquisitions, Australian operational restructure in 2012 and Pacific Steel, Fielders and Orrcon from July 2015Note: (1) The MTIFR baseline has been was reset from 4.4 to 6.3 due to changes in calculation method
15.65.14.65.35.75.86.35.15.76.46.86.6
9.38.39.412.4
17.0
21.9
29.1
47.1
52.2
60.0
17161514131211100908070605040302010099
22.4
98979695
0.80.60.60.90.60.90.70.90.90.90.60.80.91.61.8
2.83.5
4.13.5
4.8
8.0
14.0
16.0
17070605040302 161512 141308 11100901009998979695
Medically treated injury frequency rate
Safety: target to improve global performance in FY2018
Years ended 30 June Years ended 30 June
5
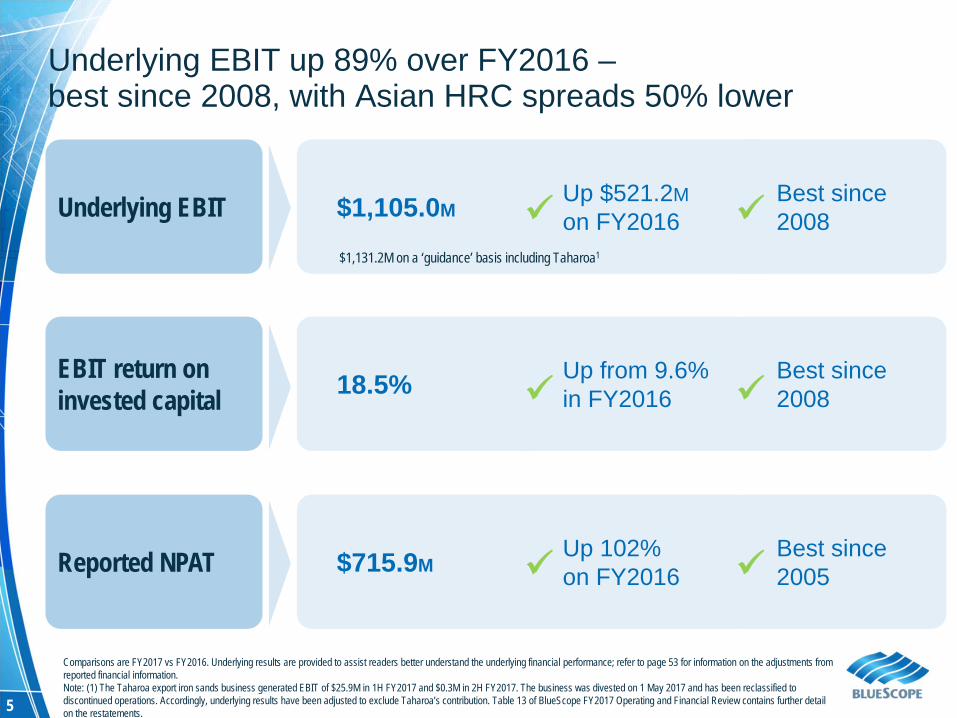
Underlying EBIT up 89% over FY2016 –best since 2008, with Asian HRC spreads 50% lower
Underlying EBIT
EBIT return on invested capital
Reported NPAT
$1,105.0MUp $521.2Mon FY2016
Best since 2008
18.5% Up from 9.6%in FY2016
Best since2008
$715.9MUp 102%on FY2016
Best since 2005
$1,131.2M on a ‘guidance’ basis including Taharoa1
Comparisons are FY2017 vs FY2016. Underlying results are provided to assist readers better understand the underlying financial performance; refer to page 53 for information on the adjustments from reported financial information.Note: (1) The Taharoa export iron sands business generated EBIT of $25.9M in 1H FY2017 and $0.3M in 2H FY2017. The business was divested on 1 May 2017 and has been reclassified to discontinued operations. Accordingly, underlying results have been adjusted to exclude Taharoa’s contribution. Table 13 of BlueScope FY2017 Operating and Financial Review contains further detail on the restatements.
6
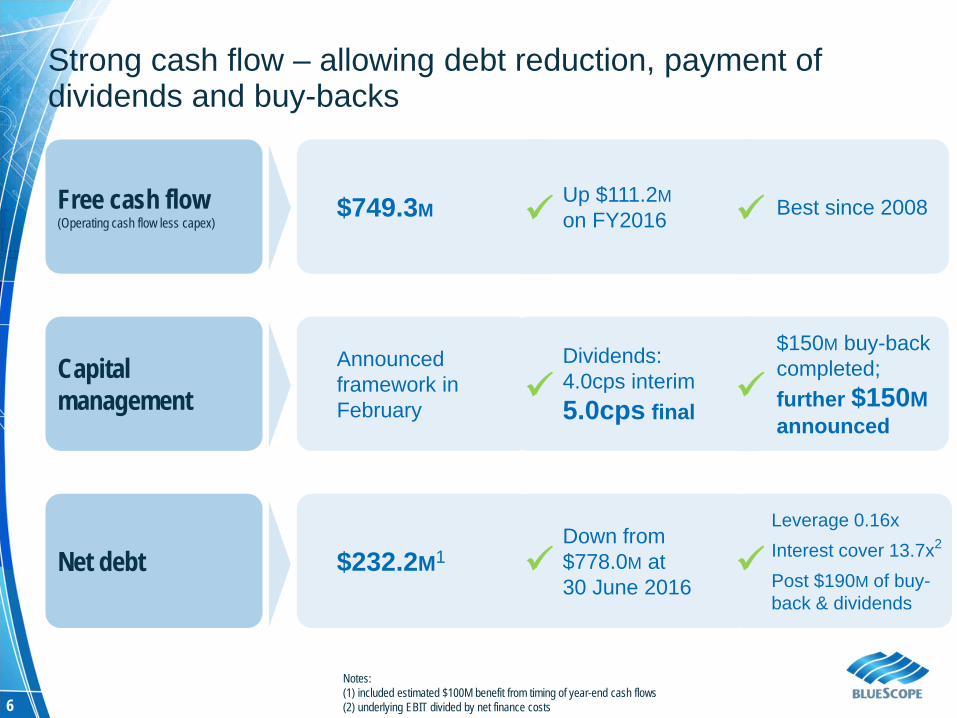
Strong cash flow – allowing debt reduction, payment of dividends and buy-backs
Free cash flow(Operating cash flow less capex)
Net debt
Capital management
$749.3MUp $111.2Mon FY2016 Best since 2008
$232.2M1Down from $778.0M at30 June 2016
Leverage 0.16xInterest cover 13.7xPost $190M of buy-back & dividends
Announced framework in February
Dividends:4.0cps interim5.0cps final
$150M buy-back completed; further $150Mannounced
Notes:(1) included estimated $100M benefit from timing of year-end cash flows(2) underlying EBIT divided by net finance costs
2
7
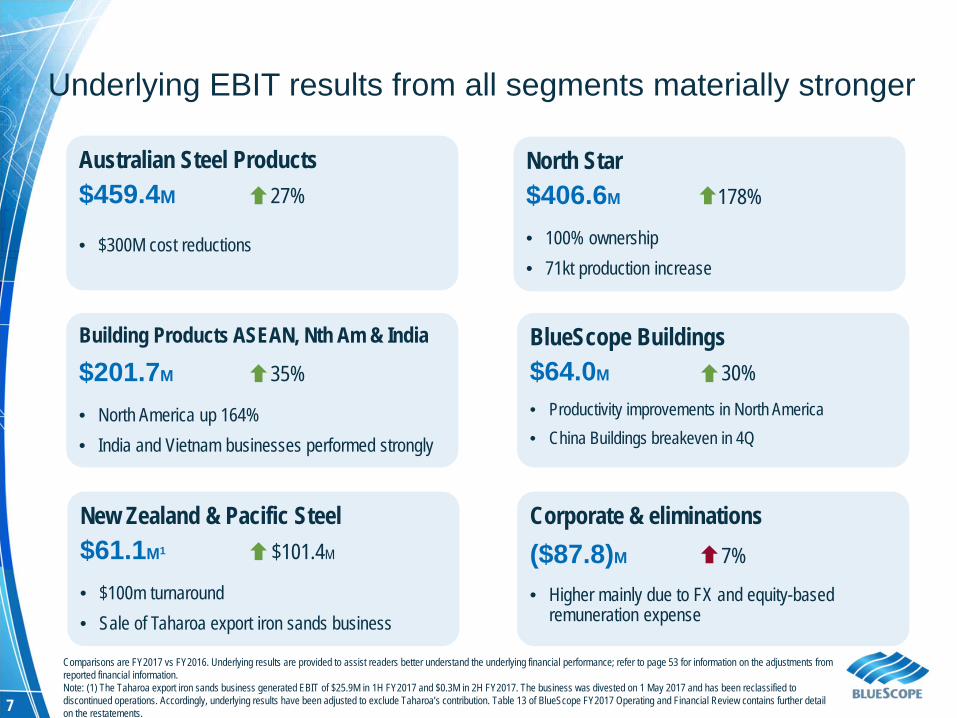
Underlying EBIT results from all segments materially stronger
Australian Steel Products$459.4M 27%
• $300M cost reductions
New Zealand & Pacific Steel$61.1M1 $101.4M
• $100m turnaround• Sale of Taharoa export iron sands business
Building Products ASEAN, Nth Am & India
$201.7M 35%
• North America up 164%• India and Vietnam businesses performed strongly
BlueScope Buildings$64.0M 30%• Productivity improvements in North America• China Buildings breakeven in 4Q
North Star$406.6M 178%
• 100% ownership• 71kt production increase
Corporate & eliminations($87.8)M 7%
• Higher mainly due to FX and equity-based remuneration expense
Comparisons are FY2017 vs FY2016. Underlying results are provided to assist readers better understand the underlying financial performance; refer to page 53 for information on the adjustments from reported financial information.Note: (1) The Taharoa export iron sands business generated EBIT of $25.9M in 1H FY2017 and $0.3M in 2H FY2017. The business was divested on 1 May 2017 and has been reclassified to discontinued operations. Accordingly, underlying results have been adjusted to exclude Taharoa’s contribution. Table 13 of BlueScope FY2017 Operating and Financial Review contains further detail on the restatements.
SUSTAINABILITY UPDATE
9
10
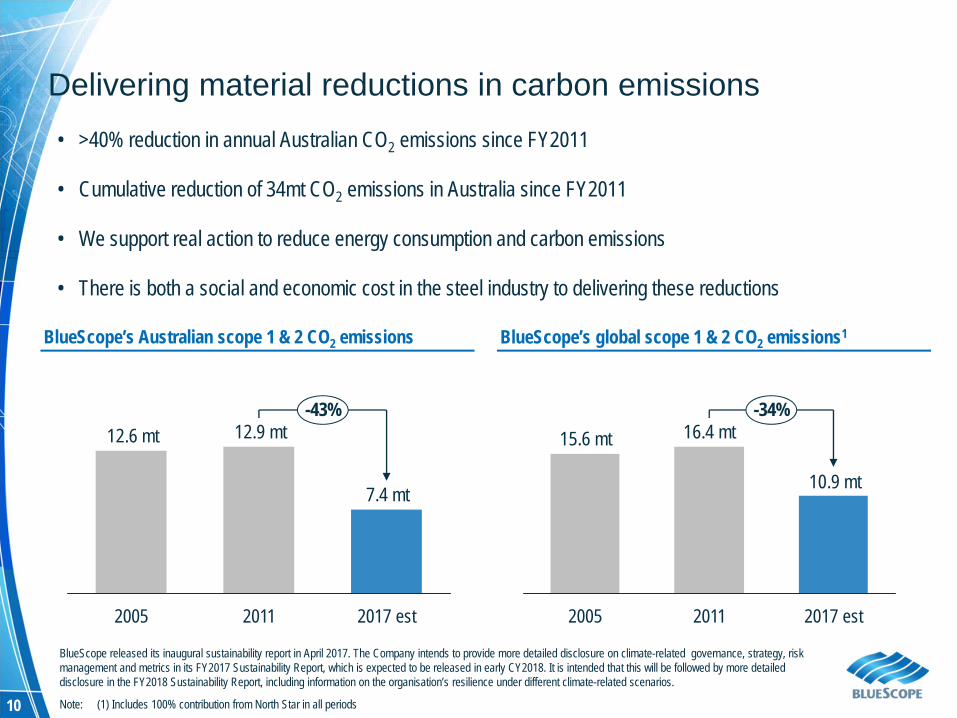
Delivering material reductions in carbon emissions• >40% reduction in annual Australian CO2 emissions since FY2011
• Cumulative reduction of 34mt CO2 emissions in Australia since FY2011
• We support real action to reduce energy consumption and carbon emissions
• There is both a social and economic cost in the steel industry to delivering these reductions
7.4 mt
12.9 mt12.6 mt-43%
2017 est20112005
BlueScope released its inaugural sustainability report in April 2017. The Company intends to provide more detailed disclosure on climate-related governance, strategy, risk management and metrics in its FY2017 Sustainability Report, which is expected to be released in early CY2018. It is intended that this will be followed by more detailed disclosure in the FY2018 Sustainability Report, including information on the organisation’s resilience under different climate-related scenarios.
Note: (1) Includes 100% contribution from North Star in all periods
BlueScope’s Australian scope 1 & 2 CO2 emissions
10.9 mt
16.4 mt15.6 mt-34%
2005 2011 2017 est
BlueScope’s global scope 1 & 2 CO2 emissions1
11
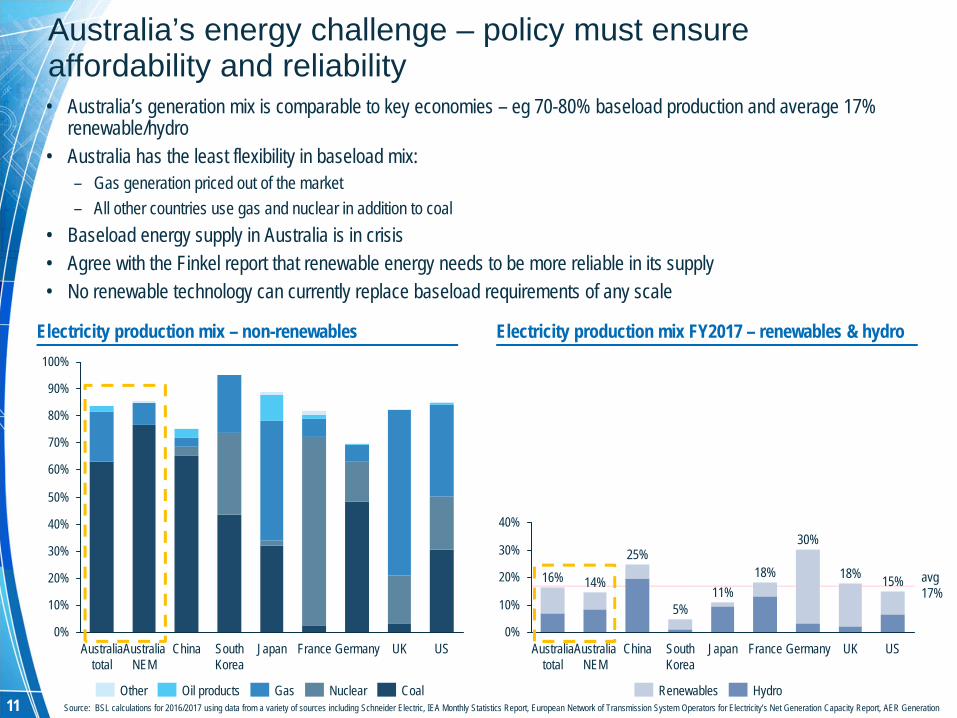
Australia’s energy challenge – policy must ensure affordability and reliability• Australia’s generation mix is comparable to key economies – eg 70-80% baseload production and average 17%
renewable/hydro• Australia has the least flexibility in baseload mix:
– Gas generation priced out of the market– All other countries use gas and nuclear in addition to coal
• Baseload energy supply in Australia is in crisis• Agree with the Finkel report that renewable energy needs to be more reliable in its supply• No renewable technology can currently replace baseload requirements of any scale
0%
10%
20%
30%
40%
50%
60%
70%
80%
90%
100%
UK USGermanyFranceJapanSouth Korea
ChinaAustralia NEM
Australia total
0%
10%
20%
30%
40%
USJapan UKGermanyFranceChinaAustralia NEM
Australia total
South Korea
30%
15%18%14%
25%16%
5%
18%11%
Renewables HydroGasOil productsOther CoalNuclear
Electricity production mix – non-renewables Electricity production mix FY2017 – renewables & hydro
avg17%
Source: BSL calculations for 2016/2017 using data from a variety of sources including Schneider Electric, IEA Monthly Statistics Report, European Network of Transmission System Operators for Electricity’s Net Generation Capacity Report, AER Generation
12
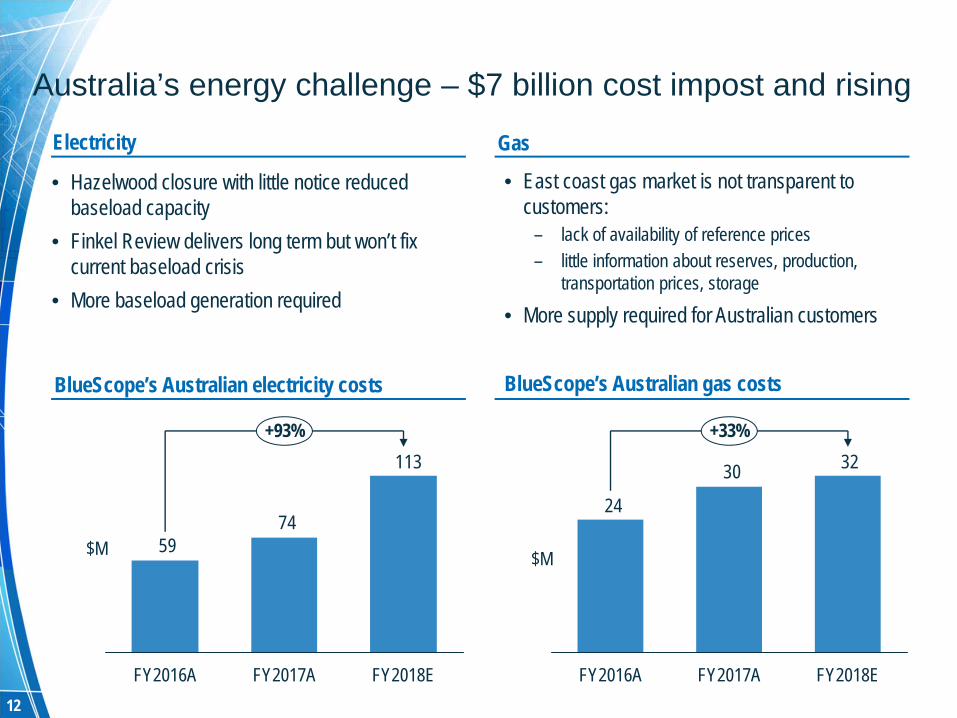
Australia’s energy challenge – $7 billion cost impost and rising
$M
BlueScope’s Australian electricity costs BlueScope’s Australian gas costs
3230
24
+33%
FY2018EFY2017AFY2016A
Electricity Gas
$M
113
7459
+93%
FY2018EFY2017AFY2016A
• Hazelwood closure with little notice reduced baseload capacity
• Finkel Review delivers long term but won’t fix current baseload crisis
• More baseload generation required
• East coast gas market is not transparent to customers:
– lack of availability of reference prices– little information about reserves, production,
transportation prices, storage
• More supply required for Australian customers
13
Governance – a core responsibility for Board and Management
• In our Company charter – Our Bond – we recognise that our success depends on our customers and suppliers, our people and our communities, and that our strength is choosing to do what is right.
• We promote a culture among our employees where these responsibilities are taken seriously. As with our focus on safety, this requires constant attention as our operations are governed by extensive laws and regulations.
• We have strong internal policies on governance and business conduct, with an actively promoted whistle-blower line across our entire global footprint: – In 2017 we received 19 tip-off calls to the Hotline and this led to 24 investigations of alleged misconduct – 9 people exited from the business as a result of these investigations– We don’t comment on individual HR matters, but we would if they pertained to members of the leadership team.
• Over the last financial year, the Australian Competition and Consumer Commission (ACCC) has been investigating potential cartel conduct by BlueScope relating to the supply of steel products in Australia, that involved a small number of BlueScope employees in the period from late 2013 to mid 2014. – BlueScope has co-operated, and continues to co-operate, with the ACCC’s investigation. – The ACCC’s investigation is ongoing. The Company is not in a position to make any further comment at this time.
• BlueScope is committed to competing fairly and complying with all laws that apply to our operations, including competition laws
14
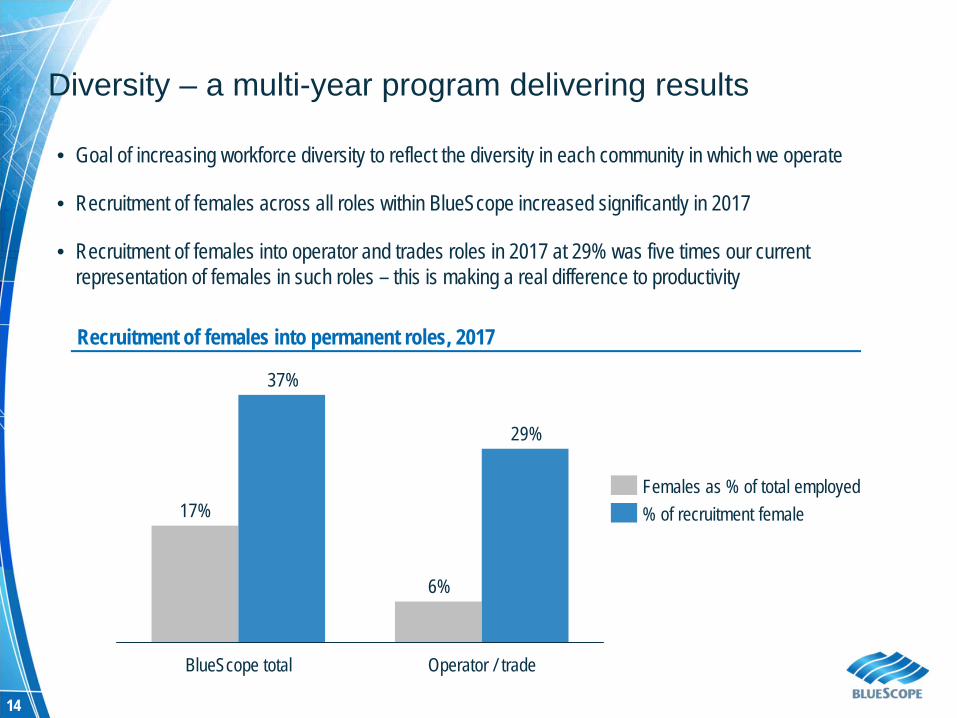
Diversity – a multi-year program delivering results
• Goal of increasing workforce diversity to reflect the diversity in each community in which we operate
• Recruitment of females across all roles within BlueScope increased significantly in 2017
• Recruitment of females into operator and trades roles in 2017 at 29% was five times our current representation of females in such roles – this is making a real difference to productivity
6%
17%
29%
37%
Operator / tradeBlueScope total
% of recruitment femaleFemales as % of total employed
Recruitment of females into permanent roles, 2017
STRATEGIC POSITION
16
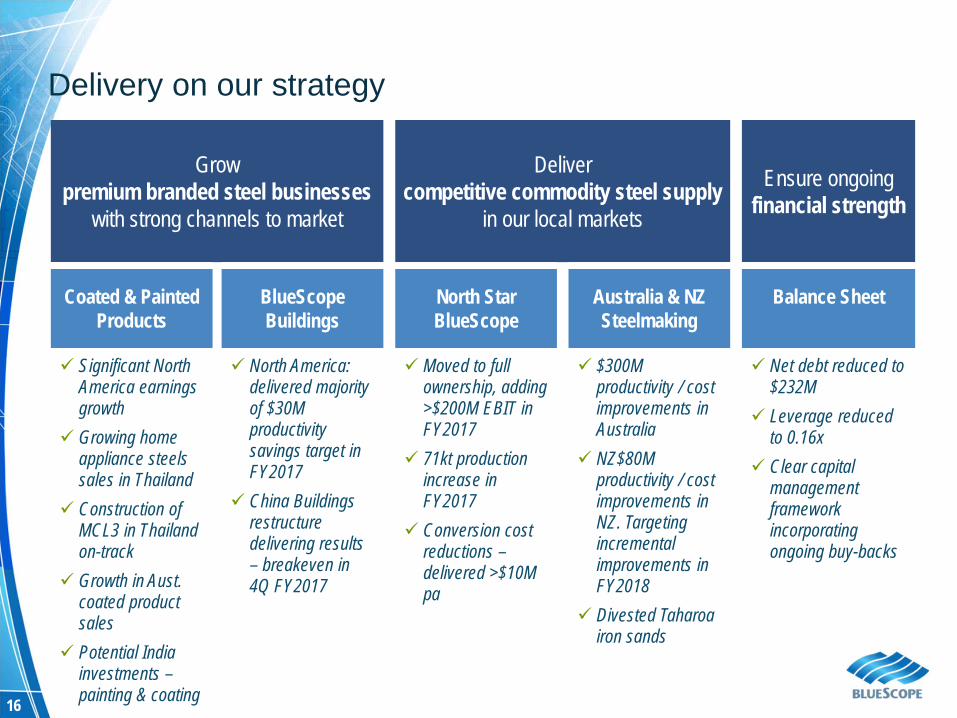
Delivery on our strategy
Growpremium branded steel businesses
with strong channels to market
Delivercompetitive commodity steel supply
in our local markets
Ensure ongoing financial strength
Coated & PaintedProducts
BlueScope Buildings
North Star BlueScope
Australia & NZ Steelmaking
Balance Sheet
Significant North America earnings growth
Growing homeappliance steels sales in Thailand
Construction of MCL3 in Thailand on-track
Growth in Aust. coated product sales
Potential India investments –painting & coating
North America: delivered majority of $30M productivity savings target in FY2017
China Buildings restructure delivering results – breakeven in 4Q FY2017
Moved to full ownership, adding >$200M EBIT in FY2017
71kt production increase in FY2017
Conversion cost reductions –delivered >$10M pa
$300M productivity / cost improvements in Australia
NZ$80M productivity / cost improvements in NZ. Targeting incrementalimprovements in FY2018
Divested Taharoa iron sands
Net debt reduced to $232M
Leverage reducedto 0.16x
Clear capital management framework incorporating ongoing buy-backs
17
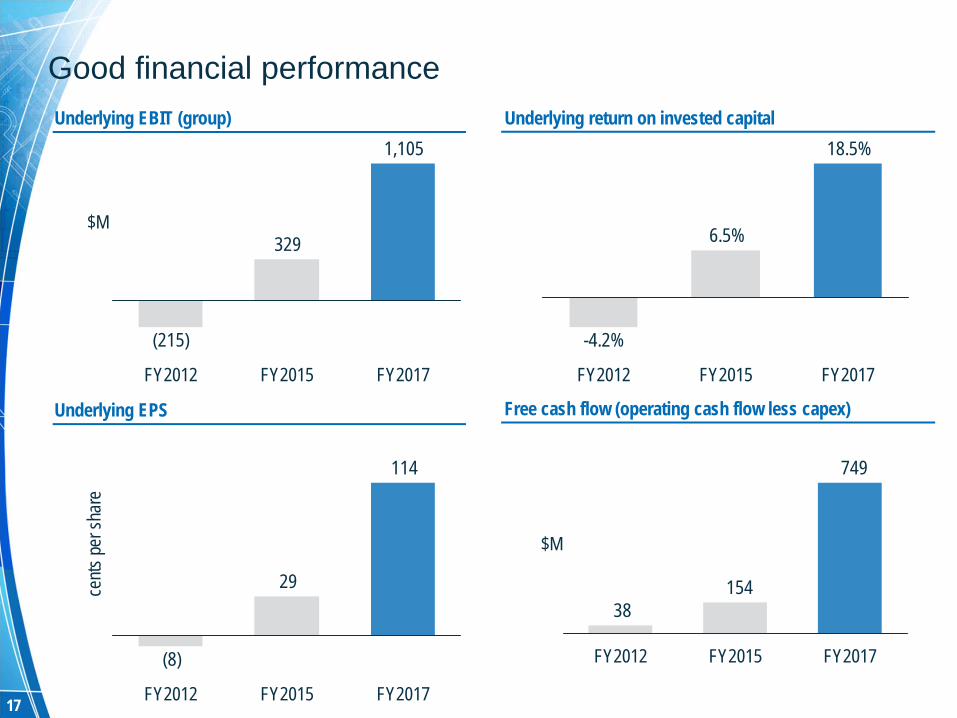
Good financial performance Underlying EBIT (group) Underlying return on invested capital
1,105
329
(215)
FY2017FY2015FY2012
$M
$M
Underlying EPS
cents
per s
hare
Free cash flow (operating cash flow less capex)
18.5%
6.5%
-4.2%
FY2017FY2015FY2012
114
29
(8)
FY2015 FY2017FY2012
749
15438
FY2015 FY2017FY2012
18
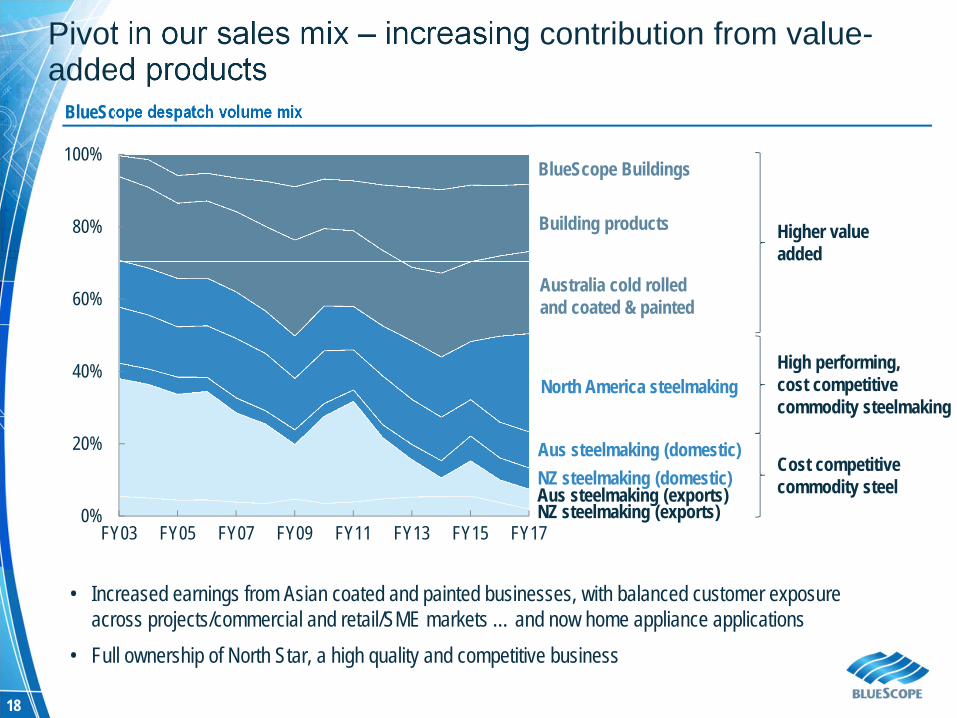
Pivot in our sales mix – increasing contribution from value-added products
BlueScope despatch volume mix
0%
20%
40%
60%
80%
100%
FY03 FY05 FY07 FY09 FY11 FY13 FY15 FY17NZ steelmaking (exports)Aus steelmaking (exports)NZ steelmaking (domestic)
North America steelmaking
Australia cold rolledand coated & painted
Building products
BlueScope Buildings
Aus steelmaking (domestic)
• Increased earnings from Asian coated and painted businesses, with balanced customer exposure across projects/commercial and retail/SME markets … and now home appliance applications
• Full ownership of North Star, a high quality and competitive business
Higher valueadded
High performing,cost competitivecommodity steelmaking
Cost competitivecommodity steel
19
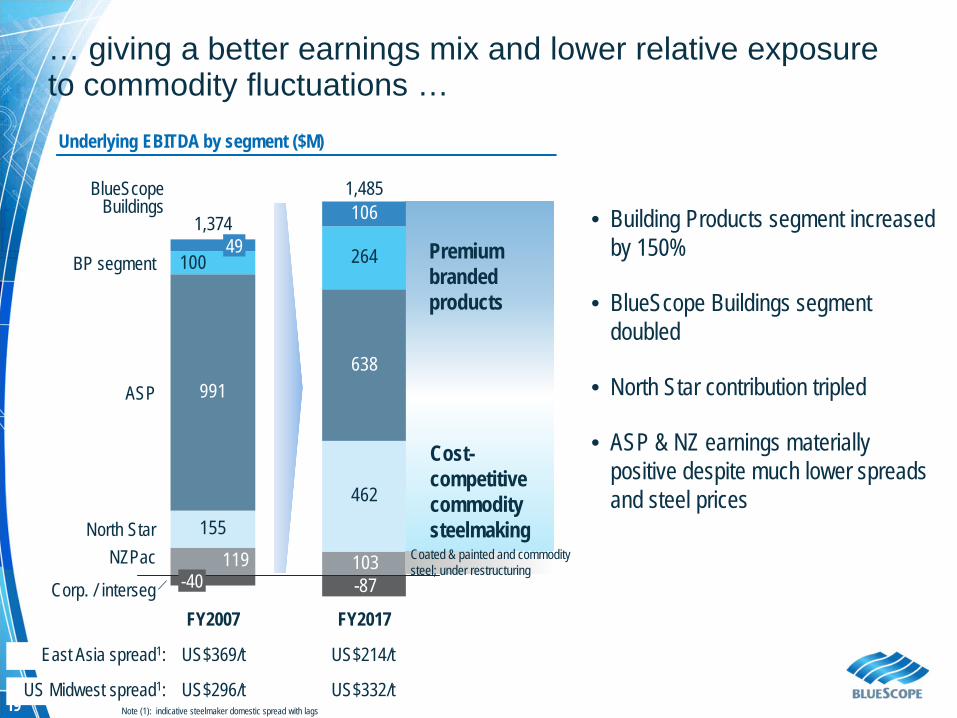
… giving a better earnings mix and lower relative exposure to commodity fluctuations …
Underlying EBITDA by segment ($M)
155462
991638
264
-87103119
100
106
Corp. / interseg
NZPacNorth Star
ASP
BP segment
FY2017
1,485
FY2007
1,374
-40
49
BlueScope Buildings
Premiumbrandedproducts
Cost-competitivecommoditysteelmaking
East Asia spread1: US$369/t US$214/t
US Midwest spread1: US$296/t US$332/tNote (1): indicative steelmaker domestic spread with lags
• Building Products segment increased by 150%
• BlueScope Buildings segment doubled
• North Star contribution tripled
• ASP & NZ earnings materially positive despite much lower spreads and steel prices
Coated & painted and commodity steel; under restructuring
20
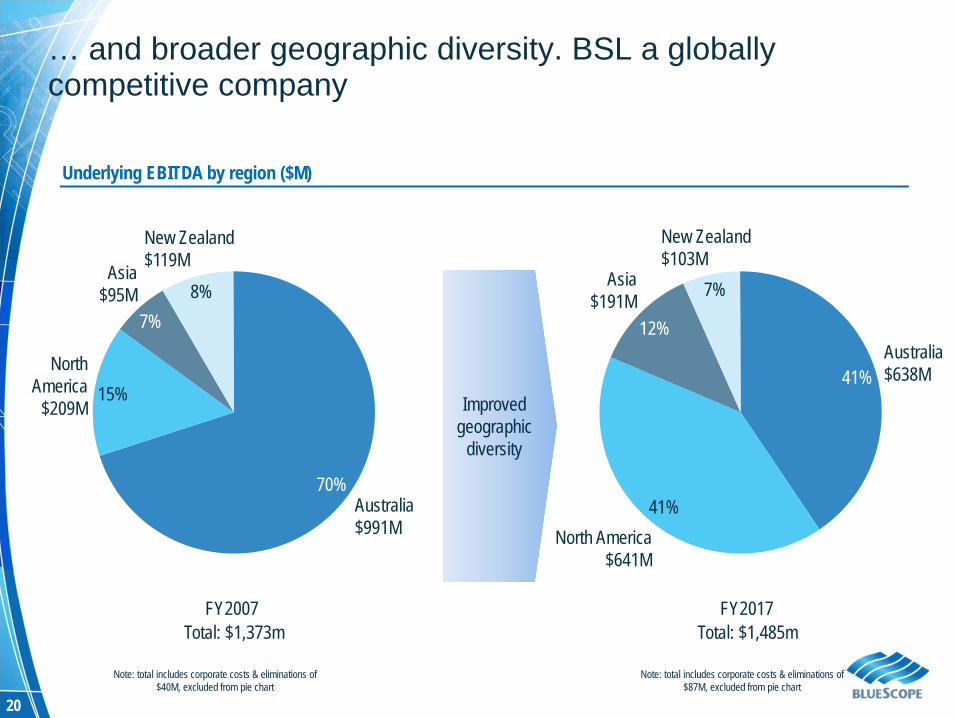
… and broader geographic diversity. BSL a globally competitive company
Underlying EBITDA by region ($M)
Improved geographic
diversity
New Zealand$119M
8%Asia
$95M7%
NorthAmerica
$209M15%
Australia$991M
70%
12%
Asia$191M 7%
New Zealand$103M
North America$641M
41%
Australia$638M41%
Note: total includes corporate costs & eliminations of $40M, excluded from pie chart
FY2007 FY2017Total: $1,373m
Note: total includes corporate costs & eliminations of $87M, excluded from pie chart
Total: $1,485m
21
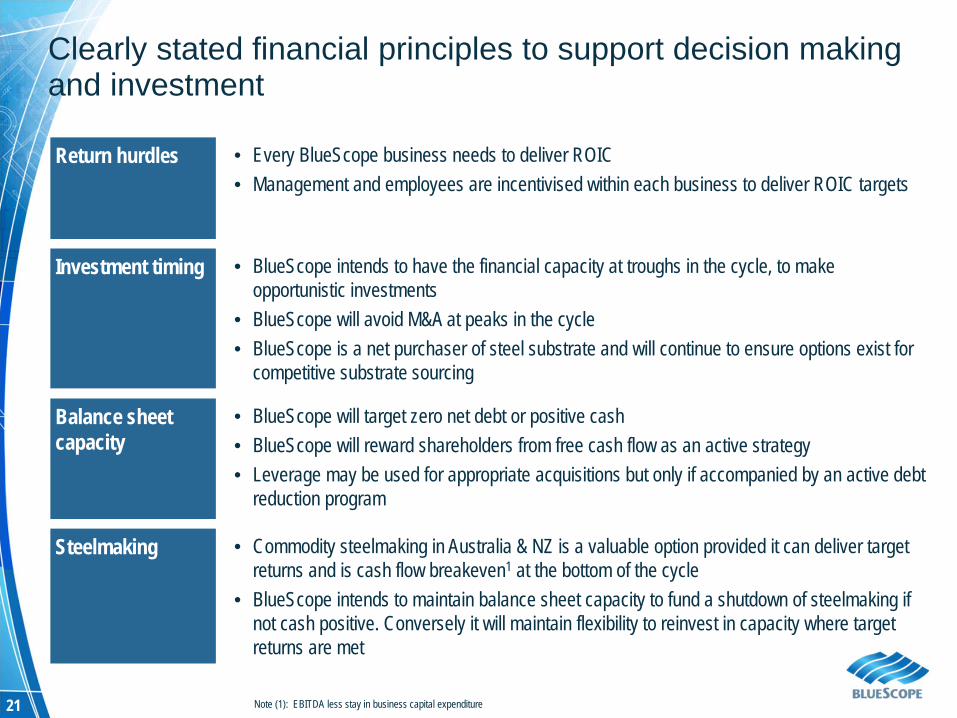
Clearly stated financial principles to support decision making and investment
Return hurdles • Every BlueScope business needs to deliver ROIC• Management and employees are incentivised within each business to deliver ROIC targets
Investment timing • BlueScope intends to have the financial capacity at troughs in the cycle, to make opportunistic investments
• BlueScope will avoid M&A at peaks in the cycle• BlueScope is a net purchaser of steel substrate and will continue to ensure options exist for
competitive substrate sourcing
Balance sheet capacity
• BlueScope will target zero net debt or positive cash• BlueScope will reward shareholders from free cash flow as an active strategy• Leverage may be used for appropriate acquisitions but only if accompanied by an active debt
reduction program
Steelmaking • Commodity steelmaking in Australia & NZ is a valuable option provided it can deliver targetreturns and is cash flow breakeven1 at the bottom of the cycle
• BlueScope intends to maintain balance sheet capacity to fund a shutdown of steelmaking if not cash positive. Conversely it will maintain flexibility to reinvest in capacity where target returns are met
Note (1): EBITDA less stay in business capital expenditure
22
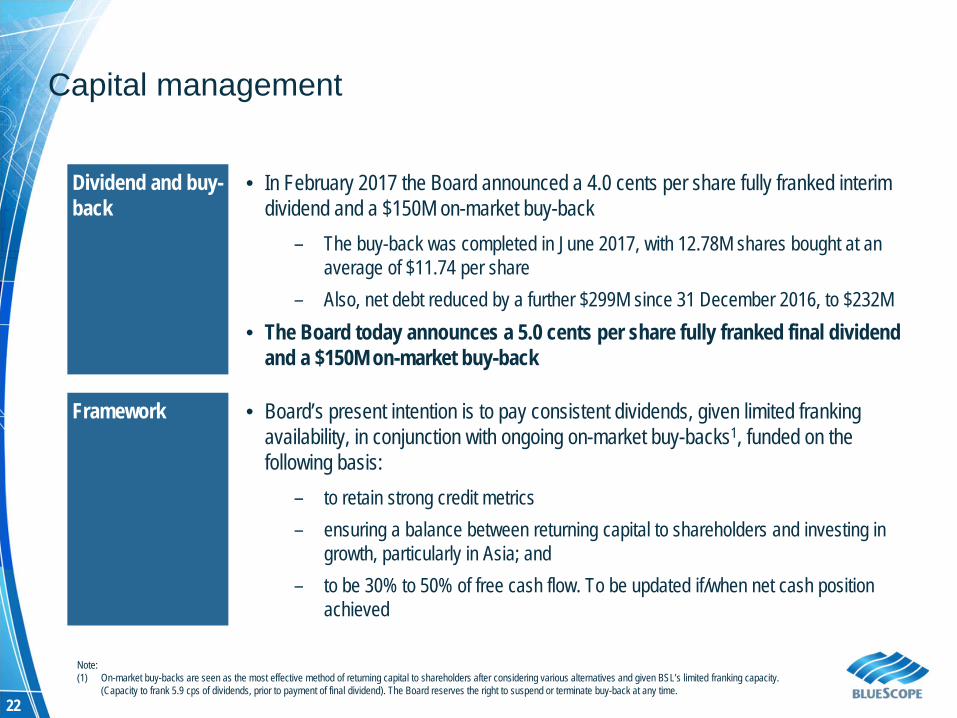
Capital management
Note:(1) On-market buy-backs are seen as the most effective method of returning capital to shareholders after considering various alternatives and given BSL’s limited franking capacity.
(Capacity to frank 5.9 cps of dividends, prior to payment of final dividend). The Board reserves the right to suspend or terminate buy-back at any time.
Dividend and buy-back
• In February 2017 the Board announced a 4.0 cents per share fully franked interim dividend and a $150M on-market buy-back
– The buy-back was completed in June 2017, with 12.78M shares bought at an average of $11.74 per share
– Also, net debt reduced by a further $299M since 31 December 2016, to $232M• The Board today announces a 5.0 cents per share fully franked final dividend
and a $150M on-market buy-back
Framework • Board’s present intention is to pay consistent dividends, given limited franking availability, in conjunction with ongoing on-market buy-backs1, funded on the following basis:
– to retain strong credit metrics – ensuring a balance between returning capital to shareholders and investing in
growth, particularly in Asia; and– to be 30% to 50% of free cash flow. To be updated if/when net cash position
achieved
23
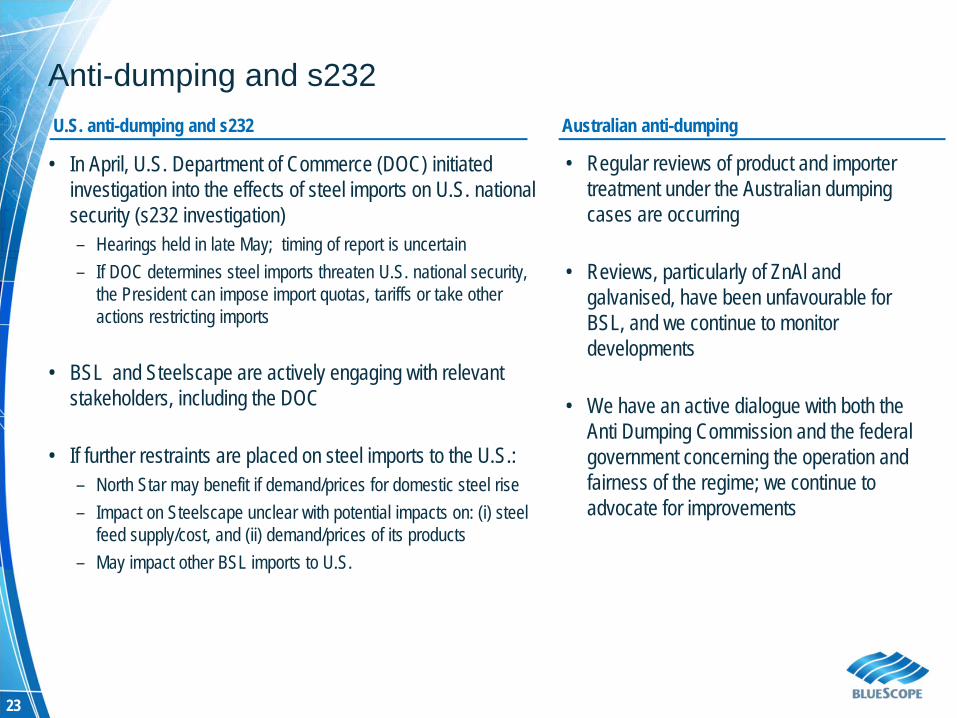
Anti-dumping and s232
• In April, U.S. Department of Commerce (DOC) initiated investigation into the effects of steel imports on U.S. national security (s232 investigation)– Hearings held in late May; timing of report is uncertain– If DOC determines steel imports threaten U.S. national security,
the President can impose import quotas, tariffs or take other actions restricting imports
• BSL and Steelscape are actively engaging with relevant stakeholders, including the DOC
• If further restraints are placed on steel imports to the U.S.:– North Star may benefit if demand/prices for domestic steel rise– Impact on Steelscape unclear with potential impacts on: (i) steel
feed supply/cost, and (ii) demand/prices of its products– May impact other BSL imports to U.S.
• Regular reviews of product and importer treatment under the Australian dumping cases are occurring
• Reviews, particularly of ZnAl and galvanised, have been unfavourable for BSL, and we continue to monitor developments
• We have an active dialogue with both the Anti Dumping Commission and the federal government concerning the operation and fairness of the regime; we continue to advocate for improvements
U.S. anti-dumping and s232 Australian anti-dumping
SEGMENTFINANCIAL RESULTS
25
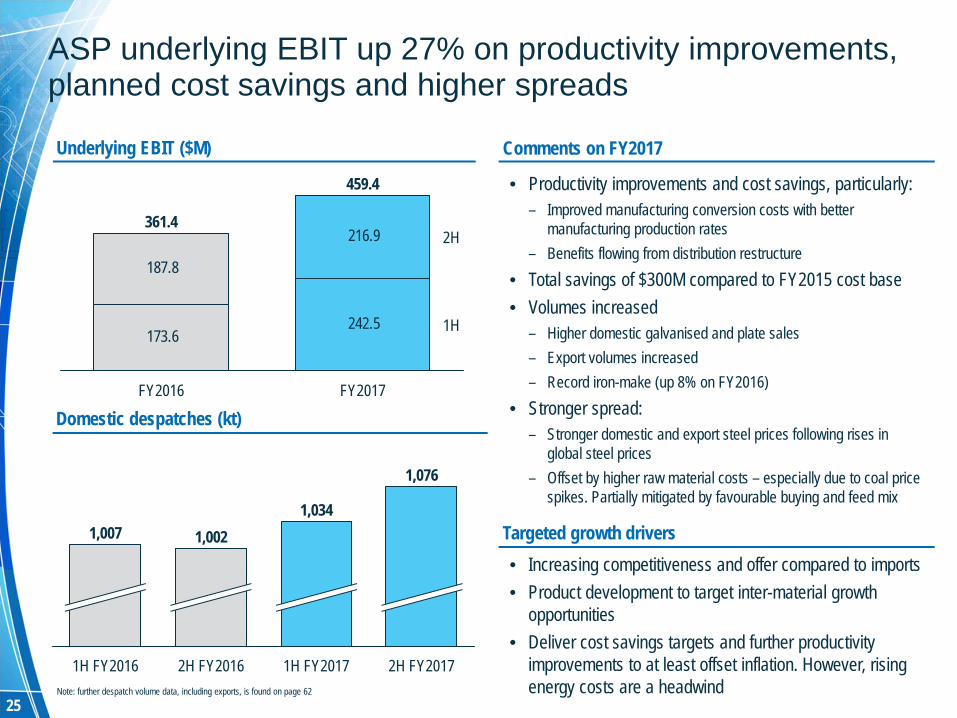
Underlying EBIT ($M) Comments on FY2017
• Productivity improvements and cost savings, particularly:– Improved manufacturing conversion costs with better
manufacturing production rates– Benefits flowing from distribution restructure
• Total savings of $300M compared to FY2015 cost base• Volumes increased
– Higher domestic galvanised and plate sales– Export volumes increased– Record iron-make (up 8% on FY2016)
• Stronger spread:– Stronger domestic and export steel prices following rises in
global steel prices– Offset by higher raw material costs – especially due to coal price
spikes. Partially mitigated by favourable buying and feed mix
ASP underlying EBIT up 27% on productivity improvements, planned cost savings and higher spreads
Domestic despatches (kt)
Targeted growth drivers• Increasing competitiveness and offer compared to imports• Product development to target inter-material growth
opportunities• Deliver cost savings targets and further productivity
improvements to at least offset inflation. However, rising energy costs are a headwind
1,076
2H FY2017
1,007
1H FY2016
1,002
2H FY2016
1,034
1H FY2017Note: further despatch volume data, including exports, is found on page 62
242.5 173.6
216.9
187.8
1H
2H
FY2017
459.4
361.4
FY2016
26
0
200
400
600
800
1,000
1,200
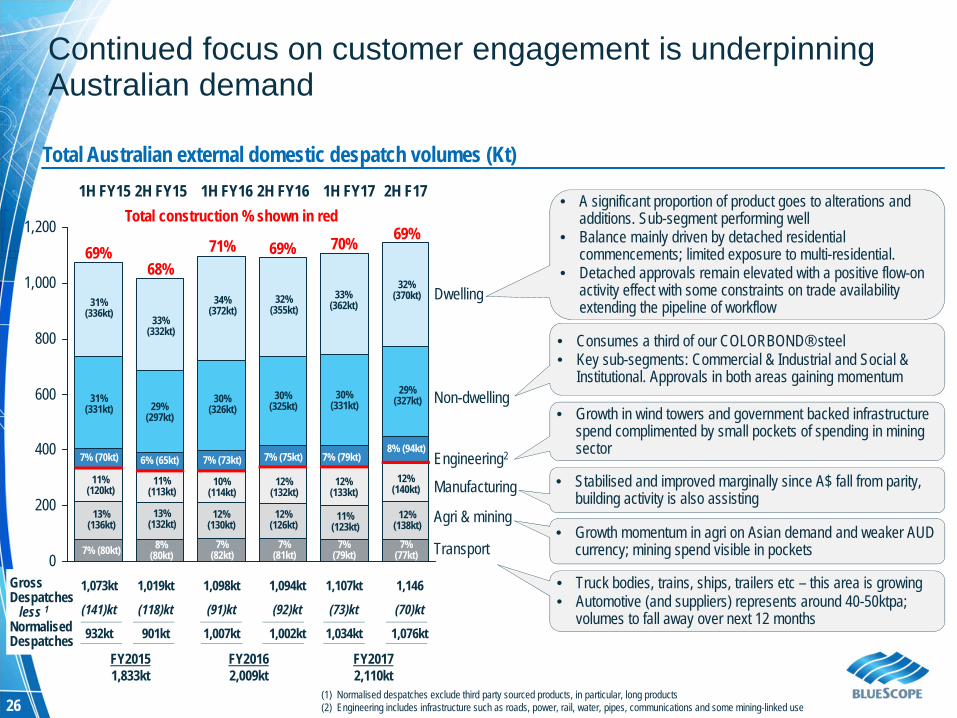
(1) Normalised despatches exclude third party sourced products, in particular, long products(2) Engineering includes infrastructure such as roads, power, rail, water, pipes, communications and some mining-linked use
1H FY15 2H FY15 1H FY16 2H FY16 1H FY17 2H F17
Total Australian external domestic despatch volumes (Kt)
Total construction % shown in red
1,073kt 1,019kt 1,098kt 1,094kt 1,107kt 1,146
(141)kt (118)kt (91)kt (92)kt (73)kt (70)kt
932kt 901kt 1,007kt 1,002kt 1,034kt 1,076kt
GrossDespatches
less 1NormalisedDespatches
Continued focus on customer engagement is underpinning Australian demand
Non-dwelling
Dwelling
Engineering2
Manufacturing
Agri & mining
Transport
6% (65kt)
11%(113kt)
13%(132kt)
8%(80kt)
29%(297kt)
33%(332kt)
69%68%
7% (70kt)
11%(120kt)
13%(136kt)
7% (80kt)
31%(331kt)
31%(336kt)
FY20151,833kt
7% (75kt)
12%(132kt)
12%(126kt)
7%(81kt)
30%(325kt)
32%(355kt)
69%
7% (73kt)
10%(114kt)
12%(130kt)
7%(82kt)
30%(326kt)
34%(372kt)
71%
FY20162,009kt
70%
7% (79kt)
12%(133kt)
11%(123kt)
7%(79kt)
30%(331kt)
33%(362kt)
FY20172,110kt
• A significant proportion of product goes to alterations and additions. Sub-segment performing well
• Balance mainly driven by detached residential commencements; limited exposure to multi-residential.
• Detached approvals remain elevated with a positive flow-on activity effect with some constraints on trade availability extending the pipeline of workflow
• Truck bodies, trains, ships, trailers etc – this area is growing• Automotive (and suppliers) represents around 40-50ktpa;
volumes to fall away over next 12 months
• Consumes a third of our COLORBOND® steel • Key sub-segments: Commercial & Industrial and Social &
Institutional. Approvals in both areas gaining momentum
• Growth in wind towers and government backed infrastructure spend complimented by small pockets of spending in mining sector
• Stabilised and improved marginally since A$ fall from parity,building activity is also assisting
• Growth momentum in agri on Asian demand and weaker AUD currency; mining spend visible in pockets
69%
8% (94kt)
29%(327kt)
32%(370kt)
12%(140kt)
12%(138kt)
7%(77kt)
27
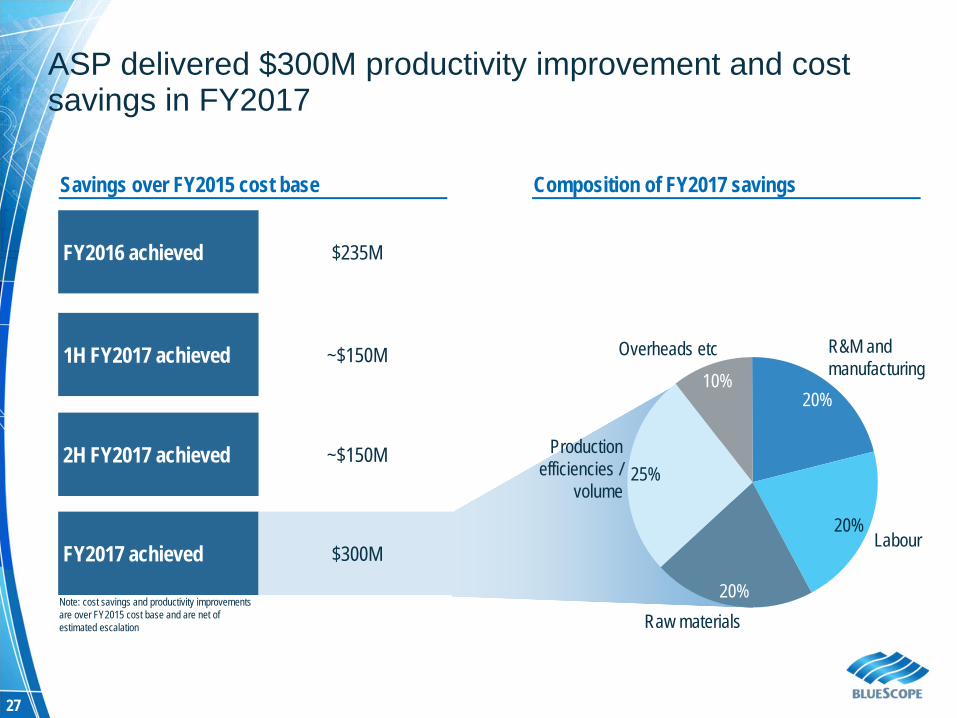
ASP delivered $300M productivity improvement and cost savings in FY2017
Note: cost savings and productivity improvements are over FY2015 cost base and are net of estimated escalation
FY2016 achieved $235M
1H FY2017 achieved ~$150M
2H FY2017 achieved ~$150M
FY2017 achieved $300M
20%
R&M andmanufacturing
20%Labour
20%Raw materials
25%Production
efficiencies /volume
10%Overheads etc
Savings over FY2015 cost base Composition of FY2017 savings
28
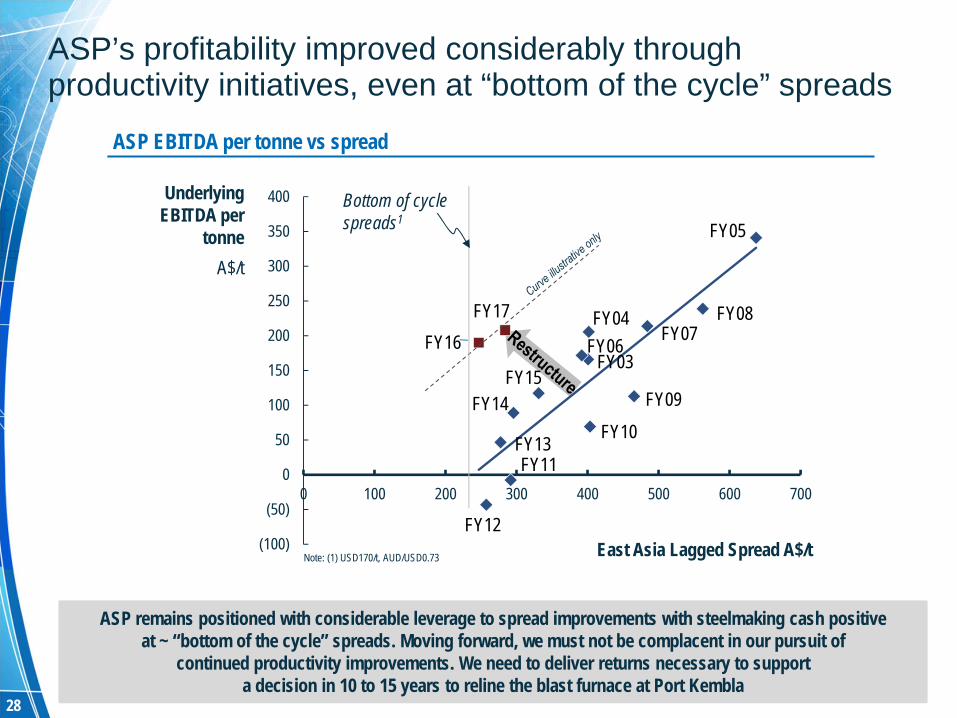
ASP’s profitability improved considerably through productivity initiatives, even at “bottom of the cycle” spreads
(100)
(50)
0
50
100
150
200
250
300
350
400
0 100 200 300 400 500 600 700
FY16
FY10
FY12
FY15
FY05
FY09
FY03
FY08
Bottom of cycle spreads1
Underlying EBITDA per
tonneA$/t
East Asia Lagged Spread A$/tNote: (1) USD170/t, AUD/USD0.73
ASP EBITDA per tonne vs spread
ASP remains positioned with considerable leverage to spread improvements with steelmaking cash positiveat ~ “bottom of the cycle” spreads. Moving forward, we must not be complacent in our pursuit of
continued productivity improvements. We need to deliver returns necessary to supporta decision in 10 to 15 years to reline the blast furnace at Port Kembla
FY07FY04
FY11FY13
FY14
FY06
FY17
29
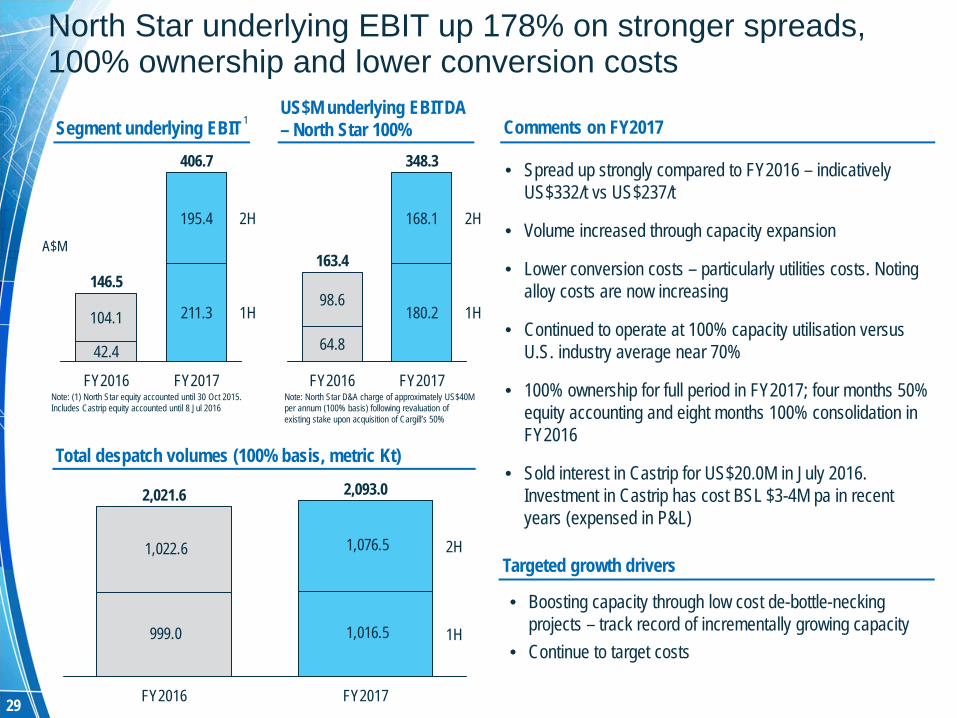
Comments on FY2017
• Spread up strongly compared to FY2016 – indicatively US$332/t vs US$237/t
• Volume increased through capacity expansion
• Lower conversion costs – particularly utilities costs. Noting alloy costs are now increasing
• Continued to operate at 100% capacity utilisation versus U.S. industry average near 70%
• 100% ownership for full period in FY2017; four months 50% equity accounting and eight months 100% consolidation in FY2016
• Sold interest in Castrip for US$20.0M in July 2016. Investment in Castrip has cost BSL $3-4M pa in recent years (expensed in P&L)
North Star underlying EBIT up 178% on stronger spreads,100% ownership and lower conversion costs
Total despatch volumes (100% basis, metric Kt)
Note: North Star D&A charge of approximately US$40M per annum (100% basis) following revaluation of existing stake upon acquisition of Cargill’s 50%
Note: (1) North Star equity accounted until 30 Oct 2015. Includes Castrip equity accounted until 8 Jul 2016
Segment underlying EBIT
Targeted growth drivers
• Boosting capacity through low cost de-bottle-necking projects – track record of incrementally growing capacity
• Continue to target costs
US$M underlying EBITDA – North Star 100%1
A$M
104.1
42.4
195.4
146.5
211.3
FY2016
406.7
1H
2H
FY2017
1H
2H
FY2017
348.3
180.2
168.1
FY2016
163.4
64.8
98.6
1,022.6 1,076.5
1,016.5 999.0 1H
2H
FY2017
2,093.0
FY2016
2,021.6
30
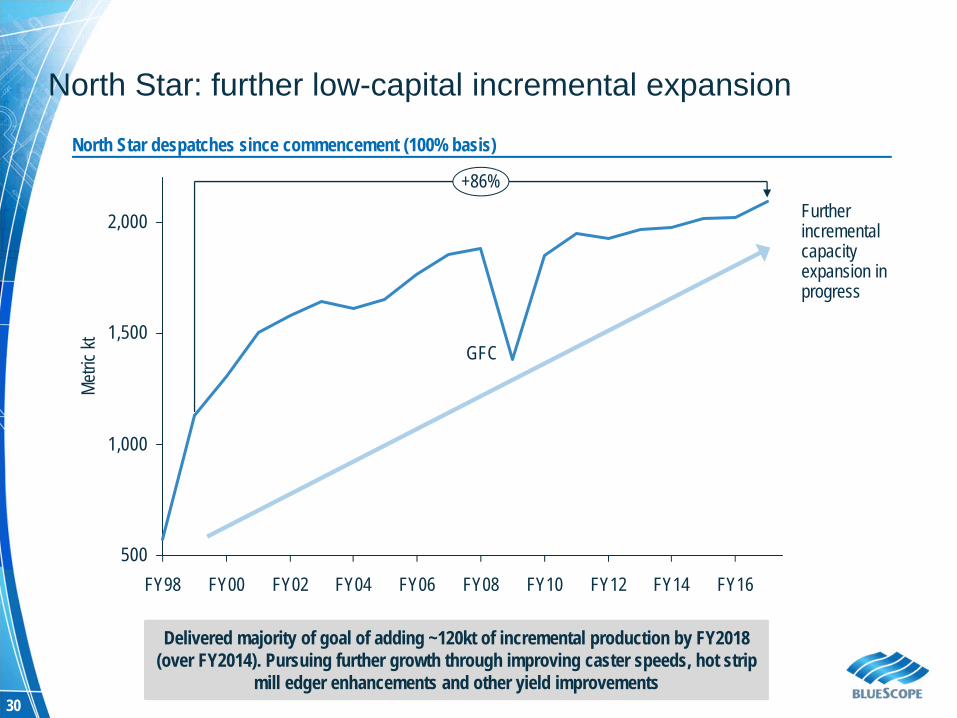
North Star: further low-capital incremental expansion
500
1,000
1,500
2,000
FY02 FY08 FY14FY98 FY00 FY04 FY06 FY10 FY12 FY16
Metric
kt
+86%Furtherincremental capacity expansion in progress
GFC
North Star despatches since commencement (100% basis)
Delivered majority of goal of adding ~120kt of incremental production by FY2018 (over FY2014). Pursuing further growth through improving caster speeds, hot strip
mill edger enhancements and other yield improvements
31
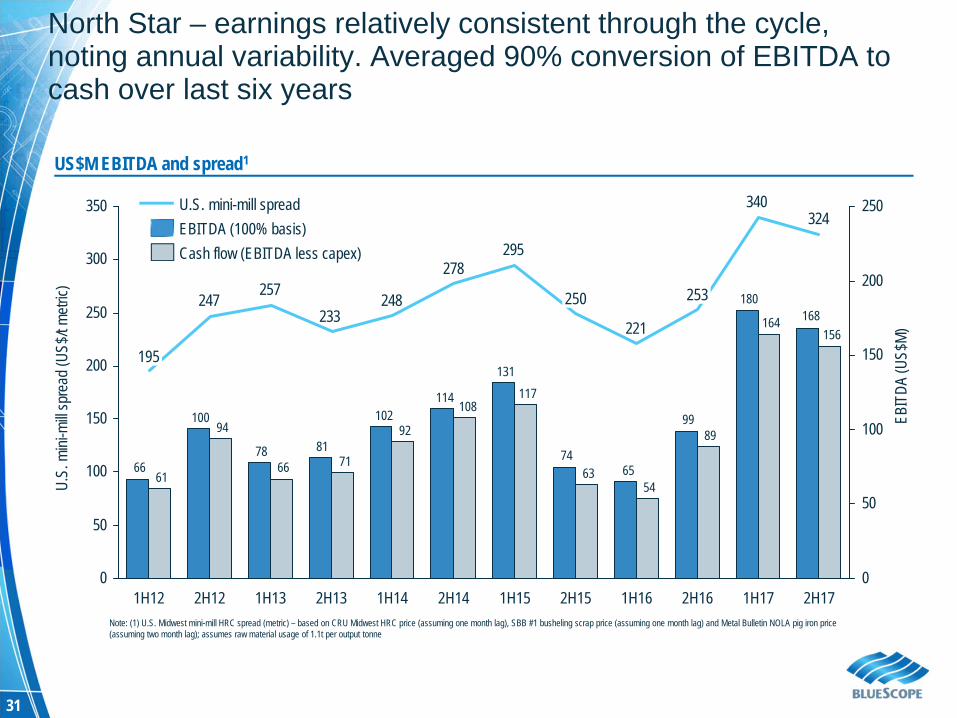
North Star – earnings relatively consistent through the cycle, noting annual variability. Averaged 90% conversion of EBITDA to cash over last six years
168180
99
6574
131
114102
8178
100
66
156164
89
5463
117108
92
7166
94
61
324340
221
295278
248233
257247
0
50
100
150
200
250
0
50
100
150
200
250
300
350
1H172H161H162H151H152H141H142H131H132H121H12 2H17
250
195
253
EBITDA (100% basis)U.S. mini-mill spread
Cash flow (EBITDA less capex)
US$M EBITDA and spread1
Note: (1) U.S. Midwest mini-mill HRC spread (metric) – based on CRU Midwest HRC price (assuming one month lag), SBB #1 busheling scrap price (assuming one month lag) and Metal Bulletin NOLA pig iron price (assuming two month lag); assumes raw material usage of 1.1t per output tonne
U.S.
mini
-mill
spre
ad (U
S$/t m
etric)
EBIT
DA (U
S$M)
32
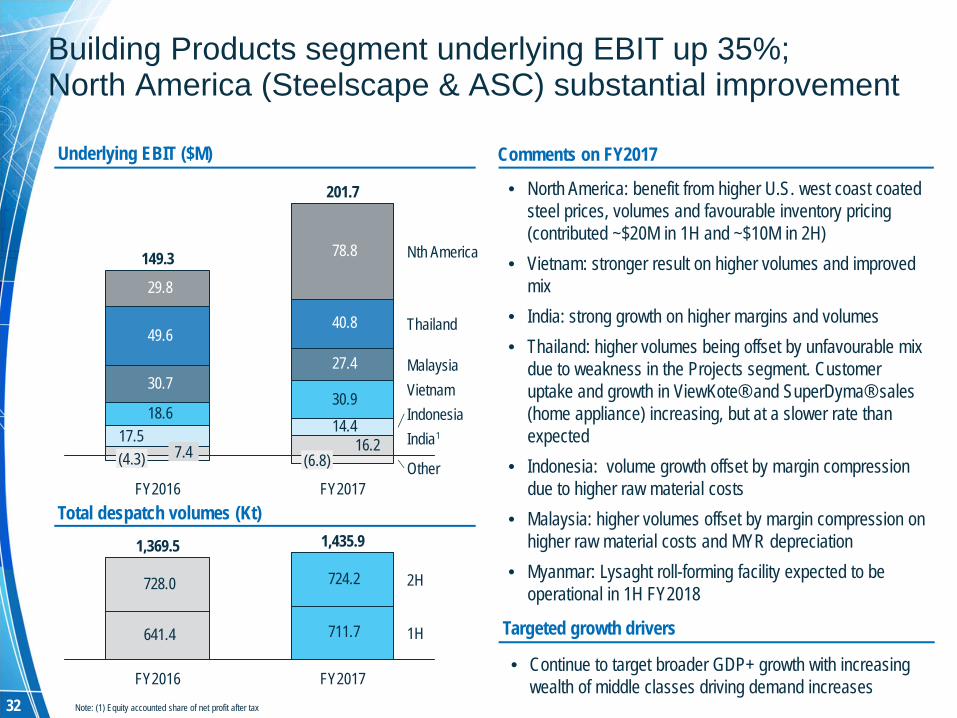
Underlying EBIT ($M) Comments on FY2017
• North America: benefit from higher U.S. west coast coated steel prices, volumes and favourable inventory pricing (contributed ~$20M in 1H and ~$10M in 2H)
• Vietnam: stronger result on higher volumes and improved mix
• India: strong growth on higher margins and volumes• Thailand: higher volumes being offset by unfavourable mix
due to weakness in the Projects segment. Customer uptake and growth in ViewKote® and SuperDyma® sales (home appliance) increasing, but at a slower rate than expected
• Indonesia: volume growth offset by margin compression due to higher raw material costs
• Malaysia: higher volumes offset by margin compression on higher raw material costs and MYR depreciation
• Myanmar: Lysaght roll-forming facility expected to be operational in 1H FY2018
Total despatch volumes (Kt)
Building Products segment underlying EBIT up 35%;North America (Steelscape & ASC) substantial improvement
Targeted growth drivers
• Continue to target broader GDP+ growth with increasing wealth of middle classes driving demand increases
Note: (1) Equity accounted share of net profit after tax
1
49.6 40.8
29.8
78.8
16.2 14.4 17.5
30.9 18.6
27.4 30.7
Other
IndiaIndonesia
Thailand
VietnamMalaysia
Nth America
FY2017
201.7
(6.8)
FY2016
149.3
(4.3) 7.4
641.4 711.7
728.0 724.2
1H
2H
FY2017
1,435.9
FY2016
1,369.5
33
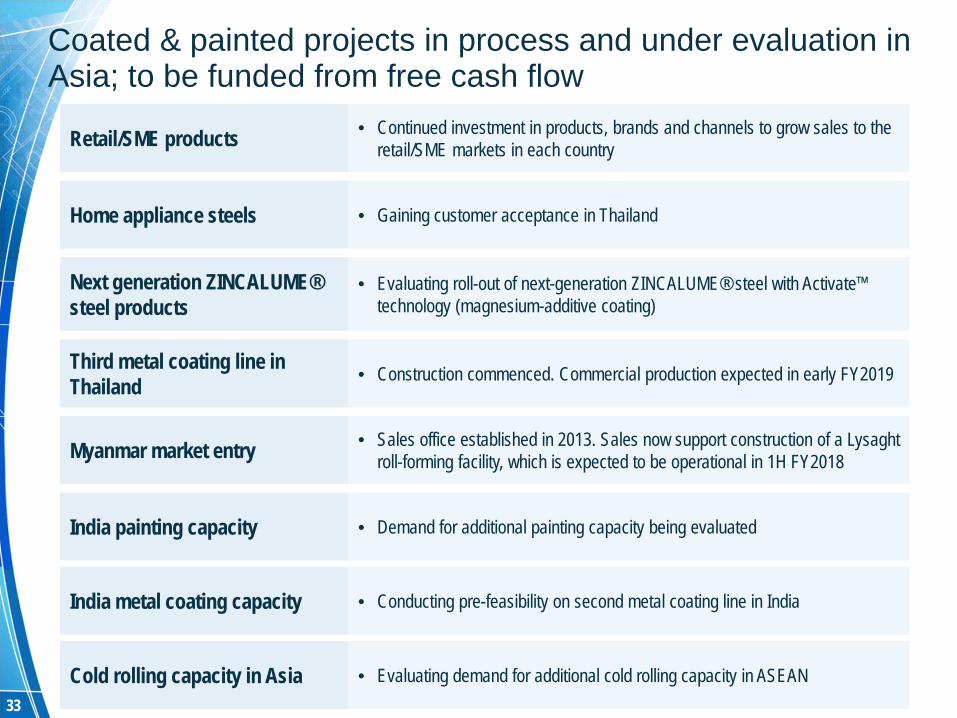
Coated & painted projects in process and under evaluation in Asia; to be funded from free cash flow
Retail/SME products • Continued investment in products, brands and channels to grow sales to the retail/SME markets in each country
Home appliance steels • Gaining customer acceptance in Thailand
Next generation ZINCALUME® steel products
• Evaluating roll-out of next-generation ZINCALUME® steel with Activate™ technology (magnesium-additive coating)
Third metal coating line in Thailand • Construction commenced. Commercial production expected in early FY2019
Myanmar market entry • Sales office established in 2013. Sales now support construction of a Lysaght roll-forming facility, which is expected to be operational in 1H FY2018
India painting capacity • Demand for additional painting capacity being evaluated
India metal coating capacity • Conducting pre-feasibility on second metal coating line in India
Cold rolling capacity in Asia • Evaluating demand for additional cold rolling capacity in ASEAN
34
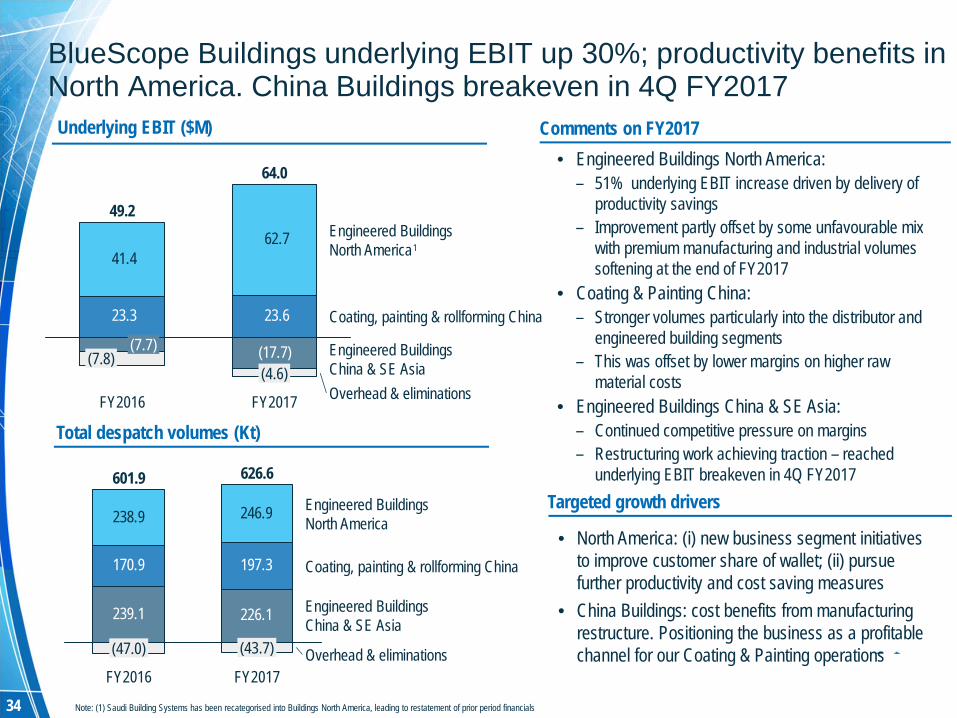
Underlying EBIT ($M) Comments on FY2017
BlueScope Buildings underlying EBIT up 30%; productivity benefits in North America. China Buildings breakeven in 4Q FY2017
Total despatch volumes (Kt)
• Engineered Buildings North America:– 51% underlying EBIT increase driven by delivery of
productivity savings– Improvement partly offset by some unfavourable mix
with premium manufacturing and industrial volumes softening at the end of FY2017
• Coating & Painting China:– Stronger volumes particularly into the distributor and
engineered building segments– This was offset by lower margins on higher raw
material costs• Engineered Buildings China & SE Asia:
– Continued competitive pressure on margins– Restructuring work achieving traction – reached
underlying EBIT breakeven in 4Q FY2017Targeted growth drivers
• North America: (i) new business segment initiatives to improve customer share of wallet; (ii) pursue further productivity and cost saving measures
• China Buildings: cost benefits from manufacturing restructure. Positioning the business as a profitable channel for our Coating & Painting operations
23.3 23.6
41.4 62.7
(17.7)(4.6)
FY2016
49.2
(7.8)(7.7)
Overhead & eliminations
Engineered BuildingsChina & SE Asia
Coating, painting & rollforming China
Engineered BuildingsNorth America
FY2017
64.0
239.1 226.1
170.9 197.3
238.9 246.9
Overhead & eliminations
Engineered BuildingsChina & SE Asia
Coating, painting & rollforming China
Engineered BuildingsNorth America
FY2017
626.6
(43.7)
FY2016
601.9
(47.0)
Note: (1) Saudi Building Systems has been recategorised into Buildings North America, leading to restatement of prior period financials
1
35
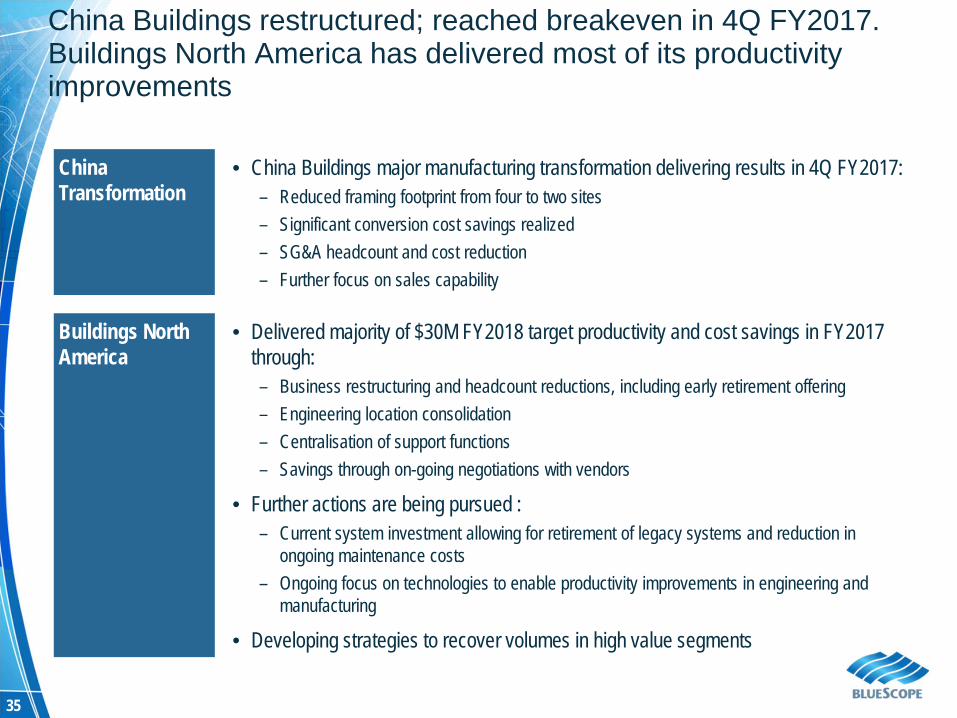
China Buildings restructured; reached breakeven in 4Q FY2017. Buildings North America has delivered most of its productivity improvements
China Transformation
• China Buildings major manufacturing transformation delivering results in 4Q FY2017:– Reduced framing footprint from four to two sites– Significant conversion cost savings realized– SG&A headcount and cost reduction– Further focus on sales capability
Buildings North America
• Delivered majority of $30M FY2018 target productivity and cost savings in FY2017 through:– Business restructuring and headcount reductions, including early retirement offering– Engineering location consolidation – Centralisation of support functions– Savings through on-going negotiations with vendors
• Further actions are being pursued :– Current system investment allowing for retirement of legacy systems and reduction in
ongoing maintenance costs– Ongoing focus on technologies to enable productivity improvements in engineering and
manufacturing
• Developing strategies to recover volumes in high value segments
36
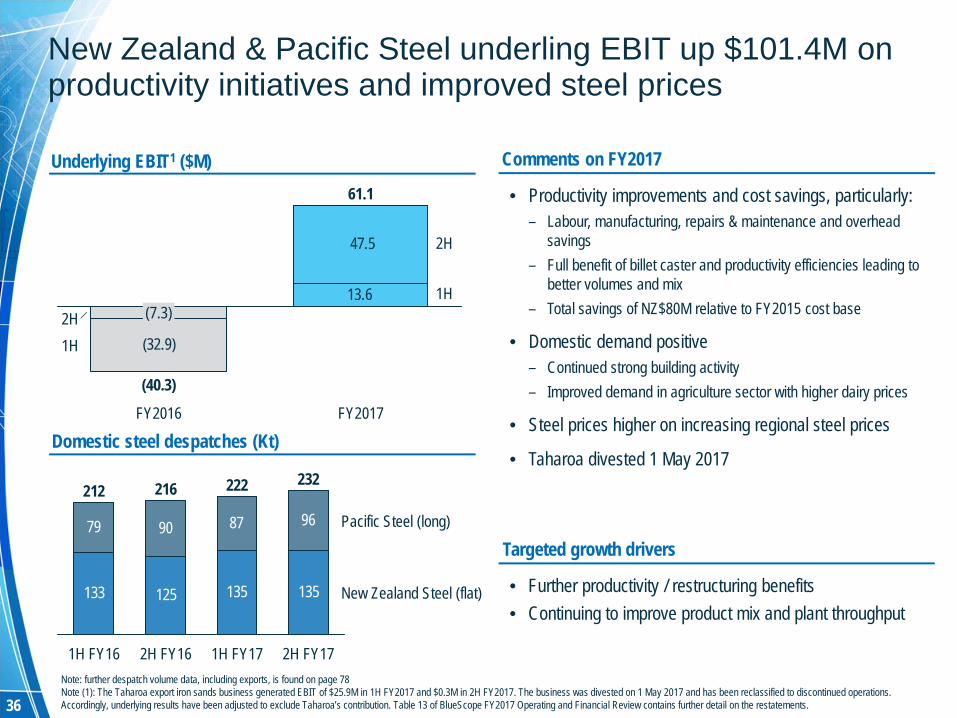
Comments on FY2017Underlying EBIT1 ($M)
Domestic steel despatches (Kt)
New Zealand & Pacific Steel underling EBIT up $101.4M on productivity initiatives and improved steel prices
• Productivity improvements and cost savings, particularly:– Labour, manufacturing, repairs & maintenance and overhead
savings– Full benefit of billet caster and productivity efficiencies leading to
better volumes and mix– Total savings of NZ$80M relative to FY2015 cost base
• Domestic demand positive– Continued strong building activity– Improved demand in agriculture sector with higher dairy prices
• Steel prices higher on increasing regional steel prices
• Taharoa divested 1 May 2017
Targeted growth drivers
• Further productivity / restructuring benefits• Continuing to improve product mix and plant throughput
(32.9)
47.5
13.6
1H2H
FY2017FY2016
(40.3)
61.1
(7.3)1H
2H
133 125 135
79 90 87
135
96
2H FY161H FY16
216212
Pacific Steel (long)
1H FY17
222
2H FY17
New Zealand Steel (flat)
232
Note: further despatch volume data, including exports, is found on page 78Note (1): The Taharoa export iron sands business generated EBIT of $25.9M in 1H FY2017 and $0.3M in 2H FY2017. The business was divested on 1 May 2017 and has been reclassified to discontinued operations. Accordingly, underlying results have been adjusted to exclude Taharoa’s contribution. Table 13 of BlueScope FY2017 Operating and Financial Review contains further detail on the restatements.
37
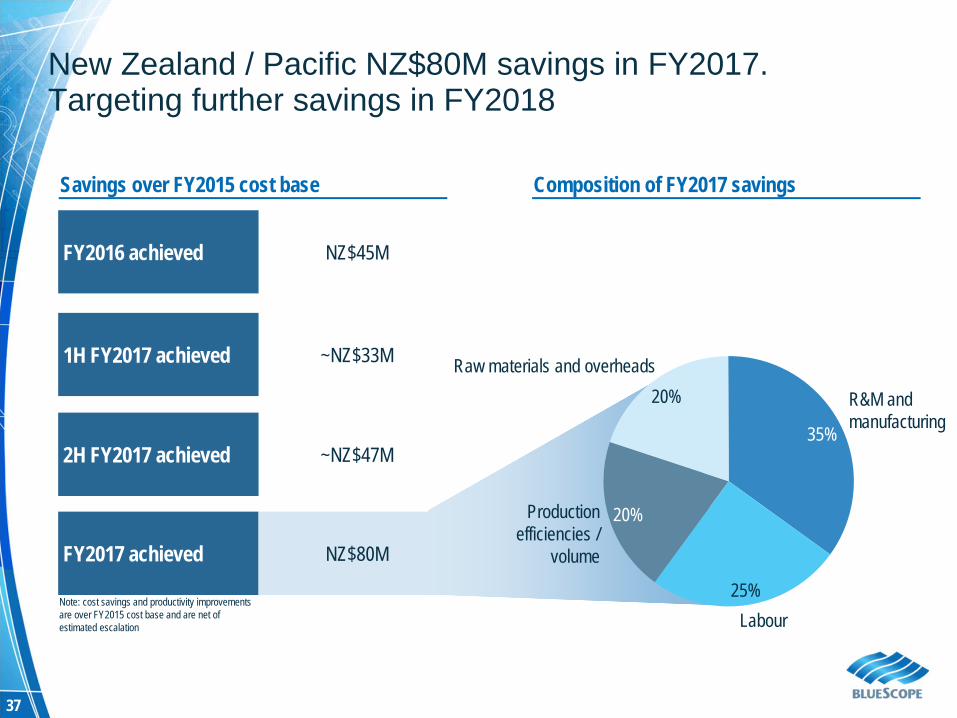
New Zealand / Pacific NZ$80M savings in FY2017. Targeting further savings in FY2018
Note: cost savings and productivity improvements are over FY2015 cost base and are net of estimated escalation
FY2016 achieved NZ$45M
1H FY2017 achieved ~NZ$33M
2H FY2017 achieved ~NZ$47M
FY2017 achieved NZ$80M
Savings over FY2015 cost base Composition of FY2017 savings
25%
20%
Labour
Productionefficiencies /
volume
R&M andmanufacturing35%
Raw materials and overheads20%
GROUP FINANCIALS
39
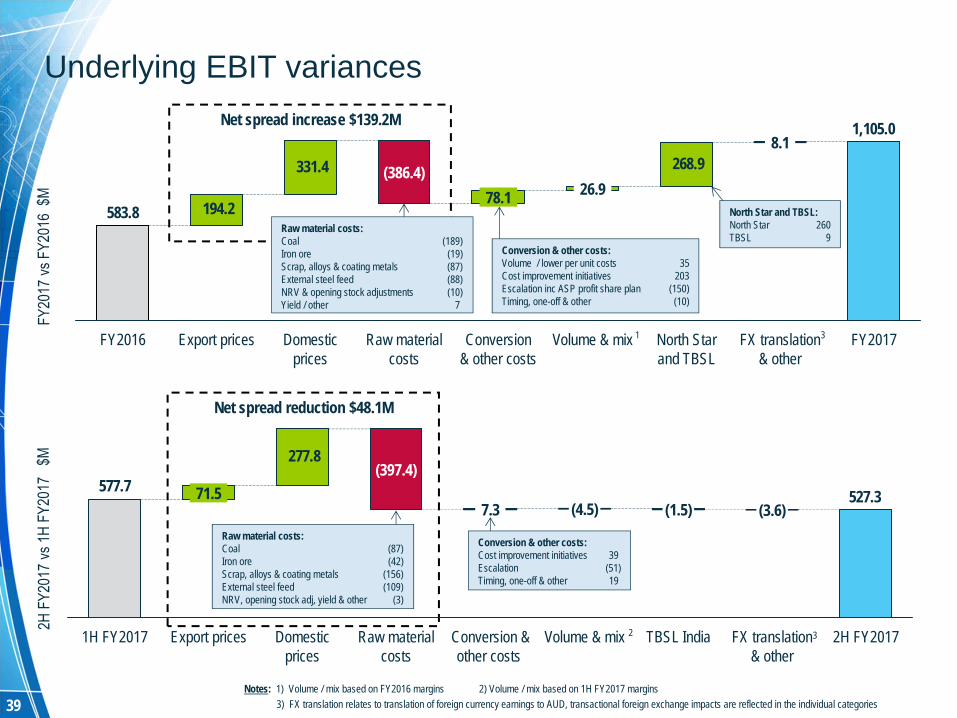
Net spread reduction $48.1M
194.2
331.4 268.9
1,105.0
583.8
FY2017FX translation & other
8.1
North Star and TBSL
Volume & mix
26.9
Conversion & other costs
78.1
Raw material costs
(386.4)
Domestic prices
Export pricesFY2016
Notes: 1) Volume / mix based on FY2016 margins 2) Volume / mix based on 1H FY2017 margins3) FX translation relates to translation of foreign currency earnings to AUD, transactional foreign exchange impacts are reflected in the individual categories
1
527.3
277.8
577.7
2H FY2017FX translation & other
(3.6)
TBSL India
(1.5)
Volume & mix
(4.5)
Conversion & other costs
7.3
Raw material costs
(397.4)
Domestic prices
Export prices
71.5
1H FY2017
Underlying EBIT variances
2
3
3
Conversion & other costs:Cost improvement initiatives 39Escalation (51)Timing, one-off & other 19
Raw material costs:Coal (87)Iron ore (42)Scrap, alloys & coating metals (156)External steel feed (109)NRV, opening stock adj, yield & other (3)
Conversion & other costs:Volume / lower per unit costs 35Cost improvement initiatives 203Escalation inc ASP profit share plan (150)Timing, one-off & other (10)
North Star and TBSL:North Star 260TBSL 9
Net spread increase $139.2M
Raw material costs:Coal (189)Iron ore (19)Scrap, alloys & coating metals (87)External steel feed (88)NRV & opening stock adjustments (10)Yield / other 7
40
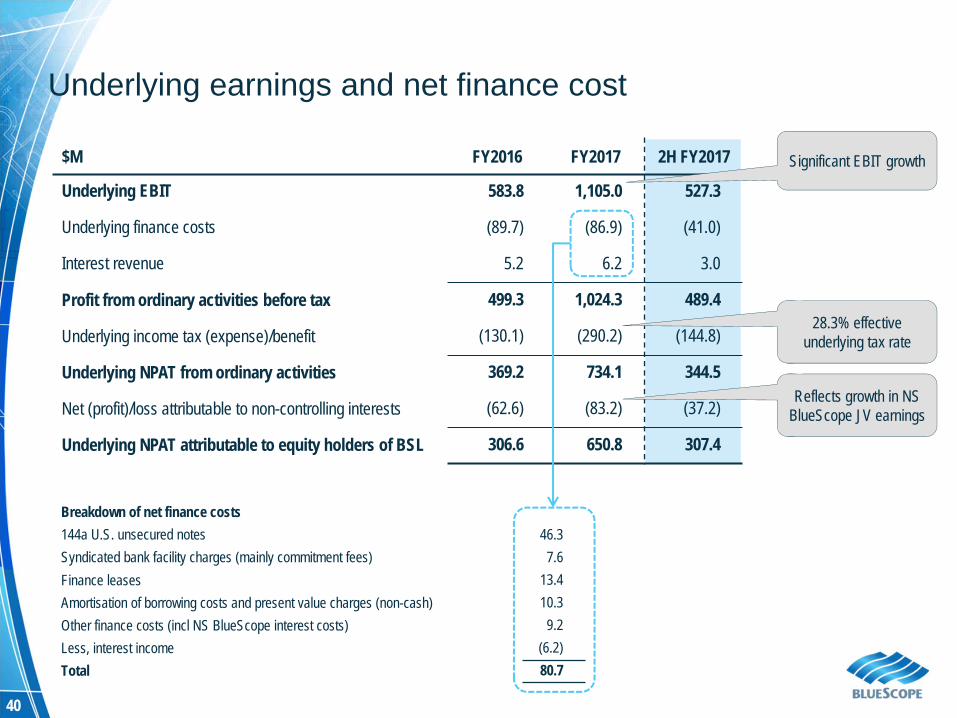
Underlying earnings and net finance cost
$M FY2016 FY2017 2H FY2017
Underlying EBIT 583.8 1,105.0 527.3
Underlying finance costs (89.7) (86.9) (41.0)
Interest revenue 5.2 6.2 3.0
Profit from ordinary activities before tax 499.3 1,024.3 489.4
Underlying income tax (expense)/benefit (130.1) (290.2) (144.8)
Underlying NPAT from ordinary activities 369.2 734.1 344.5
Net (profit)/loss attributable to non-controlling interests (62.6) (83.2) (37.2)
Underlying NPAT attributable to equity holders of BSL 306.6 650.8 307.4
Significant EBIT growth
28.3% effective underlying tax rate
Breakdown of net finance costs144a U.S. unsecured notes 46.3Syndicated bank facility charges (mainly commitment fees) 7.6Finance leases 13.4Amortisation of borrowing costs and present value charges (non-cash) 10.3Other finance costs (incl NS BlueScope interest costs) 9.2Less, interest income (6.2)Total 80.7
Reflects growth in NS BlueScope JV earnings
41
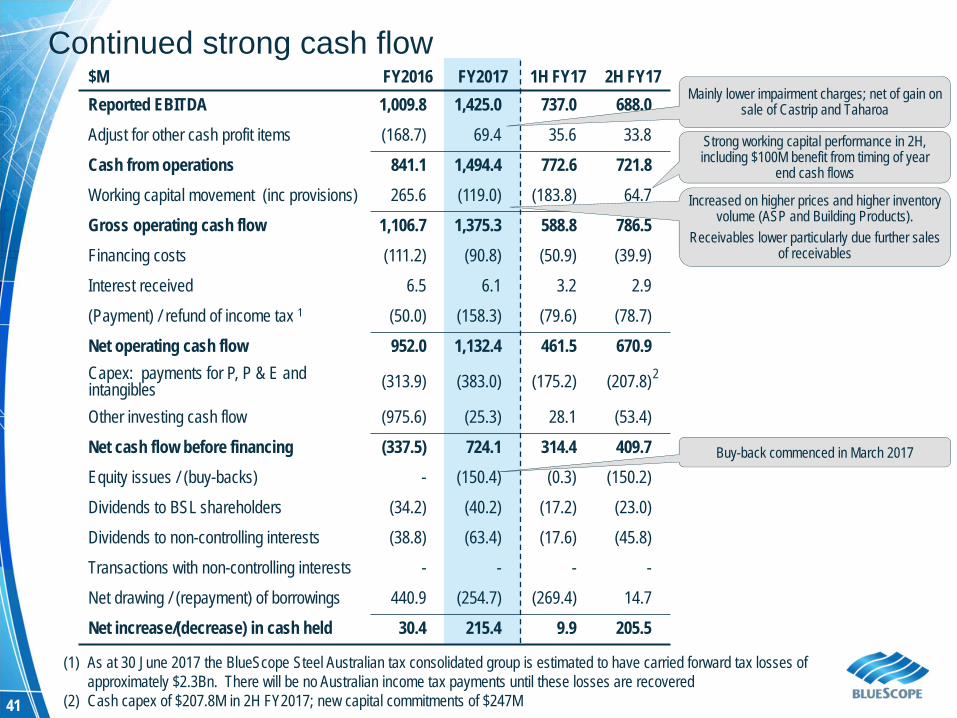
$M FY2016 FY2017 1H FY17 2H FY17Reported EBITDA 1,009.8 1,425.0 737.0 688.0Adjust for other cash profit items (168.7) 69.4 35.6 33.8
Cash from operations 841.1 1,494.4 772.6 721.8Working capital movement (inc provisions) 265.6 (119.0) (183.8) 64.7
Gross operating cash flow 1,106.7 1,375.3 588.8 786.5Financing costs (111.2) (90.8) (50.9) (39.9)
Interest received 6.5 6.1 3.2 2.9
(Payment) / refund of income tax 1 (50.0) (158.3) (79.6) (78.7)
Net operating cash flow 952.0 1,132.4 461.5 670.9Capex: payments for P, P & E and intangibles (313.9) (383.0) (175.2) (207.8)
Other investing cash flow (975.6) (25.3) 28.1 (53.4)
Net cash flow before financing (337.5) 724.1 314.4 409.7Equity issues / (buy-backs) - (150.4) (0.3) (150.2)
Dividends to BSL shareholders (34.2) (40.2) (17.2) (23.0)
Dividends to non-controlling interests (38.8) (63.4) (17.6) (45.8)
Transactions with non-controlling interests - - - -
Net drawing / (repayment) of borrowings 440.9 (254.7) (269.4) 14.7
Net increase/(decrease) in cash held 30.4 215.4 9.9 205.5
(1) As at 30 June 2017 the BlueScope Steel Australian tax consolidated group is estimated to have carried forward tax losses of approximately $2.3Bn. There will be no Australian income tax payments until these losses are recovered
(2) Cash capex of $207.8M in 2H FY2017; new capital commitments of $247M
Continued strong cash flow
Increased on higher prices and higher inventory volume (ASP and Building Products).
Receivables lower particularly due further sales of receivables
2
Mainly lower impairment charges; net of gain on sale of Castrip and Taharoa
Buy-back commenced in March 2017
Strong working capital performance in 2H, including $100M benefit from timing of year
end cash flows
42
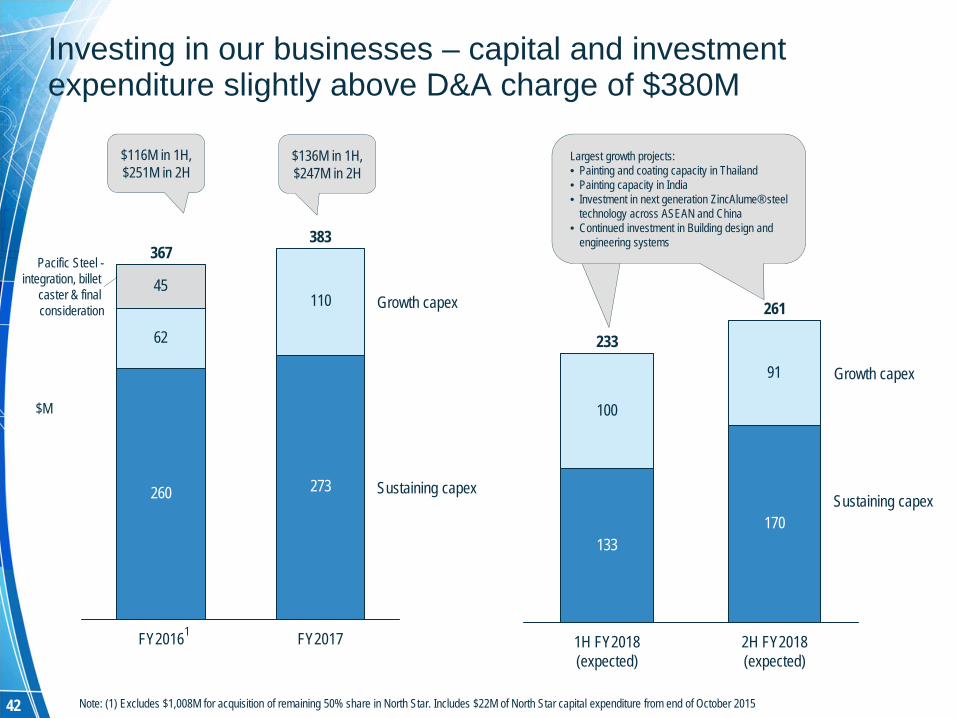
Investing in our businesses – capital and investment expenditure slightly above D&A charge of $380M
Note: (1) Excludes $1,008M for acquisition of remaining 50% share in North Star. Includes $22M of North Star capital expenditure from end of October 2015
1
260 273
62
11045
FY2016
367
Sustaining capex
Pacific Steel -integration, billet
caster & final consideration
FY2017
Growth capex
383
$116M in 1H,$251M in 2H
$136M in 1H,$247M in 2H
$M
133170
100
91 Growth capex
2H FY2018(expected)
261
1H FY2018 (expected)
233
Largest growth projects:• Painting and coating capacity in Thailand• Painting capacity in India• Investment in next generation ZincAlume® steel
technology across ASEAN and China• Continued investment in Building design and
engineering systems
Sustaining capex
43
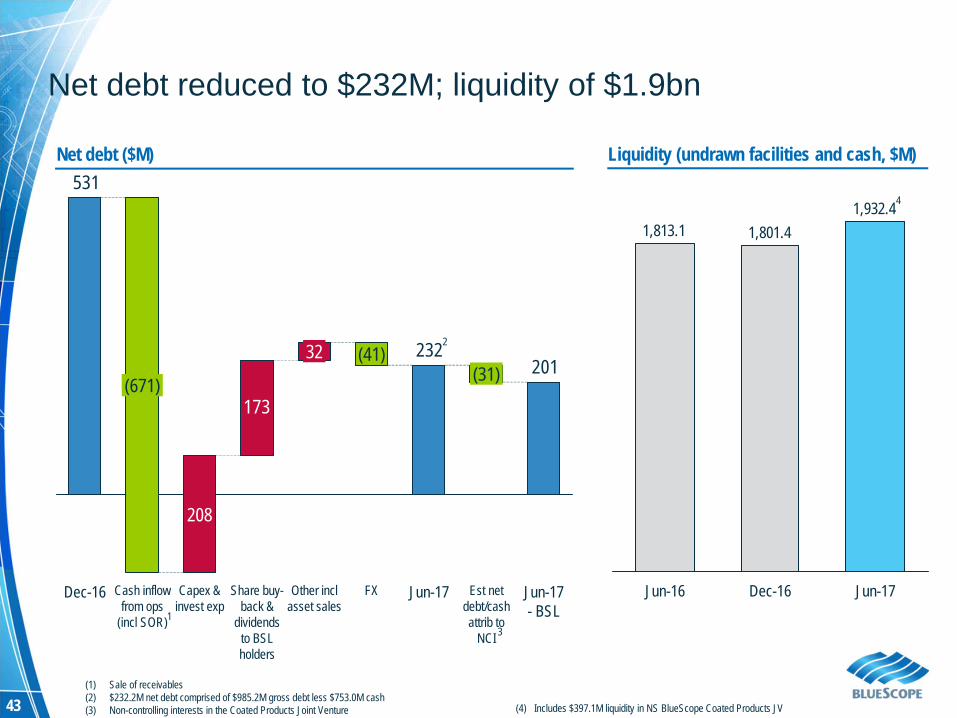
Net debt reduced to $232M; liquidity of $1.9bn
Net debt ($M)
1,932.4 1,801.4 1,813.1
Jun-17Dec-16Jun-16
Liquidity (undrawn facilities and cash, $M)
4
(4) Includes $397.1M liquidity in NS BlueScope Coated Products JV
201232
173
531
(671)
Dec-16 Est net debt/cash attrib to
NCI
Jun-17 - BSL
(31)
Jun-17Other incl asset sales
FX
208
(41)32
Share buy-back &
dividends to BSL holders
Capex & invest exp
Cash inflow from ops
(incl SOR)
(1) Sale of receivables(2) $232.2M net debt comprised of $985.2M gross debt less $753.0M cash(3) Non-controlling interests in the Coated Products Joint Venture
13
2
44
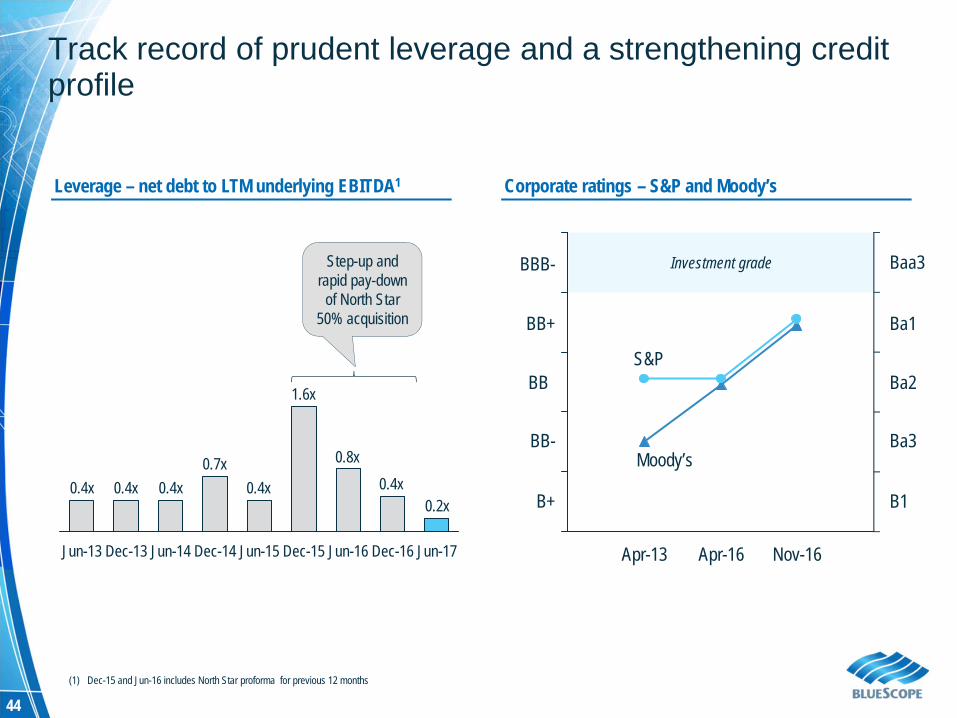
Investment grade
Track record of prudent leverage and a strengthening credit profile
Leverage – net debt to LTM underlying EBITDA1 Corporate ratings – S&P and Moody’s
0.2x0.4x
0.8x
1.6x
0.4x0.7x
0.4x0.4x0.4x
Dec-14Jun-14Jun-13 Jun-15 Dec-15Dec-13 Jun-17Dec-16Jun-16
(1) Dec-15 and Jun-16 includes North Star proforma for previous 12 months
Step-up and rapid pay-down
of North Star 50% acquisition
Nov-16Apr-16Apr-13
B+
BB-
BB
BB+
BBB-
B1
Ba3
Ba2
Ba1
Baa3
S&P
Moody’s

OUTLOOK & SUMMARY
46
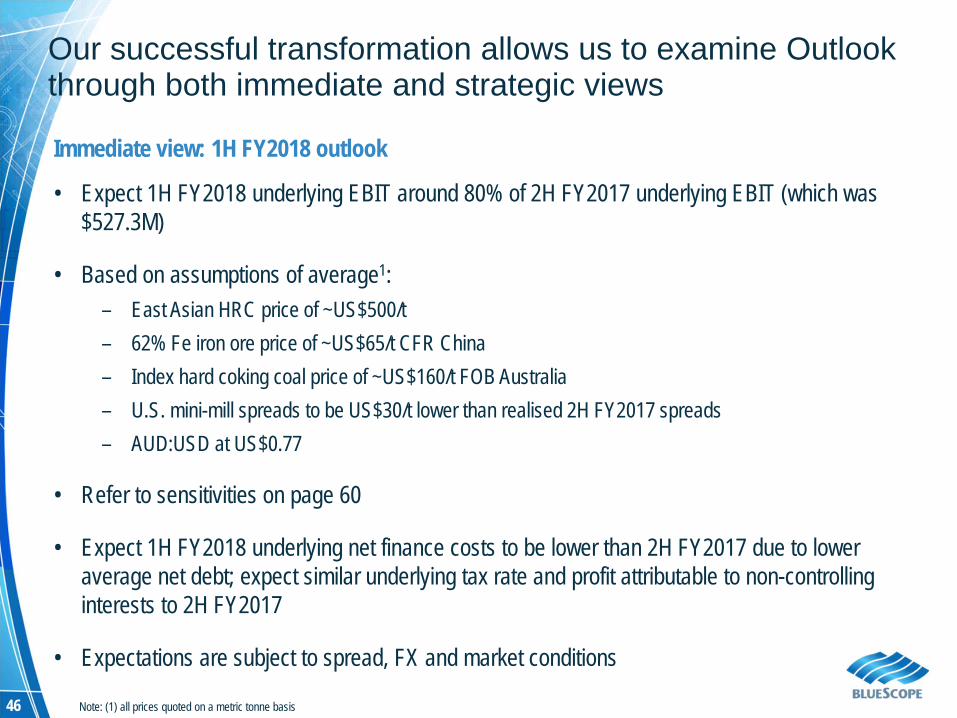
Immediate view: 1H FY2018 outlook
• Expect 1H FY2018 underlying EBIT around 80% of 2H FY2017 underlying EBIT (which was $527.3M)
• Based on assumptions of average1:– East Asian HRC price of ~US$500/t– 62% Fe iron ore price of ~US$65/t CFR China – Index hard coking coal price of ~US$160/t FOB Australia– U.S. mini-mill spreads to be US$30/t lower than realised 2H FY2017 spreads– AUD:USD at US$0.77
• Refer to sensitivities on page 60
• Expect 1H FY2018 underlying net finance costs to be lower than 2H FY2017 due to lower average net debt; expect similar underlying tax rate and profit attributable to non-controlling interests to 2H FY2017
• Expectations are subject to spread, FX and market conditions
Our successful transformation allows us to examine Outlook through both immediate and strategic views
Note: (1) all prices quoted on a metric tonne basis
47
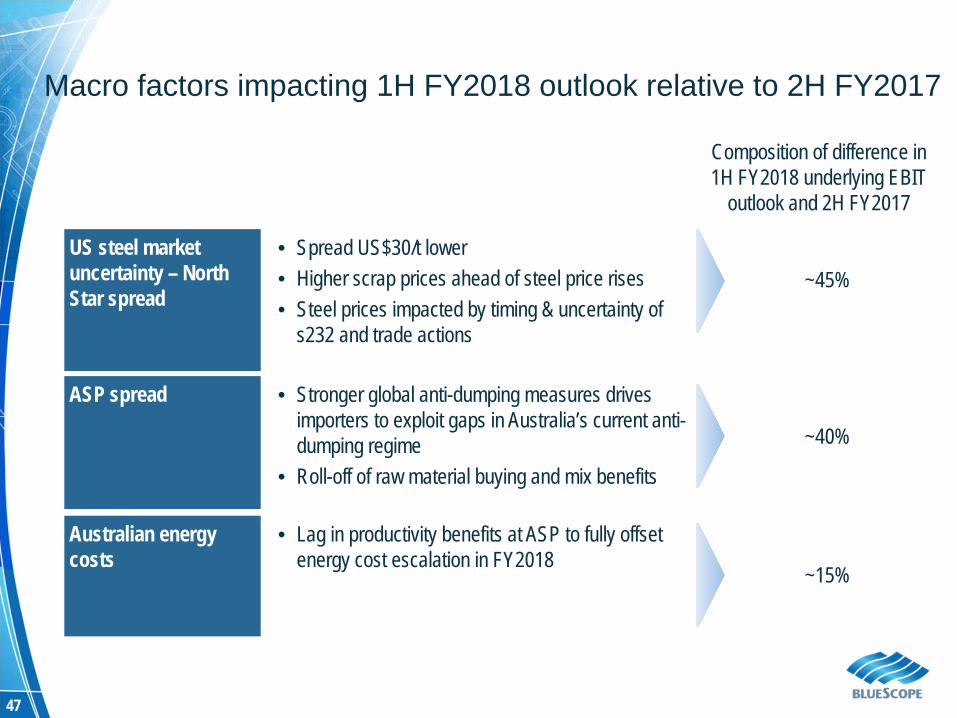
Macro factors impacting 1H FY2018 outlook relative to 2H FY2017
US steel market uncertainty – North Star spread
• Spread US$30/t lower• Higher scrap prices ahead of steel price rises• Steel prices impacted by timing & uncertainty of
s232 and trade actions
ASP spread • Stronger global anti-dumping measures drives importers to exploit gaps in Australia’s current anti-dumping regime
• Roll-off of raw material buying and mix benefits
Australian energy costs
• Lag in productivity benefits at ASP to fully offset energy cost escalation in FY2018
~45%
~40%
~15%
Composition of difference in 1H FY2018 underlying EBIT
outlook and 2H FY2017
48
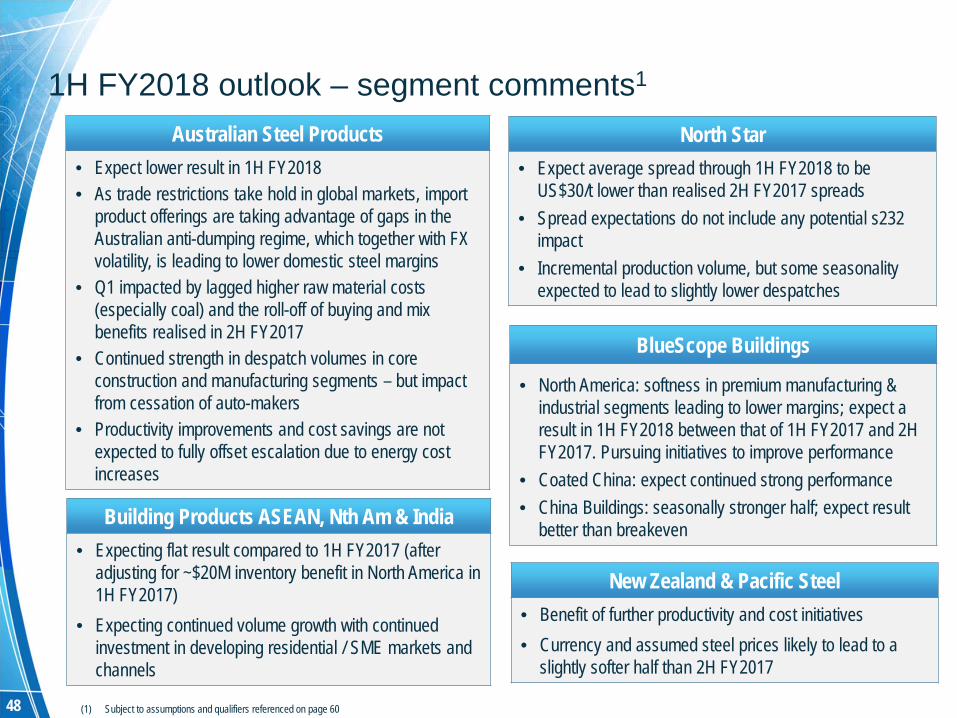
1H FY2018 outlook – segment comments1
New Zealand & Pacific Steel• Benefit of further productivity and cost initiatives• Currency and assumed steel prices likely to lead to a
slightly softer half than 2H FY2017
Building Products ASEAN, Nth Am & India• Expecting flat result compared to 1H FY2017 (after
adjusting for ~$20M inventory benefit in North America in 1H FY2017)
• Expecting continued volume growth with continued investment in developing residential / SME markets and channels
BlueScope Buildings
• North America: softness in premium manufacturing & industrial segments leading to lower margins; expect a result in 1H FY2018 between that of 1H FY2017 and 2H FY2017. Pursuing initiatives to improve performance
• Coated China: expect continued strong performance• China Buildings: seasonally stronger half; expect result
better than breakeven
North Star• Expect average spread through 1H FY2018 to be
US$30/t lower than realised 2H FY2017 spreads• Spread expectations do not include any potential s232
impact• Incremental production volume, but some seasonality
expected to lead to slightly lower despatches
(1) Subject to assumptions and qualifiers referenced on page 60
Australian Steel Products• Expect lower result in 1H FY2018• As trade restrictions take hold in global markets, import
product offerings are taking advantage of gaps in the Australian anti-dumping regime, which together with FX volatility, is leading to lower domestic steel margins
• Q1 impacted by lagged higher raw material costs(especially coal) and the roll-off of buying and mix benefits realised in 2H FY2017
• Continued strength in despatch volumes in core construction and manufacturing segments – but impact from cessation of auto-makers
• Productivity improvements and cost savings are not expected to fully offset escalation due to energy cost increases
49
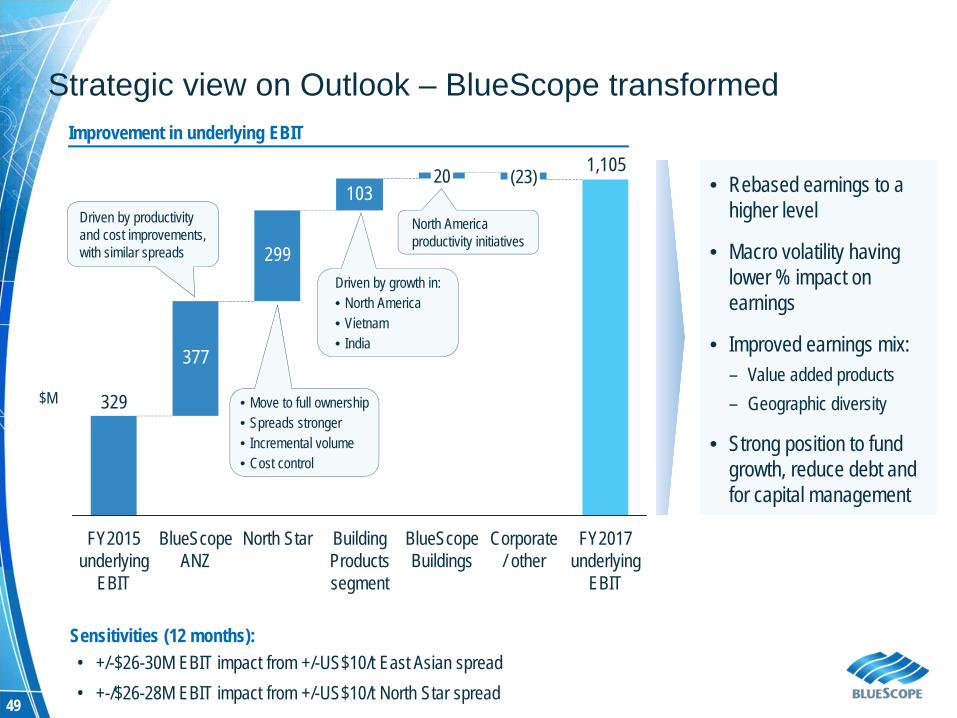
Strategic view on Outlook – BlueScope transformedImprovement in underlying EBIT
377
299
1031,105
329
FY2017 underlying
EBIT
BlueScope Buildings
Corporate / other
(23)20
Building Products segment
North StarBlueScope ANZ
FY2015 underlying
EBIT
Driven by productivity and cost improvements, with similar spreads
$M • Move to full ownership• Spreads stronger• Incremental volume• Cost control
Driven by growth in:• North America• Vietnam• India
North America productivity initiatives
Sensitivities (12 months):• +/-$26-30M EBIT impact from +/-US$10/t East Asian spread• +-/$26-28M EBIT impact from +/-US$10/t North Star spread
• Rebased earnings to a higher level
• Macro volatility having lower % impact on earnings
• Improved earnings mix:– Value added products– Geographic diversity
• Strong position to fund growth, reduce debt and for capital management

Q&A
ADDITIONAL INFORMATION – GROUP-LEVEL MATERIAL
52
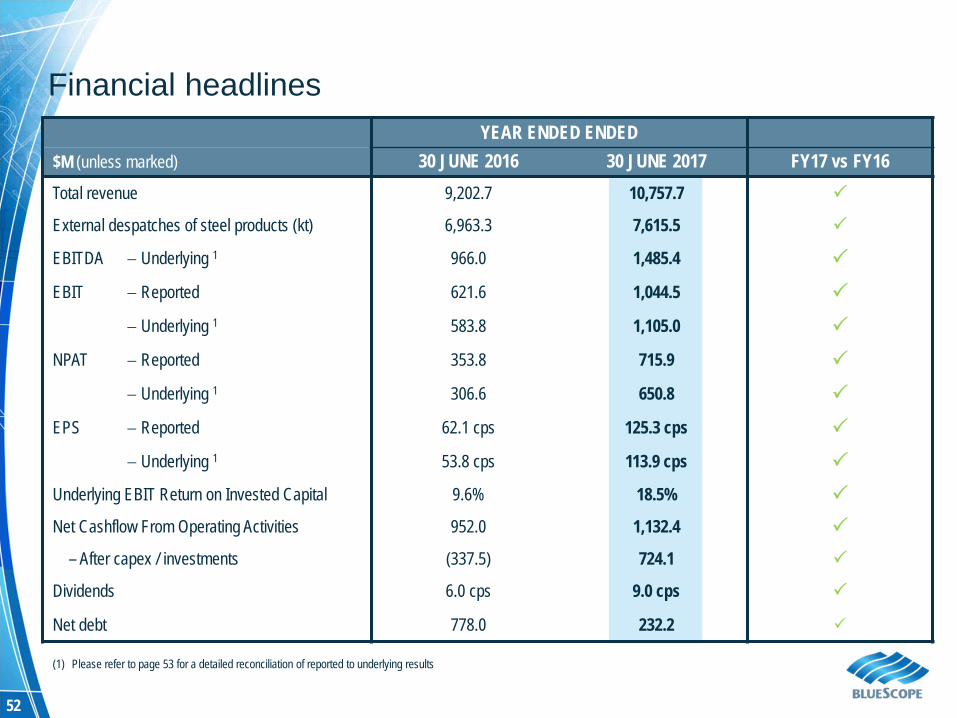
YEAR ENDED ENDED$M (unless marked) 30 JUNE 2016 30 JUNE 2017 FY17 vs FY16Total revenue 9,202.7 10,757.7
External despatches of steel products (kt) 6,963.3 7,615.5
EBITDA Underlying 1 966.0 1,485.4
EBIT Reported 621.6 1,044.5
Underlying 1 583.8 1,105.0
NPAT Reported 353.8 715.9
Underlying 1 306.6 650.8
EPS Reported 62.1 cps 125.3 cps
Underlying 1 53.8 cps 113.9 cps
Underlying EBIT Return on Invested Capital 9.6% 18.5%
Net Cashflow From Operating Activities 952.0 1,132.4
– After capex / investments (337.5) 724.1
Dividends 6.0 cps 9.0 cps
Net debt 778.0 232.2
(1) Please refer to page 53 for a detailed reconciliation of reported to underlying results
Financial headlines
53
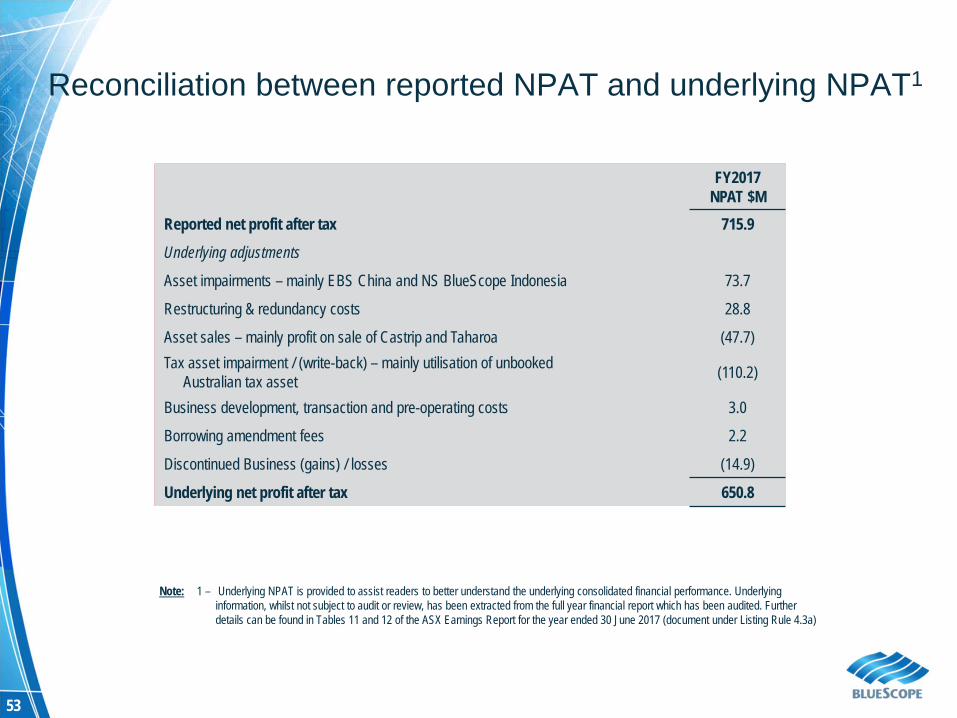
FY2017NPAT $M
Reported net profit after tax 715.9Underlying adjustments
Asset impairments – mainly EBS China and NS BlueScope Indonesia 73.7
Restructuring & redundancy costs 28.8
Asset sales – mainly profit on sale of Castrip and Taharoa (47.7)Tax asset impairment / (write-back) – mainly utilisation of unbooked
Australian tax asset (110.2)
Business development, transaction and pre-operating costs 3.0
Borrowing amendment fees 2.2
Discontinued Business (gains) / losses (14.9)
Underlying net profit after tax 650.8
Note: 1 – Underlying NPAT is provided to assist readers to better understand the underlying consolidated financial performance. Underlying information, whilst not subject to audit or review, has been extracted from the full year financial report which has been audited. Further details can be found in Tables 11 and 12 of the ASX Earnings Report for the year ended 30 June 2017 (document under Listing Rule 4.3a)
Reconciliation between reported NPAT and underlying NPAT1
54
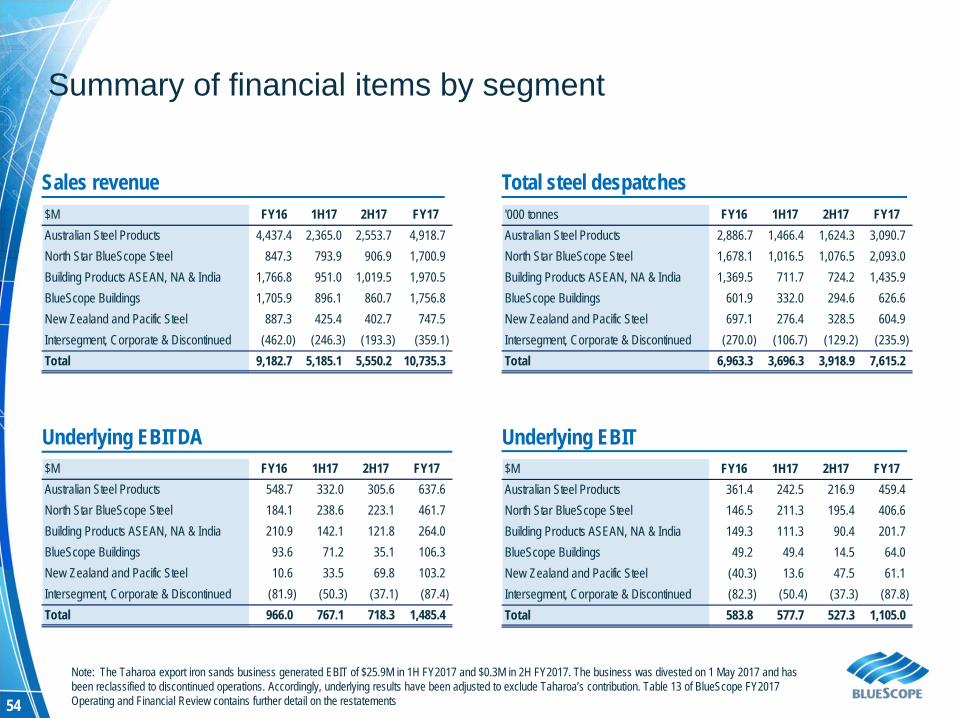
Sales revenue$M FY16 1H17 2H17 FY17Australian Steel Products 4,437.4 2,365.0 2,553.7 4,918.7North Star BlueScope Steel 847.3 793.9 906.9 1,700.9Building Products ASEAN, NA & India 1,766.8 951.0 1,019.5 1,970.5BlueScope Buildings 1,705.9 896.1 860.7 1,756.8New Zealand and Pacific Steel 887.3 425.4 402.7 747.5Intersegment, Corporate & Discontinued (462.0) (246.3) (193.3) (359.1)Total 9,182.7 5,185.1 5,550.2 10,735.3
Underlying EBITDA$M FY16 1H17 2H17 FY17Australian Steel Products 548.7 332.0 305.6 637.6North Star BlueScope Steel 184.1 238.6 223.1 461.7Building Products ASEAN, NA & India 210.9 142.1 121.8 264.0BlueScope Buildings 93.6 71.2 35.1 106.3New Zealand and Pacific Steel 10.6 33.5 69.8 103.2Intersegment, Corporate & Discontinued (81.9) (50.3) (37.1) (87.4)Total 966.0 767.1 718.3 1,485.4
$M FY16 1H17 2H17 FY17Australian Steel Products 361.4 242.5 216.9 459.4North Star BlueScope Steel 146.5 211.3 195.4 406.6Building Products ASEAN, NA & India 149.3 111.3 90.4 201.7BlueScope Buildings 49.2 49.4 14.5 64.0New Zealand and Pacific Steel (40.3) 13.6 47.5 61.1Intersegment, Corporate & Discontinued (82.3) (50.4) (37.3) (87.8)Total 583.8 577.7 527.3 1,105.0
Summary of financial items by segment
Total steel despatches'000 tonnes FY16 1H17 2H17 FY17Australian Steel Products 2,886.7 1,466.4 1,624.3 3,090.7North Star BlueScope Steel 1,678.1 1,016.5 1,076.5 2,093.0Building Products ASEAN, NA & India 1,369.5 711.7 724.2 1,435.9BlueScope Buildings 601.9 332.0 294.6 626.6New Zealand and Pacific Steel 697.1 276.4 328.5 604.9Intersegment, Corporate & Discontinued (270.0) (106.7) (129.2) (235.9)Total 6,963.3 3,696.3 3,918.9 7,615.2
Underlying EBIT
Note: The Taharoa export iron sands business generated EBIT of $25.9M in 1H FY2017 and $0.3M in 2H FY2017. The business was divested on 1 May 2017 and has been reclassified to discontinued operations. Accordingly, underlying results have been adjusted to exclude Taharoa’s contribution. Table 13 of BlueScope FY2017 Operating and Financial Review contains further detail on the restatements
55
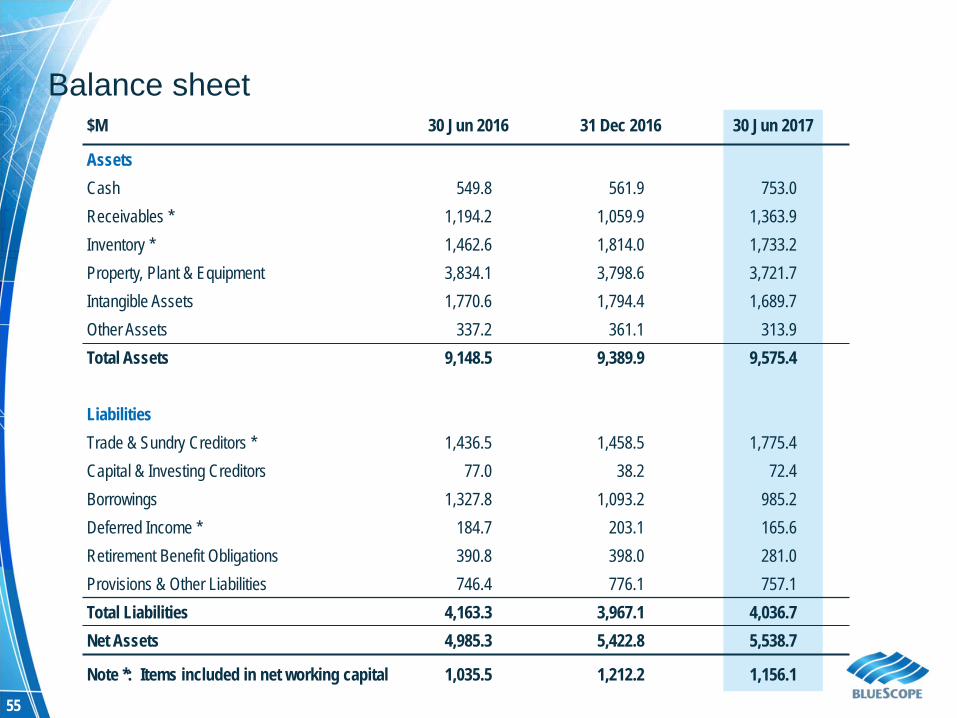
$M 30 Jun 2016 31 Dec 2016 30 Jun 2017
Assets Cash 549.8 561.9 753.0Receivables * 1,194.2 1,059.9 1,363.9Inventory * 1,462.6 1,814.0 1,733.2Property, Plant & Equipment 3,834.1 3,798.6 3,721.7Intangible Assets 1,770.6 1,794.4 1,689.7Other Assets 337.2 361.1 313.9Total Assets 9,148.5 9,389.9 9,575.4
Liabilities Trade & Sundry Creditors * 1,436.5 1,458.5 1,775.4Capital & Investing Creditors 77.0 38.2 72.4Borrowings 1,327.8 1,093.2 985.2Deferred Income * 184.7 203.1 165.6Retirement Benefit Obligations 390.8 398.0 281.0Provisions & Other Liabilities 746.4 776.1 757.1Total Liabilities 4,163.3 3,967.1 4,036.7Net Assets 4,985.3 5,422.8 5,538.7
Note *: Items included in net working capital 1,035.5 1,212.2 1,156.1
Balance sheet
56
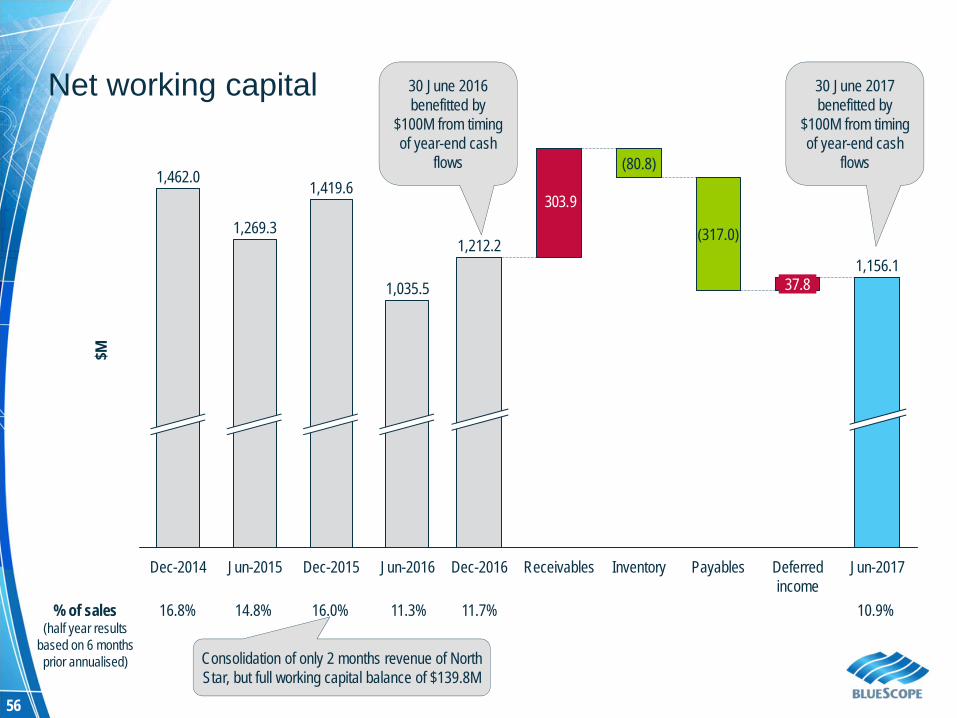
Net working capital
303.9
1,156.1
Deferred income
37.8
Payables
(317.0)
Inventory
(80.8)
ReceivablesDec-2016
1,212.2
Jun-2017
$M
Jun-2016
1,035.5
Dec-2015
1,419.6
Jun-2015
1,269.3
Dec-2014
1,462.0
% of sales(half year results
based on 6 months prior annualised)
16.8% 14.8% 11.3%16.0%
Consolidation of only 2 months revenue of North Star, but full working capital balance of $139.8M
10.9%11.7%
30 June 2017benefitted by
$100M from timing of year-end cash
flows
30 June 2016benefitted by
$100M from timing of year-end cash
flows
57
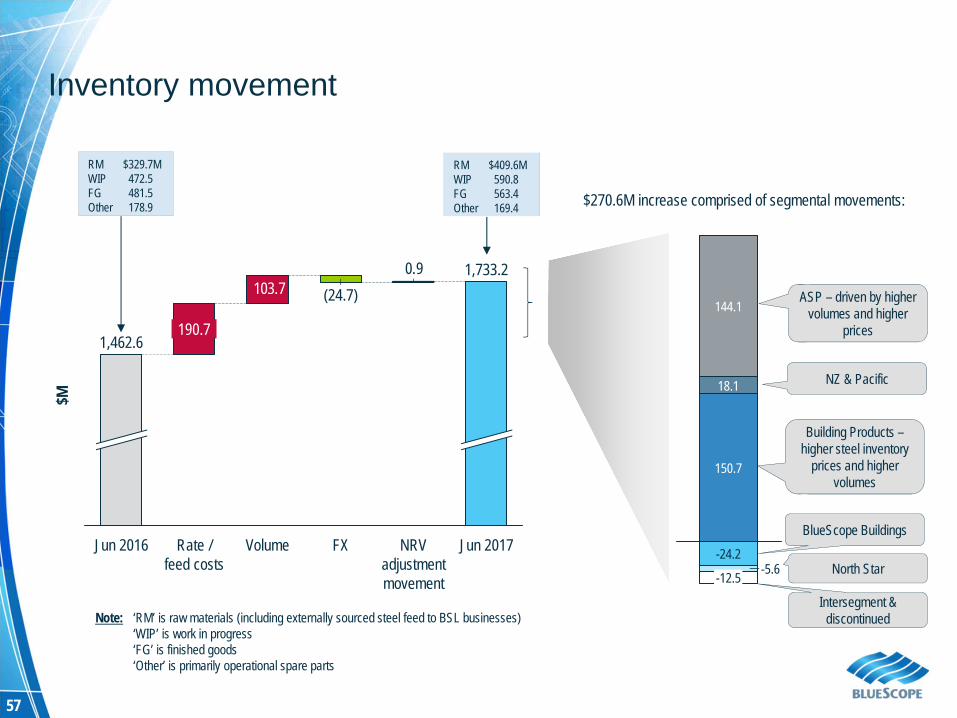
Inventory movement
0.9 103.7
Jun 2017
1,733.2
NRV adjustment movement
FX
(24.7)
VolumeRate / feed costs
190.7
Jun 2016
1,462.6
Note: ‘RM’ is raw materials (including externally sourced steel feed to BSL businesses)‘WIP’ is work in progress‘FG’ is finished goods ‘Other’ is primarily operational spare parts
RM $329.7MWIP 472.5FG 481.5Other 178.9
RM $409.6MWIP 590.8FG 563.4Other 169.4 $270.6M increase comprised of segmental movements:
-12.5 -5.6-24.2
150.7
18.1
144.1
$M
North Star
NZ & Pacific
Building Products –higher steel inventory
prices and higher volumes
BlueScope Buildings
ASP – driven by higher volumes and higher
prices
Intersegment & discontinued
58
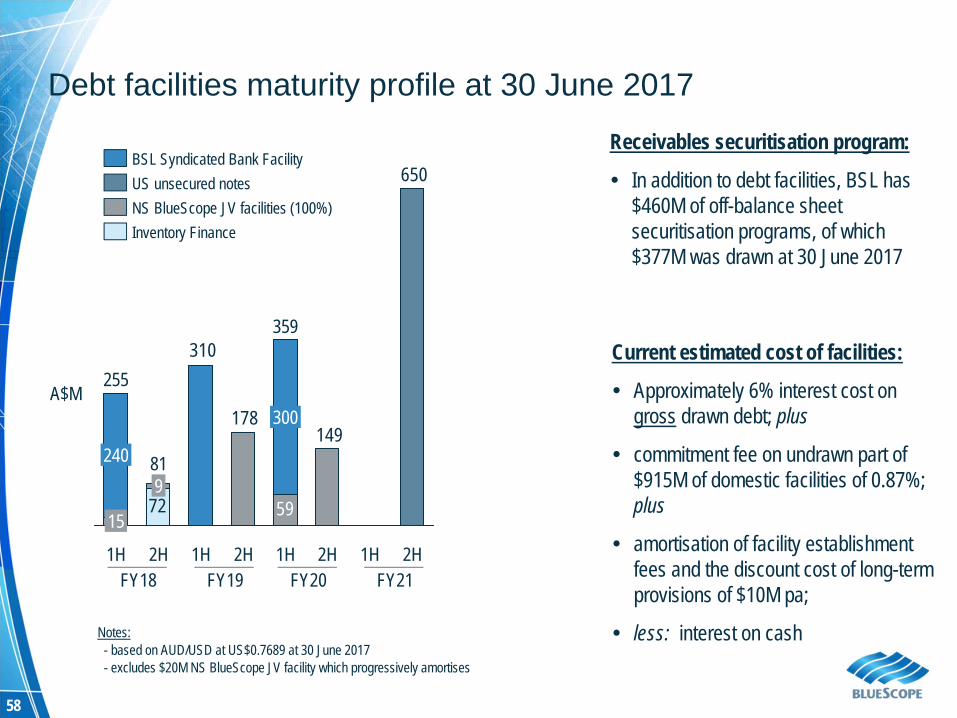
Notes:- based on AUD/USD at US$0.7689 at 30 June 2017- excludes $20M NS BlueScope JV facility which progressively amortises
Current estimated cost of facilities:
Approximately 6% interest cost on gross drawn debt; plus
commitment fee on undrawn part of $915M of domestic facilities of 0.87%; plus
amortisation of facility establishment fees and the discount cost of long-term provisions of $10M pa;
less: interest on cash
72
178149
59
650
310
2H1H
9
2H 2H2H 1H1H
359
81
15
1H
255
240
300
Inventory FinanceNS BlueScope JV facilities (100%)US unsecured notesBSL Syndicated Bank Facility
Receivables securitisation program:
In addition to debt facilities, BSL has $460M of off-balance sheet securitisation programs, of which $377M was drawn at 30 June 2017
FY20
Debt facilities maturity profile at 30 June 2017
FY18 FY19
A$M
FY21
59
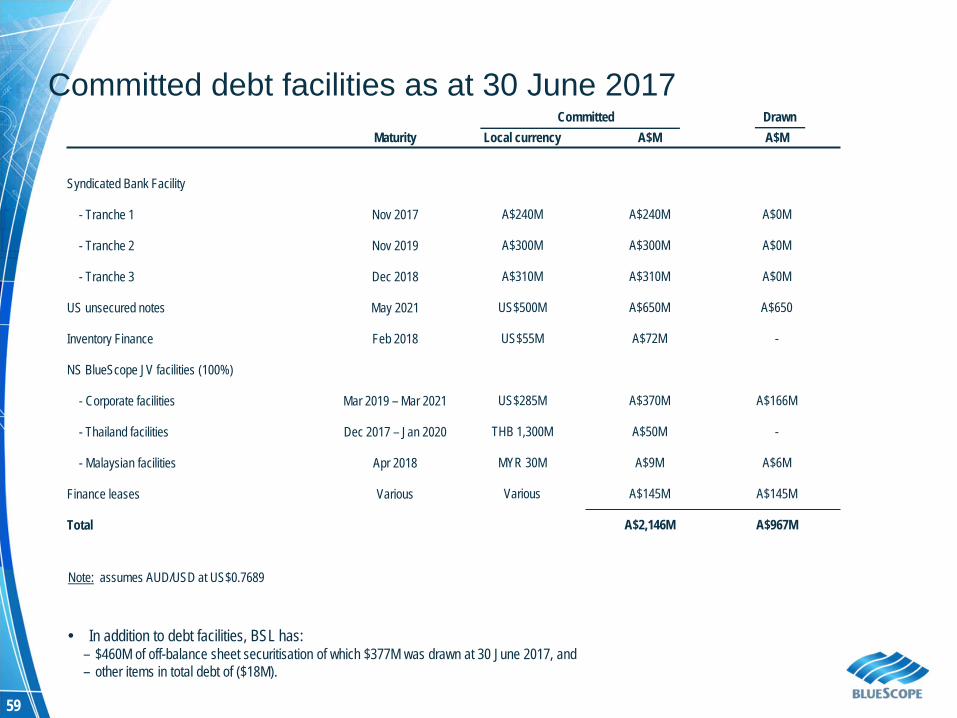
Committed DrawnMaturity Local currency A$M A$M
Syndicated Bank Facility
- Tranche 1 Nov 2017 A$240M A$240M A$0M
- Tranche 2 Nov 2019 A$300M A$300M A$0M
- Tranche 3 Dec 2018 A$310M A$310M A$0M
US unsecured notes May 2021 US$500M A$650M A$650
Inventory Finance Feb 2018 US$55M A$72M -
NS BlueScope JV facilities (100%)
- Corporate facilities Mar 2019 – Mar 2021 US$285M A$370M A$166M
- Thailand facilities Dec 2017 – Jan 2020 THB 1,300M A$50M -
- Malaysian facilities Apr 2018 MYR 30M A$9M A$6M
Finance leases Various Various A$145M A$145M
Total A$2,146M A$967M
Note: assumes AUD/USD at US$0.7689
In addition to debt facilities, BSL has:– $460M of off-balance sheet securitisation of which $377M was drawn at 30 June 2017, and– other items in total debt of ($18M).
Committed debt facilities as at 30 June 2017
60
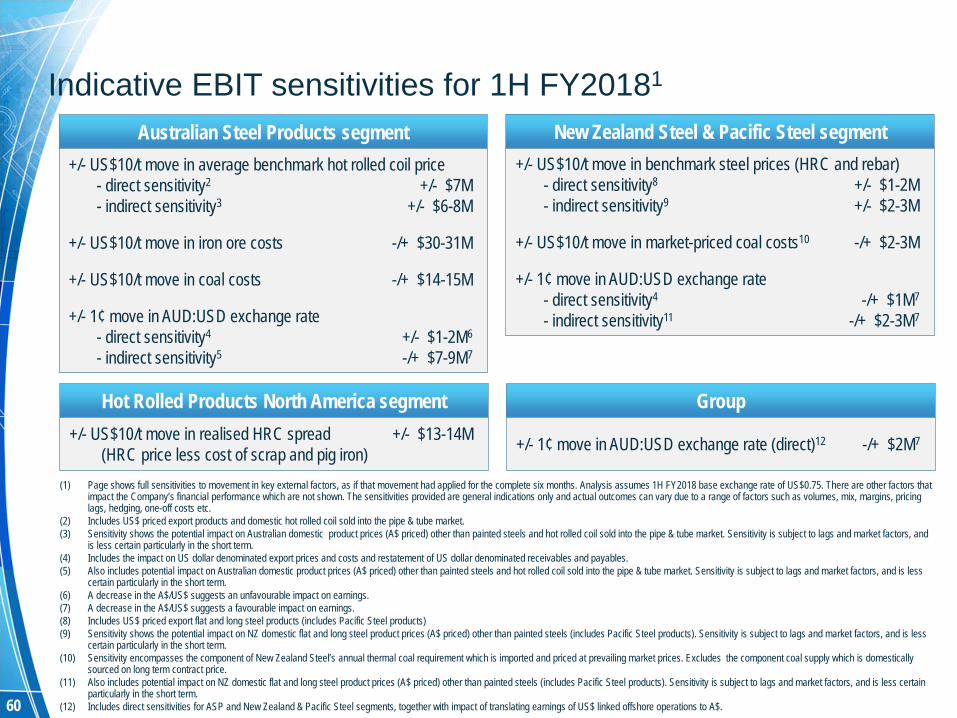
(1) Page shows full sensitivities to movement in key external factors, as if that movement had applied for the complete six months. Analysis assumes 1H FY2018 base exchange rate of US$0.75. There are other factors that impact the Company’s financial performance which are not shown. The sensitivities provided are general indications only and actual outcomes can vary due to a range of factors such as volumes, mix, margins, pricing lags, hedging, one-off costs etc.
(2) Includes US$ priced export products and domestic hot rolled coil sold into the pipe & tube market. (3) Sensitivity shows the potential impact on Australian domestic product prices (A$ priced) other than painted steels and hot rolled coil sold into the pipe & tube market. Sensitivity is subject to lags and market factors, and
is less certain particularly in the short term.(4) Includes the impact on US dollar denominated export prices and costs and restatement of US dollar denominated receivables and payables. (5) Also includes potential impact on Australian domestic product prices (A$ priced) other than painted steels and hot rolled coil sold into the pipe & tube market. Sensitivity is subject to lags and market factors, and is less
certain particularly in the short term.(6) A decrease in the A$/US$ suggests an unfavourable impact on earnings.(7) A decrease in the A$/US$ suggests a favourable impact on earnings.(8) Includes US$ priced export flat and long steel products (includes Pacific Steel products)(9) Sensitivity shows the potential impact on NZ domestic flat and long steel product prices (A$ priced) other than painted steels (includes Pacific Steel products). Sensitivity is subject to lags and market factors, and is less
certain particularly in the short term.(10) Sensitivity encompasses the component of New Zealand Steel’s annual thermal coal requirement which is imported and priced at prevailing market prices. Excludes the component coal supply which is domestically
sourced on long term contract price. (11) Also includes potential impact on NZ domestic flat and long steel product prices (A$ priced) other than painted steels (includes Pacific Steel products). Sensitivity is subject to lags and market factors, and is less certain
particularly in the short term.(12) Includes direct sensitivities for ASP and New Zealand & Pacific Steel segments, together with impact of translating earnings of US$ linked offshore operations to A$.
Indicative EBIT sensitivities for 1H FY20181
Australian Steel Products segment+/- US$10/t move in average benchmark hot rolled coil price
- direct sensitivity2 +/- $7M- indirect sensitivity3 +/- $6-8M
+/- US$10/t move in iron ore costs -/+ $30-31M
+/- US$10/t move in coal costs -/+ $14-15M
+/- 1¢ move in AUD:USD exchange rate- direct sensitivity4 +/- $1-2M6
- indirect sensitivity5 -/+ $7-9M7
Hot Rolled Products North America segment+/- US$10/t move in realised HRC spread +/- $13-14M
(HRC price less cost of scrap and pig iron)
New Zealand Steel & Pacific Steel segment+/- US$10/t move in benchmark steel prices (HRC and rebar)
- direct sensitivity8 +/- $1-2M- indirect sensitivity9 +/- $2-3M
+/- US$10/t move in market-priced coal costs10 -/+ $2-3M
+/- 1¢ move in AUD:USD exchange rate- direct sensitivity4 -/+ $1M7
- indirect sensitivity11 -/+ $2-3M7
Group
+/- 1¢ move in AUD:USD exchange rate (direct)12 -/+ $2M7
ADDITIONAL INFORMATION– SEGMENT MATERIAL
62
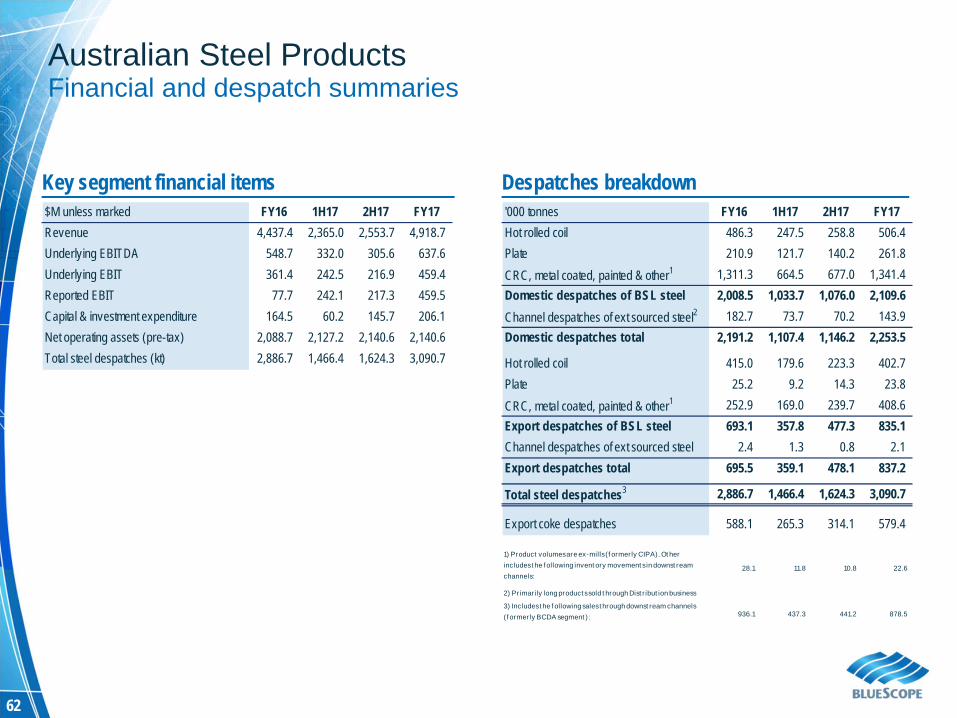
Key segment financial items$M unless marked FY16 1H17 2H17 FY17Revenue 4,437.4 2,365.0 2,553.7 4,918.7Underlying EBITDA 548.7 332.0 305.6 637.6Underlying EBIT 361.4 242.5 216.9 459.4Reported EBIT 77.7 242.1 217.3 459.5Capital & investment expenditure 164.5 60.2 145.7 206.1Net operating assets (pre-tax) 2,088.7 2,127.2 2,140.6 2,140.6Total steel despatches (kt) 2,886.7 1,466.4 1,624.3 3,090.7
Despatches breakdown'000 tonnes FY16 1H17 2H17 FY17Hot rolled coil 486.3 247.5 258.8 506.4Plate 210.9 121.7 140.2 261.8CRC, metal coated, painted & other1 1,311.3 664.5 677.0 1,341.4Domestic despatches of BSL steel 2,008.5 1,033.7 1,076.0 2,109.6Channel despatches of ext sourced steel2 182.7 73.7 70.2 143.9Domestic despatches total 2,191.2 1,107.4 1,146.2 2,253.5
Hot rolled coil 415.0 179.6 223.3 402.7Plate 25.2 9.2 14.3 23.8CRC, metal coated, painted & other1 252.9 169.0 239.7 408.6Export despatches of BSL steel 693.1 357.8 477.3 835.1Channel despatches of ext sourced steel 2.4 1.3 0.8 2.1Export despatches total 695.5 359.1 478.1 837.2
Total steel despatches3 2,886.7 1,466.4 1,624.3 3,090.7
Export coke despatches 588.1 265.3 314.1 579.4
1) Product volumes are ex-mills (f ormerly CIPA). Ot her includes t he f ollowing invent ory movement s in downst ream channels:
28.1 11.8 10.8 22.6
2) Primarily long product s sold t hrough Dist r ibut ion business
3) Includes t he f ollowing sales t hrough downst ream channels ( f ormerly BCDA segment ): 936.1 437.3 441.2 878.5
Australian Steel ProductsFinancial and despatch summaries
63
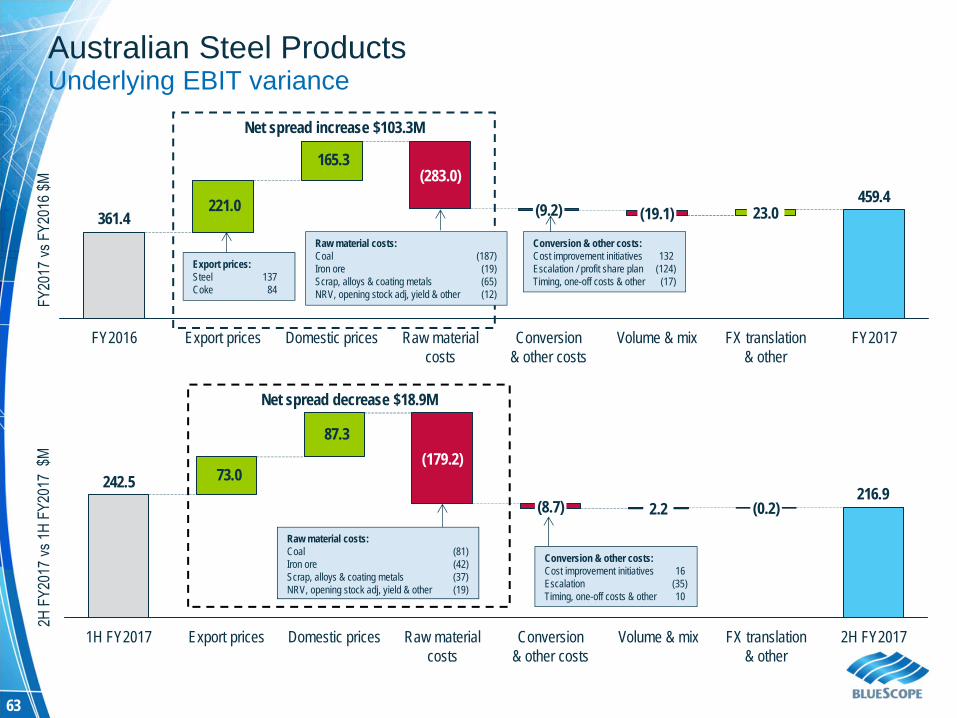
Net spread decrease $18.9M
73.0 216.9
87.3
242.5
2H FY2017FX translation & other
(0.2)
Volume & mix
2.2
Conversion & other costs
(8.7)
Raw material costs
(179.2)
Domestic pricesExport prices1H FY2017
221.0
165.3
459.4 361.4
FY2017FX translation & other
23.0
Volume & mix
(19.1)
Conversion & other costs
(9.2)
Raw material costs
(283.0)
Domestic pricesExport pricesFY2016
Australian Steel ProductsUnderlying EBIT variance
Conversion & other costs:Cost improvement initiatives 132Escalation / profit share plan (124)Timing, one-off costs & other (17)
Conversion & other costs:Cost improvement initiatives 16Escalation (35)Timing, one-off costs & other 10
Net spread increase $103.3M
Raw material costs:Coal (187)Iron ore (19)Scrap, alloys & coating metals (65)NRV, opening stock adj, yield & other (12)
Export prices:Steel 137Coke 84
Raw material costs:Coal (81)Iron ore (42)Scrap, alloys & coating metals (37)NRV, opening stock adj, yield & other (19)
64
$0Jan-17Jan-16Jan-15Jan-14Jan-13Jan-12Jan-11Jan-10Jan-09Jan-08
$700
Jan-06Jan-05Jan-04
$600
$500
Jan-07
$800
$400
$300
$200
$100
Jan-03
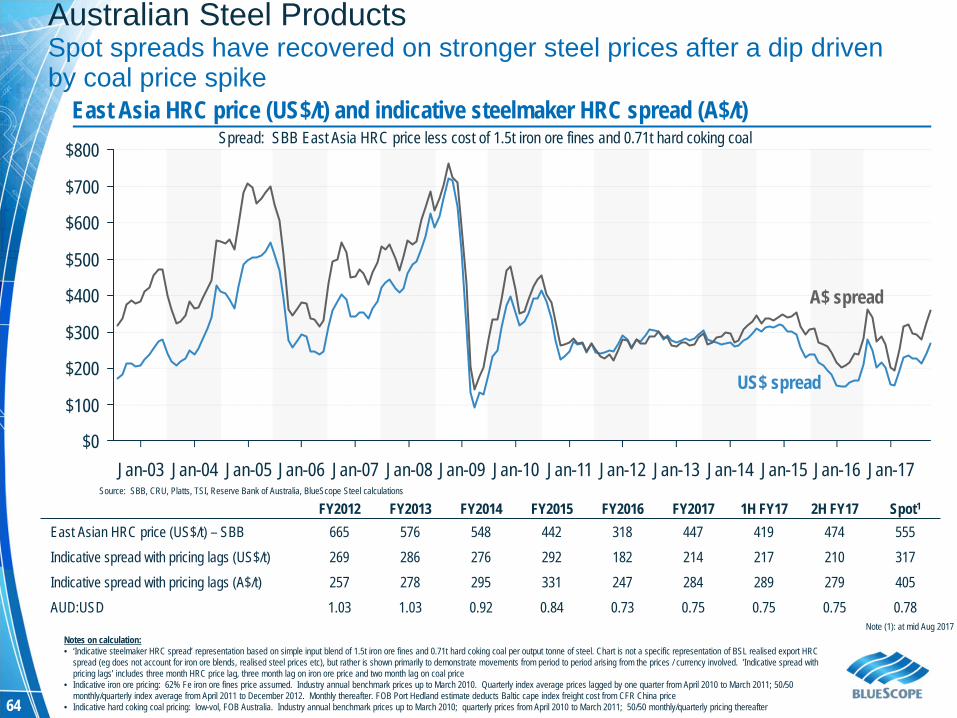
East Asia HRC price (US$/t) and indicative steelmaker HRC spread (A$/t)Spread: SBB East Asia HRC price less cost of 1.5t iron ore fines and 0.71t hard coking coal
Source: SBB, CRU, Platts, TSI, Reserve Bank of Australia, BlueScope Steel calculations
Notes on calculation:• ‘Indicative steelmaker HRC spread’ representation based on simple input blend of 1.5t iron ore fines and 0.71t hard coking coal per output tonne of steel. Chart is not a specific representation of BSL realised export HRC
spread (eg does not account for iron ore blends, realised steel prices etc), but rather is shown primarily to demonstrate movements from period to period arising from the prices / currency involved. ‘Indicative spread with pricing lags’ includes three month HRC price lag, three month lag on iron ore price and two month lag on coal price
• Indicative iron ore pricing: 62% Fe iron ore fines price assumed. Industry annual benchmark prices up to March 2010. Quarterly index average prices lagged by one quarter from April 2010 to March 2011; 50/50 monthly/quarterly index average from April 2011 to December 2012. Monthly thereafter. FOB Port Hedland estimate deducts Baltic cape index freight cost from CFR China price
• Indicative hard coking coal pricing: low-vol, FOB Australia. Industry annual benchmark prices up to March 2010; quarterly prices from April 2010 to March 2011; 50/50 monthly/quarterly pricing thereafter
FY2012 FY2013 FY2014 FY2015 FY2016 FY2017 1H FY17 2H FY17 Spot1
East Asian HRC price (US$/t) – SBB 665 576 548 442 318 447 419 474 555 Indicative spread with pricing lags (US$/t) 269 286 276 292 182 214 217 210 317Indicative spread with pricing lags (A$/t) 257 278 295 331 247 284 289 279 405AUD:USD 1.03 1.03 0.92 0.84 0.73 0.75 0.75 0.75 0.78
Australian Steel ProductsSpot spreads have recovered on stronger steel prices after a dip driven by coal price spike
Note (1): at mid Aug 2017
A$ spread
US$ spread
65
Dome
stic
Expo
rt
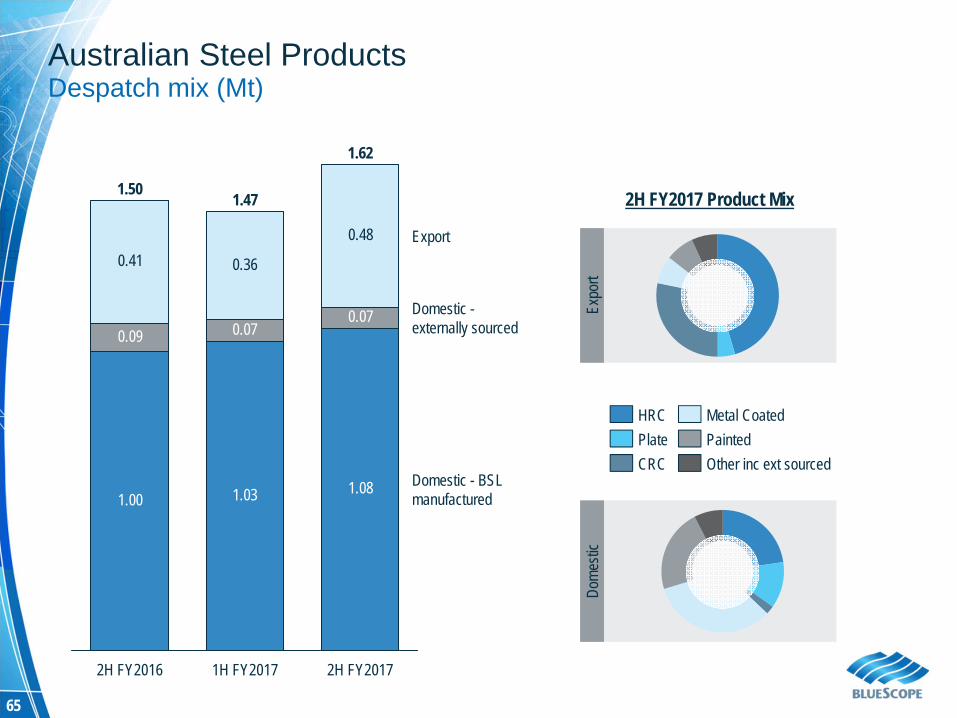
2H FY2017 Product Mix
Other inc ext sourcedPaintedMetal Coated
CRCPlateHRC
Australian Steel ProductsDespatch mix (Mt)
1.00 1.03 1.08
0.09 0.070.07
0.41 0.36
0.48
1.62
Domestic - BSLmanufactured
Domestic -externally sourced
Export
2H FY20171H FY2017
1.47
2H FY2016
1.50
66
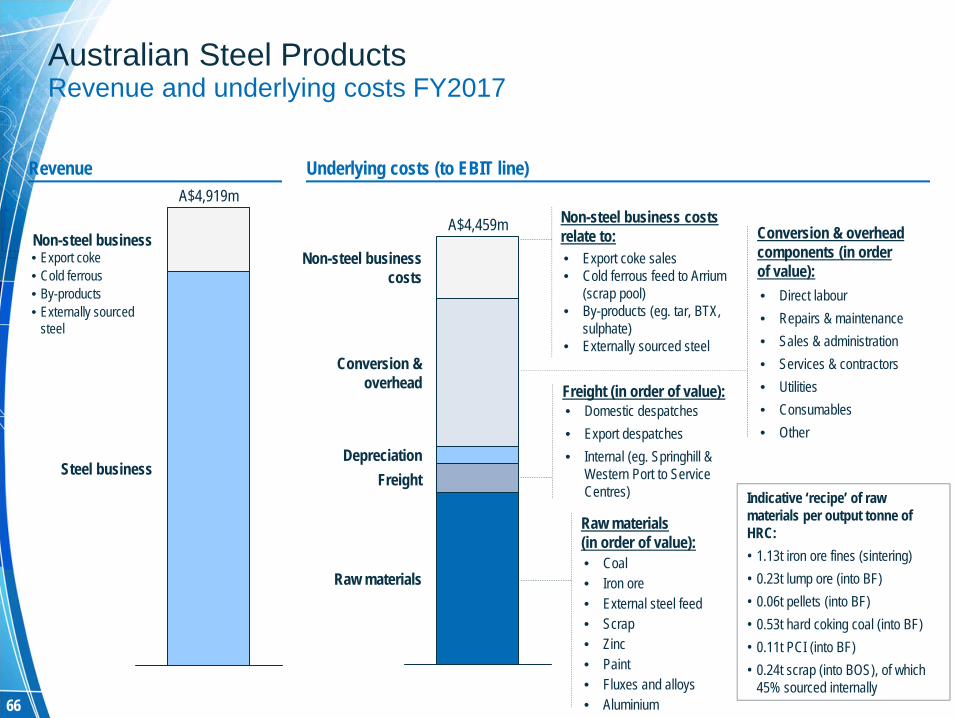
Raw materials
FreightDepreciation
Conversion &overhead
Non-steel businesscosts
A$4,459m Conversion & overhead components (in orderof value):• Direct labour• Repairs & maintenance• Sales & administration• Services & contractors• Utilities• Consumables• Other
Non-steel business costsrelate to:• Export coke sales• Cold ferrous feed to Arrium
(scrap pool)• By-products (eg. tar, BTX,
sulphate)• Externally sourced steel
Raw materials(in order of value):• Coal• Iron ore• External steel feed• Scrap• Zinc• Paint• Fluxes and alloys• Aluminium
Freight (in order of value):• Domestic despatches• Export despatches• Internal (eg. Springhill &
Western Port to Service Centres)
Non-steel business
Steel business
A$4,919mUnderlying costs (to EBIT line)Revenue
• Export coke• Cold ferrous• By-products• Externally sourced
steel
Indicative ‘recipe’ of raw materials per output tonne of HRC:• 1.13t iron ore fines (sintering)• 0.23t lump ore (into BF)• 0.06t pellets (into BF)• 0.53t hard coking coal (into BF)• 0.11t PCI (into BF)• 0.24t scrap (into BOS), of which
45% sourced internally
Australian Steel ProductsRevenue and underlying costs FY2017
67
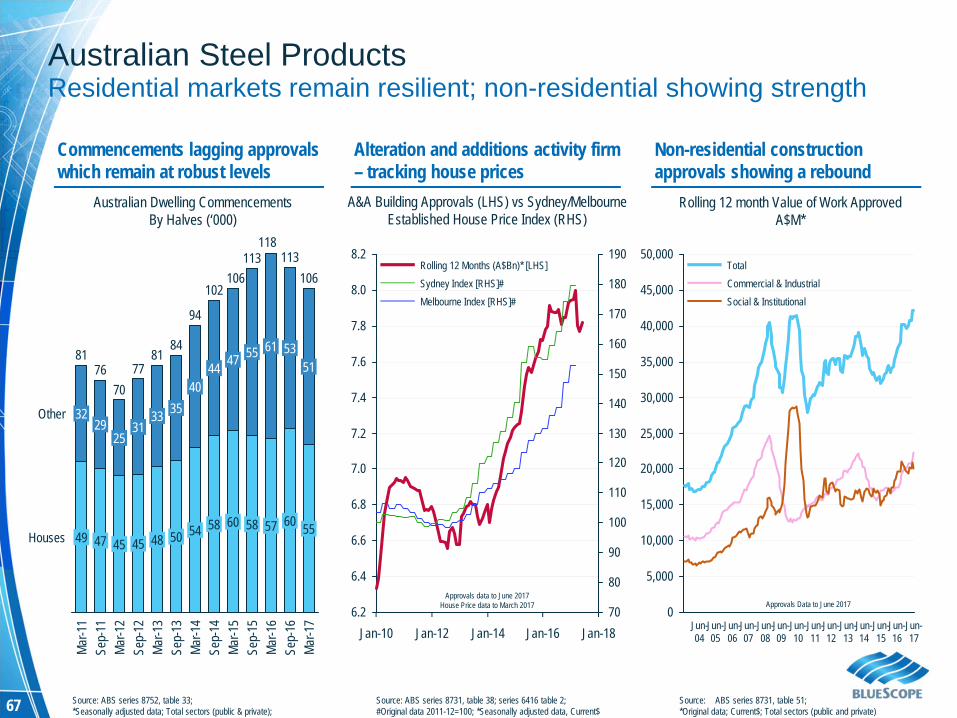
Commencements lagging approvals which remain at robust levels
Australian Steel ProductsResidential markets remain resilient; non-residential showing strength
Alteration and additions activity firm – tracking house prices
Non-residential construction approvals showing a rebound
Houses
Other
Mar-1
7
106
55
51
Sep-
16
113
60
53
Mar-1
6
118
57
61
Sep-
15113
58
55
Mar-1
5
106
60
47
Sep-
14
102
58
44
Mar-1
4
94
54
40
Sep-
13
84
50
35
Mar-1
3
81
48
33
Sep-
12
77
45
31
Mar-1
2
70
45
25
Sep-
11
76
47
29
Mar-1
1
81
49
32
6.2
6.4
6.6
6.8
7.0
7.2
7.4
7.6
7.8
8.0
8.2
70
80
90
100
110
120
130
140
150
160
170
180
190
Jan-18Jan-16Jan-14Jan-12Jan-10
Melbourne Index [RHS]#Sydney Index [RHS]#Rolling 12 Months (A$Bn)* [LHS]
Australian Dwelling CommencementsBy Halves (‘000)
A&A Building Approvals (LHS) vs Sydney/Melbourne Established House Price Index (RHS)
Rolling 12 month Value of Work ApprovedA$M*
0
5,000
10,000
15,000
20,000
25,000
30,000
35,000
40,000
45,000
50,000
Jun-08
Jun-04
Jun-09
Jun-14
Jun-13
Jun-06
Jun-07
Jun-17
Jun-11
Jun-15
Jun-05
Jun-16
Jun-10
Jun-12
Social & InstitutionalCommercial & IndustrialTotal
Source: ABS series 8752, table 33; *Seasonally adjusted data; Total sectors (public & private);
Source: ABS series 8731, table 51; *Original data; Current$; Total sectors (public and private)
Source: ABS series 8731, table 38; series 6416 table 2; #Original data 2011-12=100; *Seasonally adjusted data, Current$
Approvals Data to June 2017Approvals data to June 2017
House Price data to March 2017
68
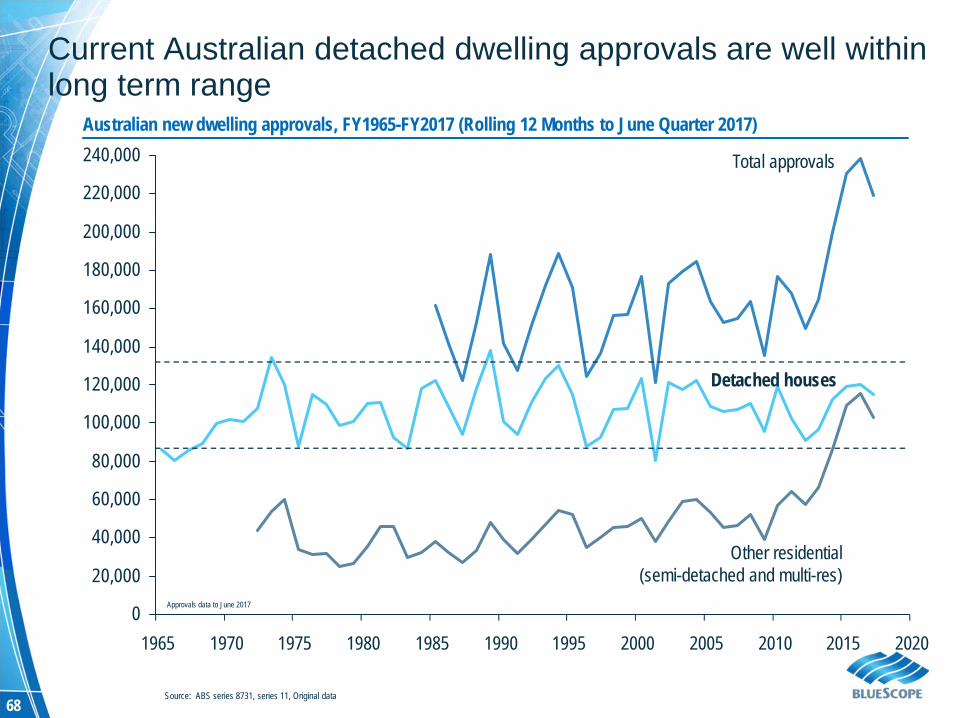
Current Australian detached dwelling approvals are well within long term range
0
20,000
40,000
60,000
80,000
100,000
120,000
140,000
160,000
180,000
200,000
220,000
240,000
1965 1970 1975 1980 1985 1990 1995 2000 2005 2010 2015 2020
Total approvals
Detached houses
Other residential(semi-detached and multi-res)
Australian new dwelling approvals, FY1965-FY2017 (Rolling 12 Months to June Quarter 2017)
Source: ABS series 8731, series 11, Original data
Approvals data to June 2017
69
0200400600800
1,0001,2001,4001,6001,8002,0002,2002,4002,6002,800
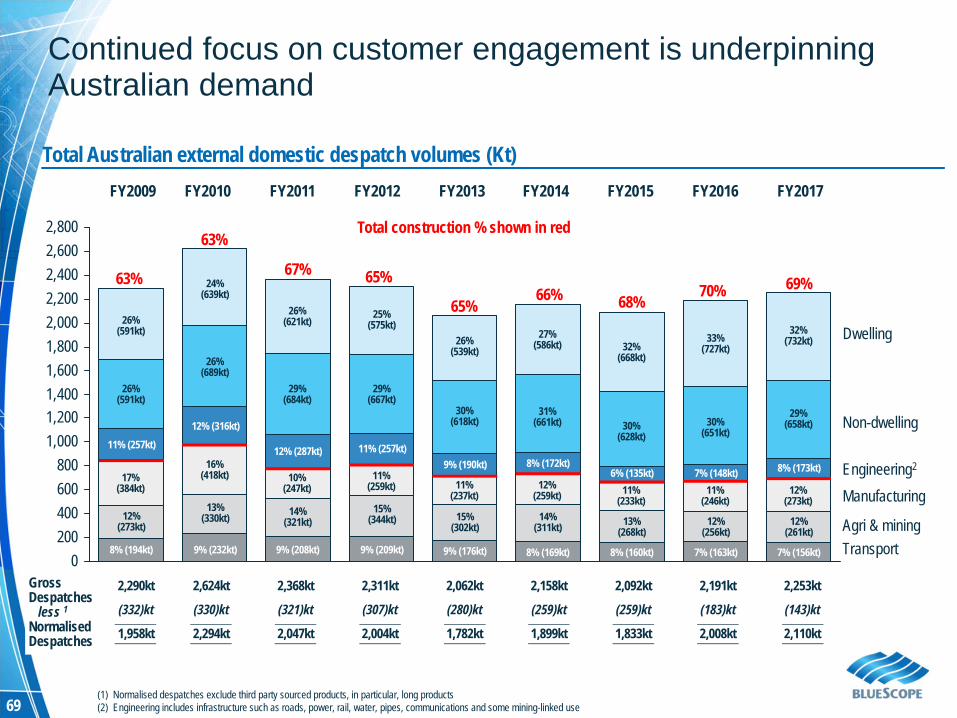
(1) Normalised despatches exclude third party sourced products, in particular, long products(2) Engineering includes infrastructure such as roads, power, rail, water, pipes, communications and some mining-linked use
FY2009 FY2010 FY2011 FY2012 FY2013 FY2014 FY2015 FY2016 FY2017
Total Australian external domestic despatch volumes (Kt)
Total construction % shown in red
2,290kt 2,624kt 2,368kt 2,311kt 2,062kt 2,158kt 2,092kt 2,191kt 2,253kt
(332)kt (330)kt (321)kt (307)kt (280)kt (259)kt (259)kt (183)kt (143)kt
1,958kt 2,294kt 2,047kt 2,004kt 1,782kt 1,899kt 1,833kt 2,008kt 2,110kt
GrossDespatches
less 1NormalisedDespatches
Continued focus on customer engagement is underpinning Australian demand
Non-dwelling
Dwelling
Engineering2
Manufacturing
Agri & miningTransport
63% 67%
63%
65%
65%66% 68% 70% 69%
11% (257kt)
17%(384kt)
12%(273kt)
8% (194kt)
26%(591kt)
26%(591kt)
8% (173kt)
12%(273kt)
12%(261kt)
7% (156kt)
32%(732kt)
29%(658kt)
7% (148kt)11%
(246kt)
12%(256kt)
7% (163kt)
33%(727kt)
30%(651kt)
6% (135kt)11%
(233kt)
13%(268kt)
8% (160kt)
32%(668kt)
30%(628kt)
8% (172kt)
12%(259kt)
14%(311kt)
8% (169kt)
27%(586kt)
31%(661kt)
9% (190kt)
11%(237kt)
15%(302kt)
9% (176kt)
26%(539kt)
30%(618kt)
11% (257kt)
11%(259kt)
15%(344kt)
9% (209kt)
25%(575kt)
29%(667kt)
12% (287kt)
10%(247kt)
14%(321kt)
9% (208kt)
26%(621kt)
29%(684kt)
12% (316kt)
16%(418kt)
13%(330kt)
9% (232kt)
24%(639kt)
26%(689kt)
70
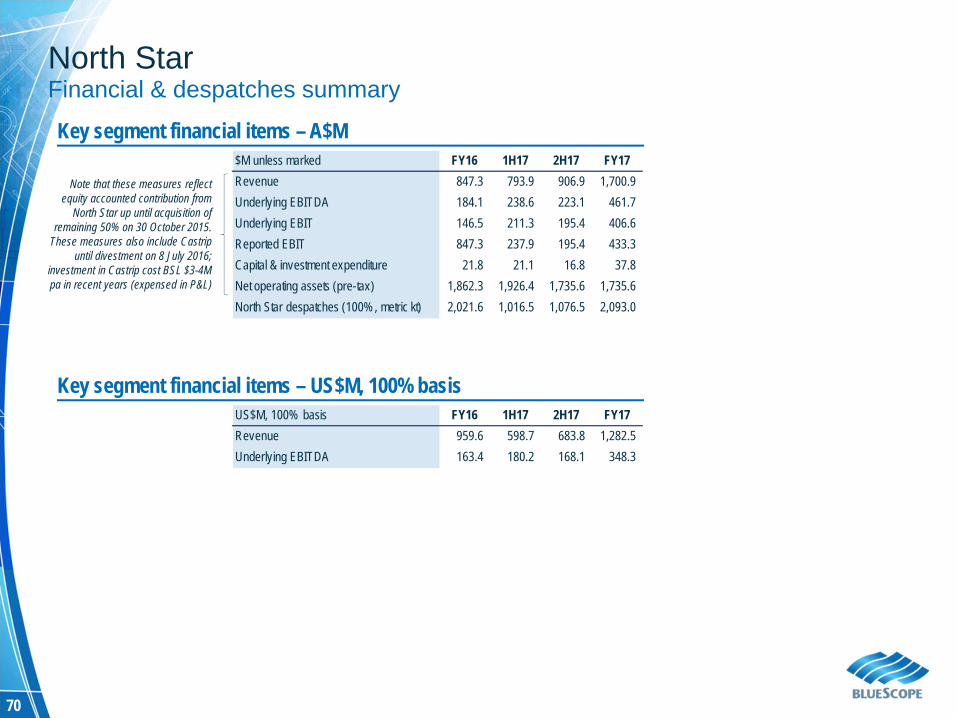
Key segment financial items – A$M$M unless marked FY16 1H17 2H17 FY17Revenue 847.3 793.9 906.9 1,700.9Underlying EBITDA 184.1 238.6 223.1 461.7Underlying EBIT 146.5 211.3 195.4 406.6Reported EBIT 847.3 237.9 195.4 433.3Capital & investment expenditure 21.8 21.1 16.8 37.8Net operating assets (pre-tax) 1,862.3 1,926.4 1,735.6 1,735.6North Star despatches (100% , metric kt) 2,021.6 1,016.5 1,076.5 2,093.0
North StarFinancial & despatches summary
Note that these measures reflect equity accounted contribution from
North Star up until acquisition of remaining 50% on 30 October 2015.
These measures also include Castripuntil divestment on 8 July 2016;
investment in Castrip cost BSL $3-4M pa in recent years (expensed in P&L)
Key segment financial items – US$M, 100% basisUS$M, 100% basis FY16 1H17 2H17 FY17Revenue 959.6 598.7 683.8 1,282.5Underlying EBITDA 163.4 180.2 168.1 348.3
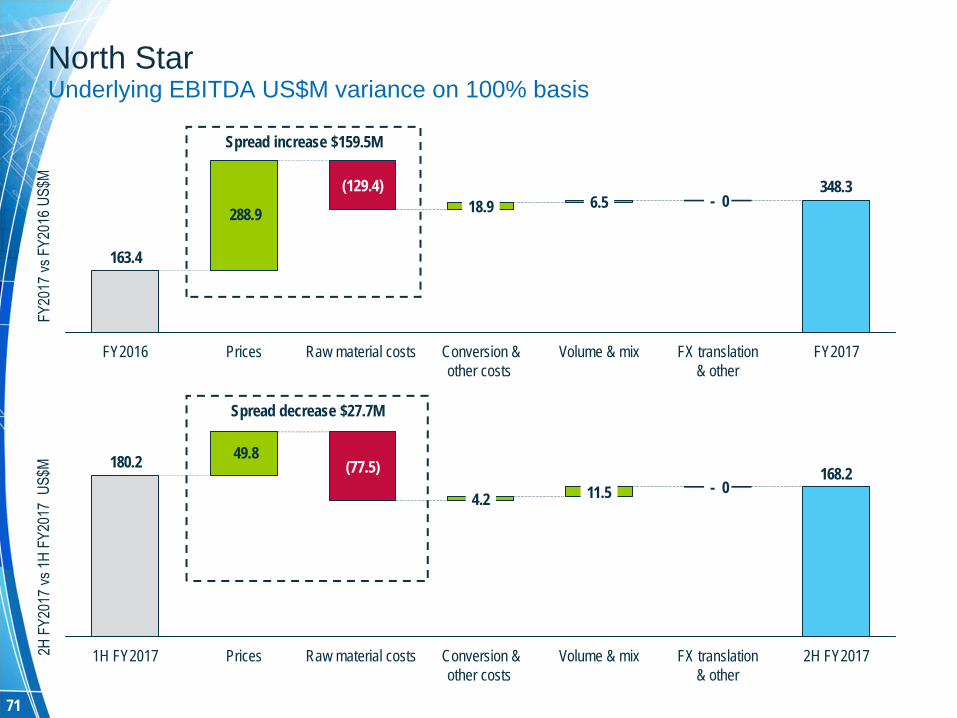
71
Spread increase $159.5M
348.3 288.9
163.4
FY2017FX translation & other
- 0
Volume & mix
6.5
Conversion & other costs
18.9
Raw material costs
(129.4)
PricesFY2016
168.2 49.8 180.2
Prices1H FY2017
- 0
FX translation & other
Volume & mixRaw material costs
11.5
Conversion & other costs
4.2
(77.5)
2H FY2017
North StarUnderlying EBITDA US$M variance on 100% basis
Spread decrease $27.7M
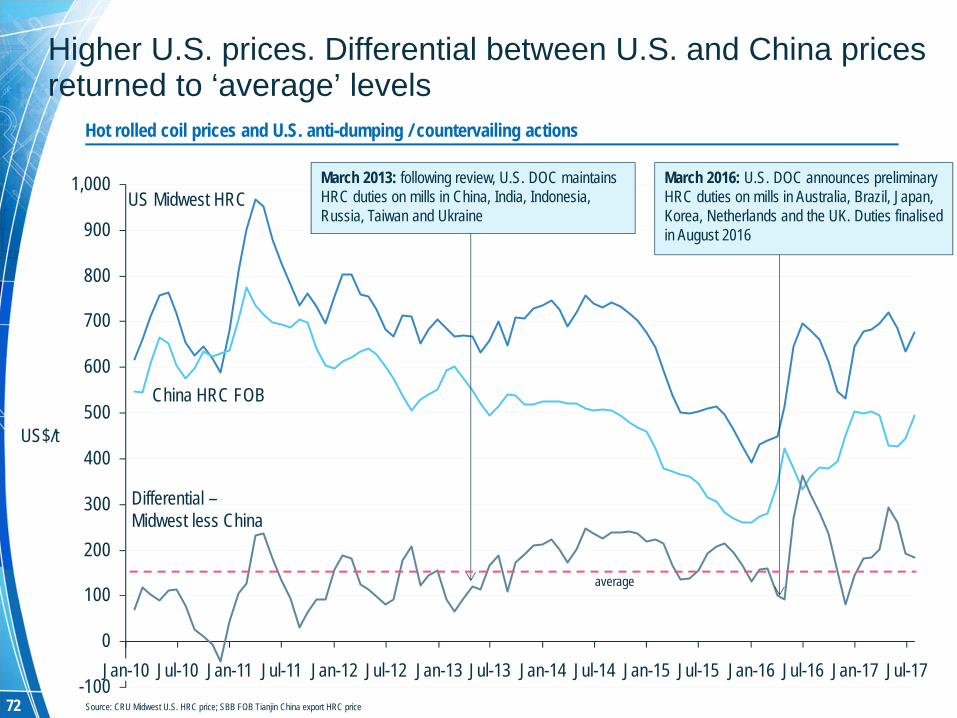
72
Higher U.S. prices. Differential between U.S. and China prices returned to ‘average’ levels
-100
0
100
200
300
400
500
600
700
800
900
1,000
Jan-17Jan-16Jan-15Jan-14Jan-13Jan-12Jan-11 Jul-12Jul-10 Jul-14Jan-10 Jul-17Jul-13 Jul-16Jul-15Jul-11
US Midwest HRC
China HRC FOB
Differential –Midwest less China
US$/t
Hot rolled coil prices and U.S. anti-dumping / countervailing actions
March 2016: U.S. DOC announces preliminary HRC duties on mills in Australia, Brazil, Japan, Korea, Netherlands and the UK. Duties finalised in August 2016
March 2013: following review, U.S. DOC maintains HRC duties on mills in China, India, Indonesia, Russia, Taiwan and Ukraine
Source: CRU Midwest U.S. HRC price; SBB FOB Tianjin China export HRC price
average
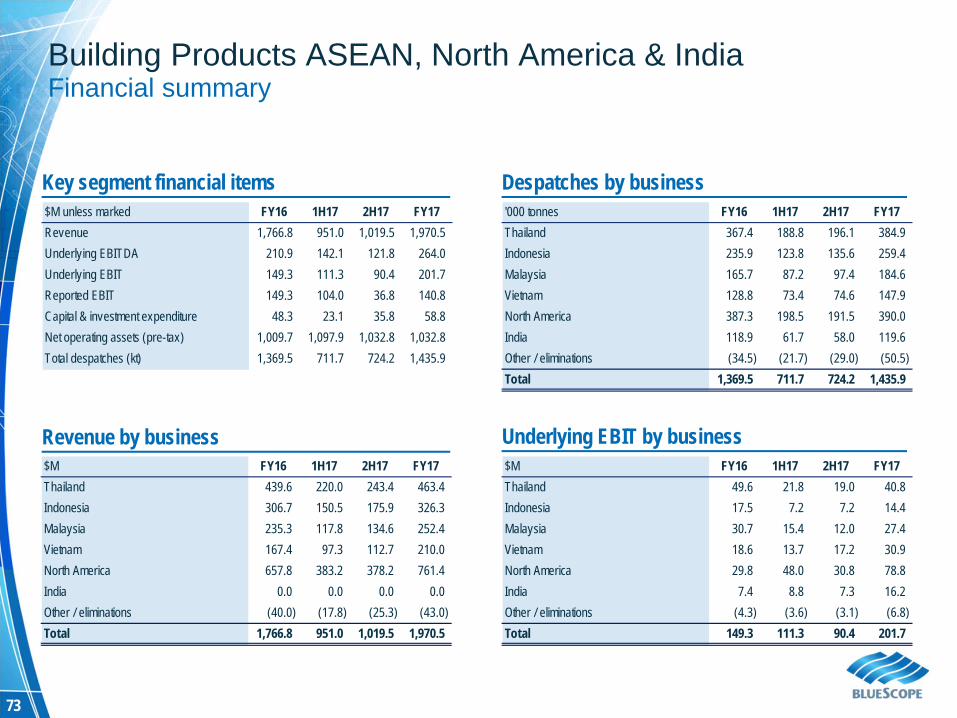
73
Key segment financial items$M unless marked FY16 1H17 2H17 FY17Revenue 1,766.8 951.0 1,019.5 1,970.5Underlying EBITDA 210.9 142.1 121.8 264.0Underlying EBIT 149.3 111.3 90.4 201.7Reported EBIT 149.3 104.0 36.8 140.8Capital & investment expenditure 48.3 23.1 35.8 58.8Net operating assets (pre-tax) 1,009.7 1,097.9 1,032.8 1,032.8Total despatches (kt) 1,369.5 711.7 724.2 1,435.9
Despatches by business'000 tonnes FY16 1H17 2H17 FY17Thailand 367.4 188.8 196.1 384.9Indonesia 235.9 123.8 135.6 259.4Malaysia 165.7 87.2 97.4 184.6Vietnam 128.8 73.4 74.6 147.9North America 387.3 198.5 191.5 390.0India 118.9 61.7 58.0 119.6Other / eliminations (34.5) (21.7) (29.0) (50.5)Total 1,369.5 711.7 724.2 1,435.9
Revenue by business Underlying EBIT by business$M FY16 1H17 2H17 FY17Thailand 49.6 21.8 19.0 40.8Indonesia 17.5 7.2 7.2 14.4Malaysia 30.7 15.4 12.0 27.4Vietnam 18.6 13.7 17.2 30.9North America 29.8 48.0 30.8 78.8India 7.4 8.8 7.3 16.2Other / eliminations (4.3) (3.6) (3.1) (6.8)Total 149.3 111.3 90.4 201.7
$M FY16 1H17 2H17 FY17Thailand 439.6 220.0 243.4 463.4Indonesia 306.7 150.5 175.9 326.3Malaysia 235.3 117.8 134.6 252.4Vietnam 167.4 97.3 112.7 210.0North America 657.8 383.2 378.2 761.4India 0.0 0.0 0.0 0.0Other / eliminations (40.0) (17.8) (25.3) (43.0)Total 1,766.8 951.0 1,019.5 1,970.5
Building Products ASEAN, North America & IndiaFinancial summary
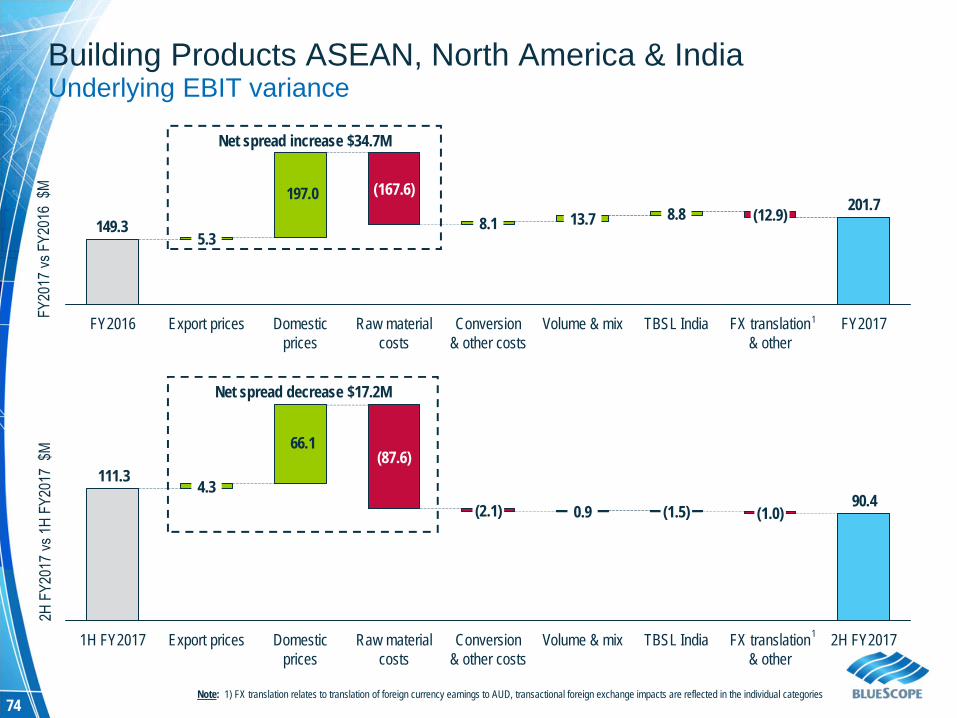
74
Net spread decrease $17.2M
Net spread increase $34.7M
201.7 197.0
149.3
FY2017FX translation & other
(12.9)
TBSL India
8.8
Volume & mix
13.7
Conversion & other costs
8.1
Raw material costs
(167.6)
Domestic prices
Export prices
5.3
FY2016
90.4
66.1
111.3
2H FY2017FX translation & other
(1.0)
TBSL India
(1.5)
Volume & mix
0.9
Conversion & other costs
(2.1)
Raw material costs
(87.6)
Domestic prices
Export prices
4.3
1H FY2017
Building Products ASEAN, North America & IndiaUnderlying EBIT variance
Note: 1) FX translation relates to translation of foreign currency earnings to AUD, transactional foreign exchange impacts are reflected in the individual categories
1
1
75
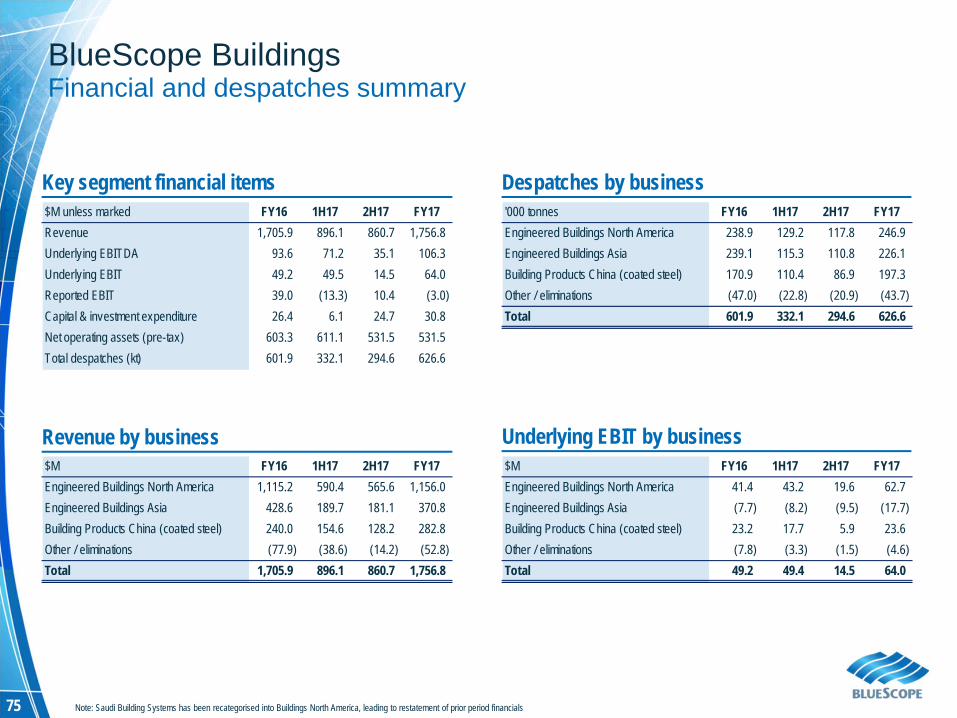
Key segment financial items$M unless marked FY16 1H17 2H17 FY17Revenue 1,705.9 896.1 860.7 1,756.8Underlying EBITDA 93.6 71.2 35.1 106.3Underlying EBIT 49.2 49.5 14.5 64.0Reported EBIT 39.0 (13.3) 10.4 (3.0)Capital & investment expenditure 26.4 6.1 24.7 30.8Net operating assets (pre-tax) 603.3 611.1 531.5 531.5Total despatches (kt) 601.9 332.1 294.6 626.6
Despatches by business'000 tonnes FY16 1H17 2H17 FY17Engineered Buildings North America 238.9 129.2 117.8 246.9Engineered Buildings Asia 239.1 115.3 110.8 226.1Building Products China (coated steel) 170.9 110.4 86.9 197.3Other / eliminations (47.0) (22.8) (20.9) (43.7)Total 601.9 332.1 294.6 626.6
Revenue by business Underlying EBIT by business$M FY16 1H17 2H17 FY17Engineered Buildings North America 41.4 43.2 19.6 62.7Engineered Buildings Asia (7.7) (8.2) (9.5) (17.7)Building Products China (coated steel) 23.2 17.7 5.9 23.6Other / eliminations (7.8) (3.3) (1.5) (4.6)Total 49.2 49.4 14.5 64.0
$M FY16 1H17 2H17 FY17Engineered Buildings North America 1,115.2 590.4 565.6 1,156.0Engineered Buildings Asia 428.6 189.7 181.1 370.8Building Products China (coated steel) 240.0 154.6 128.2 282.8Other / eliminations (77.9) (38.6) (14.2) (52.8)Total 1,705.9 896.1 860.7 1,756.8
BlueScope BuildingsFinancial and despatches summary
Note: Saudi Building Systems has been recategorised into Buildings North America, leading to restatement of prior period financials
76
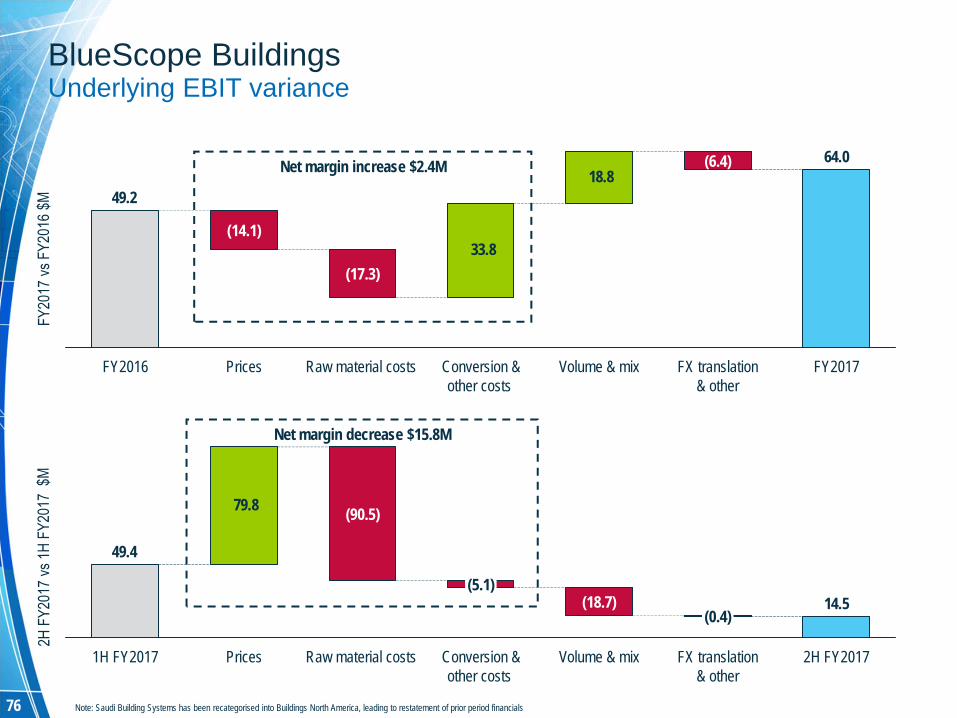
Net margin decrease $15.8M
Net margin increase $2.4M
33.8
18.8 64.0
49.2
FY2017FX translation & other
(6.4)
Volume & mixConversion & other costs
Raw material costs
(17.3)
Prices
(14.1)
FY2016
79.8
14.5
49.4
(0.4)
FX translation & other
2H FY2017Volume & mix
(18.7)
Conversion & other costs
(5.1)
Raw material costs
(90.5)
Prices1H FY2017
BlueScope BuildingsUnderlying EBIT variance
Note: Saudi Building Systems has been recategorised into Buildings North America, leading to restatement of prior period financials
77
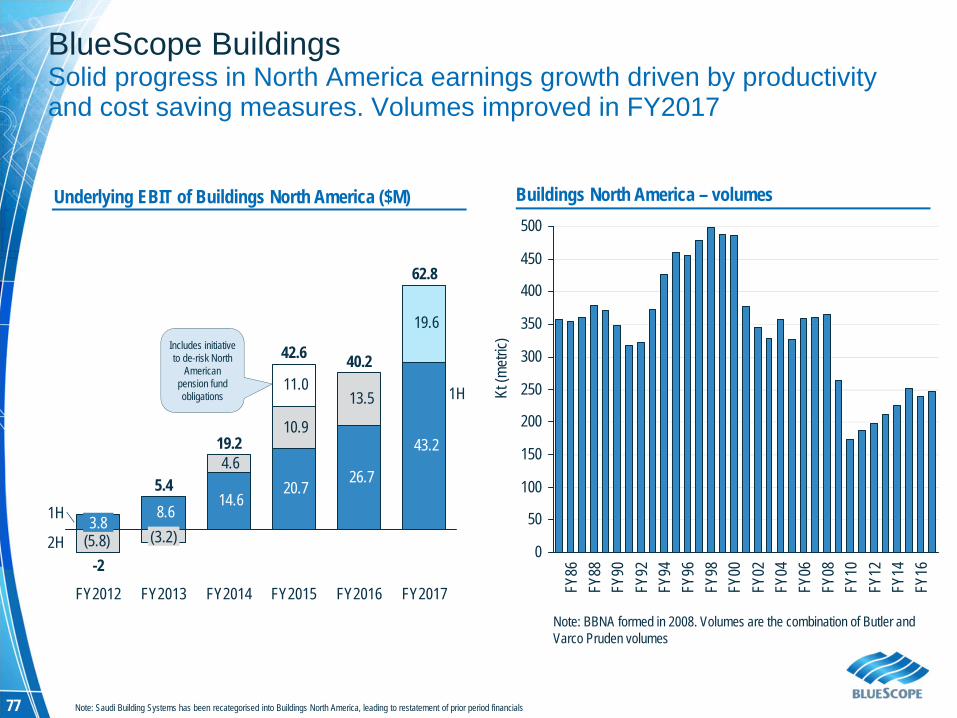
BlueScope BuildingsSolid progress in North America earnings growth driven by productivity and cost saving measures. Volumes improved in FY2017
Underlying EBIT of Buildings North America ($M)
0
50
100
150
200
250
300
350
400
450
500
FY16
FY14
FY12
FY10
FY08
FY06
FY04
FY02
FY00
FY98
FY96
FY94
FY92
FY90
FY88
FY86
Kt(m
etric)
Buildings North America – volumes
Note: BBNA formed in 2008. Volumes are the combination of Butler and Varco Pruden volumes
14.6 20.7 26.7
43.2 4.6
10.9
13.5
19.6
(5.8)
8.6
11.0
1H
2H
FY2017
62.8
FY2016
40.2
FY2015
42.6
FY2014
19.2
FY2013
5.4
(3.2)
FY2012
-2
3.8
1H
Includes initiative to de-risk North
American pension fund obligations
Note: Saudi Building Systems has been recategorised into Buildings North America, leading to restatement of prior period financials
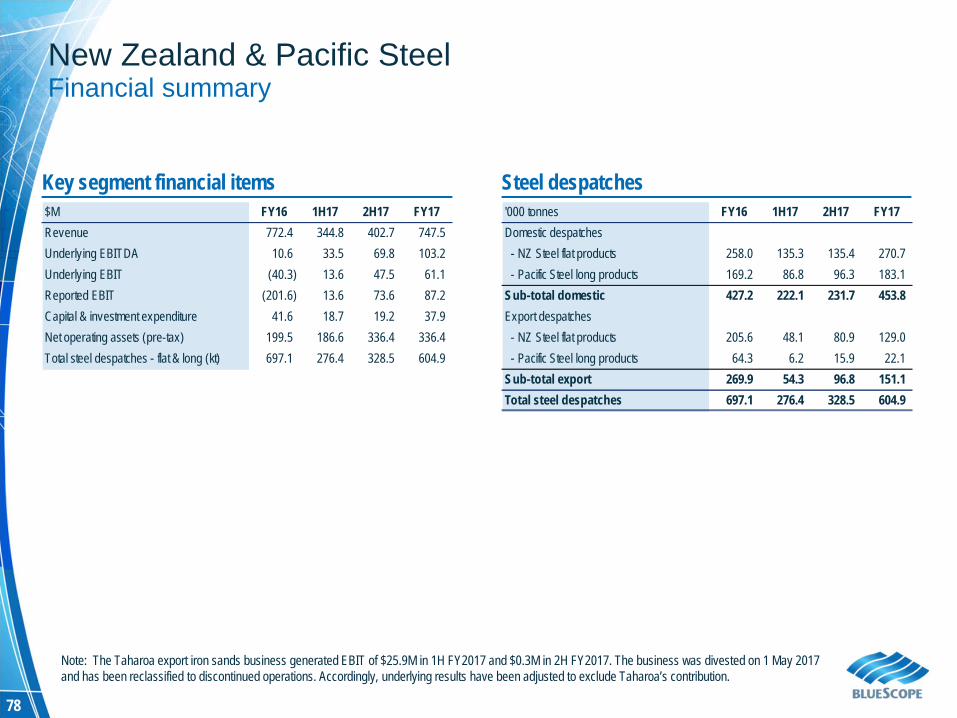
78
Key segment financial items$M FY16 1H17 2H17 FY17Revenue 772.4 344.8 402.7 747.5Underlying EBITDA 10.6 33.5 69.8 103.2Underlying EBIT (40.3) 13.6 47.5 61.1Reported EBIT (201.6) 13.6 73.6 87.2Capital & investment expenditure 41.6 18.7 19.2 37.9Net operating assets (pre-tax) 199.5 186.6 336.4 336.4Total steel despatches - flat & long (kt) 697.1 276.4 328.5 604.9
New Zealand & Pacific SteelFinancial summary
Steel despatches '000 tonnes FY16 1H17 2H17 FY17Domestic despatches - NZ Steel flat products 258.0 135.3 135.4 270.7 - Pacific Steel long products 169.2 86.8 96.3 183.1Sub-total domestic 427.2 222.1 231.7 453.8Export despatches - NZ Steel flat products 205.6 48.1 80.9 129.0 - Pacific Steel long products 64.3 6.2 15.9 22.1Sub-total export 269.9 54.3 96.8 151.1Total steel despatches 697.1 276.4 328.5 604.9
Note: The Taharoa export iron sands business generated EBIT of $25.9M in 1H FY2017 and $0.3M in 2H FY2017. The business was divested on 1 May 2017 and has been reclassified to discontinued operations. Accordingly, underlying results have been adjusted to exclude Taharoa’s contribution.
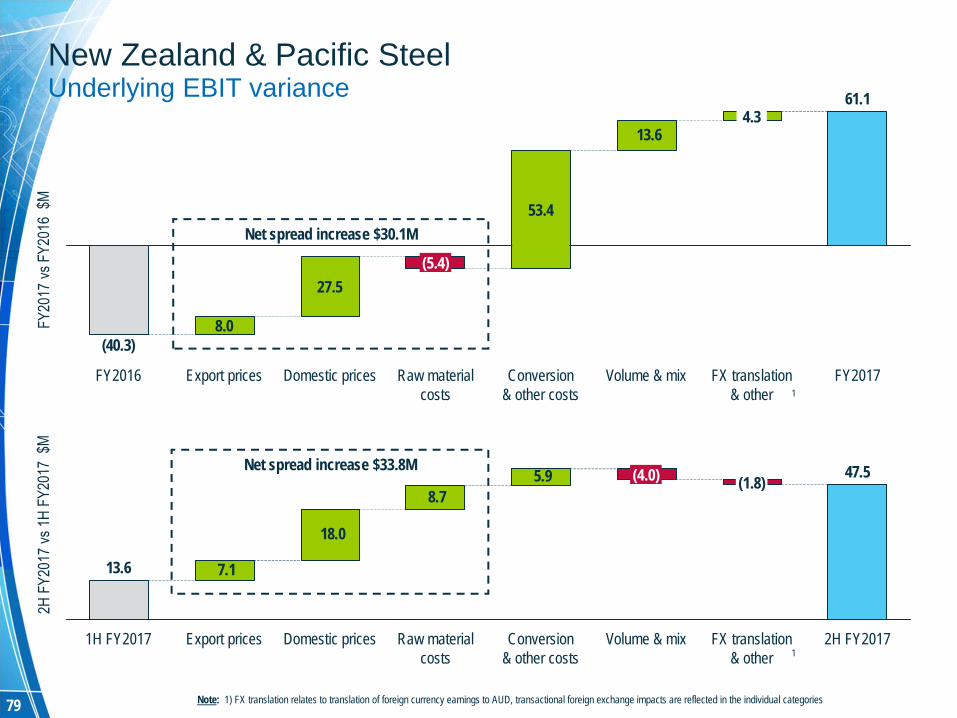
79
18.0
5.9 47.5
13.6
8.7
7.1
2H FY2017
(1.8)
FX translation & other
Volume & mix
(4.0)
Conversion & other costs
Raw material costs
Domestic pricesExport prices1H FY2017
13.6
61.1
(40.3)
Conversion & other costs
4.3
Volume & mix FY2017FX translation & other
53.4
Raw material costs
(5.4)
Domestic prices
27.5
Export prices
8.0
FY2016
Net spread increase $30.1M
Net spread increase $33.8M
New Zealand & Pacific SteelUnderlying EBIT variance
Note: 1) FX translation relates to translation of foreign currency earnings to AUD, transactional foreign exchange impacts are reflected in the individual categories
1
1
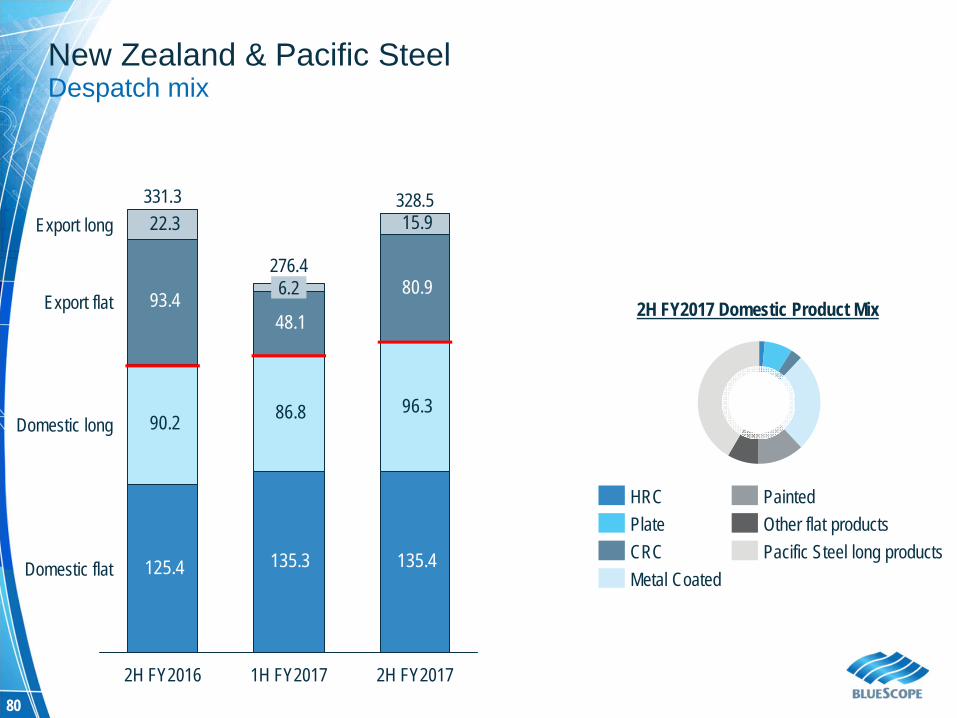
80
125.4 135.3 135.4
90.2 86.8 96.3
93.4 48.1
80.9
15.9 22.3
Domestic flat
Domestic long
Export flat
Export long
2H FY2017
328.5
1H FY2017
276.46.2
2H FY2016
331.3
New Zealand & Pacific SteelDespatch mix
2H FY2017 Domestic Product Mix
Pacific Steel long productsOther flat products
HRCPlateCRCMetal Coated
Painted
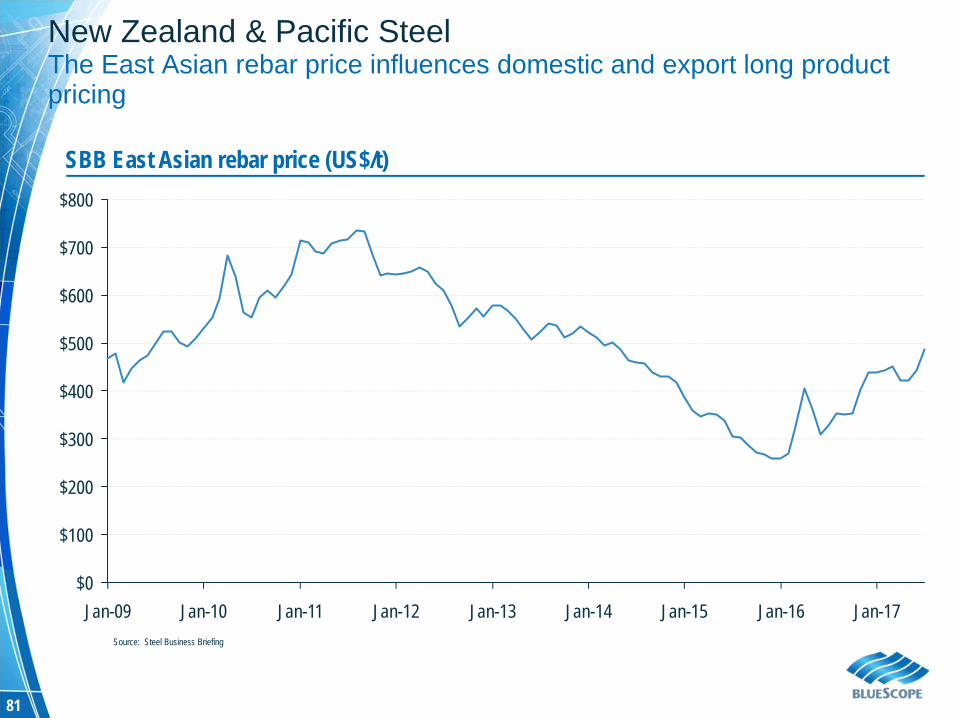
81
$500
Jan-10Jan-09 Jan-17
$600
$700
$800
$400
$300
$200
$100
$0Jan-16Jan-15Jan-14Jan-13Jan-12Jan-11
SBB East Asian rebar price (US$/t)
Source: Steel Business Briefing
New Zealand & Pacific SteelThe East Asian rebar price influences domestic and export long product pricing
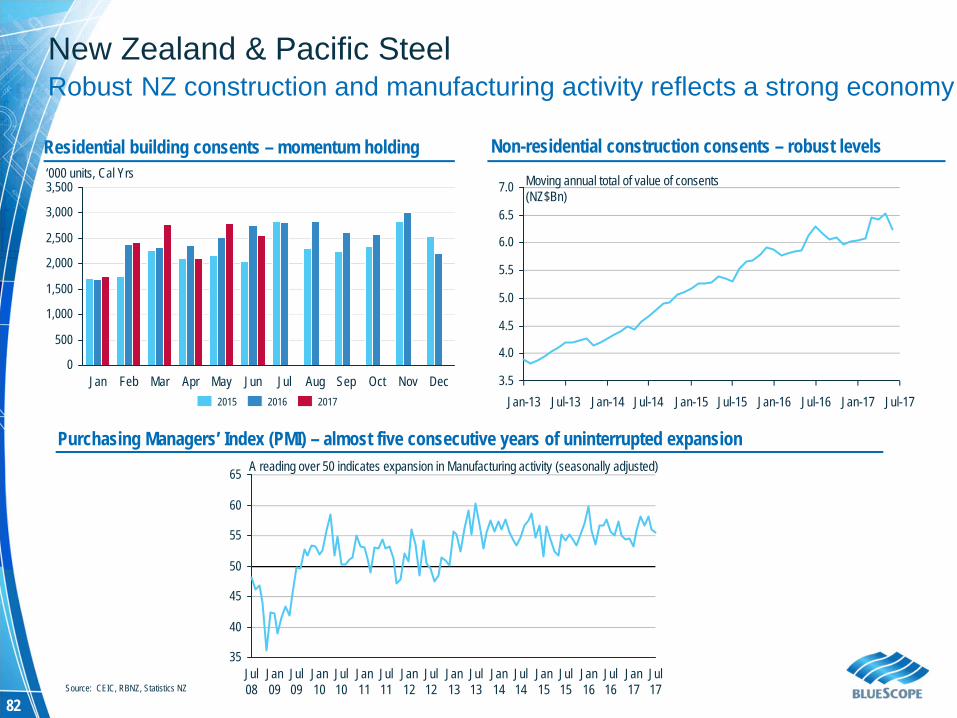
82
Residential building consents – momentum holding Non-residential construction consents – robust levels
New Zealand & Pacific SteelRobust NZ construction and manufacturing activity reflects a strong economy
35
40
45
50
55
60
65
Jul 17
Jan 17
Jul 16
Jan 16
Jul 15
Jan 15
Jul 14
Jan 14
Jul 13
Jan 13
Jul 12
Jan 12
Jul 11
Jan 11
Jul 10
Jan 10
Jul 09
Jan 09
Jul 08
A reading over 50 indicates expansion in Manufacturing activity (seasonally adjusted)
0
500
1,000
1,500
2,000
2,500
3,000
3,500
DecNovOctSepAugJulJunMayAprMarFebJan201720162015
3.5
4.0
4.5
5.0
5.5
6.0
6.5
7.0
Jan-15Jul-14Jan-14Jul-13Jan-13 Jul-17Jan-17Jul-16Jan-16Jul-15
‘000 units, Cal Yrs Moving annual total of value of consents (NZ$Bn)
Source: CEIC, RBNZ, Statistics NZ
Purchasing Managers’ Index (PMI) – almost five consecutive years of uninterrupted expansion
FY2017 Financial Results Presentation
21 August 2017
Paul O’Malley, Managing Director and Chief Executive OfficerCharlie Elias, Chief Financial Officer
BlueScope Steel Limited. ASX Code: BSL