Embed Size (px)
Citation preview

ISSN 1346-7328
ISSN 0386-5878
Technical Note of National Institute for Land and Infrastructure Management No.280 December 2005
T e c h n i c a l N o t e o f P u b l i c W o r k s R e s e a r c h I n s t i t u t e No.3990 December 2005
FY2004 RESEARCH SUMMARY OF WASTEWATER MANAGEMENT AND W A T E R Q U A L I T Y C O N T R O L
National Institute for Land and Infrastructure Management, Minis t ry of Land, Infrast ructure and Transport , Japan
Incorporated Administrative Agency Public Works Research Institute

Technical Note of NILIM No.280 December 2005
Technical Note of PWRI No.3990 December 2005
FY2004 RESEARCH SUMMARY OF WASTEWATER MANAGEMENT AND W A T E R Q U A L I T Y C O N T R O L
WASTEWATER SYSTEM DIVISION WASTEWATER AND SLUDGE MANAGEMENT DIVISION
of WATER QUALITY CONTROL DEPARTMENT
NATIONAL INSTITUTE FOR LAND AND INFRASTRUCTURE MANAGEMENT, MINISTRY OF LAND, INFRASTRUCTURE AND TRANSPORT, JAPAN
RECYCLING RESEARCH TEAM of MATERIAL AND GEOTECHNICAL ENGINEERING RESEARCH GROUP
WATER QUALITY RESEARCH TEAM of WATER ENVIRONMENT RESEARCH GROUP
INCORPORATED ADMINISTRATIVE AGENCY PUBLIC WORKS RESEARCH INSTITUTE
Synopsis
This Research Summary briefly introduces researches on wastewater management and water quality control carried out in Fiscal 2004 by National Institute Land and Infrastructure Management, Ministry of Land, Infrastructure and Transport, Japan and Incorporated Administrative Agency Public Works Research Institute.
Key words: wastewater system, wastewater treatment, advanced wastewater treatment, wastewater sludge, water quality control, recycling
PREFACE
This Research Summary briefly introduces researches on wastewater management and water quality control that were carried out in fiscal 2004 by National Institute for Land and Infrastructure Management, Ministry of Land, Infrastructure and Transport and Incorporated Administrative Agency Public Works Research Institute. While the full content of each research is presented in Japanese in the Annual Report of Wastewater Management and Water Quality Control (Technical Note of NILIM No. 263, Technical Note of PWRI No. 3976), the abstract of each research is being published in both Japanese and English. Since we have several tens of foreign visitors to NILIM and PWRI each year to exchange views on water quality control engineering each other, English version, though abstract, is considered useful for that.
NILIM's researches introduced in this Research Summary were funded through Research Funds for Sewerage & Sewage Purification Programs, Construction Technology R&D Expenses, Research & Study Expenses for ODA, Research & Study Expenses and Global Environment Research Fund, while PWRI's through Grants for operating expenses and Income from entrusted research inclusive of Research Funds for Sewerage & Sewage Purification Programs. Although these funds have different purposes in each research from theory to practice, the results are obtained through intensive studies and are all useful to effectively promote wastewater management and water quality control. Hopefully, more intensive exchange of views in water quality control engineering is to be promoted through this Research Summary.
Kenji Sakai, Director Water Quality Control Department, National Institute for Land and Infrastructure Management, Ministry of Land, Infrastructure and Transport
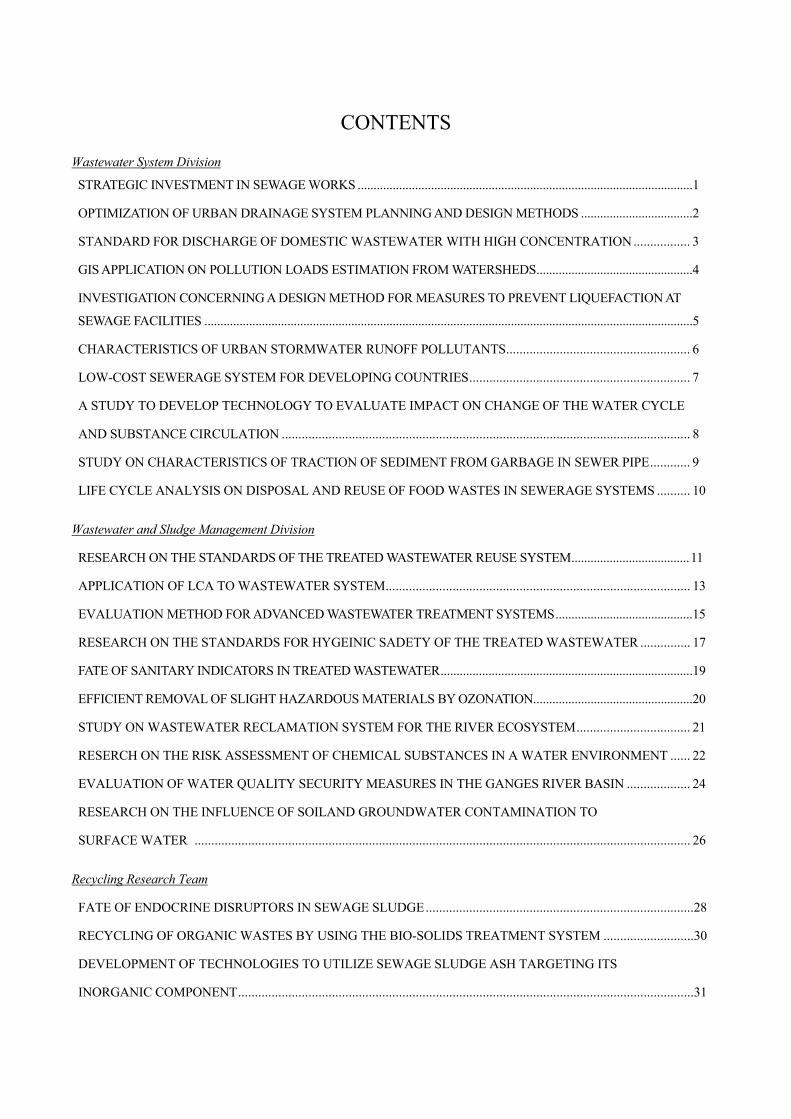
CONTENTS
Wastewater System Division
STRATEGIC INVESTMENT IN SEWAGE WORKS .........................................................................................................1
OPTIMIZATION OF URBAN DRAINAGE SYSTEM PLANNING AND DESIGN METHODS ...................................2
STANDARD FOR DISCHARGE OF DOMESTIC WASTEWATER WITH HIGH CONCENTRATION................. 3
GIS APPLICATION ON POLLUTION LOADS ESTIMATION FROM WATERSHEDS.................................................4
INVESTIGATION CONCERNING A DESIGN METHOD FOR MEASURES TO PREVENT LIQUEFACTION AT
SEWAGE FACILITIES .........................................................................................................................................................5
CHARACTERISTICS OF URBAN STORMWATER RUNOFF POLLUTANTS....................................................... 6
LOW-COST SEWERAGE SYSTEM FOR DEVELOPING COUNTRIES.................................................................. 7
A STUDY TO DEVELOP TECHNOLOGY TO EVALUATE IMPACT ON CHANGE OF THE WATER CYCLE
AND SUBSTANCE CIRCULATION .......................................................................................................................... 8
STUDY ON CHARACTERISTICS OF TRACTION OF SEDIMENT FROM GARBAGE IN SEWER PIPE............ 9
LIFE CYCLE ANALYSIS ON DISPOSAL AND REUSE OF FOOD WASTES IN SEWERAGE SYSTEMS .......... 10
Wastewater and Sludge Management Division
RESEARCH ON THE STANDARDS OF THE TREATED WASTEWATER REUSE SYSTEM.....................................11
APPLICATION OF LCA TO WASTEWATER SYSTEM........................................................................................... 13
EVALUATION METHOD FOR ADVANCED WASTEWATER TREATMENT SYSTEMS...........................................15
RESEARCH ON THE STANDARDS FOR HYGEINIC SADETY OF THE TREATED WASTEWATER ............... 17
FATE OF SANITARY INDICATORS IN TREATED WASTEWATER...............................................................................19
EFFICIENT REMOVAL OF SLIGHT HAZARDOUS MATERIALS BY OZONATION..................................................20
STUDY ON WASTEWATER RECLAMATION SYSTEM FOR THE RIVER ECOSYSTEM.................................. 21
RESERCH ON THE RISK ASSESSMENT OF CHEMICAL SUBSTANCES IN A WATER ENVIRONMENT ...... 22
EVALUATION OF WATER QUALITY SECURITY MEASURES IN THE GANGES RIVER BASIN ................... 24
RESEARCH ON THE INFLUENCE OF SOILAND GROUNDWATER CONTAMINATION TO
SURFACE WATER .................................................................................................................................................... 26
Recycling Research Team
FATE OF ENDOCRINE DISRUPTORS IN SEWAGE SLUDGE................................................................................28
RECYCLING OF ORGANIC WASTES BY USING THE BIO-SOLIDS TREATMENT SYSTEM ...........................30
DEVELOPMENT OF TECHNOLOGIES TO UTILIZE SEWAGE SLUDGE ASH TARGETING ITS
INORGANIC COMPONENT........................................................................................................................................31
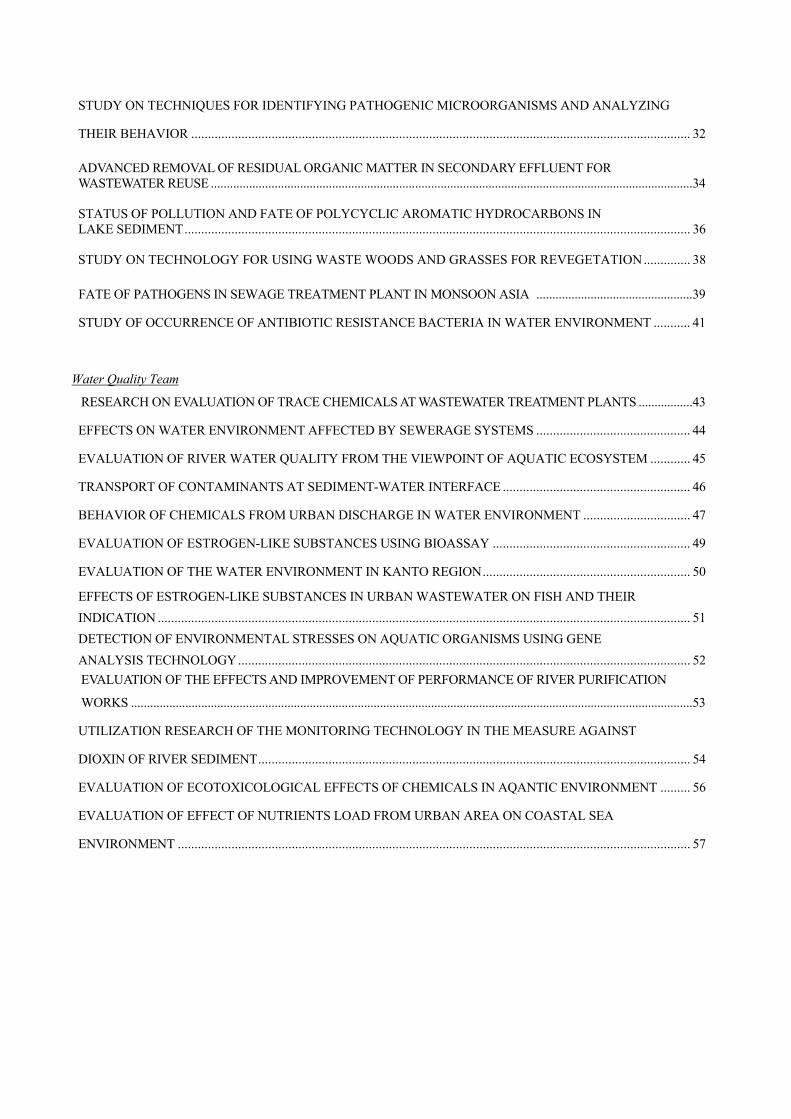
STUDY ON TECHNIQUES FOR IDENTIFYING PATHOGENIC MICROORGANISMS AND ANALYZING
THEIR BEHAVIOR ..................................................................................................................................................... 32 ADVANCED REMOVAL OF RESIDUAL ORGANIC MATTER IN SECONDARY EFFLUENT FOR WASTEWATER REUSE .......................................................................................................................................................34 STATUS OF POLLUTION AND FATE OF POLYCYCLIC AROMATIC HYDROCARBONS IN LAKE SEDIMENT....................................................................................................................................................... 36 STUDY ON TECHNOLOGY FOR USING WASTE WOODS AND GRASSES FOR REVEGETATION.............. 38
FATE OF PATHOGENS IN SEWAGE TREATMENT PLANT IN MONSOON ASIA .................................................39
STUDY OF OCCURRENCE OF ANTIBIOTIC RESISTANCE BACTERIA IN WATER ENVIRONMENT ........... 41
Water Quality Team
RESEARCH ON EVALUATION OF TRACE CHEMICALS AT WASTEWATER TREATMENT PLANTS .................43
EFFECTS ON WATER ENVIRONMENT AFFECTED BY SEWERAGE SYSTEMS .............................................. 44
EVALUATION OF RIVER WATER QUALITY FROM THE VIEWPOINT OF AQUATIC ECOSYSTEM ............ 45
TRANSPORT OF CONTAMINANTS AT SEDIMENT-WATER INTERFACE ........................................................ 46
BEHAVIOR OF CHEMICALS FROM URBAN DISCHARGE IN WATER ENVIRONMENT ................................ 47
EVALUATION OF ESTROGEN-LIKE SUBSTANCES USING BIOASSAY ........................................................... 49
EVALUATION OF THE WATER ENVIRONMENT IN KANTO REGION.............................................................. 50
EFFECTS OF ESTROGEN-LIKE SUBSTANCES IN URBAN WASTEWATER ON FISH AND THEIR INDICATION ............................................................................................................................................................... 51 DETECTION OF ENVIRONMENTAL STRESSES ON AQUATIC ORGANISMS USING GENE ANALYSIS TECHNOLOGY....................................................................................................................................... 52 EVALUATION OF THE EFFECTS AND IMPROVEMENT OF PERFORMANCE OF RIVER PURIFICATION
WORKS ................................................................................................................................................................................53
UTILIZATION RESEARCH OF THE MONITORING TECHNOLOGY IN THE MEASURE AGAINST
DIOXIN OF RIVER SEDIMENT................................................................................................................................. 54
EVALUATION OF ECOTOXICOLOGICAL EFFECTS OF CHEMICALS IN AQANTIC ENVIRONMENT ......... 56
EVALUATION OF EFFECT OF NUTRIENTS LOAD FROM URBAN AREA ON COASTAL SEA
ENVIRONMENT ......................................................................................................................................................... 57
STRATEGIC INVESTMENT IN SEWAGE WORKS
K. Fujiu, and T. Yoshida Wastewater System Division
Project period: 2002-2005
OBJECTIVES
Cost benefit analysis can be effective in setting target for water quality improvement in public water areas. The effect of water quality improvement by sewage works is categorized into two items: use value such as recreation, and non-use value such as ecosystem conservation. The Contingent Valuation Method (CVM) can be used to measure the benefits including non-use value, but there are not many researches involving the benefit measurement technique in our country, and thus general application methodologies should be established.
On the other hand, the United States, which has actively adopted CVM in environment assessment, evaluated the nationwide benefit of water quality improvement due to the Clean Water Act, based on CVM surveys conducted at 61 sites. In Japan, the establishment of benefit transfer must be researched further, and various conditions such as assumptions of function forms must be examined for possible cases. With a view to application of benefit transfer function, a CVM survey targeting water quality improvement appraisal was conducted in this fiscal year.
RESULTS The study site of the CVM survey was set in Town of Sakai, Ibaraki Prefecture. The site selection considered income and the other qualities in the Prefecture in comparison of the existing similar surveys for effective data collection. Mail method was adopted, and WTP for water quality improvement was asked in dichotomous choice. 1,500 mails were distributed and 402, i.e. 27% of 1500, responded to the questionnaire. Out of 402 respondents, 255 effective answers were utilized for WTP appraisal and analysis for further use.
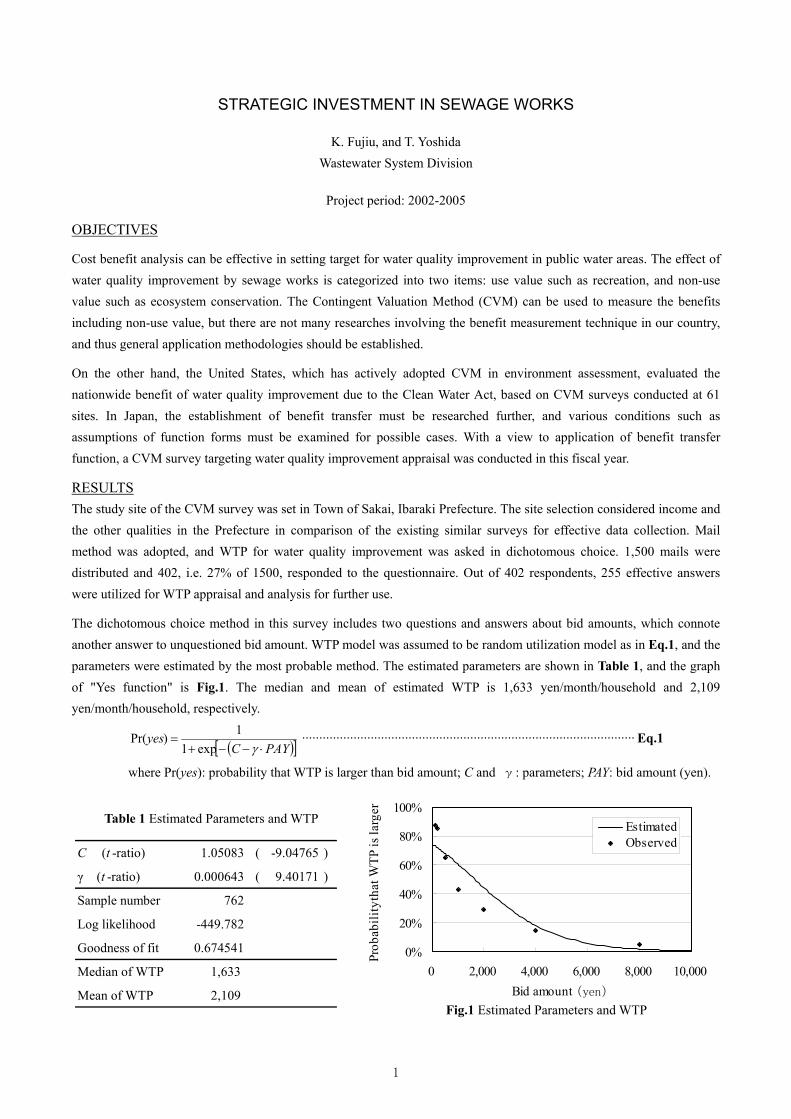
The dichotomous choice method in this survey includes two questions and answers about bid amounts, which connote another answer to unquestioned bid amount. WTP model was assumed to be random utilization model as in Eq.1, and the parameters were estimated by the most probable method. The estimated parameters are shown in Table 1, and the graph of "Yes function" is Fig.1. The median and mean of estimated WTP is 1,633 yen/month/household and 2,109 yen/month/household, respectively.
( )[ ]PAYCyes
⋅−−+=
γexp11)Pr( ································································································· Eq.1
where Pr(yes): probability that WTP is larger than bid amount; C and γ: parameters; PAY: bid amount (yen).
C (t -ratio) 1.05083 ( -9.04765 )
γ (t -ratio) 0.000643 ( 9.40171 )
Sample number 762
Log likelihood -449.782
Goodness of fit 0.674541
Median of WTP 1,633
Mean of WTP 2,109
0%
20%
40%
60%
80%
100%
0 2,000 4,000 6,000 8,000 10,000Bid amount (yen)
Prob
abili
ty th
at W
TP is
larg
er
EstimatedObserved
Table 1 Estimated Parameters and WTP
Fig.1 Estimated Parameters and WTP
1
Optimization of Urban Drainage System Planning and Design Methods
Kazuya FUJIU, Teiji SUGAYA, Tatsuo OKAMOTO
Wastewater System Division, Water Quality Control Department,
National Institute for Land and Infrastructure Management, Ministry of Land, Infrastructure and Transport
(Project Period: 2004-2006)
・Objective In Japan, a new law regarding flood control measure has been enacted in response to the frequent occurrence of urban
floods. The new law requires that urban drainage measures be promoted with the close cooperation of sewer managers and
river managers. However, till now, urban drainage measures have not always been set through cooperation with both managers.
In the future, therefore, it will be necessary to examine concrete cooperation methods.
One unsolved issue is drainage control of pumping stations that discharge storm water into rivers. Drainage control means
controlling drainage executed to prevent destruction of levees by river water when its level has risen to the danger level during
a flood. When pumps are stopped to execute drainage control, an inner water inundation occurs and the river flow burden is
lightened. In a basin where a high percentage of the river flow is water discharged by the pumping of drainage, the rules
governing drainage control such as the location of the gauging station that observes the water level that is a criterion for
drainage control, the method of setting the water level at which the pump is stopped or restarted has strong effects on flooding
damage in the basin, increasing the importance of setting optimum rules to perform drainage control.
This research was undertaken to clarify the optimum rules for drainage control performed during floods by performing a
simulation hypothesizing a simple drainage basin and estimating the influence on the rules for drainage control have on
flooding damage. We evaluated flooding damage from the perspectives of both inside water inundation and river water
flooding.
・Result This study obtained the following results.
1) It clarified that the amount and the location of the flood differed greatly according to the location of the gauging station
that observed the water level that is a criterion for the method of setting the water level at which the pump is stopped or
restarted for drainage control.
2) It suggests that when drainage control is executed on the basis of a single water level on the downstream side of the
pumping station, setting the location of the gauging station near the pumping station can suppress the rise of the water
level and the amount of inside water inundation that occurs after the pump has been stopped.
3) It suggests that when drainage control is executed on the basis of the water level near the outfall at each pumping station,
the maximum water level of the rivers is almost equal to the water level at which the which pump is stopped.
4) It suggests that when drainage control is executed on the basis of a single water level on the downstream side of the
pumping station, the amount of inside water inundation is equal in all drainage basins, but when drainage control is
executed on the basis of the water level near the outfall of each pumping station, the location of the flood differs greatly
depending on the method of setting the water level at which the pump is stopped or restarted.
2
STANDARD FOR DISCHARGE OF DOMESTIC WASTEWATER WITH HIGH CONCENTRATION
M.Takahasshi, K.Fujiu, A.Yoshida, R.Hiraide and T.Hamada
Water Quality Control Department
Project period: 2000-2003
Objectives The purpose of this study is to clarify infulluence of the introduction of garbage grinders on sewage systems in regions where
they are introduced.
Experimental Outline In the town of Utanobori in Hokkaido, a trial installation of garbage grinders was done in and around a housing estate managed
by the town from August 1999 to March 2002. At this time, garbage grinders are installed in 301 households (639 people) that is a
garbage grinder penetration rate of 36% (/person)
1. Garbage Grinder's Use and Pollution Loads in Hotel's Kitchen
This study is to survey the actual situation of how a garbage grinder is used in a resort hotel's restaurant's kitchen in Utanobori
Town, and to estimate the pollution loads from the garbage grinder's use.
2 Influence of Garbage Grinder Introduction on the Sewer pipe This research, a study of the properties of the deposition of materials inside sewer pipes that is a factor contributing to the
production of hydrogen sulfide, was conducted by sampling deposited material in districts where garbage grinders are installed
and in districts where garbage grinders are not installed. The concentrations of hydrogen sulfide in pipes with large quantities of
deposited material were measured.
Results 1. Pollution loads from Garbage Grinder Use in Hotel Kitchen in Utanobori Town 1) Water consumption by the garbage grinder use was too small to be detected through monthly water consumption records.
2) 94% of total garbage amount from the kitchen was processed by the garage grinder.
3) There was no significant difference between garbage-water quality conversion ratios of the restaurant kitchen and those of house kitchens.
2 Influence of Garbage Grinder Introduction on the Sewer pipe 1) The volatile solid content of material deposited in sewer pipes in districts where garbage disposers are installed ranges
from 5% to 8%, indicating that the deposited material contains more organic material than in districts without garbage
disposers where the volatile solid content is 2% or 3%.
2) It was predicted that the hydrogen sulfide concentration would be high at the outlets of pressurized feed pipes and at
pumping stations because polluted water containing garbage is retained at these locations. But in Utanobori, hydrogen
sulfide was not observed at these locations. 3) In pipes where eggshell fragments have accumulated, a maximum of 20ppm/second of hydrogen sulfide is produced in
the summer when the temperature is high for several months. But Utanobori is in a cold region where the period of high temperature conditions that produce hydrogen sulfide is extremely short. And the pipes are PVC pipes that are not
corroded by hydrogen sulfide. In the future, the impact of wastewater from garbage disposers on the corrosion of sewer
pipes must be studied in regions where pipe corrosion is a problem.
3
GIS Application on Pollution Loads Estimation from Watersheds
K. Fujiu, T. Yoshida, and N. Tamoto Wastewater System Division
Project period: 2004-2006
OBJECTIVES
For effective ambience water quality control, it is relevant to establish master plans on pollution loads in units of watersheds, and Comprehensive Basin-wide Plans of Sewerage System (hereinafter, referred to as CBPSS) take a leading role for conducting sewage works. In practice of plan formulation, estimation of pollution loads on a watershed basis and load reduction in sewage works sector accompanies not a little time and works of data collection and calculation. On the other hand, as Geographic Information System (hereinafter, referred to as GIS) recently see a remarkable progress with large number of data digitized, environment of GIS application has been getting a stable ground.
This research aims to establish database for pollution loads and seek for a methodology of estimating pollution load accurately and in a more reasonable way. In the fiscal year 2004, as the beginning year of this research, current practices of pollution loads estimation in three CBPSS as well as GIS data availability were surveyed, and applicability of GIS utilization in pollution loads estimation was considered.
RESULTS
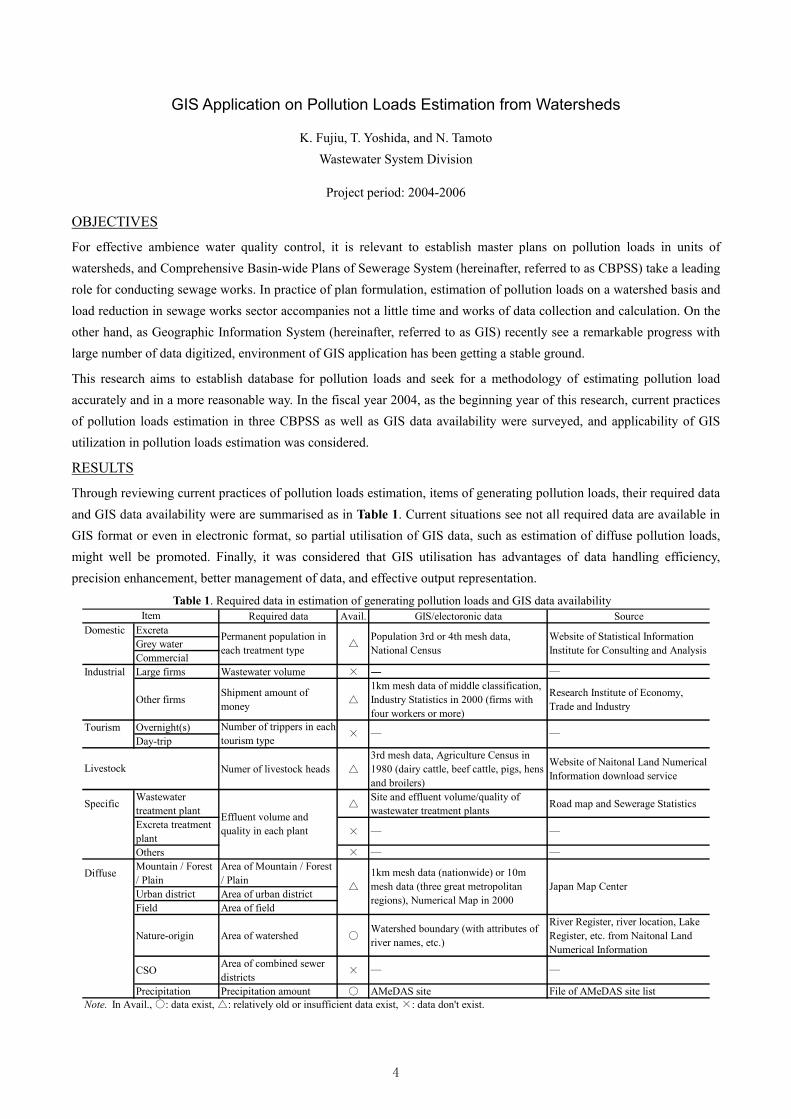
Through reviewing current practices of pollution loads estimation, items of generating pollution loads, their required data and GIS data availability were are summarised as in Table 1. Current situations see not all required data are available in GIS format or even in electronic format, so partial utilisation of GIS data, such as estimation of diffuse pollution loads, might well be promoted. Finally, it was considered that GIS utilisation has advantages of data handling efficiency, precision enhancement, better management of data, and effective output representation.
Required data Avail. GIS/electoronic data SourceDomestic Excreta
Grey waterCommercial
Industrial Large firms Wastewater volume × ― ―
Other firmsShipment amount ofmoney △
1km mesh data of middle classification,Industry Statistics in 2000 (firms withfour workers or more)
Research Institute of Economy,Trade and Industry
Tourism Overnight(s)Day-trip
Numer of livestock heads △
3rd mesh data, Agriculture Census in1980 (dairy cattle, beef cattle, pigs, hensand broilers)
Website of Naitonal Land NumericalInformation download service
Specific Wastewatertreatment plant △
Site and effluent volume/quality ofwastewater treatment plants
Road map and Sewerage Statistics
Excreta treatmentplant × ― ―
Others × ― ―
Diffuse Mountain / Forest/ Plain
Area of Mountain / Forest/ Plain
Urban district Area of urban districtField Area of field
Nature-origin Area of watershed ○Watershed boundary (with attributes ofriver names, etc.)
River Register, river location, LakeRegister, etc. from Naitonal LandNumerical Information
CSO Area of combined sewerdistricts × ― ―
Precipitation Precipitation amount ○ AMeDAS site File of AMeDAS site listNote. In Avail., ○: data exist, △: relatively old or insufficient data exist, ×: data don't exist.
1km mesh data (nationwide) or 10mmesh data (three great metropolitanregions), Numerical Map in 2000
Japan Map Center
Population 3rd or 4th mesh data,National Census
Website of Statistical InformationInstitute for Consulting and Analysis
― ―
△
×
△
Livestock
Item
Permanent population ineach treatment type
Number of trippers in eachtourism type
Effluent volume andquality in each plant
Table 1. Required data in estimation of generating pollution loads and GIS data availability
4

Investigation concerning a design method for measures to prevent liquefaction at sewage facilities
Kazuya Fujiu, Kaoru Namekata: Wastewater System Division, Water Quality Control Department
Project period: 2004
Objective: After the 1995 Southern Hyogo Earthquake, the guideline for the seismic resistance of sewage facilities was
improved. However, recent earthquakes such as the 2003 Off-shore Miyagi Earthquake, the 2003 Northern Miyagi
Prefecture Earthquake and the 2003 Off-shore Tokachi Earthquake, caused extensive damage to sewers by causing the
liquefaction of their backfilling.
In particular, the 2003 Off-shore Tokachi Earthquake caused liquefaction of backfilling in peat ground that was
considered safe from liquefaction. The guideline, does not stipulate a method of backfilling for ground that is
considered safe from liquefaction. Later, a questionnaire survey was held for cities, towns and villages etc. where
sewers were damaged by earthquakes in recent years. It investigated the factors that cause severe damage.
Results: The following results were obtained from the questionnaire survey.
1) At places where the JMA seismic intensity is higher than 5.4, the sewer damage rate tends to be remarkably higher
than that at places where the JMA seismic intensity is less than 5.4.
2) Many places where the JMA seismic intensity was higher than 5.4 and the sewer damage rate was high were
places with peat or soft cohesive ground that was backfilled using sand for. (A group)
3) The sewer damage rate tended to be concentrated at less than 20% at many places where the ground was soft
sand or where sand was used for backfilling and the JMA seismic intensity was higher than 5.4. (B group)
Figure 1 Relation between JMA seismic intensity and swere damage rate
0
20
40
60
80
100
4 4.5 5 5.5 6 6.5
JMA seismic intensity
sew
er d
amag
e ra
te(
%)
the peat or soft cohesive groundthe sand ground
A group
B group
5

Characteristics of Urban Stormwater Runoff Pollutants
K. Fujiu, T. Yoshida and N. Tamoto
Wastewater System Division
Project Period: 2004-2006
OBJECTIVES
In urban areas served by separate sewer systems, runoff during rainfall that includes non-point pollution loads such as road
surface drainage is almost always discharged without treatment into public waters through storm sewers. However, it is
difficult to evaluate non-point pollution load, because of limited accumulation of relevant data prevents clarification of the
actual situation.
This research aims to evaluate non-point source, which consists of heavy metals and endocrine disrupting chemicals, from
urban areas.
METHOD
The investigation was carried out at the storm
sewer outlets of three drainage areas
simultaneously during the same rainfall,
concerning two rainfall events. Table 1 presents
characteristics of target rainfalls. The items of the
water quality analysis were BOD, COD, SS, VSS,
TN, TP, heavy metals (Cu, Zn, Pb, Cd),
Bisphenol A and Benzo(a)pyrene. The sample
was obtained by manually taking 20 bottles from
each investigation point.
RESULTS
Table 2 shows the result of this survey.
According to Table 2, both event mean
concentration (EMC) and specific runoff pollutant
load measured in Area A tend to be higher than
the results in the other areas. Especially, pollutant
load of heavy metals and endocrine disrupting
chemicals in Area A were not ignorable value. It
was suggested that this difference was caused by
differences between traffic flow volume and land
use etc. in each drainage area.
In the future, more data should be accumulated
and analyzed.
Table 1 Characteristics of subject rainfall and prior rainfall
Prior fine weather days Rainfall
Maximumprecipitation
intensity
Prior fine weather days Rainfall
Maximumprecipitation
intensity(days) (mm) (mm/hr) (days) (mm) (mm/hr)
Area A 5 14 2.5 10 6 2.5Area B 5 15 3.5 4 9.5 2.5Area C 4 14.5 3 4 8 2.5
No.1 No.2
Table 2 EMC and specific pollutant load
No.1 No.2 No.1 No.2 No.1 No.2
BOD (mg/l) 12.8 19.8 3.9 20.7 4.4 17.7COD 15.5 29.3 5.7 27.2 8.9 23.7SS (mg/l) 65.5 85.9 27.7 61.7 31.7 27.9VSS (mg/l) 19.5 36.0 9.3 30.6 12.8 17.7TN (mg/l) 2.9 4.0 2.1 3.8 2.1 3.5TP (mg/l) 0.30 0.51 0.12 0.20 0.12 0.14Cu (mg/l) 0.02 0.06 0.003 0.026 0.034 0.057Zn (mg/l) 0.07 0.35 0.037 0.19 0.09 0.13Pb (mg/l) 0.0084 - 0.0024 0.0050 N.D. 0.0007Cd (mg/l) 0.001 - 0.0034 N.D. N.D. N.D.Bisphenol A (μg/l) 0.21 0.2 0.11 0.4 0.1 0.2Benzo(a)pyrene (μg/l) 0.007 0.025 0.018 0.024 0.014 0.027BOD (kg/ha) 0.72 0.52 0.02 0.16 0.02 0.13COD (kg/ha) 0.87 0.77 0.04 0.20 0.04 0.18SS (kg/ha) 3.68 2.25 0.17 0.46 0.13 0.21VSS (kg/ha) 1.09 0.94 0.06 0.23 0.05 0.13TN (kg/ha) 0.165 0.104 0.013 0.028 0.009 0.027TP (kg/ha) 0.017 0.013 0.00075 0.0015 0.00051 0.0010Cu (g/ha) 0.95 1.56 0.02 0.19 0.14 0.43Zn (g/ha) 0.47 9.12 0.23 1.43 0.37 1.00Pb (g/ha) 0.47 - 0.015 0.038 N.D. 0.0054Cd (g/ha) 0.03 - 0.021 N.D. N.D. N.D.Bisphenol A (mg/ha) 11.56 6.05 0.69 3.15 0.33 1.54Benzo(a)pyrene (mg/ha) 0.40 0.65 0.11 0.18 0.06 0.20
Area B Area C
Event MeanConcentration
(EMC)
Specific PollutantLoad
Area A
Impervious surface (%) 69 67 61Area (ha) 98 7416
6
LOW-COST SEWERAGE SYSTEM FOR DEVELOPING COUNTRIES
K. Fujiu, M. Minamiyama, T. Sugaya, M. Nasu, R. Hiraide and K. Sakurai
Wastewater System Division, and Wastewater and Sludge Management Division
Project period: 2001-2004
INTRODUCTION As hygiene deteriorates due to the remarkable progress of urbanization, it is becoming important to improve the water
environment and secure water resources in developing countries; especially in rural areas where people live in poor
hygienic conditions caused by the spread of epidemics and the shortage of water resources, because they have less
understanding of the importance of wastewater treatment than those who live in urban areas. To solve these problems, the
quality of these water resources should be improved by establishing low-cost sewerage systems through improving
existing drainage facilities such as septic tanks, wetland and soil filtration. Therefore, the objective of this research is to
develop low-cost sewerage systems suitable to the characteristics of developing countries, such as high temperatures and
low labor and land costs, including citizen participation and efficient management of sewerage systems.
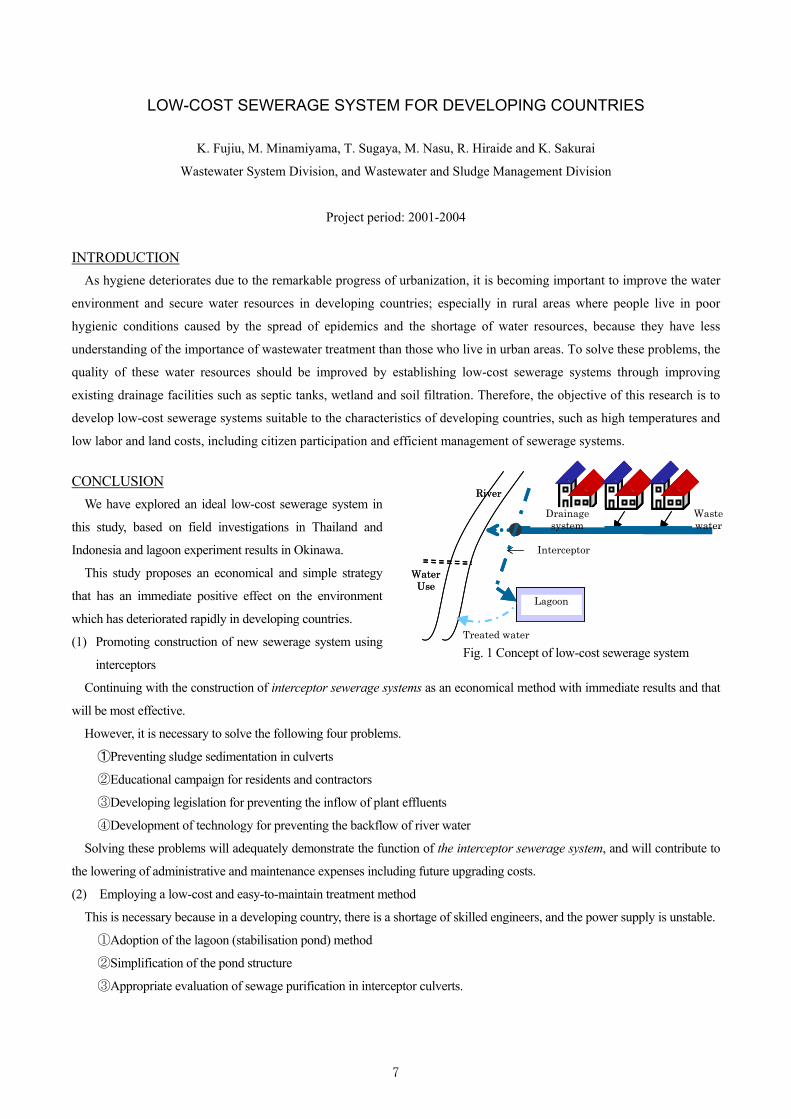
CONCLUSION We have explored an ideal low-cost sewerage system in
this study, based on field investigations in Thailand and
Indonesia and lagoon experiment results in Okinawa.
This study proposes an economical and simple strategy
that has an immediate positive effect on the environment
which has deteriorated rapidly in developing countries.
(1) Promoting construction of new sewerage system using
interceptors
Continuing with the construction of interceptor sewerage systems as an economical method with immediate results and that
will be most effective.
However, it is necessary to solve the following four problems.
①Preventing sludge sedimentation in culverts
②Educational campaign for residents and contractors
③Developing legislation for preventing the inflow of plant effluents
④Development of technology for preventing the backflow of river water
Solving these problems will adequately demonstrate the function of the interceptor sewerage system, and will contribute to
the lowering of administrative and maintenance expenses including future upgrading costs.
(2) Employing a low-cost and easy-to-maintain treatment method
This is necessary because in a developing country, there is a shortage of skilled engineers, and the power supply is unstable.
①Adoption of the lagoon (stabilisation pond) method
②Simplification of the pond structure
③Appropriate evaluation of sewage purification in interceptor culverts.
Interceptor
Drainage system
Wastewater
Lagoon
Water Use
Treated water
River
Interceptor
Drainage system
Wastewater
Lagoon
Water Use
Treated water
River
Fig. 1 Concept of low-cost sewerage system
7
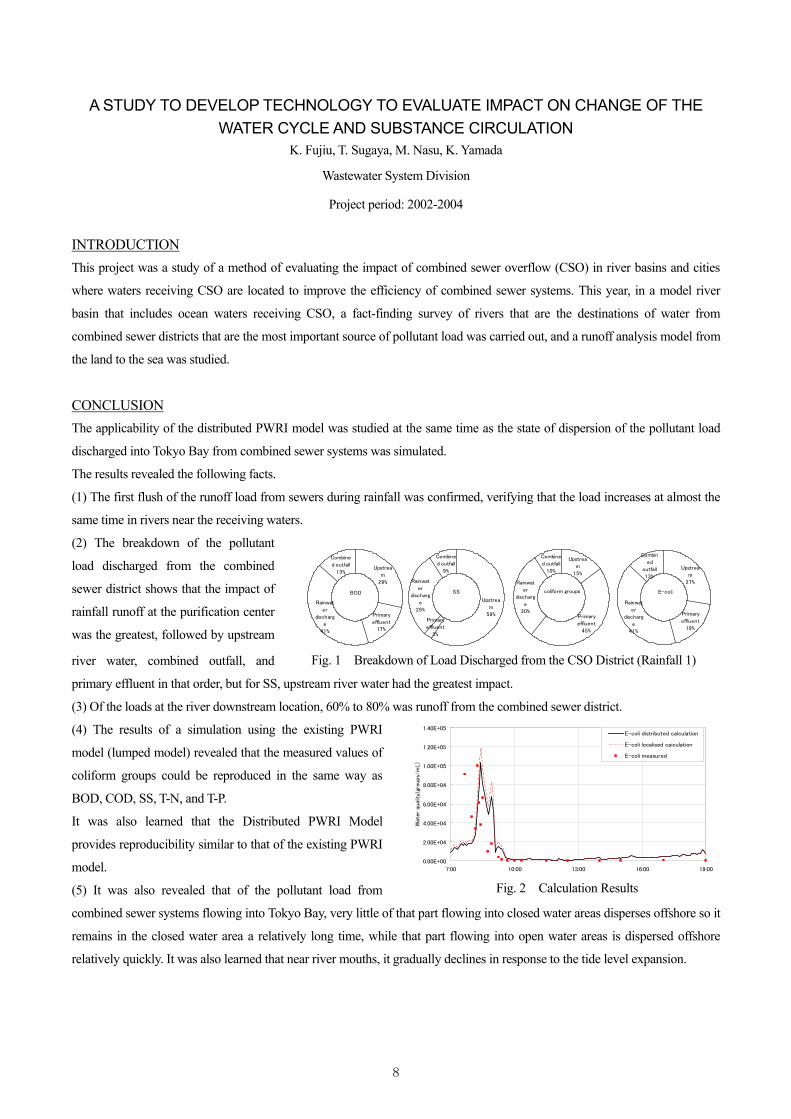
Fig. 1 Breakdown of Load Discharged from the CSO District (Rainfall 1)
BOD
Upstrea
m
29%
Primary
effluent
17%
Rainwat
er
discharg
e
41%
Combine
d outfall
13%
SS
Upstrea
m
59%Primary
effluent
3%
Rainwat
er
discharg
e
29%
Combine
d outfall
9%
coliform groups
Upstrea
m
15%
Primary
effluent
45%
Rainwat
er
discharg
e
30%
Combine
d outfall
10%
E-coli
Upstrea
m
27%
Primary
effluent
19%
Rainwat
er
discharg
e
41%
Combin
ed
outfall
13%
A STUDY TO DEVELOP TECHNOLOGY TO EVALUATE IMPACT ON CHANGE OF THE WATER CYCLE AND SUBSTANCE CIRCULATION
K. Fujiu, T. Sugaya, M. Nasu, K. Yamada
Wastewater System Division
Project period: 2002-2004
INTRODUCTION This project was a study of a method of evaluating the impact of combined sewer overflow (CSO) in river basins and cities
where waters receiving CSO are located to improve the efficiency of combined sewer systems. This year, in a model river
basin that includes ocean waters receiving CSO, a fact-finding survey of rivers that are the destinations of water from
combined sewer districts that are the most important source of pollutant load was carried out, and a runoff analysis model from
the land to the sea was studied.
CONCLUSION The applicability of the distributed PWRI model was studied at the same time as the state of dispersion of the pollutant load
discharged into Tokyo Bay from combined sewer systems was simulated.
The results revealed the following facts.
(1) The first flush of the runoff load from sewers during rainfall was confirmed, verifying that the load increases at almost the
same time in rivers near the receiving waters.
(2) The breakdown of the pollutant
load discharged from the combined
sewer district shows that the impact of
rainfall runoff at the purification center
was the greatest, followed by upstream
river water, combined outfall, and
primary effluent in that order, but for SS, upstream river water had the greatest impact.
(3) Of the loads at the river downstream location, 60% to 80% was runoff from the combined sewer district.
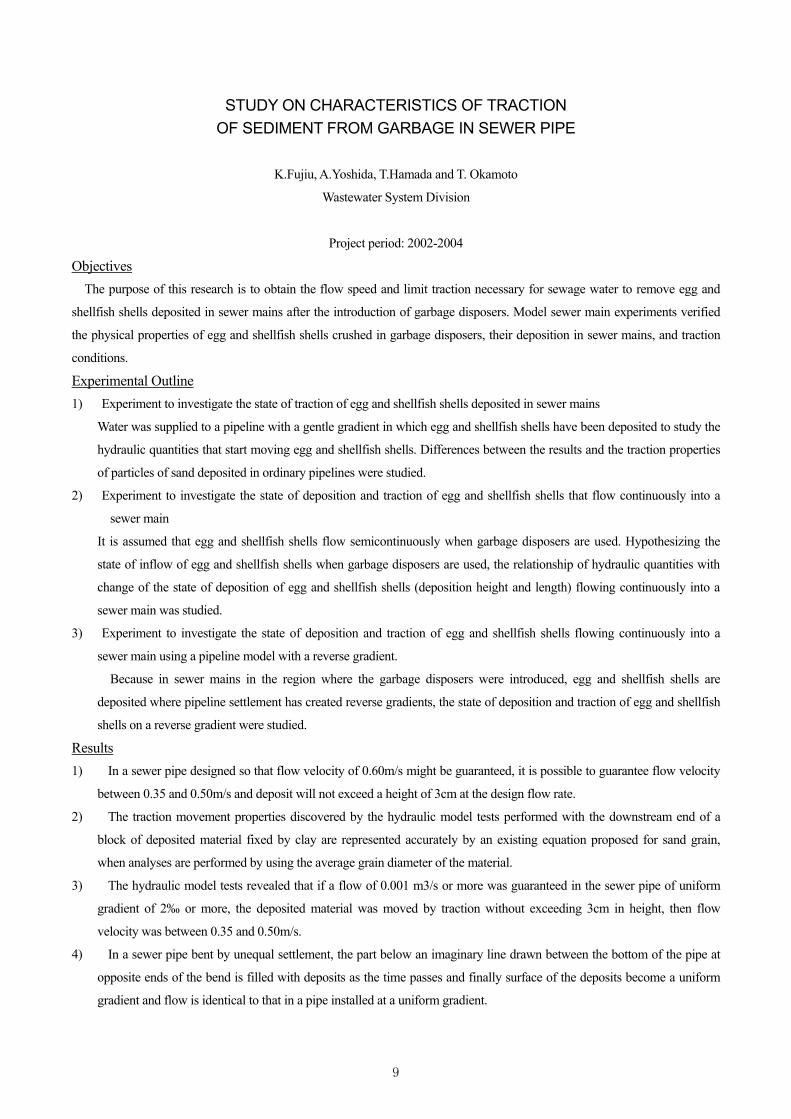
(4) The results of a simulation using the existing PWRI
model (lumped model) revealed that the measured values of
coliform groups could be reproduced in the same way as
BOD, COD, SS, T-N, and T-P.
It was also learned that the Distributed PWRI Model
provides reproducibility similar to that of the existing PWRI
model.
(5) It was also revealed that of the pollutant load from
combined sewer systems flowing into Tokyo Bay, very little of that part flowing into closed water areas disperses offshore so it
remains in the closed water area a relatively long time, while that part flowing into open water areas is dispersed offshore
relatively quickly. It was also learned that near river mouths, it gradually declines in response to the tide level expansion.
0.00E+00
2.00E+04
4.00E+04
6.00E+04
8.00E+04
1.00E+05
1.20E+05
1.40E+05
7:00 10:00 13:00 16:00 19:00
Wate
r qu
ality(
grou
ps/m
L)
E-coli distributed calculation
E-coli localised caiculation
E-coli measured
Fig. 2 Calculation Results
8
STUDY ON CHARACTERISTICS OF TRACTION OF SEDIMENT FROM GARBAGE IN SEWER PIPE
K.Fujiu, A.Yoshida, T.Hamada and T. Okamoto
Wastewater System Division
Project period: 2002-2004
Objectives The purpose of this research is to obtain the flow speed and limit traction necessary for sewage water to remove egg and
shellfish shells deposited in sewer mains after the introduction of garbage disposers. Model sewer main experiments verified
the physical properties of egg and shellfish shells crushed in garbage disposers, their deposition in sewer mains, and traction
conditions.
Experimental Outline 1) Experiment to investigate the state of traction of egg and shellfish shells deposited in sewer mains
Water was supplied to a pipeline with a gentle gradient in which egg and shellfish shells have been deposited to study the
hydraulic quantities that start moving egg and shellfish shells. Differences between the results and the traction properties
of particles of sand deposited in ordinary pipelines were studied.
2) Experiment to investigate the state of deposition and traction of egg and shellfish shells that flow continuously into a
sewer main
It is assumed that egg and shellfish shells flow semicontinuously when garbage disposers are used. Hypothesizing the
state of inflow of egg and shellfish shells when garbage disposers are used, the relationship of hydraulic quantities with
change of the state of deposition of egg and shellfish shells (deposition height and length) flowing continuously into a
sewer main was studied.
3) Experiment to investigate the state of deposition and traction of egg and shellfish shells flowing continuously into a
sewer main using a pipeline model with a reverse gradient.
Because in sewer mains in the region where the garbage disposers were introduced, egg and shellfish shells are
deposited where pipeline settlement has created reverse gradients, the state of deposition and traction of egg and shellfish
shells on a reverse gradient were studied.
Results 1) In a sewer pipe designed so that flow velocity of 0.60m/s might be guaranteed, it is possible to guarantee flow velocity
between 0.35 and 0.50m/s and deposit will not exceed a height of 3cm at the design flow rate.
2) The traction movement properties discovered by the hydraulic model tests performed with the downstream end of a
block of deposited material fixed by clay are represented accurately by an existing equation proposed for sand grain,
when analyses are performed by using the average grain diameter of the material.
3) The hydraulic model tests revealed that if a flow of 0.001 m3/s or more was guaranteed in the sewer pipe of uniform
gradient of 2‰ or more, the deposited material was moved by traction without exceeding 3cm in height, then flow
velocity was between 0.35 and 0.50m/s.
4) In a sewer pipe bent by unequal settlement, the part below an imaginary line drawn between the bottom of the pipe at
opposite ends of the bend is filled with deposits as the time passes and finally surface of the deposits become a uniform
gradient and flow is identical to that in a pipe installed at a uniform gradient.
9
Life Cycle Analysis on Disposal and Reuse of Food Wastes in Sewerage Systems
K.Fujiu, A.Yoshida and T. Yoshida
Wastewater System Division
Project period: 2002-2004
Objectives and Experimental Outline 1. Study of technologies to collect and treat organic waste material in sewer systems
Documents have been a field survey conducted in cities in the United States where the garbage grinder penetration rate is
already high to obtain information about efficient sewer maintenance technologies for use after the introduction of garbage
grinders. In order to estimate the increase of the load of influent caused by the introduction of garbage grinder s, the quality of
garbage grinder wastewater prepared based on the quantity of kitchen garbage placed in the garbage grinder and the kitchen
garbage collected from households using garbage grinder s was analyzed in Utanobori Town where garbage grinder
introduction trial has been carried out. The impact on water overflowing from a combined sewer system was studied by setting
a model district and simulating the load increase.
2. Research on the overall evaluation of the environmental impacts of the introduction of garbage disposers The impacts on sewer systems (sewer mains and treatment plants), waste treatment systems (collection and incineration
facilities, final disposal sites), and on homes of the introduction of garbage grinders (household waste material only, not waste
material from business offices) were studied by performing an overall evaluation based on LC-CO2 and LCE (life cycle
assessment).
Results 1. Study of technologies to collect and treat organic waste material in sewer systems 1) Garbage disposers have been installed in 44% of American homes and the penetration rate was high on the west coast.
2) In nine countries of Europe including Germany and France, the use of garbage disposers is restricted.
3) The sewer main cleaning rate in the United States is 29%, that is higher than the combined sewer main cleaning rate in
Japan, but the correlation of the garbage grinder penetration rate – sewer main cleaning rate was low.
4) The amount of garbage processed with the garbage grinders was 99g/cap/day, which is about half the amount of garbage
put out per person per day.
5) It is assumed that the introduction of garbage grinders will increase the discharged load from combined sewer systems
during rainfall.
2. Research on the overall evaluation of the environmental impacts of the introduction of garbage grinders 1) Because the introduction of garbage grinders increased the electric power consumed by sewage treatment plants and the
quantity of nitrous oxide discharged during sludge incineration and reduced the quantity of electrical power produced by
waste material in a waste material treatment system, the environmental load increased in terms of CO2.
2) It is estimated that if garbage disposers were installed in 100% of the homes in the town of Utanobori, the cost of sewage
treatment service would increase by ¥200,000/year, but the coast of disposing of waste material would fall by
340,000/year.
10

RESEARCH ON THE STANDARDS OF THE TREATED WASTEWATER REUSE SYSTEM
A. Tajima, K. Sakurai and M. Minamiyama
Wastewater and Sludge Management Division, Water Quality Control Department
Project period: 2001-2005
OBJECTIVES In Japan, since the first reuse of treated wastewater as toilet flushing water was undertaken in 1980 in Fukuoka City in
response to the severe drought in 1978, treated wastewater has been used as toilet flushing water, snow melting water,
environmental water, industrial water, sprinkling water and for a variety of other uses. However, only 200 million m3 per
year of treated wastewater from 246 wastewater treatment plants (WTPs) is being reused outside the plants, which is less
than 2% of the 1.4 billion m3 of effluent from 1,924 plants in FY 2003. It is expected that such applications will increase
in the future from the viewpoint of saving water resources in urban areas, which will in turn increase the importance of
appropriately reusing treated wastewater.
Therefore, care must be taken to maintain the appropriate color, turbidity, odor, and other aesthetic elements of reclaimed
wastewater so that it is not unpleasant for users, and suitable measures taken to prevent corrosion, clogging, and other
problems that impair the functions of the treated wastewater reuse system.
For the above reasons, the Sewerage and Wastewater Management Department of the Ministry of Land, Infrastructure
and Transport and the Water Quality Control Department of the National Institute for Land and Infrastructure
Management decided to revise the water quality standards and the water quality targets stipulated in the previous
guidelines and manuals for the reuse of treated wastewater. And, in order to establish new standards from the viewpoint
of appeal and acceptance, these organizations have carried out the surveys on users’ consciousness to the reuse of treated
wastewater. This report presents the results of the surveys and the results of studies on new standards based on these
surveys.
MATERIALS AND METHODS Table 1 Methods of survey
Category of use Toilet flushing water Landscaping water / Recreational water
Period 2003.12 – 2004.2 2004.7 2003.12 – 2004.1 2004.7
Number of survey location 7 3 4 3
Number of people who
answered
1,124 734 731 482
Measured items of water quality Turbidity, color and odor
It is important to investigate users’ taste for the reclaimed wastewater in order to study the criteria on appeal and acceptance of
the reclaimed wastewater because there is close relationship between the appeal and acceptance of the reclaimed wastewater
and users’ taste. Therefore, in order to study the influence of turbidity, color and odor of the reclaimed wastewater on the users’
taste, the survey on users’ taste for turbidity, color and odor of the reclaimed wastewater was performed at the facilities where
reclaimed wastewater is used. The method of the survey is shown as Table 1 and the questionnaires were handed to the users
11
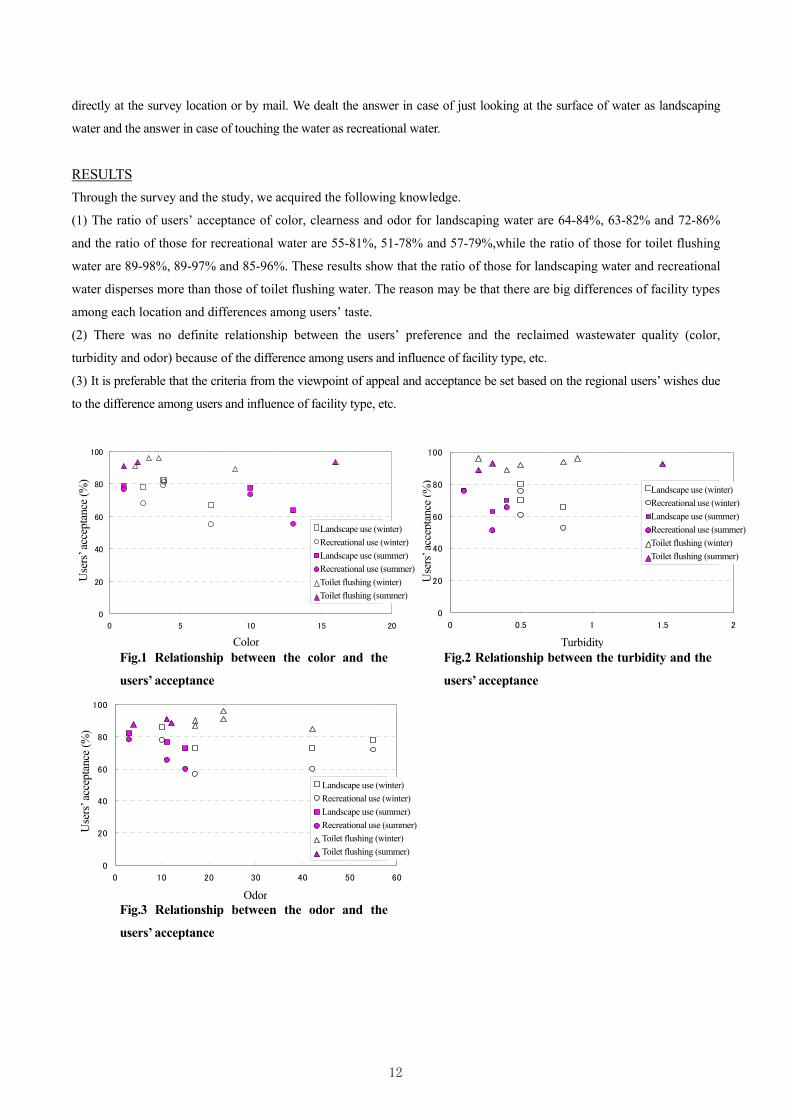
directly at the survey location or by mail. We dealt the answer in case of just looking at the surface of water as landscaping
water and the answer in case of touching the water as recreational water.
RESULTS Through the survey and the study, we acquired the following knowledge.
(1) The ratio of users’ acceptance of color, clearness and odor for landscaping water are 64-84%, 63-82% and 72-86%
and the ratio of those for recreational water are 55-81%, 51-78% and 57-79%,while the ratio of those for toilet flushing
water are 89-98%, 89-97% and 85-96%. These results show that the ratio of those for landscaping water and recreational
water disperses more than those of toilet flushing water. The reason may be that there are big differences of facility types
among each location and differences among users’ taste.
(2) There was no definite relationship between the users’ preference and the reclaimed wastewater quality (color,
turbidity and odor) because of the difference among users and influence of facility type, etc.
(3) It is preferable that the criteria from the viewpoint of appeal and acceptance be set based on the regional users’ wishes due
to the difference among users and influence of facility type, etc.
0
20
40
60
80
100
0 5 10 15 20
色度(度)
容認
度(%
)
修景用水(冬)
親水用水(冬)
修景用水(夏)
親水用水(夏)
水洗用水(冬)
水洗用水(夏)
0
20
40
60
80
100
0 0.5 1 1.5 2
濁度(度)
容認
度(%
)
修景用水(冬)
親水用水(冬)
修景用水(夏)
親水用水(夏)
水洗用水(冬)
水洗用水(夏)
0
20
40
60
80
100
0 10 20 30 40 50 60
臭気強度
容認
度(%
)
修景用水(冬)
親水用水(冬)
修景用水(夏)
親水用水(夏)
水洗用水(冬)
水洗用水(夏)
Fig.2 Relationship between the turbidity and the
users’ acceptance
Fig.3 Relationship between the odor and the
users’ acceptance
Color Turbidity
Odor
Landscape use (winter) Recreational use (winter)Landscape use (summer)Recreational use (summer)Toilet flushing (winter) Toilet flushing (summer)
Landscape use (winter) Recreational use (winter)Landscape use (summer)Recreational use (summer)Toilet flushing (winter) Toilet flushing (summer)
Use
rs’ a
ccep
tanc
e (%
)
Fig.1 Relationship between the color and the
users’ acceptance
Use
rs’ a
ccep
tanc
e (%
)
Use
rs’ a
ccep
tanc
e ( %
)
Landscape use (winter) Recreational use (winter)Landscape use (summer)Recreational use (summer)Toilet flushing (winter) Toilet flushing (summer)
12
APPLICATION OF LCA TO WASTEWATER SYSTEM
M. Minamiyama, Y. Aratani and R. Hiraide
Wastewater and Sludge Management Division
Project period: FY2001-2004
OBJECTIVES Recently, it has become necessary to evaluate the impacts of public works projects on the environment from the
viewpoint of global environmental protection. Life-cycle assessment (LCA) is an effective method for such evaluations.
This research examined the application of LCA to wastewater projects. The environmental load of CO2 emissions
(LC-CO2) and energy consumptions (LCE) were calculated over the four life-cycle stages of a wastewater system:
construction, operation and maintenance, recycling and reuse, and scrapping.
In FY 2004, we analyzed the possibility of simplifying life-cycle inventory (LCI) analysis in the LCA process for
wastewater treatment systems and the effects of updating input-output tables (I-O tables) on the primary unit load and
results of LCI analysis.
METHODS (1) Simplification of LCI analysis for wastewater treatment system
Our previous studies on the characteristics of environmental load of wastewater treatment systems showed that most of
the environmental load derives from electricity consumption of some main equipment during the operation and
maintenance stage in the life-cycle of wastewater treatment systems. In this study, we tried to simplify the LCI analysis
for the oxidation ditch (OD) process. We calculated LC-CO2 and LCE for four wastewater treatment plants treated by the
process and analyzed the relationship between the environmental load and electric power of the equipment used.
(2) Effects of updating I-O tables on primary unit load and results of LCI analysis
The primary unit load for LCI analysis is generally based on the unit load taken from I-O tables in Japan; in our
previous studies, the primary unit load from the 1990 edition of the tables was used. I-O tables are updated every five
years and the 1995 edition is now publicly available. In this study, we analyzed the effects of changing the primary unit
load resulting from the I-O tables being updated from the 1990 edition to the 1995 edition on the results of LCI analysis
for wastewater treatment systems, calculating LC-CO2 and LCE at the operation and maintenance stage for four
wastewater treatment plants which have various types of treatment process and treatment capacities.
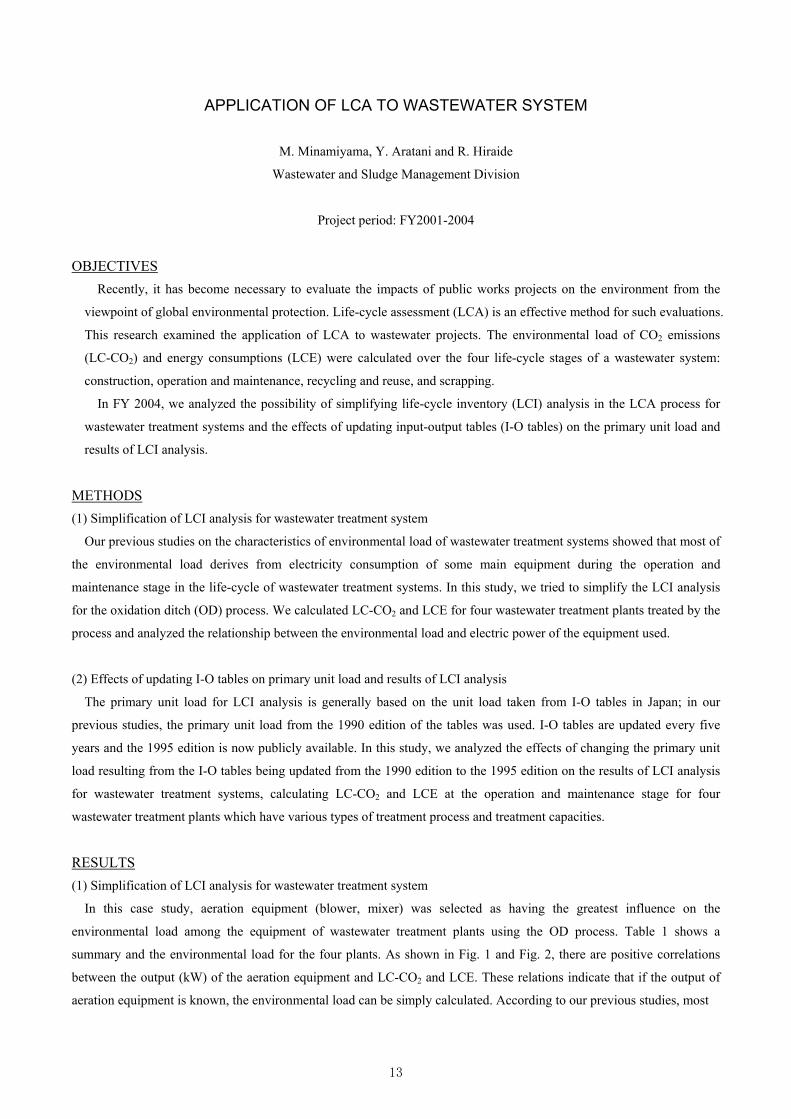
RESULTS (1) Simplification of LCI analysis for wastewater treatment system
In this case study, aeration equipment (blower, mixer) was selected as having the greatest influence on the
environmental load among the equipment of wastewater treatment plants using the OD process. Table 1 shows a
summary and the environmental load for the four plants. As shown in Fig. 1 and Fig. 2, there are positive correlations
between the output (kW) of the aeration equipment and LC-CO2 and LCE. These relations indicate that if the output of
aeration equipment is known, the environmental load can be simply calculated. According to our previous studies, most
13
of the environmental load of other types of treatment process except OD derives from electricity consumption of some
main equipment at the operation and maintenance stage in the life-cycle, too. By capturing the LCI analysis data for other
types of treatment process, it may be possible to clarify the relationship between the main equipment and the
environmental load for each type of treatment process. When it is necessary to evaluate the impacts of the wastewater
treatment process in terms of global environmental protection assuming that the information and data for LCI analysis are
limited as projects are planned and facilities are designed, these relationships could be used to simply calculate the
environmental load.
(2) Effects of update of I-O tables on primary unit load and results of LCI analysis
With the updating of the primary unit load based on I-O tables from the 1990 edition to the 1995 edition, LC-CO2 at
the operation and maintenance stage in the life-cycle for the four treatment plants increased approximately 3–5% and
LCE decreased approximately 5–7%. As a result, LC-CO2 and LCE derived from electricity consumption increased 5.8%
and decreased 6.2%, respectively, so it is inferred that the environmental load derived from the consumption of chemicals
(coagulant, sodium hypochlorite, etc.) and fuel (oil, gas, etc.) had little influence on the total environmental load.
Except for particular plants which use large quantities of chemicals and fuel, it is assumed that the updating of the
primary unit load based on I-O tables from the 1990 edition to the 1995 edition has little influence on the environmental
load for wastewater treatment plant at the operation and maintenance stage in the life-cycle.
This research examined the application of LCA to wastewater systems as a project evaluation method at the planning
and design stage of projects. The results will be used to promote wastewater projects appropriately from the perspective
of global environmental protection.
Fig. 1 Output of aeration and LC-CO2 Fig. 2 Output of aeration and LCE
Table 1 Summary and environmental loads of four wastewater treatment plants
0
200
400
600
800
1,000
0 50 100 150 200 250
Output of aeration(kW)
LC-CO
2(t-CO
2/ye
ar)
0
4,000
8,000
12,000
16,000
20,000
0 50 100 150 200 250
Output of aeration(kW)
LCE(GJ/year)
Treatment plant1) A B C DOutput of aeration2) (kW) 30 194 30 78.4Type of aeration Vertical shaft Horizontal shaft Vertical shaft Diffuser and propeller
LC-CO2 (t-CO2/year) 1.56×10² 8.90×10² 1.54×10² 5.14×10²
LCE (GJ/year) 3.04×10³ 1.80×10⁴ 3.11×10³ 9.46×10³
1) Oxidation ditch process2) Data in FY 2002
14
EVALUATION METHOD FOR ADVANCED WASTEWATER TREATMENT SYSTEMS
M. Minamiyama, Y. Aratani, H. Yamagata Wastewater and Sludge Management Division
Project period: 2002-2004
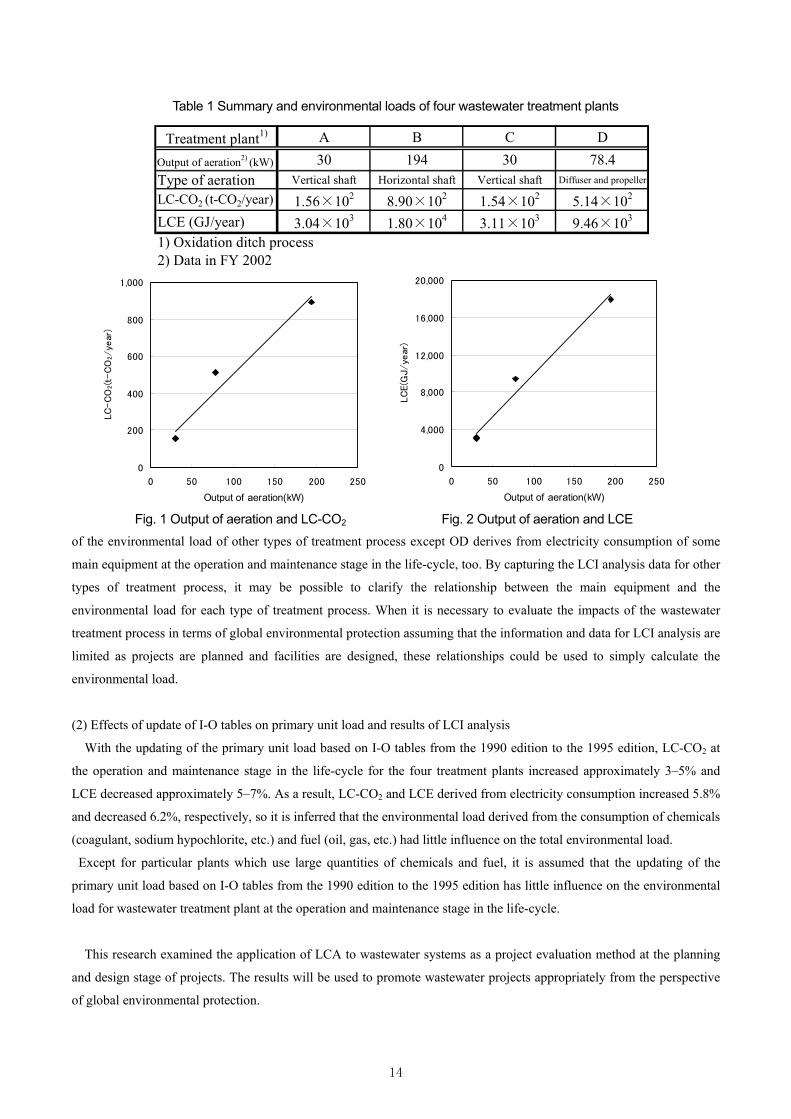
Objective The water quality in enclosed water bodies must be improved, and advanced wastewater treatment is one effective means. Part of the cost for advanced treatment is to be collected from sewerage fees in accordance with the polluter-pays principle. Thus, ways of explaining to people the need for advanced treatment through discussions based on scientific information including the cost and benefit of advanced treatment, are required. Therefore, in cooperation with an NPO that is involved in preserving the water of Lake Biwa and sewerage systems, we developed a method of evaluating advanced treatment from the view of people . Method and Results In this study, we developed a method for obtaining an understanding of advanced wastewater treatment by increasing the knowledge of people concerning the water environment using newsletters and questionnaires (Figure.1) .
Expert information
Newsletter 1
Newsletter 2
1st questionnaire
2nd questionnaire
3rd questionnaire
conveying the needs
conveying the needs
conveying expert information
conveying expert information
evaluation and identification of needs
evaluation and identification of needs
providing information 1
providing information 2
Comparison
Comparison
≪Administration ≫ ≪NPO≫ ≪People≫
Figure 1 Survey of change in people awareness by providing information in collaboration with NPO
15
The results were as follows. (1) To increase the knowledge of people concerning the water environment, we developed the new process that an NPO as a neutral position between the administration and people, identified the information needed by people, obtained expert information from the administration, and conveyed it to the people in a simple newsletter. (2) Conveying information to the people twice by newsletters has increased their knowledge concerning water environment problems and measures. For example, the number of people who understand that agriculture wastewater and road wastewater other than domestic wastewater are sources of pollution of Lake Biwa has increased; the number of people who are aware of the dioxin and endocrine disrupter other than the red tide as an environmental problem of Lake Biwa has increased; the number of people who understand the need to adopt the advanced wastewater treatment and urban rain wastewater treatment to protect the environment of Lake Biwa has increased; and the number of people who recognize various effects such as further removal of nitrogen/phosphor and removal of trihalomethane formation potential and endocrine disrupters by adopting ultra-advanced wastewater treatment has increased. (3) After information was provided for the first time, the number of people willing to pay for the preservation of the water environment of Lake Biwa increased. The willingness to pay for ultra-advanced wastewater treatment was 189 yen per month/household, which was relatively higher than its maintenance expenses of about 160 yen per month/household.. However, 30% of people were not willing to pay anything, so there is a need to reduce this ratio.
16
RESEARCH ON THE STANDARDS FOR HYGEINIC SADETY OF THE TREATED WASTEWATER
A. Tajima, K. Sakurai and M. Minamiyama
Wastewater and Sludge Management Division, Water Quality Control Department
Project period: 2001-2005
OBJECTIVES It is expected that reuse of treated wastewater will increase in the future from the viewpoint of saving water resources in
urban areas, which will in turn increase the importance of appropriately reusing treated wastewater.
On the other hand, the health risk posed by Cryptosporidium and other pathogenic microbes through drinking water and
food has become a severe social problem in recent years, raising concerns over the safety of water. It is, therefore,
necessary that the reuse of treated wastewater employ countermeasures against these new problems from now on.
For the above reasons, the Sewerage and Wastewater Management Department of the Ministry of Land, Infrastructure
and Transport and the Water Quality Control Department of the National Institute for Land and Infrastructure
Management decided to revise the water quality standards and the water quality targets stipulated in the previous
guidelines and manuals for the reuse of treated wastewater. And, in order to establish new standards from the perspective
of guaranteeing hygienic safety, these organizations have carried out fact-finding surveys on bacteria and protozoa in the
reuse of treated wastewater. This report presents the results of the fact-finding surveys and the results of studies on new
standards based on these surveys.
MATERIALS AND METHODS (1) In order to study standards for
bacteria in the reuse of treated
wastewater, the pathogenic microbes
and related indices shown in Table 1
were measured throughout a one-year
period in the treated wastewater reuse
systems that use the five reclamation
treatment processes at four WTPs in
Japan.
The measured pathogenic bacteria were Salmonella and Campylobacter that are major causes of food poisoning in Japan,
EHEC O-157 that caused a severe outbreak of group infections in Japan, and Legionella that can propagate in the
reclaimed water supply process.
Samples were obtained at three locations – water overflowing from the final settling tank, immediately after the
reclamation treatment process, and in the tank receiving supplied water.
(2) In order to study standards for protozoa in the reuse of treated wastewater, sand-filtered water from two WTPs in
Japan were surveyed for Cryptosporidium every month for two years and then evaluated the risk of Cryptosporidium in
the reuse of treated wastewater based on the results of the survey to study treatment standards capable of ensuring an
Category Items analyzed
General items pH, water temperature, turbidity, SS, residual
chlorine (free, combined)
Total coliforms
E. coli
Index
Heterotrophic plate counts (HPC)*
Legionella
Bacteria
Pathogenic
bacteria Salmonella, Campylobacter, EHEC O-157
17
appropriate risk level.
RESULTS (1) There were cases where total coliforms propagated in the supply tank, but there were almost no cases where E. coli
propagated in the supply tank. Because it is assumed that when a certain period of time has passed after reclamation
treatment, it is considered inappropriate to use bacteria that have propagated in the water environment as index bacteria,
suggesting that E. coli would be more appropriate than total coliforms as the index bacteria in the reuse of treated
wastewater.
(2) The fact that it is possible to lower HPC to a specified level by maintaining the combined residual chlorine
concentration at 0.3 mg/L or more suggests that a standard value of 0.3 mg/L or more is necessary for the combined
residual chlorine concentration. On the other hand, target pathogenic bacteria were not detected in any samples.
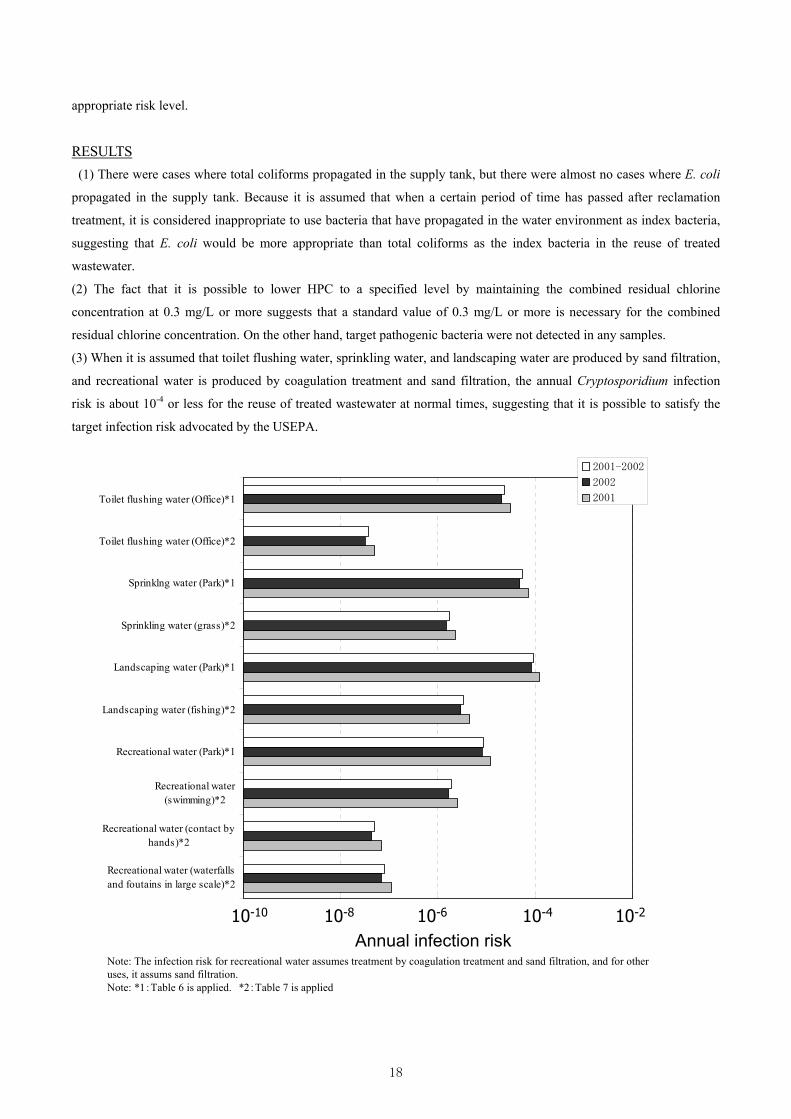
(3) When it is assumed that toilet flushing water, sprinkling water, and landscaping water are produced by sand filtration,
and recreational water is produced by coagulation treatment and sand filtration, the annual Cryptosporidium infection
risk is about 10-4 or less for the reuse of treated wastewater at normal times, suggesting that it is possible to satisfy the
target infection risk advocated by the USEPA.
1.0E-10 1.0E-08 1.0E-06 1.0E-04 1.0E-02
Recreational water (waterfallsand foutains in large scale)*2
Recreational water (contact byhands)*2
Recreational water(swimming)*2
Recreational water (Park)*1
Landscaping water (fishing)*2
Landscaping water (Park)*1
Sprinkling water (grass)*2
Sprinklng water (Park)*1
Toilet flushing water (Office)*2
Toilet flushing water (Office)*1
年間感染リスク
2001-2002
2002
2001
Note: The infection risk for recreational water assumes treatment by coagulation treatment and sand filtration, and for other uses, it assums sand filtration.Note: *1:Table 6 is applied. *2:Table 7 is applied
10-10 10-8 10-6 10-4 10-2
Annual infection risk1.0E-10 1.0E-08 1.0E-06 1.0E-04 1.0E-02
Recreational water (waterfallsand foutains in large scale)*2
Recreational water (contact byhands)*2
Recreational water(swimming)*2
Recreational water (Park)*1
Landscaping water (fishing)*2
Landscaping water (Park)*1
Sprinkling water (grass)*2
Sprinklng water (Park)*1
Toilet flushing water (Office)*2
Toilet flushing water (Office)*1
年間感染リスク
2001-2002
2002
2001
Note: The infection risk for recreational water assumes treatment by coagulation treatment and sand filtration, and for other uses, it assums sand filtration.Note: *1:Table 6 is applied. *2:Table 7 is applied
10-10 10-8 10-6 10-4 10-2
Annual infection risk
18
FATE OF SANITARY INDICATORS IN TREATED WASTEWATER
Mizuhiko Minamiyama, Ryosuke Hiraide, Kensuke Sakurai
Wastewater and Sludge Management Division
Project period: 2002-2004
OBJECTIVES The spread of wastewater treatment systems has raised the quantities of treated wastewater discharged by wastewater treatment
plants, increasing the percentage of treated wastewater in river water. And the treated wastewater is reused in a variety of ways in
urban regions. This means an increase in opportunities for people to come into direct contact with treated wastewater.
However, treated wastewater contains a variety of pathogenic microorganisms produced by human activities. Traditionally, total
coliforms have been used to indicate the existence of pathogenic microorganisms, but they are not adequately reliable as an index.
In order to appropriately maintain the hygienic safety of treated wastewater and environmental water, the properties of various
kinds of indicator microorganisms should be clarified to select an index appropriate to each purpose. This study was a survey
conducted to compare the behavior of total coliforms that have been used in the past, E.coli, faecal streptococcus, and
C.Perfringens spores in receiving waters to clarify the properties of indicator microorganisms.
METHOD and RESULTS From FY2002 to FY2004, research was carried out in order to clarify the behavior of various kinds of indicator microorganisms
after the discharge of treated wastewater. The results have revealed that total coliforms that have been used as an index of faecal
pollution in the past do play a certain role as an index that clarifies disinfection effects on treated wastewater. However, under
conditions such as its use as an index of hygienic safety after a certain degree of time has passed since it is discharged, when
treated wastewater is reused for example, there are cases where it cannot necessarily be described as a an appropriate index
because total coliforms increases during a short period of time, even in the same water. There are cases where it would be better
to use E.coli that measured by a specific enzyme substrate culture that did not increase or decrease very much even after chlorine
disinfection during this testing as the index. It would be difficult to use faecal streptococcus that has a low absolute count as an
indicator microorganism. It can be concluded that C.Perfringens spores show strong chlorine resistance, because their count did
not change even when the degree of chlorine disinfection was varied, so they can be used as an indicator of pathogenic
microorganisms that are chlorine resistant. But, the fact that C.Perfringens spores appeared to have stronger settleability than
E.coli etc., has suggested that it would be difficult to make a judgment that there are no pollutants by pathogenic microorganisms
simply because C.Perfringens spores are not detected.
19
EFFICIENT REMOVAL OF SLIGHT HAZARDOUS MATERIALS BY OZONATION
T. Hirayama and M. Minamiyama
Wastewater and Sludge Management Division, Water Quality Control Department
Project period: 2002-2004
OBJECTIVES The problems of the slight hazardous materials represented by the endocrine disruptors are getting more serious year by year.
These materials may have a bad influence on natural environment, ecosystem and human health even if these are slightly
contained. Endocrine disruptor is said to decrease sharply in process of wastewater treatment by some researches, but the
influence which endocrine disruptor have on ecosystem is unknown and it may be needed to decrease more on the basis of the
influence. The objectives of this research is to establish the way of efficient removal of slight hazardous materials by
ozonation.
RESULTS We decided nonylphenol (below written, “NP”), bisphenol-A (below written, “BPA”), 17β-estradiol (below written, “E2”)
and estorone (below written, “E1”) as the target substances. In order to clarify ozonation operating conditions that effectively
remove the target substances from treated wastewater, and influences that the treated wastewater qualities have on removing
the target substances by ozonation, pilot plant experiments were carried out. The results are as follows.
(1) When the ozone contact times were from 3 to 15min and the reactor height is 1.6m or 4.1m, BPA was reduced to below
the detection limit at an ozone injection rate of 5mg-O3/L, NP and E2 were reduced to below the detection limit at ozone
injection rates of 3mg-O3/L or higher, E1 was reduced to below the quantitative limit at an ozone injection rate of
5mg-O3/L.
(2) When an ozone injection rate was 1.5mg-O3/L, there were several cases where NP, BPA and E2 were not reduced to
below the detection limit, E1 was not reduced to below the quantitative limit. There was no correlation between the ozone
contact times and the removal rates of the target substances at an ozone injection rate of 1.5mg-O3/L, when the ozone
contact times were from 3 to 15min.
(3) When an ozone injection rate was 1.5mg-O3/L and E260(the absorbance of ultraviolet rays of 260nm-wavelength), which
is the index of organic materials which have unsaturated combinations, was less than 0.09, NP, BPA and E2 were reduced
to below the detection limit, E1 was reduced to below the quantitative limit. It is expected that E260 could be used as the
index of materials which are more easily oxidized by ozonation than the target substances, and that we could find an
effective ozone injection rate by using E260.
20

Study on Wastewater Reclamation System for the River Ecosystem
M. Minamiyama, Y. Aratani and R. Hiraide
Wastewater and Sludge Management Division
Project period: FY2001-2005
OBJECTIVES
As the amount of treated wastewater is increasing in response to the coverage of sewerage systems, there is a growing
tendency to utilize treated wastewater to create water environments. Treated wastewater is sometimes extensively utilized to
create streams and other water environments in urban areas that have disappeared due to urbanization. Streams and other water
environments are valuable spaces not only for human lives but also as habitats for all kinds of aquatic lives. However, the
relationship between aquatic lives that inhabit these water environments and the quality of treated wastewater is not clearly
understood. Because treated wastewater is a valuable water resource, it is important to evaluate wastewater treatment systems
from the perspective of habitat environments in the receiving water bodies of treated wastewater. Tadotsu town in Kagawa
prefecture tries to utilize treated wastewater as reclaimed wastewater in an artificial stream as a receiving water body. This
stream was first operated using drinking water, but now reclaimed wastewater is used. This study was carried out to clarify the
effects of the water qualities of reclaimed wastewater and drinking water such as nutrients on periphytic algae grown in the
artificial stream in the town.
METHOD
In the artificial stream in Tadotsu town, Kagawa prefecture, two types of field survey were carried out, one for the effects of
drinking water and the other for the effects of reclaimed wastewater on aquatic life. The surveys for drinking water were
carried out two times from January and March 2004, and for reclaimed wastewater two times from September and
November 2004 and from January and March 2005. To compare the effects of the two types of water, periphytic algae and
water qualities were analyzed. Unglazed ceramic plates were installed in the upper reaches to analyze periphytic algae, and
the biomass (cell count), the community composition and the diversity of periphytic algae were analyzed.
RESULTS (1) Biomass
The concentration of nitrogen of reclaimed wastewater was ten times as high as that of drinking water. On the other hand,
the concentration of phosphorus of reclaimed wastewater and drinking water was the same level. It is supposed that there were
no differences between the biomass for drinking water and reclaimed wastewater because of the same concentration level of
phosphorus.
(2) Community composition
In the survey of reclaimed wastewater from September and November 2004, Homoeothrix janthina of Cyanophyceae was
dominant, which is a representative species in relatively clean rivers in Japan.
Bacillariophyceae and Cyanophyceae were dominant and there were no differences between drinking water and reclaimed
wastewater in the number of cells by taxonomic class in the same survey period from January and March.
(3) Diversity
The number of species was at the same level between the survey of drinking water and that of reclaimed wastewater.
21
RESEARCH ON THE RISK ASSESSMENT OF CHEMICAL SUBSTANCES IN A WATER ENVIRONMENT
M. Takahashi, T. Shimizu, M. Minamiyama, H. Yamagata
Wastewater and Sludge Management Division
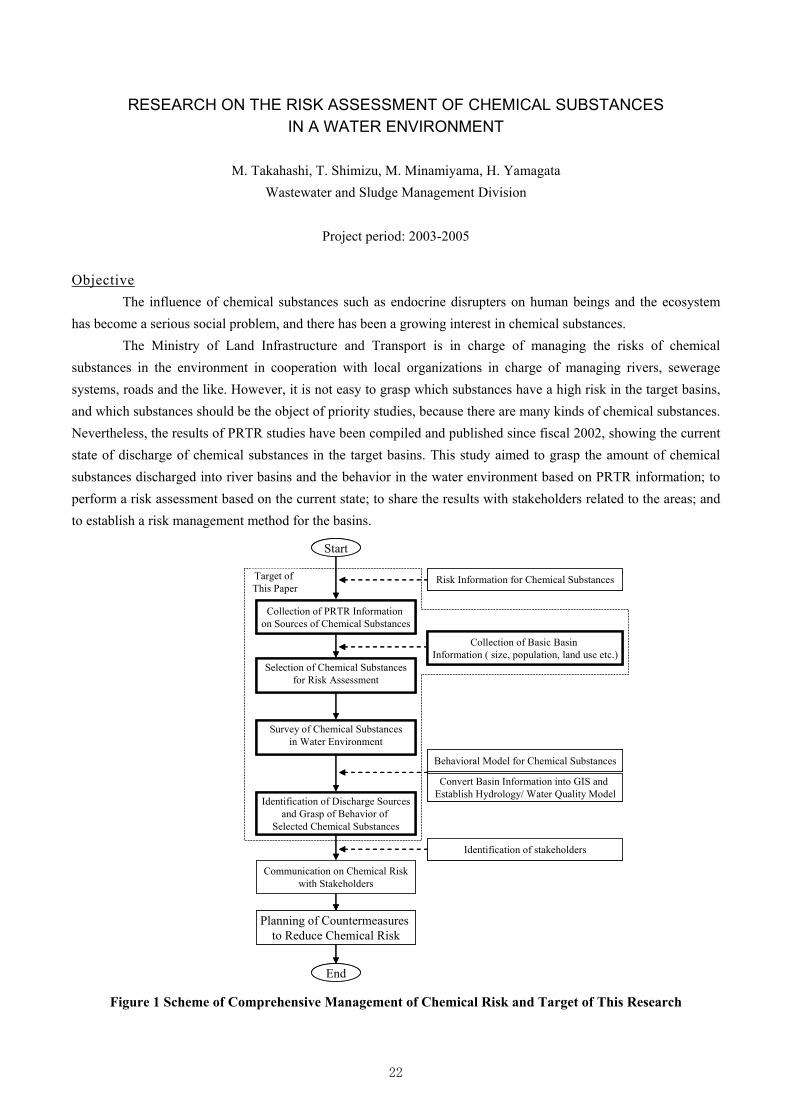
Project period: 2003-2005 Objective The influence of chemical substances such as endocrine disrupters on human beings and the ecosystem has become a serious social problem, and there has been a growing interest in chemical substances. The Ministry of Land Infrastructure and Transport is in charge of managing the risks of chemical substances in the environment in cooperation with local organizations in charge of managing rivers, sewerage systems, roads and the like. However, it is not easy to grasp which substances have a high risk in the target basins, and which substances should be the object of priority studies, because there are many kinds of chemical substances. Nevertheless, the results of PRTR studies have been compiled and published since fiscal 2002, showing the current state of discharge of chemical substances in the target basins. This study aimed to grasp the amount of chemical substances discharged into river basins and the behavior in the water environment based on PRTR information; to perform a risk assessment based on the current state; to share the results with stakeholders related to the areas; and to establish a risk management method for the basins.
Figure 1 Scheme of Comprehensive Management of Chemical Risk and Target of This Research
Start
Selection of Chemical Substancesfor Risk Assessment
Collection of PRTR Information on Sources of Chemical Substances
Survey of Chemical Substancesin Water Environment
Identification of Discharge Sourcesand Grasp of Behavior of
Selected Chemical Substances
Communication on Chemical Riskwith Stakeholders
Planning of Countermeasures to Reduce Chemical Risk
Collection of Basic Basin Information ( size, population, land use etc.)
Risk Information for Chemical Substances
Behavioral Model for Chemical Substances
Identification of stakeholders
Convert Basin Information into GIS and Establish Hydrology/ Water Quality Model
End
Target of This Paper
22
Method and Results In fiscal 2004 the study covered the following. 1) Regarding the target chemical substances (zinc, lead, arsenic, manganese, nickel, copper, chrome, fluorine,
boron, polyoxyethylene nonionic surface-active agents, 17 β -estradiol, estrone, nonylphenol, nonylphenolethoxylate, nonyl phenoxyacetic acid) which were detected in the model rivers in fiscal 2003, the concentration in the rivers including water, suspended substances, and bottom sediments was surveyed, and the concentration was evaluated in terms of human health and protection of aquatic ecosystem based on domestic and overseas information. In the model rivers, zinc was identified as being a priority for risk management in order to protect aquatic ecosystem.
2) Based on research on the status of the target chemical substances in the influent and effluent of sewerage treatment plants in the model area in order to identify the discharge sources of the detected target chemical substances, the contribution in the sewerage effluent water of estrone and boron was higher than that of CODcr and SS, but the contribution with respect to the other chemical substances was low. Nonylphenol ethoxylate, nonylphenol, and polyoxyethylene nonionic surface-active agents were effectively removed by the sewerage treatment plants.
3) The businesses which must report their discharge amount of target chemical substances by PRTR law (so called “designated businesses”) in the basins of the model river were grasped, and the contributions of the loads of target chemical substances in the model rivers were evaluated. The results suggested that it is difficult to evaluate the concentrations of target chemical substances in rivers receiving effluent when using only the annual loads reported from the designated businesses. This could be because the concentration of the target chemical substances in the effluent water from the designated businesses has a large daily and seasonal variation in accordance with the operational situation, etc.; that the flow of the river has daily and seasonal variations; and that there is a contribution from the businesses which do not have to report their discharge amount of target chemical substances and other discharge sources such as domestic wastewater, agricultural wastewater, etc.
23
Sustainable water policy scenarios for river basins with rapidly in creasing population - Countermeasure strategy to global hydrological variation in monsoon Asia -
EVALUATION OF WATER QUALITY SECURITY MEASURES IN THE GANGES RIVER BASIN
M. Minamiyama, R. Hiraide, K. Sakurai
Wastewater and Sludge Management Division
Project period: FY2003-2008
OBJECTIVES
In Asia and other regions, rapid population growth, urban development, and industrialization have
exacerbated water problems, and human activities have caused fluctuation of water cycles and other problems.
The goal of this research is to help resolve these problems by presenting policy scenarios for nine typical Asian
river systems. This research is done as team research (CREST type) led by research representative Professor
Sunada of the University of Yamanashi, because the area studied is vast and faces many challenges. The
Wastewater and Sludge Management Division of the NILIM is in charge of the presentation of policy scenarios
with priority on water problems in the Ganges river basin.
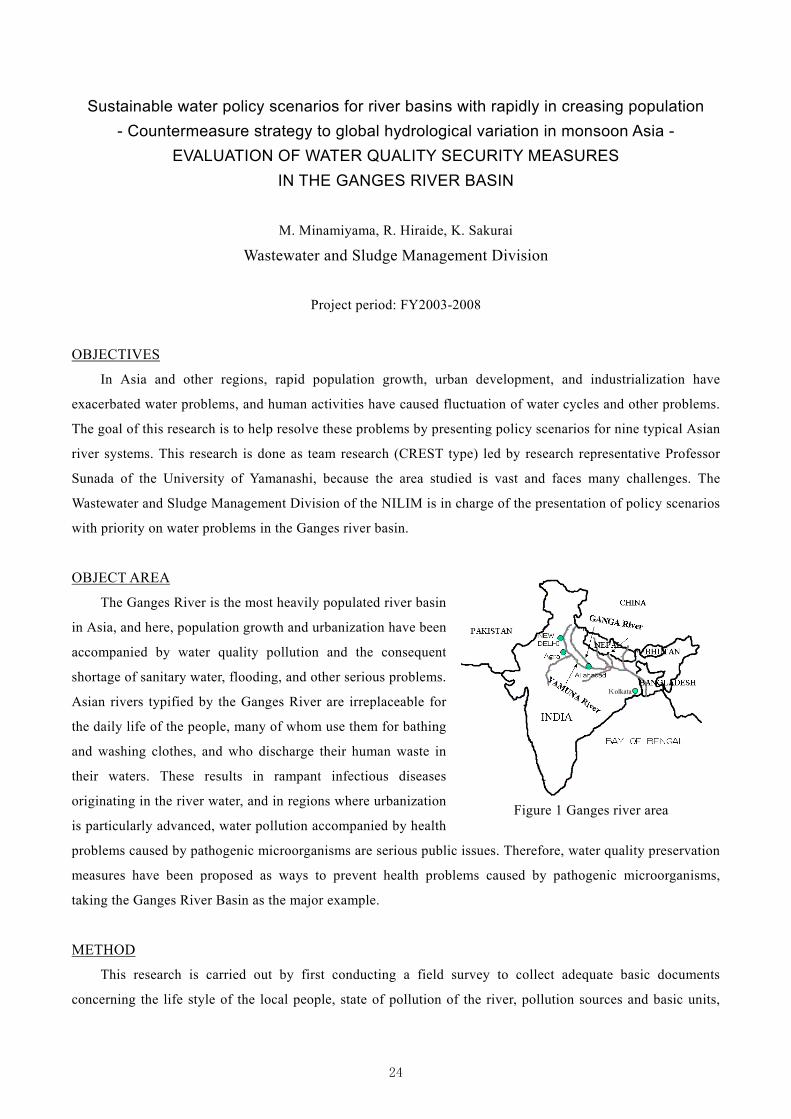
OBJECT AREA
The Ganges River is the most heavily populated river basin
in Asia, and here, population growth and urbanization have been
accompanied by water quality pollution and the consequent
shortage of sanitary water, flooding, and other serious problems.
Asian rivers typified by the Ganges River are irreplaceable for
the daily life of the people, many of whom use them for bathing
and washing clothes, and who discharge their human waste in
their waters. These results in rampant infectious diseases
originating in the river water, and in regions where urbanization
is particularly advanced, water pollution accompanied by health
problems caused by pathogenic microorganisms are serious public issues. Therefore, water quality preservation
measures have been proposed as ways to prevent health problems caused by pathogenic microorganisms,
taking the Ganges River Basin as the major example.
METHOD
This research is carried out by first conducting a field survey to collect adequate basic documents
concerning the life style of the local people, state of pollution of the river, pollution sources and basic units,
Kolkata
Figure 1 Ganges river area
24
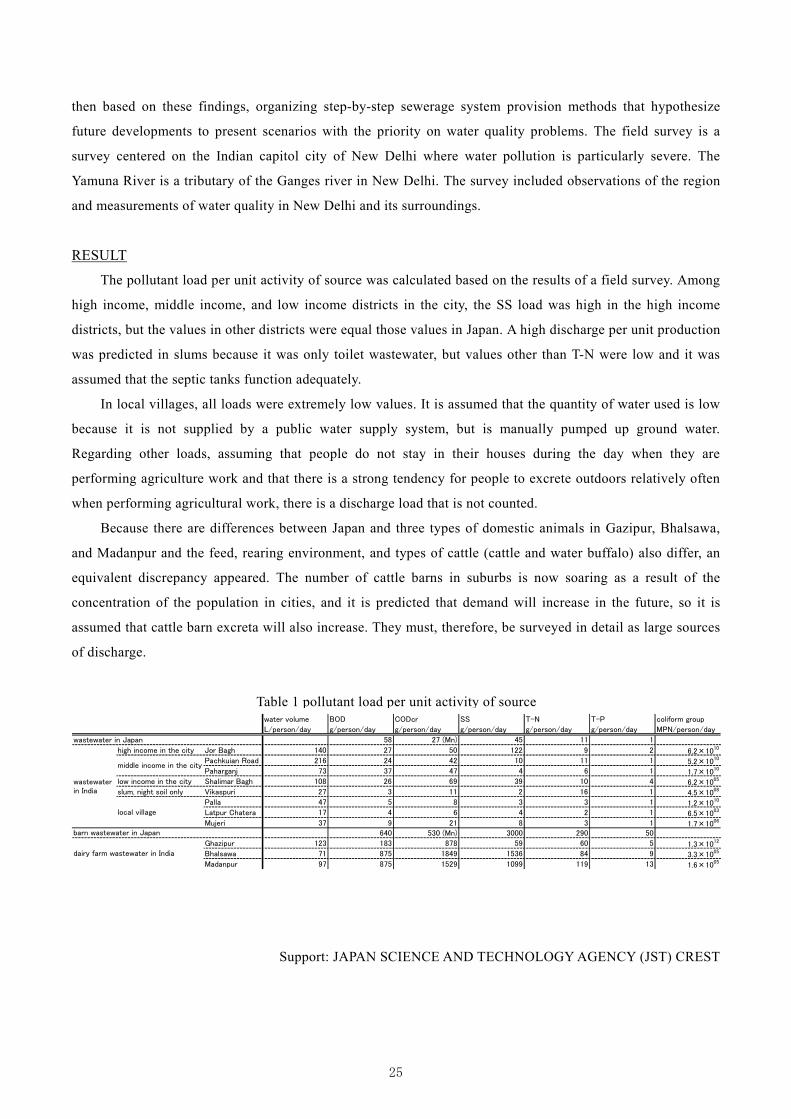
then based on these findings, organizing step-by-step sewerage system provision methods that hypothesize
future developments to present scenarios with the priority on water quality problems. The field survey is a
survey centered on the Indian capitol city of New Delhi where water pollution is particularly severe. The
Yamuna River is a tributary of the Ganges river in New Delhi. The survey included observations of the region
and measurements of water quality in New Delhi and its surroundings.
RESULT
The pollutant load per unit activity of source was calculated based on the results of a field survey. Among
high income, middle income, and low income districts in the city, the SS load was high in the high income
districts, but the values in other districts were equal those values in Japan. A high discharge per unit production
was predicted in slums because it was only toilet wastewater, but values other than T-N were low and it was
assumed that the septic tanks function adequately.
In local villages, all loads were extremely low values. It is assumed that the quantity of water used is low
because it is not supplied by a public water supply system, but is manually pumped up ground water.
Regarding other loads, assuming that people do not stay in their houses during the day when they are
performing agriculture work and that there is a strong tendency for people to excrete outdoors relatively often
when performing agricultural work, there is a discharge load that is not counted.
Because there are differences between Japan and three types of domestic animals in Gazipur, Bhalsawa,
and Madanpur and the feed, rearing environment, and types of cattle (cattle and water buffalo) also differ, an
equivalent discrepancy appeared. The number of cattle barns in suburbs is now soaring as a result of the
concentration of the population in cities, and it is predicted that demand will increase in the future, so it is
assumed that cattle barn excreta will also increase. They must, therefore, be surveyed in detail as large sources
of discharge.
Support: JAPAN SCIENCE AND TECHNOLOGY AGENCY (JST) CREST
Table 1 pollutant load per unit activity of sourcewater volume BOD CODcr SS T-N T-P coliform group
L/person/day g/person/day g/person/day g/person/day g/person/day g/person/day MPN/person/day
58 27 (Mn) 45 11 1
high income in the city Jor Bagh 140 27 50 122 9 2 6.2×10¹⁰
Pachkuian Road 216 24 42 10 11 1 5.2×10¹⁰
Paharganj 73 37 47 4 6 1 1.7×10¹⁰
low income in the city Shalimar Bagh 108 26 69 39 10 4 6.2×1005
slum, night soil only Vikaspuri 27 3 11 2 16 1 4.5×1008
Palla 47 5 8 3 3 1 1.2×10¹⁰
Latpur Chatera 17 4 6 4 2 1 6.5×1003
Mujeri 37 9 21 8 3 1 1.7×1006
640 530 (Mn) 3000 290 50
Ghazipur 123 183 878 59 60 5 1.3×10¹²
Bhalsawa 71 875 1849 1536 84 9 3.3×1005
Madanpur 97 875 1529 1099 119 13 1.6×1005
wastewaterin India
dairy farm wastewater in India
middle income in the city
local village
wastewater in Japan
barn wastewater in Japan
25
RESEARCH ON THE INFLUENCE OF SOIL AND GROUNDWATER CONTAMINATION TO SURFACE WATER
M.Minamiyama, H. Yamagata
Wastewater and Sludge Management Division
Project period: 2004-2005 Objective
Groundwater contamination by volatile organic compounds (VOC), heavy metals, nitrate nitrogen, etc. has become a problem. In fiscal 2002, the Soil Contamination Countermeasures Law came into force. However, the influence of chemical substances from ground water to surface water remain unclear.
Therefore, this study selected chemical substances to be surveyed from the view of the influence from ground water to surface water, and then surveyed the behavior of these chemical substances in ground water. Method and Results 1) Selection of substances to be surveyed
Chemical substances that could affect water bodies via ground water were selected to be surveyed in this study from the following points of view. (1) Chemical substances designated in the Soil Contamination Countermeasures Law In the Soil Contamination Countermeasures Law, the elution amount standard is provided for class-1 specified
harmful substances (VOC 11 substances), class-2 specified harmful substance (nine substances such as heavy metals), and class-3 specified harmful substances (five substances such as agricultural chemicals) in accordance with the Environmental Quality Standard Items relating to soil contamination, in terms of their influence on human health through ingestion in contaminated ground water, etc. These substances were selected as survey targets.
(2) Nitrate nitrogen and ammonia nitrogen Nitrate nitrogen and ammonia nitrogen were specified to be Environmental Quality Standard Items relating to
water contamination of ground water in 1998 due to their influence on human health. In this study, nitrate nitrogen is included as a survey target. Ammonia nitride, which is contained in waste from humans and animals, was included as a survey target because it is nitrified.
(3) Environmental Quality Standard Substances concerning preservation of aquatic organisms Total zinc was specified as an Environmental Quality Standard Item concerning preservation of aquatic ecosystem in 2003. Total zinc was included as a survey target because it contaminates water bodies from ground water.
(4) Higher-ranked substances in the PRTR which are discharged in large quantities to soil or disposed of in landfills on business
According to the PRTR, the substance that was discharged into the soil on business premises in the largest amounts was ethylene glycol, so ethylene glycol was included as a survey target.
(5) Others Among the six substances which were specified as targets of the Environmental Survey for Exposure Study in fiscal 2002 by the Ministry of the Environment, perfluoro octane sulfuric acid (PFOS), has extremely high repeated-dose toxicity, and is considered to have high acute toxicity to aquatic organisms, so PFOS was included as a survey target.
Hydrazine and polyoxyethylene alkyl ether (C=12–15) and D-D (1,3 dichloropropene) were included as survey targets, because the amounts used and discharged are estimated to be comparatively large based on surveys held by Graduate School of Yokohama National University.
26
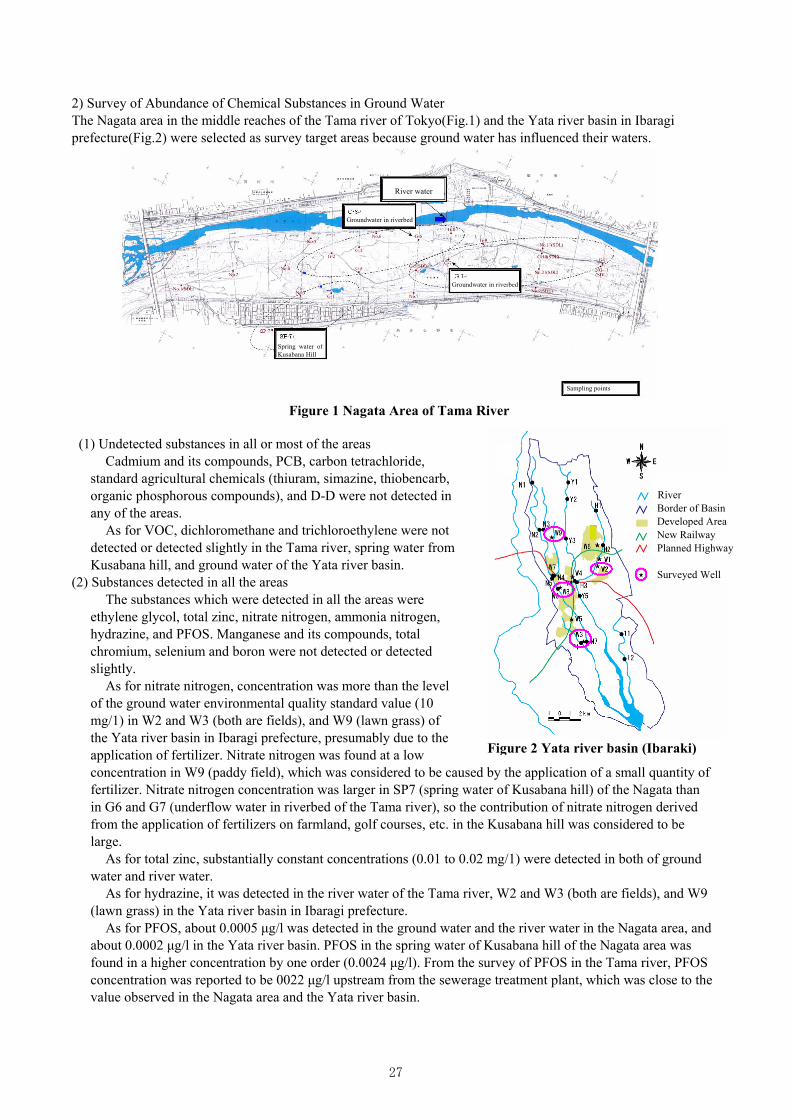
2) Survey of Abundance of Chemical Substances in Ground Water The Nagata area in the middle reaches of the Tama river of Tokyo(Fig.1) and the Yata river basin in Ibaragi prefecture(Fig.2) were selected as survey target areas because ground water has influenced their waters.
Figure 1 Nagata Area of Tama River
(1) Undetected substances in all or most of the areas Cadmium and its compounds, PCB, carbon tetrachloride,
standard agricultural chemicals (thiuram, simazine, thiobencarb, organic phosphorous compounds), and D-D were not detected in any of the areas.
As for VOC, dichloromethane and trichloroethylene were not detected or detected slightly in the Tama river, spring water from Kusabana hill, and ground water of the Yata river basin.
(2) Substances detected in all the areas The substances which were detected in all the areas were
ethylene glycol, total zinc, nitrate nitrogen, ammonia nitrogen, hydrazine, and PFOS. Manganese and its compounds, total chromium, selenium and boron were not detected or detected slightly.
As for nitrate nitrogen, concentration was more than the level of the ground water environmental quality standard value (10 mg/1) in W2 and W3 (both are fields), and W9 (lawn grass) of the Yata river basin in Ibaragi prefecture, presumably due to the application of fertilizer. Nitrate nitrogen was found at a low concentration in W9 (paddy field), which was considered to be caused by the application of a small quantity of fertilizer. Nitrate nitrogen concentration was larger in SP7 (spring water of Kusabana hill) of the Nagata than in G6 and G7 (underflow water in riverbed of the Tama river), so the contribution of nitrate nitrogen derived from the application of fertilizers on farmland, golf courses, etc. in the Kusabana hill was considered to be large.
As for total zinc, substantially constant concentrations (0.01 to 0.02 mg/1) were detected in both of ground water and river water.
As for hydrazine, it was detected in the river water of the Tama river, W2 and W3 (both are fields), and W9 (lawn grass) in the Yata river basin in Ibaragi prefecture.
As for PFOS, about 0.0005 μg/l was detected in the ground water and the river water in the Nagata area, and about 0.0002 μg/l in the Yata river basin. PFOS in the spring water of Kusabana hill of the Nagata area was found in a higher concentration by one order (0.0024 μg/l). From the survey of PFOS in the Tama river, PFOS concentration was reported to be 0022 μg/l upstream from the sewerage treatment plant, which was close to the value observed in the Nagata area and the Yata river basin.
Figure 2 Yata river basin (Ibaraki)
River Border of BasinDeveloped AreaNew Railway Planned Highway Surveyed Well
River water
Groundwater in riverbed
Groundwater in riverbed
Spring water ofKusabana Hill
Sampling points
27

Fate of Endocrine Disruptors in Sewage Sludge
Masaaki OZAKI, Hiromasa YAMASHITA and Syuuichi Ochi Recycling Team, Material and Geotechnical Engineering Research Group
Public Works Research Institute
Project period: 2002-2005 OBJECTIVES Recycling of sewage sludge has been increasing in Japan. In FY2002 the total amount of sewage sludge generated was 2,105 kt of dry solids (DS) and around 14% of this amount (293 kt-DS) was recycled for agricultural use. On the other hand, there is a growing concern that hazardous organic compounds may be present in sewage sludge. Nonylphenolic compounds (NPCs) and estrogens are important groups of such compounds because of their endocrine-disrupting activities. Nonylphenols (NPs) and nonylphenol n ethoxylates (NPnEOs, n = 1 – 15) of shorter ethoxylate chain are hydrophobic and tend to be adsorbed by the sludge, hence land application of this sludge compost may contaminate soil and water environments. This study proposes an extraction method for analyzing endocrine disruptors in sewage sludge, and reveals the fate of endocrine disruptors in the land application of sewage sludge compost. The study also reveals the relationship between the fate of endocrine disruptors in the sewage sludge treatment process and the operating conditions. RESULTS In FY2004, we developed a method of measuring NPs, NPnEOs and NPnECs by LC/MS/MS (Liquid Chromatograph / Mass Spectrometry / Mass Spectrometry). We also conducted a laboratory experiment to study the fate of NPs in the sewage sludge composting process and a survey on the occurrence of NPCs in sewage sludge compost in an actual sewage treatment plant. The research results were as follows. 1. Development of method of measuring NPs, NPnEOs and NPnECs by LC/MS/MS Quantitative analysis of NPnECs in sewage sludge by HPLC was difficult and thus LC/MS/MS analysis was required. NPs and NPnEOs themselves could be measured by HPLC easily, but various other substances contained in sludge often made it difficult to clearly separate their peaks. Therefore we developed a method of measuring NPs, NPnEOs and NPnECs by LC/MS/MS. The flowchart in Fig. 1 shows the basic procedure of measurement.
Taitech, Vacuum freeze dryer VD-600™
Japan Dionex, HPSE system ASE-200™ Varian Inc., Hydromatrix™2000psi, 100°C, Extraction period: 5 min×2 (methanol extraction)
Tokyo Rika Kikai, Rotary vacuum evaporator N-N™
Waters, Sep-Pak Plus Silica™ GL science, Graphite carbon cartridge™load by hexane : chloroform (80:20) load by 1 NHCl-Water, wash by acetonitrile : water (6:4)take chloroform extraction and hexane : chloroform (80:20) extraction extract by 25 mM formic acid - dichloromethane : methanol (9:1)
NP, NPnEO measurement NPnEC measurement
Sewage sludge compost
LC/MS/MS LC/MS/MS
Solid phase extraction
Freeze dry
Clean up
Concentration
High-performance solvent extraction
HPLC
Fig. 1 Flowchart of method of measuring NPs, NPnEOs and NPnECs
2. Fate of NPs in sewage sludge composting process A laboratory-scale experiment was carried out to study the fate of NPs in the sewage sludge composting process. The experimental conditions, apparatus and results are shown in Table 1, Fig. 2 and Fig. 3, respectively. Under the condition of 35°C, NPs were degraded rapidly. Degradation was delayed at 50°C and almost ceased at 70°C. It is reported that 50 and 100 mg/l of 4-NP was reduced by up to 66% by aerobic thermophilic treatment (60°C, 10 days) in a laboratory-scale experiment (Banat et al., 2000), while another study suggested that NP degradation decreased over 65°C in a composting experiment (Moeller et al., 2003). In most composting facilities, the composting
28

temperature is expected to exceed 65°C mainly in order to inactivate pathogens. However, this operation may suppress the NP degrading microbial activities in the composting plant. Further research is needed to clarify the obstacle to biodegradation of NPs in the composting process and, if possible, to enhance the degradation potential.
Table 1 Experimental conditions Run 1 Run 2 Run 3
Temperature °C 35 50 70NPs(1) μg/g-dry 150 60 60Materials Sludge(2)
SawdustReturn compost
Air flow L/min(1) Calculated initial NPs concentration (background + spike)(2) Dewatered anaerobically digested sewage sludge
1
0.40.10.5
0%
20%
40%
60%
80%
100%
120%
140%
160%
180%
0 3 6 9 12 15 18 21 24Time (day)
NP
chan
ge
35℃
50℃
70℃
NP Spike
NP Spike
Fig. 2 Compost experiment apparatus Fig. 3 NPs change in composting at different temperatures
3. Occurrence of NPCs in sewage sludge compost in actual sewage treatment plant Samples of 17 composts were collected from various prefectures in Japan and analyzed for NPs and NPnEOs (n = 1 – 15). The concentration (μg/g-dry) of NPs, total NPnEOs (n = 1 – 15) and total NPCs ranged from 6.5 to 110, from 8.3 to 82.3 and from 23.6 to 174.9, respectively (Fig. 4). NPnEOs of n > 5 (ethoxylate chains longer than n = 5) were not detected in more than 50% of the composts and NPnEOs of n > 9 were not detected in more than 75% of the composts (Fig. 4). These results suggested that sewage sludge composts contained NPnEOs of which ethoxylate chains were shortened. All five composts made from anaerobically digested sewage sludge contained higher concentrations of NPs than all 7 composts from raw excess sewage sludge (no anaerobic digestion) and both groups were significantly different statistically (p < 0.05, Mann-Whitney's U test) (Table 2). It is obvious that anaerobically digested sludge caused the high concentration of NPs in the compost. Table 2 NPs concentration and type of sludge
NP NP1EO NP3EO NP5EO NP7EO NP9EO NP11EO NP13EO NP15EO
020
4060
8010
0
NPs
Con
cent
ratio
n in
com
post
s(m
icro
g/g
-dry
)
NPnEO(n=1-15)
Median75%
25%
75%+(interquartile x 1.5)
25%-(interquartile x 1.5)
Outlying value
NPCs
Type of NPs NPnEO Totalsludge (n=1-15) NPCs
1 17 D 109.7 16.0 125.72 2 D 92.2 82.7 174.93 14 D 88.8 45.8 134.64 5 D 40.0 19.9 59.95 1 D 26.2 25.5 51.76 6 R 19.6 8.3 27.97 15 R 14.3 23.1 37.48 7 R 11.1 37.2 48.39 11 R 9.6 29.7 39.3
10 13 R 9.0 20.1 29.111 8 R 7.3 16.3 23.612 4 R 6.5 33.7 40.2
NPs, NPnEO and NPCs: micro g / g dry solid
NPsRank
CompostNo.
Fig. 4 Distribution of NPCs in sewage sludge composts in Japan (sample n = 17) REFERENCE Banat, F. A., S. Prechtl, and F. Bischof. (2000). Aerobic thermophilic treatment of sewage sludge contaminated with 4-nonylphenol. Chemosphere 41:297-302. Moeller, J., and U. Reeh. (2003). Degradation of nonylphenol ethoxylates (NPE) in sewage sludge and source separated municipal solid waste under bench-scale composting conditions. Bull. Environ. Contam. Toxicol. 70:248-54.
29
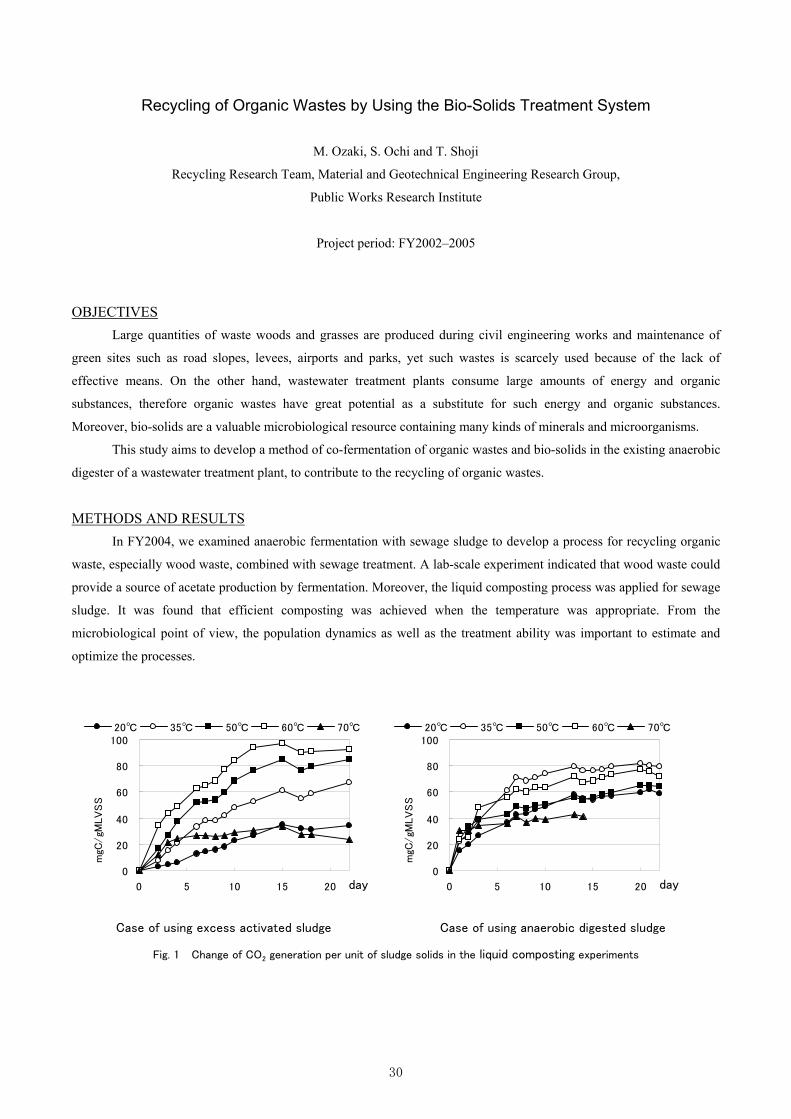
Recycling of Organic Wastes by Using the Bio-Solids Treatment System
M. Ozaki, S. Ochi and T. Shoji
Recycling Research Team, Material and Geotechnical Engineering Research Group,
Public Works Research Institute
Project period: FY2002–2005
OBJECTIVES Large quantities of waste woods and grasses are produced during civil engineering works and maintenance of
green sites such as road slopes, levees, airports and parks, yet such wastes is scarcely used because of the lack of
effective means. On the other hand, wastewater treatment plants consume large amounts of energy and organic
substances, therefore organic wastes have great potential as a substitute for such energy and organic substances.
Moreover, bio-solids are a valuable microbiological resource containing many kinds of minerals and microorganisms.
This study aims to develop a method of co-fermentation of organic wastes and bio-solids in the existing anaerobic
digester of a wastewater treatment plant, to contribute to the recycling of organic wastes.
METHODS AND RESULTS In FY2004, we examined anaerobic fermentation with sewage sludge to develop a process for recycling organic
waste, especially wood waste, combined with sewage treatment. A lab-scale experiment indicated that wood waste could
provide a source of acetate production by fermentation. Moreover, the liquid composting process was applied for sewage
sludge. It was found that efficient composting was achieved when the temperature was appropriate. From the
microbiological point of view, the population dynamics as well as the treatment ability was important to estimate and
optimize the processes.
Fig. 1 Change of CO2 generation per unit of sludge solids in the liquid composting experiments
0
20
40
60
80
100
0 5 10 15 20 日
mgC
/gM
LV
SS
-消
化汚
泥
20℃ 35℃ 50℃ 60℃ 70℃
0
20
40
60
80
100
0 5 10 15 20 日
mgC
/gM
LV
SS
-余
剰汚
泥
20℃ 35℃ 50℃ 60℃ 70℃
day day
Case of using excess activated sludge Case of using anaerobic digested sludge
30
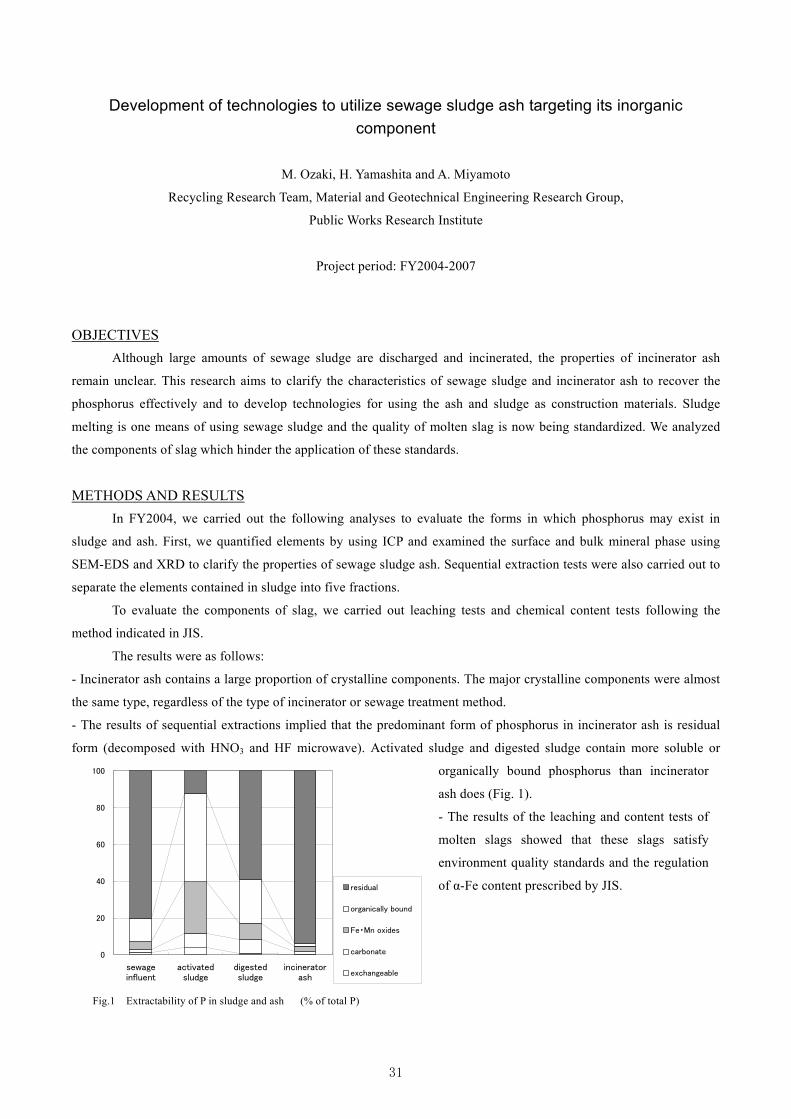
Development of technologies to utilize sewage sludge ash targeting its inorganic component
M. Ozaki, H. Yamashita and A. Miyamoto
Recycling Research Team, Material and Geotechnical Engineering Research Group,
Public Works Research Institute
Project period: FY2004-2007
OBJECTIVES Although large amounts of sewage sludge are discharged and incinerated, the properties of incinerator ash
remain unclear. This research aims to clarify the characteristics of sewage sludge and incinerator ash to recover the
phosphorus effectively and to develop technologies for using the ash and sludge as construction materials. Sludge
melting is one means of using sewage sludge and the quality of molten slag is now being standardized. We analyzed
the components of slag which hinder the application of these standards.
METHODS AND RESULTS In FY2004, we carried out the following analyses to evaluate the forms in which phosphorus may exist in
sludge and ash. First, we quantified elements by using ICP and examined the surface and bulk mineral phase using
SEM-EDS and XRD to clarify the properties of sewage sludge ash. Sequential extraction tests were also carried out to
separate the elements contained in sludge into five fractions.
To evaluate the components of slag, we carried out leaching tests and chemical content tests following the
method indicated in JIS.
The results were as follows:
- Incinerator ash contains a large proportion of crystalline components. The major crystalline components were almost
the same type, regardless of the type of incinerator or sewage treatment method.
- The results of sequential extractions implied that the predominant form of phosphorus in incinerator ash is residual
form (decomposed with HNO3 and HF microwave). Activated sludge and digested sludge contain more soluble or
organically bound phosphorus than incinerator
ash does (Fig. 1).
- The results of the leaching and content tests of
molten slags showed that these slags satisfy
environment quality standards and the regulation
of α-Fe content prescribed by JIS.
0
20
40
60
80
100
sewageinfluent
activatedsludge
digestedsludge
incineratorash
residual
organically bound
Fe・Mn oxides
carbonate
exchangeable
Fig.1 Extractability of P in sludge and ash (% of total P)
31
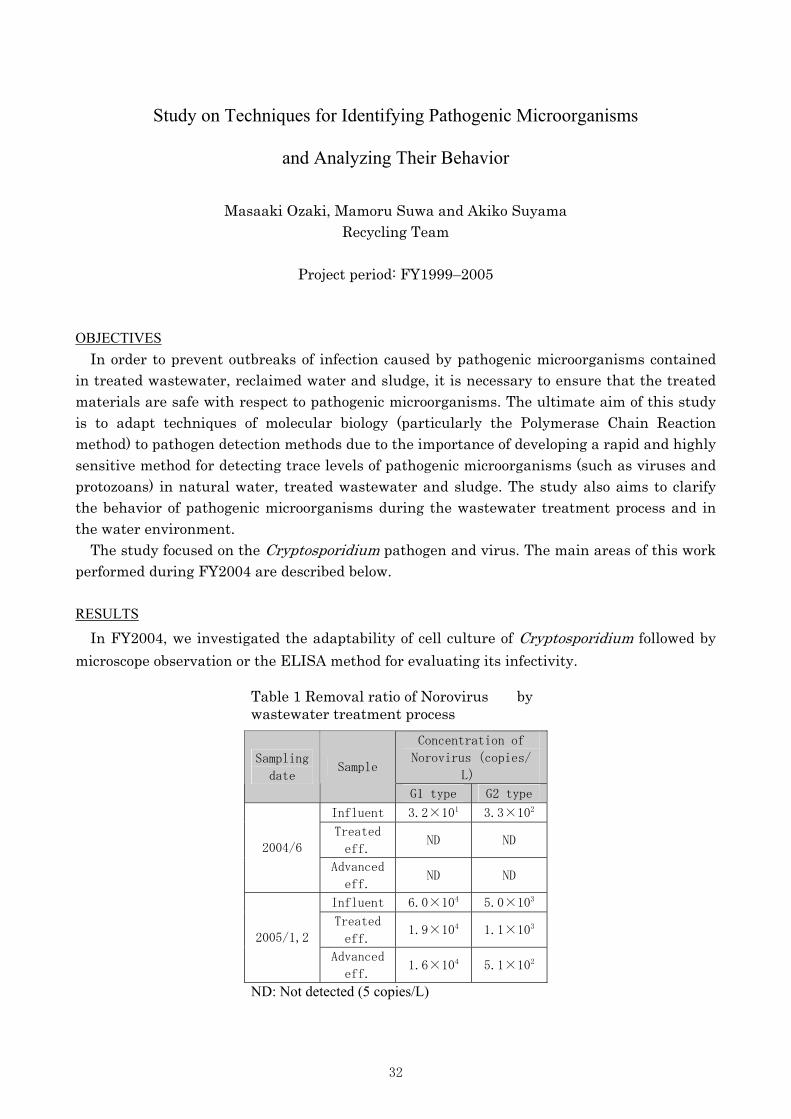
Study on Techniques for Identifying Pathogenic Microorganisms
and Analyzing Their Behavior
Masaaki Ozaki, Mamoru Suwa and Akiko Suyama
Recycling Team
Project period: FY1999–2005 OBJECTIVES
In order to prevent outbreaks of infection caused by pathogenic microorganisms contained in treated wastewater, reclaimed water and sludge, it is necessary to ensure that the treated materials are safe with respect to pathogenic microorganisms. The ultimate aim of this study is to adapt techniques of molecular biology (particularly the Polymerase Chain Reaction method) to pathogen detection methods due to the importance of developing a rapid and highly sensitive method for detecting trace levels of pathogenic microorganisms (such as viruses and protozoans) in natural water, treated wastewater and sludge. The study also aims to clarify the behavior of pathogenic microorganisms during the wastewater treatment process and in the water environment.
The study focused on the Cryptosporidium pathogen and virus. The main areas of this work performed during FY2004 are described below. RESULTS
In FY2004, we investigated the adaptability of cell culture of Cryptosporidium followed by microscope observation or the ELISA method for evaluating its infectivity.
Table 1 Removal ratio of Norovirus by wastewater treatment process
Concentration of
Norovirus(copies/
L)
Sampling
date Sample
G1 type G2 type
Influent 3.2×101 3.3×10²
Treated
eff. ND ND
2004/6
Advanced
eff. ND ND
Influent 6.0×10⁴ 5.0×10³
Treated
eff. 1.9×10⁴ 1.1×10³
2005/1,2
Advanced
eff. 1.6×10⁴ 5.1×10²
ND: Not detected (5 copies/L)
32
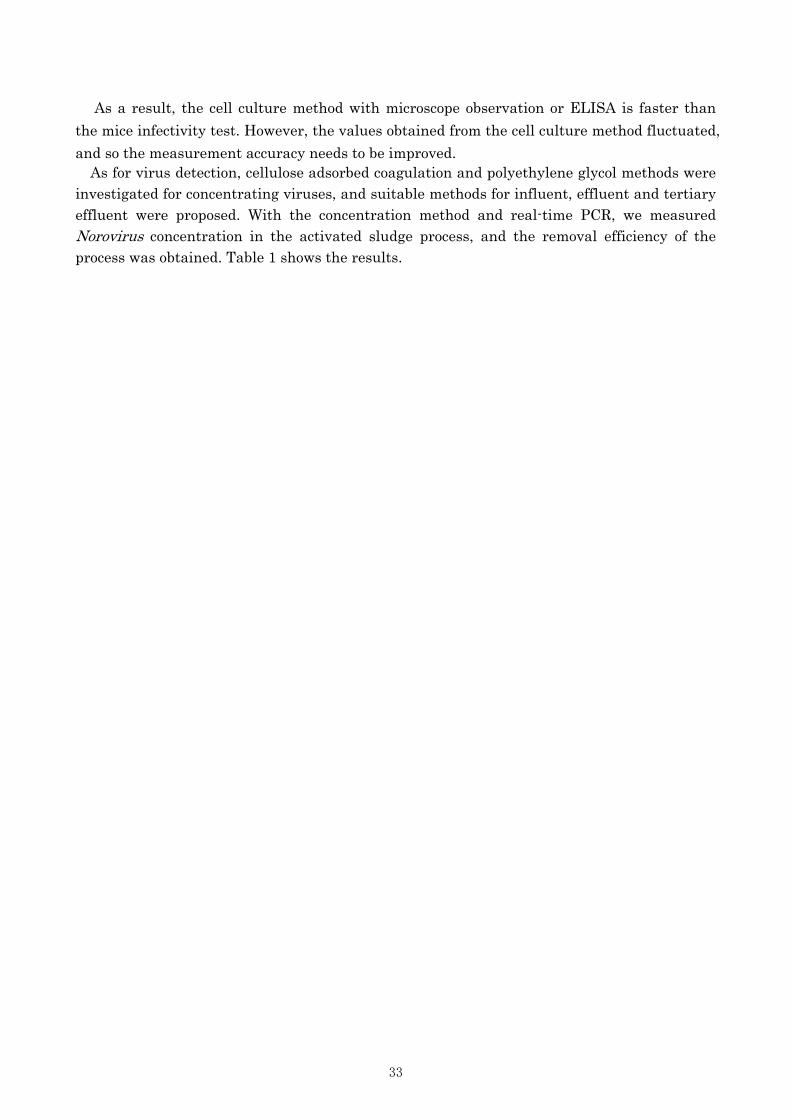
As a result, the cell culture method with microscope observation or ELISA is faster than the mice infectivity test. However, the values obtained from the cell culture method fluctuated, and so the measurement accuracy needs to be improved.
As for virus detection, cellulose adsorbed coagulation and polyethylene glycol methods were investigated for concentrating viruses, and suitable methods for influent, effluent and tertiary effluent were proposed. With the concentration method and real-time PCR, we measured Norovirus concentration in the activated sludge process, and the removal efficiency of the process was obtained. Table 1 shows the results.
33

Advanced Removal of Residual Organic Matter in Secondary Effluent for Wastewater Reuse
M. Ozaki, S. Ochi, T. Maki and T. Shoji
Recycling Research Team, Material and Geotechnical Engineering Research Group,
Public Works Research Institute
Project period: FY2002–2005
OBJECTIVES Treated wastewater is regarded as an alternative water resource in urban areas; however, residual organic matter
may cause problems such as regrowth of microorganisms in distribution facilities and change of biota in the water
environment. This research aims to develop advanced methods of removing residual organic matter inexpensively and
efficiently.
METHODS AND RESULTS In 2004, we carried out experiments using eight columns as a trickling filter which were each packed with
different media (Table 1 and Fig. 1) to analyze the effects of removing trace organic matter from the advanced
treatment water of wastewater. Fractionation by gel permeation chromatograph was used for characterizing the organic
matter in the secondary effluents from wastewater treatment plants with activated sludge processes.
The results of the research were as follows:
1) Maximum removal rates were CODcr: 36% (Fig. 2) and TOC: 21% (Fig. 3) for a continuous flow period of
230 days.
2) Organic matter in the secondary effluent could not be characterized.
Table 1 Medias used
Fig. 1 Apparatus of the column experiments
columns packed media
A Activated carbon
B ZeoliteC CharcoalD Kohga stoneE Chemo-treated charcoalF Mixture zeolite and charcoalG Mixture charcoal and kohga stone
H Mixture kohga stone and zeolite
34
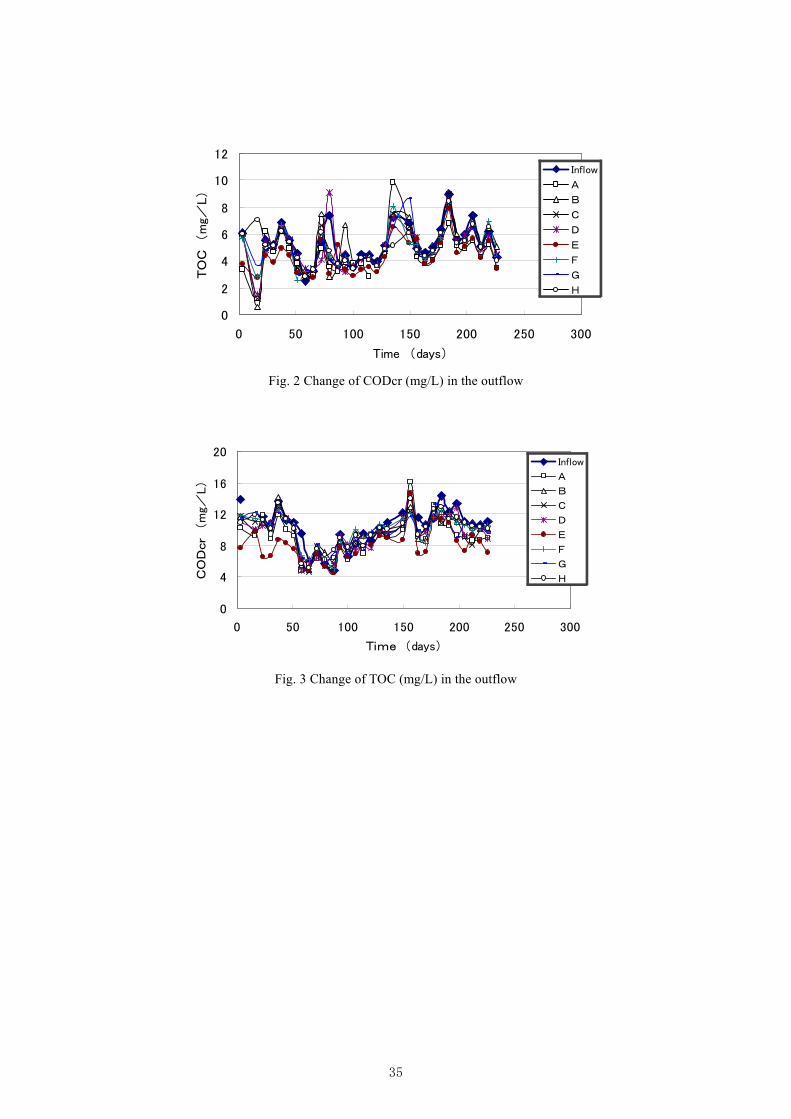
Fig. 2 Change of CODcr (mg/L) in the outflow
Fig. 3 Change of TOC (mg/L) in the outflow
0
2
4
6
8
10
12
0 50 100 150 200 250 300
Time (days)
TO
C
(m
g/L)
Inflow
A
B
C
D
E
F
G
H
0
4
8
12
16
20
0 50 100 150 200 250 300
Time (days)
CO
Dcr
(m
g/L)
Inflow
A
B
C
D
E
F
G
H
35
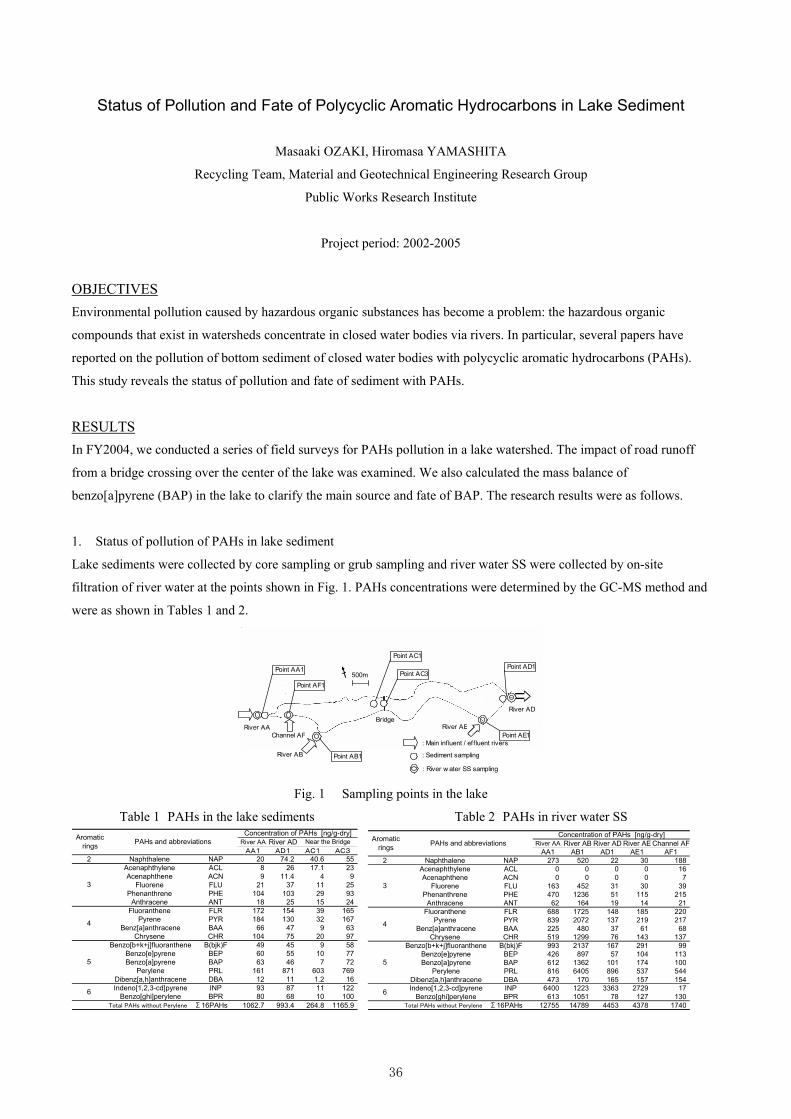
Status of Pollution and Fate of Polycyclic Aromatic Hydrocarbons in Lake Sediment
Masaaki OZAKI, Hiromasa YAMASHITA
Recycling Team, Material and Geotechnical Engineering Research Group
Public Works Research Institute
Project period: 2002-2005
OBJECTIVES Environmental pollution caused by hazardous organic substances has become a problem: the hazardous organic
compounds that exist in watersheds concentrate in closed water bodies via rivers. In particular, several papers have
reported on the pollution of bottom sediment of closed water bodies with polycyclic aromatic hydrocarbons (PAHs).
This study reveals the status of pollution and fate of sediment with PAHs.
RESULTS In FY2004, we conducted a series of field surveys for PAHs pollution in a lake watershed. The impact of road runoff
from a bridge crossing over the center of the lake was examined. We also calculated the mass balance of
benzo[a]pyrene (BAP) in the lake to clarify the main source and fate of BAP. The research results were as follows.
1. Status of pollution of PAHs in lake sediment
Lake sediments were collected by core sampling or grub sampling and river water SS were collected by on-site
filtration of river water at the points shown in Fig. 1. PAHs concentrations were determined by the GC-MS method and
were as shown in Tables 1 and 2.
500m Point AA1
Point AC1
River AB
Bridge
: Main influent / eff luent rivers
Point AD1
: Sediment sampling
Point AF1
Point AC3
River AA
Point AB1
Channel AF Point AE1River AE
River AD
: River w ater SS sampling
Fig. 1 Sampling points in the lake
Table 1 PAHs in the lake sediments Table 2 PAHs in river water SS
River AA River ADAA1 AD1 AC1 AC3
2 Naphthalene NAP 20 74.2 40.6 55Acenaphthylene ACL 8 26 17.1 23Acenaphthene ACN 9 11.4 4 9
Fluorene FLU 21 37 11 25Phenanthrene PHE 104 103 29 93
Anthracene ANT 18 25 15 24Fluoranthene FLR 172 154 39 165
Pyrene PYR 184 130 32 167Benz[a]anthracene BAA 66 47 9 63
Chrysene CHR 104 75 20 97Benzo[b+k+j]fluoranthene B(bjk)F 49 45 9 58
Benzo[e]pyrene BEP 60 55 10 77Benzo[a]pyrene BAP 63 46 7 72
Perylene PRL 161 871 603 769Dibenz[a,h]anthracene DBA 12 11 1.2 16Indeno[1,2,3-cd]pyrene INP 93 87 11 122
Benzo[ghi]perylene BPR 80 68 10 100Total PAHs without Perylene Σ16PAHs 1062.7 993.4 264.8 1165.9
Concentration of PAHs [ng/g-dry]Near the BridgeAromatic
rings PAHs and abbreviations
3
4
5
6
River AA River AB River AD River AE Channel AFAA1 AB1 AD1 AE1 AF1
2 Naphthalene NAP 273 520 22 30 188Acenaphthylene ACL 0 0 0 0 16Acenaphthene ACN 0 0 0 0 7
Fluorene FLU 163 452 31 30 39Phenanthrene PHE 470 1236 51 115 215
Anthracene ANT 62 164 19 14 21Fluoranthene FLR 688 1725 148 185 220
Pyrene PYR 839 2072 137 219 217Benz[a]anthracene BAA 225 480 37 61 68
Chrysene CHR 519 1299 76 143 137Benzo[b+k+j]fluoranthene B(bkj)F 993 2137 167 291 99
Benzo[e]pyrene BEP 426 897 57 104 113Benzo[a]pyrene BAP 612 1362 101 174 100
Perylene PRL 816 6405 896 537 544Dibenz[a,h]anthracene DBA 473 170 165 157 154Indeno[1,2,3-cd]pyrene INP 6400 1223 3363 2729 17
Benzo[ghi]perylene BPR 613 1051 78 127 130Total PAHs without Perylene Σ16PAHs 12755 14789 4453 4378 1740
Concentration of PAHs [ng/g-dry]
5
6
Aromaticrings PAHs and abbreviations
3
4
36
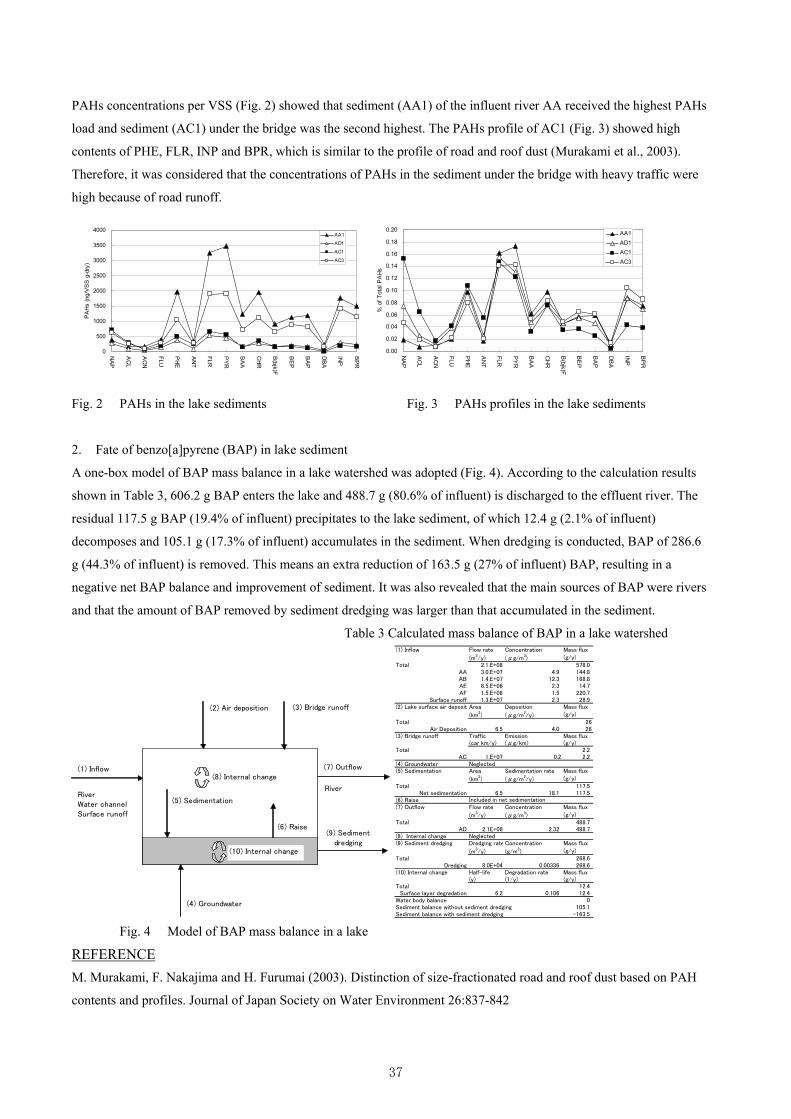
PAHs concentrations per VSS (Fig. 2) showed that sediment (AA1) of the influent river AA received the highest PAHs
load and sediment (AC1) under the bridge was the second highest. The PAHs profile of AC1 (Fig. 3) showed high
contents of PHE, FLR, INP and BPR, which is similar to the profile of road and roof dust (Murakami et al., 2003).
Therefore, it was considered that the concentrations of PAHs in the sediment under the bridge with heavy traffic were
high because of road runoff.
0
500
1000
1500
2000
2500
3000
3500
4000
NA
P
AC
L
AC
N
FLU
PH
E
AN
T
FLR
PY
R
BA
A
CH
R
B(bjk)F
BE
P
BA
P
DB
A
INP
BP
R
PA
Hs
(ng/
VS
S g
-dry
)
AA1
AD1
AC1
AC3
0.00
0.02
0.04
0.06
0.08
0.10
0.12
0.14
0.16
0.18
0.20
NA
P
AC
L
AC
N
FLU
PH
E
AN
T
FLR
PY
R
BA
A
CH
R
B(bjk)F
BE
P
BA
P
DB
A
INP
BP
R
% o
f Tot
al P
AH
s
AA1AD1AC1AC3
Fig. 2 PAHs in the lake sediments Fig. 3 PAHs profiles in the lake sediments
2. Fate of benzo[a]pyrene (BAP) in lake sediment
A one-box model of BAP mass balance in a lake watershed was adopted (Fig. 4). According to the calculation results
shown in Table 3, 606.2 g BAP enters the lake and 488.7 g (80.6% of influent) is discharged to the effluent river. The
residual 117.5 g BAP (19.4% of influent) precipitates to the lake sediment, of which 12.4 g (2.1% of influent)
decomposes and 105.1 g (17.3% of influent) accumulates in the sediment. When dredging is conducted, BAP of 286.6
g (44.3% of influent) is removed. This means an extra reduction of 163.5 g (27% of influent) BAP, resulting in a
negative net BAP balance and improvement of sediment. It was also revealed that the main sources of BAP were rivers
and that the amount of BAP removed by sediment dredging was larger than that accumulated in the sediment.
Table 3 Calculated mass balance of BAP in a lake watershed
(1) Inflow (7) Outflow
(2) Air deposition
(9) Sedimentdredging
(5) Sedimentation
(6) Raise
RiverWater channelSurface runoff
(4) Groundwater
River
(3) Bridge runoff
(10) Internal change
(8) Internal change
(1) Inflow Flow rate Concentration Mass flux
(m3/y) (μg/m
3) (g/y)
Total 2.1.E+08 578.0AA 3.0.E+07 4.9 144.8AB 1.4.E+07 12.3 168.8AE 6.5.E+06 2.3 14.7AF 1.5.E+08 1.5 220.7
Surface runoff 1.3.E+07 2.3 28.9(2) Lake surface air depositiArea Deposition Mass flux
(km2) (μg/m
2/y) (g/y)
Total 26Air Deposition 6.5 4.0 26
(3) Bridge runoff Traffic Emission Mass flux(car km/y) (μg/km) (g/y)
Total 2.2AC 1.E+07 0.2 2.2
(4) Groundwater Neglected(5) Sedimentation Area Sedimentation rate Mass flux
(km2) (μg/m
2/y) (g/y)
Total 117.5Net sedimentation 6.5 18.1 117.5
(6) Raise(7) Outflow Flow rate Concentration Mass flux
(m3/y) (μg/m
3) (g/y)
Total 488.7AD 2.1E+08 2.32 488.7
(8) Internal change Neglected(9) Sediment dredging Dredging rate Concentration Mass flux
(m3/y) (g/m
3) (g/y)
Total 268.6Dredging 8.0E+04 0.00336 268.6
(10) Internal change Half-life Degradation rate Mass flux(y) (1/y) (g/y)
Total 12.4Surface layer degradation 6.2 0.106 12.4
Water body balance 0Sediment balance without sediment dredging 105.1Sediment balance with sediment dredging -163.5
Included in net sedimentation
Fig. 4 Model of BAP mass balance in a lake
REFERENCE M. Murakami, F. Nakajima and H. Furumai (2003). Distinction of size-fractionated road and roof dust based on PAH
contents and profiles. Journal of Japan Society on Water Environment 26:837-842
37
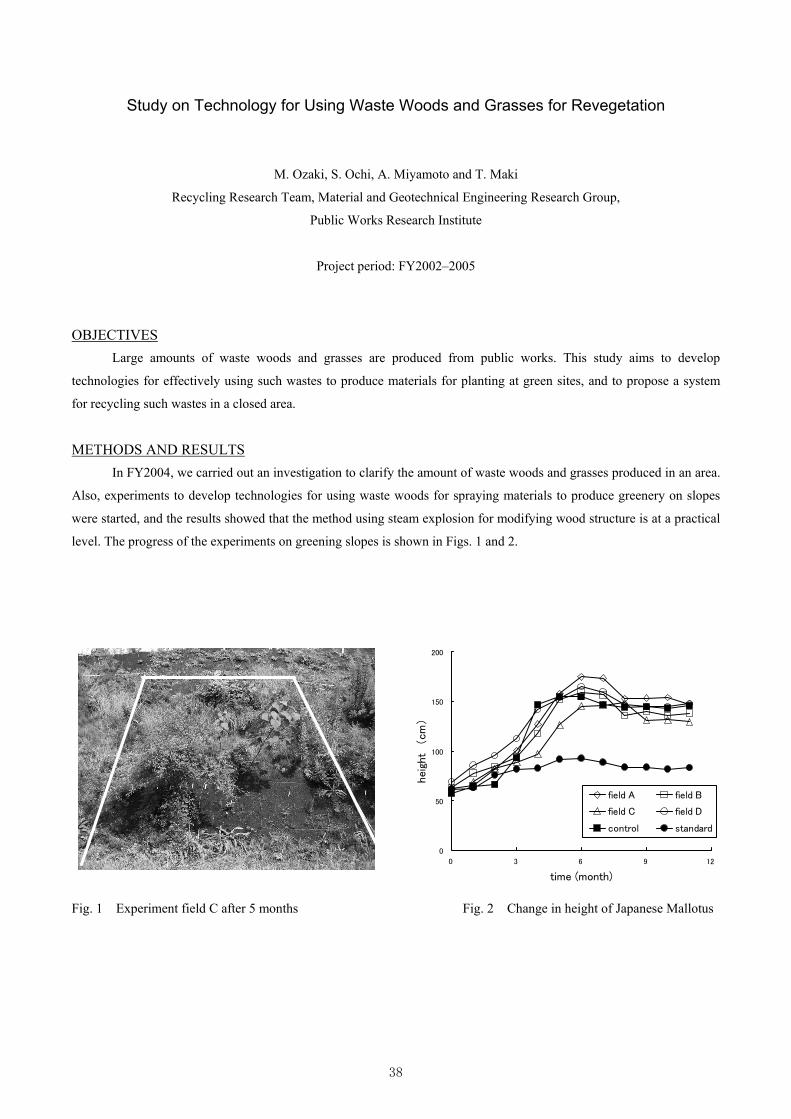
Study on Technology for Using Waste Woods and Grasses for Revegetation
M. Ozaki, S. Ochi, A. Miyamoto and T. Maki
Recycling Research Team, Material and Geotechnical Engineering Research Group,
Public Works Research Institute
Project period: FY2002–2005
OBJECTIVES Large amounts of waste woods and grasses are produced from public works. This study aims to develop
technologies for effectively using such wastes to produce materials for planting at green sites, and to propose a system
for recycling such wastes in a closed area.
METHODS AND RESULTS In FY2004, we carried out an investigation to clarify the amount of waste woods and grasses produced in an area.
Also, experiments to develop technologies for using waste woods for spraying materials to produce greenery on slopes
were started, and the results showed that the method using steam explosion for modifying wood structure is at a practical
level. The progress of the experiments on greening slopes is shown in Figs. 1 and 2.
Fig. 1 Experiment field C after 5 months Fig. 2 Change in height of Japanese Mallotus
0
50
100
150
200
0 3 6 9 12
time (month)
hei
ght
(cm
)
field A field B
field C field D
control standard
38

Fate of Pathogens in Sewage Treatment Plant in Monsoon Asia
Masaaki Ozaki, Mamoru Suwa and Akiko Suyama
Recycling Research Team Project period: 2003–2006
OBJECTIVES
Rapid population growth, urbanization, delayed sewerage system construction and intensive rainfall in Monsoon Asia have polluted urban water environments with pathogens originating from human feces. To evaluate the associated risks to people living in Monsoon Asia, the sources, routes and fate of pathogens in the water environment must be investigated. Most sewage treatment in Monsoon Asia is performed by lagoons, and the characteristics of the removal or inactivation of pathogens by these lagoons must be evaluated in terms of the effects of temperature, sunlight intensity and amount of rainfall. Lagoons are sometimes backed up by wetlands, and this supplemental process must also be performed efficiently.
The first aim of this research is to develop indicator microorganisms which are representative of the three pathogen groups: bacteria, protozoa and viruses. Then, these indicators will be used to evaluate the effects of the type of lagoon, the wetland and the climate conditions on the fate of pathogens.
The main works performed during FY2004 are described below.
RESULTS
In FY2004, lagoons in Thailand in the Mekong watershed were surveyed. Two lagoons in Khon Kean and the Asian Institute of Technology (AIT) were selected for this research to compare the effects of sewerage system. Each house has a septic tank in Khon Kean, whereas AIT has its own sewerage system with flush toilets. As the results in Table 1 show, the concentrations of Giardia and Norovirus at AIT are much higher than at Khon Kean. The concentration of Norovirus at both lagoons is much higher than that in Japan, but Norovirus and Giardia are treated by lagoons effectively.
39

Table 1 Concentration and removal ratio of pathogens
Total coli form
(cfu or MPN/ml)
NorovirusG1
(copies/L)
NorovirusG2
(copies/L)
Giardia
(cysts/L)
Cryptosporidium
(oocysts/L)
04/06~05/2,3
Influent 4.4E+2~2.3E+5 1.1E+4~9.7E+5 4.1E+2~1.6E+5 ND~1.5E+2 〔7/8〕 ND 〔0/8〕
Aerated 4.0E+1~3.0E+4 ND~1.0E+3 ND~1.7E+4 ND~2.2E+1 〔2/8〕 ND 〔0/8〕
Effluent 3.8E+1~2.2E+4 ND~2.9E+2 ND~1.0E+4 ND~1.0E+0 〔1/8〕 ND 〔0/8〕
Mean removal ratio(%) 83.2 94.2 85.0 99.9 ―
Influent 2.1E+4~9.0E+6 4.5E+4~3.5E+6 1.7E+4~2.0E+6 2.6E+2~1.8E+4 〔9/9〕 ND~1.6E+1 〔5/9〕
Effluent1 4.6E+3~1.6E+6 1.0E+5~2.2E+6 1.3E+4~1.3E+6 1.1E+1~4.1E+2 〔9/9〕 ND~2.0E+0 〔2/9〕
Effluent2 7.0E+1~5.0E+3 3.6E+1~4.2E+5 ND~6.0E+4 3.0E+0~2.8E+1 〔9/9〕 ND 〔0/9〕
Mean removal ratio(%) 99.6 65.7 92.3 99.2 100
04/06~05/01
AIT
Date 04/06~12,05/01
Khon k
ean
ND: Not detected
40
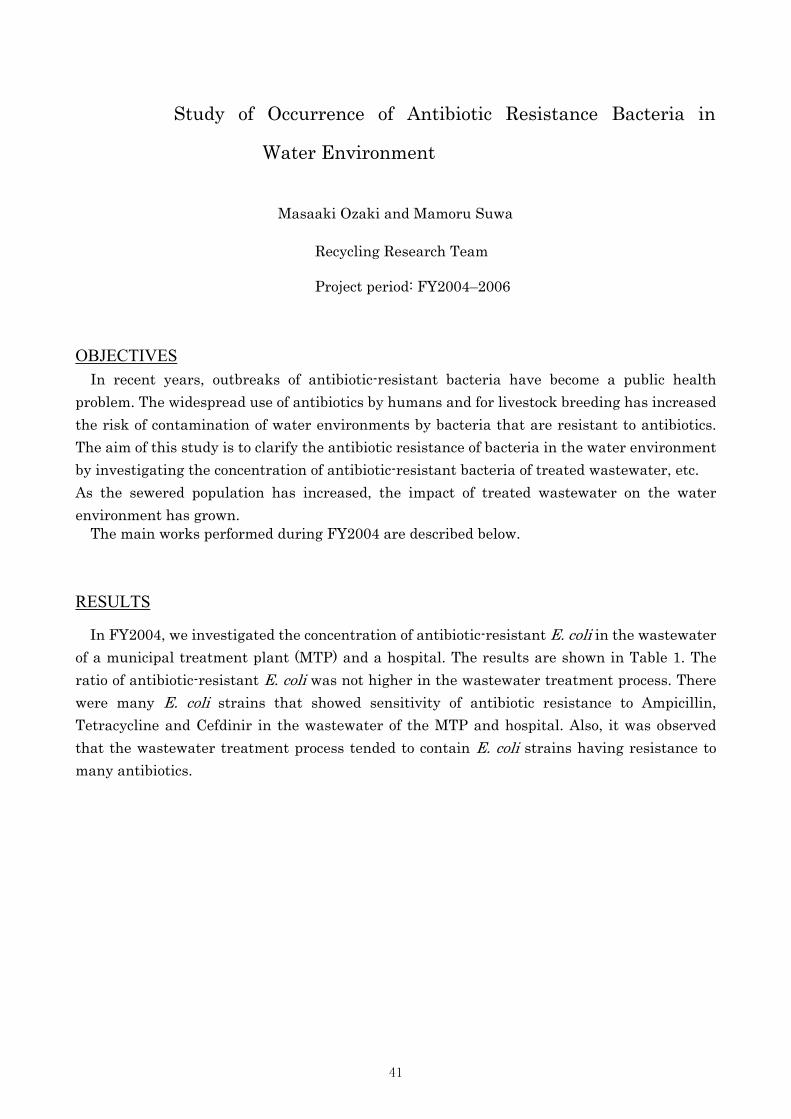
Study of Occurrence of Antibiotic Resistance Bacteria in
Water Environment
Masaaki Ozaki and Mamoru Suwa
Recycling Research Team Project period: FY2004–2006
OBJECTIVES
In recent years, outbreaks of antibiotic-resistant bacteria have become a public health problem. The widespread use of antibiotics by humans and for livestock breeding has increased the risk of contamination of water environments by bacteria that are resistant to antibiotics. The aim of this study is to clarify the antibiotic resistance of bacteria in the water environment by investigating the concentration of antibiotic-resistant bacteria of treated wastewater, etc. As the sewered population has increased, the impact of treated wastewater on the water environment has grown.
The main works performed during FY2004 are described below.
RESULTS
In FY2004, we investigated the concentration of antibiotic-resistant E. coli in the wastewater of a municipal treatment plant (MTP) and a hospital. The results are shown in Table 1. The ratio of antibiotic-resistant E. coli was not higher in the wastewater treatment process. There were many E. coli strains that showed sensitivity of antibiotic resistance to Ampicillin, Tetracycline and Cefdinir in the wastewater of the MTP and hospital. Also, it was observed that the wastewater treatment process tended to contain E. coli strains having resistance to many antibiotics.
41
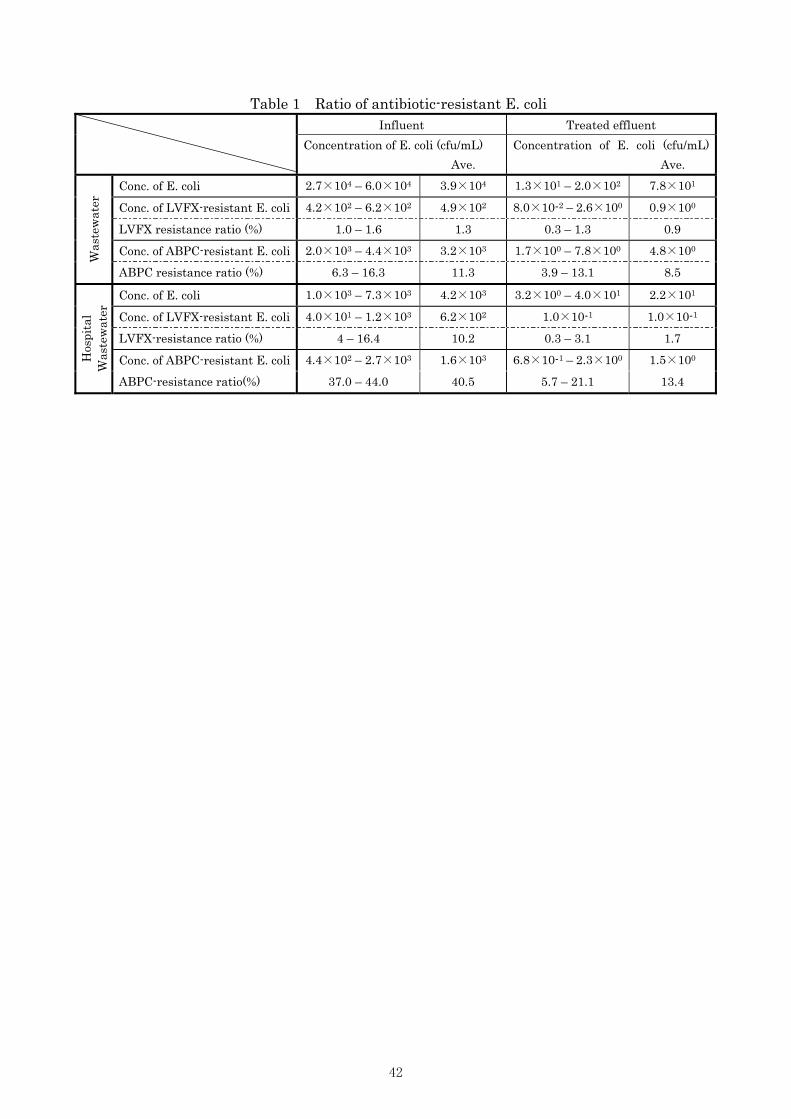
Table 1 Ratio of antibiotic-resistant E. coli Influent Treated effluent
Concentration of E. coli (cfu/mL) Ave.
Concentration of E. coli (cfu/mL) Ave.
Conc. of E. coli 2.7×10⁴ – 6.0×10⁴ 3.9×10⁴ 1.3×101 – 2.0×10² 7.8×101 Conc. of LVFX-resistant E. coli 4.2×10² – 6.2×10² 4.9×10² 8.0×10⁻² – 2.6×100 0.9×100 LVFX resistance ratio (%) 1.0 – 1.6 1.3 0.3 – 1.3 0.9 Conc. of ABPC-resistant E. coli 2.0×10³ – 4.4×10³ 3.2×10³ 1.7×100 – 7.8×100 4.8×100 W
aste
wat
er
ABPC resistance ratio (%) 6.3 – 16.3 11.3 3.9 – 13.1 8.5
Conc. of E. coli 1.0×10³ – 7.3×10³ 4.2×10³ 3.2×100 – 4.0×101 2.2×101 Conc. of LVFX-resistant E. coli 4.0×101 – 1.2×10³ 6.2×10² 1.0×10⁻¹ 1.0×10⁻¹ LVFX-resistance ratio (%) 4 – 16.4 10.2 0.3 – 3.1 1.7 Conc. of ABPC-resistant E. coli 4.4×10² – 2.7×10³ 1.6×10³ 6.8×10⁻¹ – 2.3×100 1.5×100 H
ospi
tal
Was
tew
ater
ABPC-resistance ratio(%) 37.0 – 44.0 40.5 5.7 – 21.1 13.4
42
RESEARCH ON EVALUATION OF TRACE CHEMICALS AT WASTEWATER TREATMENT PLANTS
Yutaka Suzuki, Koya Komori, Yuji Okayasu
Water Quality Research Team, Water Environment Research Group
Independent Administrative Institution Public Works Research Institute
Project period: FY 2000-2005
Previous studies have pointed out the occurrence of many trace chemicals such as endocrine disrupting
chemicals (EDCs) in sewage. Therefore, the method to estimate their fate and risk should be established.
In FY2004, improvement of EDCs measurement with ELISA method was studied, and behavior of free estrogen,
their conjugates and synthetic estrogen (oral contraceptive pill) in wastewater treatment plants was investigated.
Main results are as follows;
1) Three pre-treatment procedures for removing cross-reacting and/or disturbing substances in measuring
17β-estradiol (E2) and estrone (E1) with ELISA method were compared. The result indicates that it is effective to
remove humic-acid fraction in improving the accuracy of measuring E1 in influent.
2) Behavior of free estrogens and estrogen sulfates in a wastewater treatment process was studied under aerobic
condition (MLDO>5mg/L) and long SRT (60 days) using a membrane bioreactor. Free estrogens were completely
removed, while estrogen sulfates were decreased to some extent and remained in the secondary effluent. This
result indicates that estrogen sulfates are much more persistent than free estrogens.
3) The occurrence of ethinyl estradiol (EE2), which is main component of an oral contraceptive pill, in influent
and secondary effluent in 10 municipal wastewater treatment plants were studied. EE2 was detected by both
analytical methods (HR-GC/MS and LC/MS/MS) and ELISA method. Concentrations of EE2 in influent were
under detection limit and those in secondary effluent ranged from n.d. to 0.28ng/L.
Key words: endocrine disrupting chemicals, estrogen, nonylphenol, ELISA, wastewater treatment
43
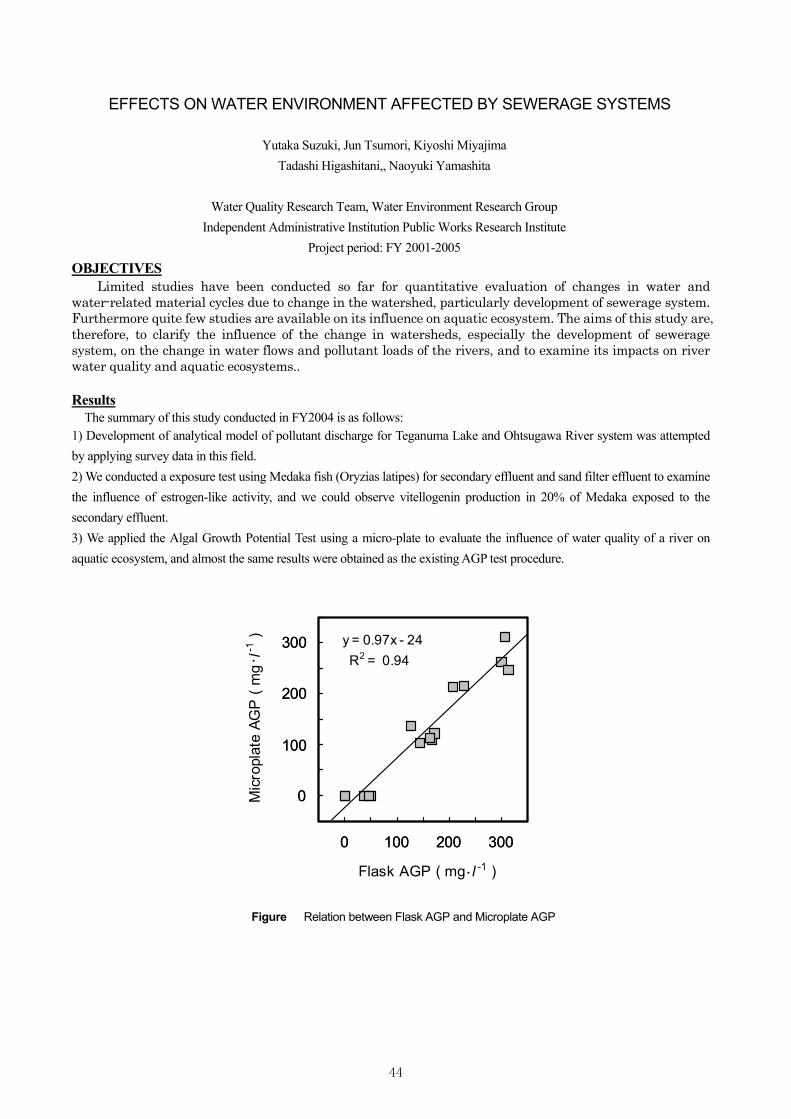
EFFECTS ON WATER ENVIRONMENT AFFECTED BY SEWERAGE SYSTEMS
Yutaka Suzuki, Jun Tsumori, Kiyoshi Miyajima Tadashi Higashitani,, Naoyuki Yamashita
Water Quality Research Team, Water Environment Research Group
Independent Administrative Institution Public Works Research Institute Project period: FY 2001-2005
OBJECTIVES Limited studies have been conducted so far for quantitative evaluation of changes in water and
water-related material cycles due to change in the watershed, particularly development of sewerage system. Furthermore quite few studies are available on its influence on aquatic ecosystem. The aims of this study are, therefore, to clarify the influence of the change in watersheds, especially the development of sewerage system, on the change in water flows and pollutant loads of the rivers, and to examine its impacts on river water quality and aquatic ecosystems.. Results
The summary of this study conducted in FY2004 is as follows: 1) Development of analytical model of pollutant discharge for Teganuma Lake and Ohtsugawa River system was attempted by applying survey data in this field. 2) We conducted a exposure test using Medaka fish (Oryzias latipes) for secondary effluent and sand filter effluent to examine the influence of estrogen-like activity, and we could observe vitellogenin production in 20% of Medaka exposed to the secondary effluent. 3) We applied the Algal Growth Potential Test using a micro-plate to evaluate the influence of water quality of a river on aquatic ecosystem, and almost the same results were obtained as the existing AGP test procedure.
Figure Relation between Flask AGP and Microplate AGP
-50
0
50
100
150
200
250
300
350
-50 0 50 100 150 200 250 300 350
Flask AGP ( mg・l -1 )
Mic
ropl
ate
AGP
( m
g・l-1
) y = 0.97x - 24 R2 = 0.94
100 200 3000 100 200 3000
100
200
300
0
100
200
300
0
44

Evaluation of River Water Quality from the Viewpoint of Aquatic Ecosystem
Y. Suzuki, K. Miyajima, N. Yamashita and N. Nakada Water Quality Team
Project period: FY 2000-2005
OBJECTIVES In recent years, sewerage systems have widely spread in urban areas. At the same time, the volumetric percentage of water
derived from sewage treatment plants (STPs) in rivers has been increasing. As a result, the quality of river water is greatly influenced by the f treated wastewater. It is, therefore, assumed that the treated wastewater may exert positive or negative impacts on natural ecosystems. However, studies on impacts of STP discharge upon organisms and receiving rivers are very limited.
The objective of this study is to investigate the relationship between water quality and living organisms. In FY 2004, we investigated the fate of organic and inorganic compounds originating from sewerage effluent and the bioaccumulation of estrogenic substances and metals in periphytons and benthos in Tama River. Results The summary of this study conducted in FY2004 is as follows: (1) The fate of sewage related compounds in the river was investigated in summer. As a result, inorganic nitrogen and
phosphorus, estrogen and nonylphenol related compounds were not decreased in the section of 1000m to 3000m lower stream from the STP, which was contrary to that significant decrease in concentration of estrogen along river stream was observed in previous study in summer.
(2) River water, periphyton and benthic invertebrates were collected at the upper site of the Tama River (St.1 and St.2) and the site downstream of STP discharge (St.,3) and it was shown that the content of Mn, Zn, Pb, Cu and Mo among heavy metals in periphyton were raised after inflows of STP effluent (Fig. 1). However, biomagnification of heavy metals through the food web was not observed.
0
500
1000
1500
2000
St.1 St.2 St.3 St.4
Con
tent
(µg/
g) Mn
020
4060
80100
St.1 St.2 St.3 St.4
Con
tent
(µg/
g) Pb
330
0
100
200
300
400
St.1 St.2 St.3 St.4
Con
tent
(µg/
g) Zn
020
4060
80100
St.1 St.2 St.3 St.4
Con
tent
(µg/
g) Cu
01
23
45
St.1 St.2 St.3 St.4
Con
tent
(µg/
g) Mo
010
2030
4050
St.1 St.2 St.3 St.4
Con
tent
(µg/
g) Ni
Figure 1. Concentrations of metals in sediment, particulate organic matter, periphyton and stenopsyche
collected from Tama River.
SedimentFPOMCPOMPeriphytonStenopsyche
45

TRANSPORT OF CONTAMINANTS AT SEDIMENT-WATER INTERFACE
Yutaka Suzuki, Jun Tsumori
Water Quality Research Team, Water Environment Research Group
Independent Administrative Institution Public Works Research Institute
Project period: FY 2000-2005
The aim of this study is to clarify release mechanisms of nutrients form lake and reservoir sediments from the
viewpoint of eutrophication countermeasure.
In FY 2003, we conducted a field investigation in Ushikubiri reservoir, an experiment of oxygen supply in bottom
layer, and a laboratory experiment using sediment samples. The following results were obtained.
1) Oxygen supply experiment in the reservoir has been conducted since FY 2002. Temperature, DO and ORP in water
column were continuously monitored by the sensor during experimental period. Then, we observed the continuous
change of oxidation-reduction potential and nutrients concentrations in water column with or with out oxygen supply. As
a result, increase of phosphorus concentrations in water column that were not found in aerobic conditions was observed
after the stop of oxygen supply. However, the phenomena was not as clear as that of last year.
2) Release tests with anoxic condition using core sediment samples collected before and after oxygen supply experiments
in the reservoir were conducted. The result was that release rates of nitrogen were not different between before and after
the oxygen supply. In addition, dissolved oxygen concentration in the test column increased of nitrogen purge.
3) Batch stirring experiments were conducted using the surface, middle and bottom layers of a core sediment samples,
and the rates and potentials of nutrient release from sediment mud under varied temperatures, aerobic and anoxic
conditions were quantitatively assessed. From the experiments, following results were obtained; the difference of
dissolution amount of phosphorus among sediment samples was small under aerobic conditions; both release
concentrations and rates were promoted under anoxic conditions and high temperature (20 degree C) compared with
those under aerobic conditions and low temperature (5 degree C); the nitrification rate of surface layer sediments under
aerobic conditions was significantly bigger than those of other layer sediments.
Key words: sediment, nutrients, elution, DO, ORP, monitoring.
46
BEHAVIOR OF CHEMICALS FROM URBAN DISCHARGE IN WATER ENVIRONMENT
Y. Suzuki, K. Komori, J. Tsumori, F. Li and N. Yamashita
Water Quality Division
Project period: 2001 - 2005
OBJECTIVES The target substances of this study are endocrine disruptors (EDs) such as decomposition by-product of surface active
chemicals and human and animal related hormones originating from urban wastewater, and the aims of this study are
development of efficient investigation and analytical techniques of EDs in river water and sediment samples and the
clarification of fate of EDs in water environment.
RESULTS In FY 2004, we conducted development of analytical techniques of the conjugated forms of natural estrogens in
wastewater treatment plants, surveys of concentrations of nonylphenol and its derivatives (NPs) in water and sediment samples
in a lake, development of simulation model of NPs based on the surveys, and evaluation of estrogen decomposition rates of
water and sediment samples in a reservoir. Then, following results were obtained.
1) We modified the analytical method of the conjugated forms of estrogens that we reported last year. The recovery
efficiencies of conjugated estrogens (i.e., E1-S, E2-S, E3-S, E1-G, E2-G, E3-G and E2-S&G) were improved, showing 87 -
120% for secondary effluent and 60-110% for wastewater influent (See Figure 1).
2) NPs concentration of the water samples in the lake decreased along flow direction, but that of the sediment samples
showed opposite tendency. A simulation model was developed incorporating decomposition rates and adsorption constants
obtained from experiments, and the model could calculate the characteristics of NPs composition and distribution of the water
samples.
3) Decomposition rates of E2 were larger in the surface layer sediments or under aerobic condition than in the middle and
bottom layer sediments or under anaerobic condition. If the decomposition rates were evaluated per unit mass of SS, the rates
were high in the water samples than in the sediment samples (See Figure 2).
Research Paper 1) F. Li, J. Tsumori, N. Yamashita, H. Tanaka and Y. Suzuki, Biodegradation and biotransformation pathways of
17b-estradiol by reservoir sediment under aerobic and anaerobic conditions, Environmental engineering research, Vol.41,
pp.447-458 (2004)
2) T. Ohiwa, M. Sueoka, K. Tanabe, K. Komori and Y. Suzuki, Determination of conjugated estrogens in sewage by
LC-MS/MS, The 7th annual meeting of Japan society of endocrine disrupters research, p.145 (2004)
47

Figure 1 Recoveries (%) of estrogens from purified water samplesthrougt the modified analytical method
0
20
40
60
80
100
120
E1-S E2-S E3-S E1-G E2-G E3-G E2-S&G
Rec
ove
ry
(%
)
Purified water
Secondary settling tank effluent
WWTP influent
1.281.50
0.05
0.81
0.02
0.14
0.03
5.70
0.01
0.1
1
10
BW/OW Sediment BW/OW Sediment
k[h
r-1/(g
-SS/
l)]
AnaerobicAerobic
T4 U1b
3.44
0.300.57
0.03
0.11
0.030.07
0.04
0.01
0.1
1
10
BW/OW Sediment BW/OW Sediment
k[h
r-1/(g
-SS/
l)] AnaerobicAerobic
2004/5
Aerobic
2004/5 2004/10a
1.281.50
0.05
0.81
0.02
0.14
0.03
5.70
0.01
0.1
1
10
BW/OW Sediment BW/OW Sediment
k[h
r-1/(g
-SS/
l)]
AnaerobicAerobic
T4 U1b
3.44
0.300.57
0.03
0.11
0.030.07
0.04
0.01
0.1
1
10
BW/OW Sediment BW/OW Sediment
k[h
r-1/(g
-SS/
l)] AnaerobicAerobic
2004/51.281.50
0.05
0.81
0.02
0.14
0.03
5.70
0.01
0.1
1
10
BW/OW Sediment BW/OW Sediment
k[h
r-1/(g
-SS/
l)]
AnaerobicAerobic
T4 U1b
3.44
0.300.57
0.03
0.11
0.030.07
0.04
0.01
0.1
1
10
BW/OW Sediment BW/OW Sediment
k[h
r-1/(g
-SS/
l)] AnaerobicAerobic
2004/5
Aerobic
2004/5 2004/10a
Figure 2 Comparison of E2 degradation rate between water (BW/OW) and sediment
48
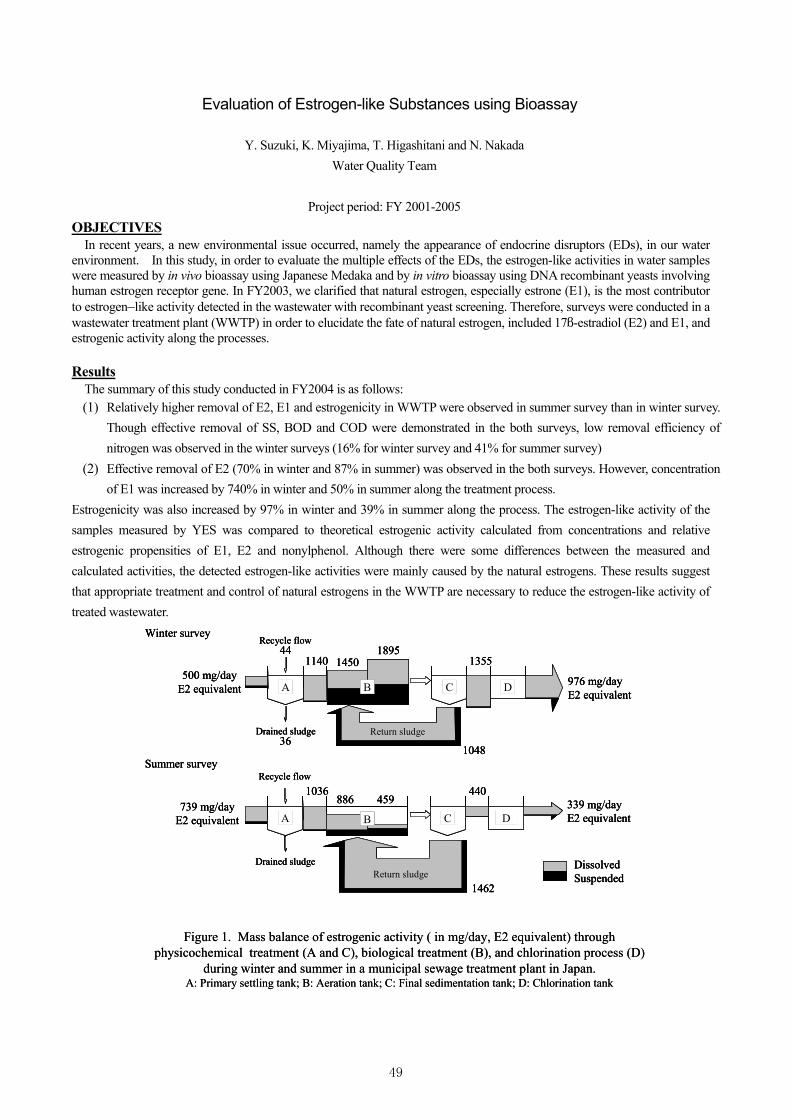
Evaluation of Estrogen-like Substances using Bioassay
Y. Suzuki, K. Miyajima, T. Higashitani and N. Nakada Water Quality Team
Project period: FY 2001-2005
OBJECTIVES In recent years, a new environmental issue occurred, namely the appearance of endocrine disruptors (EDs), in our water
environment. In this study, in order to evaluate the multiple effects of the EDs, the estrogen-like activities in water samples were measured by in vivo bioassay using Japanese Medaka and by in vitro bioassay using DNA recombinant yeasts involving human estrogen receptor gene. In FY2003, we clarified that natural estrogen, especially estrone (E1), is the most contributor to estrogen–like activity detected in the wastewater with recombinant yeast screening. Therefore, surveys were conducted in a wastewater treatment plant (WWTP) in order to elucidate the fate of natural estrogen, included 17β-estradiol (E2) and E1, and estrogenic activity along the processes. Results
The summary of this study conducted in FY2004 is as follows: (1) Relatively higher removal of E2, E1 and estrogenicity in WWTP were observed in summer survey than in winter survey.
Though effective removal of SS, BOD and COD were demonstrated in the both surveys, low removal efficiency of nitrogen was observed in the winter surveys (16% for winter survey and 41% for summer survey)
(2) Effective removal of E2 (70% in winter and 87% in summer) was observed in the both surveys. However, concentration of E1 was increased by 740% in winter and 50% in summer along the treatment process.
Estrogenicity was also increased by 97% in winter and 39% in summer along the process. The estrogen-like activity of the samples measured by YES was compared to theoretical estrogenic activity calculated from concentrations and relative estrogenic propensities of E1, E2 and nonylphenol. Although there were some differences between the measured and calculated activities, the detected estrogen-like activities were mainly caused by the natural estrogens. These results suggest that appropriate treatment and control of natural estrogens in the WWTP are necessary to reduce the estrogen-like activity of treated wastewater.
A C D
A C D
DissolvedSuspended
500 mg/day E2 equivalent
976 mg/day E2 equivalent
739 mg/day E2 equivalent
339 mg/day E2 equivalent
Winter survey
Summer survey
Return sludgeDrained sludge
Recycle flow
Return sludgeDrained sludge
Recycle flow
11401895
1355
1048
1036459
440
1462
B
1450
B
886
44
36
Figure 1. Mass balance of estrogenic activity ( in mg/day, E2 equivalent) through physicochemical treatment (A and C), biological treatment (B), and chlorination process (D)
during winter and summer in a municipal sewage treatment plant in Japan. A: Primary settling tank; B: Aeration tank; C: Final sedimentation tank; D: Chlorination tank
A C D
A C D
DissolvedSuspended
500 mg/day E2 equivalent
976 mg/day E2 equivalent
739 mg/day E2 equivalent
339 mg/day E2 equivalent
Winter survey
Summer survey
Return sludgeDrained sludge
Recycle flow
Return sludgeDrained sludge
Recycle flow
11401895
1355
1048
1036459
440
1462
B
1450
B
886
44
36
A C D
A C D
DissolvedSuspended
500 mg/day E2 equivalent
976 mg/day E2 equivalent
739 mg/day E2 equivalent
339 mg/day E2 equivalent
Winter survey
Summer survey
Return sludgeDrained sludge
Recycle flow
Return sludgeDrained sludge
Recycle flow
11401895
1355
1048
1036459
440
1462
B
1450
B
886
44
36
Figure 1. Mass balance of estrogenic activity ( in mg/day, E2 equivalent) through physicochemical treatment (A and C), biological treatment (B), and chlorination process (D)
during winter and summer in a municipal sewage treatment plant in Japan. A: Primary settling tank; B: Aeration tank; C: Final sedimentation tank; D: Chlorination tank
49

EVALUATION OF THE WATER ENVIRONMENT IN KANTO REGION
Yutaka SUZUKI, Jun TSUMORI, Kiyoshi MIYAJIMA Tadashi Higashitani,, Naoyuki Yamashita
Water Quality Research Team, Water Environment Research Group
Independent Administrative Institution Public Works Research Institute Project period: FY 2001-2005
OBJECTIVES
The aims of this study are to evaluate current water quality from the view point of the water environment, and to collect useful data of watersheds and water quality to preserve the water environment in Kanto region. For these purposes, we investigated water quantity and water quality of the rivers, their relation to their watershed conditions, the influence of estrogen-like substances on fish by using exposure tests, and the influence of nutrients on eutrophication of rivers by using algal growth potential test. Results
The summary of this study conducted in FY2004 is as follows: (1) Some river samples showed toxicity in algal growth inhibition test from the end of April to the middle of May, but
pesticides could not be detected in those samples. (2) AGP map in Tone River was obtained during the period without rainfall in summer and winter. (3) The on-site exposure system of Medaka fish (Oryzias latipes) with water temperature control was improved, which
enabled experiments in various sites under the same exposure condition.
Figure AGP map in Tone River in August of 2004
AGP (1×10⁶ cells/mL)
AGP (5×10⁶ cells/mL)
水郷大橋
河口堰
銚子大橋
金江津取手
須賀
木下
関宿橋
野田橋
流山橋
新葛飾橋
市川橋
掛馬沖
高崎沖
玉造沖
湖心
麻生沖
武井沖
釜谷沖
神宮橋潮来
栗橋利根大堰
刀水橋坂東大橋
芽吹橋
上武大橋
手賀大橋
三谷橋
黒子橋
豊原橋
川又橋
鬼怒川橋
平方
川島橋
上平橋
養蚕橋
大道泉橋
豊水橋
内匠橋
飯塚橋
槐戸橋
高砂橋
三国橋
新開橋巴波橋
小貝川
巴波川
鬼怒川
渡良瀬川
文巻橋
波崎
息栖
利根川
綾瀬川
霞ヶ浦
北浦
荒川
水郷大橋
河口堰
銚子大橋
金江津取手
須賀
木下
関宿橋
野田橋
流山橋
新葛飾橋
市川橋
掛馬沖
高崎沖
玉造沖
湖心
麻生沖
武井沖
釜谷沖
神宮橋潮来
栗橋利根大堰
刀水橋坂東大橋
芽吹橋
上武大橋
手賀大橋
三谷橋
黒子橋
豊原橋
川又橋
鬼怒川橋
平方
川島橋
上平橋
養蚕橋
大道泉橋
豊水橋
内匠橋
飯塚橋
槐戸橋
高砂橋
三国橋
新開橋巴波橋
小貝川
巴波川
鬼怒川
渡良瀬川
文巻橋
波崎
息栖
利根川
綾瀬川
霞ヶ浦
北浦
荒川
(b) 2004年8月3日
図 利根川流域における の分布
50
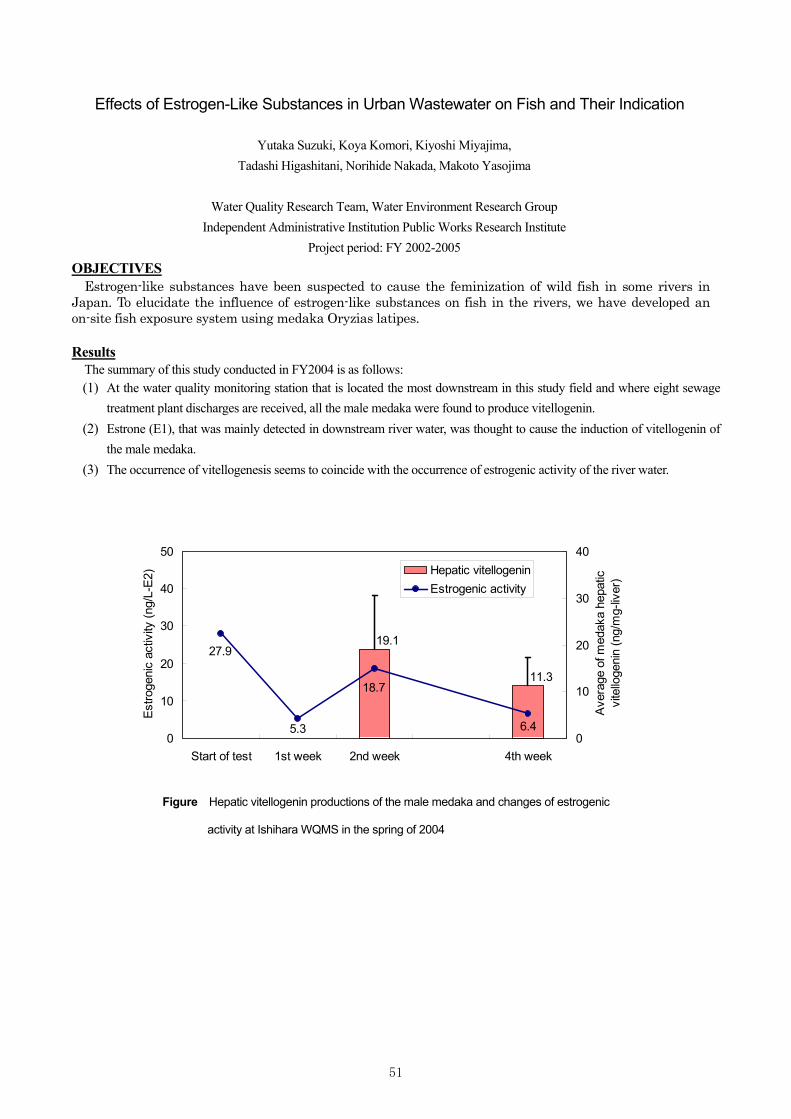
Effects of Estrogen-Like Substances in Urban Wastewater on Fish and Their Indication
Yutaka Suzuki, Koya Komori, Kiyoshi Miyajima, Tadashi Higashitani, Norihide Nakada, Makoto Yasojima
Water Quality Research Team, Water Environment Research Group
Independent Administrative Institution Public Works Research Institute Project period: FY 2002-2005
OBJECTIVES Estrogen-like substances have been suspected to cause the feminization of wild fish in some rivers in
Japan. To elucidate the influence of estrogen-like substances on fish in the rivers, we have developed an on-site fish exposure system using medaka Oryzias latipes. Results
The summary of this study conducted in FY2004 is as follows: (1) At the water quality monitoring station that is located the most downstream in this study field and where eight sewage
treatment plant discharges are received, all the male medaka were found to produce vitellogenin. (2) Estrone (E1), that was mainly detected in downstream river water, was thought to cause the induction of vitellogenin of
the male medaka. (3) The occurrence of vitellogenesis seems to coincide with the occurrence of estrogenic activity of the river water.
Figure Hepatic vitellogenin productions of the male medaka and changes of estrogenic
activity at Ishihara WQMS in the spring of 2004
11.3
19.1
6.4
18.7
5.3
27.9
0
10
20
30
40
50
Start of test 1st week 2nd week 4th week
Estro
geni
c ac
tivity
(ng/
L-E2
)
0
10
20
30
40
Ave
rage
of m
edak
a he
patic
vite
lloge
nin
(ng/
mg-
liver
)
Hepatic vitellogeninEstrogenic activity
51

Detection of Environmental Stresses on Aquatic Organisms Using Gene Analysis Technology
Yutaka Suzuki, Kiyoshi Miyajima, Naoyuki Yamashita and Tadashi Higashitani
Water Quality Team Project period : FY 2002-2006
OBJECTIVES Some stresses, which are caused by chemical substances, may not be detected with traditional bioassay methods. Nowadays, a method that can be used to analyze and evaluate the influences of such chemicals in gene levels has been developed. However, this method is mainly used in the medical field. In this study, we attempted to apply this method to the environmental field for evaluation of the chemical impacts on aquatic organisms present in rivers or streams. RESULTS IntelliGene Cyano CHIP Ver.2.0 (Takara Bio Inc.), in which genes of cyanobacteria Synechocystis sp. (PCC6803) was fixed, was used to evaluate the chemical impacts on the aquatic oraganism. Effects of chemicals such as herbicide, pharmaceutical, surfactant and heavy metal on the organism were evaluated with the Cyano CHIP. The major results obtained in FY 2004 are as follow: (1) RNA extracted from Synechocystis sp. cells was analyzed to check the quality of RNA samples by capillary electrophoresis. As a result, the two clear peaks of 16s and 23s ribosomal RNA of prokaryote were detected. Then, it is confirmed that RNA required for the DNA microarray analysis was sufficiently extracted in this experiment. (2) Cyanobacterium Synechocystis sp., which was cultivating with BG-11 medium, was exposed to herbicide DCMU, antibacterial agent clarithromycin, surfactant LAS, heavy metal zinc and STP (Sewage Treatment Plant) efflutnt sample. Gene expression by exposure to the chemicals was analyzed by DNA microarray using the the Cyano CHIP Ver2.0. As a result, variation of gene expression was not observed for the samples exposed to the DCMU, LAS, Zn and STP effluent compared with unexposed control sample. Meanwhile, significant variation of gene expression pattern was observed for the sample exposed to the antibacterial agent clarithromycin, suggesting that gene expression of Synechocystis sp. will be affected by exposure to the antibacterial agent.
(b) Clarithromycin
1
10
100
1000
10000
100000
1 10 100 1000 10000 100000
Cy3 Signal Intensity
Cy5
Sig
nal I
nten
sity
(c) LAS
1
10
100
1000
10000
100000
1 10 100 1000 10000 100000
Cy3 Signal Intensity
Cy5
Sig
nal I
nten
sity
Figure 1. Gene expression analysis of Synechocystis sp. by DNA microarray
52
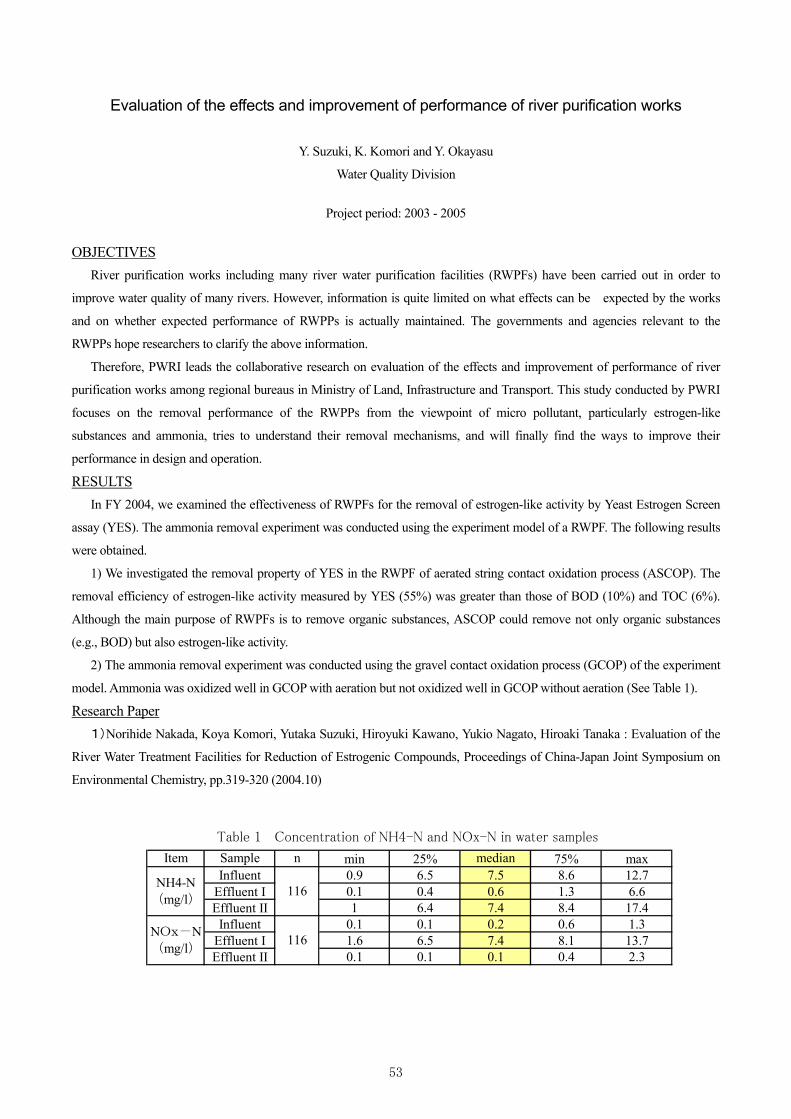
Evaluation of the effects and improvement of performance of river purification works
Y. Suzuki, K. Komori and Y. Okayasu
Water Quality Division
Project period: 2003 - 2005
OBJECTIVES River purification works including many river water purification facilities (RWPFs) have been carried out in order to
improve water quality of many rivers. However, information is quite limited on what effects can be expected by the works
and on whether expected performance of RWPPs is actually maintained. The governments and agencies relevant to the
RWPPs hope researchers to clarify the above information.
Therefore, PWRI leads the collaborative research on evaluation of the effects and improvement of performance of river
purification works among regional bureaus in Ministry of Land, Infrastructure and Transport. This study conducted by PWRI
focuses on the removal performance of the RWPPs from the viewpoint of micro pollutant, particularly estrogen-like
substances and ammonia, tries to understand their removal mechanisms, and will finally find the ways to improve their
performance in design and operation.
RESULTS In FY 2004, we examined the effectiveness of RWPFs for the removal of estrogen-like activity by Yeast Estrogen Screen
assay (YES). The ammonia removal experiment was conducted using the experiment model of a RWPF. The following results
were obtained.
1) We investigated the removal property of YES in the RWPF of aerated string contact oxidation process (ASCOP). The
removal efficiency of estrogen-like activity measured by YES (55%) was greater than those of BOD (10%) and TOC (6%).
Although the main purpose of RWPFs is to remove organic substances, ASCOP could remove not only organic substances
(e.g., BOD) but also estrogen-like activity.
2) The ammonia removal experiment was conducted using the gravel contact oxidation process (GCOP) of the experiment
model. Ammonia was oxidized well in GCOP with aeration but not oxidized well in GCOP without aeration (See Table 1).
Research Paper 1)Norihide Nakada, Koya Komori, Yutaka Suzuki, Hiroyuki Kawano, Yukio Nagato, Hiroaki Tanaka : Evaluation of the
River Water Treatment Facilities for Reduction of Estrogenic Compounds, Proceedings of China-Japan Joint Symposium on
Environmental Chemistry, pp.319-320 (2004.10)
Item Sample n min 25% median 75% maxInfluent 0.9 6.5 7.5 8.6 12.7
Effluent I 0.1 0.4 0.6 1.3 6.6Effluent II 1 6.4 7.4 8.4 17.4
Influent 0.1 0.1 0.2 0.6 1.3Effluent I 1.6 6.5 7.4 8.1 13.7Effluent II 0.1 0.1 0.1 0.4 2.3
116
116
Table 1 Concentration of NH4-N and NOx-N in water samples
NH4-N(mg/l)
NOx-N(mg/l)
53

Utilization research of the monitoring technology in the measure against dioxin of river sediment
Y. Suzuki and K. Komori
Water Quality Division
Project period: 2003 - 2005
OBJECTIVES In recent years, the pollution by dioxines (DXNs) including tetra- through octa-chlorodibenzo-p-dioxins (PCDDs), tetra-
through octa-chlorodibenzofurans (PCDFs), and coplanar polychlorobiphenyls (Co-PCBs) has become a major nationwide
problem, as dioxins have high toxicity even in trace concentrations. It is necessary to take suitable countermeasures to dioxin
with establishment of the Law Concerning Special Measures Against Dioxins (Law No. 105 of 1999). Based on the Dioxins
Law, the sediment quality standard (150pg-TEQ/g) was stipulated on July 22, 2002. When sediment exceeding the standard is
found, the contaminated area will be identified through surveys around there, and then remedial measures such as dredging
will be conducted. It is expected that the number of samples for investigating contaminated area increases. It is necessary to
develop a quicker analysis method and continuous monitoring technology.
In this research, development of simpler detection technologies which use such as the enzyme-linked immunosorbent
assay method and a continuous monitoring technology is attempted.
RESULTS In FY 2004, we applied a simple detection technology to the dioxin pollution spot and evaluated its applicability. The
following result was obtained.
1) The method tested was quadropole gas chromatography mass spectrometry (Q-pole GC/MS) that was focusing on
2,3,7,8,-TeCDF. The Q-pole GC/MS method was applied to a survey at a small river. The obtained values of Q-pole GC/MS
method differed from those measured by the standard method for samples below 150 pg-TEQ/g, but, both values became
closer for samples over 300 pg-TEQ/g (See Figure 1 and 2). Therefore, a simple detection technology such as Q-pole GC/MS
method is applicable to such surveys as to know the high concentration pollution area.
Research Paper 1) K. Komori, H. Tanaka, M. Yasojima, M. Minamiyama, Y. Suzuki, Y. Miyake, M. Kato, K. Urano, Applicability of
inexpensive and rapid analytical methods for dioxins in river sediment, The Society of Environmental Instrumentation Control
and Automation, Vol.9, No.2, pp.133-140, 2004 (in Japanese)
2) K. Komori, H. Tanaka, M. Yasojima, Y. Suzuki, Simple analytical method for dioxins in river sediments by Q-pole GC/MS,
Proceedings of the 41st Environmental Engineering Forum, pp.107-109, 2004 (in Japanese)
54
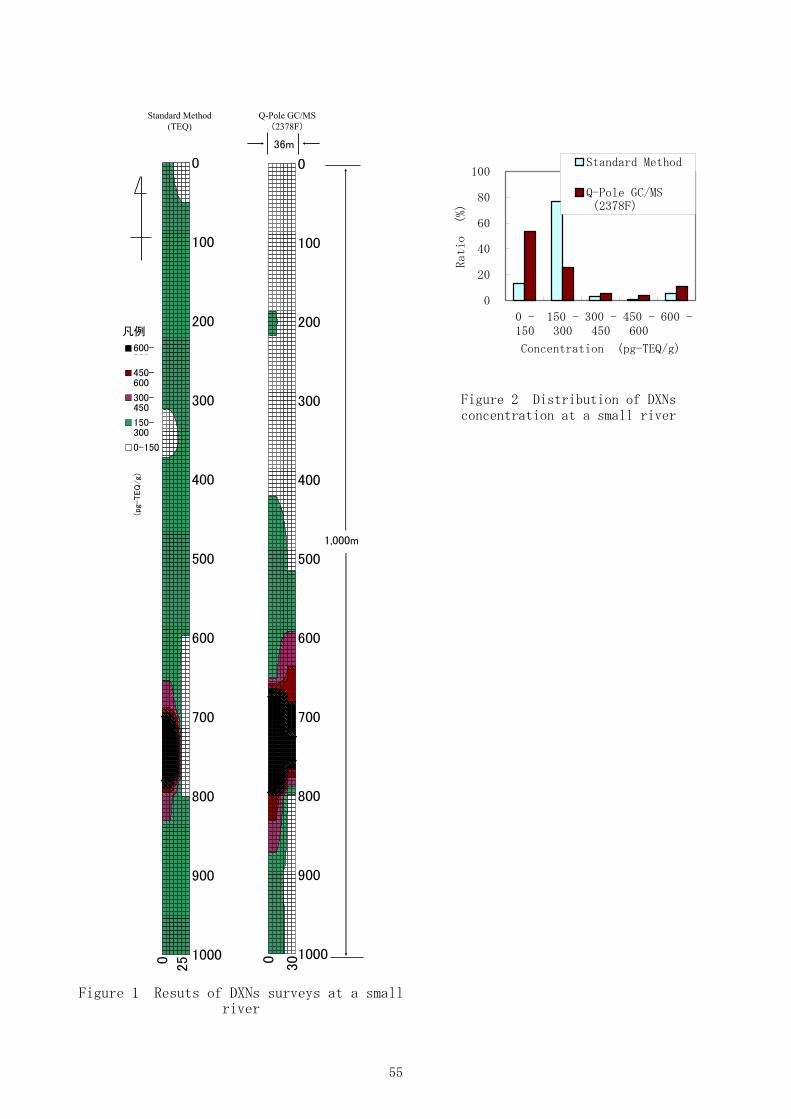
Q-Pole GC/MS(2378F)
Figure 1 Resuts of DXNs surveys at a smallriver
Standard Method(TEQ)
0
301000
900
800
700
600
500
400
300
200
100
00
25 1000
900
800
700
600
500
400
300
200
100
0
600-750
450-600
300-450
150-300
0-150
1,000m
凡例
(pg-TEQ/g)
36m
Figure 2 Distribution of DXNsconcentration at a small river
0
20
40
60
80
100
0 -150
150 -300
300 -450
450 -600
600 -
Concentration (pg-TEQ/g)
Ratio
(%)
Standard Method
Q-Pole GC/MS(2378F)
55

Evaluation of Ecotoxicological Effects of Chemicals in Aqantic Environment
Yutaka Suzuki, Koya Komori, Kiyoshi Miyajima and Naoyuki Yamashita
Water Quality Team Project period : FY 2003-2007
OBJECTIVES In recent years, various kinds of chemicals are used widely, according to the progress of industry. It has been reported that various chemicals such as pesticide and endocrine disrupter exist in waste, sewage treatment and river water. From these backgrounds, the purpose of this study is to investigate the effects of chemicals to organisms in the aquatic environment. RESULTS The summary of this study conducted in FY2004 is as follows. (1) Bioassays were conducted to evaluate the ecotoxicological effects of pharmaceuticals discharged into water environment on aquatic organisms. Antibacterial agent, Levofloxacin (LVFX) and Clarithromycin (CAM), which were popular antibiotics in Japan, were selected as pharmaceuticals tested in this research. Algal growth inhibition test using green alga Pseudokirchneriella subcapitata (NIES-35) was conducted. As a result, EC50, LOEC and NOEC were 1,200 μg/L, 630 μg/L, 310 μg/L for LVFX and were 11 μg/L, 6.3 μg/L, 3.1 μg/L for CAM, respectively. Toxicity of CAM was considered to be about 100 times higher than that of LVFX. (2) Ecological risk assessment of LVFX and CAM was conducted with comparison between predicted no-effect concentration (PNEC) and predicted environmental concentration (PEC). As a result, PEC for the LVFX was always to be lower than PNEC. But PEC for the CAM was to be higher than PNEC when dilution ratio of CAM in waters is less than 20 times. Considering the ratio of PEC/PNEC, it was evaluated that LVFX had no risk and CAM had risk depending on the dilution ratio. Therefore, it will be necessary to pay attention to the impact of CAM discharged into rivers and streams on the aquatic ecosystem.
0
20
40
60
80
100
120
10 100 1000 10000
Levofloxacin concentration (μg/L)
Inhi
bitio
n ( %
)
0
20
40
60
80
100
120
0.1 1 10 100
Clarithromycin concentration (μg/L)
Inhi
bitio
n ( %
)
Figure 1. Results of algal growth inhibition assay for Levofloxacin (LVFX) and Clarithromycin (CAM)
56
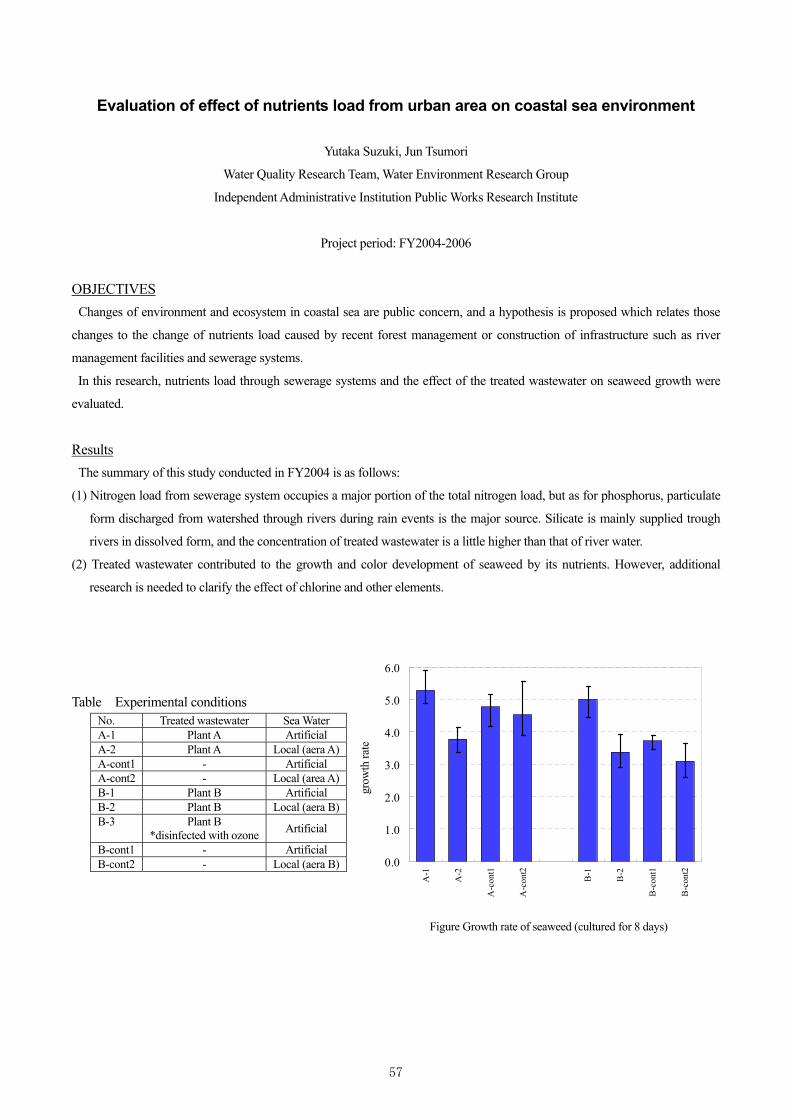
Evaluation of effect of nutrients load from urban area on coastal sea environment
Yutaka Suzuki, Jun Tsumori
Water Quality Research Team, Water Environment Research Group
Independent Administrative Institution Public Works Research Institute
Project period: FY2004-2006 OBJECTIVES Changes of environment and ecosystem in coastal sea are public concern, and a hypothesis is proposed which relates those
changes to the change of nutrients load caused by recent forest management or construction of infrastructure such as river
management facilities and sewerage systems.
In this research, nutrients load through sewerage systems and the effect of the treated wastewater on seaweed growth were
evaluated. Results The summary of this study conducted in FY2004 is as follows:
(1) Nitrogen load from sewerage system occupies a major portion of the total nitrogen load, but as for phosphorus, particulate
form discharged from watershed through rivers during rain events is the major source. Silicate is mainly supplied trough
rivers in dissolved form, and the concentration of treated wastewater is a little higher than that of river water.
(2) Treated wastewater contributed to the growth and color development of seaweed by its nutrients. However, additional
research is needed to clarify the effect of chlorine and other elements.
Table Experimental conditions No. Treated wastewater Sea Water A-1 Plant A Artificial A-2 Plant A Local (aera A)A-cont1 - Artificial A-cont2 - Local (area A)B-1 Plant B Artificial B-2 Plant B Local (aera B)B-3 Plant B
*disinfected with ozone Artificial
B-cont1 - Artificial B-cont2 - Local (aera B)
0.0
1.0
2.0
3.0
4.0
5.0
6.0
A-1
A-2
A-c
ont1
A-c
ont2
B-1
B-2
B-c
ont1
B-c
ont2
成長
比
Figure Growth rate of seaweed (cultured for 8 days)
grow
th ra
te
57

──────────────────────────── TECHNICAL NOTE of NILIM No.280 December 2005
TECHNICAL NOTE of PWRI No.3990 December 2005
© National Institute for Land and Infrastructure Management © Public Works Research Institute
────────────────────────────
Research Administration and Evaluation Division, Planning and Research Administration Department,
National Institute for Land and Infrastructure Management Ministry of Land, Infrastructure and Transport, Japan
Asahi 1, Tsukuba, Ibaraki 305-0804, Japan Phone: +81-29-864-2675
Facilities Management and Research Information Division, Planning and Research Administration Department,
Incorporated Administrative Agency Public Works Research Institute 1-6, Minamihara, Tsukuba, Ibaraki 305-8516, Japan
Phone: +81-29-879-6754