Embed Size (px)
Citation preview
Ingenia Communities Group 26 August 2014
New homes at Mudgee Tourist and Van Resort, NSW
FY14 Annual Results Presentation
A leading provider of
affordable Australian seniors housing built
around two key portfolios generating quality
recurrent operating cashflows.
This scaleable platform is well positioned
for further expansion through embedded
capital light low risk development and
further accretive acquisitions.
Ingenia today
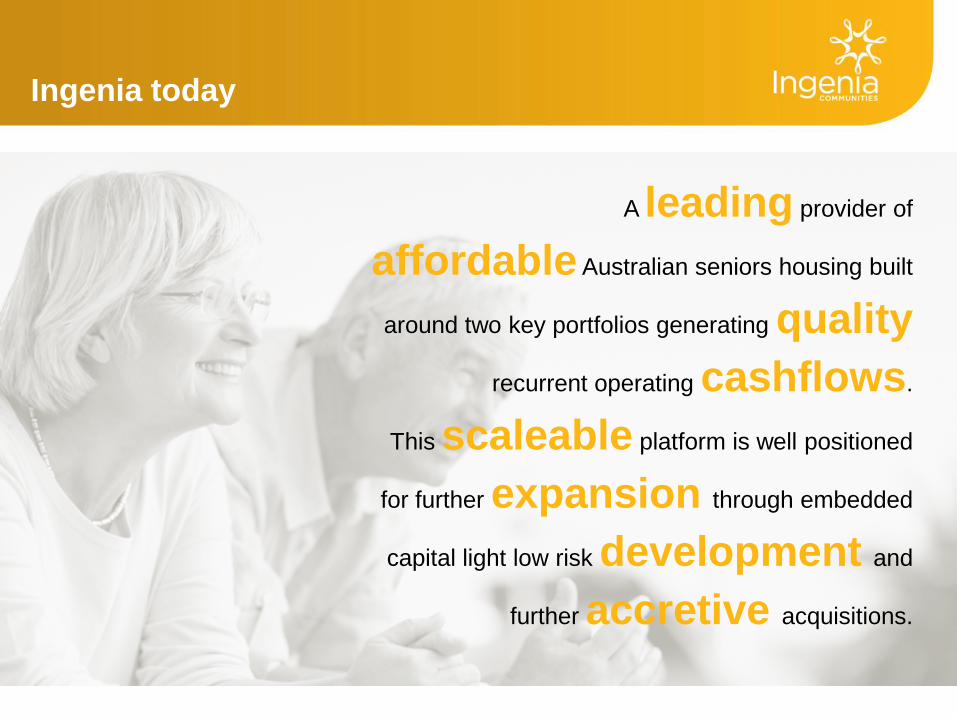
Financial highlights
p3
► Total segment revenue up 49% to $49 million
► Underlying profit up 97%, to $11.6 million
► Active Lifestyle Estates contributed $3.9 million (21% of Portfolio EBIT) in first full year
► Garden Villages EBIT contribution up 28.6%
► Underlying profit EPS up 50% to 1.8 cents
► Operating cashflow up 27%, driven by rental yields and emerging development profits
► Full year distribution of 1.15 cents per security, up 15%
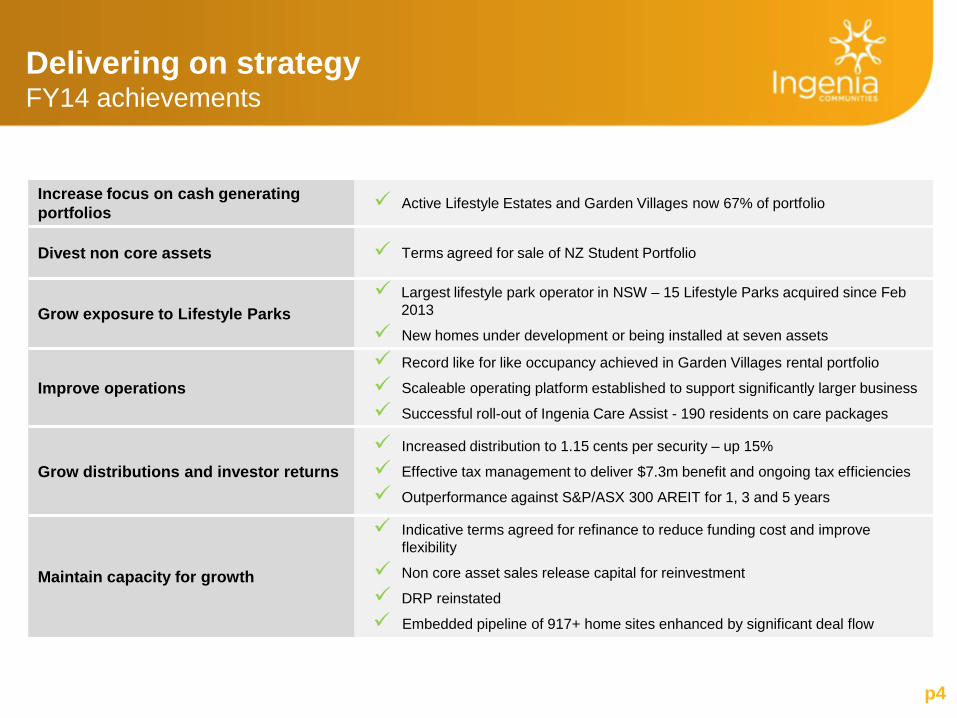
Delivering on strategy FY14 achievements
p4
Increase focus on cash generating portfolios Active Lifestyle Estates and Garden Villages now 67% of portfolio
Divest non core assets Terms agreed for sale of NZ Student Portfolio
Grow exposure to Lifestyle Parks Largest lifestyle park operator in NSW – 15 Lifestyle Parks acquired since Feb
2013
New homes under development or being installed at seven assets
Improve operations Record like for like occupancy achieved in Garden Villages rental portfolio
Scaleable operating platform established to support significantly larger business
Successful roll-out of Ingenia Care Assist - 190 residents on care packages
Grow distributions and investor returns Increased distribution to 1.15 cents per security – up 15%
Effective tax management to deliver $7.3m benefit and ongoing tax efficiencies
Outperformance against S&P/ASX 300 AREIT for 1, 3 and 5 years
Maintain capacity for growth
Indicative terms agreed for refinance to reduce funding cost and improve flexibility
Non core asset sales release capital for reinvestment
DRP reinstated
Embedded pipeline of 917+ home sites enhanced by significant deal flow
Garden Villages
44%
NZ Students
15%
DMF 35%
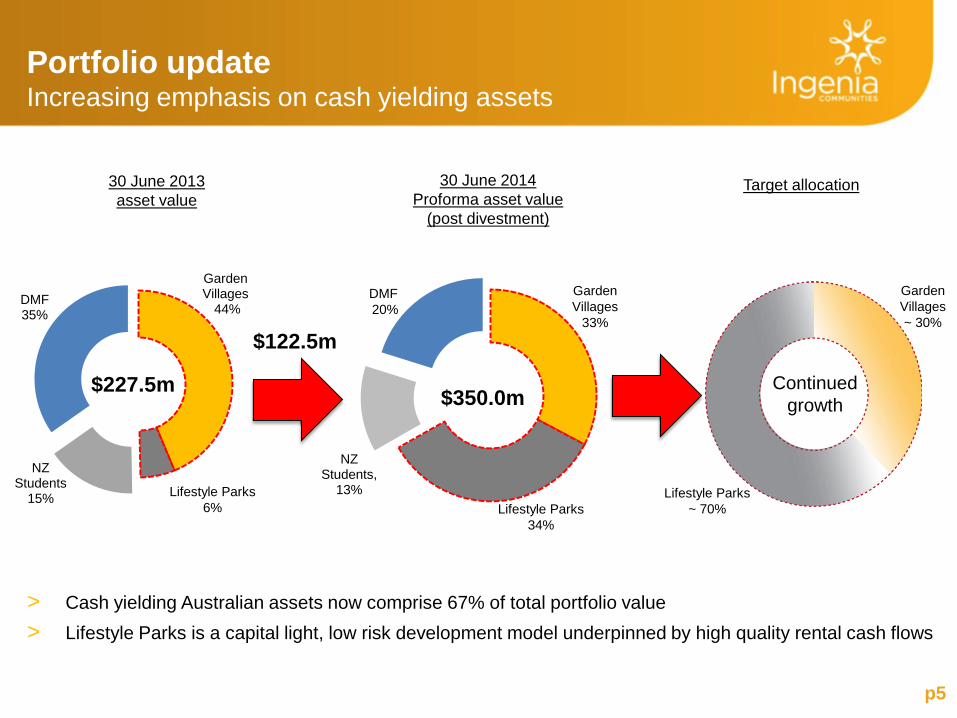
Portfolio update Increasing emphasis on cash yielding assets
p5
30 June 2013 asset value
> Cash yielding Australian assets now comprise 67% of total portfolio value > Lifestyle Parks is a capital light, low risk development model underpinned by high quality rental cash flows
30 June 2014 Proforma asset value
(post divestment)
$122.5m
$227.5m
Lifestyle Parks 6%
Target allocation
Garden Villages ~ 30%
Lifestyle Parks ~ 70%
NZ Students,
13%
Garden Villages
33%
$350.0m
DMF 20%
Lifestyle Parks 34%
Continued growth
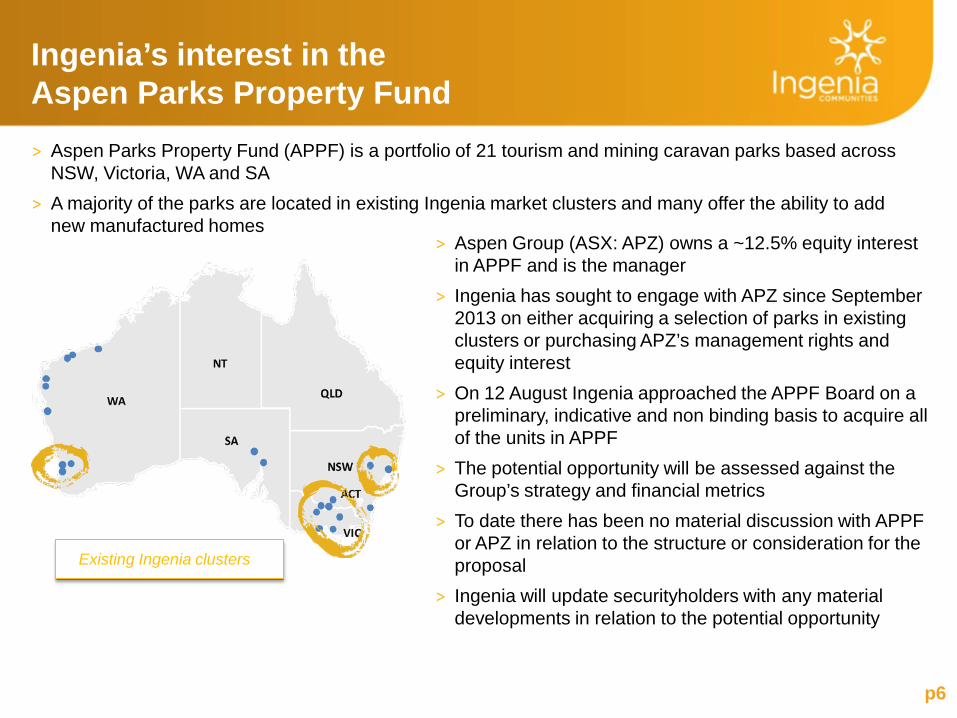
Ingenia’s interest in the Aspen Parks Property Fund
p6
> Aspen Group (ASX: APZ) owns a ~12.5% equity interest in APPF and is the manager
> Ingenia has sought to engage with APZ since September 2013 on either acquiring a selection of parks in existing clusters or purchasing APZ’s management rights and equity interest
> On 12 August Ingenia approached the APPF Board on a preliminary, indicative and non binding basis to acquire all of the units in APPF
> The potential opportunity will be assessed against the Group’s strategy and financial metrics
> To date there has been no material discussion with APPF or APZ in relation to the structure or consideration for the proposal
> Ingenia will update securityholders with any material developments in relation to the potential opportunity
> Aspen Parks Property Fund (APPF) is a portfolio of 21 tourism and mining caravan parks based across NSW, Victoria, WA and SA
> A majority of the parks are located in existing Ingenia market clusters and many offer the ability to add new manufactured homes
Existing Ingenia clusters
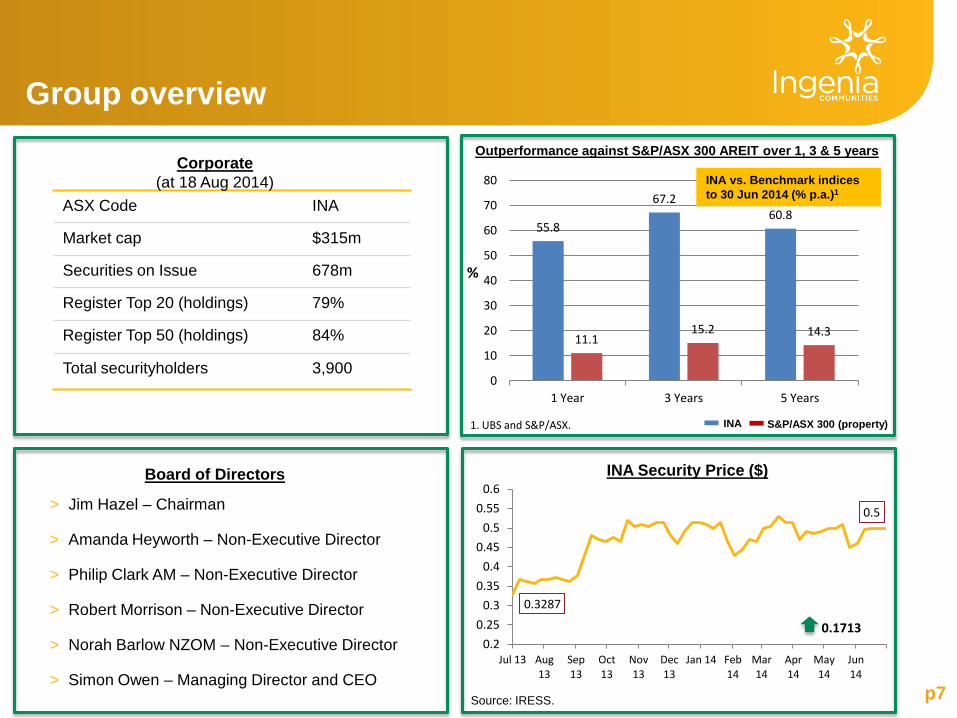
Outperformance against S&P/ASX 300 AREIT over 1, 3 & 5 years
p7
Group overview
Board of Directors
S&P/ASX 300 (property) INA
55.8
67.2 60.8
11.1 15.2 14.3
0
10
20
30
40
50
60
70
80
1 Year 3 Years 5 Years
INA vs. Benchmark indices to 30 Jun 2014 (% p.a.)1
1. UBS and S&P/ASX.
0.3287
0.5
0.2 0.25
0.3 0.35
0.4 0.45
0.5 0.55
0.6
Jul 13 Aug 13
Sep 13
Oct 13
Nov 13
Dec 13
Jan 14 Feb 14
Mar 14
Apr 14
May 14
Jun 14
INA Security Price ($)
%
0.1713
Source: IRESS.
ASX Code INA
Market cap $315m
Securities on Issue 678m
Register Top 20 (holdings) 79%
Register Top 50 (holdings) 84%
Total securityholders 3,900
Corporate (at 18 Aug 2014)
> Jim Hazel – Chairman
> Amanda Heyworth – Non-Executive Director
> Philip Clark AM – Non-Executive Director
> Robert Morrison – Non-Executive Director
> Norah Barlow NZOM – Non-Executive Director
> Simon Owen – Managing Director and CEO
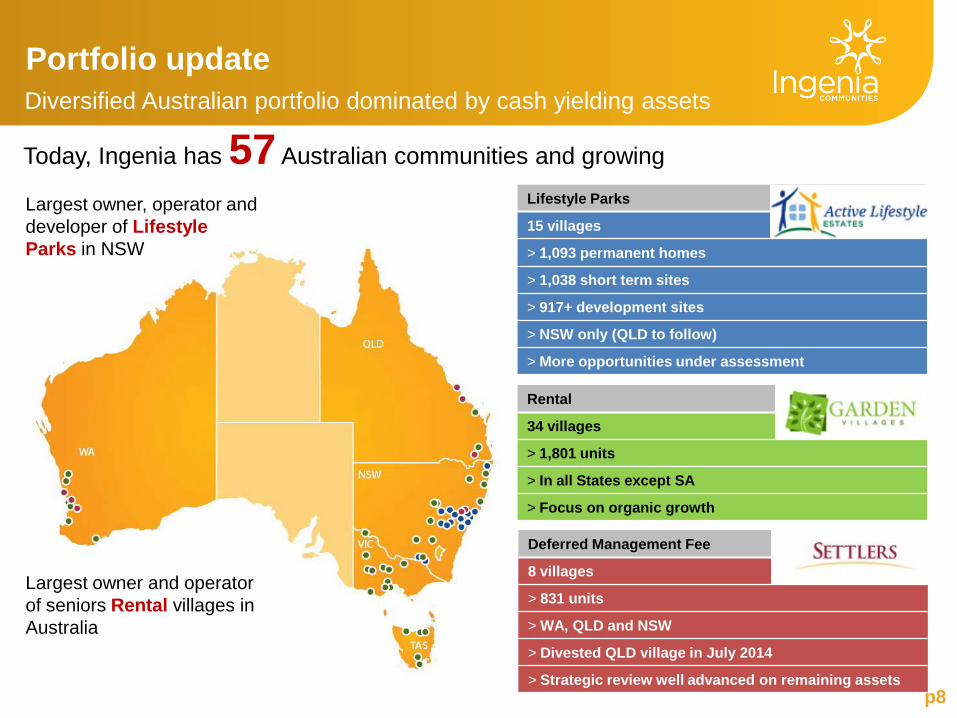
Rental
34 villages
> 1,801 units
> In all States except SA
> Focus on organic growth
Deferred Management Fee
8 villages
> 831 units
> WA, QLD and NSW
> Divested QLD village in July 2014
> Strategic review well advanced on remaining assets
Lifestyle Parks
15 villages
> 1,093 permanent homes
> 1,038 short term sites
> 917+ development sites
> NSW only (QLD to follow)
> More opportunities under assessment
Today, Ingenia has 57 Australian communities and growing
Largest owner, operator and developer of Lifestyle Parks in NSW
Largest owner and operator of seniors Rental villages in Australia
Portfolio update Diversified Australian portfolio dominated by cash yielding assets
p8
p9
Key financials
Pool at Drifters Village, Kingscliff NSW
Key financials
p10
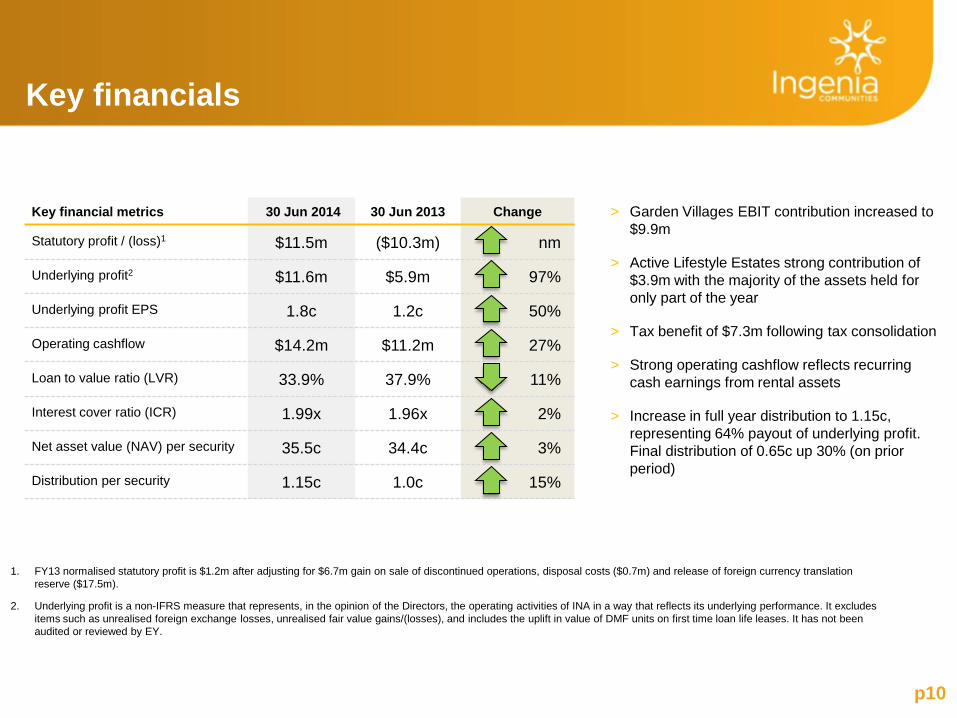
Key financial metrics 30 Jun 2014 30 Jun 2013 Change
Statutory profit / (loss)1 $11.5m ($10.3m) nm
Underlying profit2 $11.6m $5.9m 97%
Underlying profit EPS
1.8c 1.2c 50%
Operating cashflow $14.2m $11.2m 27%
Loan to value ratio (LVR) 33.9% 37.9% 11%
Interest cover ratio (ICR) 1.99x 1.96x 2%
Net asset value (NAV) per security
35.5c 34.4c 3%
Distribution per security
1.15c 1.0c 15%
1. FY13 normalised statutory profit is $1.2m after adjusting for $6.7m gain on sale of discontinued operations, disposal costs ($0.7m) and release of foreign currency translation reserve ($17.5m).
2. Underlying profit is a non-IFRS measure that represents, in the opinion of the Directors, the operating activities of INA in a way that reflects its underlying performance. It excludes items such as unrealised foreign exchange losses, unrealised fair value gains/(losses), and includes the uplift in value of DMF units on first time loan life leases. It has not been audited or reviewed by EY.
> Garden Villages EBIT contribution increased to $9.9m
> Active Lifestyle Estates strong contribution of $3.9m with the majority of the assets held for only part of the year
> Tax benefit of $7.3m following tax consolidation
> Strong operating cashflow reflects recurring cash earnings from rental assets
> Increase in full year distribution to 1.15c, representing 64% payout of underlying profit. Final distribution of 0.65c up 30% (on prior period)

p11
Underlying profit FY14 (A$m)
FY13 (A$m) Comments (FY14)
Continuing operations - Garden Villages 9.9 7.7 Incremental contribution from acquired villages
combined with occupancy and rate growth - Settlers Lifestyle 4.5 5.6 Reduction due to some projects nearing
completion and minimal reinvestment - Active Lifestyle Estates 3.9 0.4 Part year contribution from 13 properties acquired
in FY14 Portfolio EBIT 18.3 13.7 Corporate costs (6.2) (4.8) Incremental costs from activating growth strategy EBIT – Continuing operations 12.1 8.9 Net finance costs (4.0) (5.5) Lower cost of debt and capital raised being
temporarily applied against debt Income tax benefit/(expense) 2.9 (0.1) Tax losses recognised following tax consolidation
Underlying profit – Continuing operations 11.0 3.3 Discontinued operations
- US Seniors 0.3 3.2 Residual escrows from US divestment - NZ Students 1.9 1.4 Rental recommencement following refurbishment
completion EBIT – Discontinued operations 2.2 4.6 Net finance costs (1.6) (2.0) Interest expense on NZ debt facility Underlying profit – Discontinued operations 0.6 2.6 Underlying profit - Total 11.6 5.9
Statutory adjustments (4.5) (16.6) Investment property valuation movement on Australian and NZ assets offset by unrealised FX gain
Tax benefit associated with adjustments 4.4 0.4 Resulting from tax consolidation
Statutory Profit/(Loss) 11.5 (10.3)
Underlying profit
p12
Capital management Improved yield and funding capacity
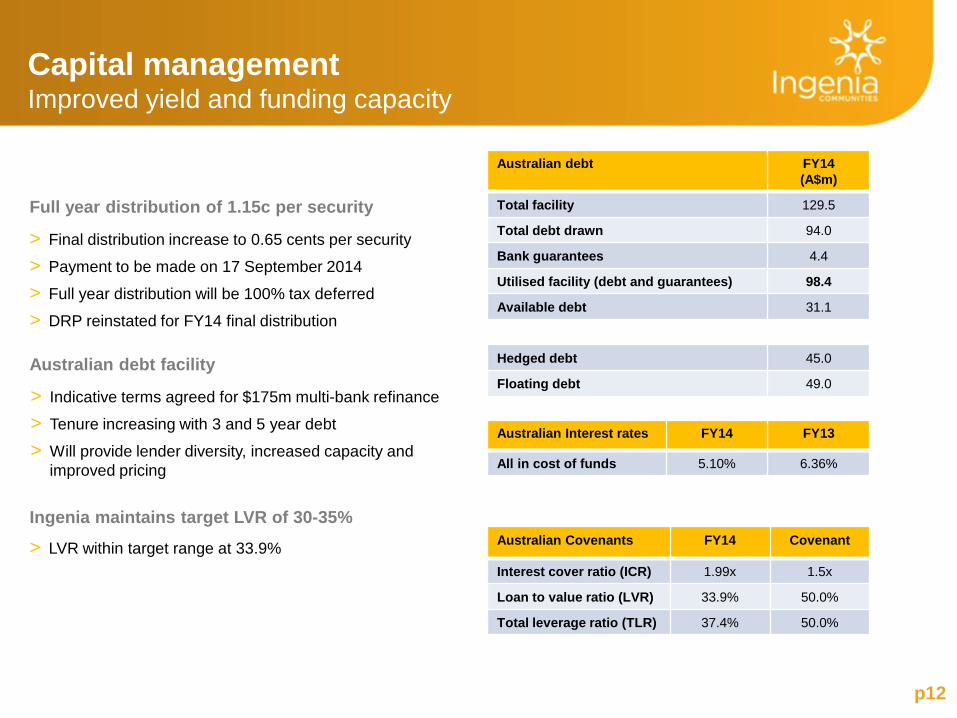
Australian debt FY14 (A$m)
Total facility 129.5
Total debt drawn 94.0
Bank guarantees 4.4
Utilised facility (debt and guarantees) 98.4
Available debt 31.1
Hedged debt 45.0
Floating debt 49.0
Australian Interest rates FY14 FY13
All in cost of funds 5.10% 6.36%
Australian Covenants FY14 Covenant
Interest cover ratio (ICR) 1.99x 1.5x
Loan to value ratio (LVR) 33.9% 50.0%
Total leverage ratio (TLR) 37.4% 50.0%
> LVR within target range at 33.9%
Australian debt facility
> Indicative terms agreed for $175m multi-bank refinance
> Tenure increasing with 3 and 5 year debt
> Will provide lender diversity, increased capacity and improved pricing
Ingenia maintains target LVR of 30-35%
Full year distribution of 1.15c per security
> Final distribution increase to 0.65 cents per security
> Payment to be made on 17 September 2014
> Full year distribution will be 100% tax deferred
> DRP reinstated for FY14 final distribution
p13
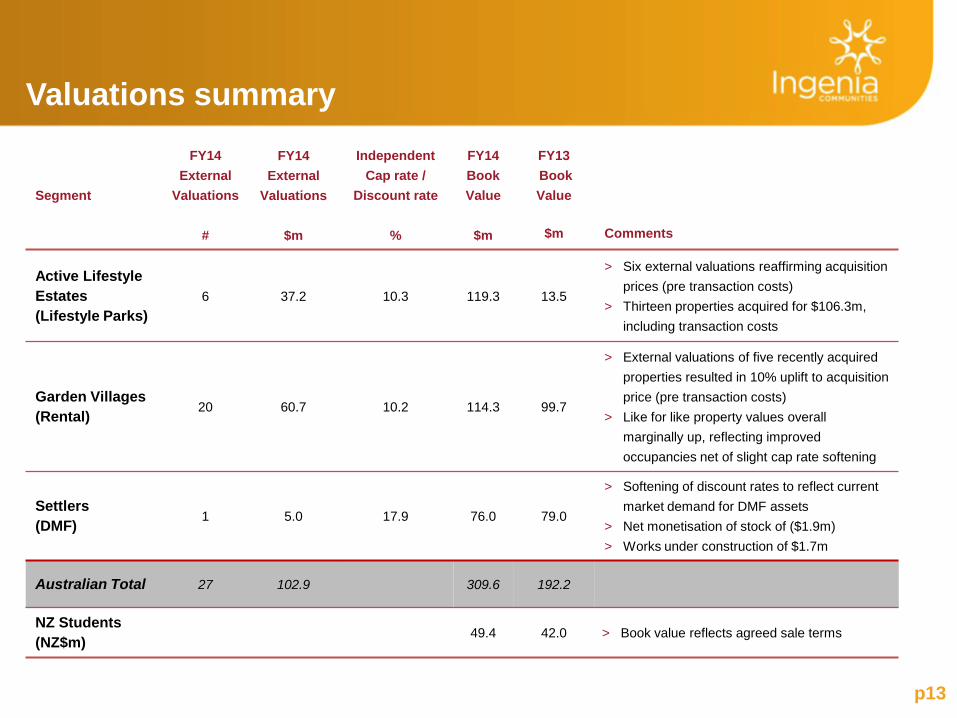
Valuations summary
Segment
FY14 External
Valuations #
FY14 External
Valuations
$m
Independent Cap rate /
Discount rate
%
FY14 Book Value
$m
FY13 Book Value
$m
Comments
Active Lifestyle Estates (Lifestyle Parks)
6 37.2 10.3 119.3 13.5
> Six external valuations reaffirming acquisition prices (pre transaction costs)
> Thirteen properties acquired for $106.3m, including transaction costs
Garden Villages (Rental) 20 60.7 10.2 114.3 99.7
> External valuations of five recently acquired properties resulted in 10% uplift to acquisition price (pre transaction costs)
> Like for like property values overall marginally up, reflecting improved occupancies net of slight cap rate softening
Settlers (DMF) 1 5.0 17.9 76.0 79.0
> Softening of discount rates to reflect current market demand for DMF assets
> Net monetisation of stock of ($1.9m) > Works under construction of $1.7m
Australian Total 27 102.9 309.6 192.2
NZ Students
(NZ$m) 49.4 42.0 > Book value reflects agreed sale terms
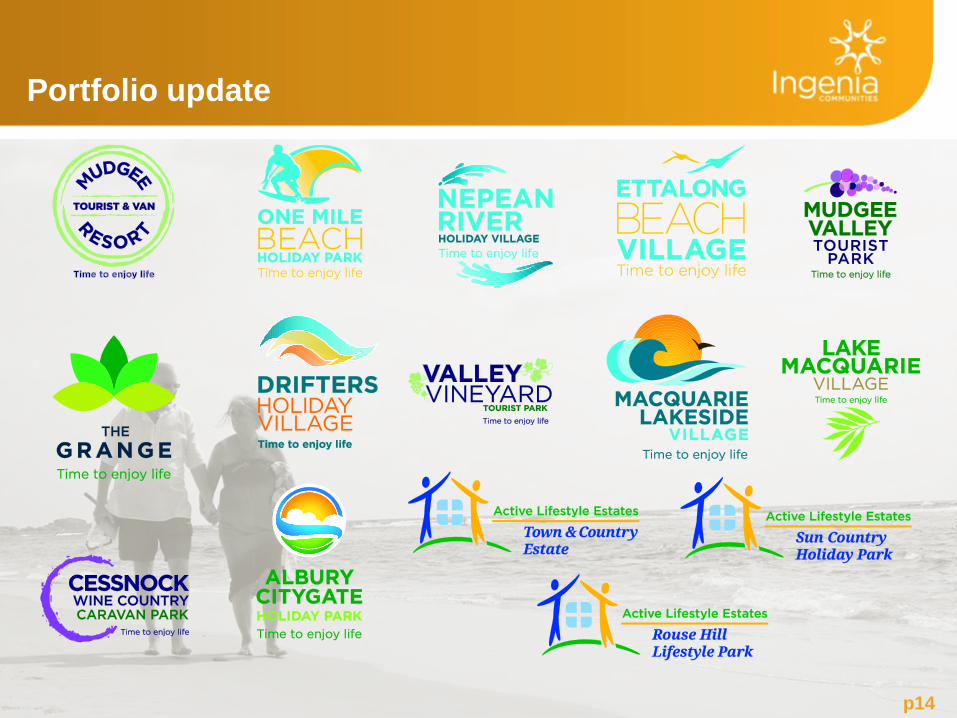
Portfolio update
p14
p15
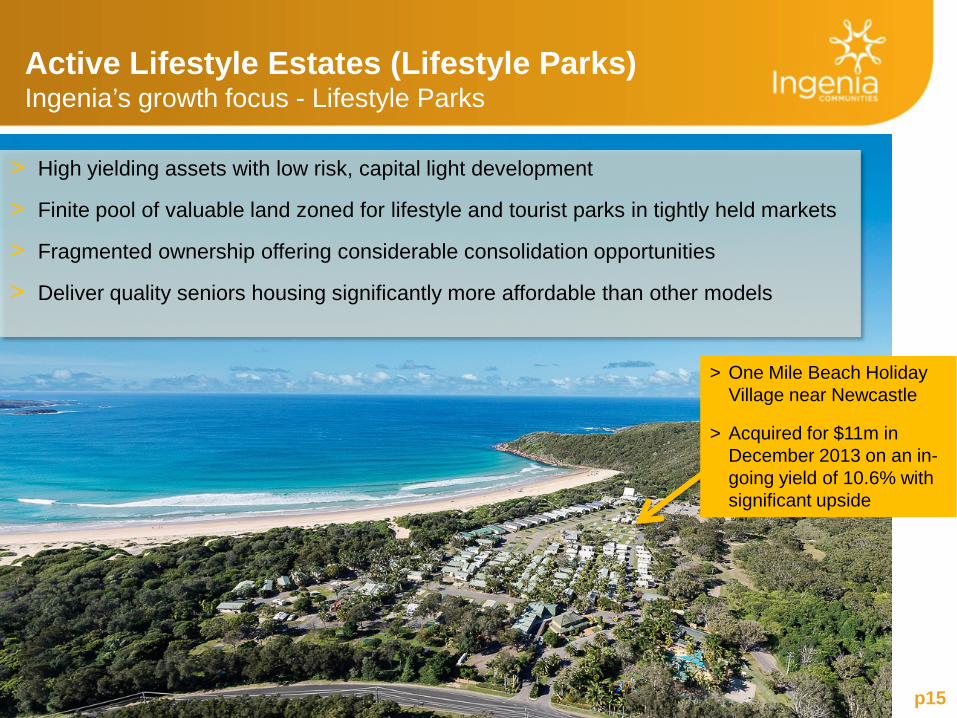
Active Lifestyle Estates (Lifestyle Parks) Ingenia’s growth focus - Lifestyle Parks
> One Mile Beach Holiday Village near Newcastle
> Acquired for $11m in December 2013 on an in-going yield of 10.6% with significant upside
> High yielding assets with low risk, capital light development
> Finite pool of valuable land zoned for lifestyle and tourist parks in tightly held markets
> Fragmented ownership offering considerable consolidation opportunities
> Deliver quality seniors housing significantly more affordable than other models
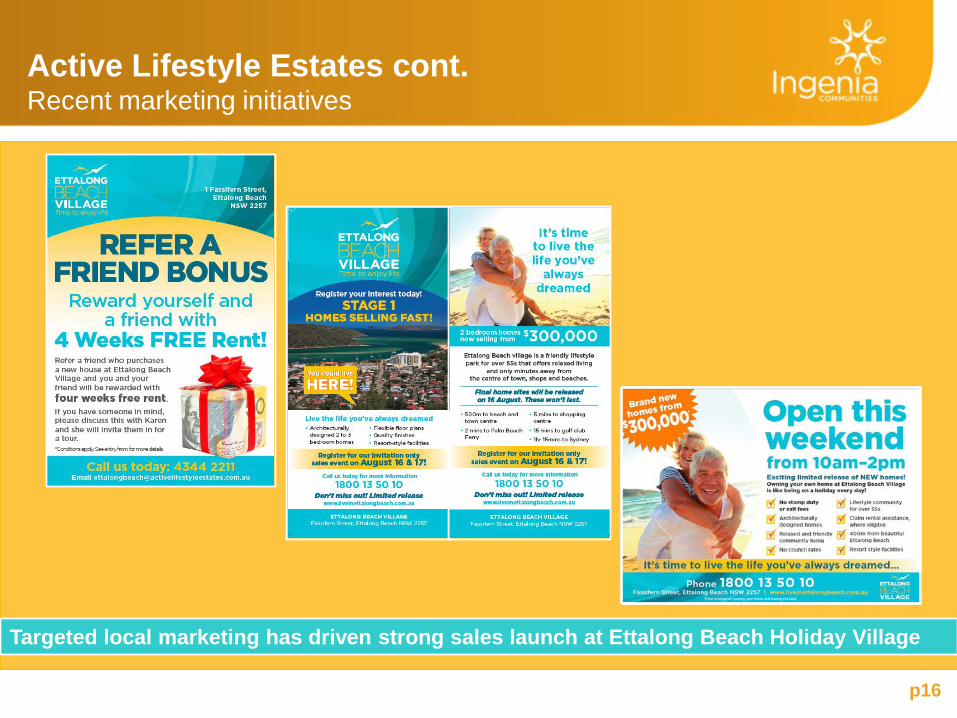
Active Lifestyle Estates cont. Recent marketing initiatives
p16
Targeted local marketing has driven strong sales launch at Ettalong Beach Holiday Village
p17
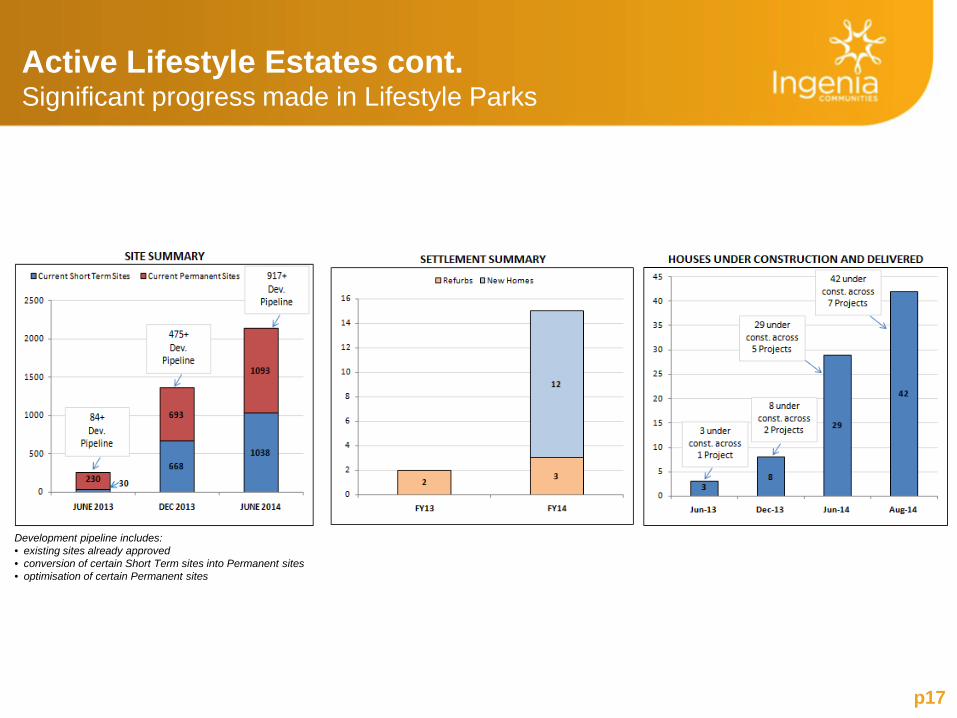
Active Lifestyle Estates cont. Significant progress made in Lifestyle Parks
Development pipeline includes: • existing sites already approved • conversion of certain Short Term sites into Permanent sites • optimisation of certain Permanent sites
p18
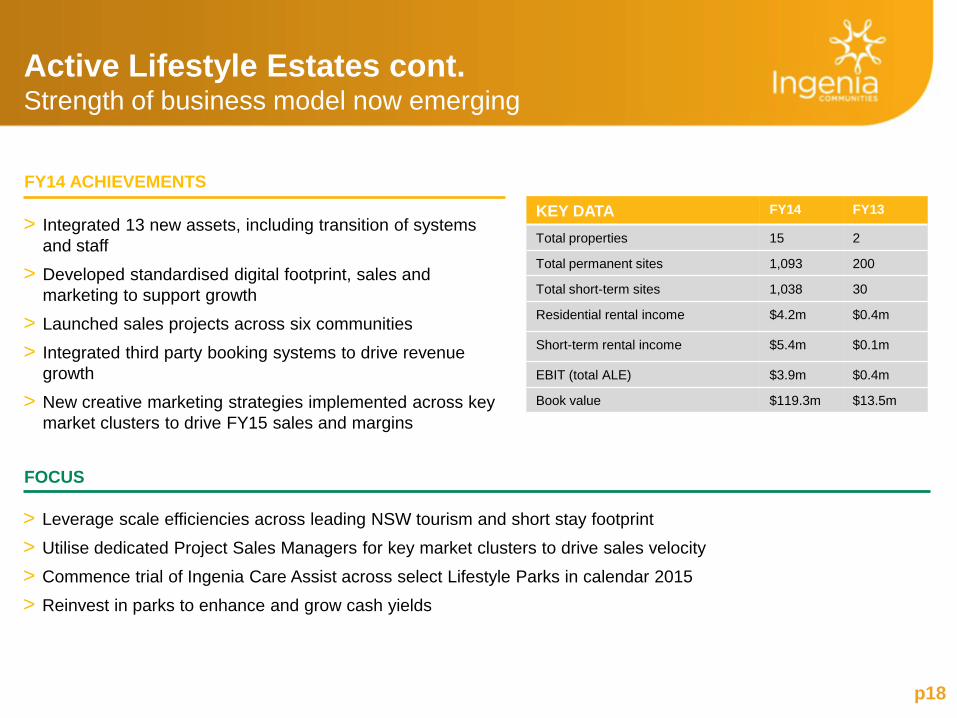
KEY DATA FY14 FY13
Total properties 15 2
Total permanent sites 1,093 200
Total short-term sites 1,038 30
Residential rental income $4.2m $0.4m
Short-term rental income $5.4m $0.1m
EBIT (total ALE) $3.9m $0.4m
Book value $119.3m $13.5m
Active Lifestyle Estates cont. Strength of business model now emerging
> Integrated 13 new assets, including transition of systems and staff
> Developed standardised digital footprint, sales and marketing to support growth
> Launched sales projects across six communities
> Integrated third party booking systems to drive revenue growth
> New creative marketing strategies implemented across key market clusters to drive FY15 sales and margins
FY14 ACHIEVEMENTS
FOCUS
> Leverage scale efficiencies across leading NSW tourism and short stay footprint
> Utilise dedicated Project Sales Managers for key market clusters to drive sales velocity
> Commence trial of Ingenia Care Assist across select Lifestyle Parks in calendar 2015
> Reinvest in parks to enhance and grow cash yields
p19
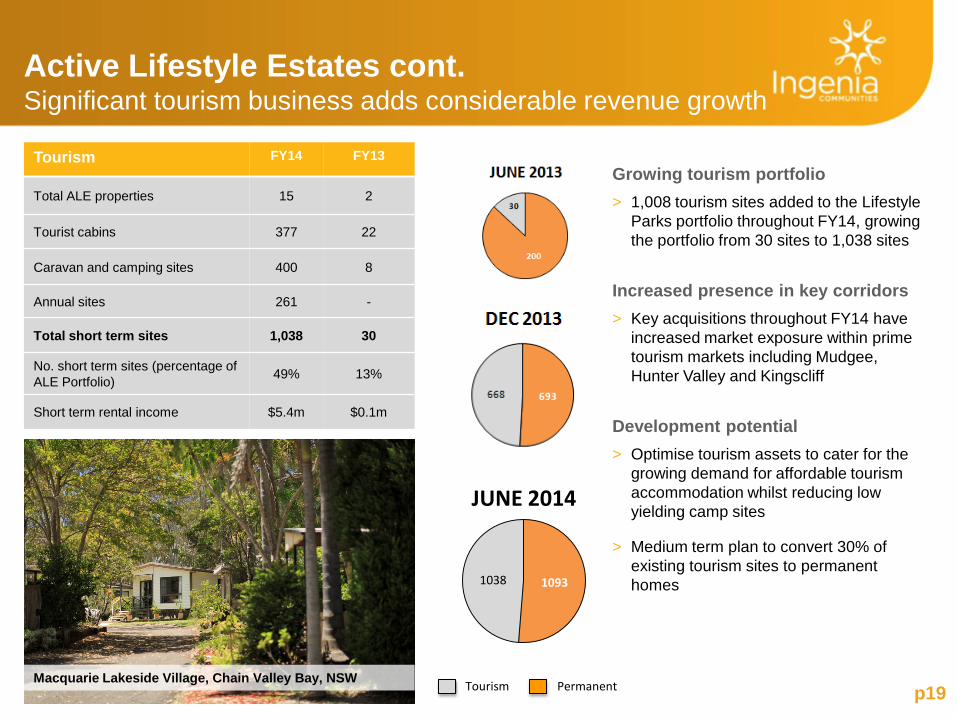
Active Lifestyle Estates cont. Significant tourism business adds considerable revenue growth
Tourism FY14 FY13
Total ALE properties 15 2
Tourist cabins 377 22
Caravan and camping sites 400 8
Annual sites 261 -
Total short term sites 1,038 30
No. short term sites (percentage of ALE Portfolio) 49% 13%
Short term rental income $5.4m $0.1m
1093 1038
JUNE 2014
Tourism Permanent
Growing tourism portfolio > 1,008 tourism sites added to the Lifestyle
Parks portfolio throughout FY14, growing the portfolio from 30 sites to 1,038 sites
Increased presence in key corridors > Key acquisitions throughout FY14 have
increased market exposure within prime tourism markets including Mudgee, Hunter Valley and Kingscliff
Development potential > Optimise tourism assets to cater for the
growing demand for affordable tourism accommodation whilst reducing low yielding camp sites
> Medium term plan to convert 30% of existing tourism sites to permanent homes
Macquarie Lakeside Village, Chain Valley Bay, NSW
p20
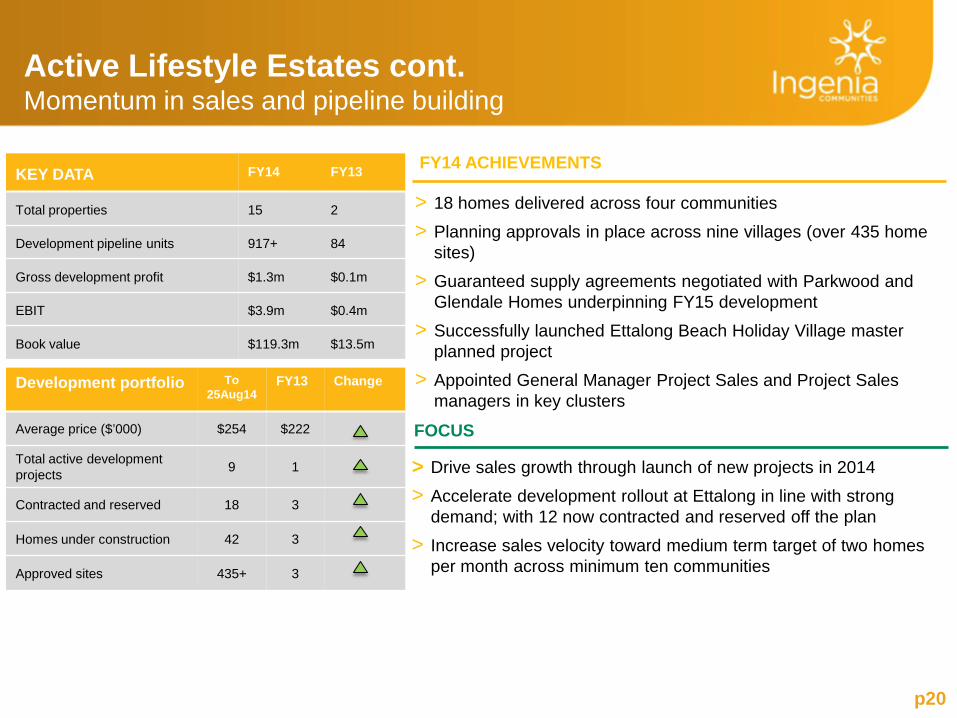
Active Lifestyle Estates cont. Momentum in sales and pipeline building
FOCUS
>
> 18 homes delivered across four communities
> Planning approvals in place across nine villages (over 435 home sites)
> Guaranteed supply agreements negotiated with Parkwood and Glendale Homes underpinning FY15 development
> Successfully launched Ettalong Beach Holiday Village master planned project
> Appointed General Manager Project Sales and Project Sales managers in key clusters
FY14 ACHIEVEMENTS KEY DATA FY14 FY13
Total properties 15 2
Development pipeline units 917+ 84
Gross development profit $1.3m $0.1m
EBIT $3.9m $0.4m
Book value $119.3m $13.5m
Development portfolio To 25Aug14
FY13 Change
Average price ($’000) $254 $222
Total active development projects 9 1
Contracted and reserved 18 3
Homes under construction 42 3
Approved sites 435+ 3
> Drive sales growth through launch of new projects in 2014
> Accelerate development rollout at Ettalong in line with strong demand; with 12 now contracted and reserved off the plan
> Increase sales velocity toward medium term target of two homes per month across minimum ten communities
p21
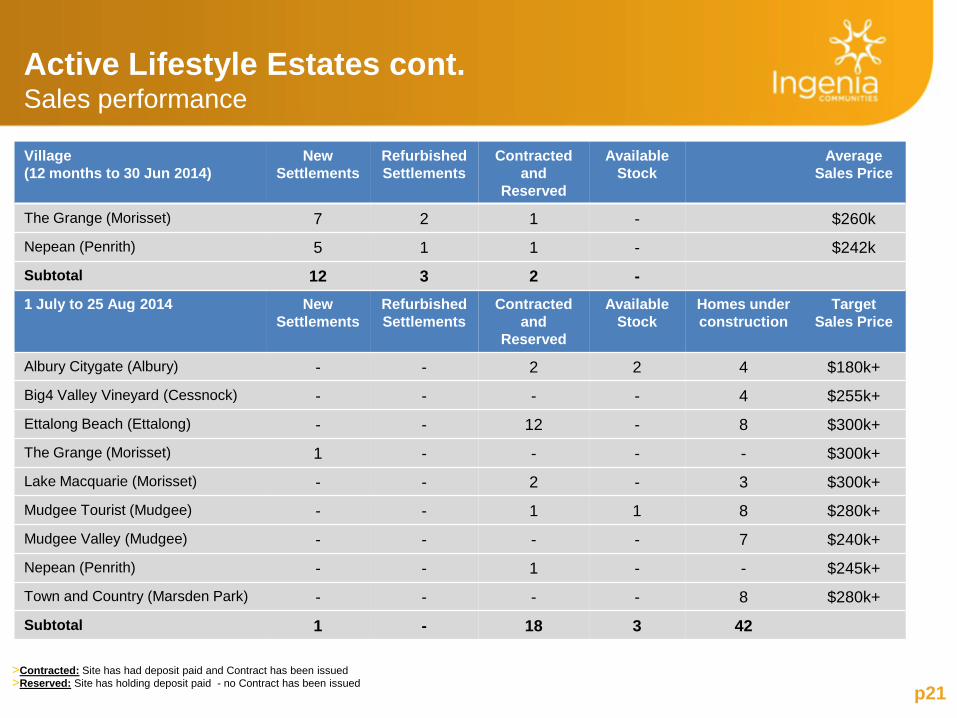
Village (12 months to 30 Jun 2014)
New Settlements
Refurbished Settlements
Contracted and
Reserved
Available Stock
Average Sales Price
The Grange (Morisset) 7 2 1 - $260k
Nepean (Penrith) 5 1 1 - $242k
Subtotal 12 3 2 - 1 July to 25 Aug 2014 New
Settlements Refurbished Settlements
Contracted and
Reserved
Available Stock
Homes under construction
Target Sales Price
Albury Citygate (Albury) - - 2 2 4 $180k+
Big4 Valley Vineyard (Cessnock) - - - - 4 $255k+
Ettalong Beach (Ettalong) - - 12 - 8 $300k+
The Grange (Morisset) 1 - - - - $300k+
Lake Macquarie (Morisset) - - 2 - 3 $300k+
Mudgee Tourist (Mudgee) - - 1 1 8 $280k+
Mudgee Valley (Mudgee) - - - - 7 $240k+
Nepean (Penrith) - - 1 - - $245k+
Town and Country (Marsden Park) - - - - 8 $280k+
Subtotal 1 - 18 3 42
Active Lifestyle Estates cont. Sales performance
>Contracted: Site has had deposit paid and Contract has been issued >Reserved: Site has holding deposit paid - no Contract has been issued
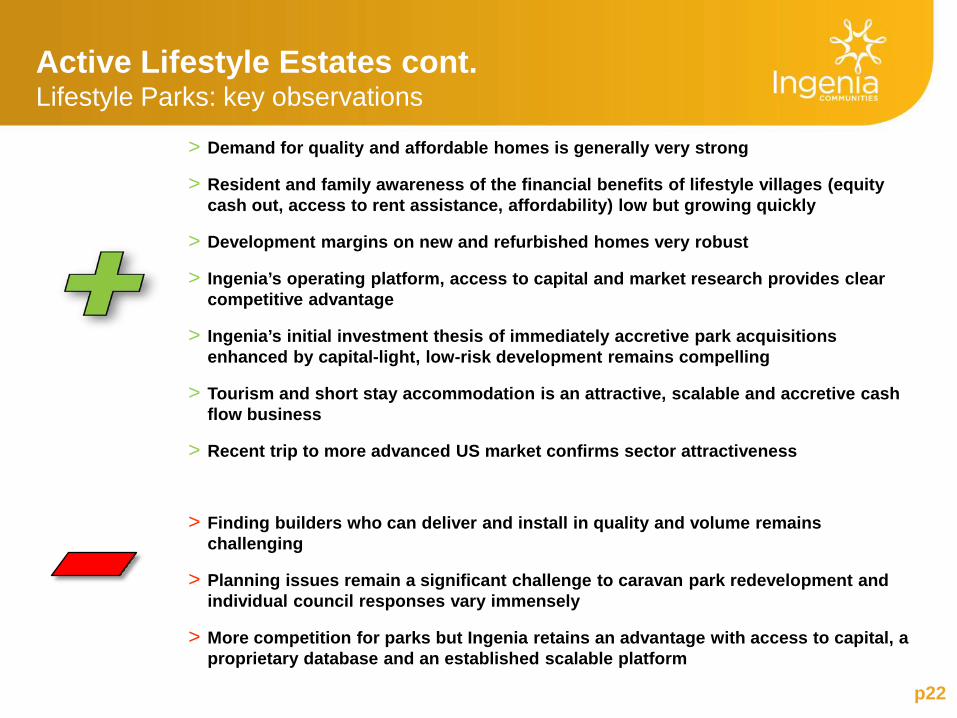
Active Lifestyle Estates cont. Lifestyle Parks: key observations
> Demand for quality and affordable homes is generally very strong
> Resident and family awareness of the financial benefits of lifestyle villages (equity cash out, access to rent assistance, affordability) low but growing quickly
> Development margins on new and refurbished homes very robust
> Ingenia’s operating platform, access to capital and market research provides clear competitive advantage
> Ingenia’s initial investment thesis of immediately accretive park acquisitions enhanced by capital-light, low-risk development remains compelling
> Tourism and short stay accommodation is an attractive, scalable and accretive cash flow business
> Recent trip to more advanced US market confirms sector attractiveness
> Finding builders who can deliver and install in quality and volume remains challenging
> Planning issues remain a significant challenge to caravan park redevelopment and individual council responses vary immensely
> More competition for parks but Ingenia retains an advantage with access to capital, a proprietary database and an established scalable platform
p22
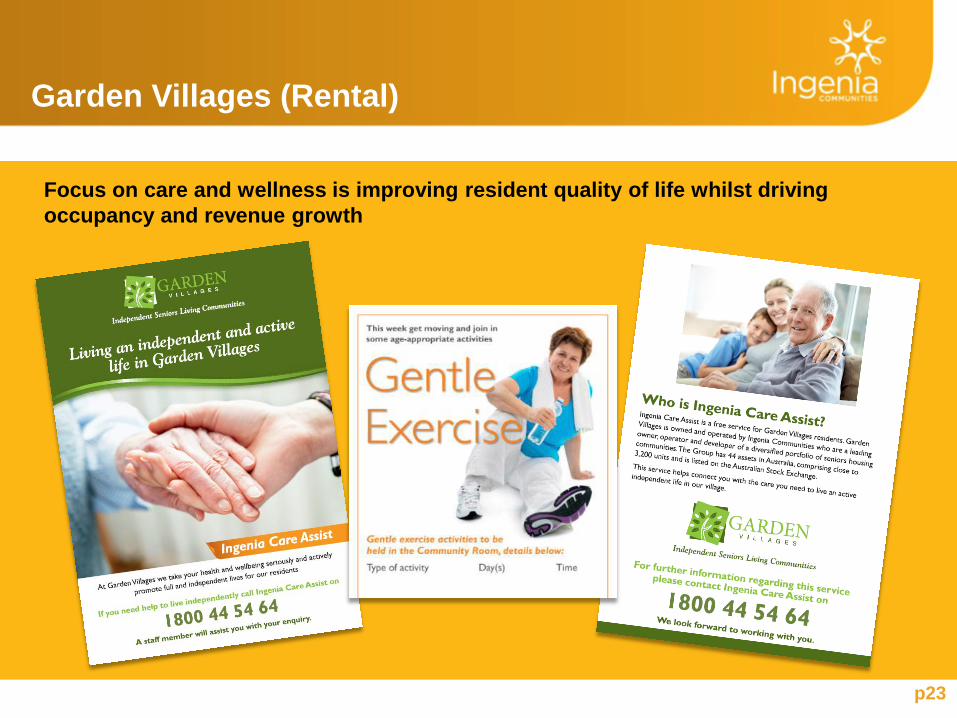
Garden Villages (Rental)
Focus on care and wellness is improving resident quality of life whilst driving occupancy and revenue growth
p23
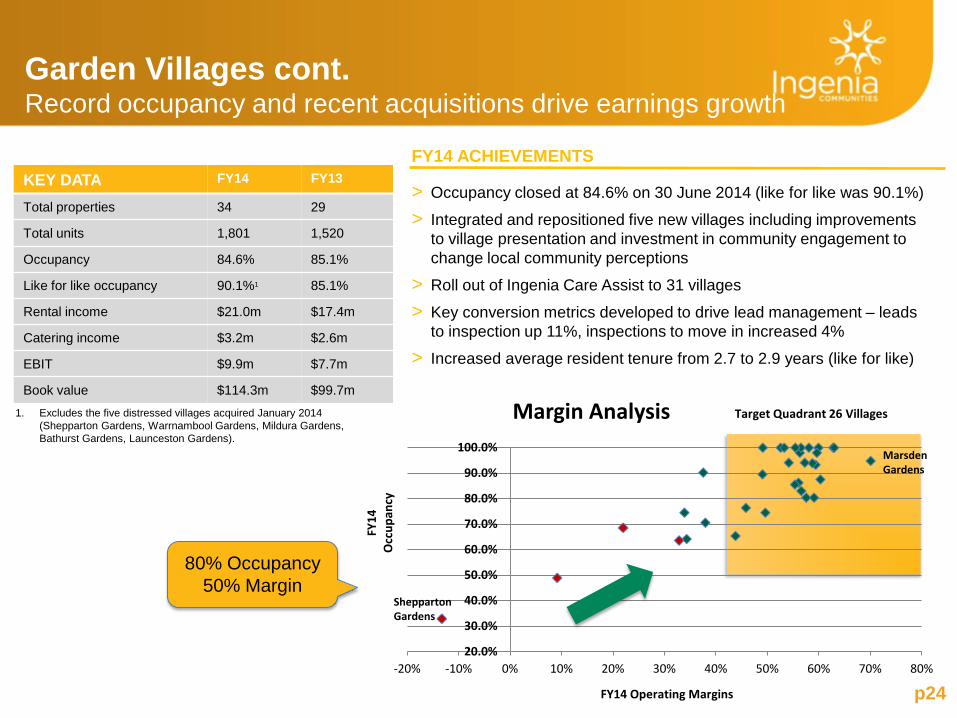
Garden Villages cont. Record occupancy and recent acquisitions drive earnings growth
KEY DATA FY14 FY13
Total properties 34 29
Total units 1,801 1,520
Occupancy 84.6% 85.1%
Like for like occupancy 90.1%1 85.1%
Rental income $21.0m $17.4m
Catering income $3.2m $2.6m
EBIT $9.9m $7.7m
Book value $114.3m $99.7m 1. Excludes the five distressed villages acquired January 2014
(Shepparton Gardens, Warrnambool Gardens, Mildura Gardens, Bathurst Gardens, Launceston Gardens).
> Occupancy closed at 84.6% on 30 June 2014 (like for like was 90.1%)
> Integrated and repositioned five new villages including improvements to village presentation and investment in community engagement to change local community perceptions
> Roll out of Ingenia Care Assist to 31 villages
> Key conversion metrics developed to drive lead management – leads to inspection up 11%, inspections to move in increased 4%
> Increased average resident tenure from 2.7 to 2.9 years (like for like)
FY14 ACHIEVEMENTS
20.0%
30.0%
40.0%
50.0%
60.0%
70.0%
80.0%
90.0%
100.0%
-20% -10% 0% 10% 20% 30% 40% 50% 60% 70% 80%
FY14
O
ccup
ancy
FY14 Operating Margins
Margin Analysis Target Quadrant 26 Villages
Shepparton Gardens
Marsden Gardens
p24
80% Occupancy 50% Margin
Garden Villages cont. Improved occupancy and acquisitions drive earnings growth
p25
FOCUS
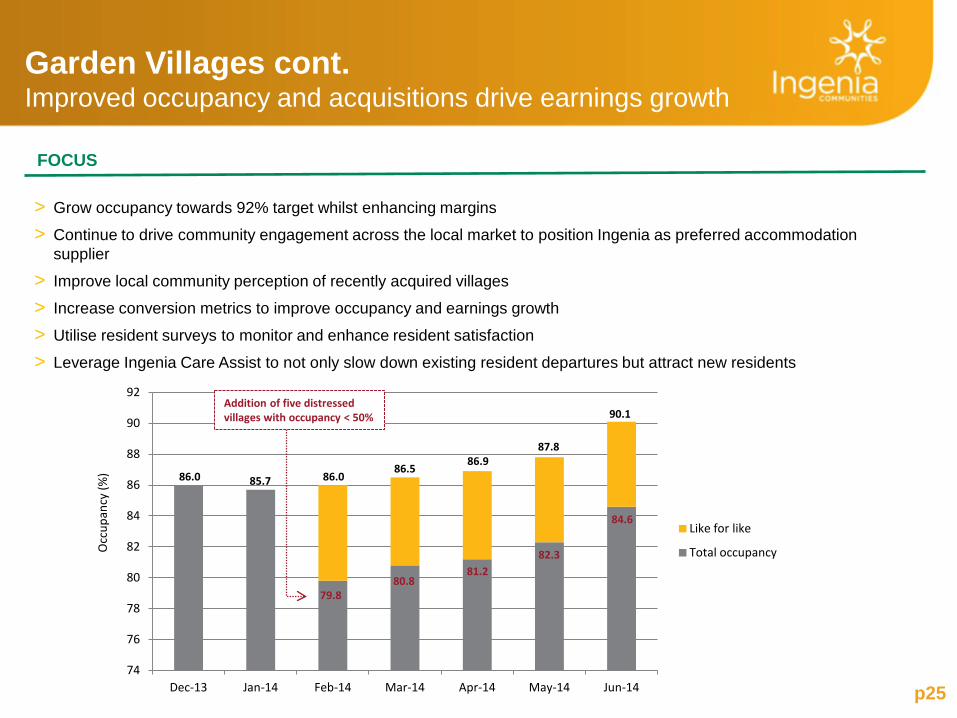
> Grow occupancy towards 92% target whilst enhancing margins
> Continue to drive community engagement across the local market to position Ingenia as preferred accommodation supplier
> Improve local community perception of recently acquired villages
> Increase conversion metrics to improve occupancy and earnings growth
> Utilise resident surveys to monitor and enhance resident satisfaction
> Leverage Ingenia Care Assist to not only slow down existing resident departures but attract new residents
Occ
upan
cy (%
)
74
76
78
80
82
84
86
88
90
92
Dec-13 Jan-14 Feb-14 Mar-14 Apr-14 May-14 Jun-14
Like for like
Total occupancy
Addition of five distressed villages with occupancy < 50%
86.0 85.7 86.0 86.5 86.9
87.8
90.1
79.8 80.8
81.2 82.3
84.6

Post Discharge
Care
Ingenia Care Assist (ICA)
Accredited external agency
providing Commonwealth
Government funded home-care
Transport
Social/Recreational support
Shopping
Personal Care
Allied Health Services
Resident benefits from continuum of care in
their home environment Ingenia benefits from
higher village occupancy and
increased resident tenure
Assist work? How does Ingenia Care
Medication Supervision
Ingenia assists existing resident (or
family) complete application to access home-care package
from accredited provider
New resident moves into an Ingenia
village due to ease of access to home-care
package
Ingenia conducts regular on-site
meetings and phone contact to ensure
residents home care needs are being appropriately met
Ingenia assesses performance of external care
provider to ensure minimum service levels are being
maintained
p26
Ingenia Care Assist cont. Delivering occupancy and income growth
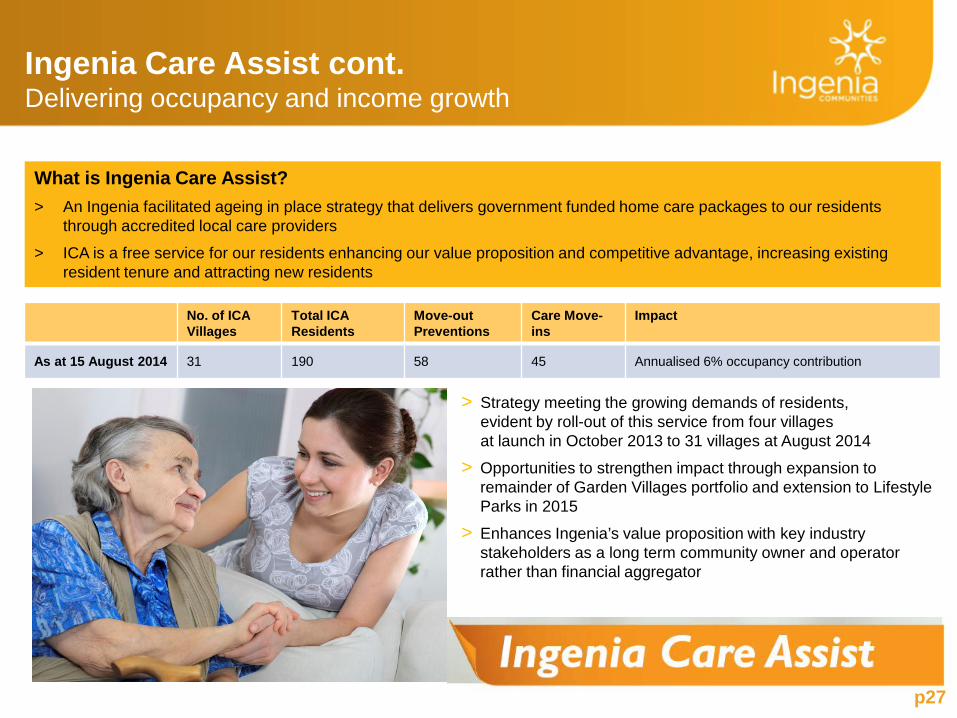
> Strategy meeting the growing demands of residents, evident by roll-out of this service from four villages at launch in October 2013 to 31 villages at August 2014
> Opportunities to strengthen impact through expansion to remainder of Garden Villages portfolio and extension to Lifestyle Parks in 2015
> Enhances Ingenia’s value proposition with key industry stakeholders as a long term community owner and operator rather than financial aggregator
No. of ICA Villages
Total ICA Residents
Move-out Preventions
Care Move-ins
Impact
As at 15 August 2014 31 190 58 45 Annualised 6% occupancy contribution
What is Ingenia Care Assist? > An Ingenia facilitated ageing in place strategy that delivers government funded home care packages to our residents
through accredited local care providers
> ICA is a free service for our residents enhancing our value proposition and competitive advantage, increasing existing resident tenure and attracting new residents
p27
p28
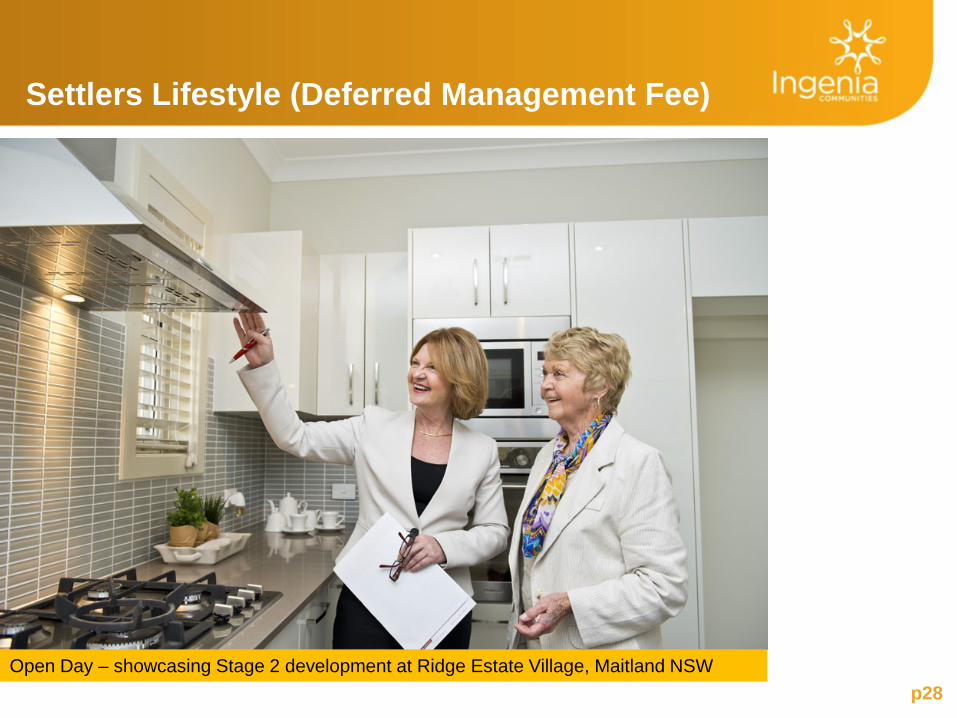
Settlers Lifestyle (Deferred Management Fee)
Open Day – showcasing Stage 2 development at Ridge Estate Village, Maitland NSW
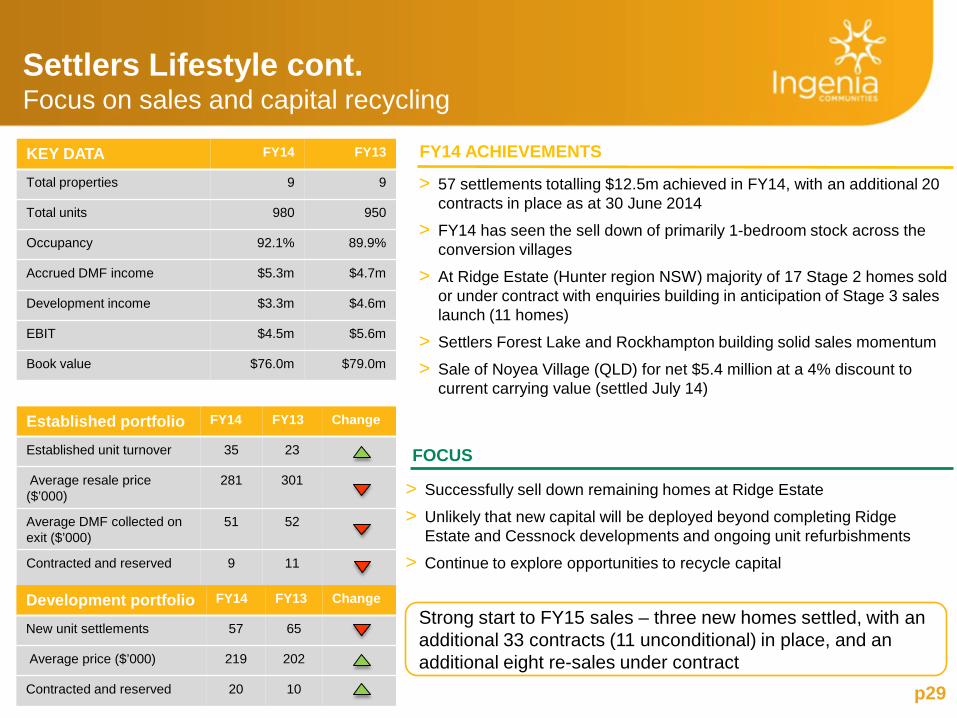
> 57 settlements totalling $12.5m achieved in FY14, with an additional 20 contracts in place as at 30 June 2014
> FY14 has seen the sell down of primarily 1-bedroom stock across the conversion villages
> At Ridge Estate (Hunter region NSW) majority of 17 Stage 2 homes sold or under contract with enquiries building in anticipation of Stage 3 sales launch (11 homes)
> Settlers Forest Lake and Rockhampton building solid sales momentum
> Sale of Noyea Village (QLD) for net $5.4 million at a 4% discount to current carrying value (settled July 14)
p29
KEY DATA FY14 FY13
Total properties 9 9
Total units 980 950
Occupancy 92.1% 89.9%
Accrued DMF income $5.3m $4.7m
Development income $3.3m $4.6m
EBIT $4.5m $5.6m
Book value $76.0m $79.0m
Settlers Lifestyle cont. Focus on sales and capital recycling
Established portfolio FY14 FY13 Change
Established unit turnover 35 23
Average resale price ($’000)
281 301
Average DMF collected on exit ($’000)
51 52
Contracted and reserved 9
11
Development portfolio FY14 FY13 Change
New unit settlements 57 65
Average price ($’000) 219 202
Contracted and reserved 20 10
FY14 ACHIEVEMENTS
> Successfully sell down remaining homes at Ridge Estate
> Unlikely that new capital will be deployed beyond completing Ridge Estate and Cessnock developments and ongoing unit refurbishments
> Continue to explore opportunities to recycle capital
FOCUS
Strong start to FY15 sales – three new homes settled, with an additional 33 contracts (11 unconditional) in place, and an additional eight re-sales under contract
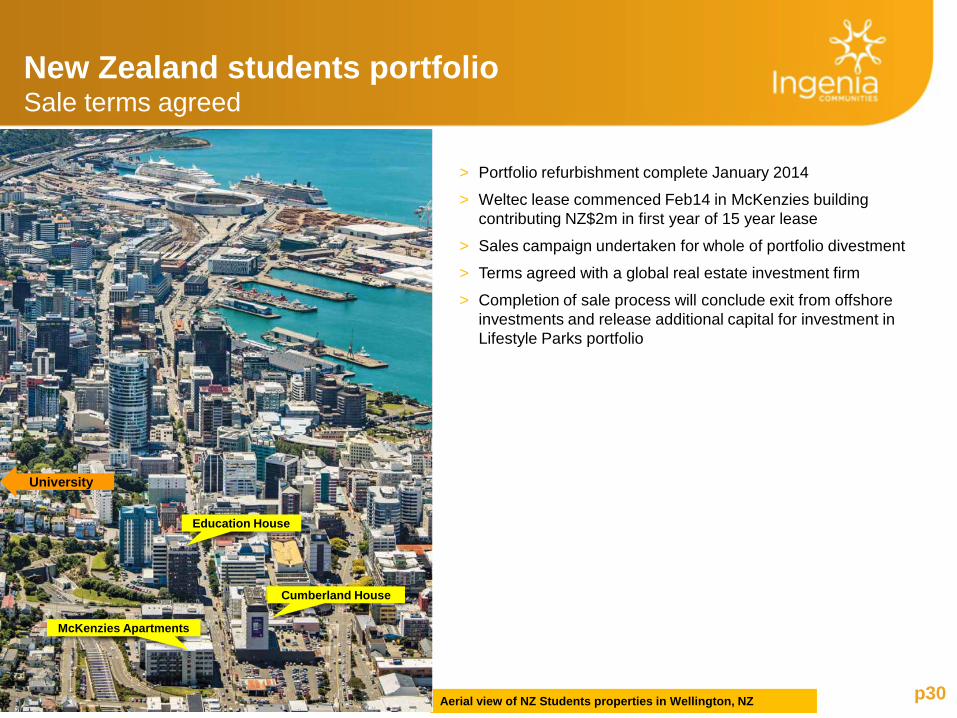
New Zealand students portfolio Sale terms agreed
p30
> Portfolio refurbishment complete January 2014
> Weltec lease commenced Feb14 in McKenzies building contributing NZ$2m in first year of 15 year lease
> Sales campaign undertaken for whole of portfolio divestment
> Terms agreed with a global real estate investment firm
> Completion of sale process will conclude exit from offshore investments and release additional capital for investment in Lifestyle Parks portfolio
Note: Portfolio has been classified as discontinued operations Aerial view of NZ Students properties in Wellington, NZ
Cumberland House
McKenzies Apartments
Education House
University
p31
► Prospective acquisition deal flow remains strong, with focus on NSW and South East QLD
► Increasing delivery and sales of new homes across existing Lifestyle Parks key short term priority
Outlook
► Expand Ingenia Care Assist to support occupancy growth and resident tenure
► Finalise multi-bank debt funding to underpin capital flexibility
► Progress with non-core asset sales to recycle capital into higher yielding Lifestyle Park opportunities
Jumping Pillow at Mudgee Tourist and Van Resort
Complete business repositioning
> Finalise sale of NZ Students portfolio
> Actively assess options to recycle low yielding capital into growing Lifestyle Parks and development pipeline > Continue to grow exposure to Lifestyle Parks through conversion of acquisition pipeline and progress on
developments
> Expand Lifestyle Parks NSW market leading presence into South East Queensland
Increase rate of new home sales and delivery in Lifestyle Parks portfolio
Deliver further operational improvements
> Optimise operating efficiencies and leverage scale efficiencies
> Invest in Lifestyle Parks infrastructure and facility improvements
> Increase Garden Villages occupancy towards mid term target of 92%
> Expand Ingenia Care Assist
> Complete sell down of Ridge Estate Stage 2 and 3
Maintain growth focus
> Complete multi-bank refinance, extending maturity and increasing borrowing capacity
> Continue to assess acquisition opportunities
> Continue to maximise securityholder returns
Outlook FY15 focus
p32
p33
Appendices
Big 4 Valley Vineyard, Cessnock NSW

Appendix 1 Reconciliation to EBIT and Underlying Profit from continuing operations
(A$m)
Active Lifestyle Estates
(Lifestyle Parks)
Garden Villages (Rental)
Settlers (DMF)
Corporate TOTAL
Rental income 9.6 21.0 1.0 - 31.6 Accrued DMF fee income - - 5.3 - 5.3 Manufactured home sales 3.4 - - - 3.4 Catering income - 3.1 0.1 - 3.2 Other property income 0.6 0.5 0.8 - 1.9 Development profit - - 3.3 - 3.3 Total segment revenue 13.6 24.6 10.5 - 48.7 Property expenses (2.6) (6.8) (1.9) (0.3) (11.6) Employee expenses (4.1) (6.4) (2.1) (2.7) (15.3) Administration expenses (0.4) (1.0) (0.2) (2.8) (4.4) Operational, marketing and selling expenses (0.5) (0.5) (1.8) (0.4) (3.2) Manufactured home cost of sales (2.1) - - - (2.1) Earnings before interest and tax (EBIT) 3.9 9.9 4.5 (6.2) 12.1 Interest income - - - 0.4 0.4 Finance expense - - - (4.4) (4.4) Income tax benefit - - - 2.9 2.9 Underlying profit – continuing operations 3.9 9.9 4.5 (7.3) 11.0
p34
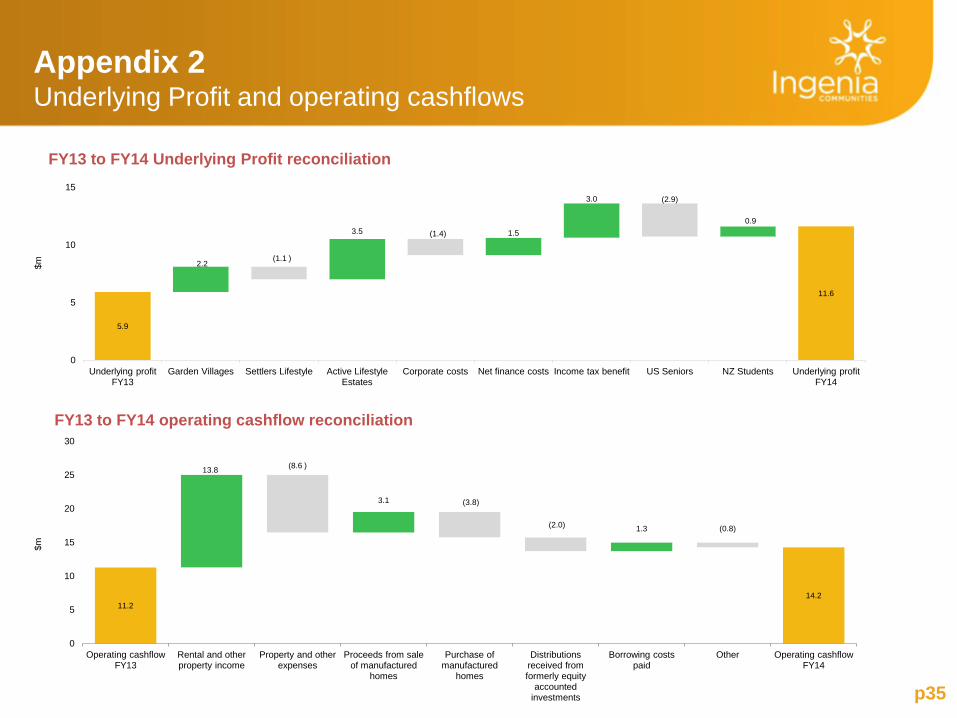
Appendix 2 Underlying Profit and operating cashflows
p35
11.2 14.2
13.8 (8.6 )
3.1 (3.8)
(2.0) 1.3 (0.8)
0
5
10
15
20
25
30
Operating cashflow FY13
Rental and other property income
Property and other expenses
Proceeds from sale of manufactured
homes
Purchase of manufactured
homes
Distributions received from formerly equity
accounted investments
Borrowing costs paid
Other Operating cashflow FY14
$m
FY13 to FY14 operating cashflow reconciliation
5.9
11.6
2.2 (1.1 )
3.5 (1.4) 1.5
3.0 (2.9)
0.9
0
5
10
15
Underlying profit FY13
Garden Villages Settlers Lifestyle Active Lifestyle Estates
Corporate costs Net finance costs Income tax benefit US Seniors NZ Students Underlying profit FY14
$m
FY13 to FY14 Underlying Profit reconciliation
p36
(A$m) Australian
Operations NZ
Students Total
Cashflows
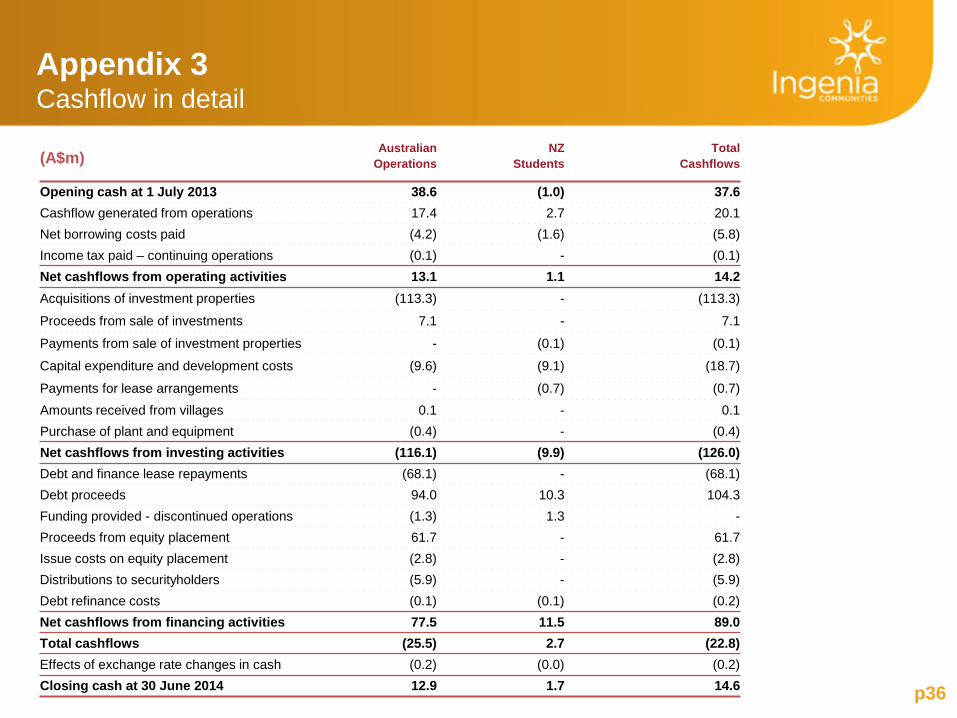
Opening cash at 1 July 2013 38.6 (1.0) 37.6 Cashflow generated from operations 17.4 2.7 20.1 Net borrowing costs paid (4.2) (1.6) (5.8) Income tax paid – continuing operations (0.1) - (0.1) Net cashflows from operating activities 13.1 1.1 14.2 Acquisitions of investment properties (113.3) - (113.3)
Proceeds from sale of investments 7.1 - 7.1
Payments from sale of investment properties - (0.1) (0.1)
Capital expenditure and development costs (9.6) (9.1) (18.7)
Payments for lease arrangements - (0.7) (0.7) Amounts received from villages 0.1 - 0.1 Purchase of plant and equipment (0.4) - (0.4) Net cashflows from investing activities (116.1) (9.9) (126.0) Debt and finance lease repayments (68.1) - (68.1) Debt proceeds 94.0 10.3 104.3 Funding provided - discontinued operations (1.3) 1.3 - Proceeds from equity placement 61.7 - 61.7 Issue costs on equity placement (2.8) - (2.8) Distributions to securityholders (5.9) - (5.9) Debt refinance costs (0.1) (0.1) (0.2) Net cashflows from financing activities 77.5 11.5 89.0 Total cashflows (25.5) 2.7 (22.8) Effects of exchange rate changes in cash (0.2) (0.0) (0.2) Closing cash at 30 June 2014 12.9 1.7 14.6
Appendix 3 Cashflow in detail
p37
(A$’000)
Australian Operations
NZ Students
Adjustments1 Total Statutory
Balance Sheet
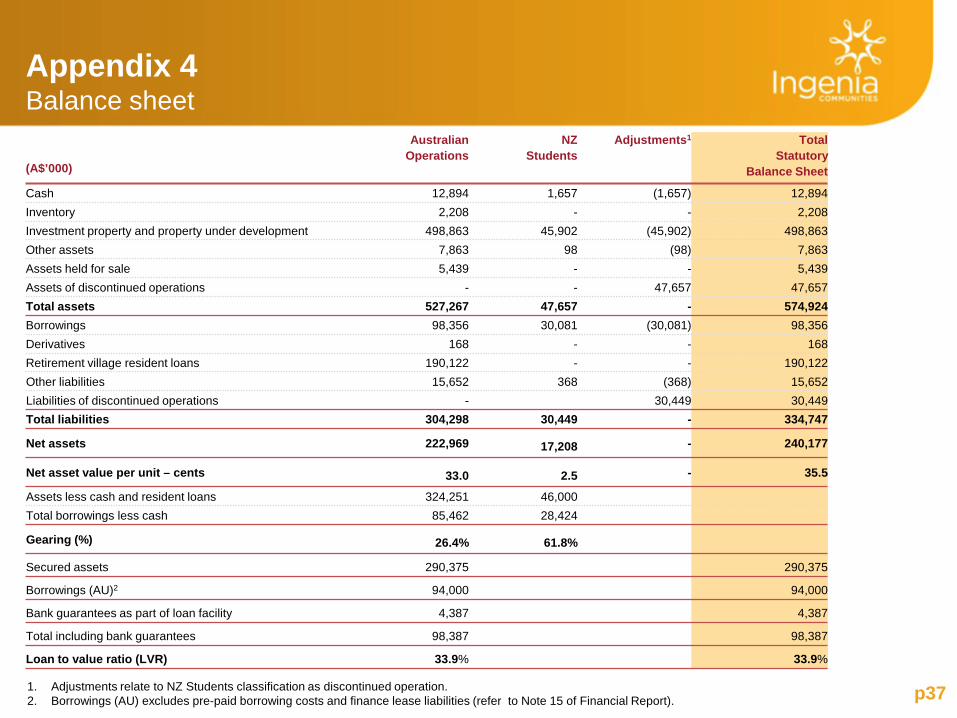
Cash 12,894 1,657 (1,657) 12,894 Inventory 2,208 - - 2,208 Investment property and property under development 498,863 45,902 (45,902) 498,863 Other assets 7,863 98 (98) 7,863 Assets held for sale 5,439 - - 5,439 Assets of discontinued operations - - 47,657 47,657 Total assets 527,267 47,657 - 574,924 Borrowings 98,356 30,081 (30,081) 98,356 Derivatives 168 - - 168 Retirement village resident loans 190,122 - - 190,122 Other liabilities 15,652 368 (368) 15,652 Liabilities of discontinued operations - 30,449 30,449 Total liabilities 304,298 30,449 - 334,747
Net assets 222,969 17,208 - 240,177
Net asset value per unit – cents 33.0 2.5 - 35.5
Assets less cash and resident loans 324,251 46,000 Total borrowings less cash 85,462 28,424
Gearing (%) 26.4% 61.8%
Secured assets 290,375 290,375
Borrowings (AU)2 94,000 94,000
Bank guarantees as part of loan facility 4,387 4,387
Total including bank guarantees 98,387 98,387
Loan to value ratio (LVR) 33.9% 33.9%
1. Adjustments relate to NZ Students classification as discontinued operation. 2. Borrowings (AU) excludes pre-paid borrowing costs and finance lease liabilities (refer to Note 15 of Financial Report).
Appendix 4 Balance sheet
p38
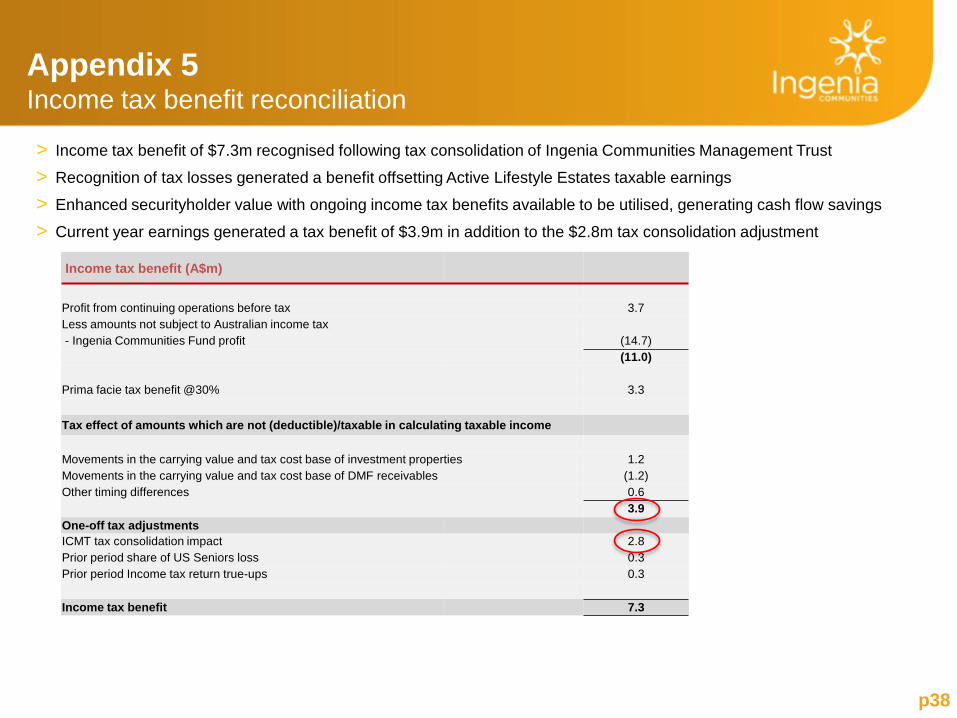
Appendix 5 Income tax benefit reconciliation
> Income tax benefit of $7.3m recognised following tax consolidation of Ingenia Communities Management Trust
> Recognition of tax losses generated a benefit offsetting Active Lifestyle Estates taxable earnings
> Enhanced securityholder value with ongoing income tax benefits available to be utilised, generating cash flow savings
> Current year earnings generated a tax benefit of $3.9m in addition to the $2.8m tax consolidation adjustment
Income tax benefit (A$m)
Profit from continuing operations before tax 3.7 Less amounts not subject to Australian income tax - Ingenia Communities Fund profit (14.7) (11.0) Prima facie tax benefit @30% 3.3 Tax effect of amounts which are not (deductible)/taxable in calculating taxable income Movements in the carrying value and tax cost base of investment properties 1.2 Movements in the carrying value and tax cost base of DMF receivables (1.2) Other timing differences 0.6 3.9 One-off tax adjustments ICMT tax consolidation impact 2.8 Prior period share of US Seniors loss 0.3 Prior period Income tax return true-ups 0.3 Income tax benefit 7.3
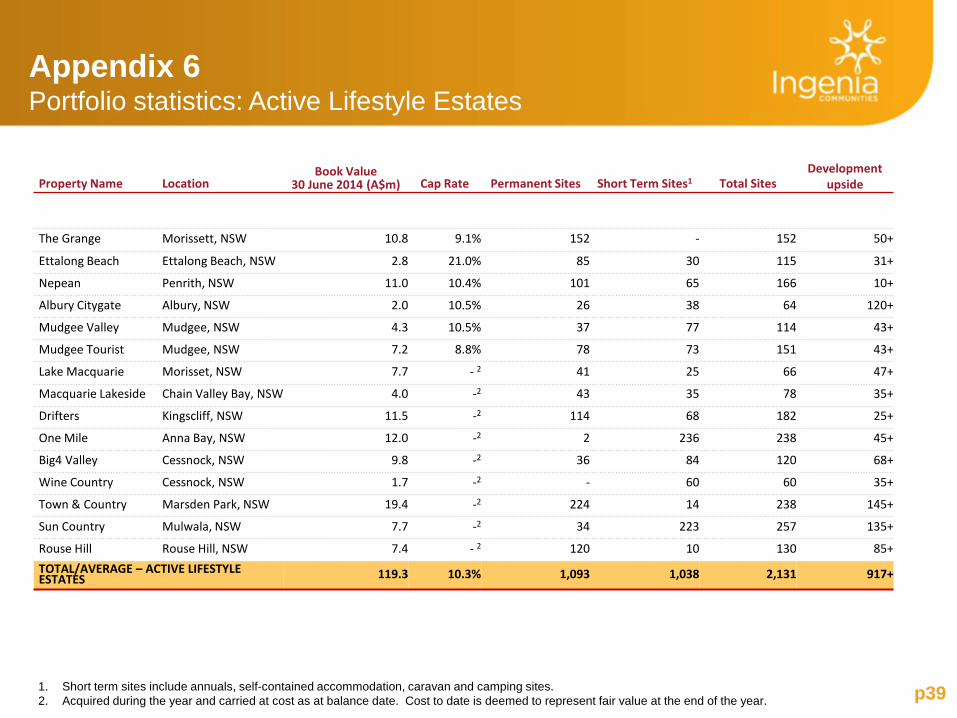
Appendix 6 Portfolio statistics: Active Lifestyle Estates
p39
Property Name Location Book Value
30 June 2014 (A$m) Cap Rate Permanent Sites Short Term Sites1 Total Sites Development
upside
The Grange Morissett, NSW 10.8 9.1% 152 - 152 50+
Ettalong Beach Ettalong Beach, NSW 2.8 21.0% 85 30 115 31+
Nepean Penrith, NSW 11.0 10.4% 101 65 166 10+
Albury Citygate Albury, NSW 2.0 10.5% 26 38 64 120+
Mudgee Valley Mudgee, NSW 4.3 10.5% 37 77 114 43+
Mudgee Tourist Mudgee, NSW 7.2 8.8% 78 73 151 43+
Lake Macquarie Morisset, NSW 7.7 - 2 41 25 66 47+
Macquarie Lakeside Chain Valley Bay, NSW 4.0 -2 43 35 78 35+
Drifters Kingscliff, NSW 11.5 -2 114 68 182 25+
One Mile Anna Bay, NSW 12.0 -2 2 236 238 45+
Big4 Valley Cessnock, NSW 9.8 -2 36 84 120 68+
Wine Country Cessnock, NSW 1.7 -2 - 60 60 35+
Town & Country Marsden Park, NSW 19.4 -2 224 14 238 145+
Sun Country Mulwala, NSW 7.7 -2 34 223 257 135+
Rouse Hill Rouse Hill, NSW 7.4 - 2 120 10 130 85+ TOTAL/AVERAGE – ACTIVE LIFESTYLE ESTATES 119.3 10.3% 1,093 1,038 2,131 917+
1. Short term sites include annuals, self-contained accommodation, caravan and camping sites. 2. Acquired during the year and carried at cost as at balance date. Cost to date is deemed to represent fair value at the end of the year.
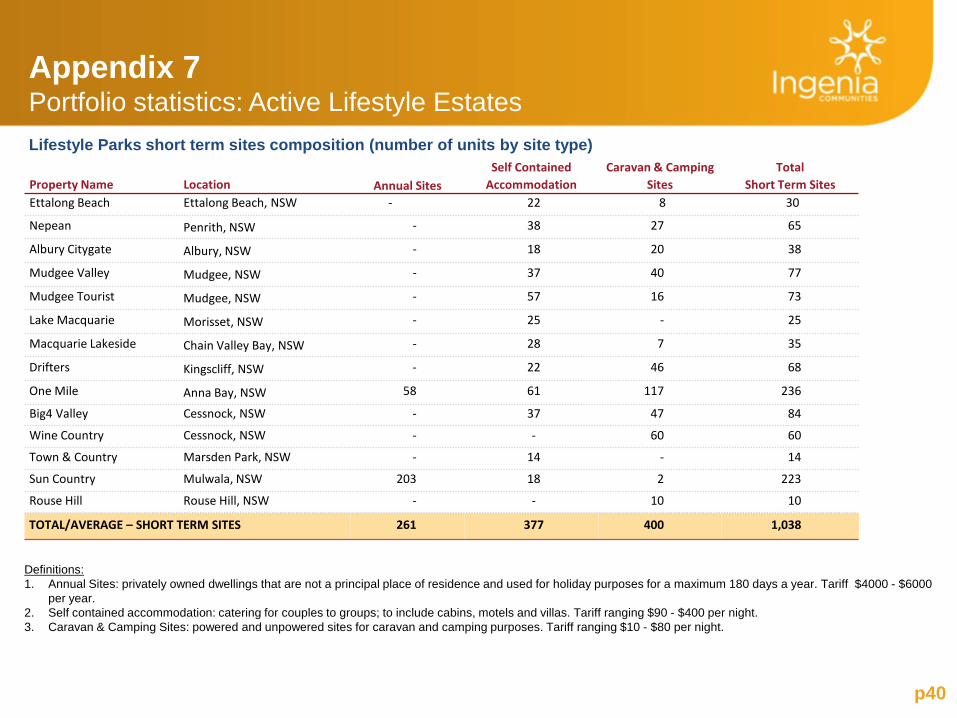
Appendix 7 Portfolio statistics: Active Lifestyle Estates
p40
Property Name Location Annual Sites Self Contained
Accommodation Caravan & Camping
Sites Total
Short Term Sites Ettalong Beach Ettalong Beach, NSW - 22 8 30
Nepean Penrith, NSW - 38 27 65
Albury Citygate Albury, NSW - 18 20 38
Mudgee Valley Mudgee, NSW - 37 40 77
Mudgee Tourist Mudgee, NSW - 57 16 73
Lake Macquarie Morisset, NSW - 25 - 25
Macquarie Lakeside Chain Valley Bay, NSW - 28 7 35
Drifters Kingscliff, NSW - 22 46 68
One Mile Anna Bay, NSW 58 61 117 236
Big4 Valley Cessnock, NSW - 37 47 84
Wine Country Cessnock, NSW - - 60 60
Town & Country Marsden Park, NSW - 14 - 14
Sun Country Mulwala, NSW 203 18 2 223
Rouse Hill Rouse Hill, NSW - - 10 10
TOTAL/AVERAGE – SHORT TERM SITES 261 377 400 1,038
Lifestyle Parks short term sites composition (number of units by site type)
Definitions: 1. Annual Sites: privately owned dwellings that are not a principal place of residence and used for holiday purposes for a maximum 180 days a year. Tariff $4000 - $6000
per year. 2. Self contained accommodation: catering for couples to groups; to include cabins, motels and villas. Tariff ranging $90 - $400 per night. 3. Caravan & Camping Sites: powered and unpowered sites for caravan and camping purposes. Tariff ranging $10 - $80 per night.
p41
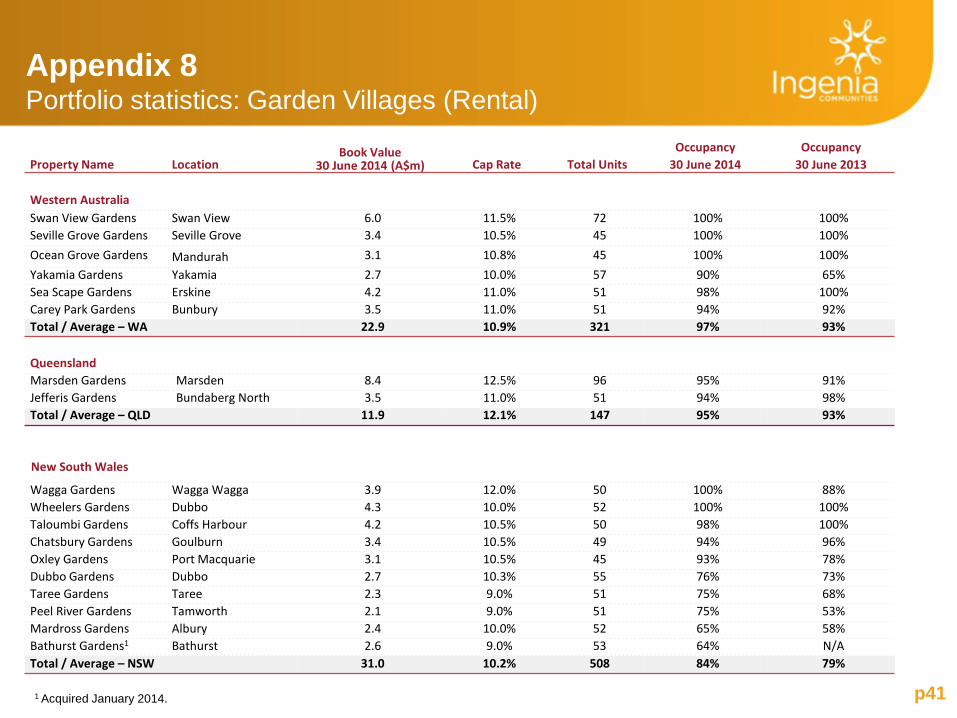
Property Name Location Book Value
30 June 2014 (A$m) Cap Rate Total Units Occupancy
30 June 2014 Occupancy
30 June 2013
Western Australia Swan View Gardens Swan View 6.0 11.5% 72 100% 100% Seville Grove Gardens Seville Grove 3.4 10.5% 45 100% 100% Ocean Grove Gardens Mandurah 3.1 10.8% 45 100% 100% Yakamia Gardens Yakamia 2.7 10.0% 57 90% 65% Sea Scape Gardens Erskine 4.2 11.0% 51 98% 100% Carey Park Gardens Bunbury 3.5 11.0% 51 94% 92% Total / Average – WA 22.9 10.9% 321 97% 93%
Queensland Marsden Gardens Marsden 8.4 12.5% 96 95% 91% Jefferis Gardens Bundaberg North 3.5 11.0% 51 94% 98% Total / Average – QLD 11.9 12.1% 147 95% 93%
New South Wales
Wagga Gardens Wagga Wagga 3.9 12.0% 50 100% 88% Wheelers Gardens Dubbo 4.3 10.0% 52 100% 100% Taloumbi Gardens Coffs Harbour 4.2 10.5% 50 98% 100% Chatsbury Gardens Goulburn 3.4 10.5% 49 94% 96% Oxley Gardens Port Macquarie 3.1 10.5% 45 93% 78% Dubbo Gardens Dubbo 2.7 10.3% 55 76% 73% Taree Gardens Taree 2.3 9.0% 51 75% 68% Peel River Gardens Tamworth 2.1 9.0% 51 75% 53% Mardross Gardens Albury 2.4 10.0% 52 65% 58% Bathurst Gardens1 Bathurst 2.6 9.0% 53 64% N/A Total / Average – NSW 31.0 10.2% 508 84% 79%
Appendix 8 Portfolio statistics: Garden Villages (Rental)
1 Acquired January 2014.
p42
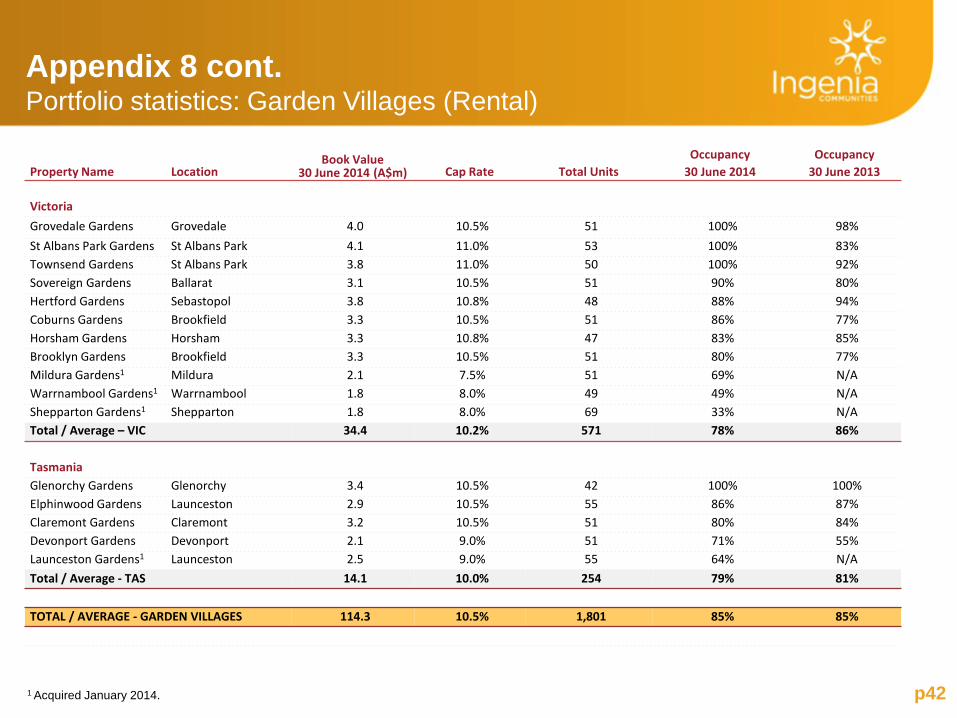
Appendix 8 cont. Portfolio statistics: Garden Villages (Rental)
Property Name Location Book Value
30 June 2014 (A$m) Cap Rate Total Units Occupancy
30 June 2014 Occupancy
30 June 2013
Victoria Grovedale Gardens Grovedale 4.0 10.5% 51 100% 98% St Albans Park Gardens St Albans Park 4.1 11.0% 53 100% 83% Townsend Gardens St Albans Park 3.8 11.0% 50 100% 92% Sovereign Gardens Ballarat 3.1 10.5% 51 90% 80% Hertford Gardens Sebastopol 3.8 10.8% 48 88% 94% Coburns Gardens Brookfield 3.3 10.5% 51 86% 77% Horsham Gardens Horsham 3.3 10.8% 47 83% 85% Brooklyn Gardens Brookfield 3.3 10.5% 51 80% 77% Mildura Gardens1 Mildura 2.1 7.5% 51 69% N/A Warrnambool Gardens1 Warrnambool 1.8 8.0% 49 49% N/A Shepparton Gardens1 Shepparton 1.8 8.0% 69 33% N/A Total / Average – VIC 34.4 10.2% 571 78% 86%
Tasmania Glenorchy Gardens Glenorchy 3.4 10.5% 42 100% 100% Elphinwood Gardens Launceston 2.9 10.5% 55 86% 87% Claremont Gardens Claremont 3.2 10.5% 51 80% 84% Devonport Gardens Devonport 2.1 9.0% 51 71% 55% Launceston Gardens1 Launceston 2.5 9.0% 55 64% N/A Total / Average - TAS 14.1 10.0% 254 79% 81%
TOTAL / AVERAGE - GARDEN VILLAGES 114.3 10.5% 1,801 85% 85%
1 Acquired January 2014.
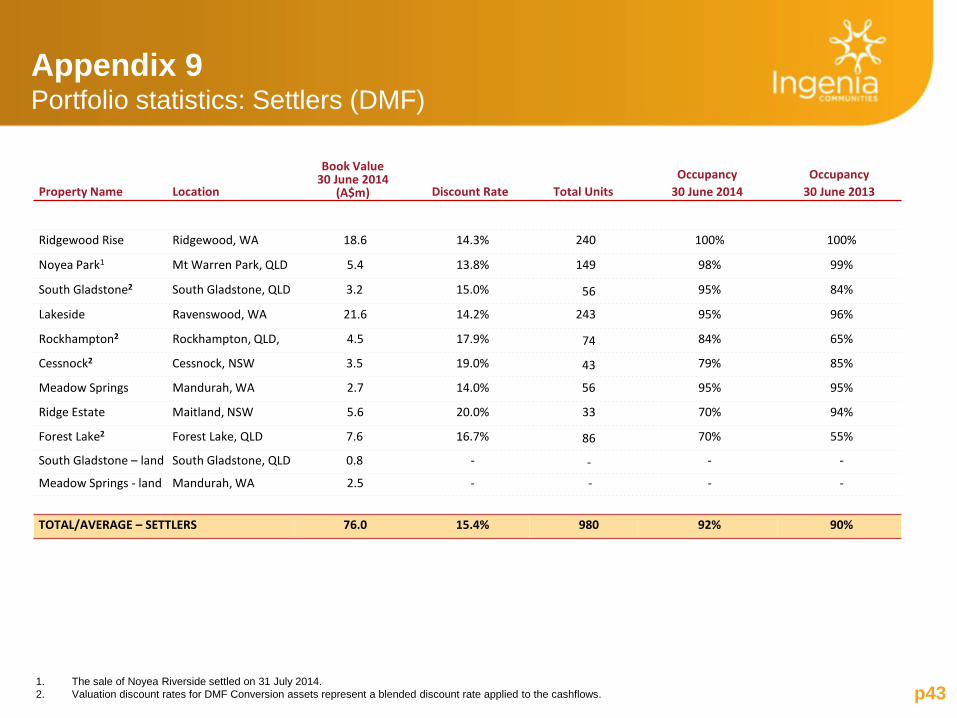
p43
Property Name Location
Book Value 30 June 2014
(A$m) Discount Rate Total Units Occupancy
30 June 2014 Occupancy
30 June 2013
Ridgewood Rise Ridgewood, WA 18.6 14.3% 240 100% 100%
Noyea Park1 Mt Warren Park, QLD 5.4 13.8% 149 98% 99%
South Gladstone2 South Gladstone, QLD 3.2 15.0% 56 95% 84%
Lakeside Ravenswood, WA 21.6 14.2% 243 95% 96%
Rockhampton2 Rockhampton, QLD, 4.5 17.9% 74 84% 65%
Cessnock2 Cessnock, NSW 3.5 19.0% 43 79% 85%
Meadow Springs Mandurah, WA 2.7 14.0% 56 95% 95%
Ridge Estate Maitland, NSW 5.6 20.0% 33 70% 94%
Forest Lake2 Forest Lake, QLD 7.6 16.7% 86 70% 55%
South Gladstone – land South Gladstone, QLD 0.8 - - - -
Meadow Springs - land Mandurah, WA 2.5 - - - -
TOTAL/AVERAGE – SETTLERS 76.0 15.4% 980 92% 90%
Appendix 9 Portfolio statistics: Settlers (DMF)
1. The sale of Noyea Riverside settled on 31 July 2014. 2. Valuation discount rates for DMF Conversion assets represent a blended discount rate applied to the cashflows.
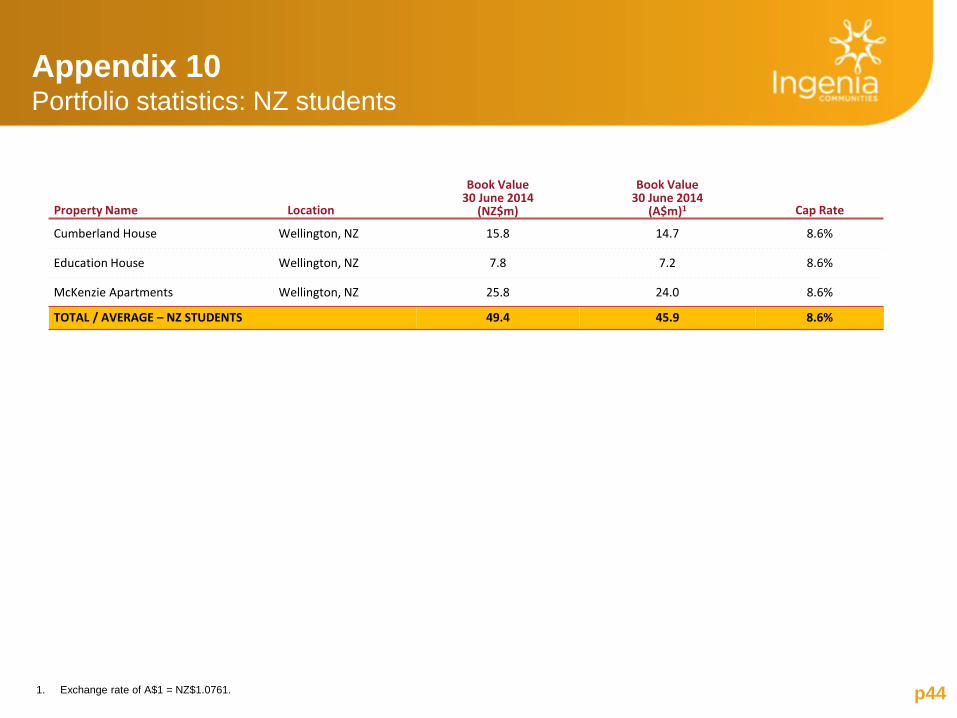
Appendix 10 Portfolio statistics: NZ students
p44 1. Exchange rate of A$1 = NZ$1.0761.
Property Name
Location
Book Value 30 June 2014
(NZ$m)
Book Value 30 June 2014
(A$m)1
Cap Rate
Cumberland House Wellington, NZ 15.8 14.7 8.6%
Education House Wellington, NZ 7.8 7.2 8.6%
McKenzie Apartments Wellington, NZ 25.8 24.0 8.6%
TOTAL / AVERAGE – NZ STUDENTS 49.4 45.9 8.6%
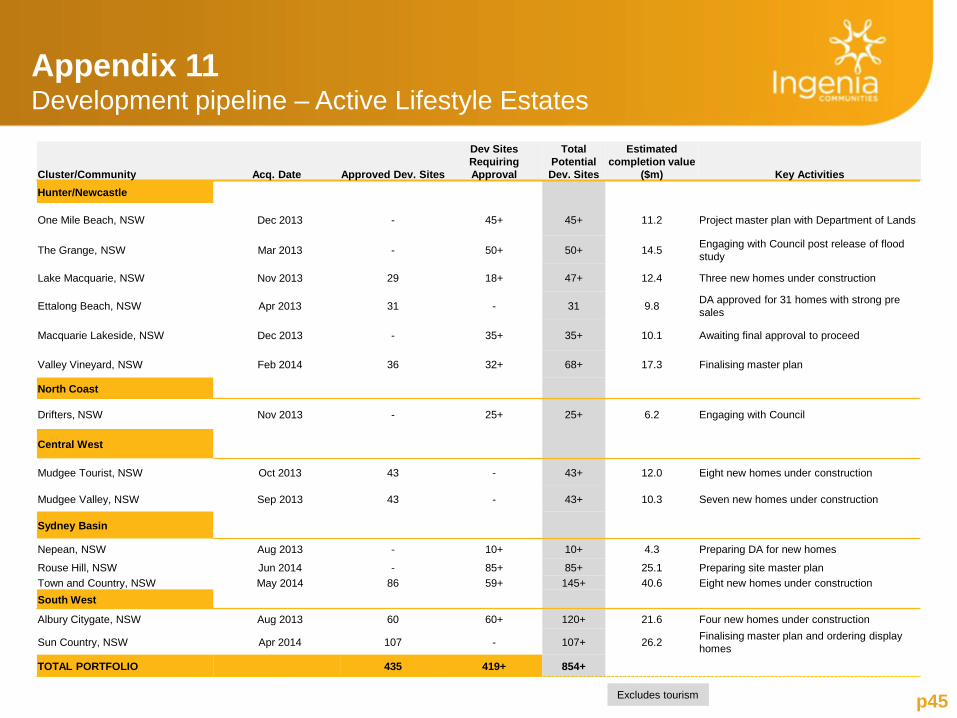
Appendix 11 Development pipeline – Active Lifestyle Estates
Cluster/Community Acq. Date Approved Dev. Sites
Dev Sites Requiring Approval
Total Potential Dev. Sites
Estimated completion value
($m) Key Activities Hunter/Newcastle
One Mile Beach, NSW Dec 2013 - 45+ 45+ 11.2 Project master plan with Department of Lands
The Grange, NSW Mar 2013 - 50+ 50+ 14.5 Engaging with Council post release of flood study
Lake Macquarie, NSW Nov 2013 29 18+ 47+ 12.4 Three new homes under construction
Ettalong Beach, NSW Apr 2013 31 - 31 9.8 DA approved for 31 homes with strong pre sales
Macquarie Lakeside, NSW Dec 2013 - 35+ 35+ 10.1 Awaiting final approval to proceed
Valley Vineyard, NSW Feb 2014 36 32+ 68+ 17.3 Finalising master plan
North Coast
Drifters, NSW Nov 2013 - 25+ 25+ 6.2 Engaging with Council
Central West
Mudgee Tourist, NSW Oct 2013 43 - 43+ 12.0 Eight new homes under construction
Mudgee Valley, NSW Sep 2013 43 - 43+ 10.3 Seven new homes under construction
Sydney Basin
Nepean, NSW Aug 2013 - 10+ 10+ 4.3 Preparing DA for new homes
Rouse Hill, NSW Jun 2014 - 85+ 85+ 25.1 Preparing site master plan Town and Country, NSW May 2014 86 59+ 145+ 40.6 Eight new homes under construction South West
Albury Citygate, NSW Aug 2013 60 60+ 120+ 21.6 Four new homes under construction
Sun Country, NSW Apr 2014 107 - 107+ 26.2 Finalising master plan and ordering display homes
TOTAL PORTFOLIO 435 419+ 854+
p45 Excludes tourism
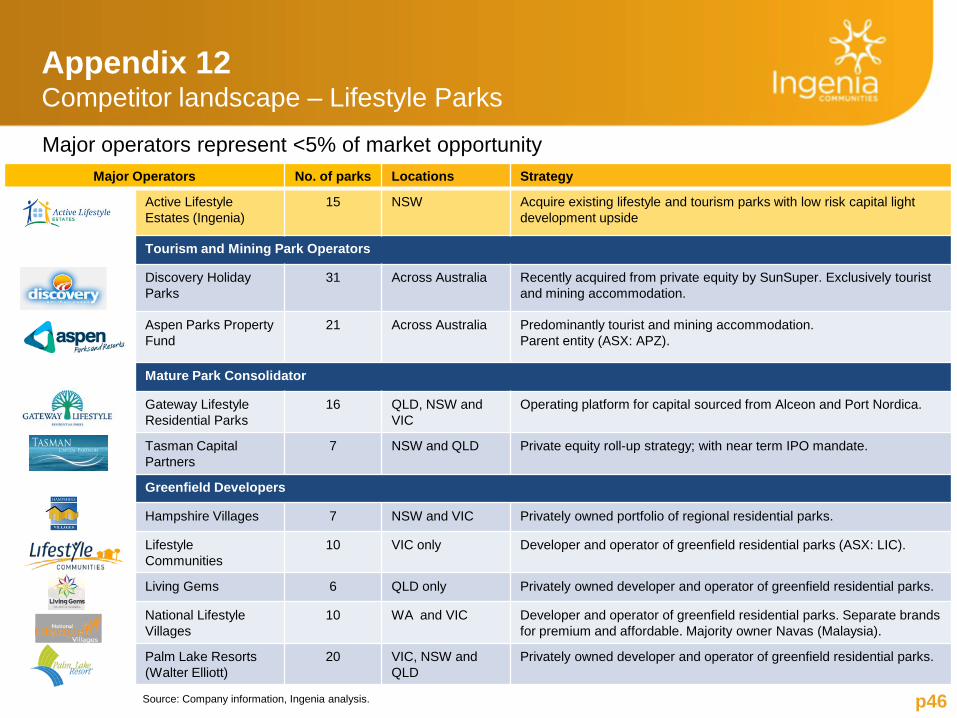
Major Operators No. of parks Locations Strategy
Active Lifestyle Estates (Ingenia)
15 NSW Acquire existing lifestyle and tourism parks with low risk capital light development upside
Tourism and Mining Park Operators
Discovery Holiday Parks
31 Across Australia Recently acquired from private equity by SunSuper. Exclusively tourist and mining accommodation.
Aspen Parks Property Fund
21 Across Australia Predominantly tourist and mining accommodation. Parent entity (ASX: APZ).
Mature Park Consolidator
Gateway Lifestyle Residential Parks
16 QLD, NSW and VIC
Operating platform for capital sourced from Alceon and Port Nordica.
Tasman Capital Partners
7 NSW and QLD Private equity roll-up strategy; with near term IPO mandate.
Greenfield Developers
Hampshire Villages 7 NSW and VIC Privately owned portfolio of regional residential parks.
Lifestyle Communities
10 VIC only Developer and operator of greenfield residential parks (ASX: LIC).
Living Gems 6 QLD only Privately owned developer and operator of greenfield residential parks.
National Lifestyle Villages
10
WA and VIC Developer and operator of greenfield residential parks. Separate brands for premium and affordable. Majority owner Navas (Malaysia).
Palm Lake Resorts (Walter Elliott)
20 VIC, NSW and QLD
Privately owned developer and operator of greenfield residential parks.
Source: Company information, Ingenia analysis.
Major operators represent <5% of market opportunity
Appendix 12 Competitor landscape – Lifestyle Parks
p46
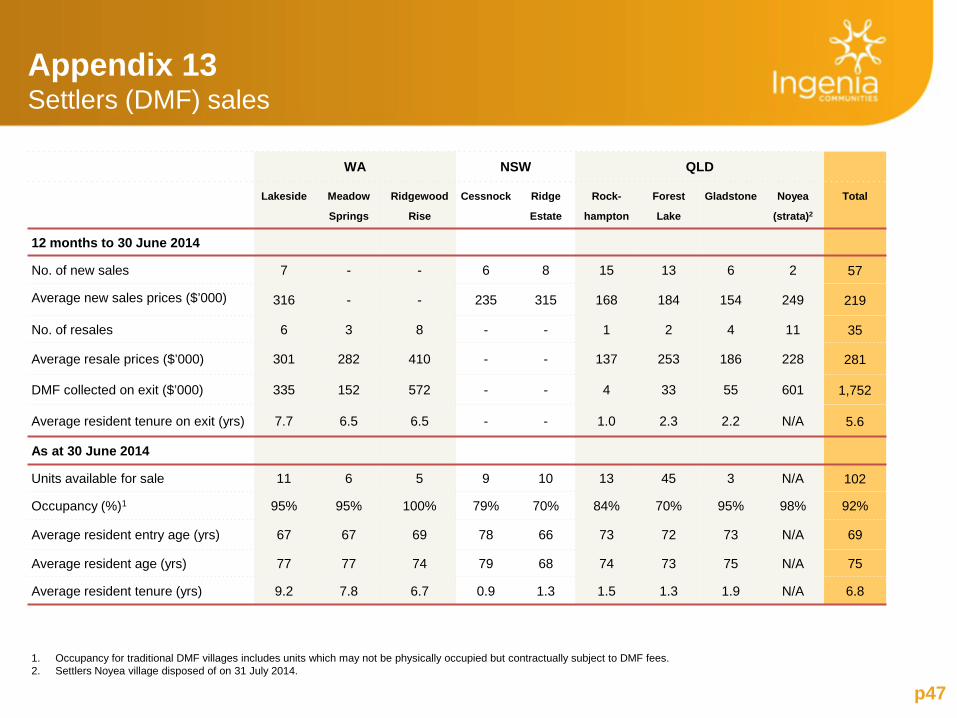
p47
WA NSW QLD
Lakeside Meadow
Springs
Ridgewood
Rise
Cessnock
Ridge
Estate
Rock-
hampton
Forest
Lake
Gladstone Noyea
(strata)2
Total
12 months to 30 June 2014
No. of new sales 7 - - 6 8 15 13 6 2 57
Average new sales prices ($’000) 316 - - 235 315 168 184 154 249 219
No. of resales 6 3 8 - - 1 2 4 11 35
Average resale prices ($’000) 301 282 410 - - 137 253 186 228 281
DMF collected on exit ($’000) 335 152 572 - - 4 33 55 601 1,752
Average resident tenure on exit (yrs) 7.7 6.5 6.5 - - 1.0 2.3 2.2 N/A 5.6
As at 30 June 2014
Units available for sale 11 6 5 9 10 13 45 3 N/A 102
Occupancy (%)1 95% 95% 100% 79% 70% 84% 70% 95% 98% 92%
Average resident entry age (yrs) 67 67 69 78 66 73 72 73 N/A 69
Average resident age (yrs) 77 77 74 79 68 74 73 75 N/A 75
Average resident tenure (yrs) 9.2 7.8 6.7 0.9 1.3 1.5 1.3 1.9 N/A 6.8
1. Occupancy for traditional DMF villages includes units which may not be physically occupied but contractually subject to DMF fees. 2. Settlers Noyea village disposed of on 31 July 2014.
Appendix 13 Settlers (DMF) sales
p48
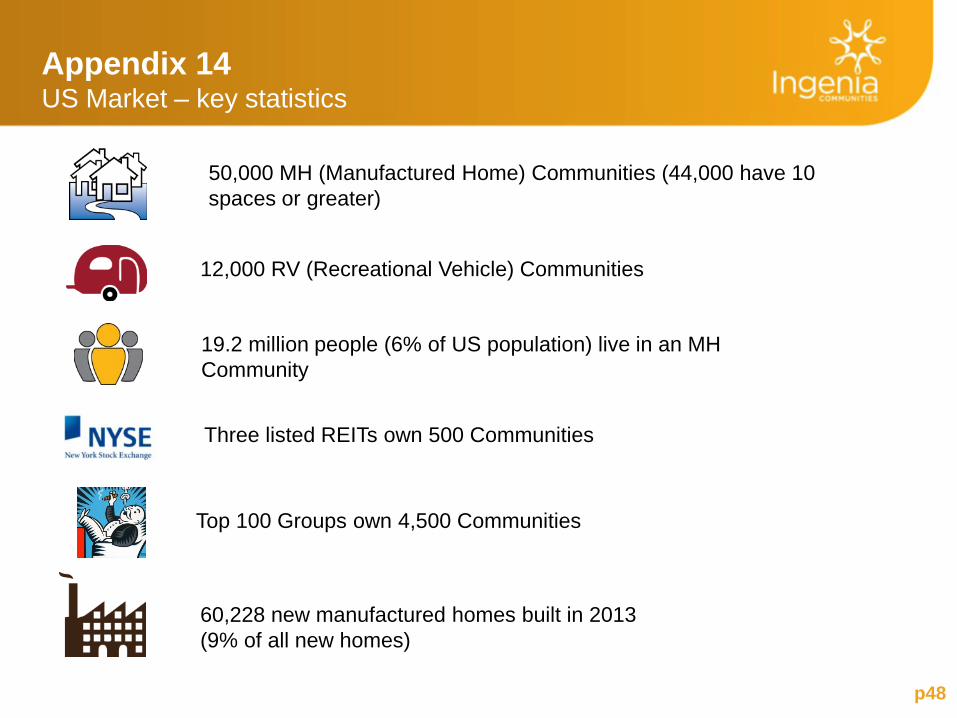
Appendix 14 US Market – key statistics
50,000 MH (Manufactured Home) Communities (44,000 have 10 spaces or greater)
19.2 million people (6% of US population) live in an MH Community
12,000 RV (Recreational Vehicle) Communities
Top 100 Groups own 4,500 Communities
Three listed REITs own 500 Communities
60,228 new manufactured homes built in 2013 (9% of all new homes)
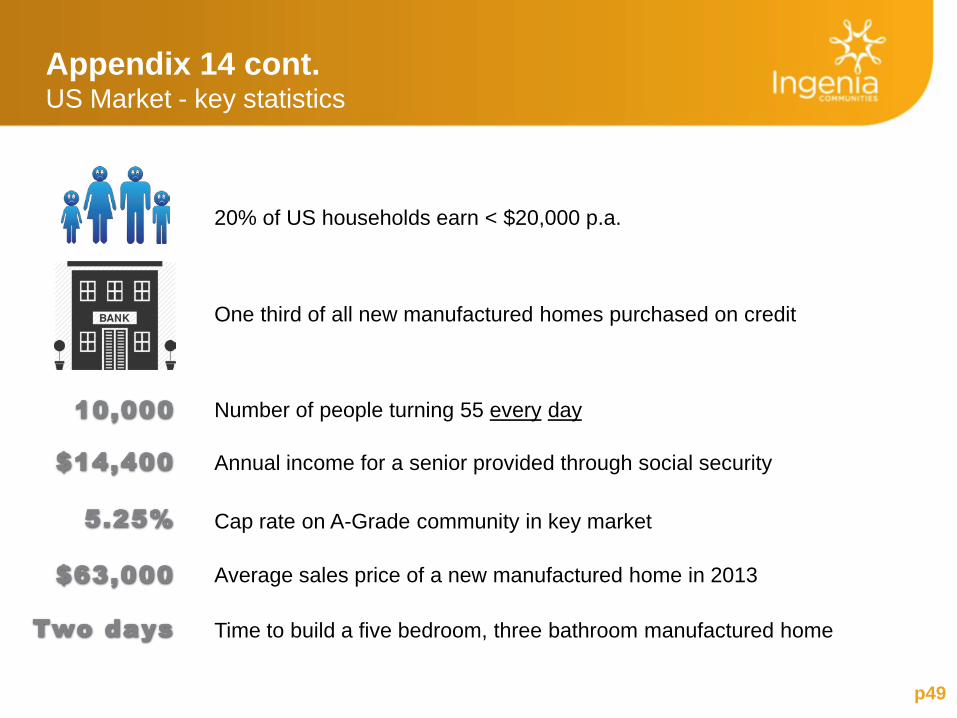
Appendix 14 cont. US Market - key statistics
p49
Cap rate on A-Grade community in key market
Number of people turning 55 every day
Average sales price of a new manufactured home in 2013
Time to build a five bedroom, three bathroom manufactured home
Annual income for a senior provided through social security
20% of US households earn < $20,000 p.a.
One third of all new manufactured homes purchased on credit
p50
US Market – key statistics
Cap rate on A-Grade community in key market
Number of people turning 55 every day
Average sales price of a new manufactured home in 2013
Time to build a five bedroom, three bathroom manufactured home
Annual income for a senior provided through social security
20% of US households earn < $20,000 p.a.
One third of all new manufactured homes purchased on credit
Disclaimer
p51
This presentation was prepared by Ingenia Communities Holdings Limited (ACN 154 444 925) and Ingenia Communities RE Limited (ACN 154 464 990) as responsible entity for Ingenia Communities Fund (ARSN 107 459 576) and Ingenia Communities Management Trust (ARSN 122 928 410) (together Ingenia Communities Group, INA or the Group). Information contained in this presentation is current as at 26 August 2014. This presentation is provided for information purposes only and has been prepared without taking account of any particular reader's financial situation, objectives or needs. Nothing contained in this presentation constitutes investment, legal, tax or other advice. Accordingly, readers should, before acting on any information in this presentation, consider its appropriateness, having regard to their objectives, financial situation and needs, and seek the assistance of their financial or other licensed professional adviser before making any investment decision. This presentation does not constitute an offer, invitation, solicitation or recommendation with respect to the subscription for, purchase or sale of any security, nor does it form the basis of any contract or commitment. Except as required by law, no representation or warranty, express or implied, is made as to the fairness, accuracy or completeness of the information, opinions and conclusions, or as to the reasonableness of any assumption, contained in this presentation. By reading this presentation and to the extent permitted by law, the reader releases each entity in the Group and its affiliates, and any of their respective directors, officers, employees, representatives or advisers from any liability (including, without limitation, in respect of direct, indirect or consequential loss or damage or loss or damage arising by negligence) arising in relation to any reader relying on anything contained in or omitted from this presentation. The forward looking statements included in this presentation involve subjective judgment and analysis and are subject to significant uncertainties, risks and contingencies, many of which are outside the control of, and are unknown to, the Group. In particular, they speak only as of the date of these materials, they assume the success of the Group’s business strategies, and they are subject to significant regulatory, business, competitive and economic uncertainties and risks. Actual future events may vary materially from forward looking statements and the assumptions on which those statements are based. Given these uncertainties, readers are cautioned not to place undue reliance on such forward looking statements. The Group, or persons associated with it, may have an interest in the securities mentioned in this presentation, and may earn fees as a result of transactions described in this presentation or transactions in securities in INA. This document is not an offer to sell or a solicitation of an offer to subscribe or purchase or a recommendation of any securities.