Embed Size (px)
Citation preview

FY09 Interim Result Six month period ended 31 December 2008
23 February 2009
SKYCITY Entertainment Group Limited

2
SKYCITY Interim Result 1H09 Agenda
I. Highlights and Results 3
II. Strategy and Outlook 10
III. Business Unit Results 13
IV. Appendices 26

1H09 Highlights and Results
4
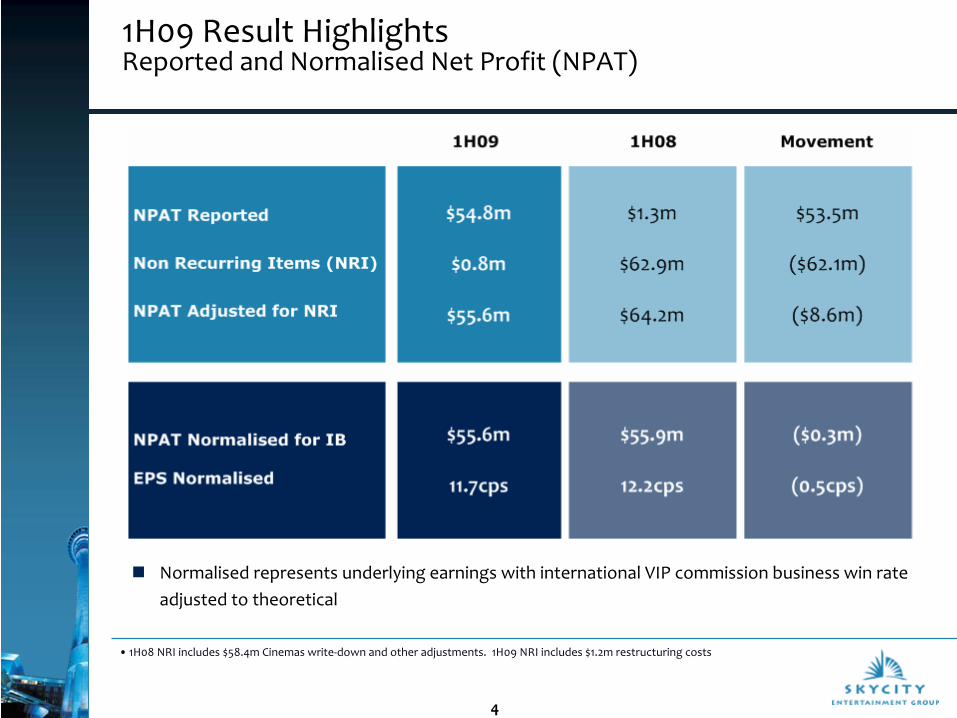
1H09 Result Highlights Reported and Normalised Net Profit (NPAT)
•1H08 NRI includes $58.4m Cinemas write‐down and other adjustments. 1H09 NRI includes $1.2m restructuring costs
Normalised represents underlying earnings with international VIP commission business win rate adjusted to theoretical

5
1H09 Result Highlights Reported Earnings
1H09$m
1H08$m
Movement$m
Revenue 422.1 421.5 0.6
EBITDA
Australian Casinos (A$36.5) 44.0 (A$35.5) 40.9 (A$1.0) 3.1
New Zealand Casinos 114.7 120.5 (5.8)
International Business 0.8 12.6 (11.8)
Cinemas 2.5 2.0 0.5
Corporate (13.5) (17.3) 3.8
Total EBITDA 148.5 158.7 (10.2)
EBITDA Margin 32.5% 34.8%
EBIT 111.7 122.9 (11.2)
NPAT 54.8 1.3 53.5
1H08 NPAT impacted by $58.4m write down of Cinemas carrying value
This page shows reported earnings. Earnings adjusted (for NRI) and normalised (International Business at theoretical win rate) earnings are set out on the following page
•Note: EBITDA margin is calculated as a % of GST‐inclusive gaming revenues and GST‐exclusive non‐gaming revenues to facilitate
Australasian comparisons
6
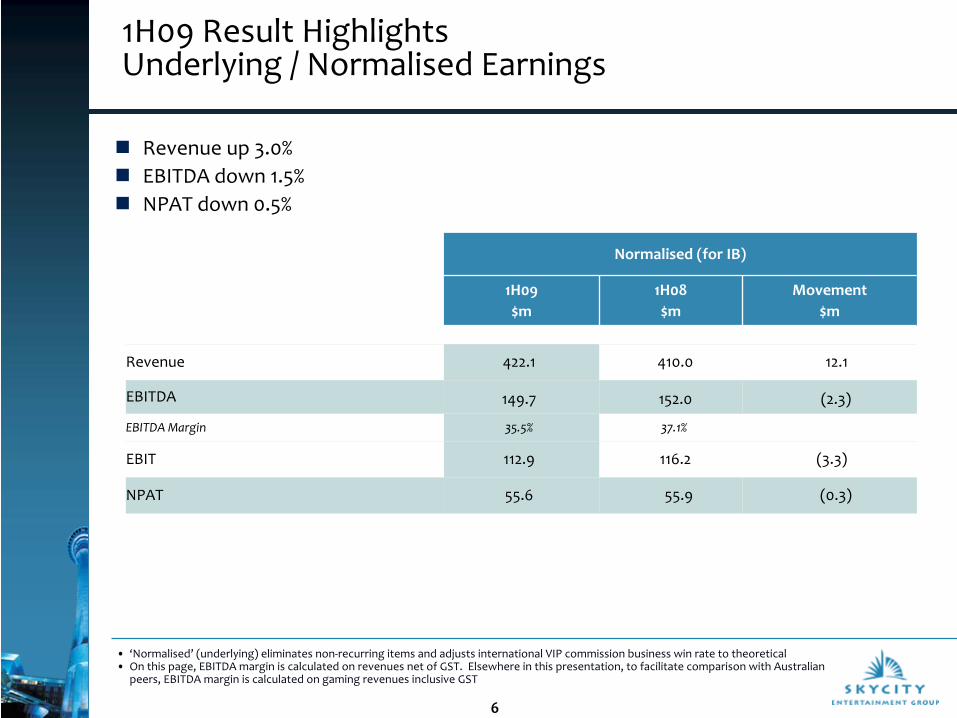
1H09 Result Highlights Underlying / Normalised Earnings
•
‘Normalised’
(underlying) eliminates non‐recurring items and adjusts international VIP commission business win rate to theoretical•
On this page, EBITDA margin is calculated on revenues net of GST. Elsewhere in this presentation, to facilitate comparison with
Australian
peers, EBITDA margin is calculated on gaming revenues inclusive GST
Normalised (for IB)
1H09$m
1H08$m
Movement $m
Revenue 422.1 410.0 12.1
EBITDA 149.7 152.0 (2.3)
EBITDA Margin 35.5% 37.1%
EBIT 112.9 116.2 (3.3)
NPAT 55.6 55.9 (0.3)
Revenue up 3.0%EBITDA down 1.5%NPAT down 0.5%

7
Key Features of 1H09 Result
Working hard across all properties to achieve revenue growth
Normalised earnings in line with corresponding prior period for both EBITDA and NPAT
Solid performance from Australian casinos
⎯
Adelaide revenue and earnings growth despite smoking ban introduction (November 07)
⎯
Darwin revenue growth continues despite expansion disruption
New Zealand operations relatively resilient despite challenging economic environment
Lower international business win rate impacts the comparison to corresponding prior period (for both revenues and EBITDA)
Cinemas business increased revenues and earnings
Tight management of capex
Neither earnings nor balance sheet impacted to any significant extent by currency fluctuations
⎯
Debt position hedged from FX exposure
Sound balance sheet and debt position

8
Secure Balance Sheet: Sound Debt Position
Debt well diversified with strong maturity profile
No maturity events until May 2010. New Zealand capital notes and Australian convertible notes (ACES ) mature in May 2010 and December 2010 respectively, but these facilities offer rollover flexibility
No significant refinancing until 2012
Significant headroom within existing covenants with no issues anticipated
⎯
Net Debt: EBITDA stable at 3.2x
⎯
Interest Cover (EBITDA/Net Interest) stable at 3.8x
Undrawn committed facilities of $500m as at 23/02/09
The USD/USPP exchange rate movement is fully hedged by a cross currency interest rate swap (CCIRS)
Drawn Debt Maturities by Financial Year (as at 31/12/08: NZ$964m)
$124
$485
$177$109
$47 $22
2009 2010 2011 2012 2013 2014 2015 2016 2017 2018 2019 2020 2020+
Capital Notes SKYCITY ACES USPP

9
1H09 Interim Distribution Strong yield at 9.0cps
Interim distribution 9.0cps (11.0cps 1H08) represents:
⎯
An effective annualised pre‐tax yield of 9.5%
at current share price levels
⎯
Record date 4 March 2009
⎯
Payment date 27 March 2009
Continuation of the distribution structure by way of non‐taxable bonus shares with fully‐imputed cash buyback alternative (PDP)
Bonus share discount of 2.5%
IRD private ruling re PDP expires 31/3/09. Extension applied for but no decision as yet
More conservative distribution policy going forward – refer page 12
Interim Dividends/Distributions (cents per share)
10.511.0
12.0 12.0
9.0
11.0
9.0
1H03 1H04 1H05 1H06 1H07 1H08 1H09

Strategy and Outlook
11
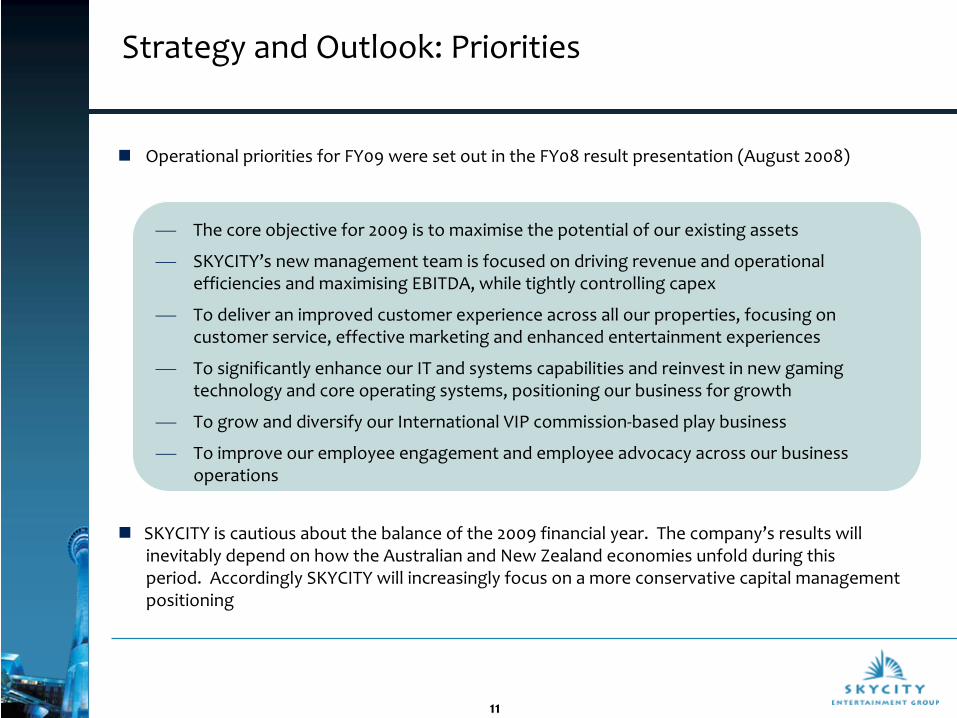
Strategy and Outlook: Priorities
Operational priorities for FY09 were set out in the FY08 result presentation (August 2008)
⎯
The core objective for 2009 is to maximise
the potential of our existing assets
⎯
SKYCITY’s new management team is focused on driving revenue and operational
efficiencies and maximising
EBITDA, while tightly controlling capex
⎯
To deliver an improved customer experience across all our properties, focusing on
customer service, effective marketing and enhanced entertainment
experiences
⎯
To significantly enhance our IT and systems capabilities and reinvest in new gaming
technology and core operating systems, positioning our business for growth
⎯
To grow and diversify our International VIP commission‐based play business
⎯
To improve our employee engagement and employee advocacy across our business
operations
SKYCITY is cautious about the balance of the 2009 financial year. The company’s results will inevitably depend on how the Australian and New Zealand economies unfold during this period. Accordingly SKYCITY will increasingly focus on a more conservative capital management positioning
12
Distribution Policy Going Forward
Consistent with SKYCITY’s increasing focus on a more conservative capital management positioning, the company plans to tighten its future shareholding distributions as below
⎯
Moving to a 60% ‐
70% distribution policy going forward
⎯
Priorities have changed in the current environment from a high payout ratio to an
increased focus on using funds available to reduce debt
⎯
Second half distribution will be set within the 60% ‐
70% (of NPAT) range

Business Unit Results

14
1H09: Revenue Summary by Business Unit
1H09$m
1H08$m
Movement $m
%
Australian Casinos
Adelaide (A$) 64.5 62.5 2.0 3.2%
Darwin (A$) 57.5 54.9 2.6 4.7%
Total Australia (A$) 122.0 117.4 4.6 3.9%
(NZ$) 147.2 135.3 11.9 8.8%
New Zealand Casinos
Auckland 202.9 205.3 (2.4) (1.2%)
Hamilton 19.9 20.0 (0.1) (0.5%)
Christchurch, Queenstown 7.1 6.5 0.6 9.2%
Total New Zealand 229.9 231.8 (1.9) (0.8%)
Casino Revenues 377.1 367.1 10.0 2.7%
International Business 7.6 21.9 (14.3) (65.3%)
Cinemas 37.4 32.5 4.9 15.1%
Group Revenues 422.1 421.5 0.6 0.1%
Revenues
(grossed up for Gaming GST) 456.3 456.6 (0.3) (0.1%)
15
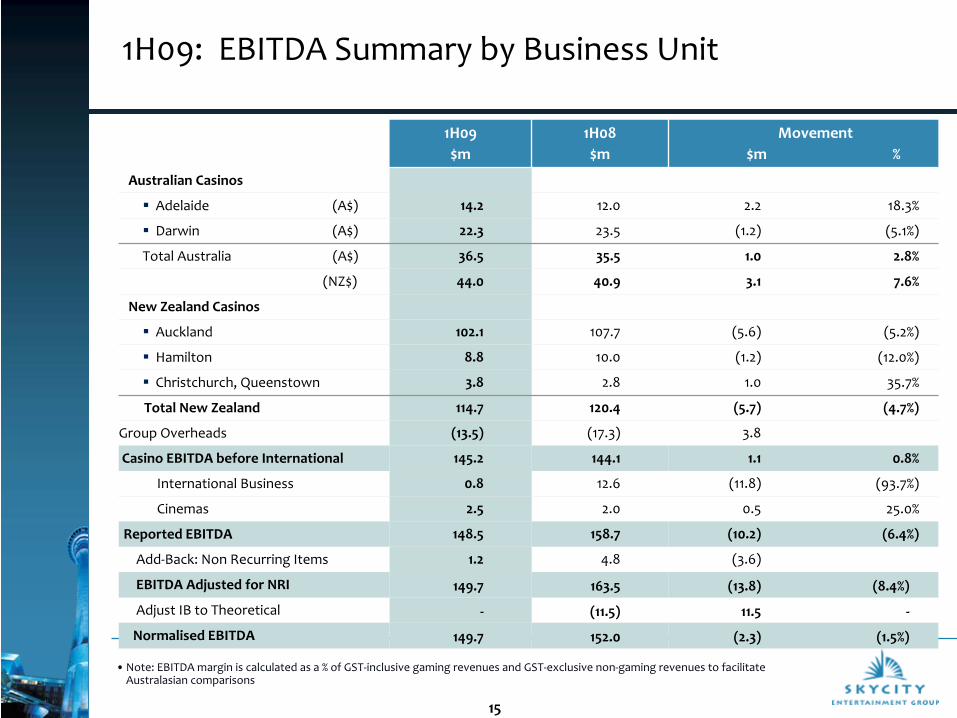
1H09: EBITDA Summary by Business Unit
1H09$m
1H08$m
Movement $m %
Australian Casinos
Adelaide (A$) 14.2 12.0 2.2 18.3%
Darwin (A$) 22.3 23.5 (1.2) (5.1%)
Total Australia (A$) 36.5 35.5 1.0 2.8%
(NZ$) 44.0 40.9 3.1 7.6%
New Zealand Casinos
Auckland 102.1 107.7 (5.6) (5.2%)
Hamilton 8.8 10.0 (1.2) (12.0%)
Christchurch, Queenstown 3.8 2.8 1.0 35.7%
Total New Zealand 114.7 120.4 (5.7) (4.7%)
Group Overheads (13.5) (17.3) 3.8
Casino EBITDA before International 145.2 144.1 1.1 0.8%
International Business 0.8 12.6 (11.8) (93.7%)
Cinemas 2.5 2.0 0.5 25.0%
Reported EBITDA 148.5 158.7 (10.2) (6.4%)
Add‐Back: Non Recurring Items 1.2 4.8 (3.6)
EBITDA Adjusted for NRI 149.7 163.5 (13.8) (8.4%)
Adjust IB to Theoretical ‐ (11.5) 11.5 ‐
Normalised EBITDA 149.7 152.0 (2.3) (1.5%)
•Note: EBITDA margin is calculated as a % of GST‐inclusive gaming revenues and GST‐exclusive non‐gaming revenues to facilitate
Australasian comparisons
16
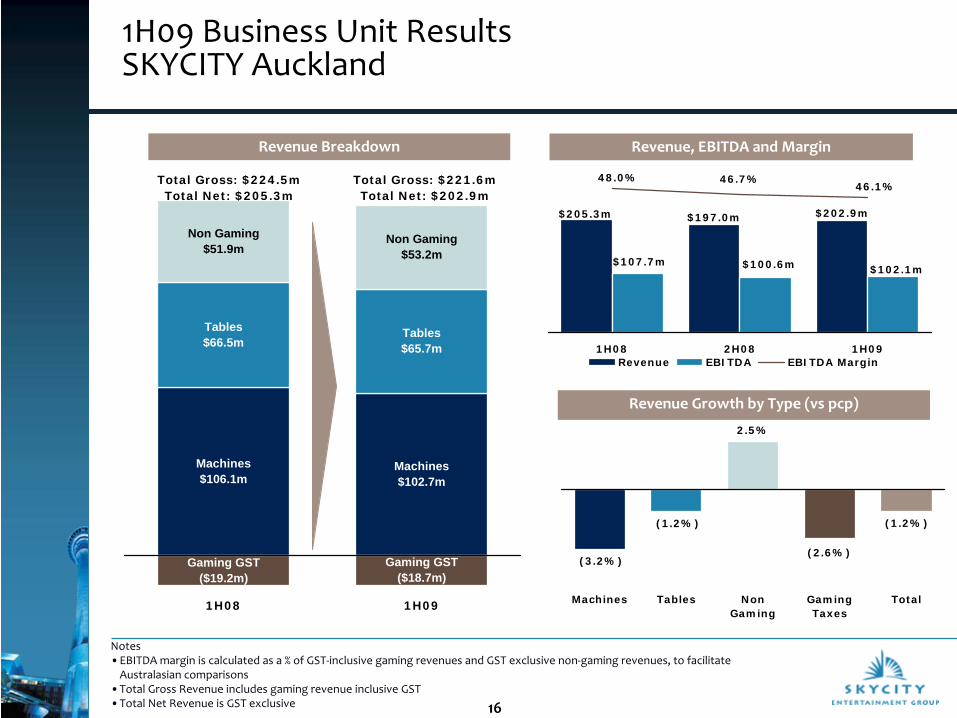
1H09 Business Unit Results SKYCITY Auckland
Revenue Breakdown Revenue, EBITDA and Margin
Revenue Growth by Type (vs
pcp)
Notes •EBITDA margin is calculated as a % of GST‐inclusive gaming revenues and GST exclusive non‐gaming revenues, to facilitate
Australasian comparisons•Total Gross Revenue includes gaming revenue inclusive GST•Total Net Revenue is GST exclusive
Tables $66.5m
Tables $65.7m
Gaming GST ($37.5m)
Non-Gaming
$51.9m
Non-Gaming
$53.2m
Machines $102.7m
Machines $106.1m
Tables $66.5m
Tables $65.7m
Gaming GST ($19.2m)
Gaming GST ($18.7m)
Non Gaming $53.2m
Non Gaming $51.9m
1H08 1H09
Total Gross: $224.5mTotal Net: $205.3m
Total Gross: $221.6mTotal Net: $202.9m
(3.2%)
(1.2%)
2.5%
(2.6%)
(1.2%)
Machines Tables NonGaming
GamingTaxes
Total
$197.0m$205.3m $202.9m
$102.1m$107.7m $100.6m
46.7%46.1%
48.0%
1H08 2H08 1H09Revenue EBITDA EBITDA Margin
17
1H09 Business Unit Results Key Features SKYCITY Auckland
Auckland revenues year to date have been relatively resilient
Modest growth during the six month period, with second quarter revenues up 5.8% over first quarter
Some increases in costs necessary to sustain revenues ‐ as a consequence, margin has softened slightly
Gaming machine revenues down 3.2 % on corresponding prior period (1H08) but 3.3% ahead of preceding half (2H08).
Second quarter performance from gaming machines improved following significant re‐layout and re‐design of
product
Gaming tables down marginally (‐1.2%) on corresponding prior period (1H08) but up (+0.9%) on preceding half (2H08)
Strong performance from non‐gaming with revenues ahead of both corresponding prior period (1H08) and preceding
half (2H08). SKYCITY Hotel (344 rooms) 80% occupancy and SKYCITY Grand (320 rooms) occupancy up strongly from
50% to 67%
Conventions and events strategies have delivered sustained revenue flows. Major events at SKYCITY Auckland have
included:
⎯
International Festival of Poker
⎯
Bob Geldof
charity dinner
⎯
Rugby charity dinner (Richie McCaw and Dan Carter)
⎯
Cricket charity dinner (Stephen Fleming and Shane Warne)
⎯
Louis Vuitton
Pacific Series
⎯
A1 GP Motor Show

18
Note: EBITDA margin is calculated as a % of GST‐inclusive gaming revenues and GST exclusive non‐gaming revenues
to facilitate Australasian comparisons
1H09 Business Unit Results SKYCITY Adelaide
A pleasing result in Adelaide with EBITDA up 18.3% over corresponding prior period
EBITDA gain due to both revenue growth and effective cost management
First half revenues up 3.2% over corresponding prior period despite full impact of smoking bans in 1H09 (v 4 months pre smoking bans in 1H08)
Introduction of new gaming product, including Rapid Roulette
Revenues grew steadily through the first half period culminating in record revenues on New Year’s Eve
Second quarter revenues up 10.5% over first quarter and 8.7% over corresponding prior period (2Q08)
Revenue Growth by Type (vs
pcp)
Revenue, EBITDA and Margin (A$)
(3.0%)
15.5%
(15.7%)
5.6%3.2%
Machines Tables NonGaming
GamingTaxes
Total
$62.5m $55.7m $64.5m
$12.0m $8.7m $14.2m
14.4%
20.2%17.7%
1H08 2H08 1H09
Revenue EBITDA EBITDA Margin
19
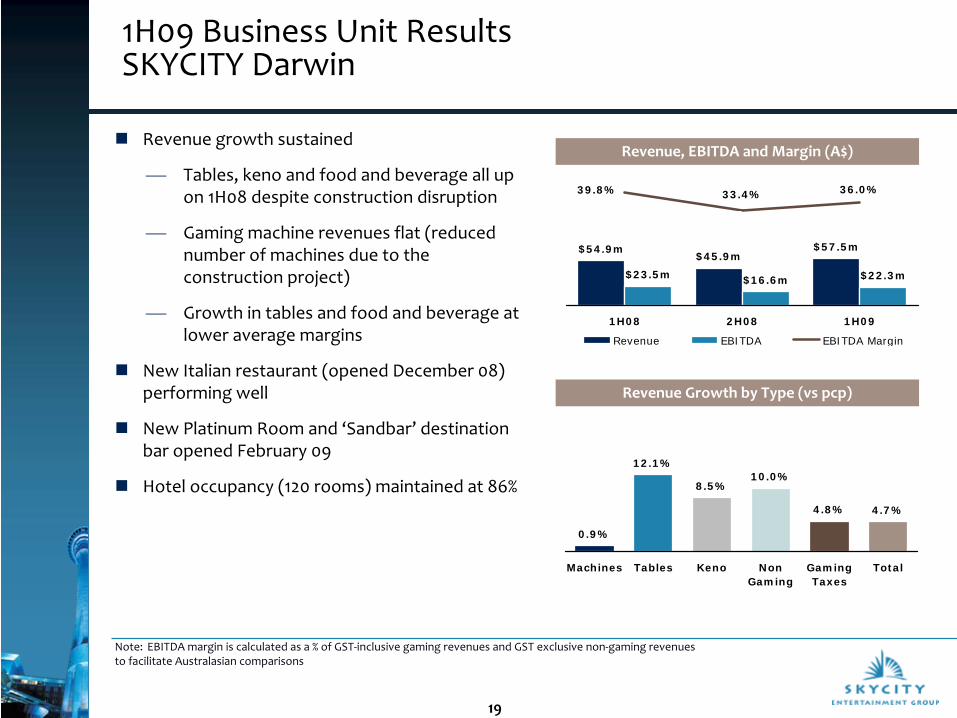
1H09 Business Unit Results SKYCITY Darwin
Revenue growth sustained
⎯
Tables, keno and food and beverage all up
on 1H08 despite construction disruption
⎯
Gaming machine revenues flat (reduced
number of machines due to the
construction project)
⎯
Growth in tables and food and beverage at
lower average margins
New Italian restaurant (opened December 08) performing well
New Platinum Room and ‘Sandbar’ destination bar opened February 09
Hotel occupancy (120 rooms) maintained at 86%
Revenue Growth by Type (vs
pcp)
Revenue, EBITDA and Margin (A$)
Note:
EBITDA margin is calculated as a % of GST‐inclusive gaming revenues and GST exclusive non‐gaming revenues
to facilitate Australasian comparisons
$54.9m$45.9m
$57.5m
$23.5m $16.6m $22.3m
33.4% 36.0%39.8%
1H08 2H08 1H09
Revenue EBITDA EBITDA Margin
0.9%
8.5%10.0%
4.8% 4.7%
12.1%
Machines Tables Keno NonGaming
GamingTaxes
Total

20
1H09 Business Unit Results SKYCITY Hamilton
Revenues in line with prior period but cost increases impacted the EBITDA outcome for the half
Focus on costs in second half targeted to restore EBITDA margin going forward
Strong focus on re‐engaging the Hamilton casino with the local community and to build customer support Revenue Growth by Type (vs
pcp)
Revenue, EBITDA and Margin
Note:
EBITDA margin is calculated as a % of GST‐inclusive gaming revenues and GST exclusive non‐gaming revenuesto facilitate Australasian comparisons
$20.0m $19.0m $19.9m
$10.0m $8.5m $8.8m
40.5%45.2%40.0%
1H08 2H08 1H09
Revenue EBITDA EBITDA Margin
(1.5%)
2.0%
0.0% 0.0%
(0.5%)
Machines Tables NonGaming
GamingTaxes
Total

21
1H09 Business Unit Results International Business
1H09 comparison to 1H08 impacted by very high turnover and win rate in 1H08
International VIP Commission Business turnover down 16% over 1H08
1.32% win rate (theoretical 1.33%) compared to 3.19% in 1H08
EBITDA at $0.8m well down on exceptionally strong $12.6m result in 1H08 Revenues: Actual v Theoretical
Revenue and EBITDA
Notes: Revenue is before commissions and taxes
$21.9m
$12.1m
$7.6m
$12.6m
$4.6m
$0.8m
1H08 2H08 1H09
Revenue EBITDA
$21.9m
$12.1m
$7.6m$10.4m $9.9m
$7.6m
1H08 2H08 1H09
Actual Revenue Theoretical Revenue
Turnover
$m
Win Rate
%
1H08 762 3.19%
2H08 675 1.92%
1H09 640 1.32%

22
1H09 Business Unit Results Christchurch and Queenstown
Christchurch EarningsChristchurch
Queenstown Revenue and EBITDAQueenstown
1H08 2H08 1H09
Revenue $34.3m $34.7m $33.7m
EBITDA $11.2m $12.2m $11.3m
EBITDA % 32.7% 35.2% 33.5%
Contribution
to SKYCITY $2.7m $3.0m $3.4m
Following the sale of the Christchurch Crowne Plaza Hotel in July and acquisition of the Intercontinental Hotels Group shareholding, SKYCITY’s effective shareholding interest in Christchurch Casino has increased from 40.5% to 45.7%
Christchurch Casino revenues and earnings steady through the last 18 month period
Renovation of level 2 of the casino area improves presentation and will refresh the customer experience.
1H08 2H08 1H09
Revenue $3.5m $3.5m $3.4m
EBITDA $0.2m $0.3m $0.4m
EBITDA % 5.1% 7.7% 10.5%
Note: Queenstown EBITDA margin is calculated as a % of GST‐inclusive gaming revenues and GST exclusive non‐gaming revenues to facilitate Australasian comparisons
Steady revenues through the last 18 months with active cost management leading to improved EBITDA.

23
1H09 Business Unit Results SKYCITY Cinemas
New management appointed during 1H09
Revenues up 15% over 1H08 with openings of new cinemas (Albany and Manukau in Auckland)
1H09 EBITDA includes $0.4m of costs related to the closure of Rialto Hamilton and the opening of Manukau
Going forward, EBITDA expected to build through revenue growth and cost effectiveness
New Auckland cinemas (10 screen complexes at Albany and Manukau) consolidate SKYCITY’s dominant position in the prime Auckland market
Auckland market share up from 55% to 65% following the openings of Albany and Manukau
Revenues
EBITDA
$32.5m $33.7m$37.4m
1H08 2H08 1H09
$2.0m$2.8m $2.5m
1H08 2H08 1H09
24
Summary
Relatively resilient revenues and earnings to date
Strong balance sheet with sound debt profile
Tight control on capital expenditure
Distribution policy reduced in favour of capital management / debt reduction
Cautious outlook which will depend on how the Australian and New Zealand economies unfold
25
Disclaimer
All information included in this presentation is provided as at 23 February 2009.
The presentation includes a number of forward‐looking statements. Forward looking statements, by their nature, involve inherent risks and uncertainties. Many of those risks and uncertainties are matters which are beyond SKYCITY’s control and could cause actual results to differ from those predicted. Variations could either be materially positive or materially negative.
This presentation has not taken into account any particular investor’s investment objectives or other circumstances. Investors are encouraged to make an independent assessment of SKYCITY.

AppendicesFurther Financial Details and
Explanatory Notes
FY09 Interim Result Six month period ended 31 December 2008

27
Index to Appendix Items
I Adjusted and Normalised Earnings and NPAT 28
II P&L Summary by Business Unit 29
III Reported EBITDA Bridge 30
IV Auckland 31
V Adelaide 32
VI Darwin 33
VII Hamilton 34
VIII Queenstown 35
IX International Business 36
X Christchurch 37
XI Cinemas 38
XII Revenue and EBITDA Margin 39
XIII Australian Dollar Earnings 40
XIV Debt Movement 41
XV Hedged Position: USPP 42
XVI Interest and Tax 43
XVII Consolidated Balance Sheet 44
XVIII Balance Sheet Notes 46
28
I Adjusted and Normalised Earnings and NPAT
1H09 1H08
EBITDA$m
EBIT$m
NPAT$m
EBITDA$m
EBIT$m
NPAT$m
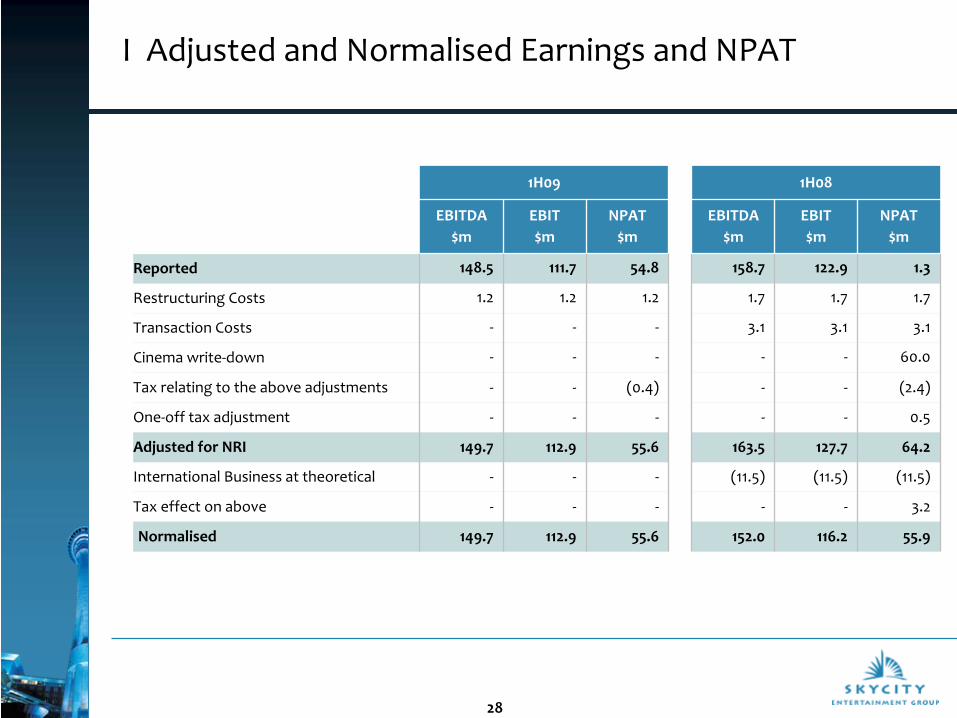
Reported 148.5 111.7 54.8 158.7 122.9 1.3
Restructuring Costs 1.2 1.2 1.2 1.7 1.7 1.7
Transaction Costs ‐ ‐ ‐ 3.1 3.1 3.1
Cinema write‐down ‐ ‐ ‐ ‐ ‐ 60.0
Tax relating to the above adjustments ‐ ‐ (0.4) ‐ ‐ (2.4)
One‐off tax adjustment ‐ ‐ ‐ ‐ ‐ 0.5
Adjusted for NRI 149.7 112.9 55.6 163.5 127.7 64.2
International Business at theoretical ‐ ‐ ‐ (11.5) (11.5) (11.5)
Tax effect on above ‐ ‐ ‐ ‐ ‐ 3.2
Normalised 149.7 112.9 55.6 152.0 116.2 55.9
29
II P&L Summary by Business Unit
•Note: EBITDA margin is calculated as a % of GST‐inclusive gaming revenues and GST‐exclusive non‐gaming revenues to facilitate
Australasian comparisons
Au
ckla
nd
Ad
ela
ide
Darw
in
Inte
rnati
on
al
Bu
sin
ess
Ham
ilto
n
Oth
er
NZ
O
pera
tio
ns
Co
rpo
rate
/
Gro
up
Su
b-T
ota
l
Cin
em
as
SK
YC
ITY
G
rou
p
Au
ckla
nd
Ad
ela
ide
Darw
in
Inte
rnati
on
al
Bu
sin
ess
Ham
ilto
n
Oth
er
NZ
O
pera
tio
ns
Co
rpo
rate
/
Gro
up
Su
b-T
ota
l
Cin
em
as
SK
YC
ITY
G
rou
p
NZ$m A$m A$m NZ$m NZ$m NZ$m NZ$m NZ$m NZ$m NZ$m NZ$m A$m A$m NZ$m NZ$m NZ$m NZ$m NZ$m NZ$m NZ$m
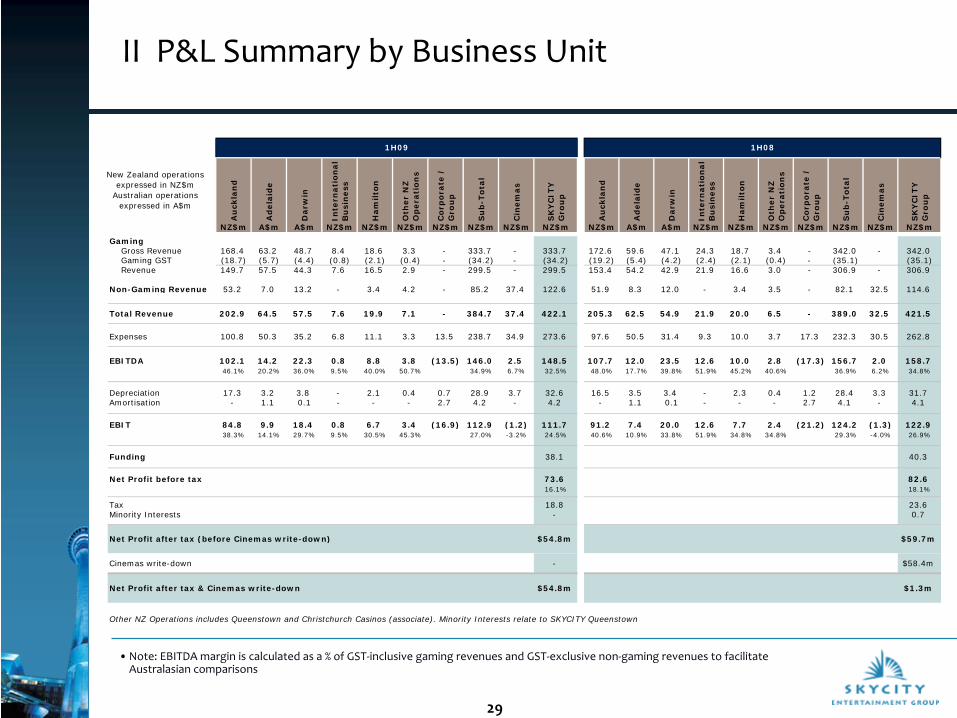
GamingGross Revenue 168.4 63.2 48.7 8.4 18.6 3.3 - 333.7 - 333.7 172.6 59.6 47.1 24.3 18.7 3.4 - 342.0 - 342.0 Gaming GST (18.7) (5.7) (4.4) (0.8) (2.1) (0.4) - (34.2) - (34.2) (19.2) (5.4) (4.2) (2.4) (2.1) (0.4) - (35.1) (35.1)Revenue 149.7 57.5 44.3 7.6 16.5 2.9 - 299.5 - 299.5 153.4 54.2 42.9 21.9 16.6 3.0 - 306.9 - 306.9
Non-Gaming Revenue 53.2 7.0 13.2 - 3.4 4.2 - 85.2 37.4 122.6 51.9 8.3 12.0 - 3.4 3.5 - 82.1 32.5 114.6
Total Revenue 202.9 64.5 57.5 7.6 19.9 7.1 - 384.7 37.4 422.1 205.3 62.5 54.9 21.9 20.0 6.5 - 389.0 32.5 421.5
Expenses 100.8 50.3 35.2 6.8 11.1 3.3 13.5 238.7 34.9 273.6 97.6 50.5 31.4 9.3 10.0 3.7 17.3 232.3 30.5 262.8
EBITDA 102.1 14.2 22.3 0.8 8.8 3.8 (13.5) 146.0 2.5 148.5 107.7 12.0 23.5 12.6 10.0 2.8 (17.3) 156.7 2.0 158.7 46.1% 20.2% 36.0% 9.5% 40.0% 50.7% 34.9% 6.7% 32.5% 48.0% 17.7% 39.8% 51.9% 45.2% 40.6% 36.9% 6.2% 34.8%
Depreciation 17.3 3.2 3.8 - 2.1 0.4 0.7 28.9 3.7 32.6 16.5 3.5 3.4 - 2.3 0.4 1.2 28.4 3.3 31.7 Amortisation - 1.1 0.1 - - - 2.7 4.2 - 4.2 - 1.1 0.1 - - - 2.7 4.1 - 4.1
EBIT 84.8 9.9 18.4 0.8 6.7 3.4 (16.9) 112.9 (1.2) 111.7 91.2 7.4 20.0 12.6 7.7 2.4 (21.2) 124.2 (1.3) 122.9 38.3% 14.1% 29.7% 9.5% 30.5% 45.3% 27.0% -3.2% 24.5% 40.6% 10.9% 33.8% 51.9% 34.8% 34.8% 29.3% -4.0% 26.9%
Funding 38.1 40.3
Net Profit before tax 73.6 82.6 16.1% 18.1%
Tax 18.8 23.6 Minority Interests - 0.7
Net Profit after tax (before Cinemas write-down) $54.8m $59.7m
Cinemas write-down - $58.4m
Net Profit after tax & Cinemas write-down $54.8m $1.3m
Other NZ Operations includes Queenstown and Christchurch Casinos (associate). Minority Interests relate to SKYCITY Queenstown
New Zealand operations expressed in NZ$m
Australian operations expressed in A$m
1H081H09
30
III 1H08 to 1H09 Reported EBITDA Bridge
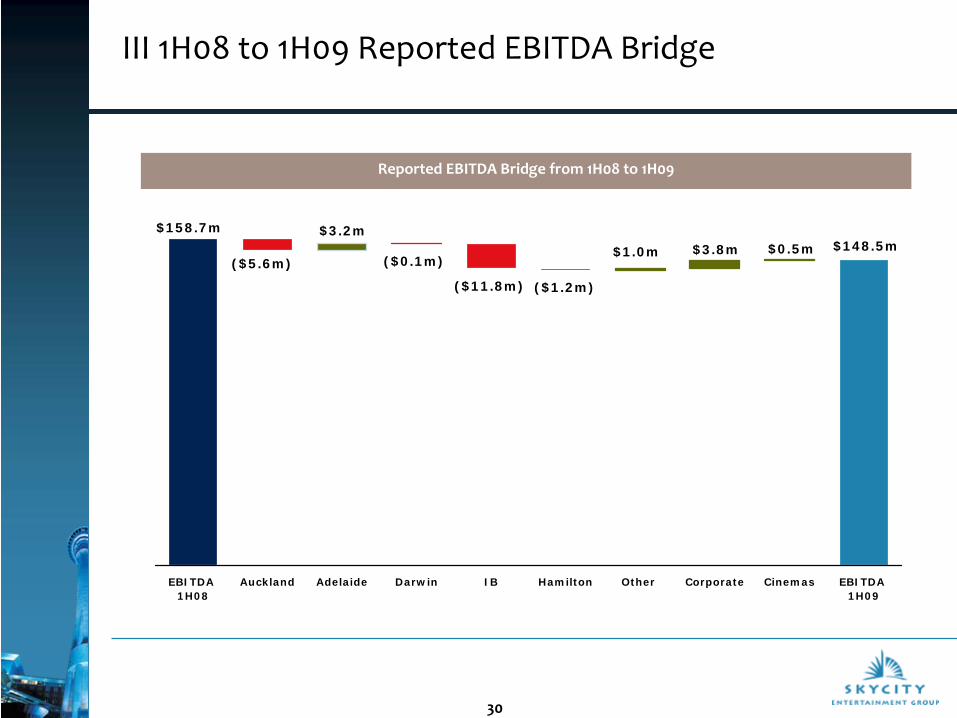
Reported EBITDA Bridge from 1H08 to 1H09
($1.2m)
$158.7m
($0.1m)($5.6m)
$3.2m
($11.8m)
$1.0m $3.8m $148.5m$0.5m
EBITDA 1H08
Auckland Adelaide Darwin IB Hamilton Other Corporate Cinemas EBITDA 1H09

31
IV 1H09 Result ‐
SKYCITY Auckland
1H09$m
1H08$m
Movement$m %
Revenues
Machines 102.7 106.1 (3.4) (3.2%)
Tables 65.7 66.5 (0.8) (1.2%)
Gross gaming revenue 168.4 172.6 (4.2) (2.4%)
Less GST on gaming revenue 18.7 19.2 (0.5) (2.6%)
Gaming Revenue (net of GST) 149.7 153.4 (3.7) (2.4%)
Food and beverage 17.4 17.8 (0.4) (2.2%)
Hotels and conventions 24.9 23.3 1.6 6.9%
Sky Tower, parking, other 10.9 10.8 0.1 0.9%
Non‐Gaming Revenue 53.2 51.9 1.3 2.5%
Total Revenue 202.9 205.3 (2.4) (1.2%)
Expenses 100.8 97.6 3.2 3.3%
EBITDAEBITDA margin
102.146.1%
107.748.0%
(5.6) (5.2%)
Depreciation 17.3 16.5 0.8 4.8%
EBIT 84.8 91.2 (6.4) (7.0%)
Note: EBITDA margin is calculated as a % of GST‐inclusive gaming revenues and GST exclusive non‐gaming revenues to
facilitate Australasian comparisons

32
V 1H09 Result ‐
SKYCITY Adelaide
1H09A$m
1H08A$m
MovementA$m %
Revenues
Machines 29.6 30.5 (0.9) (3.0%)
Tables 33.6 29.1 4.5 15.5%
Gross gaming revenue 63.2 59.6 3.6 6.0%
Less GST on gaming revenue 5.7 5.4 0.3 5.6%
Gaming Revenue (net of GST) 57.5 54.2 3.3 6.1%
Food and beverage, other 7.0 8.3 (1.3) (15.7%)
Total Revenue 64.5 62.5 2.0 3.2%
Expenses 50.3 50.5 (0.2) (0.4%)
EBITDAEBITDA margin
14.220.2%
12.017.7%
2.2 18.3%
DepreciationAmortisation (casino licence)
3.21.1
3.51.1
(0.3)‐
(8.6%)‐
EBIT 9.9 7.4 2.5 33.8%
Note: EBITDA margin is calculated as a % of GST‐inclusive gaming revenues and GST exclusive non‐gaming revenues
to facilitate Australasian comparisons
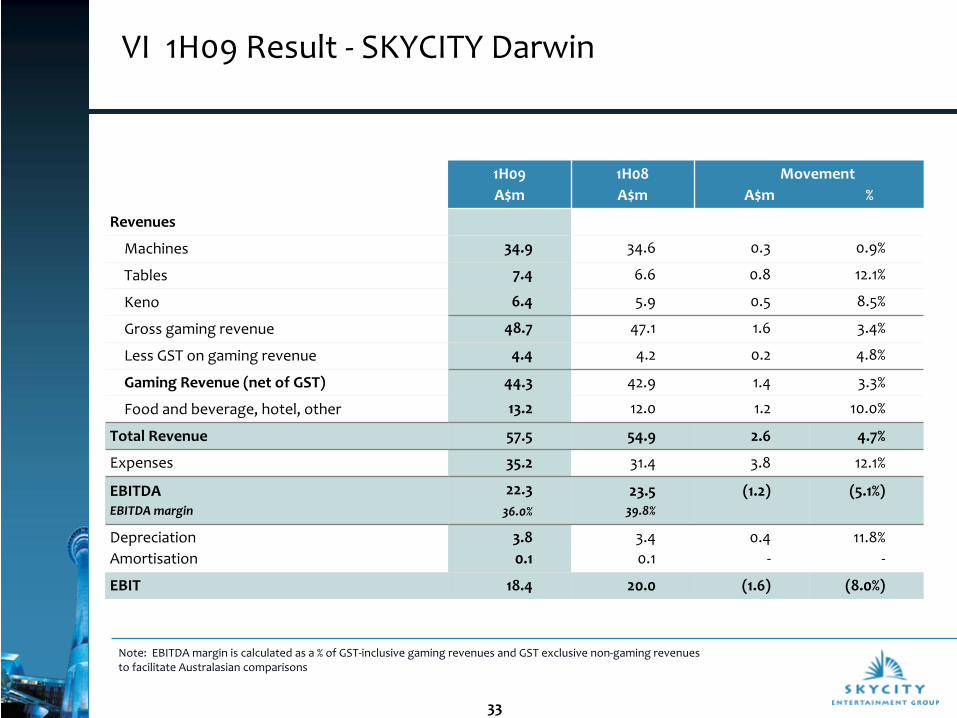
33
VI 1H09 Result ‐
SKYCITY Darwin
1H09A$m
1H08A$m
MovementA$m %
Revenues
Machines 34.9 34.6 0.3 0.9%
Tables 7.4 6.6 0.8 12.1%
Keno 6.4 5.9 0.5 8.5%
Gross gaming revenue 48.7 47.1 1.6 3.4%
Less GST on gaming revenue 4.4 4.2 0.2 4.8%
Gaming Revenue (net of GST) 44.3 42.9 1.4 3.3%
Food and beverage, hotel, other 13.2 12.0 1.2 10.0%
Total Revenue 57.5 54.9 2.6 4.7%
Expenses 35.2 31.4 3.8 12.1%
EBITDAEBITDA margin
22.336.0%
23.539.8%
(1.2) (5.1%)
DepreciationAmortisation
3.80.1
3.40.1
0.4‐
11.8%‐
EBIT 18.4 20.0 (1.6) (8.0%)
Note: EBITDA margin is calculated as a % of GST‐inclusive gaming revenues and GST exclusive non‐gaming revenues
to facilitate Australasian comparisons

34
VII 1H09 Result ‐
SKYCITY Hamilton
1H09$m
1H08$m
Movement$m %
Revenues
Machines 13.5 13.7 (0.2) (1.5%)
Tables 5.1 5.0 0.1 2.0%
Gross gaming revenue 18.6 18.7 (0.1) (0.5%)
Less GST on gaming revenue 2.1 2.1 ‐ ‐
Gaming Revenue (net of GST) 16.5 16.6 (0.1) (0.6%)
Food and beverage, other 3.4 3.4 ‐ ‐
Total Revenue 19.9 20.0 (0.1) (0.5%)
Expenses 11.1 10.0 1.1 11.0%
EBITDAEBITDA margin
8.840.0%
10.045.2%
(1.2) (12.0%)
Depreciation 2.1 2.3 (0.2) (8.7%)
EBIT 6.7 7.7 (1.0) (13.0%)
Note: EBITDA margin is calculated as a % of GST‐inclusive gaming revenues and GST exclusive non‐gaming revenues to
facilitate Australasian comparisons

35
VIII 1H09 Result ‐
SKYCITY Queenstown
1H09$m
1H08$m
Movement $m %
Revenues
Machines 1.9 2.1 (0.2) (9.5%)
Tables 1.4 1.3 0.1 7.7%
Gross gaming revenue 3.3 3.4 (0.1) (2.9%)
Less GST on gaming revenue 0.4 0.4 ‐ ‐
Gaming Revenue (net of GST) 2.9 3.0 (0.1) (3.3%)
Food and beverage, other 0.5 0.5 ‐ ‐
Total Revenue 3.4 3.5 (0.1) (2.9%)
Expenses 3.0 3.3 (0.3) (9.1%)
EBITDAEBITDA margin
0.410.5%
0.25.1%
0.2 100.0%
Depreciation 0.3 0.3 ‐ ‐
EBIT 0.1 (0.1) 0.2
Note: EBITDA margin is calculated as a % of GST‐inclusive gaming revenues and GST exclusive non‐gaming revenues
to facilitate Australasian comparisons
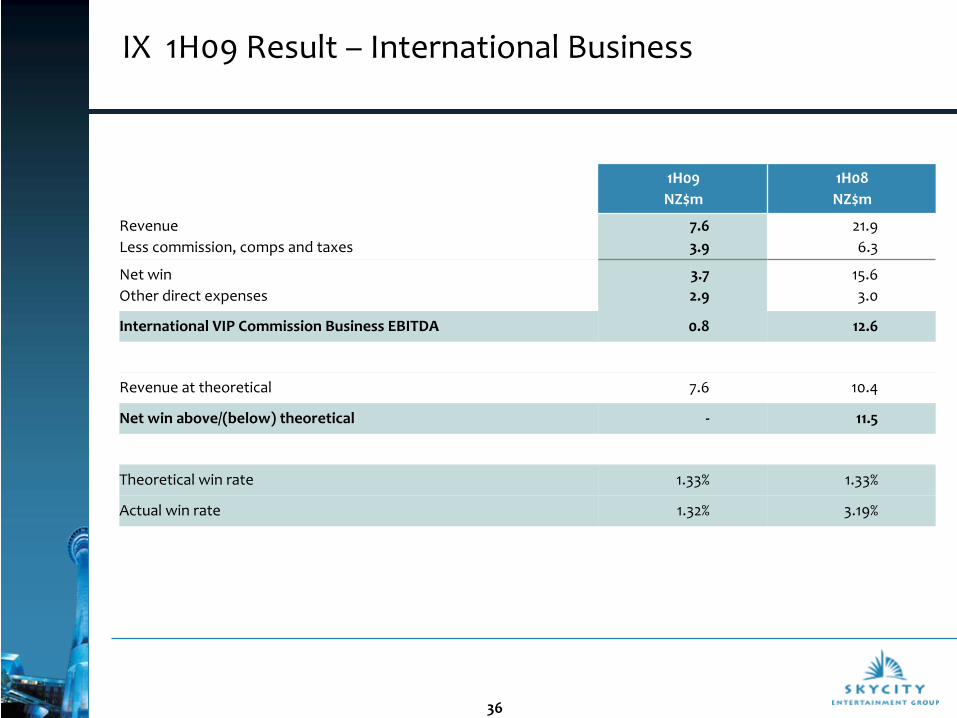
36
IX 1H09 Result –
International Business
1H09NZ$m
1H08NZ$m
RevenueLess commission, comps and taxes
7.63.9
21.96.3
Net winOther direct expenses
3.72.9
15.63.0
International VIP Commission Business EBITDA 0.8 12.6
Revenue at theoretical 7.6 10.4
Net win above/(below) theoretical ‐ 11.5
Theoretical win rate 1.33% 1.33%
Actual win rate 1.32% 3.19%

37
X 1H09 Result ‐
Christchurch Casino
Christchurch Casino is not consolidated into the SKYCITY Group result. Contribution from Christchurch Casino represents 45.7%
(2H08) and 30.7% (1H08) equity earnings plus interest received on shareholder advances
1H09$m
1H08$m
Movement$m %
Revenues
Gaming 28.3 28.5 (0.2) (0.7%)
Food and beverage, other 5.4 5.8 (0.4) (6.9%)
Total Revenue 33.7 34.3 (0.6) (1.7%)
Expenses 22.4 23.1 (0.7) (3.0%)
EBITDAEBITDA margin
11.333.5%
11.232.7%
0.1 0.9%
Depreciation 1.9 1.7 0.2 11.8%
EBIT 9.4 9.5 (0.1) (1.1%)
Contribution to SKYCITY 3.4 2.7 0.7 25.9%
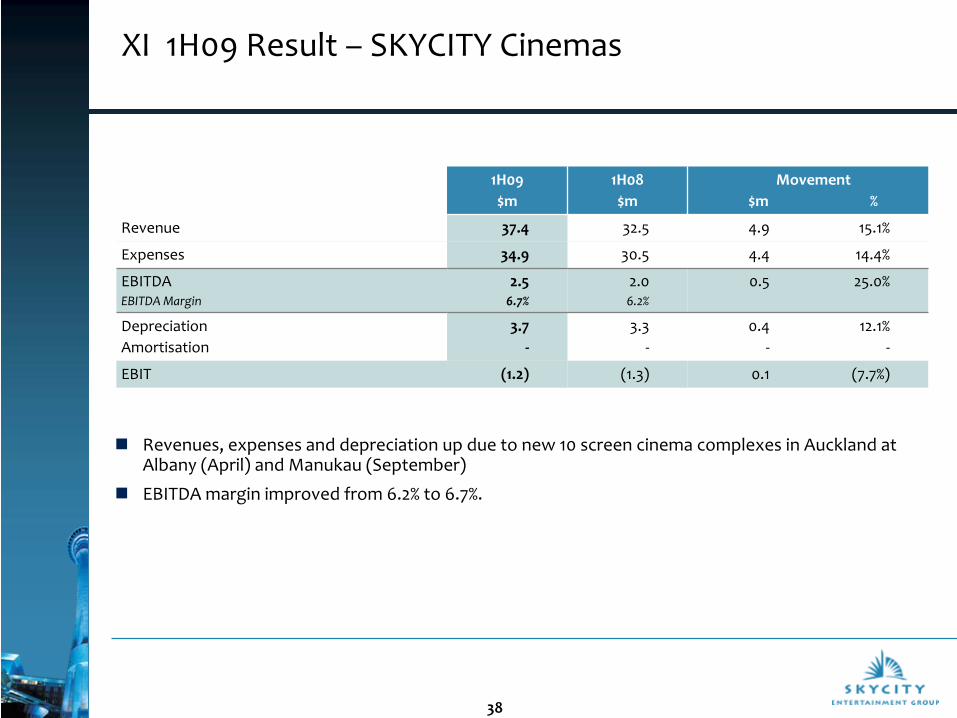
38
XI 1H09 Result –
SKYCITY Cinemas
1H09$m
1H08$m
Movement $m %
Revenue 37.4 32.5 4.9 15.1%
Expenses 34.9 30.5 4.4 14.4%
EBITDAEBITDA Margin
2.56.7%
2.06.2%
0.5 25.0%
DepreciationAmortisation
3.7‐
3.3‐
0.4‐
12.1%‐
EBIT (1.2) (1.3) 0.1 (7.7%)
Revenues, expenses and depreciation up due to new 10 screen cinema complexes in Auckland at Albany (April) and Manukau (September)
EBITDA margin improved from 6.2% to 6.7%.
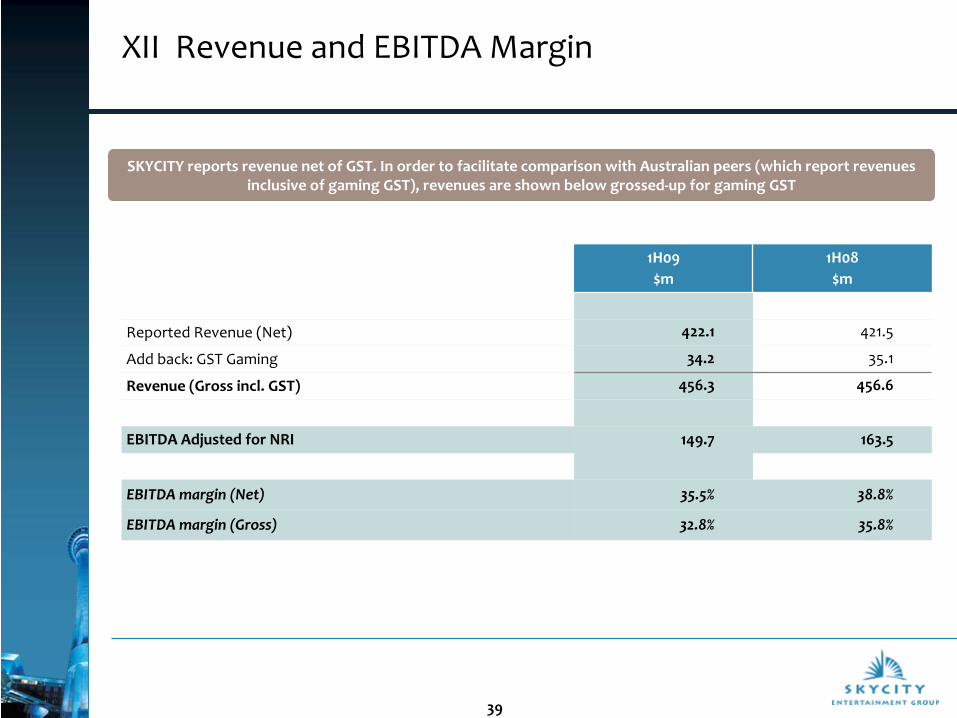
39
XII Revenue and EBITDA Margin
1H09$m
1H08$m
Reported Revenue (Net) 422.1 421.5
Add back: GST Gaming 34.2 35.1
Revenue (Gross incl. GST) 456.3 456.6
EBITDA Adjusted for NRI 149.7 163.5
EBITDA margin (Net) 35.5% 38.8%
EBITDA margin (Gross) 32.8% 35.8%
SKYCITY reports revenue net of GST. In order to facilitate comparison with Australian peers (which report revenues
inclusive of gaming GST), revenues are shown below grossed‐up for gaming GST

40
XIII Australian Dollar Earnings Adelaide and Darwin
Average NZD:AUD cross‐rate during 1H09 0.8312
Average NZD:AUD cross‐rate during 1H08 0.8676
Restating 1H08 prior period at 0.8312 to remove the FX differential would have the following impact:
–
1H08 reported EBITDA +$1.8m
–
1H08 Normalised NPAT +$0.9m
Impact of currency variation on the 1H09 v 1H08 earnings comparison not material.
41
XIV Debt Movement
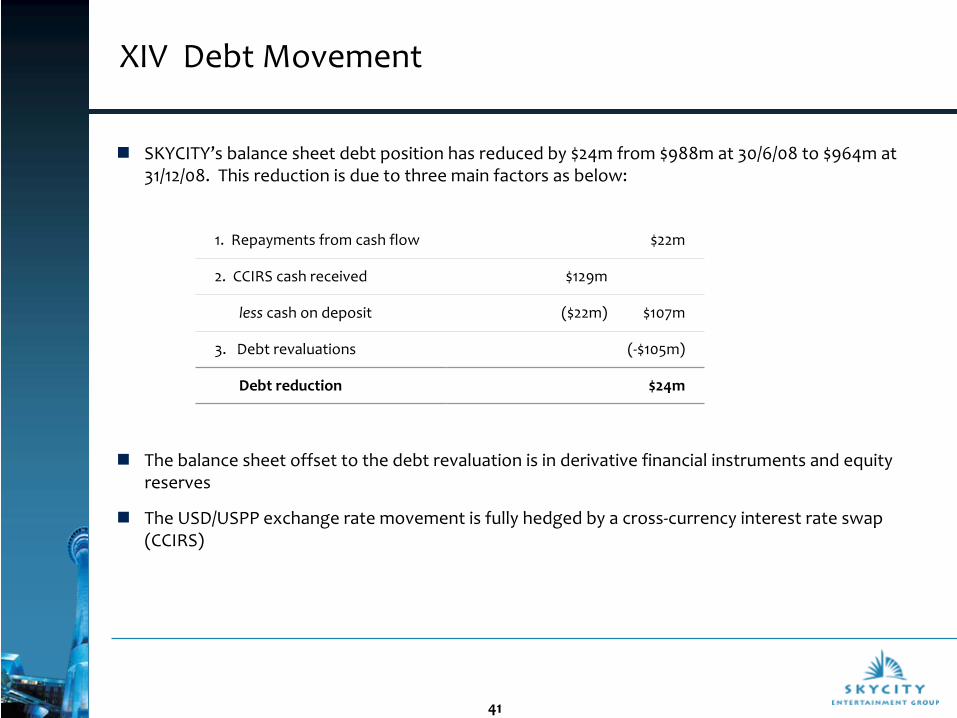
SKYCITY’s balance sheet debt position has reduced by $24m from $988m at 30/6/08 to $964m at 31/12/08. This reduction is due to three main factors as below:
The balance sheet offset to the debt revaluation is in derivative financial instruments and equity reserves
The USD/USPP exchange rate movement is fully hedged by a cross‐currency interest rate swap (CCIRS)
1. Repayments from cash flow $22m
2. CCIRS cash received $129m
less
cash on deposit ($22m) $107m
3. Debt revaluations (‐$105m)
Debt reduction $24m

42
XV Hedged Debt Position: USPP
SKYCITY’s USD debt (US Private Placement US$274.5m) is fully hedged by cross‐currency interest rate swaps (CCIRS) which are aligned to the maturity dates of the USPP
Fair value of the CCIRS at 31/12/08 was NZ$140.2m. Security arrangements with the counterparty mean that $129.3m in cash had been received by SKYCITY as at 31/12/08 to offset any credit risk re the counterparty (Deutsche Bank)
This cash has, in the meantime, been used to fully repay the bank debt facility of $129m and increase cash deposits. At the time of repayment of the USD debt, any cash received as security will be used to fund repayment of the USPP debt
The amount of cash received as security will vary with movements in the NZD/USD exchange rate. At current exchange rates (below 0.71) SKYCITY is able to use the cash received to (temporarily) pay down debt. This in‐cash position will continue as long as the NZD/USD exchange rate remains below the CCIRS rate of 0.71.

43
XVI Interest and Tax
Reduced funding costs due to lower debt and interest rates
77% of debt drawn down (as at 23/2/09) is at fixed interest
SKYCITY’s weighted average cost of debt (inclusive margin) was 7.65% for the 1H09 period, compared to 7.68% for the 1H08 period
Tax rate for 1H09 at 25.5% compared to 28.6% in 1H08. Ongoing tax rate projected at ~26.5%.

44
XVII Consolidated Balance Sheet SKYCITY Entertainment Group Limited
As at
31/12/08NZ$m
As at
30/6/08NZ$m
EquityShare Capital 482.2 460.8Retained profits (18.9) (24.3)Reserves (4.9) 34.0Minority interests 1.3 1.9
Total Equity 459.7 472.4
Current AssetsCash and bank 84.5 61.9Receivables and prepayments 35.6 31.5Inventories 6.9 5.9Tax receivables 14.0 33.8Derivative financial instruments ‐ 1.3Total Current Assets 141.0 134.4
Non‐Current AssetsProperty, plant and equipment 1,005.6 991.2Investment property ‐ 8.9Intangible assets 397.7 418.5Investments in associates 83.3 84.0Deferred tax assets 24.1 11.7Tax receivables ‐ 11.5Derivative financial instruments 13.1 22.5Other non‐current assets ‐ 1.0Total Non‐Current Assets 1,523.8 1,549.3
Total Assets 1,664.8 1,683.7
45
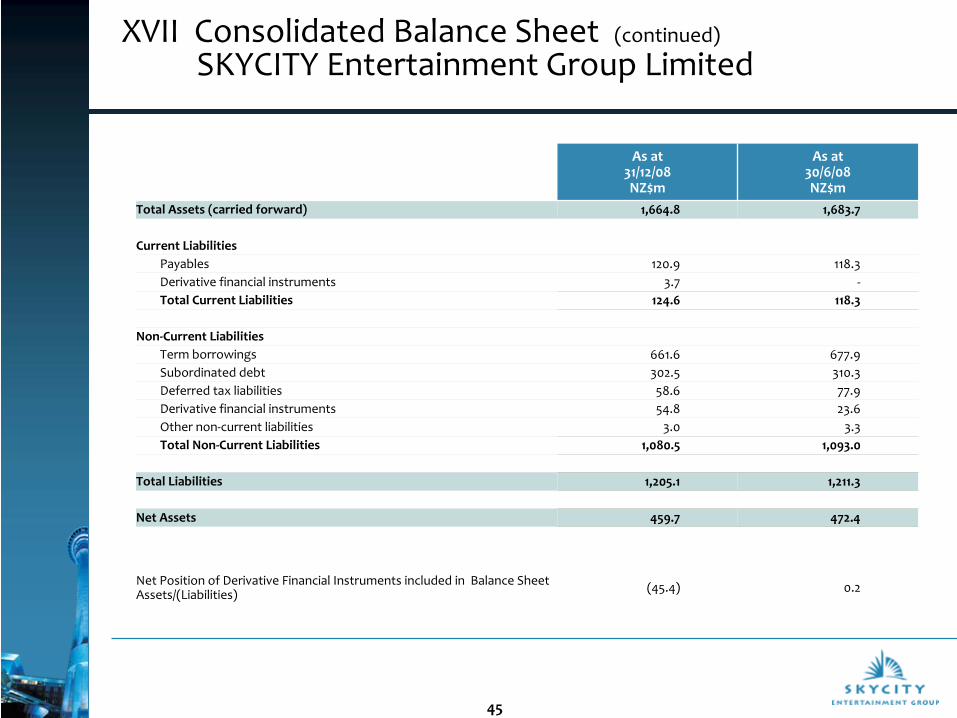
XVII Consolidated Balance Sheet (continued) SKYCITY Entertainment Group Limited
As at
31/12/08NZ$m
As at
30/6/08NZ$m
Total Assets (carried forward) 1,664.8 1,683.7
Current LiabilitiesPayables 120.9 118.3Derivative financial instruments 3.7 ‐Total Current Liabilities 124.6 118.3
Non‐Current LiabilitiesTerm borrowings 661.6 677.9Subordinated debt 302.5 310.3Deferred tax liabilities 58.6 77.9Derivative financial instruments 54.8 23.6Other non‐current liabilities 3.0 3.3Total Non‐Current Liabilities 1,080.5 1,093.0
Total Liabilities 1,205.1 1,211.3
Net Assets 459.7 472.4
Net Position of Derivative Financial Instruments included in Balance Sheet
Assets/(Liabilities) (45.4) 0.2

46
XVIII Balance Sheet Notes
Equity
–
Share capital increased by $21.5m as a result of bonus shares issued under the company’s Profit Distribution
Plan in October 2008 and shares issued to SKYCITY personnel under the company’s incentive remuneration
plan.
–
Retained profits increased by $5.4m. The transactions during the half year that affected retained profits were
net profit after tax (6 month period ended 31/12/08) of $54.8m, less the FY08 final distribution of $49.4m.
–
The Reserves balance as at 31/12/08 is represented by the shares
awarded but not yet issued to salaried staff
under the company’s staff incentive scheme $0.7m, foreign currency translation reserve balance $3.1m, and
cash flow hedge reserve ($8.7m).
–
The movement in the foreign currency translation reserve reflects changes in the New Zealand dollar value of
the company’s net Australian assets due to movements in the NZD/AUD exchange
rate.
–
The movement in the cash flow hedge reserve represents fair value movements in SKYCITY’s interest rate and
cross currency interest rate swaps that are part of cash flow hedging relationships.
–
Minority interest of $1.3m is Skyline Enterprises’
40% shareholding in Queenstown Casinos Limited.
Current Assets
–
Cash and bank comprises $47.3m of funds on interest‐bearing deposit and $37.2m of cash held in‐house/on‐
property.
–
Tax receivables of $14.1m relates to prepaid tax to ensure the Group’s imputation credit account was in credit
on 31/3/08. The balance is shown as a current asset as it is expected to be utilised within the next twelve
months. The decrease of $31.2m (30/6/08 current tax receivable $33.8m plus non‐current tax receivable
$11.5m) is a result of tax receivable balances being utilised in
the current period.

47
XVIII Balance Sheet Notes (continued)
Non‐Current Assets–
The $14.4m increase in property, plant and equipment relates primarily to transfer of a real estate asset from
Investment Property, the Darwin expansion project, completion of
the Manukau cinema complex in Auckland,
new gaming machines and conversions, offset by depreciation.
–
Investment Property of $8.9m reclassified to Property, Plant and
Equipment.–
Intangible assets have decreased by $20.8m which consists of the
impact of movements in the NZD/AUD
exchange rate on the Adelaide and Darwin casino licenses and goodwill ($19.1m), amortisation of the Adelaide
casino licence (‐A$1.0m) and software additions and amortisation (‐$0.6m).
–
Investments in Associates comprises SKYCITY’s investment in Christchurch Casinos Limited (CCL). SKYCITY’s
effective shareholding in Christchurch Casinos Limited is 45.7% up from 40.5% following the acquisition of the
Intercontinental Hotels Group shareholding in July 2008. The balance of the shareholding interest in CCL is
held via shareholder advances. Other minor associates of SKYCITY Cinemas Holdings Limited are also
included.
–
Deferred tax assets of $24.1m relate to temporary differences (accounting v tax depreciation and movements
in derivatives). Refer also deferred tax liability under non‐current liabilities (below).
–
All derivatives are discussed under the non‐current liabilities section (below).
Non‐Current Liabilities–
Term borrowings represent funds drawn down on the senior debt facility (31/12/08 – Nil), and US Private
Placement debt (NZ$664m), less deferred funding expenses ($2m).
The $16m reduction in term borrowings
from FY08 comprises exchange rate movements on the US dollar denominated USPP, offset by repayment of
the NZ$ syndicated bank facility, and amortisation of deferred funding expenses.
–
At 31/12/08, SKYCITY had in place a $500m (30/6/08: $500m) syndicated bank facility on an unsecured,
negative pledge basis, maturing April 2011. As at 31/12/08, the
amount drawn on this facility was nil (30/6/08:
$129m). The movement in the syndicated bank facility from 30/6/08 relates to debt repayment of $129 million
using funds obtained from operations and realisation of hedging currency exposures.

48
XVIII Balance Sheet Notes (continued)
Non‐Current Liabilities (continued)
–
Subordinated debt includes New Zealand capital notes ($125m) and
Australian capital notes (SKYCITY ACES)
(A$150m). The $7.8m decrease relates primarily to the impact of
exchange rate movements on the SKYCITY
ACES and amortisation of deferred expenses. This is fully hedged.
–
Deferred tax liabilities decreased by $19.3m as a result of temporary differences associated with tax v
accounting carrying values and movements in the fair value of the Group’s derivative financial instruments.
Deferred tax assets and deferred tax liabilities are not netted off under NZ IFRS. The combined deferred tax
asset and liability position as at 31/12/08, if able to be netted off, would be a net liability of $34.5m (FY08:
$66.2m).
–
NZ IFRS requires that all derivatives are marked to market and recorded on the balance sheet as at the
company’s reporting date.
–
Derivative financial instruments represent the market value of interest rate swaps, cross currency interest rate
swaps (CCIRS), and forward foreign exchange contracts. The net balance of all derivative financial
instruments has moved from $0.2m at 30/6/08 to ‐$45.4m at 31/12/08. The CCIRS hedging the USD debt have
moved from a value of ‐$23.4m to $140.2m. $129.0m cash has been received as security on the CCIRS, so the
carrying value is shown at the net value of $11.2m. Due to the fall in interest rates, interest rate swaps fixing
the company’s interest rate exposure have fallen in mark to market value from $18.7m to ‐$53.4m. As these
interest rate swaps are in an effective hedging relationship, the revaluation is reflected in the Cash Flow
Hedge Reserve (Equity).

49
Disclaimer
All information included in this presentation is provided as at 23 February 2009.
The presentation includes a number of forward‐looking statements. Forward looking statements, by their nature, involve inherent risks and uncertainties. Many of those risks and uncertainties are matters which are beyond SKYCITY’s control and could cause actual results to differ from those predicted. Variations could either be materially positive or materially negative.
This presentation has not taken into account any particular investor’s investment objectives or other circumstances. Investors are encouraged to make an independent assessment of SKYCITY.