Embed Size (px)
Citation preview

18
FY02 ASA Presentation
Provide Scientific Equipment Services
Presented by: Johnny Robbins (Team Leader)
Team Members:Annalie BurkeJohn BaronJohn OlguinJames SullivanDonna Bowe Mary DukehartDave Siecker
Office of Research ServicesNational Institutes of Health
18 November 2002

2
Table of Contents
Main PresentationASA Template ……………………………….………………………………. 4Customer Perspective……………………….………………………………. 5
Customer Segmentation …………………….…………………………………… 6Customer Satisfaction……………………….……………………………………. 7Unique Customer Measures………………………………………………………. 8
Internal Business Process Perspective…………………………………… 9 Service Group Block Diagram………………………………………………….. 10Conclusions from Discrete Services Deployment Flowcharts……………… 11Process Measures………………………………………………………………. 12
Learning and Growth Perspective…………………………………………. 13Conclusions from Turnover, Sick Leave, Awards, EEO/ER/ADR Data……. . 14Analysis of Readiness Conclusions…………………………………………… . 15Unique Learning and Growth Measures……………………………..16
Financial Perspective………………………………………………………. 17Unit Cost…………………………………………………………………………… 18Asset Utilization…………………………………………………………………… 19Unique Financial Measures…………………………………………. 20
Conclusions and Recommendations……………………………………… .21Conclusions from FY02 ASA..…………………………………………………… 22Recommendations………………………………………………………………… 23

3
Table of Contents
AppendicesASA Template……………………………………………………….
Customer segments graphs ……………………………………….
Customer satisfaction graphs………………………………………
Block diagram……………………………………………………….
Process maps……………………………………………………….
Process measures graphs…………………………………………
Learning and Growth graphs……………………………………..
Analysis of Readiness Information ……………………………….
Unit cost graphs…………………………………………………….
Asset utilization graphs…………………………………………….
Unique measures graphs………………………………………….

4
ASA Template - 2002
Customer Value Proposition
Team Leader
Scientific Equipment and Instrumentation Branch
DS5:
Discrete Services
Service Group
Maintain scientific equipment and workstations
Customer Intimacy Sustain
Provide flexible, timely, and cost effective scientific technical services, equipment and parts to support the NIH research community to enhance research efforts
Design and fabricate custom instruments
Lease and sell Scientific Equipment
DS6:
Stock and sell repair parts and fabrication materials
Product Leadership Harvest
Johnny Robbins
Operational Excellence Growth
Service Strategy
Team Members
John Olguin, John Baron, Annalie Burke, Mary Stevens, Dave Siecker, Donna Bowe
X
X
ASA Template

5
Customer Perspective

6
DS1: Customer SegmentationFY 01 and FY 02
Lease income is relatively consistent from year to year
DS1: Leased Equipment Income
0100000200000300000400000500000600000700000800000
AF
IP
CC
FD
A
NC
I
NE
I
NH
GR
I
NH
LB
I
NIA
NIA
AA
NIA
IDN
IAM
S
NIC
HD
NID
CD
ND
CR
NID
DK
NIM
H
NIN
DS
OR
S
NID
A
OT
HE
IC
FY01
FY02

18
DS1: Sale of Lease Equipment
$-$20,000
$40,000$60,000$80,000
$100,000$120,000
$140,000$160,000
CC
FD
A
NC
IN
EI
NIA
NIA
AN
IAID
NIA
MN
ICH
D
NID
CD
NID
CR
NID
DK
NIM
HN
IND
S
OR
SN
HLB
I
FY01
FY02
DS1: Customer SegmentationFY 01 and FY 02
Sales fluctuate each year depending upon the ICs budget and focus

18
DS2: Customer SegmentationFY 01 AND FY 02
The IC usage has increased from FY 01 to FY 02
DS2: Computer Repair Section
0
100
200
300
400
500
600
700
800
900
NCI CC NHLBI ORS NIAID OD OTHERS
FY01
FY02

18
DS2: Customer SegmentationFY 01 and FY 02
It appears that ORS is our most frequent customer, however a large percentage of the work being performed is in support of the SEIB Lab-wide Service Agreements or Lease Agreements on behalf of other ICs.
DS 2: Laboratory Equipment Repair
0
200
400
600
800
1000
1200
1400
ORS OD NINDS NIDDK NICHD NIAID NHLBI NCI FDA CC Others
FY02
FY01

18
DS3: Customer SegmentationFY 01 and FY 02
Sale of equipment is highly dependant on the ICs equipment budget.
DS3: New Equipment Sales Income
$-
$200,000
$400,000
$600,000
$800,000
CC
NC
IN
EIN
HG
RI
NH
LBIN
IAN
IAAAN
IAIDN
IAMS
NIC
HD
NID
AN
IDC
DN
IDC
RN
IDD
KN
IMH
NIN
DS
NIN
RO
RS
NIEH
S
IC
FY 01
FY 02
18
DS4: Customer SegmentationFY 01 AND FY 02
DS4: Stockroom Transactions by IC
0
100
200
300
400
500
600
700
800
900
1000
FY 2001
FY 2002
It appears that ORS is our top client however, most of the transactions are being made by SEIB for the ICs. The materials are being used for equipment under SEIB Lab-wide Service Agreements or SEIB Lease Agreements.

18
DS5: Customer SegmentationFY 01 and FY 02
Design and Fabricate Custom Materials
Business can fluctuate due to long term projects that may cross fiscal years
$0
$50,000
$100,000
$150,000
$200,000
$250,000
$300,000
$350,000
FY-01 FY-02
CC NCI NHLBI NICHD NIMH ORS All Other

7
• When compared to the overall ORS Scorecard findings SEIB scored well. We received above average scores in most of the areas, such as competence, quality, and reliability. However, we need to seek ways to improve timeliness and cost.
• SEIB will continue to improve timeliness by matching the right technician for the job and continue to train the technicians who require refresher technical courses to service particular instruments within the time frame established by the supervisor/manufacturer. This should assist SEIB in reducing the cost and equipment down time.
Customer Satisfaction Summary

18
Customer Satisfaction Summary (Cont.)• SEIB can reduce response time by developing an
automated way to track the jobs various stages from time of entry to time of work completion. Bi-weekly reports can be generated to show job progression. Managers can review the data and initiate changes for improvement.
• Regarding cost; SEIB customers may not be aware of our competitors hourly rates. We intend to revise our invoices to state “you have saved $270 by using our services instead of our competitors.” As well, SEIB staff can verbally share the information with each customer.

8
Unique Customer Measures
• We did not identify any unique customer measures.

9
Internal Business Process Perspective

10
SERVICE GROUP BLOCK DIAGRAM
Service Group: Provide Scientific and Technical Instrumentation Services
Date: 10/18/02 Participants: ASA Team
Request for service
or equipmentProcess order
Provide service orequipmen
t
Invoice

18
DS 1 & 3: Lease and Sell Scientific EquipmentDate: 10/13/02 Participants: ASA Team
SEIB Office StaffNHLBI
Procurement
SEIBProcurement
StaffSEIB Technical Staff
Receive request fromresearcher - sale (from
website) or rental (to staff)
Purchase?
Equipmentavailable?
Process throughDELPRO
Deliver equipment
Yes
No
Receive specialpurchase
No
Yes
Deliver equipment
Continuerenting?
Track rental and billmonthly
Yes
Buy out or pick up
Close rental or bill
Make purchase
Withinpurchasingauthority?
Make purchaseNo
Yes
No
Process Map DS1 & DS3

18
DS 2: Maintain Scientific Equipment and WorkstationsDate: 10/18/02 Participants: ASA Team
VendorSEIB Office Staff Supply StaffSEIB Procurement
StaffSEIB Technical
Supervisors/Staff
Receive request forservice from customer or
over website
Issue work request
In-house? (W/inscope, cost-
effective, staffavailable)
Engage vendor
Perform repair
Invoice bill andclose job
Assign totechnician
Parts needed?Parts in stock?
Perform repair
Inspect work
Notify requestor
Order/receive parts
Return totechnical staff?
Return to customer
Bill SEIB
Provide parts
Yes
Yes
Work OK?
YesNo
No
No
No
A
Yes
A
A
Inspect work
No
Work OK?
Yes
Yes
No
Process Map DS2

18
DS4: Stock and sell repair parts and fabrication materialsParticipants: ASA Team Date: October 18, 2002
SEIB OfficeStaff
SEIBProcurement
StaffSEIB Supply Technician
Customer(SEIB Tech, IC
staff)
Item in stock?
Customer hasJob # or CAN?
Check status ofitem
Yes
On order?Place emergency
order
Follow up order
No
Enter request incomputer
Customer receivesorder
Enter into AdminData Base
Inventory MgmtSystem
No
Yes
Create Job
Requests StockRoom item
No
Receive order
Yes
Requestor isSEIB tech?
Notify requestor
Documenta-tion of order on
hand?No
YesYes
No
Bill
Process Map DS4

18
DS 5: Design and Fabricate Custom InstrumentsDate: 10/18/02 Participants: ASA Team
SEIB Office StaffSEIB Technical
Supervisors/StaffSupply StaffVendorSEIB Procurement
Staff
Yes Yes
No
No
Work OK?
Bill SEIB
Work OK?
Inspect work
In-house? (W/inscope, cost-
effective, staffavailable)
Order/receive parts
Inspect work
Assign totechnician
Parts in stock?
Engage vendor
A
Manufacture
Fabricate
Provide parts
Receive request forservice from researcher,
over website, etc.
Prepare costestimate
A
Yes
Estimateapproved byresearcheror IC A/O?
Yes
A
Invoice bill andclose job
No
Cancel
No

11
• Our Service Group completed 5 deployment flowcharts for 5 discrete services.
• We need to initiate a way to track response time for two discrete services automatically or manually.
• To date we have not identified repetitive steps or better ways to process the work.
Conclusions from Discrete Services Deployment Flowcharts
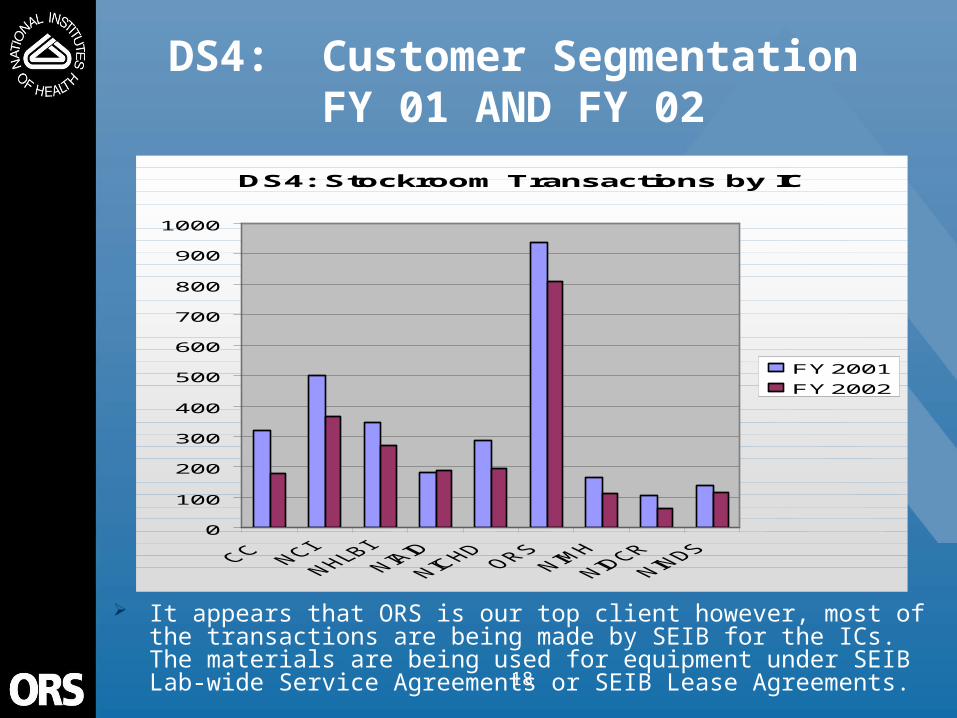
12
Process Measures• DS1: Average time between requests and
delivery of rentals• DS2: Average response time to initiate repair• DS3: Average time between requests and
delivery of equipment• DS4: Average response time to fill backorders.• DS5: Process time from initial request until start
time• FINDINGS:
DS1 & DS3 – Changing the delivery schedule from an as needed basis to a 2 day weekly delivery schedule in May 2002 did not have a negative impact.

18
Process Measures Continued• DS2: Our response time improved during FY 02
compared to FY 01. Our average response time is 7.5 hours and we are committed to maintaining this level.
• DS4: This is a prospective measure, no data is currently available. We will track backorder response time in FY 03.
• DS5: We do not have hard data but we believe turnaround time is one day. We will track as a prospective measure in FY 03.

13
Learning and Growth Perspective

18
Learning and Growth Data Table
About 6 days sick leave per employee
About 2 awards for every 3 employees
7% employee turnover
0 EEO complaints out of 42 employees
6 ER Cases out of 42 employees
1 ADR case out of 42 employees
572 12 2 0.16 307 25 11 0.89 0 0.00 4 0.32 0 0.00572B 12 0 0.00 601 50 6 0.50 0 0.00 1 0.08 0 0.00572C 6 1 0.18 163 29 0 0.00 0 0.00 0 0.00 1 0.18572D 7 0 0.00 742 111 7 1.05 0 0.00 0 0.00 0 0.00572E 5 0 0.00 178 36 4 0.80 0 0.00 1 0.20 0 0.00
Service Group 31
Total42 3 0.07 1991 48 28 0.67 0 0.00 6 0.14 1 0.02

14
• The number of awards increased from 28 to 35 when we added the awards that were processed in July 2002.
• Employee turnover includes one retirement.• 76% of the sick leave was used by three employees on extended
medical leave.• Employee absences contribute to reduced productivity, negatively
impacts finances, and eventually strain employee morale.• To improve QOWL SEIB will share more information with staff
and keep them better informed about issues that affect them/branch, and solicit feedback .
• Training is important for employee growth and SEIB will continue to ensure resources are available for this purpose and to help improve the QOWL.
Conclusions from Turnover, Sick Leave, Awards, EEO/ER/ADR Data
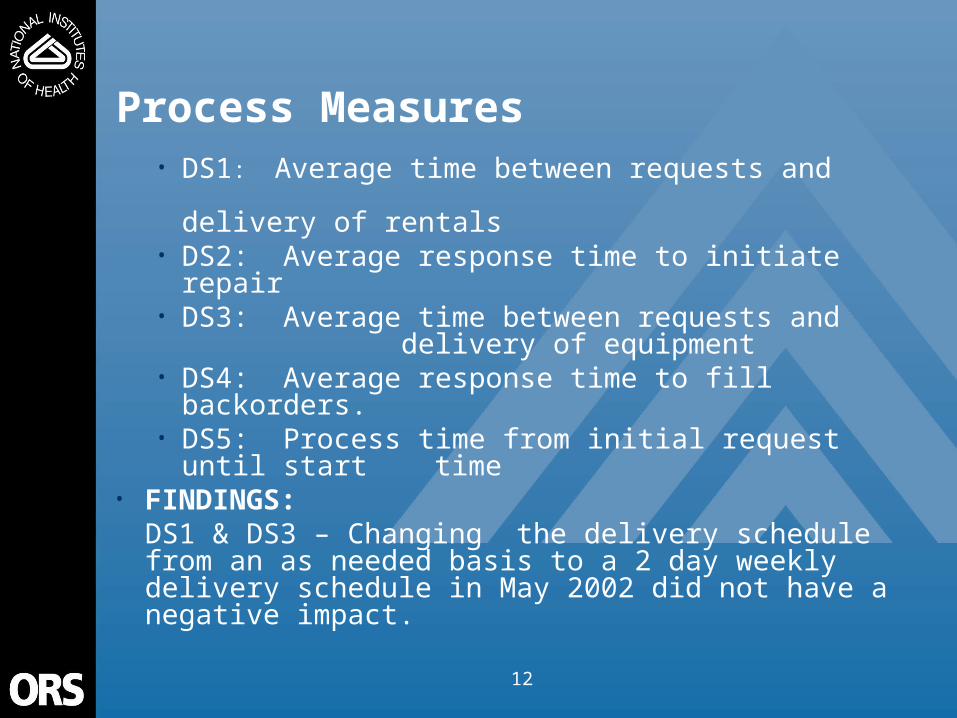
15
• SEIB needs to retain highly technical employees with extensive knowledge or varied experience in the following areas:
• - scientific equipment repair/instrument design and fabrication
• - customer service expertise• - marketing/sales expertise• - business/managerial skills• Over the next three years SEIB may lose 8-10• highly skilled employees - will re-train current
employees, and recruit or contract out.• Extensive training required for customer service,
refresher courses and continuing education training by manufacturers, and marketing/sales training.
Analysis of Readiness Conclusions
18
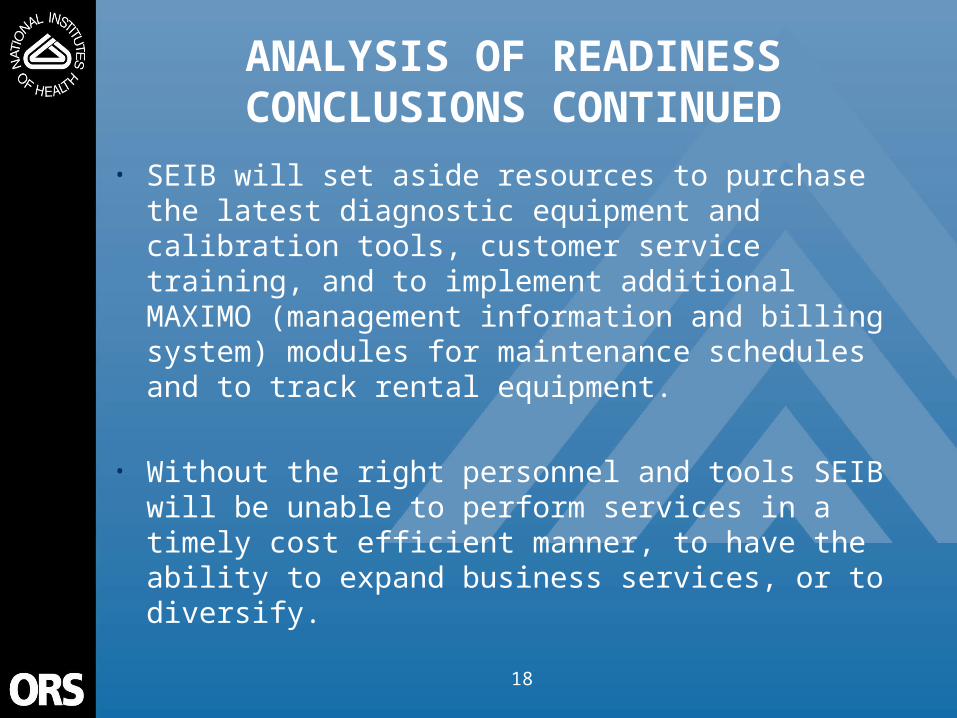
ANALYSIS OF READINESS CONCLUSIONS CONTINUED
• SEIB will set aside resources to purchase the latest diagnostic equipment and calibration tools, customer service training, and to implement additional MAXIMO (management information and billing system) modules for maintenance schedules and to track rental equipment.
• Without the right personnel and tools SEIB will be unable to perform services in a timely cost efficient manner, to have the ability to expand business services, or to diversify.
16
Unique Learning and Growth Measures
• We did not identify any unique learning and growth measures.
17
Financial Perspective

18
• DS1: - # items available• DS2 - # labor hours• DS3: - # of equipment sold• DS4: - # of parts & material sold• DS5: - # of labor hours
• We agree with the unit measures as reflected in budget and we will use them for baseline analysis.
• The services provided in SEIB are on a fee-for-service bases; all revenue generated is either by labor hours, items sold and items leased.
Unit Cost Measures

19
Lease Scientific Equipment
• 2.5 FTEs X 1500 Productive Hours = 3750• Assuming 2 hours for each output • Production Capacity = 1875 (3750/2)• Actual Production = 1636
Asset Utilization = 87.25% (1636/1875)
• FTE includes supervisor who performs other managerial duties not reflected in this discrete service.
• Someone must be available to assist customers at all times.
DS1: Asset Utilization Measures

18
DS2: Asset Utilization Measures
Maintain Scientific Equipment and Workstations
• 12 FTE’s x 1500 Available Hours = 18,000• Non-Productive Hours = 3,082• Actual Productive Hours = 14,918
Asset Utilization = 82.8% (14,198/18,000)
• An increase in service requests will yield a better utilization percentage.
• As we implement a strong market program, the demand for our services will increase directly with asset utilization.

18
DS3: Asset Utilization Measures
Sell Scientific Equipment
• FTEs = 1.5 x 1500 = 2250• Assuming 1.5 hours for each unit of output • Production Capacity = 1500 (2250/1.5)• Actual Production = 1155
Asset Utilization = 77% (1155/1500)
• Employee also serves as the property custodian for SEIB. (NOTE: This work is not reflected under the above discrete service.)

18
DS4: Asset Utilization Measures
Stock and sell repair parts and fabrication materials
• 1 FTE = 1500 Available Hours• Assuming 20 minutes for each output• Production Capacity = 7500 (1500/.20)• Actual Production = 3392
Asset Utilization = 45.2% (3392/7500)
• Employee is not being fully utilized however someone must be available at all times to serve customers.
• Plan to cross train employee to perform other responsibilities within SEIB.
18
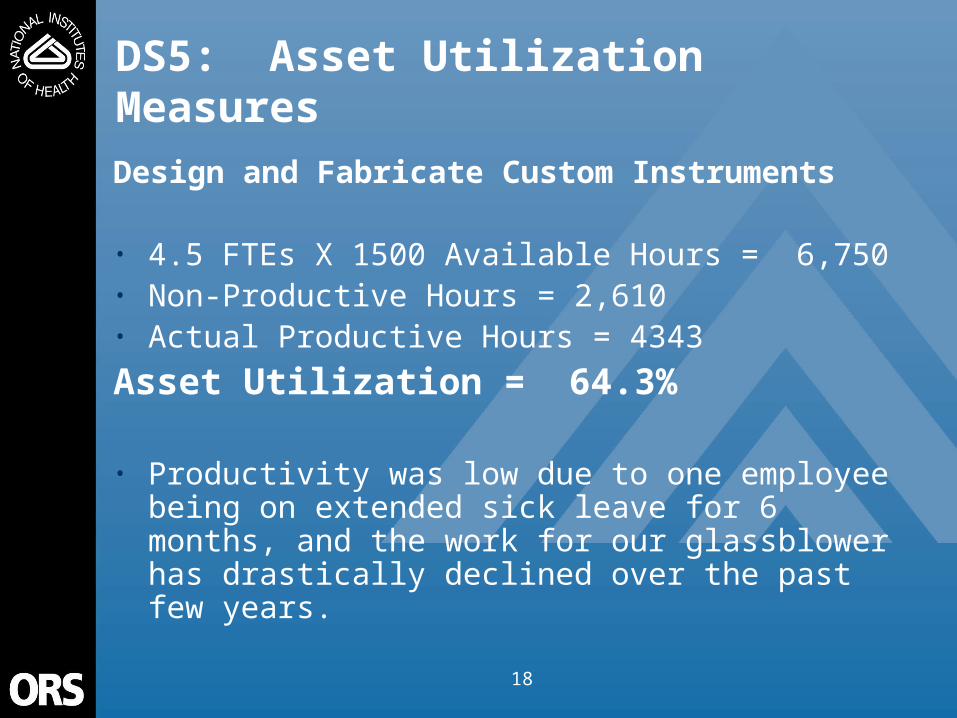
DS5: Asset Utilization Measures
Design and Fabricate Custom Instruments
• 4.5 FTEs X 1500 Available Hours = 6,750• Non-Productive Hours = 2,610• Actual Productive Hours = 4343
Asset Utilization = 64.3%
• Productivity was low due to one employee being on extended sick leave for 6 months, and the work for our glassblower has drastically declined over the past few years.

20
Unique Financial Measures
• We did not identify any unique financial measures.

21
Conclusions and Recommendations

22
Conclusions from FY02 ASA
• Need to keep customers better informed on status of repairs.
• Need to utilize additional management information tools
• Noted a major loss of our customer base.• Need to develop ways to track response time
for two discrete services.• Need to provide continuous training for
technical employees

18
Current implemented changes yielding improvements
• Reduced transportation expenses by changing the delivery schedule.
• Expanded computer services
• Improved relationship with manufacturers
• Worked with manufacturers to provide in-house technical training for SEIB and NIH researchers

23
Advertise and market our services Utilize additional MAXIMO modules for
maintenance schedules & tracking equipment – March 2003
Request a list of equipment needs from current and future customers – February 2003
Purchase diagnostic equipment and calibration tools – January 2003.
Meet with quality assurance representatives to request advice on the proper information required for certification – December 2002.
Recommendations

18
SEIB REVENUE BY DISCRETE SERVICES FY 1999 THROUGH FY 2002
$0
$1,000,000
$2,000,000
$3,000,000
$4,000,000
FY-1999 FY-2000 FY-2001 FY-2002
Parts and Materials Sell Scientific EquipmentMaintain Equipment Lease EquipmentDesign and Fabricate Instruments

18
SEIB BILLABLE HOURS BY SECTION FY 1999 THRU FY 2002
• This is directly attributed to a decline in customer retention.
0
2,000
4,000
6,000
8,000
10,000
12,000
14,000
FY-1999 FY-2000 FY-2001 FY-2002
ElectronicsLab EquipDesign/Fab

18
CUSTOMER RETENTION
Revenue from SEIB's Top Customers - 2000 - 2002
$0
$20,000
$40,000
$60,000
$80,000
$100,000
$120,000
$140,000
$160,000
$180,000
Top Customer #2 #3 #4 #5 #6 #7
FY-00
FY-01
FY-02

18
Appendices

18
Appendices
• Include the following:
• Page 2 of your ASA Template• Customer segments graphs • Customer satisfaction graphs• Block diagram• Process maps• Process measure graphs• Learning and Growth graphs• Analysis of Readiness Information • Unit cost graphs• Asset utilization graphs• Any unique measures graphs

18
Scatter DiagramFY02 Customer Importance and Satisfaction Ratings: A Closer Look
Note: A smaller portion of the chart is shown so that the individual data points can be labeled.
6.50
6.75
7.00
7.25
7.50
7.75
8.00
8.25
8.50
8.75
9.00
9.25
9.50
9.75
10.00
6.50 6.75 7.00 7.25 7.50 7.75 8.00 8.25 8.50 8.75 9.00 9.25 9.50 9.75 10.00
Satisfaction
Imp
ort
an
ce
SATISFIED,IMPORTANT
Cost
Convenience
Availability
QualityTimeliness
Data based on 30 respondents
Reliability
Competence
Handling of Problems
Responsiveness

18
Radar ChartFY02 Product/Service Satisfaction Ratings
ORS Index = 8.27
8.40
8.28
8.48
7.42
1.00
4.00
7.00
10.00Cost
Quality
Timeliness
Reliability
Data based on 436 respondents
Service Group Index = 7.99
8.74
7.74
8.52
6.53
1.00
4.00
7.00
10.00Cost
Quality
Timeliness
Reliability
Data based on 30 respondents
18
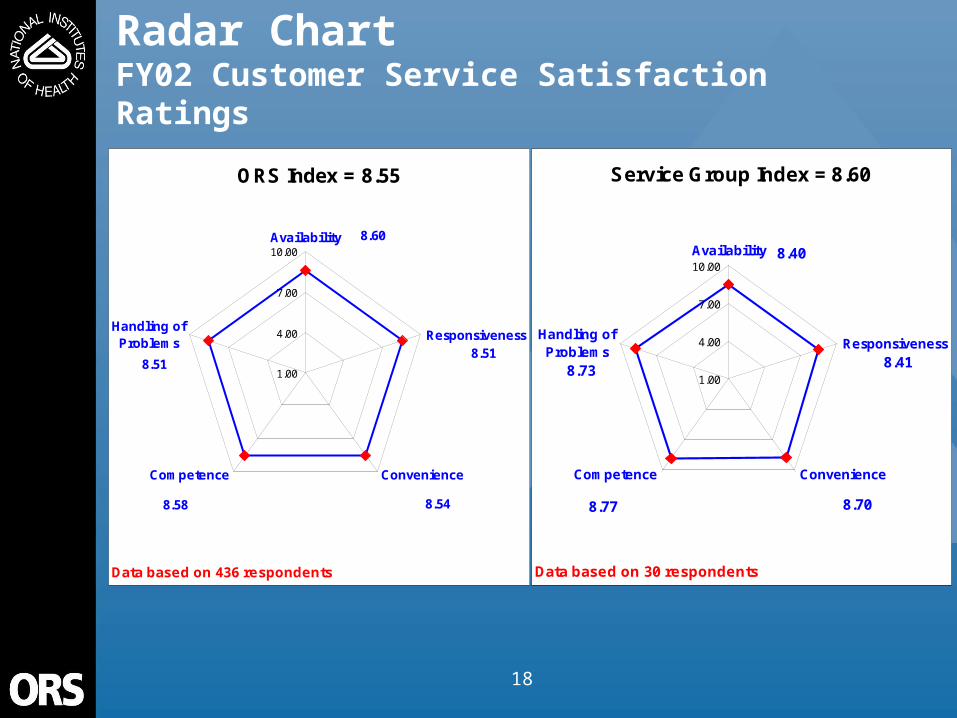
Radar ChartFY02 Customer Service Satisfaction Ratings
ORS Index = 8.55
8.60
8.58 8.54
8.518.51
1.00
4.00
7.00
10.00Availability
Responsiveness
ConvenienceCompetence
Handling ofProblems
Data based on 436 respondents
Service Group Index = 8.60
8.738.41
8.708.77
8.40
1.00
4.00
7.00
10.00Availability
Responsiveness
ConvenienceCompetence
Handling ofProblems
Data based on 30 respondents

18
DS 1 Process MeasureAverage Turnaround Time for Rental Items - By Item
July - September 2002
2.08
1.91
2.33
0
0.5
1
1.5
2
2.5
July August September
Aver
age
days

18
DS:2 Process Measure Turnaround Time for Performing Repairs
FY 2001 and FY 2002
0
2
4
6
8
10
12
ADP/ELE LES
FY2001
FY2002

18
DS 3 Process MeasureTurnaround Time for Scientific Equipment Sales
July - September 2002
0
0.5
1
1.5
2
2.5
3
3.5
July August September
Ave
rage
day
s

18
DS1: Unit Cost Chart
Lease Scientific Equipment
0
500
1000
1500
FY 2002 FY 2003 FY 2004
Unit Cost

18
DS2: UNIT COST CHART
Maintain Scientific Equip and Workstations
132
134
136
138
FY 2002 FY 2003 FY 2004
Unit Cost

18
DS3: UNIT COST CHART
Sell Scientific Equipment
0
1000
2000
3000
4000
FY 2002 FY 2003 FY 2004
Unit Cost

18
DS4: UNIT COST CHART
Stock and Sell Repair Parts
7.90
8.00
8.10
8.20
8.30
FY 2002 FY 2003 FY 2004
Unit Cost

18
DS5: UNIT COST CHART
Design and Fabricate Custom Instruments
050
100150200250300
FY 2002 FY 2003 FY 2004
Unit Cost